Embed Size (px)
Citation preview
九州大学学術情報リポジトリKyushu University Institutional Repository
Distribution Ratio of Pt on Anatase and RutileTiO_2 Particles, Determined by X-rayDiffraction and Transmission ElectronMicroscopy Analysis of Pt/TiO_2(P25)
Taira, KenjiAdvanced Technology Research Laboratories, Nippon Steel & Sumitomo Metal Corporation |Department of Material Sciences, Faculty of Engineering Sciences, Kyushu University
Einaga, HisahiroDepartment of Material Sciences, Faculty of Engineering Sciences, Kyushu University
https://doi.org/10.5109/2174853
出版情報:Evergreen. 5 (4), pp.13-17, 2018-12. Green Asia Education Centerバージョン:published権利関係:
EVERGREEN Joint Journal of Novel Carbon Resource Sciences & Green Asia Strategy, Vol. 05, Issue 04, pp.13-17, December 2018
Distribution Ratio of Pt on Anatase and Rutile TiO2 Particles, Determined by X-ray Diffraction and Transmission Electron
Microscopy Analysis of Pt/TiO2(P25)
Kenji Taira1,2*, Hisahiro Einaga2
1Advanced Technology Research Laboratories, Nippon Steel & Sumitomo Metal Corporation, 20-1 Shintomi, Futtsu, Chiba, 293-8511 Japan
2Department of Material Sciences, Faculty of Engineering Sciences, Kyushu University, Kasuga, Fukuoka, 816-8580 Japan
E-mail: [email protected]
(Received October 26, 2018; accepted December 21, 2018).
The TiO2(P25)-supported Pt catalyst has drawn significant interest from researchers due to its high activity. Analysis of the origin of this high catalytic activity must address the heterogeneity of the catalyst, since TiO2(P25) comprises both anatase and rutile phases. Thus, in this study, we demonstrate a simple method for determining the ratio of Pt particles on anatase and rutile by X-ray diffraction and transmission electron microscopy, without employing special equipment. Such a cost-effective method for determining the Pt distribution will accelerate research into the use of TiO2(P25) as a catalyst support.
Keywords: Pt, TiO2, P25, TEM, XRD.
1. Introduction TiO2 has a diverse range of industrial applications.
Although TiO2 is primarily prepared by the sulfuric acid method, the chlorine method is gradually gaining acceptance at the industrial scale. The chlorine method is promising as it affords TiO2 in higher purity than does the sulfuric acid method. In addition, the chlorine method is more environmentally friendly 1),2), which is an important factor considering the drive toward greener chemistry. With increasing attention on environmental issues, it is envisaged that the chlorine method will continue to grow in preference.
Evonik P25 is the most famous, commercially available TiO2 produced by the chlorine method 3). Interest in P25 by many scientists has been driven by its high purity and explicit photocatalytic activity. Pt/TiO2(P25) is the most thoroughly investigated form of P25. There have been many reports on the oxidation state of Pt in Pt/TiO2(P25), and the effect thereof on the photocatalytic activity 4),5). Although most studies focus on the photocatalytic activity of Pt/TiO2(P25), this catalyst is also employed in the oxidation reactions. Some reports have revealed the high activity of Pt/ TiO2(P25) in the oxidation of CO 6),7).
One of the characteristic features of P25 is that it is formed as a mixture of the anatase and rutile phases of TiO2
8). Because of its heterogeneity, the origin of the high photocatalytic activity of P25 is still debated by
many researchers 9),10). Several techniques are available for the individual analysis of anatase and rutile particles. For instance, hydrogen fluoride is used to selectively dissolve the anatase or rutile particles, so that each phase can be analyzed and monitored separately 3). Another approach employs transmission electron microscopy (TEM) in conjunction with electron energy loss spectroscopy (EELS), i.e., TEM-EELS, whereby preferential nucleation of Pt on rutile grains has been revealed. However, both these approaches have practical challenges. Hydrogen fluoride is an extremely toxic acid, and thus, special protective equipment and medical attention are necessary during the experiments. In the case of TEM-EELS, a monochromatic electron beam is preferred to clearly distinguish anatase from rutile; however, access to such an expensive instrument is limited.
Herein, we present a method for distinguishing between anatase and rutile particles, and confirm that Pt undergoes preferential nucleation on rutile particles, by using TEM but not EELS. By combining the TEM observations with X-ray diffraction (XRD) results, the distribution of Pt particles on the anatase and rutile particles is calculated. The use of TEM and XRD allows us a more cost-effective analysis approach that will enable us to analyze a number of samples in the future to clarify the effect of the heterogeneity of P25 on its catalytic activity.
- 13 -
EVERGREEN Joint Journal of Novel Carbon Resource Sciences & Green Asia Strategy, Vol. 05, Issue 04, pp.13-17, December 2018
2. Experimental 2.1. Catalyst preparation Pt/TiO2 catalysts were prepared by the impregnation
method. TiO2 (Catalysis Society of Japan (CSJ), JRC-TIO-4 (identical to DegussaP25)) was dried at 110 °C for 10 h and then heated at 500 °C in air for 1 h before use11). An aqueous solution of H2PtCl6∙6H2O (Sigma Aldrich, > 99.995%) was added dropwise to TiO2. Subsequently, the samples were dried at 110 °C overnight, and then calcined at 500 °C for 1 h. The prepared catalyst was denoted as Pt/TiO2(P25) emphasizing on the support. The amount of Pt was calculated to be 1.0 wt% based on the amount of precursor used.
2.2. Catalyst characterization The surface area of the catalysts was determined by
the Brunauer-Emmett-Teller (BET) method from N2 adsorption isotherms measured by an adsorption measurement instrument (Japan BEL, BEL-max).
XRD measurements on the catalysts were performed using an XRD instrument (Rigaku, RINT-TTR III). The ratio of the anatase to rutile phases in TiO2 was determined by following literature procedures 7),12). The average diameters of the anatase and rutile phases were estimated by Scherrer’s equation using the constant K = 0.89 13),14).
TEM images of the Pt/TiO2 catalysts were collected using a transmission electron microscope (FEI, Tecnai G2) equipped with double-tilt specimen holders. Bright field images were obtained in all cases. The accelerating voltage was adjusted to 200 kV. The observed lattice fringes were analyzed by Fourier transformation to determine the lattice constant.
3. Results and discussion The anatase and rutile phases have completely
different crystal structures, which accounts for the deviation in the band structure 15), formation of oxygen vacancies 16), 17), and the isoelectric point 18). All of these parameters can lead to characteristic catalytic behavior of Pt on each phase. Therefore, determining the ratio of Pt on anatase and rutile is crucial in understanding the catalytic activity of Pt/TiO2(P25). Herein, the detailed procedure for determining this ratio is presented. XRD provided information on the molar ratio and average size of anatase and rutile particles. TEM analysis enabled us to determine the density of the Pt particles on the anatase and rutile particles. Combining the data from both, we were able to clarify the distribution ratio of Pt on anatase and rutile.
3.1 XRD analyses of Pt/TiO2(P25)
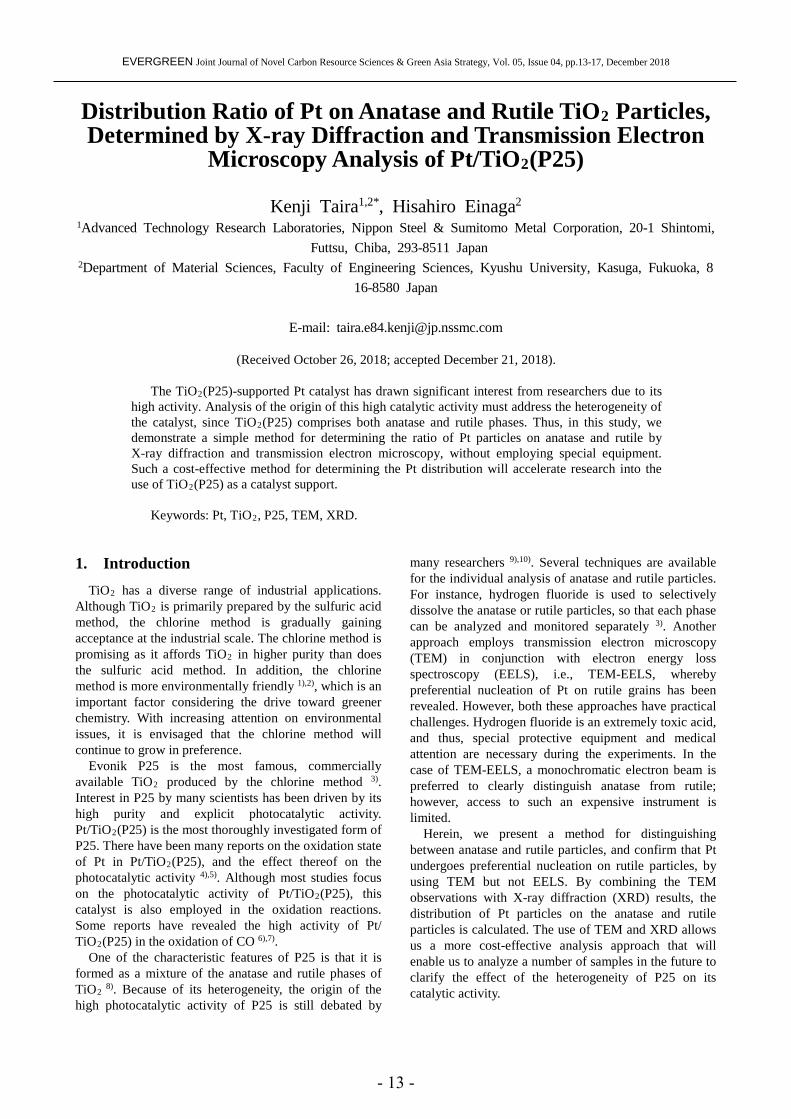
Figure 1 shows the XRD spectrum of Pt/TiO2(P25). Intense peaks corresponding to the anatase and rutile
phases were observed; however, no peaks corresponding to Pt could be assigned, suggesting that the Pt particles were highly dispersed on the both anatase and rutile TiO2 particles. The molar ratio of anatase to rutile was calculated using the peak intensity of anatase (101) and rutile (110) and found to be 88:12, 7),12) which is comparable to reported values 8). The average diameter of each phase was determined using Scherrer’s equation, and the results are listed in Table 1. The average diameters of the anatase and rutile phases were estimated to be 22 nm and 31 nm, respectively, which were in good accordance with the TEM results shown in section 3.2. Using these calculated values as well as the specific weight of each phase, the specific areas attributed to the anatase and rutile phases were calculated 8) (Table 1) under the assumption that all particles of each phase were spherical and identical. Owing to the smaller molar ratio and larger particle size of the rutile phase, more than 90% of the surface area was attributed to the anatase phase. The sum of the surface areas of the anatase and rutile phases was 64 m2/g, which was larger than the value derived using the BET method (50 m2/g). This deviation indicates that agglomeration of TiO2 particles occurred, resulting in inaccessible interfaces between the TiO2 particles.
Table 1: Molar ratio and surface area ratio between the anatase and rutile phases calculated from XRD results
Molar ratio (%)
Average size (nm)
Surface Area Area of each phase per unit
amount of TiO2(P25)
(m2/g-TiO2(P25)
Area ratio (%)
Anatase 88 22 59 92 Rutile 12 31 5 8
Fig. 1: XRD spectrum of Pt/TiO2(P25)
- 14 -
Distribution Ratio of Pt on Anatase and Rutile TiO2 Particles, Determined by X-ray Diffraction and Transmission Electron Microscopy Analysis of Pt/TiO2(P25)
3.2 Phase determination of each grain using TEM
Thus far, the existence of both anatase and rutile in Pt/TiO2(P25) was confirmed using XRD. In addition, the surface area ratio between anatase and rutile was determined. Therefore, it was envisaged that the distribution ratio of the Pt particles on the anatase and rutile phases could be calculated, provided the values of the Pt-particle density on the surface of the anatase and rutile particles was available. In this regard, TEM observation was performed to determine the density of Pt particles on the anatase and rutile surfaces.
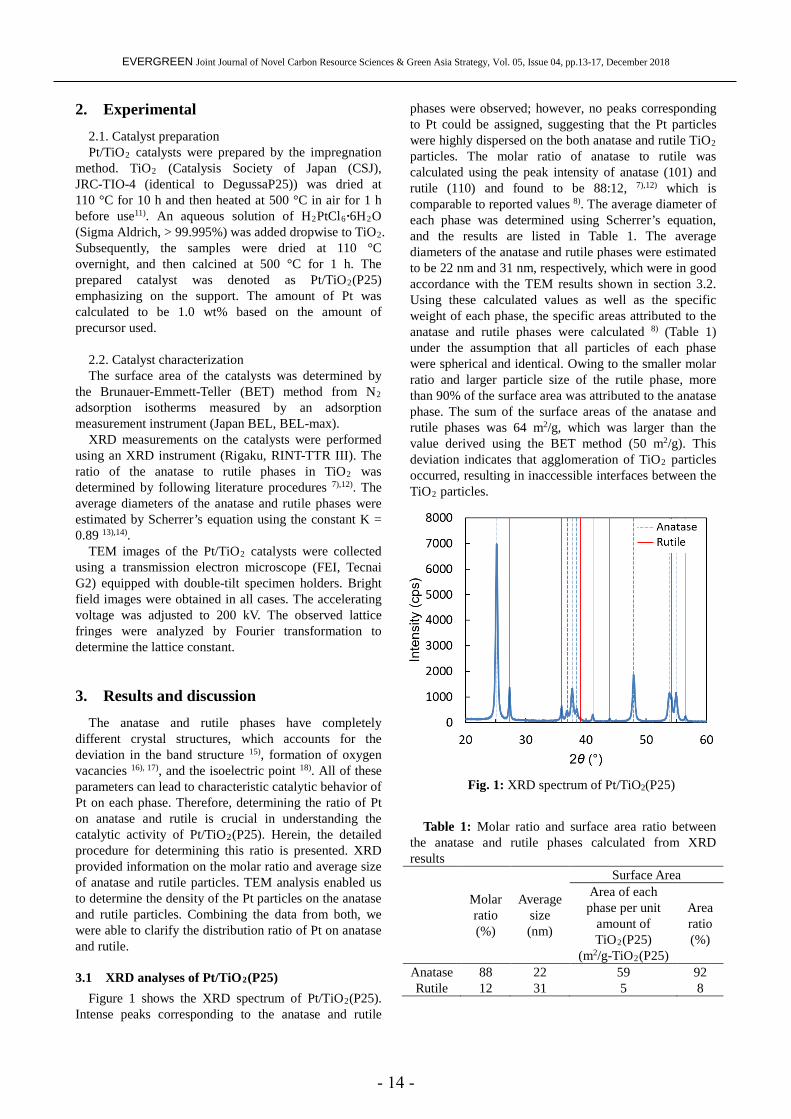
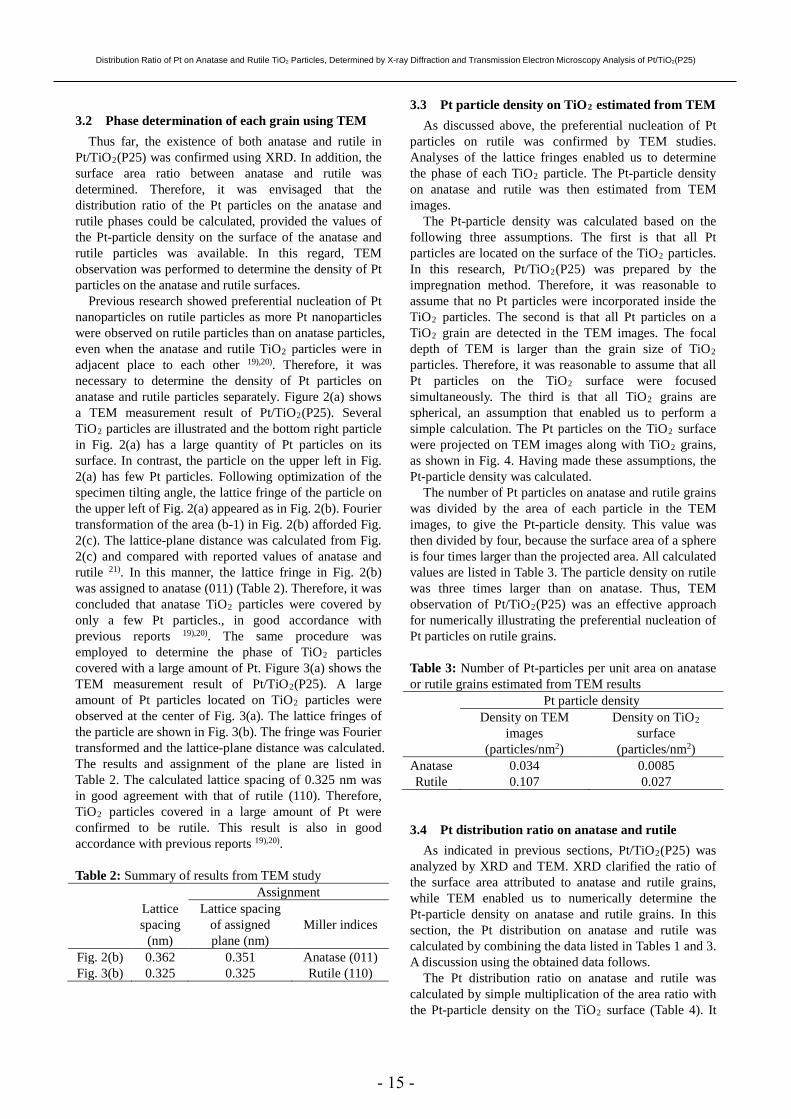
Previous research showed preferential nucleation of Pt nanoparticles on rutile particles as more Pt nanoparticles were observed on rutile particles than on anatase particles, even when the anatase and rutile TiO2 particles were in adjacent place to each other 19),20). Therefore, it was necessary to determine the density of Pt particles on anatase and rutile particles separately. Figure 2(a) shows a TEM measurement result of Pt/TiO2(P25). Several TiO2 particles are illustrated and the bottom right particle in Fig. 2(a) has a large quantity of Pt particles on its surface. In contrast, the particle on the upper left in Fig. 2(a) has few Pt particles. Following optimization of the specimen tilting angle, the lattice fringe of the particle on the upper left of Fig. 2(a) appeared as in Fig. 2(b). Fourier transformation of the area (b-1) in Fig. 2(b) afforded Fig. 2(c). The lattice-plane distance was calculated from Fig. 2(c) and compared with reported values of anatase and rutile 21). In this manner, the lattice fringe in Fig. 2(b) was assigned to anatase (011) (Table 2). Therefore, it was concluded that anatase TiO2 particles were covered by only a few Pt particles., in good accordance with previous reports 19),20). The same procedure was employed to determine the phase of TiO2 particles covered with a large amount of Pt. Figure 3(a) shows the TEM measurement result of Pt/TiO2(P25). A large amount of Pt particles located on TiO2 particles were observed at the center of Fig. 3(a). The lattice fringes of the particle are shown in Fig. 3(b). The fringe was Fourier transformed and the lattice-plane distance was calculated. The results and assignment of the plane are listed in Table 2. The calculated lattice spacing of 0.325 nm was in good agreement with that of rutile (110). Therefore, TiO2 particles covered in a large amount of Pt were confirmed to be rutile. This result is also in good accordance with previous reports 19),20). Table 2: Summary of results from TEM study
Assignment
Lattice spacing
(nm)
Lattice spacing of assigned plane (nm)
Miller indices
Fig. 2(b) 0.362 0.351 Anatase (011) Fig. 3(b) 0.325 0.325 Rutile (110)
3.3 Pt particle density on TiO2 estimated from TEM As discussed above, the preferential nucleation of Pt
particles on rutile was confirmed by TEM studies. Analyses of the lattice fringes enabled us to determine the phase of each TiO2 particle. The Pt-particle density on anatase and rutile was then estimated from TEM images.
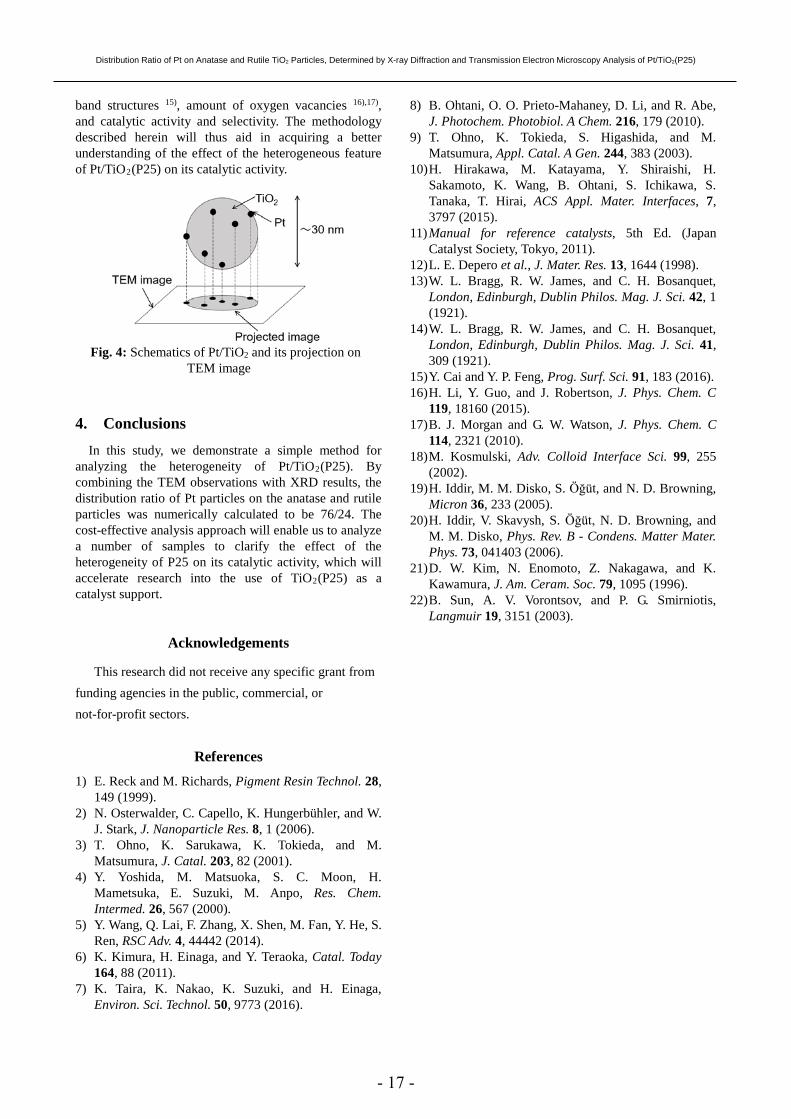
The Pt-particle density was calculated based on the following three assumptions. The first is that all Pt particles are located on the surface of the TiO2 particles. In this research, Pt/TiO2(P25) was prepared by the impregnation method. Therefore, it was reasonable to assume that no Pt particles were incorporated inside the TiO2 particles. The second is that all Pt particles on a TiO2 grain are detected in the TEM images. The focal depth of TEM is larger than the grain size of TiO2 particles. Therefore, it was reasonable to assume that all Pt particles on the TiO2 surface were focused simultaneously. The third is that all TiO2 grains are spherical, an assumption that enabled us to perform a simple calculation. The Pt particles on the TiO2 surface were projected on TEM images along with TiO2 grains, as shown in Fig. 4. Having made these assumptions, the Pt-particle density was calculated.
The number of Pt particles on anatase and rutile grains was divided by the area of each particle in the TEM images, to give the Pt-particle density. This value was then divided by four, because the surface area of a sphere is four times larger than the projected area. All calculated values are listed in Table 3. The particle density on rutile was three times larger than on anatase. Thus, TEM observation of Pt/TiO2(P25) was an effective approach for numerically illustrating the preferential nucleation of Pt particles on rutile grains.
Table 3: Number of Pt-particles per unit area on anatase or rutile grains estimated from TEM results
Pt particle density Density on TEM
images (particles/nm2)
Density on TiO2 surface
(particles/nm2) Anatase 0.034 0.0085 Rutile 0.107 0.027
3.4 Pt distribution ratio on anatase and rutile As indicated in previous sections, Pt/TiO2(P25) was
analyzed by XRD and TEM. XRD clarified the ratio of the surface area attributed to anatase and rutile grains, while TEM enabled us to numerically determine the Pt-particle density on anatase and rutile grains. In this section, the Pt distribution on anatase and rutile was calculated by combining the data listed in Tables 1 and 3. A discussion using the obtained data follows.
The Pt distribution ratio on anatase and rutile was calculated by simple multiplication of the area ratio with the Pt-particle density on the TiO2 surface (Table 4). It
- 15 -
EVERGREEN Joint Journal of Novel Carbon Resource Sciences & Green Asia Strategy, Vol. 05, Issue 04, pp.13-17, December 2018
was assumed that the Pt particle size distribution was the same, irrespective of the TiO2 phase. Approximately a quarter of Pt was located on rutile, while the rest was on anatase. Thus, the Pt distribution ratio on rutile and anatase was numerically determined without using TEM-EELS. Table 4: Ratio of Pt particles on anatase and rutile grains
Pt distribution (%) Anatase 76 Rutile 24
Thus, the Pt distribution ratio on anatase and rutile
was determined using only XRD and TEM measurement
results. The effectiveness and accessibility of these measurement techniques will allow us easy analysis of the catalysts in the future.
It is envisaged that the dependence of the catalytic activity on precursors of Pt and preparation conditions could be investigated using the developed measurement techniques. Indeed, many previous studies show that a direct correlation exists between the catalytic activity and selectivity of Pt/TiO2(P25) and the preparation methods employed 22). It is speculated that the Pt distribution ratio on anatase and rutile is also dependent on the preparation methods employed. The Pt distribution ratio can also affect the catalytic activity of Pt/TiO2(P25), because anatase and rutile phases have large differences in their
Fig. 3: TEM measurement results and Fourier
transformed data of a grain
Fig. 2: TEM measurement results and Fourier transformed data of a grain
- 16 -
Distribution Ratio of Pt on Anatase and Rutile TiO2 Particles, Determined by X-ray Diffraction and Transmission Electron Microscopy Analysis of Pt/TiO2(P25)
band structures 15), amount of oxygen vacancies 16),17), and catalytic activity and selectivity. The methodology described herein will thus aid in acquiring a better understanding of the effect of the heterogeneous feature of Pt/TiO2(P25) on its catalytic activity.
4. Conclusions In this study, we demonstrate a simple method for
analyzing the heterogeneity of Pt/TiO2(P25). By combining the TEM observations with XRD results, the distribution ratio of Pt particles on the anatase and rutile particles was numerically calculated to be 76/24. The cost-effective analysis approach will enable us to analyze a number of samples to clarify the effect of the heterogeneity of P25 on its catalytic activity, which will accelerate research into the use of TiO2(P25) as a catalyst support.
Acknowledgements
This research did not receive any specific grant from funding agencies in the public, commercial, or not-for-profit sectors.
References
1) E. Reck and M. Richards, Pigment Resin Technol. 28, 149 (1999).
2) N. Osterwalder, C. Capello, K. Hungerbühler, and W. J. Stark, J. Nanoparticle Res. 8, 1 (2006).
3) T. Ohno, K. Sarukawa, K. Tokieda, and M. Matsumura, J. Catal. 203, 82 (2001).
4) Y. Yoshida, M. Matsuoka, S. C. Moon, H. Mametsuka, E. Suzuki, M. Anpo, Res. Chem. Intermed. 26, 567 (2000).
5) Y. Wang, Q. Lai, F. Zhang, X. Shen, M. Fan, Y. He, S. Ren, RSC Adv. 4, 44442 (2014).
6) K. Kimura, H. Einaga, and Y. Teraoka, Catal. Today 164, 88 (2011).
7) K. Taira, K. Nakao, K. Suzuki, and H. Einaga, Environ. Sci. Technol. 50, 9773 (2016).
8) B. Ohtani, O. O. Prieto-Mahaney, D. Li, and R. Abe, J. Photochem. Photobiol. A Chem. 216, 179 (2010).
9) T. Ohno, K. Tokieda, S. Higashida, and M. Matsumura, Appl. Catal. A Gen. 244, 383 (2003).
10) H. Hirakawa, M. Katayama, Y. Shiraishi, H. Sakamoto, K. Wang, B. Ohtani, S. Ichikawa, S. Tanaka, T. Hirai, ACS Appl. Mater. Interfaces, 7, 3797 (2015).
11) Manual for reference catalysts, 5th Ed. (Japan Catalyst Society, Tokyo, 2011).
12) L. E. Depero et al., J. Mater. Res. 13, 1644 (1998). 13) W. L. Bragg, R. W. James, and C. H. Bosanquet,
London, Edinburgh, Dublin Philos. Mag. J. Sci. 42, 1 (1921).
14) W. L. Bragg, R. W. James, and C. H. Bosanquet, London, Edinburgh, Dublin Philos. Mag. J. Sci. 41, 309 (1921).
15) Y. Cai and Y. P. Feng, Prog. Surf. Sci. 91, 183 (2016). 16) H. Li, Y. Guo, and J. Robertson, J. Phys. Chem. C
119, 18160 (2015). 17) B. J. Morgan and G. W. Watson, J. Phys. Chem. C
114, 2321 (2010). 18) M. Kosmulski, Adv. Colloid Interface Sci. 99, 255
(2002). 19) H. Iddir, M. M. Disko, S. Öğüt, and N. D. Browning,
Micron 36, 233 (2005). 20) H. Iddir, V. Skavysh, S. Öğüt, N. D. Browning, and
M. M. Disko, Phys. Rev. B - Condens. Matter Mater. Phys. 73, 041403 (2006).
21) D. W. Kim, N. Enomoto, Z. Nakagawa, and K. Kawamura, J. Am. Ceram. Soc. 79, 1095 (1996).
22) B. Sun, A. V. Vorontsov, and P. G. Smirniotis, Langmuir 19, 3151 (2003).
Fig. 4: Schematics of Pt/TiO2 and its projection on TEM image
- 17 -