Embed Size (px)
Citation preview

Research ArticleDMTC: Optimize Energy Consumption in Dynamic WirelessSensor Network Based on Fog Computing and Fuzzy MultipleAttribute Decision-Making
Abbas Varmaghani,1 Ali Matin Nazar ,2 Mohsen Ahmadi ,3 Abbas Sharifi ,4
Saeid Jafarzadeh Ghoushchi ,3 and Yaghoub Pourasad5
1Department of Computer Engineering, Islamic Azad University of Hamadan, P.O. Box: 8415683111, Hamedan, Iran2Institute of Port, Coastal and Offshore Engineering, Ocean College, Zhejiang University, Zhoushan 316021, Zhejiang, China3Department of Industrial Engineering, Urmia University of Technology (UUT), P.O. Box: 57166-419, Urmia, Iran4Department of Mechanical Engineering, Urmia University of Technology (UUT), P.O. Box: 57166-419, Urmia, Iran5Department of Electrical Engineering, Urmia University of Technology (UUT), P.O. Box: 57166-419, Urmia, Iran
Correspondence should be addressed to Abbas Sharifi; [email protected]
Received 11 March 2021; Revised 31 May 2021; Accepted 18 June 2021; Published 1 July 2021
Academic Editor: Ihsan Ali
Copyright © 2021 Abbas Varmaghani et al. This is an open access article distributed under the Creative Commons AttributionLicense, which permits unrestricted use, distribution, and reproduction in any medium, provided the original work isproperly cited.
Advances in wireless technologies and small computing devices, wireless sensor networks can be superior technology in manyapplications. Energy supply constraints are one of the most critical measures because they limit the operation of the sensornetwork; therefore, the optimal use of node energy has always been one of the biggest challenges in wireless sensor networks.Moreover, due to the limited lifespan of nodes in WSN and energy management, increasing network life is one of the mostcritical challenges in WSN. In this investigation, two computational distributions are presented for a dynamic wireless sensornetwork; in this fog-based system, computing load was distributed using the optimistic and blind method between fog networks.The presented method with the main four steps is called Distribution-Map-Transfer-Combination (DMTC) method. Also,Fuzzy Multiple Attribute Decision-Making (Fuzzy MADM) is used for clustering and routing network based on the presenteddistribution methods. Results show that the optimistic method outperformed the blind one and reduced energy consumption,especially in extensive networks; however, in small WSNs, the blind scheme resulted in an energy efficiency network.Furthermore, network growth leads optimistic WSN to save higher energy in comparison with blinded ones. Based on theresults of complexity analysis, the presented optimal and blind methods are improved by 28% and 48%, respectively.
1. Introduction
A sensor network consists of many sensor nodes interactingstrongly with the physical environment, which receives andresponds to environmental information through the sensor.The connection between these nodes is wireless. Each nodeworks independently and has specific capabilities and a cer-tain energy level. To perform the placement operation insome methods, several nodes are equipped with higher capa-bilities such as higher radio range, more energy, auxiliaryequipment for movement, and a GPS receiver [1]. Accordingto the data collection methods, the wireless sensor network
can be divided into two categories: homogeneous sensor net-works, including base stations and sensor nodes equippedwith the same capabilities (e.g., computing power and capac-ity). They have the same memory. Data collection in thesetypes of networks is based on the data structure. Heteroge-neous sensor networks have a base station (complex sensornodes equipped with advanced processing and communica-tion capabilities) compared to conventional sensor nodes [2].
Sensor distribution (i.e., the location of sensors in the tar-get area) is one of the leading design issues in wireless sensornetworks. The location of a sensor may affect the implemen-tation of system requirements and network performance
HindawiWireless Communications and Mobile ComputingVolume 2021, Article ID 9953416, 14 pageshttps://doi.org/10.1155/2021/9953416

metrics [3]. Careful placement of the sensors can be an effec-tive optimization tool to achieve the desired design goals. Forexample, the total coverage is directly related to how the sen-sors are adequately positioned to cover the desired area onthe wireless sensor network. The sensors should not be tooclose to each other, not overlap, and not be overused. Theyalso should not be too far apart to prevent the formation ofcoverage gaps in the network. A good distribution makes itpossible to perform better in gathering information and com-munication [3, 4]. Some distribution methods also use sta-tionary sensors to support the sensor location’s dynamicadaptation, making it possible to reconfigure a dynamic dis-tribution and improve network performance to minimizeenergy consumption [5]. During the design process of thenetwork infrastructure, the creation of routes is affected bythe sensors’ energy limit because wireless transmission isdirectly related to the second (and higher) power of distance[6]. Using multistep delivery methods will result in lesspower loss, but using this method will cause problems intopology management and access control to the transmissionenvironment [7]. Therefore, because in most networks, thesensors are randomly located in the network, it is not possibleto use multipath methods [8].
Clustering in network routing can significantly affect theoverall scalability of the system, lifespan, and energy effi-ciency [9]. Hierarchical routing is one of the most efficientways to reduce energy consumption within a cluster andreduce the number of responses sent to the base station [10,11]. In contrast, a single-level network may overload thegates as traffic congestion increases. In addition, a single-level architecture is not scalable for a large set of nodesbecause sensors are usually not able to communicate overlong distances. In addition, clustering can stabilize networktopology along routes and reduce overhead and overall topol-ogy maintenance costs. It means that the nodes are protectedonly when connected to CHs. Furthermore, they are notaffected by changes in levels between CHs [12]. CHs can alsoimplement an optimized management strategy that will drivenetwork performance and battery and network life. A CHcan schedule intracluster activities so that the nodes switchto sleep mode (low power consumption) and reduce theenergy dissipation rate. Nodes can also be used in a rotatingorder to specify a time for sending and receiving information.As a result, data retrieval is prevented [13].
One of the main goals of wireless sensor network designsis to make data transmission work to extend the network’slifespan and prevent connections from failing through powermanagement methods. Routing protocols in such networksare affected by some challenging factors. Tolerance againsterror and the ability to organize and expand have been thereasons for the success of wireless sensor networks in appli-cations [14]. Creating an efficient architecture in distributinginformation between nodes can meet the time lost in theabnormal data filter. These wireless sensor networks can becreated within fog computing, distributing the computa-tional load between several nodes [15] effectively. The sensornode is first used to identify the data, and CHs should evalu-ate it. The tendency toward the adoption of wireless sensornetworks has intensified in recent years due to its extensive
applications in a variety of industries. A wireless sensor net-work [16] is formed by linking a large number of sensornodes. Prior to its actual application, the designed methodol-ogy must be tested. Having a live sensor network environ-ment, on the other hand, is not always feasible. In that case,simulation is the only way to test the study before movingon with real-world implementation. To date, a wide rangeof modeling tools for WSN networks are accessible, some ofwhich are dedicated to wireless sensor networks and otherswhich are applicable to both wireless and wired networks[16]. The distance between the data center and the datasource is the fundamental downside of cloud computing.Fog computing is a cloud computing technology thataddresses these issues. It is one of the paradigms for distrib-uted service computing. It makes full use of terminal devices’diverse computational features. It has paravirtualized archi-tecture as well [17]. With strict energy and processingresource constraints, distributed detection is a critical chal-lenge for WSNs. The appropriate threshold in most detectioncases is determined by the noise power, which is subject toconsiderable variability in practice [18]. Fog computing addsto the power and benefits of cloud computing and services byextending data generation and analysis to the network edge[19]. Real-time location-based services and applications withmobility assistance are feasible because of the physical prox-imity of users and a high-speed internet connection to thecloud. To promote fog computing, load balancingapproaches are utilized which may be done in two forms,static load balancing and dynamic load balancing [19].
Because most WSNs operate in unattended locationswhere human access and monitoring are nearly impossible,lifetime improvement has always been a critical concern.Clustering is one of the most effective approaches for orga-nizing system operations in a coordinated manner toimprove network scalability, reduce energy consumption,and extend network lifetime. During cluster creation, how-ever, most of the prior techniques overload the cluster leader.To address this issue, various academics devised the conceptof fuzzy logic, which is used in WSN decision-making [20].The clustering hierarchy technique is another approach fordata transfer in WSNs. This algorithm is one of the mostpotent ways for increasing the energy efficiency of WSNsand for maximizing the lifetime of WSNs. WSNs conserveenergy by using hierarchical protocols centered on clusteringhierarchy. Data might be collected and transmitted to a basestation by nodes having more remaining energy. Neverthe-less, earlier clustering hierarchy approaches [21] did notaccount for duplicated data acquired by nearby nodes ornodes that overlapped. Currently used clustering strategiesinclude selecting cluster heads with higher leftover energyand rotating cluster heads on a regular basis to spread energyconsumption across nodes in each cluster and lengthen net-work lifetime. Most earlier algorithms, on the other hand,did not take into account the predicted residual energy,which is then used to predict the remaining energy for select-ing a cluster head and performing a round [22].
This study is aimed at working in a computational net-work of fog with a set of inhomogeneous wireless devices.The objective is to provide a computational distribution
2 Wireless Communications and Mobile Computing
method that reduces energy consumption in the nodes andsatisfies the limitations of the edge delay. These nodes aredynamic and can both examine nodes and measure theircommunication links. The network can be used in smart cit-ies or intelligent buildings that take information from sensorssuch as (traffic density or temperature) from the environ-ment and use fog computing. Other works include networkclustering and routing to reduce energy consumption andextend network life. For this purpose, fuzzy MADM algo-rithms are used to select optimal CHs. Therefore, the mainaims are summarized as the following points:
(i) Provide computational distribution method inDynamic WSN
(ii) Network routing using fuzzy MADM algorithms
The paper includes Introduction to present the main prob-lem statement, and all need to be satisfied based on fog comput-ing and routing WSN. Related Works provides a briefdescription of the literature review regarding fog computing.Methods andMaterials represents the presentedmodel and gov-erning equations for both computation distribution and routingprotocol. In Results and Discussion, the final findings and anal-ysis results are illustrated. Finally, Conclusion summarizes theresults and provides the future scope and direction of the study.
2. Related Works
Various methods have been proposed to analyze the spatialand temporal density of routing data; for example, theNMAST method [23] uses the ability of neighboring dynam-ics to measure the spatial and temporal density of data. kpathways can be utilized for visual investigation in applica-tions such as traffic monitoring, public transit planning,and location selection as dynamic networks, unlike typicalclustering algorithms that need several data-dependenthyperparameters [24]. Research of fog computing defined anew generation of support ofWSN used in any aspect of smartcities, for example, using the system in the emergency systemof fireman [25], traffic light control [26], agricultural system[27], and healthmonitoring system [28]. One of the challengesof WSN is data privacy. Gathering information and transfer-ring to the base station needs some proper affords like design-ing security systems. For overcoming this challenge, the fogsystem is one efficient framework. In this case, an aggregatormay be disconnected from the fog server and unable to senddata directly. It can, nevertheless, share the encrypted datawith an adjacent aggregator in order to send data to the fogserver by adding its current collected data to the encrypteddata. The relevant data values may be extracted by the fogserver and saved in a local repository, which may then beupdated in cloud repositories [29]. Storage, communication,transmission ratio, energy consumption, and resilience areall improved by the fog system [29]. As a result, job allocationand secure deduplication are two of the system’s tasks. Itdetects data and protects against security risks. Sharma andSaini [30] proposed a Multi-Objective basedWhale Optimiza-tion method for the modeling of a fog layer system for safe
data deduplication. Average latency, customer happiness, net-work longevity, energy usage, and security strength allincreased as a result of their work [30]. Szynkiewicz et al.[31] developed an energy-aware, secure sensing and comput-ing system centered on static and dynamic clusters and edgeand fog computing paradigms. The aggregated data stored atedges were transferred to the base station to analyze by gate-ways. The results of the implementation enhanced securityand offload of data analysis [31].
The following are some examples of effective fuzzy algo-rithm applications in WSN. To model noisy power uncer-tainty, Mohammadi et al. [18] employed the fuzzyhypothesis test (FHT). Furthermore, using the Neyman–Pearson lemma on the FHT, they presented an optimum cen-soring strategy. It is demonstrated that the best censoringstrategy may be found by comparing the energy of observeddata to a threshold. The threshold would be determined bythe local communication limitation and the noise uncer-tainty limitation, according to the findings [18]. Mohammadiet al. [32] looked at a decentralized detection problem for aWSN and utilized FHT to characterize the noise poweruncertainty from a Bayesian perspective. The suggestedmethod was assessed in terms of detection and false alarmprobability. In the presence of noisy power uncertainty, sim-ulations indicate that the suggested detector outperformsboth the Anderson–Darling approach and the standardenergy detector. Nayak and Vathasavai [20] looked into thepros and cons of a variety of clustering techniques. Thesealgorithms are focused on CH efficiency, which might beadaptable, adaptable, and intelligent enough to transfer loadacross sensor nodes, extending the network lifetime. Menariaet al. [33] introduced an FT technique in WSN to managefaults that happen during data transmission from the sensorto the sink or base station due to link or node failure. Anenhanced quadratic minimum spanning tree technique wasused in the model. To increase fault tolerance in WSN, therevised technique introduced a unique approach to discoveran alternate edge in the spanning tree in place of the brokenor failed edge.
In a chapter, Kaur et al. [17] discussed the various aspectsof cloud and fog computing platforms. In addition, both plat-forms’ full architectures were provided, along with a compar-ison study. All application management techniques wereexamined, including resource coordination, distributedapplication deployment, and distributed data flow. Differentload balancing algorithms were described by Singh et al.[19]. In fog computing settings, round robin load balancingis the simplest and most straightforward load balancing solu-tion. The Source IP Hash load-balancing technique has a crit-ical flaw in that each change might redirect to anybody with adifferent server, making it unsuitable for fog networks [19].El Alami and Najid [21] developed an improved clusteringhierarchy methodology for overlapping and nearby nodesbased on the sleeping-waking process. As a result, dataredundancy was reduced to a minimum, and network life-span was increased. Unlike earlier hierarchical routing algo-rithms, which needed all nodes to gather and send data, thesuggested technique just needed the waking nodes to do so.They use the method in both homogeneous and
3Wireless Communications and Mobile Computing

heterogeneous networks. Lee and Cheng [22] suggested afuzzy-logic-based clustering methodology with an energyprediction extension to extend the lifetime of WSNs. Thesuggested methodology was found to be more efficient thanprevious distributed algorithms in simulations. Because edgedevices have restricted computing and energy resources, effi-cient sensor deployment and power management are criticaldesign concerns that must be addressed in order to carry outa significant amount of computation and extend the lifespanof a sensing system to guarantee high-quality monitoring.One of the challenges of the edge-based system is data vol-ume in edge devices. Regarding the exponential increment
of data in edges, reducing this congestion can extend theWSN lifespan and improve power consumption. For over-coming this problem, Deng et al. [44] presented a compres-sion method base of fog computing approaches. Theirautoregressive analysis method reduced data congestion sig-nificantly in conjunction with improvement in power con-sumption. In some ways, mobile sinks work as fog nodes toconnect WSNs and cloud systems. Data are received fromsensor nodes and sent to the cloud system through fognodes(sinks) [45]. Summary of some methods and researchabout the use of fog computing in WSN are provided inTable 1.
Table 1: Summary of literature review of the paper.
Author Year Subject Method Application Results
Gianget al. [34]
2020Large scale, dynamic fogcomputing in WSN
Distributed node-RED Base study Reduce costs
Hossan &Nower[26]
2020 Fog-based WSN dynamicNeighboring impact
factor
Efficient dynamic trafficlight control algorithm
for multipleintersections
Reduces wait time, lowers fuelconsumption, and boosts system
throughput
Sharma &Saini [30]
2020Task allocation and securededuplication using fog
computing
Hybrid Multiplier.Multi-Objective basedWhale Optimization
algorithm
Base studyEnhancement in average latency, usersatisfaction, network lifetime, energyconsumption, and security strength
Tsipiset al. [27]
2020
Latency-AdjustableCloud/Fog ComputingArchitecture for Time-Sensitive monitoring
Cloud/fog computingparadigm
EnvironmentalMonitoring agricultural
activity
Improve efficiency, flexibility, andscalability of the approach in terms of
latency
Zeng et al.[35]
2020Energy powered Cyber-Physical Fog Systems
Mixed-integer linearprogramming
Cyber-Physicalapplication
The high energy efficiency of ouralgorithm
Rani &Saini [28]
2020Secure data collection of fog
computing in WSN
The combination of fogand cloud can handle
extensive datacollection.
Health monitoringReduce the cost of data transportation
and storage
Bellavistaet al. [36]
2020SDN-based multi-layer
routing in fog environments
Multi-Layer AdvancedNetworkingEnvironment
Smart cityDetermines the most suitable path and
configures the proper MLRforwarding mechanism
Jain &Goel [37]
2020Energy efficient fuzzy
routing protocolFuzzy C-means
Wireless sensornetwork
High performance, low energyconsumption
Tortonesiet al. [38]
2019Innovative information-
centric service model for fogcomputing
Fog-as-a-serviceSmart city
environmentsAn effective platform for running fogservices on heterogeneous devices
Sun et al.[39]
2019Presenting an energy-
efficient clustering methodfor fog computing in WSNs
Cross-layer-sensingclustering method and
particles swarmoptimization
Base studyOptimize the data aggregation
efficiency and improve the networkperformance
Maatouget al. [40]
2019Fog computing frameworkfor energy management
Fog computingframework
Smart building
Decreases latency and improvesenergy-saving and the efficiency ofservices among things with different
capabilities
Sahithet al. [41]
2019Face identification in fogcomputing framework for
WSN
Radio communicationmodule XBee, ZigBee
protocolFace identification
Data collection and the functionalityof the system are good.
Mihaiet al. [42]
2018Intelligent Data Processingin fog system and WSN
Fog and mistcomputing approaches
Base study Improve the information to noise ratio
Bhargavaet al. [43]
2017Fog-enabled WSN systemfor animal behavior analysis
Edge mining conceptAnimal behavior
analysisAccuracy and suitability of the
methods
4 Wireless Communications and Mobile Computing
3. Methods and Materials
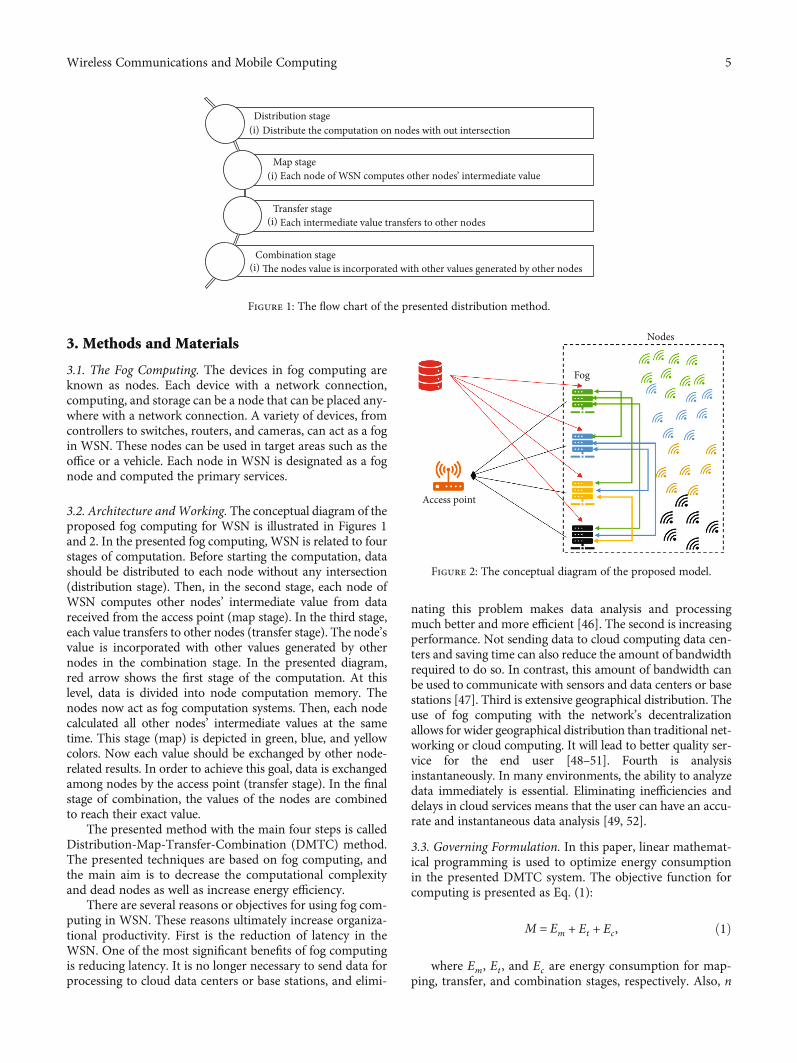
3.1. The Fog Computing. The devices in fog computing areknown as nodes. Each device with a network connection,computing, and storage can be a node that can be placed any-where with a network connection. A variety of devices, fromcontrollers to switches, routers, and cameras, can act as a fogin WSN. These nodes can be used in target areas such as theoffice or a vehicle. Each node in WSN is designated as a fognode and computed the primary services.
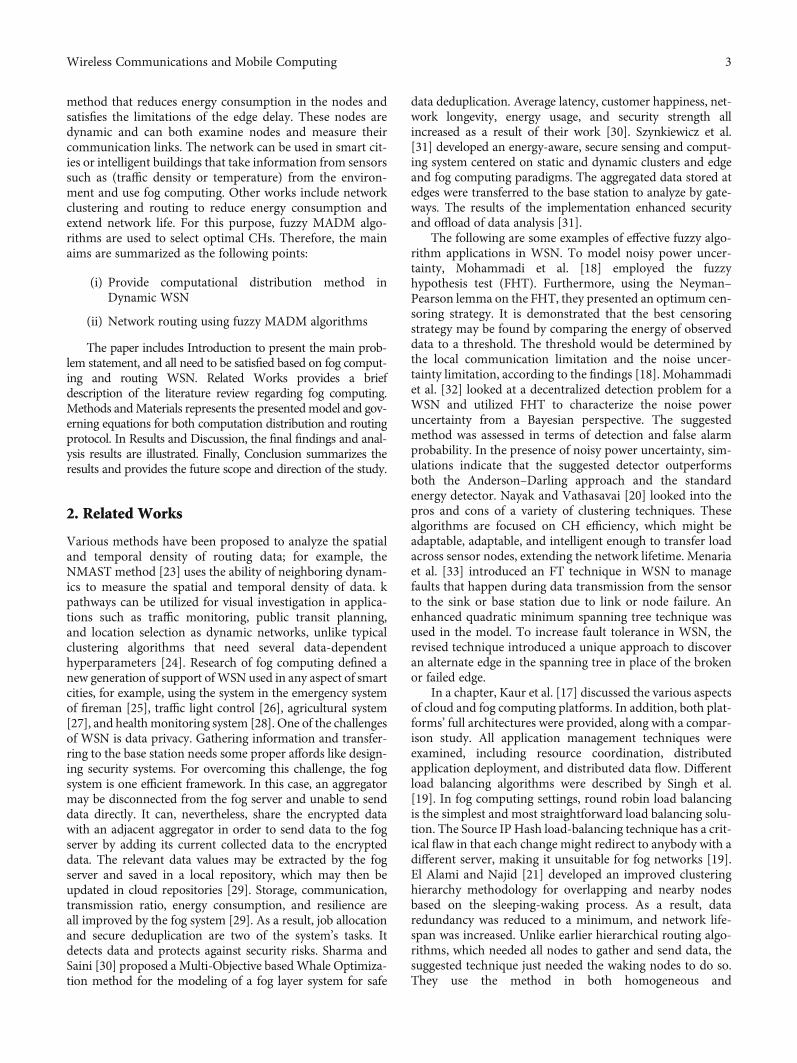
3.2. Architecture andWorking. The conceptual diagram of theproposed fog computing for WSN is illustrated in Figures 1and 2. In the presented fog computing, WSN is related to fourstages of computation. Before starting the computation, datashould be distributed to each node without any intersection(distribution stage). Then, in the second stage, each node ofWSN computes other nodes’ intermediate value from datareceived from the access point (map stage). In the third stage,each value transfers to other nodes (transfer stage). The node’svalue is incorporated with other values generated by othernodes in the combination stage. In the presented diagram,red arrow shows the first stage of the computation. At thislevel, data is divided into node computation memory. Thenodes now act as fog computation systems. Then, each nodecalculated all other nodes’ intermediate values at the sametime. This stage (map) is depicted in green, blue, and yellowcolors. Now each value should be exchanged by other node-related results. In order to achieve this goal, data is exchangedamong nodes by the access point (transfer stage). In the finalstage of combination, the values of the nodes are combinedto reach their exact value.
The presented method with the main four steps is calledDistribution-Map-Transfer-Combination (DMTC) method.The presented techniques are based on fog computing, andthe main aim is to decrease the computational complexityand dead nodes as well as increase energy efficiency.
There are several reasons or objectives for using fog com-puting in WSN. These reasons ultimately increase organiza-tional productivity. First is the reduction of latency in theWSN. One of the most significant benefits of fog computingis reducing latency. It is no longer necessary to send data forprocessing to cloud data centers or base stations, and elimi-
nating this problem makes data analysis and processingmuch better and more efficient [46]. The second is increasingperformance. Not sending data to cloud computing data cen-ters and saving time can also reduce the amount of bandwidthrequired to do so. In contrast, this amount of bandwidth canbe used to communicate with sensors and data centers or basestations [47]. Third is extensive geographical distribution. Theuse of fog computing with the network’s decentralizationallows for wider geographical distribution than traditional net-working or cloud computing. It will lead to better quality ser-vice for the end user [48–51]. Fourth is analysisinstantaneously. In many environments, the ability to analyzedata immediately is essential. Eliminating inefficiencies anddelays in cloud services means that the user can have an accu-rate and instantaneous data analysis [49, 52].
3.3. Governing Formulation. In this paper, linear mathemat-ical programming is used to optimize energy consumptionin the presented DMTC system. The objective function forcomputing is presented as Eq. (1):
M = Em + Et + Ec, ð1Þ
where Em, Et , and Ec are energy consumption for map-ping, transfer, and combination stages, respectively. Also, n
Distribution stage
Map stage
Distribute the computation on nodes with out intersection
Each node of WSN computes other nodes’ intermediate value
Combination stage �e nodes value is incorporated with other values generated by other nodes
Transfer stage Each intermediate value transfers to other nodes
(i)
(i)
(i)
(i)
Figure 1: The flow chart of the presented distribution method.
Access point
Fog
Nodes
Figure 2: The conceptual diagram of the proposed model.
5Wireless Communications and Mobile Computing

is the node number. Energy consumed in mapping level isdefined as follows:
Em = CnPn ND + lnð Þ, ð2Þ
such that Cn is the number of CPU cores for processingsingle bit and Pn is the energy required for the process.Therefore, CnPn is the amount of energy for processing a sin-gle node. N is the number of nodes, D is distributed data, andln is the size of the distributed file.
Moreover, in transfer level, the energy consumption isequal by Eq. (3).
Et = CnPn: ð3Þ
In this equation, T is the number of bits for computation.Es shows shuffle level energy consumption is the WSN. Itequals by Eq. (4):
Ec =pn N − 1ð ÞTln
LB:log2 1 + pn hnj j2/Γσ2� � , ð4Þ
where pn, hn, B, Γ, and σ2 are the power of radiofre-quency of node n, wireless channel, bandwidth, SNP gap,and noise power, respectively. The following constraints areexerted to the computation:
〠N
n=1ln = L, ln ≥ 0, N ≥ 1, T ≥ 0, B ≥ 1, L ≥ 1,
lnCn
Fn+ Et
pn≤ τn,
ð5Þ
where Fn is the number of CPU process per second innode n and τn is defined as the latency of node n. Accordingto mathematical programming, we should obtain the mini-mum value of energy consumption in the WSN system.
3.4. Clustering and Routing Protocol. In WSN routing, only asmall number of nodes must be connected to the base stationto increase network lifespan and decrease energy consump-
tion. These nodes are cluster heads (CHs). Because the nodesare dynamic, the most appropriate nodes should be selectedas the CHs. In this section of the study, the Fuzzy MultipleAttribute Decision-Making (MADM) method was used toselect the CHs. The Fuzzy MADMmethod uses three criteria:concentration, the energy level in each node, and the node’scentrality. The properties of the network are as follows:
(i) The base station must be away from the sensornodes and immobile
(ii) All network nodes are heterogeneous and haveenergy limitations
(iii) Nodes have spatial information sent to the base sta-tion with the corresponding energy level in the phaseadjustment phase
(iv) Nodes are dynamic
In this research, however, routing is based on clustering.However, the choice of CHs based on a method depends onmultiple parameters. Therefore, in this study, unlike previousmethods where the selection of CHs was mainly based on onecriterion or a one-sided approach, in the proposed method ofselection protocols, the CHs are chosen based on multicriteria.
According to the flowchart of Figure 3, first, the data israndomly distributed between the nodes. Then, the initial
Recognizingneighborhood
Initialconnection
betweennodes and
sinks
Calculatingvalue basedon criteria
Disconnectneighborhood
Updatecriteria
Updatedata
Fuzzy MADMdecisionmaking
Distributingdata to nodes
Figure 3: The flowchart of CH detection for routing.
0 10 20 30 40 50 60 70 80 90 1000
50
100
150
Figure 4: Initial wireless sensor network for the involving problemwith 100 nodes and an access point.
6 Wireless Communications and Mobile Computing

connection between the nodes and the sinks is established toload the data of each node in the system. The criteria shouldbe identified using the existing constraints, and the valuesbased on them should be calculated. In the next step, in orderto update the data, the connection between the user and thesink is disconnected, and the criteria will be updated andmeasured in the new phase so that the final selection can bemade based on the Fuzzy MADM method by modifying theexisting data and taken from the nodes. In general, the spaceconsidered in the flowchart can be described in the followingsections.
(i) In the first stage, the establishment of nodes in thefield begins so that the mechanism of neighbordetection to discover the general network and createan initial routing tree begins
(ii) In the second stage, the best route from the relaynode to the sink is identified
(iii) The final step involves the operation stage, these cri-teria are monitored, and the value is dynamicallychanged in response to changes in the status of thenetwork
This method optimizes the lifespan and reduces the errorin the network by presenting new constraints and differentassumptions. Adding node power consumption as a newconstraint can have different challenges in the simulation ofthe proposed model.
4. Results and Discussion
4.1. Architectural Properties of the WSN. As shown inFigure 4, the first sensor network is a square network withdimensions of 100 × 100m, with the base station (BS) placedaway from the sensors. In addition, all sensor nodes are pro-vided 0.1 J of starting energy. As a result, the network’s totalstarting energy is 10 J. The energy parameters Efs and Empare 10 pJ/bit/m2 and 0.0013 pJ/bit/m2, respectively. Eelec andEDA parameters have values of 5.5 nJ/bit and 5.5 nJ/bit,
respectively. Simulation tests for 100 WSN installations wereconducted to guarantee the correctness of the results. To offera comparative description of the procedures, the average ofthe collected findings was employed. Experiment has numer-ous N clusters ranging from ten to twenty to find the idealvalue of a cluster. For each value of N , the average energyconsumption per cycle is determined. Moreover, the effi-ciency of optimum computing is studied through mathemat-ical operations. The presented DMTC computing systemincludes regularly sharing w among the N nodes, withoutconsidering the nodes’ computing capacities and the powerof channel to access point. The used parameters for the sim-ulation are illustrated in Table 2.
4.2. Results of Presented Distribution Analysis. RegardingFigure 4, the presented problem in the initial condition
Table 2: Parameter’s value used in the presented DMTC algorithm.
Parameter Letter Range Unit
Energy free space Efs 10 pJ/bit/m2
Energy of multipath fading Emp 0.0013 pJ/bit/m2
Energy dissipated per bit Eelec 5.5 nJ/bit
Energy consumed in aggregating one-bit data EDA 5.5 nJ/bit
Number of CPU C 500-1500 Cycle/bit
Wireless channel h 10-3 -
CPU process per second F 0.1-1 GHz
Bandwidth B 15 kHz
Power of process P 10-200 pJ/cycle
Noise power σ2 1 nW
SNP gap 1 -
Forall(nodes)Find(neighborhood);Connect (nodes and Access point);Distribute (data);Em=Eq.(2)
Forall (node i:N)I_ii=Calculate (int_value(i,…,N))Et=Eq.(3)
For (node i:N)I_i=I_i1+I_i2+…I_iNEc=Eq.(4)E=Eq.(1)
For all (nodes)Calculating (Concentration, Centricity, Energy level)Disconnect (neighborhoods)Update (criteria)Update (data)Fuzzy MADM decision makingFind (CHs)Calculate (energy, death node, pack size)
End
Algorithm 1: Pseudocode of the presented approach.
7Wireless Communications and Mobile Computing

consists of 100 dynamic nodes of fogs with an accesspoint. The solution area is 100 × 100m the access pointis located 50m upper than the problem area. Before pro-cessing the network, the process is equally divided by eachnode based on the architecture of Figure 1. The presentedmethod is implemented on the different number of nodesN . Two methods of computing are considered as optimis-tic and blind schemes.
The highest point of computational load for both of theschemes is calculated as the following equation.
Loptimistic = τ1F1C1
+⋯+τKFN
CN, ð6Þ
Lblind =N min τ1F1C1
,⋯, τKFN
CN
� �: ð7Þ
If we consider each node’s capacity as random values,computational load also is random. In this condition, inter-ruption probability is shown in Figure 5(a) in differentlatency values in 10 and 20 nodes. Findings show that theoptimistic distribution among nodes has a lower interruptionin comparison with the blind model. In the optimisticmethod, the computing load is calculated as the sum of theprocess of each node. However, in the blind method, the loadvalue is equal to N times the minimum value of the nodes
process. The results of the distribution method inFigure 5(a) show that the rising number of the total systeminterruption is decreased that is one of the advantages of thismethod. Another advantage is the remarkedly low energyconsumption of the optimistic approach shown inFigure 5(b) compared to the blind one. The process is donefor 100 number nodes with one-second latency.
Regarding Eq. (1), total energy consumption in the pre-sented system is constructed by three Em, Et , and Ec as energyconsumption for mapping, transfer, and combination stages,respectively. The results of total energy decomposition on thethree factors of Figure 5(b) are depicted in Figure 5(c). Basedon the results, high percentage of energy belongs to Em andEc for mapping and composition, respectively. With anincreasing number of nodes, mapping energy decreased.Regarding Figure 5(d), with rising latency, energy consump-tion for mapping stage is reduced. Another advantage of thepresented method is that a slower process leads to reducedenergy used. We used the Fuzzy MADM method for routingthe wireless sensor network based on the presented distribu-tion algorithm in the other parts of the paper.
4.3. Results of the Clustering Process. Regarding Figure 4, theinitial network consists of 100 fog nodes and one access pointfor connection. The computing load is randomly distributedbetween nodes based on the methods mentioned above.
0.5 1 1.5 2 2.5
100
10–1
10–2
10–3
10–4
Latency [s]
K = 10 (optimistic)K = 20 (optimistic)
K = 10 (blind)K = 20 (blind)
(a)
20 40 60 80 10010–1
1
K
Tota
l ene
rgy
cons
umpt
ion
[J]
OptimalBlind
(b)
20 40 60 80 100K
Ener
gy co
nsum
ptio
n [J]
Em (optimal)Er (optimal)Es (optimal)
Em (blind)Er (blind)Es (blind)
100
10–1
10–2
10–3
(c)
0.5 1.5 2.51 2 3
10–1
10–2
10–3
Latency [s]
Ener
gy co
nsum
ptio
n [J]
Em (optimal)Er (optimal)Es (optimal)
(d)
Figure 5: Results of the presented DMTC distributed computing method. (a) Interruption probability vs. latency, (b) total energy of fog nodesvs. number of nodes, (c) disruption of energy consumption vs. number of nodes, and (d) energy consumption vs. latency.
8 Wireless Communications and Mobile Computing
These processes are performed in any iteration of the pre-sented routing method.
(i) Checking the equipment remaining energy anddetermining to inactivate equipment due to thedepletion of energy
(ii) Determining cluster heads (CHs) based on the FuzzyMADM methods
(iii) Clustering of the remaining nodes (except CHs)according to the shortest distance to one of the CHs
(iv) Transfer of information from nodes to CHs and thento access points based on radio transmission rela-tionships that lead to energy consumption in nodes
(v) If termination is not done, return the mentionedloop, i.e., check the remaining energy in the nodesand determine the inactive nodes
For determining CHs based on Fuzzy MADM, first, adecision matrix is constructed. The number of rows of thematrix is the number of nodes N , and columns are equal tothree numerical criteria of decision as follows:
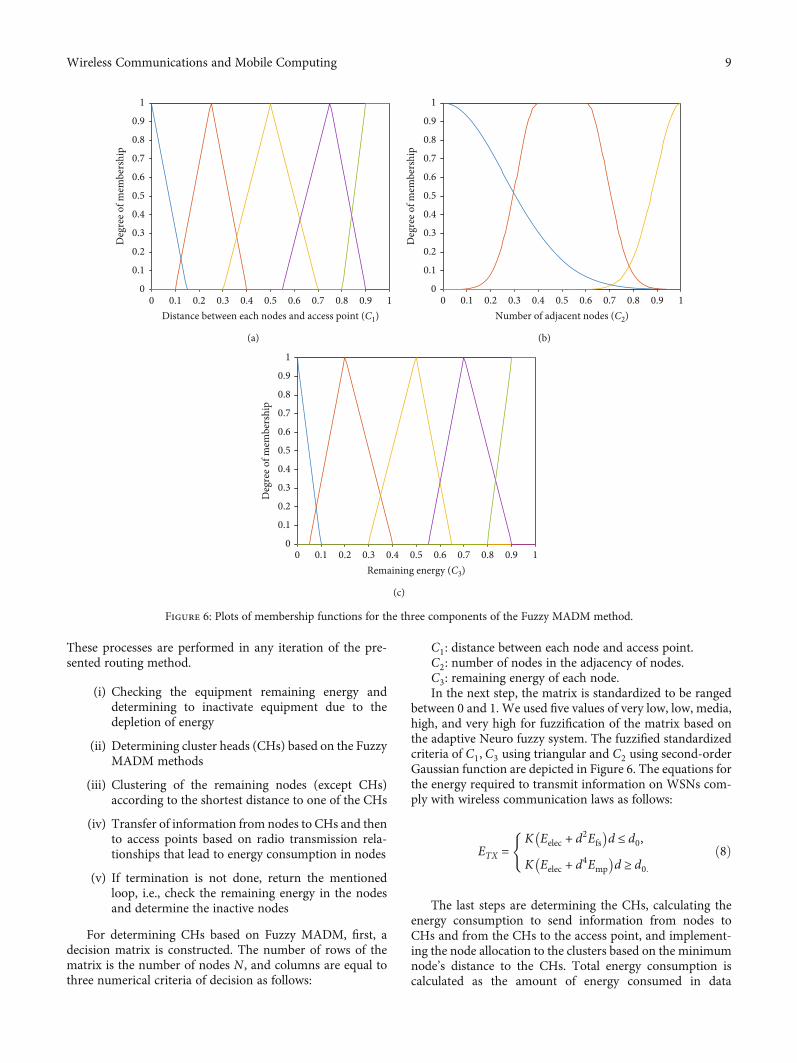
C1: distance between each node and access point.C2: number of nodes in the adjacency of nodes.C3: remaining energy of each node.In the next step, the matrix is standardized to be ranged
between 0 and 1. We used five values of very low, low, media,high, and very high for fuzzification of the matrix based onthe adaptive Neuro fuzzy system. The fuzzified standardizedcriteria of C1, C3 using triangular and C2 using second-orderGaussian function are depicted in Figure 6. The equations forthe energy required to transmit information on WSNs com-ply with wireless communication laws as follows:
ETX =K Eelec + d2Efs� �
d ≤ d0,
K Eelec + d4Emp� �
d ≥ d0:
(ð8Þ
The last steps are determining the CHs, calculating theenergy consumption to send information from nodes toCHs and from the CHs to the access point, and implement-ing the node allocation to the clusters based on the minimumnode’s distance to the CHs. Total energy consumption iscalculated as the amount of energy consumed in data
0 0.1 0.2 0.3 0.4 0.5 0.6 0.7 0.8 0.9 1Distance between each nodes and access point (C1)
0
0.1
0.2
0.3
0.4
0.5
0.6
0.7
0.8
0.9
1D
egre
e of m
embe
rshi
p
(a)
0 0.1 0.2 0.3 0.4 0.5 0.6 0.7 0.8 0.9 1Number of adjacent nodes (C2)
0
0.1
0.2
0.3
0.4
0.5
0.6
0.7
0.8
0.9
1
Deg
ree o
f mem
bers
hip
(b)
0 0.1 0.2 0.3 0.4 0.5 0.6 0.7 0.8 0.9 1Remaining energy (C3)
0
0.1
0.2
0.3
0.4
0.5
0.6
0.7
0.8
0.9
1
Deg
ree o
f mem
bers
hip
(c)
Figure 6: Plots of membership functions for the three components of the Fuzzy MADM method.
9Wireless Communications and Mobile Computing

0 5 10 15 20 25 30 35 40 45Round
0
0.05
0.1
0.15
0.2
0.25
0.3
0.35
0.4
Sum
of e
nerg
y
N = 20N = 40N = 60
N = 80N = 100
(a)
0 5 10 15 20 25 30 35 40 45Round
0
10
20
30
40
50
60
70
80
90
100
Num
ber o
f dea
d no
des
N = 20N = 40N = 60
N = 80N = 100
(b)
0 5 10 15 20 25 30 35 40 45Round
050
100150200250300350400450
Num
ber o
f pac
ket s
ent t
o ac
cess
poi
nt
N = 20N = 40N = 60
N = 80N = 100
(c)
0 2 4 6 8 10 12 14Round
0
0.02
0.04
0.06
0.08
0.1
0.12
0.14
Sum
of e
nerg
y
N = 20N = 40N = 60
N = 80N = 100
(d)
0 2 4 6 8 10 12 14Round
0
10
20
30
40
50
60
70
80
90
100
Num
ber o
f dea
d no
des
N = 20N = 40N = 60
N = 80N = 100
(e)
0 2 4 6 8 10 12 14Round
0
20
40
60
80
100
120
140
Num
ber o
f pac
ket s
ent t
o ac
cess
poi
nt
N = 20N = 40N = 60
N = 80N = 100
(f)
Figure 7: Results of routing for the presented method with Fuzzy MADM approach. (a) Energy consumption vs. round for optimistic model,(b) number of dead nodes vs. round for optimistic model, (c) number of the packet sent to the access point vs. round for optimistic model, (d)energy consumption vs. round for blind model, (e) number of dead nodes vs. round for blind model, and (f) number of the packet sent to theaccess point vs. round for blind model.
10 Wireless Communications and Mobile Computing
transmission, mapping, and composition by each node withnetwork execution.
The routing is done using two methods of optimistic andblind, and the results are illustrated in Figure 7. Figure 7(a)shows total energy consumption for the network with theoptimistic scheme for computational load distribution forthe number of nodes N = 20, 40, 60, 80, and 100. For all theprocess of optimistic scheme, computational load Loptimistic(see Eq. (6)) is identical. Energy consumption until all thenodes are dead shows that a network with many nodes islower energy consumption. However, a network with 20nodes used a higher value of energy.
Due to the optimal formation of clusters using fuzzy logicand selection of fuzzy CHs, long-distance transmission in thenetwork is further reduced, which CHs show low energy con-sumption in each sensor node. It is one of the advantages ofthe optimistic method that has been aforementioned in theprevious process. When the remaining energy of a sensornode in a network hits zero, it is called dead. The operationalcapacity of the network diminishes as the number of deadnodes in the network grows. As a result, sensor node mortal-ity has a direct impact on network operation. Therefore, opti-mistic method endurance is reduced with the increasingnumber of nodes based on Figure 7(b). While 40, 60, 80,and 100 nodes are dead, only 20% of the node of 20 cases isdead. Also, the number of packed sent to access point isdecreased Figure 7(c) with the increasing number of nodes.On the other hand, in the blind method, according toFigure 7(d), the increasing number of node energy consump-tion also has risen. Moreover, maximum energy consump-tion is belonging to the 100 node cases.
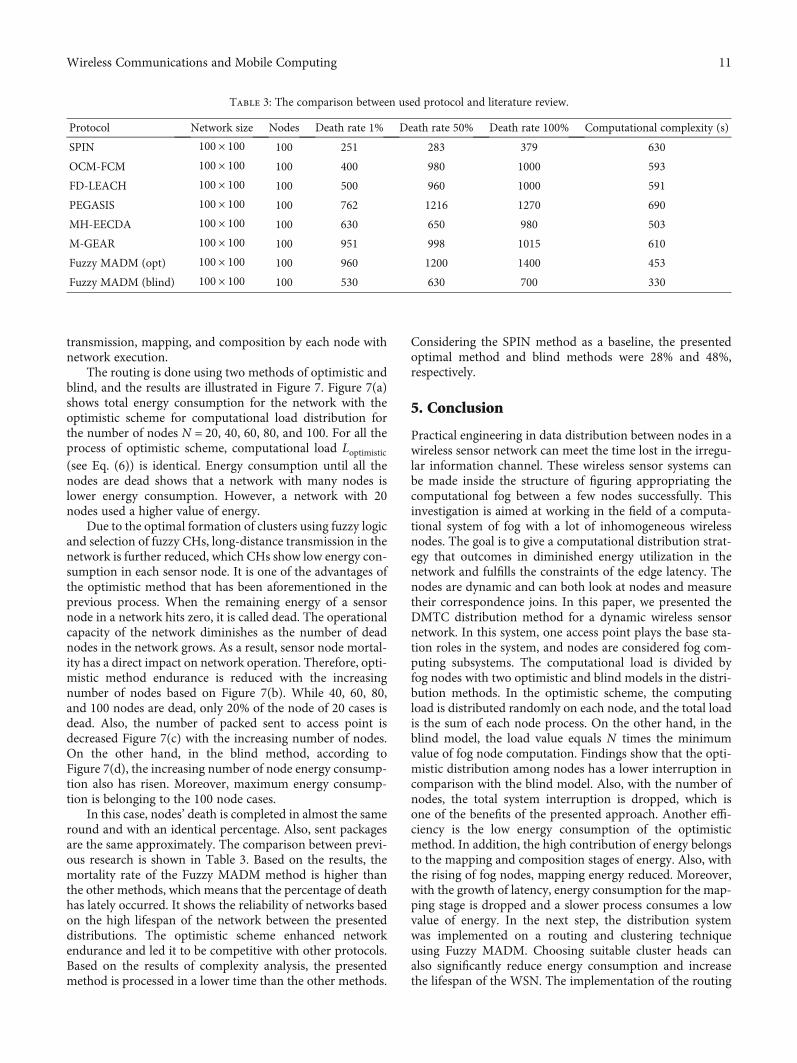
In this case, nodes’ death is completed in almost the sameround and with an identical percentage. Also, sent packagesare the same approximately. The comparison between previ-ous research is shown in Table 3. Based on the results, themortality rate of the Fuzzy MADM method is higher thanthe other methods, which means that the percentage of deathhas lately occurred. It shows the reliability of networks basedon the high lifespan of the network between the presenteddistributions. The optimistic scheme enhanced networkendurance and led it to be competitive with other protocols.Based on the results of complexity analysis, the presentedmethod is processed in a lower time than the other methods.
Considering the SPIN method as a baseline, the presentedoptimal method and blind methods were 28% and 48%,respectively.
5. Conclusion
Practical engineering in data distribution between nodes in awireless sensor network can meet the time lost in the irregu-lar information channel. These wireless sensor systems canbe made inside the structure of figuring appropriating thecomputational fog between a few nodes successfully. Thisinvestigation is aimed at working in the field of a computa-tional system of fog with a lot of inhomogeneous wirelessnodes. The goal is to give a computational distribution strat-egy that outcomes in diminished energy utilization in thenetwork and fulfills the constraints of the edge latency. Thenodes are dynamic and can both look at nodes and measuretheir correspondence joins. In this paper, we presented theDMTC distribution method for a dynamic wireless sensornetwork. In this system, one access point plays the base sta-tion roles in the system, and nodes are considered fog com-puting subsystems. The computational load is divided byfog nodes with two optimistic and blind models in the distri-bution methods. In the optimistic scheme, the computingload is distributed randomly on each node, and the total loadis the sum of each node process. On the other hand, in theblind model, the load value equals N times the minimumvalue of fog node computation. Findings show that the opti-mistic distribution among nodes has a lower interruption incomparison with the blind model. Also, with the number ofnodes, the total system interruption is dropped, which isone of the benefits of the presented approach. Another effi-ciency is the low energy consumption of the optimisticmethod. In addition, the high contribution of energy belongsto the mapping and composition stages of energy. Also, withthe rising of fog nodes, mapping energy reduced. Moreover,with the growth of latency, energy consumption for the map-ping stage is dropped and a slower process consumes a lowvalue of energy. In the next step, the distribution systemwas implemented on a routing and clustering techniqueusing Fuzzy MADM. Choosing suitable cluster heads canalso significantly reduce energy consumption and increasethe lifespan of the WSN. The implementation of the routing
Table 3: The comparison between used protocol and literature review.
Protocol Network size Nodes Death rate 1% Death rate 50% Death rate 100% Computational complexity (s)
SPIN 100 × 100 100 251 283 379 630
OCM-FCM 100 × 100 100 400 980 1000 593
FD-LEACH 100 × 100 100 500 960 1000 591
PEGASIS 100 × 100 100 762 1216 1270 690
MH-EECDA 100 × 100 100 630 650 980 503
M-GEAR 100 × 100 100 951 998 1015 610
Fuzzy MADM (opt) 100 × 100 100 960 1200 1400 453
Fuzzy MADM (blind) 100 × 100 100 530 630 700 330
11Wireless Communications and Mobile Computing

method on optimistic and blind schemes revealed that largenetworks consume lower energy in an optimistic approachthan small ones. Also, energy consumption is dropped withclustering and choosing cluster heads. Because nodes’ mor-tality rate influences WSN efficiency, increasing nodes’ num-ber network endurance is decremented; however, in the blindmethod, the efficiency of the network with an increasingnumber of nodes reduced. To be concluded, the optimisticscheme is proper for an extensive network. However, theblind method is better for a small network.
Fog node resources may be virtualized and distributed toseveral users. Multitenant support in fog resources andscheduling compute jobs based on their QoS needs havenot been thoroughly addressed in the available literature.Future study can be directed toward addressing this gap inthe literature. The development of a real-world testbed fortesting the operation of fog-based rules is typically quitehighly priced and not scalable in many circumstances. As aresult, many academics are looking for an effective toolboxfor fog simulation to conduct preliminary evaluations of fogcomputing systems. Nevertheless, there are just a few fogsimulators on the market right now. Future research mightinclude the construction of a more efficient simulator forfog computing.
Data Availability
In this paper, a random dataset is used. And the parameters’values are extracted from articles.
Disclosure
The funding sources had no involvement in the study design,collection, analysis, or interpretation of data, writing of themanuscript, or in the decision to submit the manuscript forpublication.
Conflicts of Interest
We declare no conflict of interest.
References
[1] N. Jeyakkannan and B. Nagaraj, “Online monitoring of geo-logical methane storage and leakage based on wireless sensornetworks,” Asian Journal of Chemistry, vol. 26, Supplement2, pp. S23–S26, 2014.
[2] P. Saini and A. K. Sharma, “E-DEEC - enhanced distributedenergy efficient clustering scheme for heterogeneous WSN,”in 2010 1st International Conference on Parallel, Distributedand Grid Computing, PDGC-2010, pp. 205–210, Solan, India,2010.
[3] S. H. Thimmaiah and G. Mahadevan, “Analysis of improvedDV-distance algorithm for distributed localization in Wsns,”International Journal of Engineering Research and Develop-ment, vol. 14, no. 2, pp. 16–20, 2018.
[4] A. Gallegos, T. Noguchi, T. Izumi, and Y. Nakatani, “Zone-based energy aware data collection protocol for WSNs,” IEICETransactions on Communications, vol. E101.B, no. 3, pp. 750–762, 2018.
[5] A. Petitti, D. di Paola, A. Milella et al., “A network of station-ary sensors and mobile robots for distributed ambientintelligence,” IEEE Intelligent Systems, vol. 31, no. 6,pp. 28–34, 2016.
[6] E. Pietrosemoli, “Long-distance, low-cost wireless data trans-mission,” URSI Radio Science Bulletin, vol. 339, no. 339,pp. 23–31, 2011.
[7] B. Song, W. Xiao, and Z. Zhang, “Multi-step sensor schedul-ing for energy-efficient high-accuracy collaborative targettracking in wireless sensor networks,” in Proceedings-2013 IEEE International Conference on Green Computingand Communications and IEEE Internet of Things andIEEE Cyber, Physical and Social Computing, GreenCom-iThings-CPSCom 2013, pp. 1341–1345, Beijing, China,2013.
[8] G. P. Sunitha, S. M. D. Kumar, and B. P. V. Kumar, “Energyefficient hierarchical multipath routing protocol to alleviatecongestion in WSN,” International Journal of Ad Hoc andUbiquitous Computing, vol. 32, no. 1, pp. 59–73, 2019.
[9] M. Azharuddin and P. K. Jana, “PSO-based approach forenergy-efficient and energy-balanced routing and clusteringin wireless sensor networks,” Soft Computing, vol. 21, no. 22,pp. 6825–6839, 2017.
[10] L. Chan, K. Gomez Chavez, H. Rudolph, and A. Hourani,“Hierarchical routing protocols for wireless sensor network: acompressive survey,” Wireless Networks, vol. 26, no. 5,pp. 3291–3314, 2020.
[11] P. S. Mann and S. Singh, “Energy-efficient hierarchical routingfor wireless sensor networks: a swarm intelligence approach,”Wireless Personal Communications, vol. 92, no. 2, pp. 785–805, 2017.
[12] M. Jamuna Rani and C. Vasanthanayaki, “Network conditionbased multi-level image compression and transmission inWSN,” Computer Communications, vol. 150, pp. 317–324,2020.
[13] A. Lipare and D. R. Edla, “Cluster head selection and clusterconstruction using fuzzy logic in WSNs,” in 2019 IEEE 16thIndia Council International Conference, INDICON 2019 - Sym-posium Proceedings, pp. 1–4, Rajkot, India, 2019.
[14] M. A. Siddiqi, A. A. Mugheri, and M. Khoso, “Analysis onsecurity methods of wireless sensor network,” Sukkur IBAJournal of Computing and Mathematical Sciences, vol. 2,no. 1, pp. 52–60, 2018.
[15] G. Zhang and R. Li, “Fog computing architecture-based dataacquisition for WSN applications,” China Communications,vol. 14, no. 11, pp. 69–81, 2017.
[16] A. Nayyar and R. Singh, “A comprehensive review of simula-tion tools for wireless sensor networks (WSNs),” Journal ofWireless Networking and Communications, vol. 5, no. 1,pp. 19–47, 2015.
[17] A. Kaur, P. Singh, and A. Nayyar, “Fog Computing: Building aRoad to IoT with Fog Analytics,” in Fog Data Analytics for IoTApplications, pp. 59–78, Springer, 2020.
[18] A. Mohammadi, S. H. Javadi, D. Ciuonzo, V. Persico, andA. Pescapé, “Distributed detection with fuzzy censoring sen-sors in the presence of noise uncertainty,” Neurocomputing,vol. 351, pp. 196–204, 2019.
[19] S. P. Singh, R. Kumar, A. Sharma, and A. Nayyar, “Leveragingenergy-efficient load balancing algorithms in fog computing,”Concurrency and Computation: Practice and Experience, p.e5913, 2020.
12 Wireless Communications and Mobile Computing

[20] P. Nayak and B. Vathasavai, “Energy efficient clustering algo-rithm for multi-hop wireless sensor network using type-2fuzzy logic,” IEEE Sensors Journal, vol. 17, no. 14, pp. 4492–4499, 2017.
[21] H. El Alami and A. Najid, “ECH: an enhanced clustering hier-archy approach to maximize lifetime of wireless sensor net-works,” IEEE Access, vol. 7, pp. 107142–107153, 2019.
[22] J. S. Lee and W. L. Cheng, “Fuzzy-logic-based clusteringapproach for wireless sensor networks using energy predica-tion,” IEEE Sensors Journal, vol. 12, no. 9, pp. 2891–2897,2012.
[23] Y. Yang, J. Cai, H. Yang, J. Zhang, and X. Zhao, “TAD: a trajec-tory clustering algorithm based on spatial-temporal densityanalysis,” Expert Systems with Applications, vol. 139,p. 112846, 2020.
[24] S. Wang, Z. Bao, J. S. Culpepper, T. Sellis, and X. Qin, “Fastlarge-scale trajectory clustering,” Proceedings of the VLDBEndowment, vol. 13, no. 1, pp. 29–42, 2019.
[25] L. Campanile, M. Gribaudo, M. Iacono, and M. Mastroianni,“Performance evaluation of a fog WSN infrastructure foremergency management,” Simulation Modelling Practice andTheory, vol. 104, article 102120, 2020.
[26] S. Hossan and N. Nower, “Fog-based dynamic traffic light con-trol system for improving public transport,” Public Transport,vol. 12, no. 2, pp. 431–454, 2020.
[27] A. Tsipis, A. Papamichail, G. Koufoudakis, G. Tsoumanis, S. E.Polykalas, and K. Oikonomou, “Latency-adjustable cloud/fogcomputing architecture for time-sensitive environmentalmonitoring in olive groves,” AgriEngineering, vol. 2, no. 1,pp. 175–205, 2020.
[28] S. Rani and P. Saini, “Fog Computing: Applications and SecureData Aggregation,” in Handbook of Computer Networks andCyber Security: Principles and Paradigms, pp. 475–492,Springer, 2019.
[29] A. Ullah, G. Said, M. Sher, and H. Ning, “Fog-assisted securehealthcare data aggregation scheme in IoT-enabled WSN,”Peer-to-Peer Networking and Applications, vol. 13, no. 1,pp. 163–174, 2020.
[30] S. Sharma and H. Saini, “Fog assisted task allocation andsecure deduplication using 2FBO2 and MoWo in cluster-based industrial IoT (IIoT),” Computer Communications,vol. 152, pp. 187–199, 2020.
[31] E. Niewiadomska-Szynkiewicz, A. Sikora, J. Kołodziej, andP. Szynkiewicz, “Modelling and simulation of secure energyaware fog sensing systems,” Simulation Modelling Practiceand Theory, vol. 101, article 102011, 2020.
[32] A. Mohammadi, S. H. Javadi, and D. Ciuonzo, “Bayesian fuzzyhypothesis test in wireless sensor networks with noiseuncertainty,” Applied Soft Computing, vol. 77, pp. 218–224, 2019.
[33] V. K. Menaria, S. C. Jain, N. Raju, R. Kumari, A. Nayyar, andE. Hosain, “NLFFT: a novel fault tolerance model usingartificial intelligence to improve performance in wirelesssensor networks,” IEEE Access, vol. 8, pp. 149231–149254,2020.
[34] N. K. Giang, R. Lea, and V. C. M. Leung, “Developing applica-tions in large scale, dynamic fog computing: a case study,” Soft-ware: Practice and Experience, vol. 50, no. 5, pp. 519–532,2020.
[35] D. Zeng, L. Gu, and H. Yao, “Towards energy efficient servicecomposition in green energy powered Cyber–Physical Fog
Systems,” Future Generation Computer Systems, vol. 105,pp. 757–765, 2020.
[36] P. Bellavista, C. Giannelli, and D. D. P. Montenero, “A refer-ence model and prototype implementation for SDN-basedmulti layer routing in fog environments,” IEEE Transactionson Network and Service Management, vol. 17, no. 3,pp. 1460–1473, 2020.
[37] A. Jain and A. K. Goel, “Energy efficient fuzzy routing protocolfor wireless sensor networks,” Wireless Personal Communica-tions, vol. 110, no. 3, pp. 1459–1474, 2020.
[38] M. Tortonesi, M. Govoni, A. Morelli, G. Riberto, C. Stefanelli,and N. Suri, “Taming the IoT data deluge: an innovativeinformation-centric service model for fog computing applica-tions,” Future Generation Computer Systems, vol. 93,pp. 888–902, 2019.
[39] Z. Sun, L. Wei, C. Xu et al., “An energy-efficient cross-layer-sensing clustering method based on intelligent fog computingin WSNs,” IEEE Access, vol. 7, pp. 144165–144177, 2019.
[40] A. Maatoug, G. Belalem, and S. Mahmoudi, “Fog computingframework for location-based energy management in smartbuildings,” Multiagent and Grid Systems, vol. 15, no. 1,pp. 39–56, 2019.
[41] S. R. Sahith, S. R. Rudraraju, A. Negi, and N. K. Suryadevara,“Mesh WSN data aggregation and face identification in fogcomputing framework,” in Proceedings of the InternationalConference on Sensing Technology, ICST, pp. 1–6, Sydney,NSW, Australia, 2019.
[42] V. Mihai, C. E. Hanganu, G. Stamatescu, and D. Popescu,“WSN and fog computing integration for intelligent data pro-cessing,” in Proceedings of the 10th International Conferenceon Electronics, Computers and Artificial Intelligence, ECAI2018, pp. 1–4, Iasi, Romania, 2019.
[43] K. Bhargava, S. Ivanov, C. Kulatunga, and W. Donnelly, “Fog-enabled WSN system for animal behavior analysis in precisiondairy,” in 2017 International Conference on Computing, Net-working and Communications, ICNC 2017, pp. 504–510, Sili-con Valley, CA, USA, 2017.
[44] H. Deng, Z. Guo, R. Lin, and H. Zou, “Fog computingarchitecture-based data reduction scheme for WSN,” in 1stInternational Conference on Industrial Artificial Intelligence,IAI 2019, pp. 1–6, Shenyang, China, 2019.
[45] T. Wang, J. Zeng, Y. Lai et al., “Data collection from WSNs tothe cloud based on mobile Fog elements,” Future GenerationComputer Systems, vol. 105, pp. 864–872, 2020.
[46] Y. Y. Shih, W. H. Chung, A. C. Pang, T. C. Chiu, and H. Y.Wei, “Enabling low-latency applications in fog-radio accessnetworks,” IEEE Network, vol. 31, no. 1, pp. 52–58, 2017.
[47] K. Bhargava and S. Ivanov, “A fog computing approach forlocalization in WSN,” in IEEE International Symposium onPersonal, Indoor and Mobile Radio Communications, PIMRC,pp. 1–7, Montreal, QC, Canada, 2018.
[48] A. H. Gandomi, A. H. Alavi, A. Asghari, H. Niroomand, andA. M. Nazar, “An innovative approach for modeling of hyster-etic energy demand in steel moment resisting frames,” NeuralComputing and Applications, vol. 24, no. 6, pp. 1285–1291,2014.
[49] A. Matin Nazar, P. Jiao, Q. Zhang, K. J. I. Egbe, and A. H.Alavi, “A new structural health monitoring approach basedon smartphone measurements of magnetic field intensity,”IEEE Instrumentation & Measurement Magazine, vol. 24,pp. 49-50, 2021.
13Wireless Communications and Mobile Computing

[50] M. H. Syed, E. B. Fernandez, and M. Ilyas, “A pattern for fogcomputing,” in ACM International Conference ProceedingSeries, pp. 1–10, New York, NY, USA, 2016.
[51] A. M. Nazar, K.-J. I. Egbe, P. Jiao, and A. H. Alavi, “A novelmulti-mode magnetic triboelectric nanogenerator energy har-vesting system,” in Behavior and Mechanics of MultifunctionalMaterials XV, 2021.
[52] K. Intharawijitr, K. Iida, and H. Koga, “Analysis of fog modelconsidering computing and communication latency in 5G cel-lular networks,” in 2016 IEEE International Conference on Per-vasive Computing and Communication Workshops, PerComWorkshops, pp. 1–4, Sydney, NSW, Australia, 2016.
14 Wireless Communications and Mobile Computing