Embed Size (px)
Citation preview
DPRIETI Discussion Paper Series 11-E-061
Does Tobin's q Matter for Firms' Choicesof Globalization Mode?
JINJI NaotoKyoto University
ZHANG XingyuanOkayama University
HARUNA ShojiOkayama University
The Research Institute of Economy, Trade and Industryhttp://www.rieti.go.jp/en/
RIETI Discussion Paper Series 11-E-061 July 2011
Does Tobin's q Matter for Firms' Choices of Globalization Mode?∗
JINJI Naoto† ZHANG Xingyuan HARUNA Shoji Kyoto University Okayama University Okayama University
Abstract
In this paper, we investigate empirically how firms’ choices of globalization mode differ
according to their productivity and Tobin’s q using firm-level data of Japanese firms. Our
findings support predictions by Helpman, Melitz, and Yeaple (2004) and by Chen, Horstmann,
and Markusen (2008). That is, we find that firms with higher productivity tend to choose more
foreign direct investment (FDI) and less exporting. We also find that firms with higher Tobin’s
q tend to choose more FDI and less foreign outsourcing of production. The difference in
productivity is relatively less important for the choice between FDI and foreign outsourcing,
and the difference in Tobin’s q is relatively less important for the choice between exporting and
FDI. Because the indexes of globalization activities have a strong negatively skewed
distribution, our results indicate that quantile regression would be appropriate to analyze the
relationship between firm characteristics and choice of globalization mode.
Keywords: FDI, foreign outsourcing, export, Tobin’s q, and quantile regression.
JEL classification: F10; F23; D22; L22
∗ The authors thank Masahisa Fujita, Masayuki Morikawa, Ayumu Tanaka, Yasuyuki Todo, and Ryuhei Wakasugi for their valuable comments and suggestions on an earlier version of the paper. The authors also thank the Research Institute of Economy, Trade and Industry (RIETI) for providing an opportunity to conduct this research and the Research and Statistics Department of the Ministry of Economy, Trade and Industry (METI) for granting permission to access firm-level data from METI's surveys. The authors are solely responsible for any remaining errors. †Corresponding author. Faculty of Economics, Kyoto University, Yoshida-honmachi, Sakyo-ku, Kyoto 606-8501, Japan. Phone & fax: +81-75-753-3511. E-mail: [email protected].
RIETI Discussion Papers Series aims at widely disseminating research results in the form of professional papers, thereby stimulating lively discussion. The views expressed in the papers are solely those of the author(s), and do not represent those of the Research Institute of Economy, Trade and Industry.
1 Introduction
The relationship between a firm’s productivity and the manner in which it accesses foreign markets
has been investigated both theoretically and empirically.1 Melitz (2003) presents a model in which the
most productive firms export goods to foreign markets, whereas less productive firms supply goods
to their domestic markets only. Helpman, Melitz, and Yeaple (2004) extend the framework of Melitz
(2003) to incorporate the possibility that firms serve foreign markets through foreign direct investment
(FDI). They predict that only the most productive firms find it profitable to serve foreign markets
via FDI and that medium-productivity firms serve foreign markets by exporting. As in Melitz (2003),
lower-productivity firms serve their domestic markets only.
The sorting of firms into multinationals, exporters, and domestic producers according to their
productivity has been well documented by numerous empirical studies. First, the superior performance
of exporting firms relative to domestic producers has been confirmed by Bernard and Jensen (1995,
1999) and Bernard et al. (2007) for the US; by Clerides, Lach, and Tybout (1998) for Colombia,
Mexico, and Morocco; by Aw, Chung, and Roberts (2000) for South Korea and Taiwan; and by Mayer
and Ottaviano (2007) for European countries. Moreover, the productivity advantage of firms that
engage in FDI relative to exporters that do not engage in FDI has been documented by Helpman,
Melitz, and Yeaple (2004) for the US; by Head and Ries (2003), Kimura and Kiyota (2006), and
Wakasugi et al. (2008) for Japan; and by Girma, Kneller, and Pisu (2005) for the UK.
However, when a firm offshores its production of intermediate inputs, it can choose either FDI or
outsourcing. By introducing intra-sectoral firm heterogeneity into an incomplete contracting model
developed by Antras (2003), Antras and Helpman (2004) theoretically show that high-productivity
firms engage in FDI and that medium-productivity firms choose foreign outsourcing. They also
show that low-productivity firms acquire intermediate inputs within their domestic economies. That
productivity ordering emerges in sectors that are intensive in headquarter services.
Tomiura (2007) tests the predictions of Antras and Helpman (2004) using a firm-level dataset that
covers all manufacturing industries in Japan. He provides rare and direct evidence that supports
their predictions. That is, he finds that firms that engage only in foreign outsourcing tend to be
less productive than firms that engage in FDI. More precisely, he finds that the average productivity
of firms that serve only their domestic markets is much lower than that of firms with access to
foreign markets. Multinationals (firms that engage in FDI) are on average more productive than
exporters (firms that export to foreign markets but engage in neither FDI nor foreign outsourcing)
and outsourcers (firms that outsource abroad but neither export nor conduct FDI). The average
productivity of exporters is lowest among globalized firms (firms that have access to foreign markets).
Moreover, firms that undertake multiple modes of foreign market access tend to be far more productive
than other types of firms.
1Helpman (2006), Greenaway and Kneller (2007), and Wagner (2007) provide surveys of the literature.
2
The models of Antras and Helpman (2004) and Antras (2003) are based on the property rights
approach (Grossman and Hart, 1986; Hart and Moore, 1990), which emphasizes the ownership of
physical assets. The owner of residual rights over an asset retains full control of the asset in the
event of a failed relationship or negotiation. Another approach focuses on knowledge-based assets
(Markusen, 1984, 2002; Horstmann and Markusen, 1987; Markusen and Venables, 1998, 2000). This
approach emphasizes the jointness property of knowledge-based assets. The jointness property leads
to the problem of non-excludability if relationships or negotiations fail. That is, knowledge capital is
easily absorbed by the local manager or licensee.
Chen, Horstmann, and Markusen (2008) have recently proposed a model that combines the two
approaches to explain how the relative importance of knowledge capital over physical capital affects a
firm’s choice between FDI and foreign outsourcing. They show that firms with higher physical capital
intensity tend to engage in outsourcing, whereas firms with higher knowledge capital intensity tend
to engage in FDI. Based on the theoretical analysis, Chen, Horstmann, and Markusen (2008) provide
an interesting testable hypothesis that firms with higher Tobin’s q would more likely establish foreign
subsidiaries. As is well known, Tobin’s q is the ratio of a firm’s market value to the replacement value
of its book equity. Because the firm’s market value reflects knowledge-based assets as well as physical
assets and because the book value of capital largely reflects physical assets only, a firm with higher
knowledge capital intensity will have a higher Tobin’s q. Consequently, their result implies that firms
with high Tobin’s q are more likely to engage in FDI, whereas those with low Tobin’s q are more likely
to engage in foreign outsourcing.
The issue then is identifying the relationship between a firm’s productivity and Tobin’s q. One
can expect that many factors will affect Tobin’s q of a firm. Productivity would be one such factor.
As Dwyer (2001) argues, however, in theory, there may or may not be a positive relationship between
productivity and Tobin’s q. In the presence of ex ante uncertainty with respect to the outcome of
investments (in physical capital, R&D, and so on), since firms with successful investments will have
high productivity and a high market value relative to the replacement cost of their assets, the model
predicts a positive relationship between productivity and Tobin’s q (Jovanovic, 1982; Hopenhayn,
1992: Melitz, 2003). In contrast, if productivity differentials are embodied in physical capital, the
relationship between productivity and Tobin’s q is not necessarily positive for every firm can use the
capital embodied higher productivity (Cooley, Greenwood, and Yorukoglu, 1997). In the literature
of corporate finance, some studies empirically analyze the relationship between firm productivity and
Tobin’s q and show that in reality, a positive relationship exists between them even after controlling
various other factors that also affect the firm’s market value (Palia and Lichtenberg, 1999; Dwyer,
2001; Balasubramanyan and Mohan, 2010).2
2Palia and Lichtenberg (1999) find a significantly positive relationship between total factor productivity (TFP)
and Tobin’s q. Dwyer (2001) also finds a significantly positive effect of a firm’s plant-level productivity on Tobin’s
q. Balasubramanyan and Mohan (2010) find a significantly positive effect of sectoral TFP growth on Tobin’s q of the
3
Another issue is that the relative importance of knowledge capital to physical capital discussed in
Chen, Horstmann, and Markusen (2008) may simply be captured by calculating the ratio of intangible
to tangible assets. In general, intangible assets include patents, copyrights, trademarks, trade names,
goodwill, and other items that lack physical substance but provide long-term benefits to the company.
It may be interesting to examine whether the effects of Tobin’s q on the choice of globalization mode
differ from effects of the intensity of intangible assets. In this paper, we use the stock of patent
applications as a direct measure of intangible assets.
The main purpose of this paper is to investigate empirically whether the predictions of Chen,
Horstmann, and Markusen (2008) and those of Helpman, Melitz, and Yeaple (2004) are supported
by the data. We use firm-level data for Japanese firms covering the period 1994–1999. Our dataset
includes information on sales, employment, capital, R&D expenditure, direct exports, and costs of
domestic and foreign outsourcing of the companies headquartered in Japan, and sales of their foreign
affiliates. Data regarding corporate balance sheets and patent applications are also included. We
then construct new indexes of a firm’s choice of globalization mode by calculating the ratio of a mode
of globalization activity (export, FDI, or foreign outsourcing) to the domestic sales of headquarter
companies. The size of FDI is measured by sales of foreign affiliates. We also construct indexes to
measure the relative choice of globalization modes by taking the ratio of the volume of direct export
by the headquarter company to FDI (i.e., sales of foreign affiliates) and the ratio of costs of foreign
outsourcing to FDI. We use labor productivity, defined by value-added per worker, which is among the
most frequently used measures in the literature, to measure productivity. Among various approaches
to measuring Tobin’s q, we employ a simple approximation version proposed by DaDalt, Donaldson,
and Garner (2003). We also calculate the ratio of intangible to tangible assets, capital intensity
(capital-labor ratio), and R&D intensity (the ratio of R&D stock to labor). Then, we regress indexes
of the firm’s choice of globalization mode on these variables.
The main findings of this paper are as follows. We first run the random-effect instrumental-variable
panel estimation to address the issue of endogeneity bias in labor productivity and Tobin’s q. The
estimation results indicate that both labor productivity and Tobin’s q have significantly positive effects
on the ratio of FDI to domestic sales and on the ratio of exports to domestic sales, but effects on the
ratio of foreign outsourcing to domestic sales are insignificant.
We next focus on our indexes of globalization activities, which have a strong negatively skewed
distribution and include outliers. Traditional estimation techniques such as the linear regression
model may not be appropriate because they provide information only on the effects of the regressors
at the conditional mean of the dependent variable. Alternatively, it may be important to estimate
the relationship between the dependent variable and the independent variables at different points
in the conditional distribution of the dependent variable. To address this issue, we employ quantile
benchmark firm in the sector.
4
regression. In contrast to traditional estimation techniques, quantile regression can provide estimates
of parameters at different quantiles of the dependent variable. Thus, it incorporates heterogeneity
among firms and allows outliers in the sample.3
The quantile regression estimation indicates that labor productivity has a significantly negative
effect on the ratio of exporting to FDI at higher quantiles; however, it has no significant effect on the
ratio of foreign outsourcing to FDI at any quantile. This result suggests that firms with higher labor
productivity tend to choose more FDI and less exporting and that the difference in labor productivity
does not matter for the choice between FDI and outsourcing. The former is consistent with the
prediction by Helpman, Melitz, and Yeaple (2004). On the other hand, Tobin’s q has a significantly
negative effect on the ratio of foreign outsourcing to FDI, whereas it has an insignificant effect on the
ratio of exporting to FDI. Thus, firms with higher Tobin’s q tend to choose more FDI and less foreign
outsourcing, whereas the difference in Tobin’s q is not important for the choice between FDI and
exporting. The former is consistent with the prediction by Chen, Horstmann, and Markusen (2008).
Moreover, we find that a higher intensity of intangible assets measured by the ratio of patent stock to
fixed capital favors FDI over foreign outsourcing and exporting. This result confirms that the effects
of Tobin’s q on the choice of globalization mode are not the same as those of the ratio of intangible
to tangible assets. Finally, our estimation result also indicates that firms with higher physical capital
intensity tend to engage in more FDI and less foreign outsourcing. This result supports the prediction
by Antras (2003).
The remainder of the paper is organized as follows. Section 2 describes the data employed in this
paper and explains variables used in our analysis. Section 3 provides empirical results and discusses
implications arising from those results. Section 4 concludes.
2 Data and Variables
2.1 Data
Our data are primarily collected from three datasets for Japanese companies: the Basic Survey of
Japanese Business Structure and Activities (Kigyo Katsudo Kihon Chosa, hereafter KKKC), the
Basic Survey of Overseas Business Activities (Kaigai Jigyo Katsudo Kihon Chosa, hereafter KJKKC),
and the NEEDS’ Company Financial Reports (NEEDS). The first two surveys are annual surveys
implemented by the Ministry of Economy, Trade and Industry (METI) and include data on business
3Quantile regression was introduced by Koenker and Bassett (1978). Buchinsky (1998) provides a survey and Koenker
and Hallock (2001) provide a nontechnical introduction of quantile regression. For technical details, see Koenker (2005)
and Hao and Naiman (2007). Wagner (2006) applies quantile regression to the analysis of export behavior of German
manufacturing plants and shows that the effects of plant characteristics, such as size, branch plant status, and R&D
intensity, on export activities vary along the conditional size distribution of the export/sales ratio. Kosteas (2008) and
Trofimenko (2008) also apply quantile regression to related issues.
5

activities of companies headquartered in Japan and their affiliates, such as sales, employment, capital,
R&D expenditure, and direct exports of the headquarters, and sales of their foreign affiliates. The
KKKC also includes information on outsourcing — i.e., the number of domestic and foreign firms
to which a headquarter company contracted out its manufacturing or processing tasks and the cost
involved in contracting out business activities during 1994–1999. Data on corporate balance sheets
are obtained from NEEDS, which covers about 4,000 publicly traded firms in Japanese stock market.
All publicly traded firms are identified by two codes — a Nikkei company code defined by Nikkei Inc.
and a security code defined by the Japanese Securities Identification Code Committee. Since firm
codes in the KKKC and KJKKC surveys differ from those in NEEDS, we use the Nikkei company
code to link the three datasets. By matching the full names and addresses of companies among the
three datasets we identify approximately 1,100 headquarter companies for each year during the period
1994–1999.
Besides the data discussed above, we collect data on patent applications by companies headquar-
tered in Japan made to the Japanese Patent Office during 1990–1999 from the database released by
the Institute of Intellectual Property (IIP).4
2.2 Indexes of globalization activities
Table 1 shows the globalization activities of our sampled companies. We identify FDI firms, out-
sourcing firms, and export firms by acquiring information on foreign affiliates’ sales reported in the
KJKKC survey in year t and on the costs of foreign outsourcing and export reported in the KKKC
survey in year t. Among these headquarter companies, about two-thirds reported implementing at
least one globalization activity from 1994 to 1999. The share of the companies involved in globaliza-
tion activities in our sample is overwhelming, contrary to the findings in Tomiura (2007) that about
90% of the firms are “domestic” for Japanese companies. This may be because the publicly traded
companies are usually sizable and competitive compared with firms that are not publicly traded.
Therefore, publicly traded companies may have greater ability to enter international markets. Among
our sampled companies, over 52% undertake FDI (including companies that also engage in export
and/or foreign outsourcing). About 65% of our sampled firms export and 16% outsource. Compared
with the number of firms engaged in FDI and exporting, the number of foreign outsourcing firms is
quite limited.
In the literature (e.g., Bernard et al., 2009; Tomiura, 2007), globalization activities are usually
categorized by using dummies that equal one when the firm engages in a particular activity and zero
otherwise. The KKKC and KJKKC survey datasets allow us to recognize the extent to which Japnese
companies are involved in globalization activities. That is, we can measure the ratio of sales by foreign
affiliates (I), which capture the size of FDI, to domestic sales by headquarter companies (D), which
4See Goto and Motohashi (2007) for details of the IIP dataset.
6
is denoted by RID. Similarly, the ratio of export by headquarter companies (X) to domestic sales
(RXD) and the ratio of costs of foreign outsourcing (O) to domestic sales (ROD) can be computed.
Using this information, we construct new indexes for FDI, export, and foreign outsourcing: RID,
RXD, and ROD. These new indexes can capture the relative importance of a particular type of
globalization activity (i.e., FDI, export, or foreign outsourcing) for a firm in relation to the size of
its domestic activity. Table 2 presents the percentiles, mean, and standard deviation for the three
indexes. The statistics of the percentiles and mean suggest that the distributions of the indexes have
a strong negative skew. There are some outliers among firms that engage in globalization activities,
reflecting that some leading MNEs mainly produce abroad rather than domestically.
We also construct indexes to measure the relative choice of globalization modes. RXI is the ratio
of export sales to foreign affiliate sales, and ROI is the ratio of outsourcing costs to foreign affiliate
sales. The former measures the relative choice of exporting over FDI, and the latter measures the
relative choice of foreign outsourcing over FDI.5 Descriptive statistics for these indexes are summarized
in Table 2.
2.3 Labor productivity, Tobin’s q, and patent stock
In this subsection, we explain important independent variables in our estimation. We begin with labor
productivity. Following Tomiura (2007), labor productivity (LnLP ) is measured in logarithms as
LnLP = log [(Sales − COGS)/L] ,
where L and Sales denote the number of regular employees and total sales, respectively, and COGS
refers to the cost of goods sold. Tomiura (2007) argues that this measure is preferable to gross output
per worker because deducting costs from sales is important, especially when the manufacturing process
involves outsourcing
Tobin’s q is measured as the ratio of the firm’s market value to its tangible assets. Corporate
finance scholars have developed complex estimations of Tobin’s q which rely on estimated market
value of the firm (Abel and Blanchard, 1986; Perfect and Wiles, 1994). As indicated by DaDalt,
Donaldson, and Garner (2003), these approaches to Tobin’s q produce more precise estimations but
are computationally costly. Moreover, these approaches may be subject to a larger selection bias. They
suggest that a simple approach is preferable unless extreme precision of the q estimates is paramount
and sample selection bias is unlikely to be significant. We attempt to use a simpler approximation
5We measure the size of FDI by sales of foreign affiliates. The sales data include local sales, exports to the source
country (Japan), and exports to third countries. Thus, when we consider the choice between FDI and foreign outsourcing,
factors not directly related to the choice between FDI and outsourcing may be included. Note that using sales of foreign
affiliates as a measure of FDI, our analysis is not inconsistent with the model in Chen, Horstmann, and Markusen
(2008), who consider only the case in which production occurs in the foreign country and a firm in the home country
chooses either FDI or outsourcing for production. They do not specify whether the possible FDI is horizontal or vertical.
7
version as discussed in DaDalt, Donaldson, and Garner (2003), who propose the following simple
approximation of Tobin’s q:
Tobin’s q =MV E + PS + LTDEBT + CL + BV INV − CA
TA,
where MV E is the year-end value of common stock and PS is the liquidation value of preferred stock.
LTDEBT , CL, BV INV , CA, and TA denote the book values of long-term debt, current liabilities,
inventory, current assets, and total assets, respectively. We exclude PS in our measure for Tobin’s q
because the data are unavailable.
Table 2 demonstrates that the mean and median values of Tobin’s q are 1.29 and 1.18, respectively,
both of which are very close to those reported in Hall, Jaffe, and Trajtenberg (2005) for the US firms
and slightly below those in Fukuda et al. (1999) for Japanese firms in the period 1985–1996.
As a measure of intangible assets, we use patent stock, Pat. We construct a patent stock at period
t from the data on patent applications by using the perpetual inventory method as follows:
Patt = It + (1 − δ)Patt−1, (1)
where Patt is the stock of patent applications at the end of period t, It is the number of patent
applications during period t, and δ is the depreciation rate. Following convention in the literature,
we resort to the traditional 15% depreciation rate (see Hall, Jaffe, and Trajtenberg (2005)). We use
the number of patent applications in 1990 as the benchmark value for Pat. Since our data on patent
applications begin from 1990 and our sample period begins in 1994, there are four years between the
benchmark year and the first year of the sample period. Thus, the value of Pat in 1994 estimated by
the perpetual inventory method is influenced little by the initial value of Pat in the benchmark year.
We then compute the logarithm of the ratio of patent stock to tangible fixed capital, LnPatK, as a
measure of the ratio of intangible to tangible assets.
Moreover, as shown in Helpman, Melitz, and Yeaple (2004), we control for capital intensity and
R&D intensity. The former is measured by the logarithm of the ratio of tangible fixed capital to
regular employees in the headquarter company, LnKL. The latter is measured by the logarithm of
the ratio of R&D stock to employees, LnRL. R&D stock, RD, is computed in the same manner as
patent stock. That is, in Eq. (1), Patt and Patt−1 are replaced by RDt and RDt−1, respectively,
and It is interpreted as the R&D expenditure in the period of t. In calculating R&D stock we also
use δ = 0.15. Similar to the case of patent stock, R&D expenditure in 1990 is used as the benchmark
value, and R&D stock in 1994 is estimated by the perpetual inventory method.
Table 2 presents descriptive statistics for these independent variables.
8

3 Empirical Results
First, we investigate the effects of labor productivity and Tobin’s q on the globalization indexes
RID, RXD, and ROD. Then we examine the effects of labor productivity, Tobin’s q, and the
intensity of intangible assets on the relative choice of globalization modes, RXI and ROI. Following
Helpman, Melitz, and Yealple (2004), we use a linearized version of regression equations and consider
a specification that controls for the firm’s capital intensity (LnKL) and R&D intensity (LnRL).
3.1 Initial results
Table 3 shows the initial results of random-effects panel estimation. To address the issue of endogeneity
bias in the logarithm of labor productivity (LnLP ) and Tobin’s q (TobinQ) we also instrument the
two variables by taking one lag of all dependent and independent variables. The random-effects IV
panel estimates are shown in Table 4. The left panels of Tables 3 and 4 show the estimated results
regarding the effects of logarithm of labor productivity and the right panels show the results with
respect to the effects of Tobin’s q.
Hausman tests for the estimated results obtained from random-effects panel estimations in Table 3
suggest that the exogeneity hypotheses between error terms and explanatory variables are statistically
accepted in most cases.6 Thus, random-effects panel estimations are appropriate compared with those
of the fixed-effects panel model. After LnLP or TobinQ is instrumented, estimates for capital intensity
LnKL in Table 4 turn out to be insignificant in many cases. However, the effects of LnLP or TobinQ
retain almost the same signs and significance as shown in Table 3.
In both tables, the coefficients of LnLP are positive and statistically significant in each index,
although the significance level is relatively weak for the cases of export (RXD) in Table 3 and foreign
outsourcing (ROD) in Table 4. These results are consistent with Tomiura (2007): higher-productivity
firms tend to engage in more globalization activities (FDI, exporting, or outsourcing).
Next we consider the effects of Tobin’s q on the globalization indexes. The estimated coefficients
of TobinQ are positive and significant for the regressions of RID and RXD in Table 4, and they are
strongly significant for RID in Table 3. However, in the regressions of ROD, the coefficient of TobinQ
is insignificant in both tables. This result suggests that an increase in Tobin’s q does not necessarily
induce a firm to expand its foreign outsourcing relative to its domestic sales.
Coefficients of LnRL are positive and statistically significant in all cases in both Tables 3 and
4, indicating the positive effects of R&D intensity on globalization activities. In contrast, while the
6Although the Hausman test indicates that the null hypothesis is rejected for regressions of ROD, results estimated
by the fixed-effects panel regressions are quite similar to those estimated by random-effects panel regressions. In cases
of fixed-effects panel regressions, the estimated coefficient of ROD is statistically significant at 0.79 for LnKL, whereas
for TobinQ, it is statistically insignificant at 0.14. All estimated results of fixed-effects panel estimates are available
from the corresponding author upon request.
9
coefficients of LnKL are significantly positive in the right panel of Table 3, they are insignificant in
most cases in Table 4. This result suggests that firms with higher capital intensity do not necessarily
engage in more globalization activities, irrespective of their mode. We discuss this issue in the next
subsection.
The regression techniques we used above are the regressions for summarizing the average relation-
ship between the globalization indexes and a set of regressors, such as LnLP and TobinQ. However, it
may be important to provide information about the relationship at different points in the conditional
distribution of the globalization choice indexes, because they have a strong negatively skewed distri-
bution. Quantile regression is a useful tool in addressing this issue.7 Here, we use an algorithm known
as least absolute deviations (LAD) to provide quantile estimates, where estimation is implemented by
solving linear-programming problems.8 Table 5 presents the estimated results obtained by quantile
regression at the 95th percentile with industrial and year dummies. For purpose of comparison, the
results estimated by ordinary least squares regression (OLS) with the same dummies for industries
and years are also reported. Coefficients of LnLP obtained both from OLS and quantile regression
are positively significant at least at the 10% level for all instances of the globalization choice indexes
except ROD, for which the significance level is 11%. On the other hand, coefficients of TobinQ vary
across regression techniques. Quantile regression coefficients reveal positive significance even for ROD,
a result which differs considerably from the OLS regression. Our results suggest that the impact of
Tobin’s q on the globalization choice indexes may differ across quantiles, particularly for some outliers.
3.2 Effects of productivity and Tobin’s q on globalization choice
In their theoretical and empirical analysis of a firm’s choice between export and FDI for heterogeneous
firms, Helpman, Melitz, and Yeaple (2004) show that the most productive firms choose to invest in
foreign markets, whereas less productive firms choose to export. On the other hand, Chen, Horstmann
and Markusen (2008), in their theoretical analysis, argue that FDI firms will have larger values of
Tobin’s q than outsourcing firms. Here we attempt to present a comprehensive view of the effects
of Tobin’s q and labor productivity on globalization choice for the firms that engage in at least one
globalization activity, whether FDI, exporting, or outsourcing.
Tables 6 and 7 summarize OLS and quantile regressions of LnLP and TobinQ on globalization
choices RXI (ratio of exporting to FDI) and ROI (ratio of foreign outsourcing to FDI).9 We also
apply the bootstrap simulation method to the same sample, where the estimates are obtained by
7See Koenker (2005) and Hao and Naiman (2007) for details on quantile regression estimation.8See Cameron and Trivedi (2009) for the detailed STATA command for the quantile estimation.9Our sample contains many zeroes, which may cause biases in the quantile regression. Moreover, we know from
theoretical analyses, such as Melitz (2003) and Helpman, Melitz, and Yeaple (2004), that initiating export or FDI
requires fixed costs and involves discontinuous choice, which is hence qualitatively different from changing the size of
export or FDI after engaging in that mode. Thus, we concentrate on observations for which each of RXI and ROI is
larger than zero.
10
bootstrapping 400 replications. The estimated results are shown in Table 9, which coincide fairly well
with those in Tables 6 and 7.
For RXI, the estimated coefficients of LnLP in Table 6 are negatively significant at higher quan-
tiles, namely, the 50th and 75th percentiles. These results strongly support the theoretical and
empirical results demonstrated by Helpman, Melitz, and Yeaple (2004). That is, an increase in labor
productivity tends to motivate a firm to choose more FDI and less exporting. However, all coefficients
of LnLP fail the null hypothesis for ROI.
In Table 7, the coefficients of TobinQ are significantly negative in the quantile regressions for ROI
at the 25th and 75th percentiles, whereas we find no significant effects of TobinQ on RXI. Thus,
an increase in Tobin’s q tends to motivate a firm to choose more FDI and less foreign outsourcing,
but it does not affect the choice between exporting and FDI. This finding supports the prediction
by Chen, Horstmann, and Markusen (2008) that firms which produce goods with higher knowledge
capital intensity tend to choose FDI over foreign outsourcing.
In Tables 6 and 7, all coefficients of LnKL are significantly negative in the quantile regressions
for ROI. Thus, an increase in capital intensity leads a firm to choose more FDI and less foreign
outsourcing. This result seems consistent with the finding of Tomiura (2007) and confirms the pre-
diction by Antras (2003). In contrast, the coefficients of LnKL in the quantile regressions for RXI
are significantly positive in most cases in both the tables. This suggests that an increase in capital
intensity prompts a firm to choose more exporting and less FDI. This contradicts the result shown
by Helpman, Melitz, and Yeaple (2004), who find that firms in more capital-intensive sectors tend to
export less relative to FDI.10 However, to our knowledge, there are no definitive theoretical predictions
regarding the relationship between capital intensity and the choice between exporting and FDI.
Moreover, in Tables 6 and 7, all coefficients of LnRL are significantly positive in the quantile
regressions. This result indicates that an increase in R&D intensity causes a firm to export and
outsource more relative to FDI. One might regard this result as inconsistent with conventional wisdom.
However, Helpman, Melitz, and Yeaple (2004) also show that R&D intensity is not a useful predictor
of exports versus FDI. Norback (2001) finds that firms with higher R&D intensity tend to export
rather than engage in FDI if the costs of technology transfer are high, while the opposite is true if
these costs are low. Theoretically, there is no definitive relationship between R&D intensity and the
choice of globalization mode. Our empirical results suggest this issue should be investigated further
theoretically and empirically.
3.3 Effects of the intensity of intangible assets on globalization choice
Finally, we analyze how the results for Tobin’s q will change if we use the ratio of intangible to tangible
assets. We repeat the estimations in the previous subsection by replacing TobinQ with LnPatK, the
10Tomiura (2007) also finds that multinationals tend to be more capital intensive than exporters.
11
logarithm of the ratio of patent stock to tangible fixed capital. Table 8 shows the estimated results for
regressions both of RXI and ROI on LnPatK. All quantile estimates of LnPatK are significantly
negative for the case of ROI, which coincides with the findings in Table 7 for the regression on
Tobin’s q. However, the estimated results also show significantly negative effects of LnPatK on RXI,
which are different from those of TobinQ in Table 7. These results imply that headquarter companies
with relatively higher intangible assets tend to favor FDI over exporting and outsourcing in their
globalization decisions. Therefore, the effects of Tobin’s q on firms’ choices of globalization mode
differ fairly from the effects of the intensity of intangible assets.
4 Conclusion
Using firm-level data for Japanese firms, this paper investigated empirically how firms’ choice of
globalization mode differs according to productivity and Tobin’s q. We tested the predictions by
Chen, Horstmann, and Markusen (2008) and Helpman, Melitz, and Yeaple (2004). Using quantile
regression, we found that firms with higher productivity tend to choose more FDI and less exporting,
which supports the prediction by Helpman, Melitz, and Yeaple (2004). The difference in productivity,
however, has no significant effect on the choice between FDI and exporting. We also found that
firms with higher Tobin’s q tend to choose more FDI and less foreign outsourcing, which supports the
prediction by Chen, Horstmann, and Markusen (2008). However, the choice between FDI and foreign
outsourcing is not affected by the difference in Tobin’s q. Moreover, the estimated result indicated
that firms with higher intensity of intangible assets tend to choose more FDI relative to both exporting
and outsourcing. Thus, we concluded that the effects of Tobin’s q on the choice of globalization mode
are not the same as those of the intensity of intangible assets.
Our results suggested that the quantile regression technique would be appropriate for analyzing the
relationship between globalization mode and firms’ characteristics, because the indexes of globalization
activities have a strong negatively skewed distribution and include outliers. Estimated results from
employing traditional estimation techniques that give information only at the conditional mean of the
dependent variable may not be appropriate.
Our findings have important policy implications. Although existing empirical studies have pri-
marily focused on the relationship between a firm’s productivity and its choice of globalization mode,
our findings illuminate the potential importance of Tobin’s q on firms’ globalization activities. In
particular, we found that a difference in Tobin’s q affects the choice between FDI and foreign out-
sourcing, whereas a difference in productivity is relatively less important for the choice between those
two activities. Firms with lower Tobin’s q are relatively more active in foreign outsourcing than in
FDI. Thus, policies to facilitate foreign outsourcing will benefit the domestic economy, because foreign
outsourcing contributes to improve the competitiveness of outsourcers by reducing their production
12
costs. Since relatively lower values of Tobin’s q imply that these firms do not effectively utilize their
capital, deregulation and expansion of supportive services to small and medium enterprises may be
helpful. Providing information on regulation in foreign countries and helping to find potential partner
companies of outsourcing may also enhance gains from foreign outsourcing by reducing fixed costs of
outsourcing. On the other hand, firms with lower Tobin’s q may be reluctant to enhance FDI because
they have difficulty in financing costs of investment, as indicated by the low value of Tobin’s q. Thus,
policies to create a financing mechanism for FDI will help those firms and facilitate outward FDI.
There are a few caveats with respect to our analysis. First, we captured firms’ globalization
activities in the relative size, such as the ratio of exports to sales of foreign affiliates and the ratio
of costs of foreign outsourcing to sales of foreign affiliates. This is because many globalized firms
engage in more than one globalization mode. In theoretical models of Helpman, Melitz, and Yeaple
(2004) and Chen, Horstmann, and Markusen (2008), by contrast, individual firms do not engage in
multiple modes of globalization, although we observe multiple modes at the aggregated industry level.
Second, we cannot fully explain our estimation results regarding the effects of capital intensity and
R&D intensity on the choice of globalization mode. Further theoretical and empirical studies on this
issue are required.
References
[1] Abel, Andrew B. and Oliver J. Blanchard. 1986. “The present value of profits and cyclical move-
ments in investment.” Econometrica 54(2): 249–273.
[2] Antras, Pol. 2003. “Firms, contracts, and trade structure.” Quarterly Journal of Economics
118(4): 1375–1418.
[3] Antras, Pol and Elhanan Helpman. 2004. “Global sourcing.” Journal of Political Economy 112(3):
552–580.
[4] Aw, Bee Yan, Sukkyun Chung, and Mark J. Roberts. 2000. “Productivity and turnover in the
export market: Micro-level evidence from the Republic of Korea and Taiwan (China).” World
Bank Economic Review 14(1): 65–90.
[5] Balasubramanyan, Lakshmi and Ramesh Mohan. 2010. “How well is productivity being priced?”
Journal of Economics and Finance 34(4): 415–429.
[6] Bernard, Andrew B. and J. Bradford Jensen. 1995. “Exporters, jobs, and wages in U.S. manu-
facturing: 1976–87.” Brookings Papers on Economic Activity, Microeconomics 1995: 67–112.
[7] Bernard, Andrew B. and J. Bradford Jensen. 1999. “Exceptional exporter performance: Cause,
effect, or both?” Journal of International Economics 47(1): 1–25.
13
[8] Bernard, Andrew B., J. Bradford Jensen, Stephen J. Redding, and Peter K. Schott. 2007. “Firms
in international trade.” Journal of Economic Perspectives 21(3): 105–130.
[9] Bernard, Andrew B., J. Bradford Jensen, and Peter K. Schott. 2009. “Importers, exporters, and
multinationals: A portrait of firms in the U.S. that trade goods.” In: T. Dunne, J.B. Jensen, and
M.J. Roberts (eds.), Producer Dynamics: New Evidence from Micro Data. University of Chicago
Press.
[10] Buchinsky, Moshe. 1998. “Recent advances in quantile regression models: A practical guideline
for empirical research.” Journal of Human Resources 33(1): 88–126.
[11] Cameron, A. Colin and Pravin K. Trivedi. 2009. Microeconometrics: Using Stata. STATA Press.
[12] Chen, Yongmin, Ignatius J. Horstmann, and James R. Markusen. 2008. “Physical capital, knowl-
edge capital and the choice between FDI and outsourcing.” NBER Working Paper 14515.
[13] Clerides, Sofronis K., Saul Lach, and James R. Tybout. 1998. “Is learning by exporting important?
Micro-dynamic evidence from Colombia, Mexico, and Morocco.” Quarterly Journal of Economics
113(3): 903–947.
[14] Cooley, Thomas F., Jeremy Greenwood, and Mehmet Yorukoglu. 1997. “The replacement prob-
lem.” Journal of Monetary Economics 40(3): 457–499.
[15] DaDalt, Peter J., Jeffrey R. Donaldson, and Jacqueline L. Garner. 2003. “Will any q do?” Journal
of Financial Research 26(4): 535–551.
[16] Dwyer, Douglas W. 2001. “Plant-level productivity and the market value of a firm.” Center for
Economic Research, U.S. Census Bureau. Working Paper 01–03.
[17] Fukuda, Shin-ichi, Ji Cong, Megumi Okui, and Ken-ichi Okuda. 1999. “Long-term loans and
investment in Japan: An empirical analysis based on the panel data of Japanese firms.” Discussion
Paper No. 1999–08. Japanese Institute for Posts and Telecommunications Policy. (in Japanese)
[18] Girma, Sourafel, Richard Kneller, and Mauro Pisu. 2005. “Exports versus FDI: An empirical
test.” Review of World Economics 144(2): 193–218.
[19] Goto, Akira and Kazuyuki Motohashi. 2007. “Development and innovation of a patent database.”
The Web Side of The Institute of Intellectual Property (IIP).
[20] Greenaway, David and Richard Kneller. 2007. “Firm heterogeneity, exporting and foreign direct
investment.” Economic Journal 117(517): F134–F161.
[21] Grossman, Sanford J. and Oliver D. Hart. 1986. “The costs and benefits of ownership: A theory
of vertical and lateral integration.” Journal of Political Economy 94(4): 691–719.
14
[22] Hao, Lingxin and Daniel Q. Naiman. 2007. Quantile Regression. SAGE Publications.
[23] Hall, Bronwyn H., Adam Jaffe, and Manuel Trajtenberg. 2005. “Market value and patent cita-
tions.” Rand Journal of Economics 36(1): 16–38.
[24] Hart, Oliver and John Moore. 1990. “Property rights and the nature of the firm.” Journal of
Political Economy 98(6): 1119–1158.
[25] Head, Keith and John Ries. 2003 “Heterogeneity and the FDI versus export decision of Japanese
manufacturers.” Journal of the Japanese and International Economies 17(4): 448–467.
[26] Helpman, Elhanan. 2006. “Trade, FDI, and the organization of firms.” Journal of Economic
Literature 44(3): 589–630.
[27] Helpman, Elhanan, Marc J. Melitz, and Stephen R. Yeaple. 2004. “Export versus FDI with
heterogeneous firms.” American Economic Review 94(1): 300–316.
[28] Hopenhayn, Hugo A. 1992. “Entry, exit, and firm dynamics in long run equilibrium.” Economet-
rica 60(5): 1127–1150.
[29] Horstmann, Ignatius J. and James R. Markusen. 1987. “Licensing versus direct investment: A
model of internalization by the multinational enterprise.” Canadian Journal of Economics 20(3):
464–481.
[30] Jovanovic, Boyan. 1982. “Selection and the evolution of industry.” Econometrica 50(3): 649–670.
[31] Kimura, Fukunari and Kozo Kiyota. 2006 “Exports, FDI, and productivity: Dynamic evidence
from Japanese firms.” Review of World Economics 142(2): 695–719.
[32] Koenker, Roger. 2005. Quantile Regression. Cambridge: Cambridge University Press.
[33] Koenker, Roger and Gilbert Bassett. 1978. “Regression quantiles.” Econometrica 46(1): 33–50.
[34] Koenker, Roger and Kevin F. Hallock. 2001. “Quantile regression.” Journal of Economic Per-
spectives 15(4): 143–156.
[35] Kosteas, Vasilios D. 2008. “Foreign direct investment and productivity spillovers: A quantile
analysis.” International Economic Journal 22(1): 25–41.
[36] Markusen, James R. 1984. “Multinationals, multi-plant economies, and the gains from trade.”
Journal of International Economics 16(3–4): 205–226.
[37] Markusen, James R. 2002. Multinational Firms and the Theory of International Trade. Cam-
bridge, M.A.: MIT Press.
15

[38] Markusen, James R. and Anthony J. Venables. 1998. “Multinational firms and the new trade
theory.” Journal of International Economics 46(2): 183–203.
[39] Markusen, James R. and Anthony J. Venables. 2000. “The theory of endowment, intra-industry
and multi-national trade.” Journal of International Economics 52(2): 209–234.
[40] Mayer, Thierry and Gianmarco I.P. Ottaviano. 2007. The Happy Few: The Internationalisation
of European Firms. Bruegel Blueprint Series.
[41] Melitz, Marc J. 2003. “The impact of trade on intra-industry reallocations and aggregate industry
productivity.” Econometrica 71(6): 1695–1725.
[42] Norback, Pehr-Johan. 2001. “Multinational firms, technology and location.” Journal of Interna-
tional Economics 54(2): 449–469.
[43] Palia, Darius and Frank Lichtenberg. 1999. “Managerial ownership and firm performance: A
re-examination using productivity measurement.” Journal of Corporate Finance 5(4): 323–339.
[44] Perfect, Steven B. and Kenneth W. Wiles. 1994. “Alternative construction of Tobin’s q: An
empirical comparison.” Journal of Empirical Finance 1(3–4): 313–341.
[45] Tomiura, Eiichi. 2007. “Foreign outsourcing, exporting, and FDI: A productivity comparison at
the firm level.” Journal of International Economics 72(1): 113–127.
[46] Trofimenko, Natalia. 2008. “Learning by exporting: Does it matter where one learns? Evidence
from Colombian manufacturing firms.” Economic Development and Cultural Change 56(4): 871–
894.
[47] Wagner, Joachim. 2006. “Export intensity and plant characteristics: What can we learn from
quantile regression?” Review of World Economics 142(1): 195–203
[48] Wagner, Joachim. 2007. “Exports and productivity: A survey of the evidence from firm-level
data.” World Economy 30(1): 60–82.
[49] Wakasugi, Ryuhei, Yasuyuki Todo, Hitoshi Sato, Shuichiro Nishioka, Toshiyuki Matsuura, Banri
Ito, and Ayumu Tanaka. 2008. “The internationalization of Japanese firms: New findings based
on firm-level data.” RIETI Discussion Paper Series 08–E–036. Research Institute of Economy,
Trade and Industry.
16
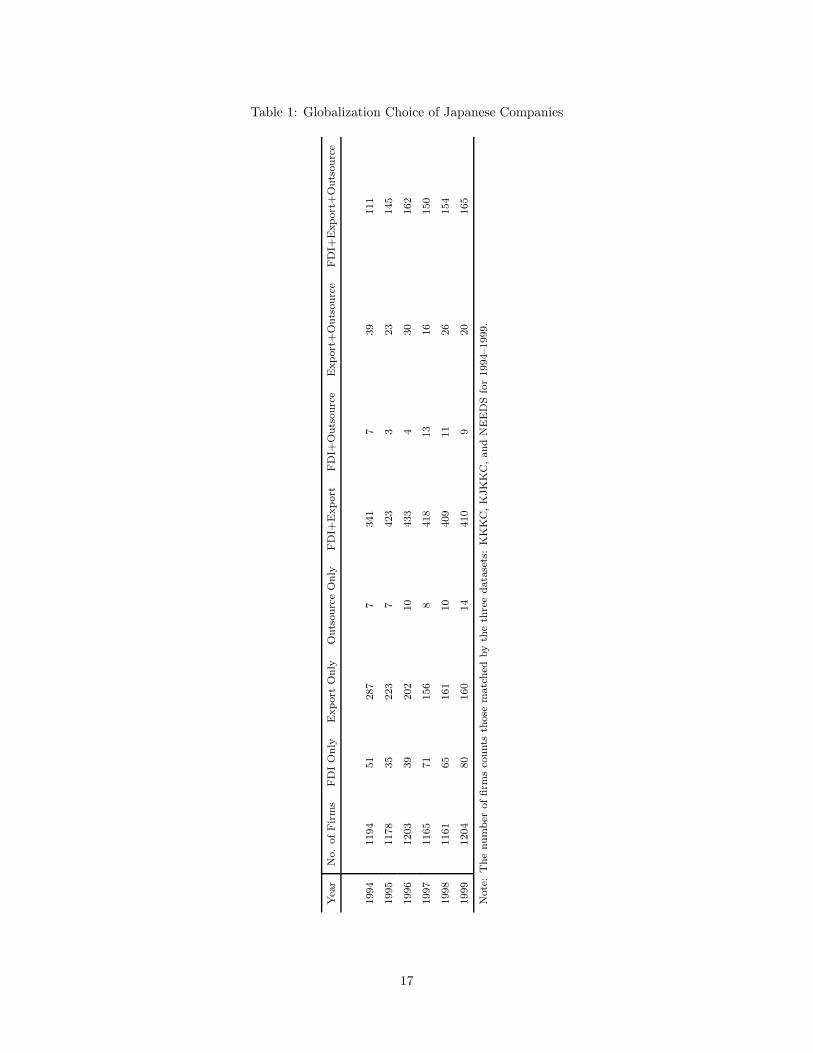
Table 1: Globalization Choice of Japanese Companies
Yea
rN
o.
ofFir
ms
FD
IO
nly
Export
Only
Outs
ourc
eO
nly
FD
I+E
xport
FD
I+O
uts
ourc
eE
xport
+O
uts
ourc
eFD
I+E
xport
+O
uts
ourc
e
1994
1194
51
287
7341
739
111
1995
1178
35
223
7423
323
145
1996
1203
39
202
10
433
430
162
1997
1165
71
156
8418
13
16
150
1998
1161
65
161
10
409
11
26
154
1999
1204
80
160
14
410
920
165
Note
:T
he
num
ber
offirm
sco
unts
those
matc
hed
by
the
thre
edata
sets
:K
KK
C,K
JK
KC
,and
NE
ED
Sfo
r1994–1999.
17
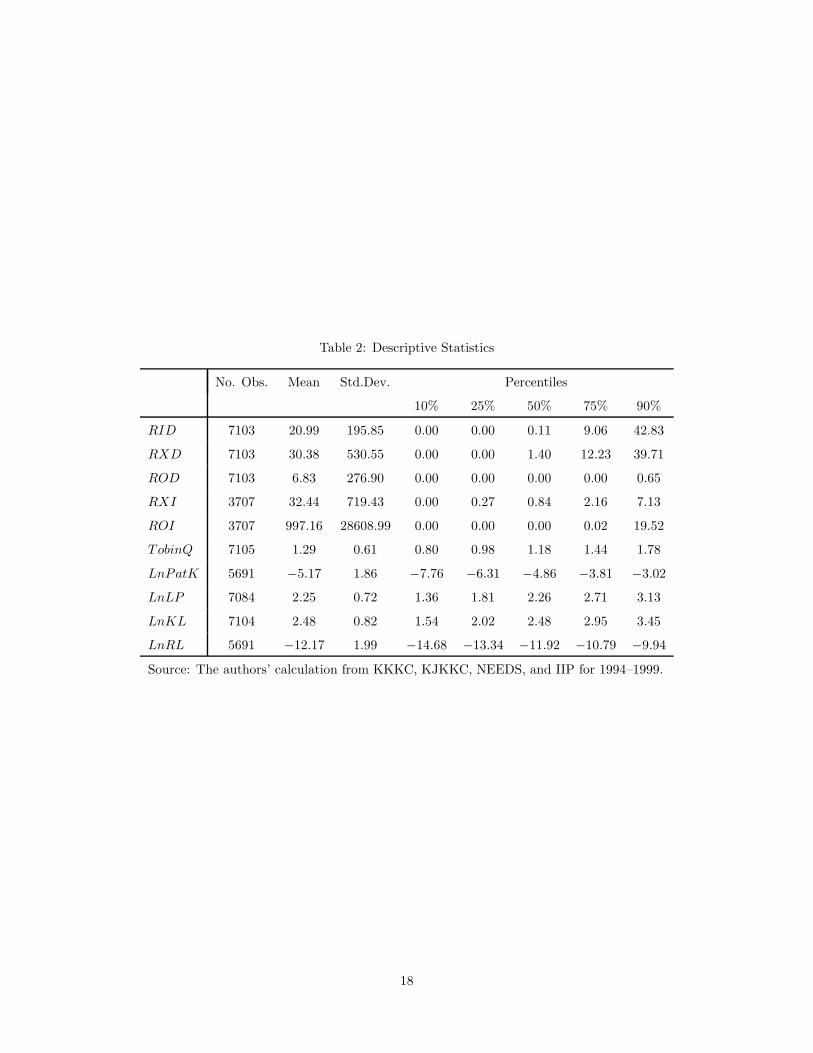
Table 2: Descriptive Statistics
No. Obs. Mean Std.Dev. Percentiles
10% 25% 50% 75% 90%
RID 7103 20.99 195.85 0.00 0.00 0.11 9.06 42.83
RXD 7103 30.38 530.55 0.00 0.00 1.40 12.23 39.71
ROD 7103 6.83 276.90 0.00 0.00 0.00 0.00 0.65
RXI 3707 32.44 719.43 0.00 0.27 0.84 2.16 7.13
ROI 3707 997.16 28608.99 0.00 0.00 0.00 0.02 19.52
TobinQ 7105 1.29 0.61 0.80 0.98 1.18 1.44 1.78
LnPatK 5691 −5.17 1.86 −7.76 −6.31 −4.86 −3.81 −3.02
LnLP 7084 2.25 0.72 1.36 1.81 2.26 2.71 3.13
LnKL 7104 2.48 0.82 1.54 2.02 2.48 2.95 3.45
LnRL 5691 −12.17 1.99 −14.68 −13.34 −11.92 −10.79 −9.94
Source: The authors’ calculation from KKKC, KJKKC, NEEDS, and IIP for 1994–1999.
18
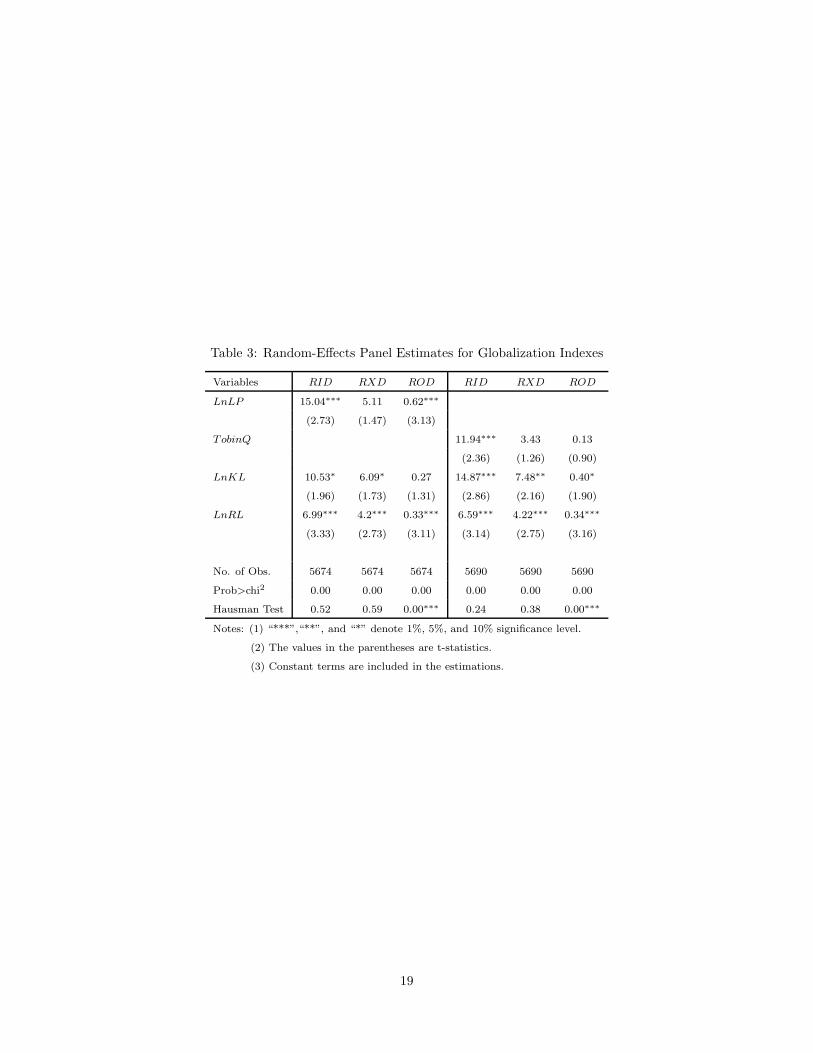
Table 3: Random-Effects Panel Estimates for Globalization Indexes
Variables RID RXD ROD RID RXD ROD
LnLP 15.04∗∗∗ 5.11 0.62∗∗∗
(2.73) (1.47) (3.13)
TobinQ 11.94∗∗∗ 3.43 0.13
(2.36) (1.26) (0.90)
LnKL 10.53∗ 6.09∗ 0.27 14.87∗∗∗ 7.48∗∗ 0.40∗
(1.96) (1.73) (1.31) (2.86) (2.16) (1.90)
LnRL 6.99∗∗∗ 4.2∗∗∗ 0.33∗∗∗ 6.59∗∗∗ 4.22∗∗∗ 0.34∗∗∗
(3.33) (2.73) (3.11) (3.14) (2.75) (3.16)
No. of Obs. 5674 5674 5674 5690 5690 5690
Prob>chi2 0.00 0.00 0.00 0.00 0.00 0.00
Hausman Test 0.52 0.59 0.00∗∗∗ 0.24 0.38 0.00∗∗∗
Notes: (1) “***”,“**”, and “*” denote 1%, 5%, and 10% significance level.
(2) The values in the parentheses are t-statistics.
(3) Constant terms are included in the estimations.
19

Table 4: Random-Effects Panel IV Estimates for Globalization Indexes
Variables RID RXD ROD RID RXD ROD
LnLP 22.15∗∗∗ 12.00∗ 1.14
(3.61) (1.94) (1.59)
TobinQ 9.22∗ 8.93∗ 0.05
(1.98) (1.77) (0.16)
LnKL 0.51 1.28 −0.06 5.83∗ 4.64 0.16
(0.16) (0.37) (−0.24) (1.96) (1.45) (0.68)
LnRL 4.59∗∗∗ 3.07∗∗ 0.23∗ 4.61∗∗∗ 3.04∗∗ 0.24∗
(3.42) (2.17) (1.91) (3.41) (2.16) (1.94)
No. of Obs. 4602 4602 4602 4625 4625 4625
Prob>chi2 0.00 0.00 0.00 0.00 0.00 0.00
Notes: (1) The first lags of dependent and independent variables are used
as instruments for LnLP .
(2) “***”,“**”, and “*” denote 1%, 5%, and 10% significance level.
(3) The values in the parentheses are t-statistics.
(4) Constant terms are included in the estimations.
20
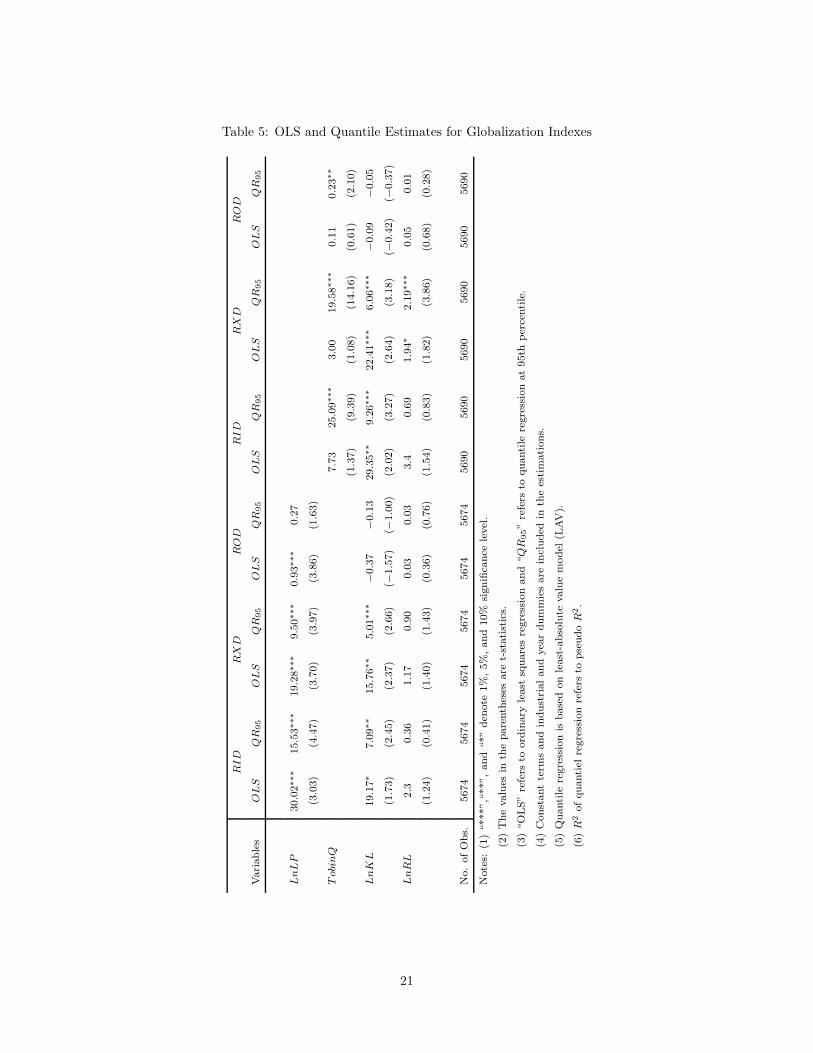
Table 5: OLS and Quantile Estimates for Globalization Indexes
RID
RX
DR
OD
RID
RX
DR
OD
Vari
able
sO
LS
QR
95
OL
SQ
R95
OL
SQ
R95
OL
SQ
R95
OL
SQ
R95
OL
SQ
R95
LnL
P30.0
2∗∗
∗15.5
3∗∗
∗19.2
8∗∗
∗9.5
0∗∗
∗0.9
3∗∗
∗0.2
7
(3.0
3)
(4.4
7)
(3.7
0)
(3.9
7)
(3.8
6)
(1.6
3)
Tobi
nQ
7.7
325.0
9∗∗
∗3.0
019.5
8∗∗
∗0.1
10.2
3∗∗
(1.3
7)
(9.3
9)
(1.0
8)
(14.1
6)
(0.6
1)
(2.1
0)
LnK
L19.1
7∗
7.0
9∗∗
15.7
6∗∗
5.0
1∗∗
∗−0
.37
−0.1
329.3
5∗∗
9.2
6∗∗
∗22.4
1∗∗
∗6.0
6∗∗
∗−0
.09
−0.0
5
(1.7
3)
(2.4
5)
(2.3
7)
(2.6
6)
(−1.5
7)
(−1.0
0)
(2.0
2)
(3.2
7)
(2.6
4)
(3.1
8)
(−0.4
2)
(−0.3
7)
LnR
L2.3
0.3
61.1
70.9
00.0
30.0
33.4
0.6
91.9
4∗
2.1
9∗∗
∗0.0
50.0
1
(1.2
4)
(0.4
1)
(1.4
0)
(1.4
3)
(0.3
6)
(0.7
6)
(1.5
4)
(0.8
3)
(1.8
2)
(3.8
6)
(0.6
8)
(0.2
8)
No.
ofO
bs.
5674
5674
5674
5674
5674
5674
5690
5690
5690
5690
5690
5690
Note
s:(1
)“***”,“
**”,and
“*”
den
ote
1%
,5%
,and
10%
signifi
cance
level
.
(2)
The
valu
esin
the
pare
nth
eses
are
t-st
ati
stic
s.
(3)
“O
LS”
refe
rsto
ord
inary
least
square
sre
gre
ssio
nand
“Q
R95”
refe
rsto
quanti
lere
gre
ssio
nat
95th
per
centi
le.
(4)
Const
ant
term
sand
indust
rialand
yea
rdum
mie
sare
incl
uded
inth
ees
tim
ati
ons.
(5)
Quanti
lere
gre
ssio
nis
base
don
least
-abso
lute
valu
em
odel
(LAV
).
(6)
R2
ofquanti
elre
gre
ssio
nre
fers
topse
udo
R2.
21

Table 6: OLS and Quantile Estimates of Productivity on Globalization Choices
RX
IR
OI
Vari
able
sO
LS
QR
25
QR
50
QR
75
OLS
QR
25
QR
50
QR
75
LnL
P0.8
7−0
.02
−0.1
5∗∗
∗−0
.31∗∗
∗500.5
0.2
50.1
5−1
.13
(0.2
0)
(−0.7
4)
(−3.7
1)
(−2.6
8)
(1.0
1)
(1.3
1)
(0.1
5)
(−0.4
5)
LnK
L−1
.61
0.0
7∗∗
∗0.1
3∗∗
∗0.4
6∗∗
∗−1
505.7
3−1
.55∗∗
∗−5
.24∗∗
∗−1
5.9
6∗∗
∗
(−1.0
1)
(3.7
7)
(3.3
1)
(3.7
8)
(−1.5
0)
(−5.9
0)
(−3.9
3)
(−4.5
4)
LnR
L1.3
40.0
4∗∗
∗0.1
0∗∗
∗0.3
2∗∗
∗−8
1.1
40.5
6∗∗
∗3.3
2∗∗
∗4.0
5∗∗
∗
(1.1
8)
(4.5
9)
(6.2
8)
(6.8
0)
(−0.2
7)
(4.6
7)
(5.7
7)
(2.6
4)
No.
ofO
bs.
3034
3034
3034
3034
868
868
868
868
R2
0.0
09
0.0
09
0.0
08
0.0
17
0.0
13
0.0
02
0.0
03
0.0
07
Note
s:(1
)“***”,“
**”,and
“*”
den
ote
1%
,5%
,and
10%
signifi
cance
level
.
(2)
The
valu
esin
the
pare
nth
eses
are
t-st
ati
stic
s.
(3)
“O
LS”
refe
rsto
ord
inary
least
square
sre
gre
ssio
nand
“Q
RX
”re
fers
toquanti
lere
gre
ssio
n
at
Xth
per
centi
le.
(4)
Const
ant
term
sand
indust
rialand
yea
rdum
mie
sare
incl
uded
inth
ees
tim
ati
ons.
(5)
Quanti
lere
gre
ssio
nis
base
don
least
-abso
lute
valu
em
odel
(LAV
).
(6)
R2
ofquanti
elre
gre
ssio
nre
fers
topse
udo
R2.
22

Table 7: OLS and Quantile Estimates of Tobin’s q on Globalization Choices
RX
IR
OI
Vari
able
sO
LS
QR
25
QR
50
QR
75
OLS
QR
25
QR
50
QR
75
Tobi
nQ
2.6
40.0
1−0
.01
0.0
0−9
78.3
5−0
.40∗∗
−1.4
7−5
.99∗∗
(1.4
0)
(0.7
3)
(−0.2
2)
(−0.0
5)
(−1.5
2)
(−2.2
1)
(−1.5
7)
(−2.0
0)
LnK
L−1
.10.0
6∗∗
∗0.0
50.3
0∗∗
∗−1
147.3
9−1
.40∗∗
∗−5
.57∗∗
∗−1
6.0
7∗∗
∗
(−0.5
2)
(3.2
6)
(1.3
0)
(2.6
6)
(−1.2
8)
(−5.4
1)
(−4.7
5)
(−4.7
0)
LnR
L1.3
80.0
4∗∗
∗0.0
9∗∗
∗0.2
9∗∗
∗−4
4.4
50.4
4∗∗
∗3.0
8∗∗
∗3.7
1∗∗
(1.1
0)
(4.5
6)
(4.9
6)
(5.9
8)
(−0.1
5)
(3.4
8)
(5.7
6)
(2.3
5)
No.
ofO
bs.
3042
3042
3042
3042
871
871
871
871
R2
0.0
09
0.0
09
0.0
08
0.0
17
0.0
13
0.0
02
0.0
03
0.0
07
Note
s:(1
)“***”,“
**”,and
“*”
den
ote
1%
,5%
,and
10%
signifi
cance
level
.
(2)
The
valu
esin
the
pare
nth
eses
are
t-st
ati
stic
s.
(3)
“O
LS”
refe
rsto
ord
inary
least
square
sre
gre
ssio
nand
“Q
RX
”re
fers
toquanti
lere
gre
ssio
n
at
Xth
per
centi
le.
(4)
Const
ant
term
sand
indust
rialand
yea
rdum
mie
sare
incl
uded
inth
ees
tim
ati
ons.
(5)
Quanti
lere
gre
ssio
nis
base
don
least
-abso
lute
valu
em
odel
(LAV
).
(6)
R2
ofquanti
lere
gre
ssio
nre
fers
topse
udo
R2.
23

Table 8: OLS and Quantile Estimates of Stock of Patents on Globalization Choices
RX
IR
OI
Vari
able
sO
LS
QR
25
QR
50
QR
75
OLS
QR
25
QR
50
QR
75
LnP
atK
−1.0
5−0
.04∗∗
∗−0
.20∗∗
∗−0
.40∗∗
∗−2
307.3
3∗∗
∗−1
.81∗∗
∗−4
.43∗∗
∗−1
6.8
7∗∗
∗
(−0.3
5)
(−3.7
6)
(−11.6
0)
(−6.2
8)
(−2.0
7)
(−10.3
5)
(−10.9
2)
(−13.1
5)
LnK
L−0
.96
0.0
6∗∗
∗0.0
6∗∗
0.3
6∗∗
∗−1
196.1
5−1
.80∗∗
∗−5
.79∗∗
∗−2
6.9
0∗∗
∗
(−0.4
6)
(3.7
8)
(2.3
8)
(3.5
8)
(−1.3
2)
(−5.5
0)
(−7.9
8)
(−12.8
4)
LnR
L2.0
10.0
6∗∗
∗0.1
9∗∗
∗0.5
0∗∗
∗904.5
8∗∗
0.9
2∗∗
∗4.5
1∗∗
∗6.3
4∗∗
∗
(1.4
7)
(6.5
0)
(11.8
6)
(8.6
9)
(2.2
5)
(5.4
3)
(12.0
7)
(5.3
5)
No.
ofO
bs.
3042
3042
3042
3042
871
871
871
871
R2
0.0
25
0.0
02
0.0
04
0.0
07
0.0
09
0.0
09
0.0
09
0.0
18
Note
s:(1
)“***”,“
**”,and
“*”
den
ote
1%
,5%
,and
10%
signifi
cance
level
.
(2)
The
valu
esin
the
pare
nth
eses
are
t-st
ati
stic
s.
(3)
“O
LS”
refe
rsto
ord
inary
least
square
sre
gre
ssio
nand
“Q
RX
”re
fers
toquanti
lere
gre
ssio
n
at
Xth
per
centi
le.
(4)
Const
ant
term
sand
indust
rialand
yea
rdum
mie
sare
incl
uded
inth
ees
tim
ati
ons.
(5)
Quanti
lere
gre
ssio
nis
base
don
least
-abso
lute
valu
em
odel
(LAV
).
(6)
R2
ofquanti
lere
gre
ssio
nre
fers
topse
udo
R2.
24
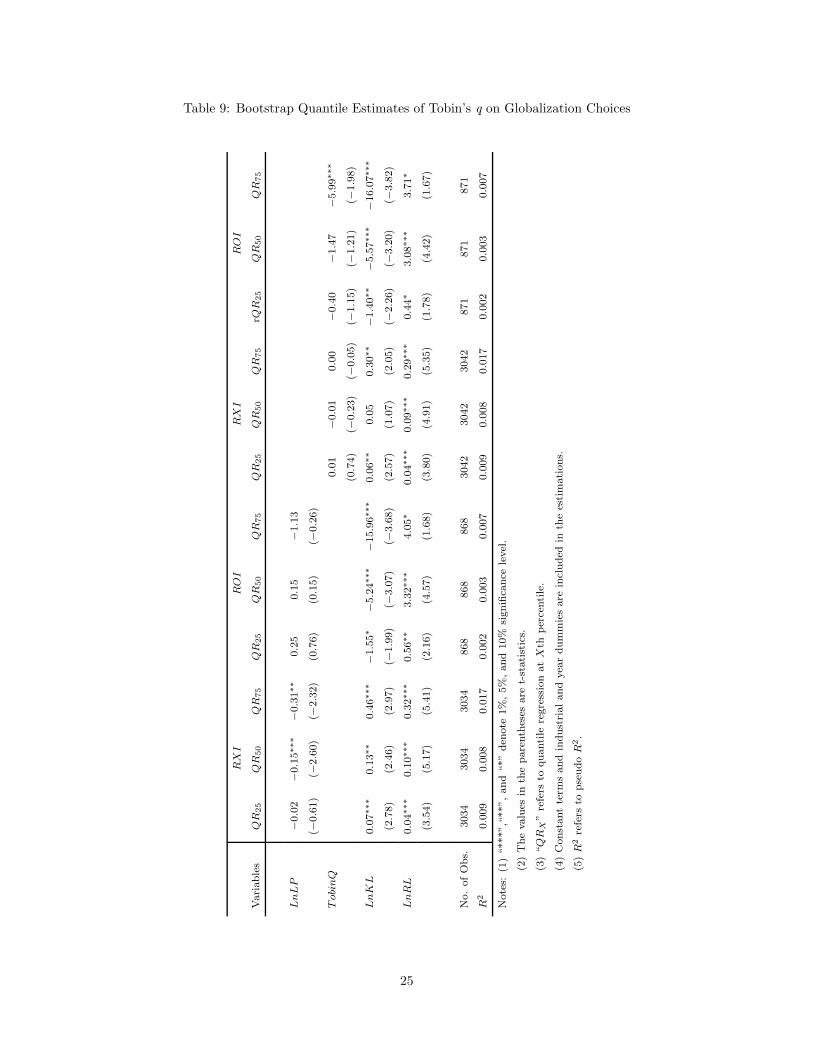
Table 9: Bootstrap Quantile Estimates of Tobin’s q on Globalization Choices
RX
IR
OI
RX
IR
OI
Vari
able
sQ
R25
QR
50
QR
75
QR
25
QR
50
QR
75
QR
25
QR
50
QR
75
rQR
25
QR
50
QR
75
LnL
P−0
.02
−0.1
5∗∗
∗−0
.31∗∗
0.2
50.1
5−1
.13
(−0.6
1)
(−2.6
0)
(−2.3
2)
(0.7
6)
(0.1
5)
(−0.2
6)
Tobi
nQ
0.0
1−0
.01
0.0
0−0
.40
−1.4
7−5
.99∗∗
∗
(0.7
4)
(−0.2
3)
(−0.0
5)
(−1.1
5)
(−1.2
1)
(−1.9
8)
LnK
L0.0
7∗∗
∗0.1
3∗∗
0.4
6∗∗
∗−1
.55∗
−5.2
4∗∗
∗−1
5.9
6∗∗
∗0.0
6∗∗
0.0
50.3
0∗∗
−1.4
0∗∗
−5.5
7∗∗
∗−1
6.0
7∗∗
∗
(2.7
8)
(2.4
6)
(2.9
7)
(−1.9
9)
(−3.0
7)
(−3.6
8)
(2.5
7)
(1.0
7)
(2.0
5)
(−2.2
6)
(−3.2
0)
(−3.8
2)
LnR
L0.0
4∗∗
∗0.1
0∗∗
∗0.3
2∗∗
∗0.5
6∗∗
3.3
2∗∗
∗4.0
5∗
0.0
4∗∗
∗0.0
9∗∗
∗0.2
9∗∗
∗0.4
4∗
3.0
8∗∗
∗3.7
1∗
(3.5
4)
(5.1
7)
(5.4
1)
(2.1
6)
(4.5
7)
(1.6
8)
(3.8
0)
(4.9
1)
(5.3
5)
(1.7
8)
(4.4
2)
(1.6
7)
No.
ofO
bs.
3034
3034
3034
868
868
868
3042
3042
3042
871
871
871
R2
0.0
09
0.0
08
0.0
17
0.0
02
0.0
03
0.0
07
0.0
09
0.0
08
0.0
17
0.0
02
0.0
03
0.0
07
Note
s:(1
)“***”,“
**”,and
“*”
den
ote
1%
,5%
,and
10%
signifi
cance
level
.
(2)
The
valu
esin
the
pare
nth
eses
are
t-st
ati
stic
s.
(3)
“Q
RX
”re
fers
toquanti
lere
gre
ssio
nat
Xth
per
centi
le.
(4)
Const
ant
term
sand
indust
rialand
yea
rdum
mie
sare
incl
uded
inth
ees
tim
ati
ons.
(5)
R2
refe
rsto
pse
udo
R2.
25
Table 10: Correlations of Variables
LnLP TobinQ LnPatK LnKL LnRL RID RXD ROD RXI ROI
LnLP 1.00
TobinQ 0.18 1.00
LnPatK −0.17 0.15 1.00
LnKL 0.35 −0.03 −0.26 1.00
LnRL −0.21 0.06 0.80 −0.32 1.00
RID 0.06 0.04 0.05 0.05 0.05 1.00
RXD 0.07 0.05 0.05 0.06 0.05 0.87 1.00
ROD −0.01 0.02 0.09 −0.08 0.09 0.09 0.10 1.00
RXI −0.02 0.01 0.01 −0.02 0.01 −0.01 0.01 0.00 1.00
ROI 0.00 −0.01 0.00 −0.02 0.02 −0.01 −0.01 0.04 0.09 1.00
26