Embed Size (px)
Citation preview

Smart choices for Chelsea:
Walking, cycling, and
taking the bus
Can we make them easy choices?

What is active transportation (AT)?
ACTIVE TRANSPORTATION: the utilitarian use of walking, cycling, all other forms of non-motorized transportation, and public transit (physical activity benefits)
Why is the promotion of AT important?
• Health
• Environment
• Social concerns
• Economy

Health benefit #1: Physical activity
• Physical inactivity is an extremely important risk factor for chronic diseases (heart disease, stroke, diabetes, cancer) which, as a category, are responsible for 63% of deaths worldwide.
• Physical inactivity is considered the world’s 4th most important health risk factor by the World Health Organization.
• Only 15 per cent of Canadian adults get recommended level of physical activity
• Only 7 per cent of Canadian children get recommended levels of physical activity

Health Benefit #1: Physical Activity
ACTIVE TRANSPORTATION WORKS! Examples:
• Study: People who live in car-dependent neighbourhoods in Ontario 70 per cent more likely to be obese than people who live in most walkable ones.
• UK Study: Those who commute by any means other than driving have lower body fat % and BMI than those who commute by car. People who biked to work were about 10lbs less heavy than people who drove.

Active transportation vs. obesity
The experts agree…..
• Organizations that support AT based on physical activity-related health benefits include:• The World Health Organization
• The International Society for Physical Activity and Health
• The Heart and Stroke Foundation of Canada
• The Public Health Agency of Canada
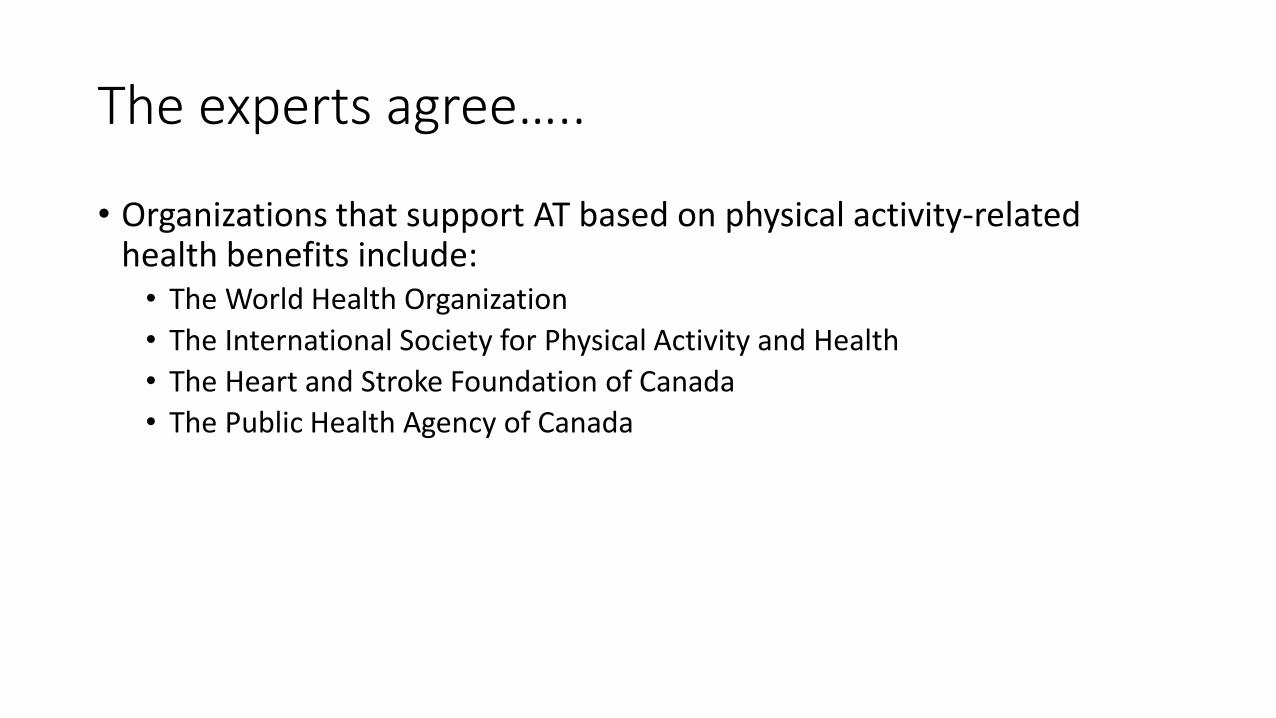
My own experiment

Weight vs. pulla consumption in high AT scenario
-20
0
20
40
60
80
100
120
140
160
July August September October November December
Wei
ght/
Pu
llaco
nsu
mp
tio
n
Making physical activity part of daily life
• AT supported because of potential to make physical activity a routine part of daily life
• No discipline or lecturing required
• IF it is the most obvious, convenient, pleasant, appealing, cheapest choice.
Health benefit # 2: Safety
• In Canada each year, about 345 pedestrians and 50 cyclists are killed in traffic accidents.
• The total number of people killed in road fatalities (all kinds) is over 2000. Total injuries are over 10 000.
• 2/3 of road fatalities 30 % of crashes Canada happen on rural roads
• 27% of fatalities and 19% of injuries involve speeding.
• If Canada were to improve road safety to the level of Sweden, more than 1000 lives would be saved EACH YEAR.
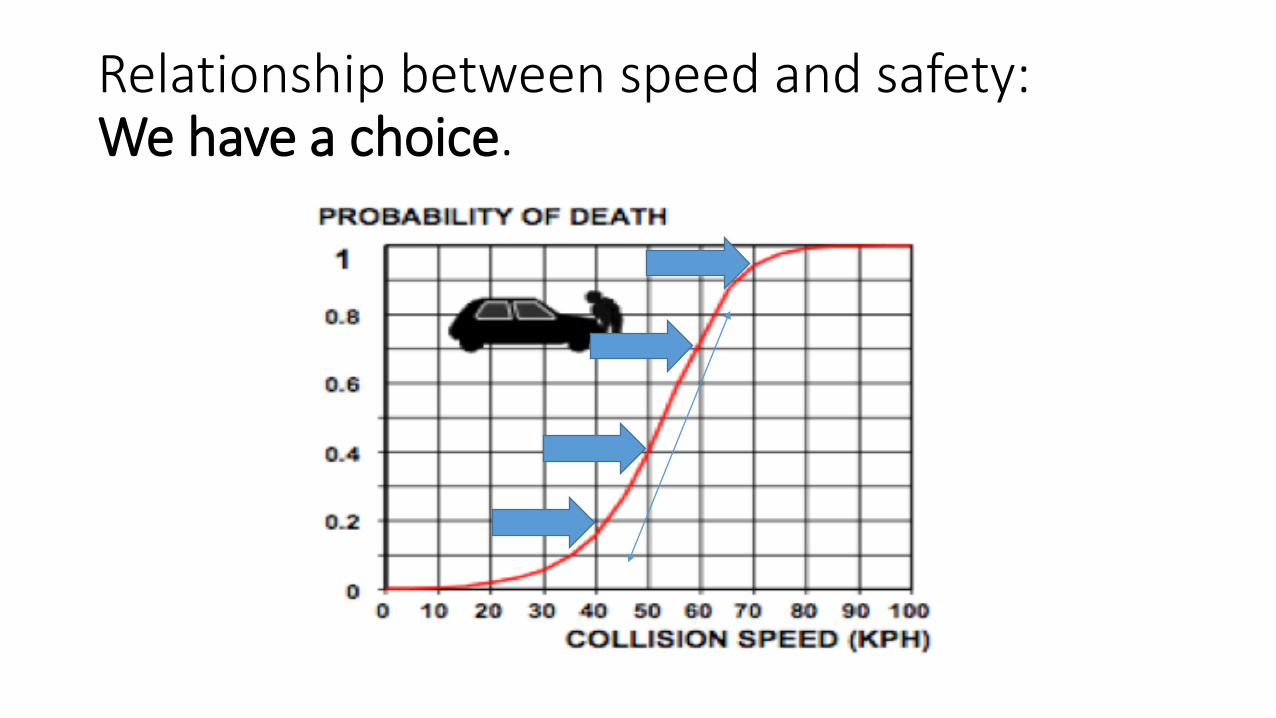
Relationship between speed and safety:We have a choice.

Health benefit #3: Air pollution
• Breathing polluted air is responsible for 21 000 premature deaths in Canada per year.

Environmental benefit # 1: Greenhouse gas emissions• The transport sector accounts for roughly 23 % (and growing) of total
greenhouse gas emissions.
• Within transport sector, private vehicles are the 2nd largest source of greenhouse gas emissions (after road freight).
• Increases in active transportation lead to decreases in private vehicle use.
• Norway (population 5 million), recently committed to investing $1 billion in cycling infrastructure over the next 15 years in order to help it reach transport emissions targets.
Social benefits
• More human interaction
• More equitable distribution of space
• Increased mobility for non car drivers
• Improved access to healthy food, recreational opportunities and other resources
• More livable, fun public spaces!
Economic benefits
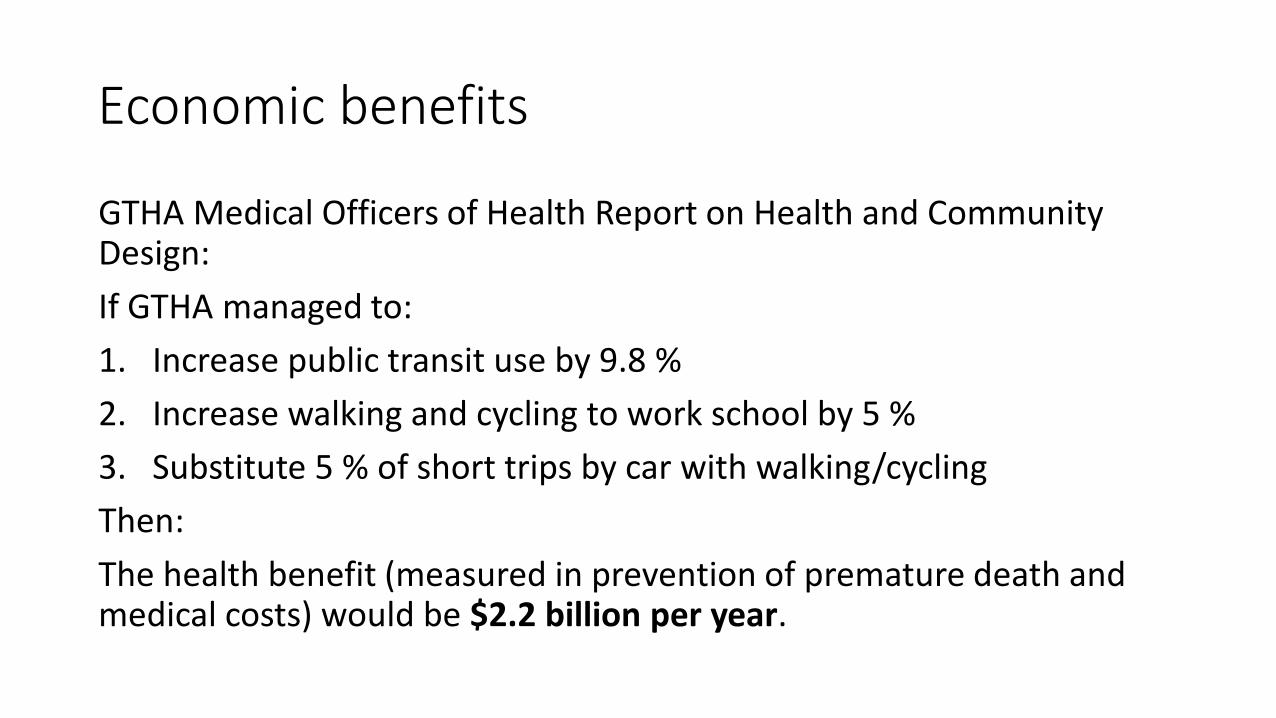
GTHA Medical Officers of Health Report on Health and Community Design:
If GTHA managed to:
1. Increase public transit use by 9.8 %
2. Increase walking and cycling to work school by 5 %
3. Substitute 5 % of short trips by car with walking/cycling
Then:
The health benefit (measured in prevention of premature death and medical costs) would be $2.2 billion per year.
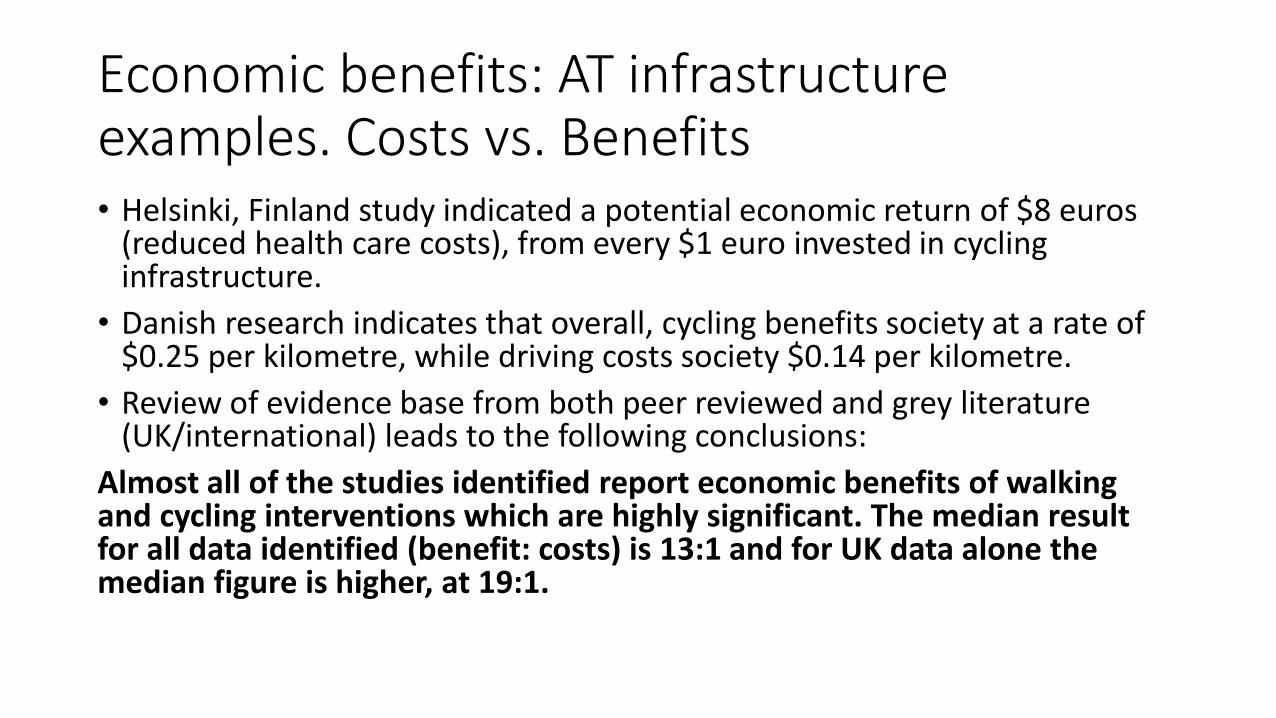
Economic benefits: AT infrastructure examples. Costs vs. Benefits• Helsinki, Finland study indicated a potential economic return of $8 euros
(reduced health care costs), from every $1 euro invested in cycling infrastructure.
• Danish research indicates that overall, cycling benefits society at a rate of $0.25 per kilometre, while driving costs society $0.14 per kilometre.
• Review of evidence base from both peer reviewed and grey literature (UK/international) leads to the following conclusions:
Almost all of the studies identified report economic benefits of walking and cycling interventions which are highly significant. The median result for all data identified (benefit: costs) is 13:1 and for UK data alone the median figure is higher, at 19:1.
Economic benefits
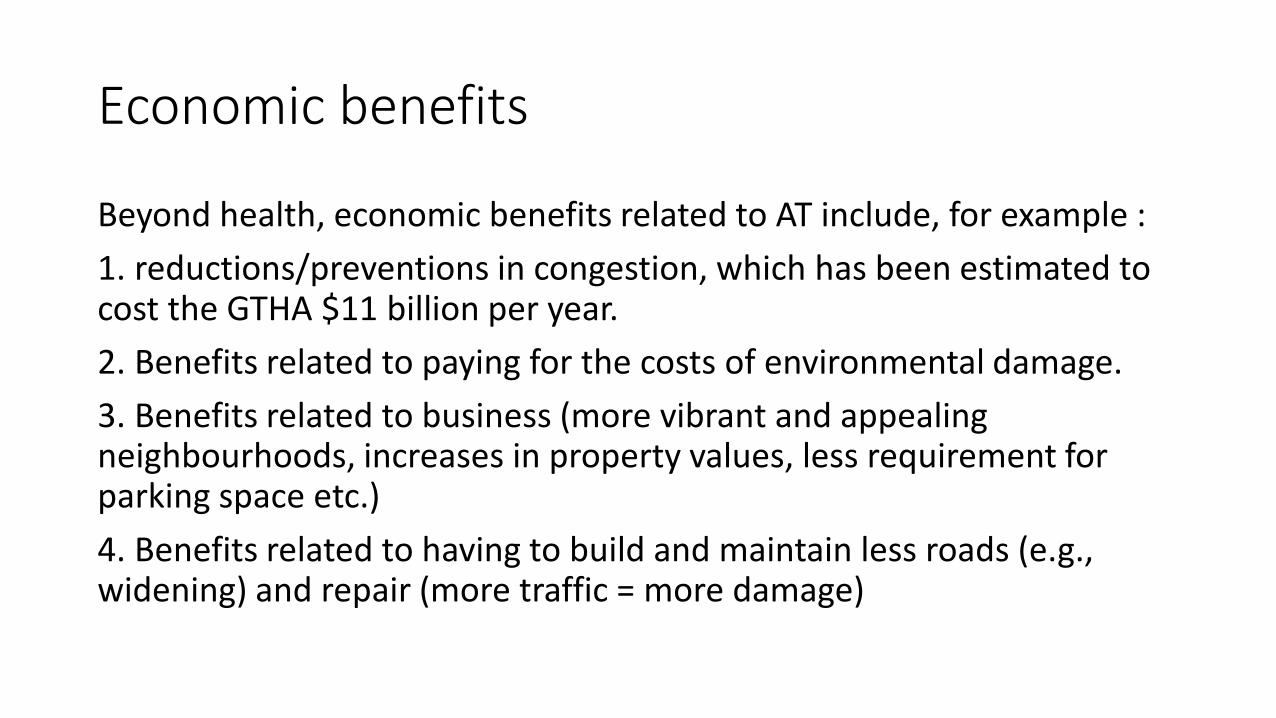
Beyond health, economic benefits related to AT include, for example :
1. reductions/preventions in congestion, which has been estimated to cost the GTHA $11 billion per year.
2. Benefits related to paying for the costs of environmental damage.
3. Benefits related to business (more vibrant and appealing neighbourhoods, increases in property values, less requirement for parking space etc.)
4. Benefits related to having to build and maintain less roads (e.g., widening) and repair (more traffic = more damage)
Economic benefits
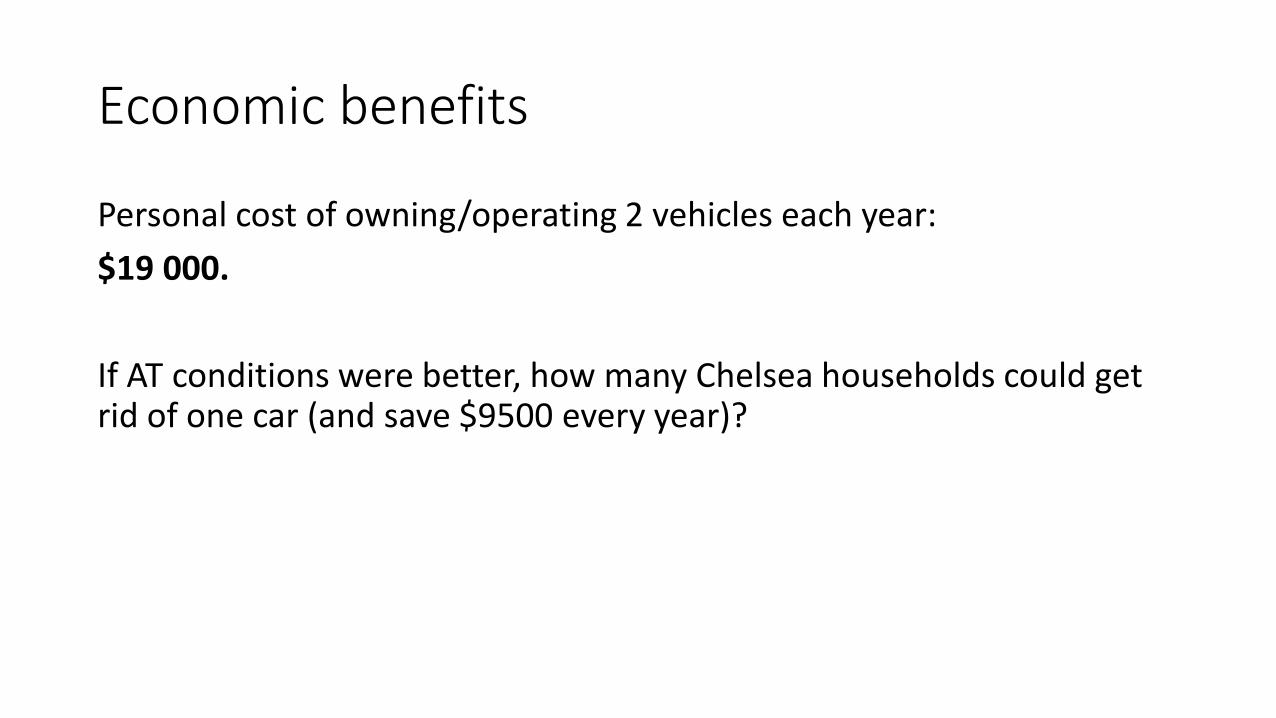
Personal cost of owning/operating 2 vehicles each year:
$19 000.
If AT conditions were better, how many Chelsea households could get rid of one car (and save $9500 every year)?
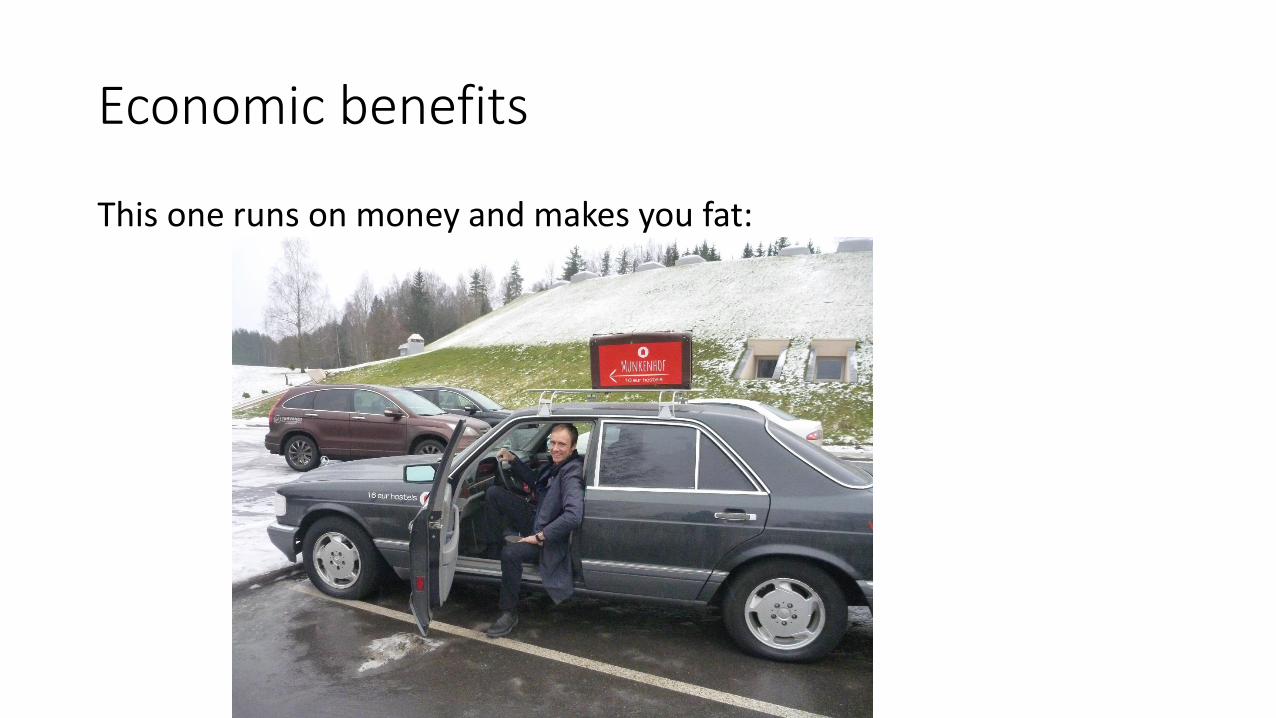
Economic benefits
This one runs on money and makes you fat:
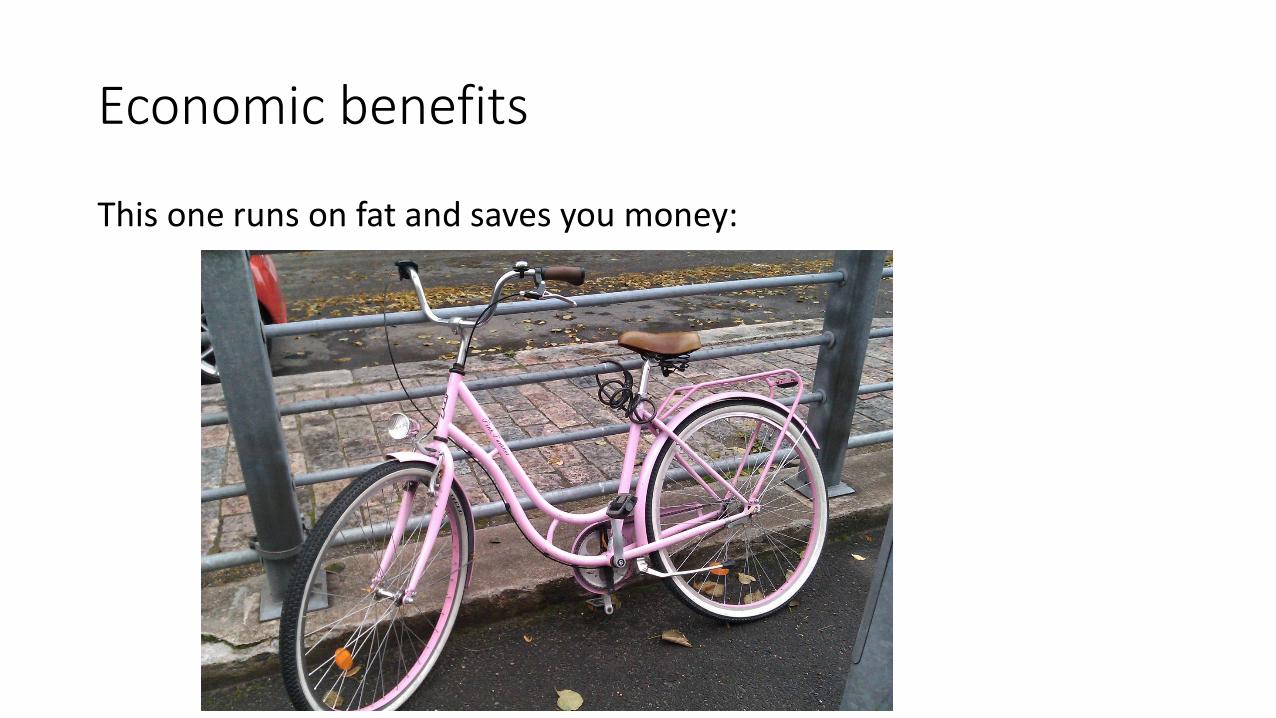
Economic benefits
This one runs on fat and saves you money:
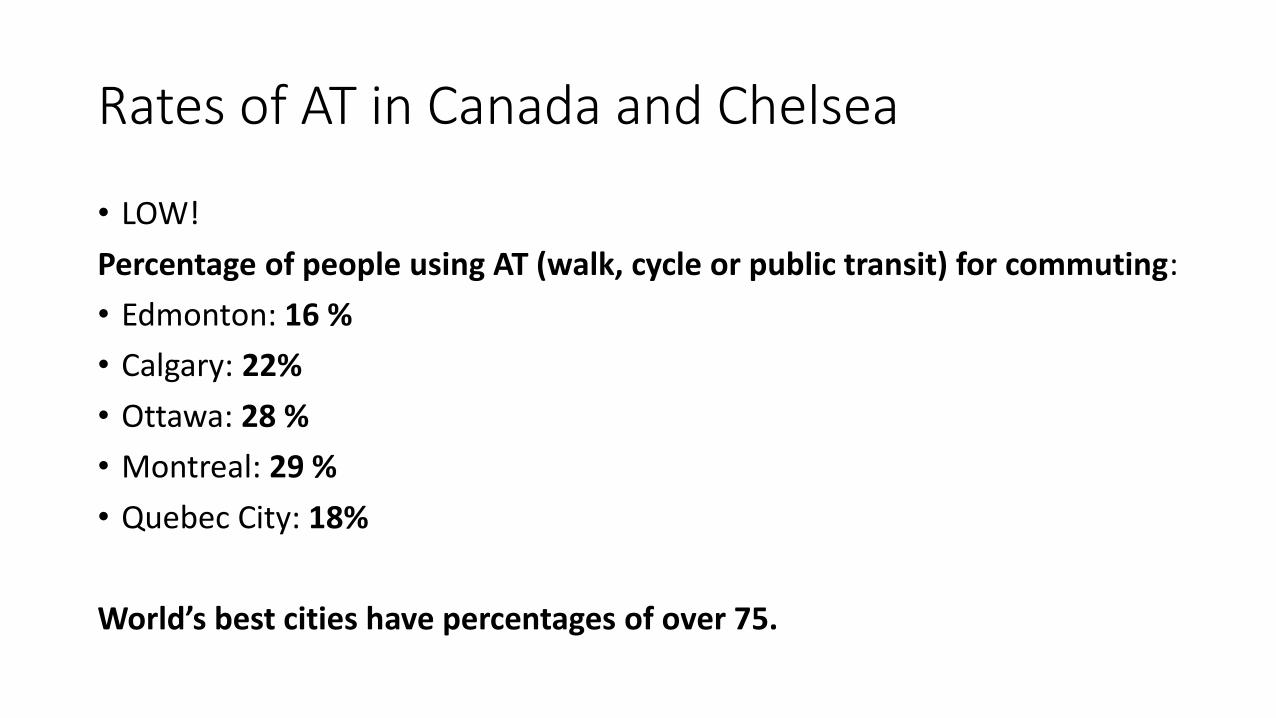
Rates of AT in Canada and Chelsea
• LOW!
Percentage of people using AT (walk, cycle or public transit) for commuting:
• Edmonton: 16 %
• Calgary: 22%
• Ottawa: 28 %
• Montreal: 29 %
• Quebec City: 18%
World’s best cities have percentages of over 75.
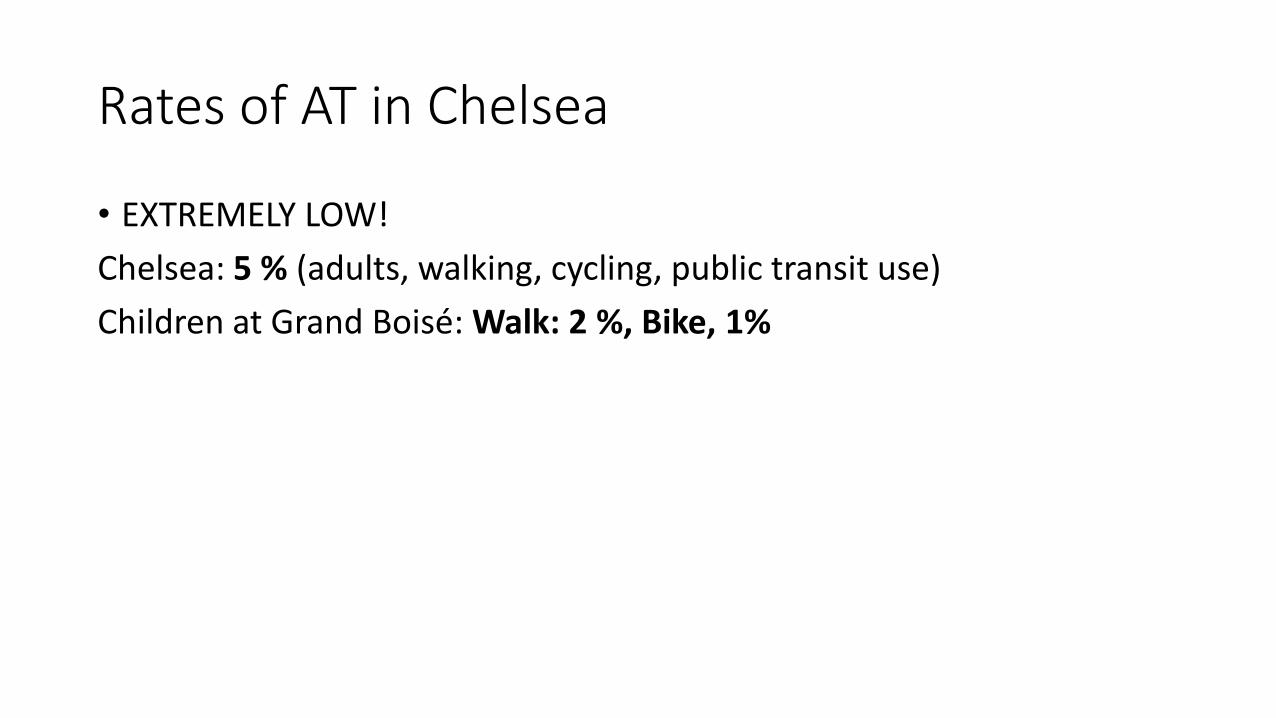
Rates of AT in Chelsea
• EXTREMELY LOW!
Chelsea: 5 % (adults, walking, cycling, public transit use)
Children at Grand Boisé: Walk: 2 %, Bike, 1%
So what does this mean?
1. Ultimately, the goal is to actually increase the number of people who walk, bike, and take public transit in Chelsea for practical purposes.
2. Promotion of AT represents a very important and considerable opportunity to improve quality of life, health, the environment in Chelsea.
3. Infrastructure for AT is an intelligent investment.
4. We have a lot of room to improve!

So what does this mean?
“These kinds of changes are not just green, granola, nice things to have. They’re actually vital economic development strategies.”
Janette Sadik-Khan, New York City’s Transportation Commissioner 2007-2013.
What does this all imply:
“In an era of increasing scrutiny over public spending there will be added pressure to achieve exceptional value for money.
Within transport, investment in walking and cycling are likely to provide low cost, high-value options for many local communities.”
-Government Office of the South West, UK Department of Health. “Value for Money. An Economic Assessment of Investment in Walking and Cycling”.

Active transportation progress in Chelsea
• Transcollines (13 routes, 53 runs, 163 000 trips per year)
• Walking/cycling infrastructure village
• Active Transportation Master Plan
• Mine/Notch/Kingsmere AT project
• Winter Community Trail/Community Trail
• Trails projects
• Gatineau Park sustainable transportation planning

Challenges for Chelsea
Walkscore (walkscore.com) for 4 Chemin Dunn:
“4 Chemin Dunn has a Walk Score of 20 out of 100. This location is a Car-Dependent neighborhood so almost all errands require a car.”
Challenges for Chelsea
1. Long distances between amenities (sprawl)
2. Lack of direct routes (cul de sacs and dead ends instead of grid-pattern)
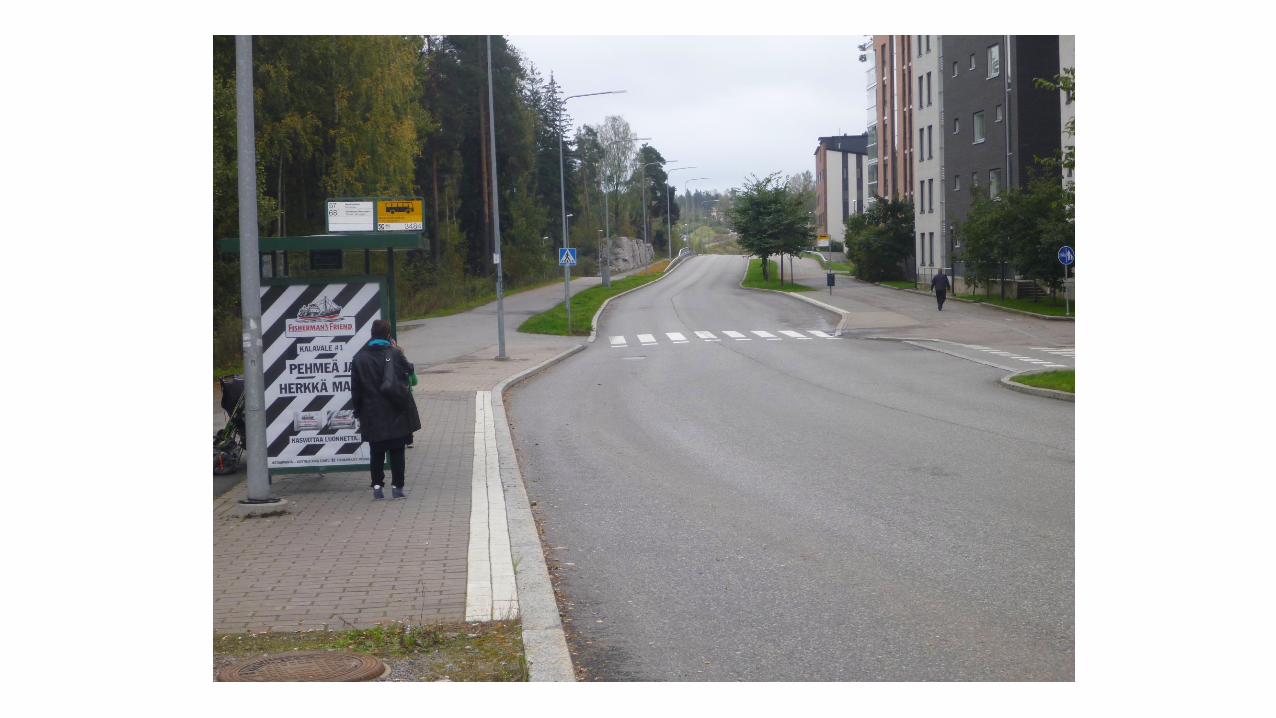
3. Generally poor conditions for walking/cycling on main routes (roads)
4. High traffic volumes/speed/heavy vehicles
5. Transit: Limited service (but improving quickly thanks to Transcollines)
6. Bedroom community (we live here, but we don’t work here, so we drive)
7. Driving is a habit.
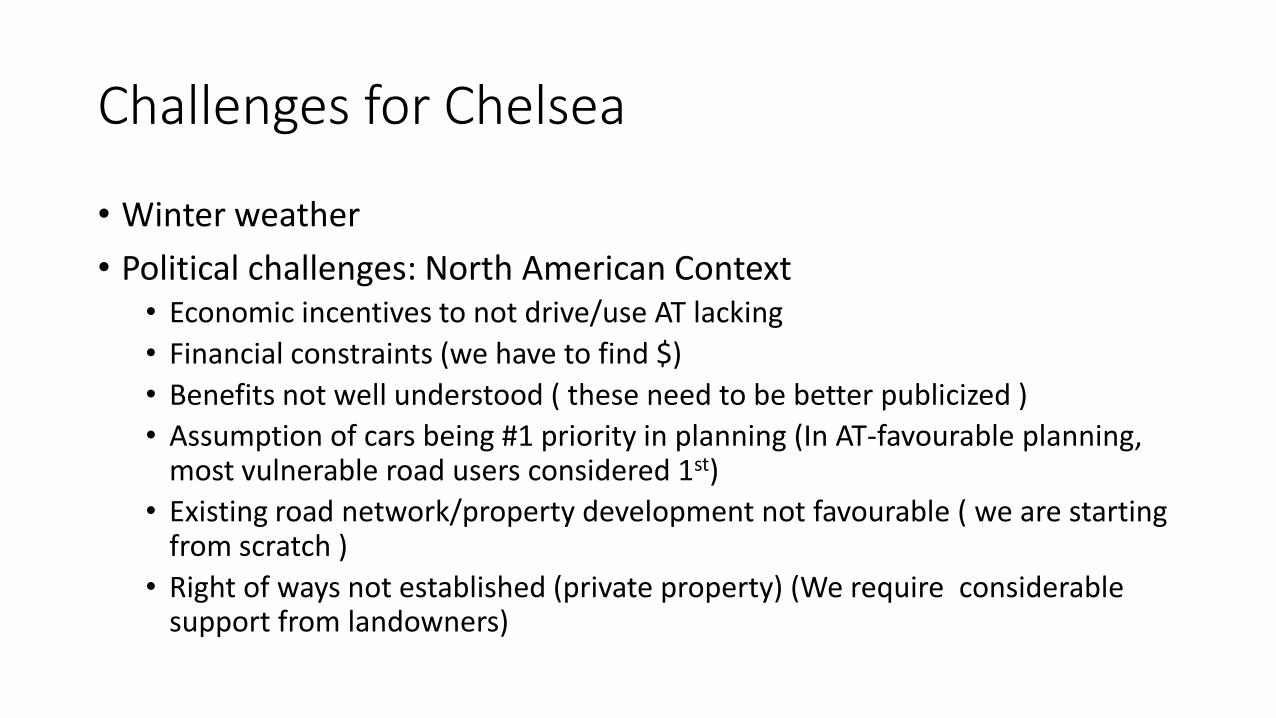
Challenges for Chelsea
• Winter weather
• Political challenges: North American Context• Economic incentives to not drive/use AT lacking
• Financial constraints (we have to find $)
• Benefits not well understood ( these need to be better publicized )
• Assumption of cars being #1 priority in planning (In AT-favourable planning, most vulnerable road users considered 1st)
• Existing road network/property development not favourable ( we are starting from scratch )
• Right of ways not established (private property) (We require considerable support from landowners)


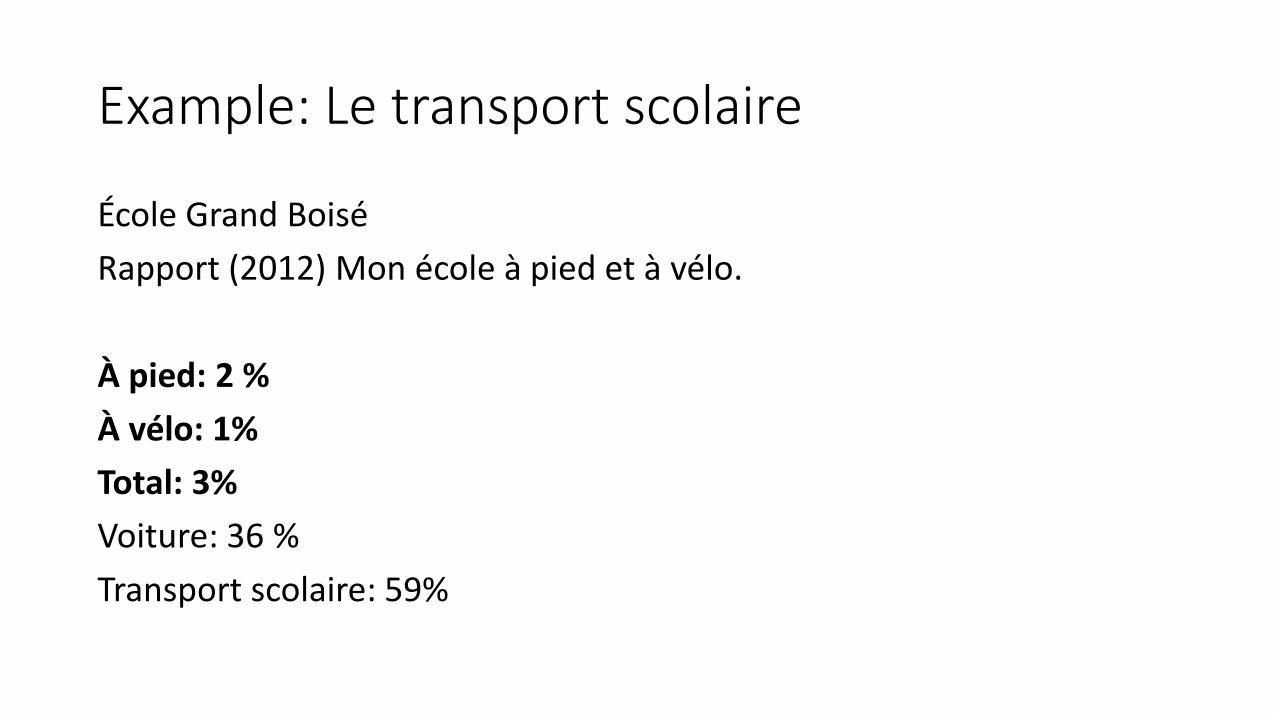
Example: Le transport scolaire
École Grand Boisé
Rapport (2012) Mon école à pied et à vélo.
À pied: 2 %
À vélo: 1%
Total: 3%
Voiture: 36 %
Transport scolaire: 59%
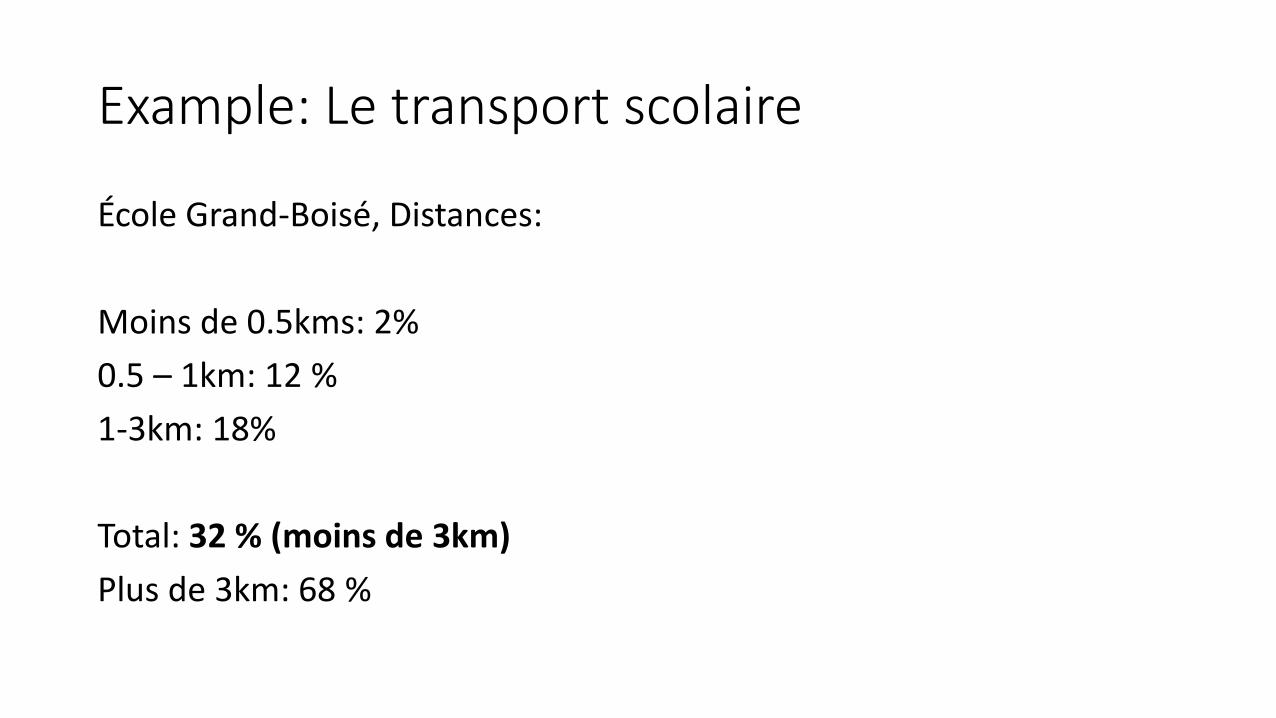
Example: Le transport scolaire
École Grand-Boisé, Distances:
Moins de 0.5kms: 2%
0.5 – 1km: 12 %
1-3km: 18%
Total: 32 % (moins de 3km)
Plus de 3km: 68 %
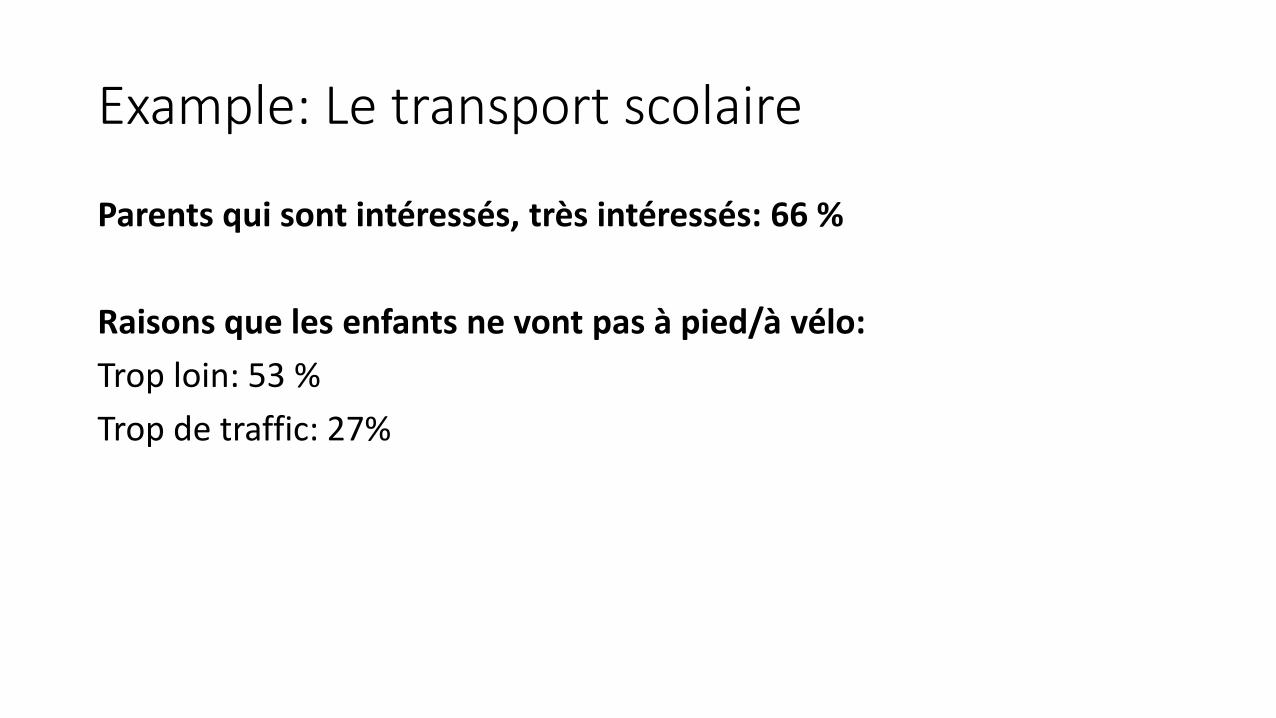
Example: Le transport scolaire
Parents qui sont intéressés, très intéressés: 66 %
Raisons que les enfants ne vont pas à pied/à vélo:
Trop loin: 53 %
Trop de traffic: 27%
Example: Le transport scolaire
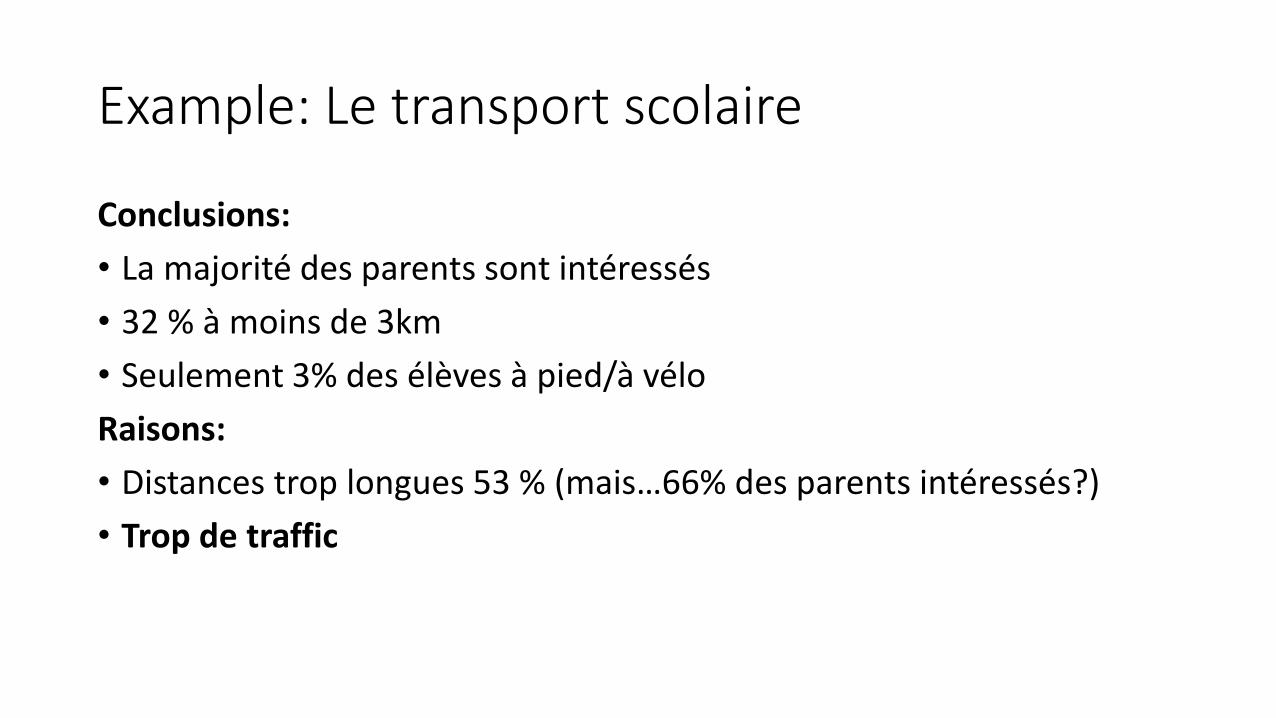
Conclusions:
• La majorité des parents sont intéressés
• 32 % à moins de 3km
• Seulement 3% des élèves à pied/à vélo
Raisons:
• Distances trop longues 53 % (mais…66% des parents intéressés?)
• Trop de traffic
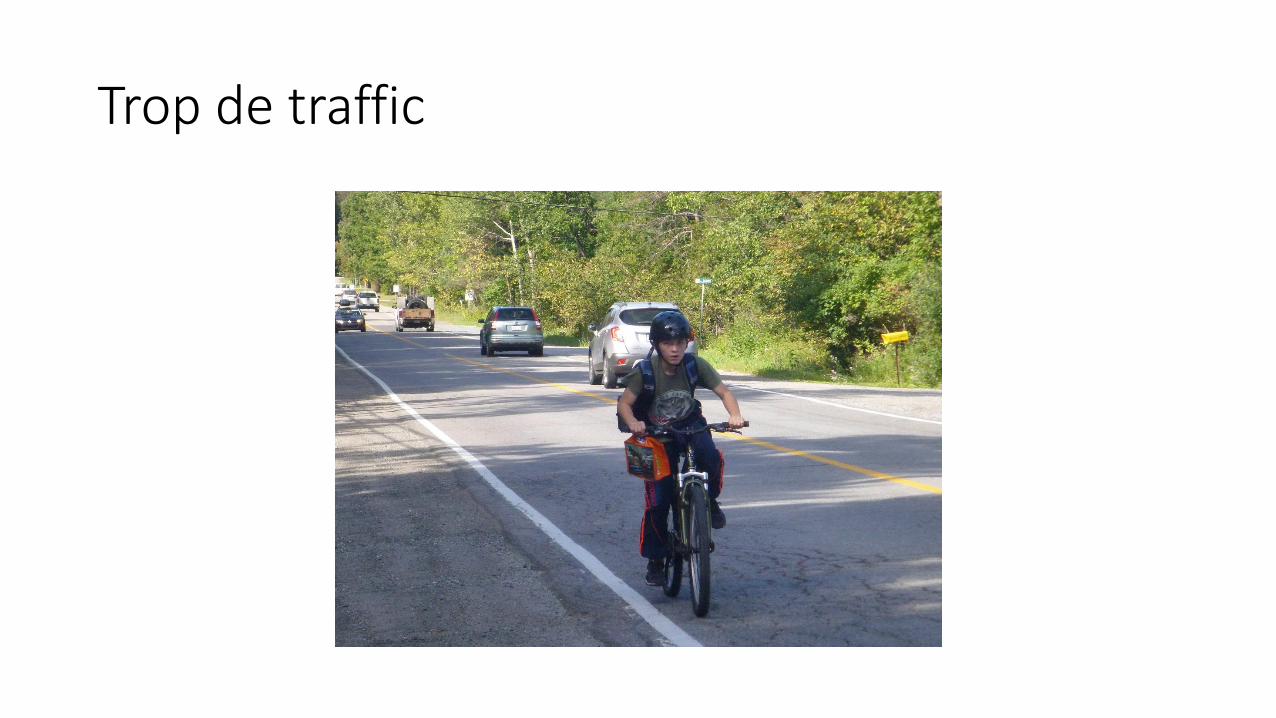
Trop de traffic
Example: Le transport scolaire
Solutions possibles:
1. Améliorer les conditions de sécurité sur les routes (en particulier, les distances entre 0 et 3 (5) kms des écoles.
2. Création de sentiers pour réduire les distances.
3. Programme de sensibilisation
Example: Le transport scolaire
Les défis pour le transport actif scolaires sont semblables à ceux pour la promotion du transport actif en Chelsea en général
Les mesures qui aident pour améliorer les conditions pour le transport scolaire à pied/à vélo améliora les conditions pour tout le monde.

What needs to happen?
What needs to happen to measurably increase the number of people who walk, bike and use public transit for practical purposes?...To have more of this…


What needs to happen?
• Provide safe and appealing conditions for walking an cycling
• Consider wide range of users of all ages (the 8-80 principle). • Can an 8 year old safely bike to get to school? • Will an 80 year old find it reasonable to walk to general store to buy some
milk? • Will a family pushing a baby stroller choose to walk to get some ice cream/go
out for coffee?
• As much as possible, accommodate all seasons/conditions
• Provide access to high quality public transit (facilitate walking and cycling in connection)
• Shorten trip distances
Attract the “interested but intimidated”
E.g., in Ottawa:
33 % of the population describe themselves as “interested in cycling but concerned about traffic safety and waiting for more bike lanes and off road paths”.
For roads: (ex.) Complete streets principles:
• A Complete Street is designed for all ages, abilities, and modes of travel. On Complete Streets, safe and comfortable access for pedestrians, bicycles, transit users and people with disabilities is not an afterthought, but an integral planning feature.
• A Complete Streets policy ensures that transportation planners and engineers consistently design and operate the entire street network for all road users, not only motorists.
• Roads are not just “traffic sewers”, but shared public spaces where people actually want to be.


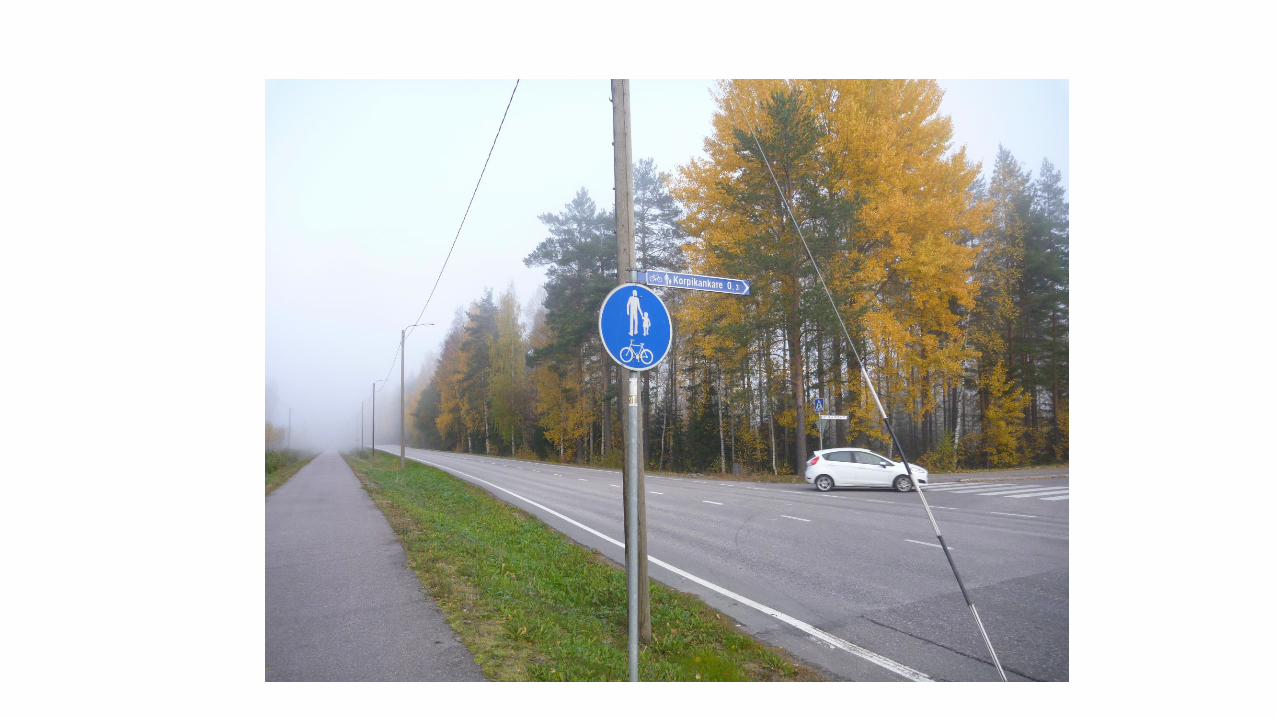
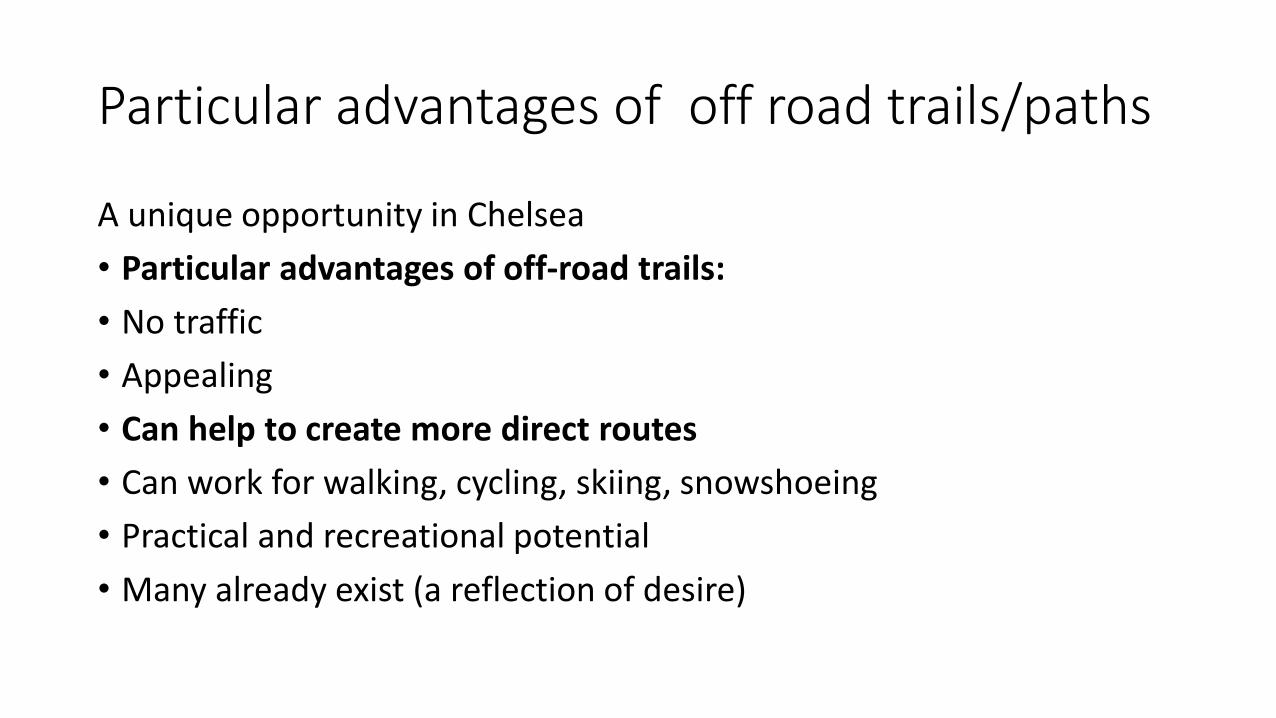
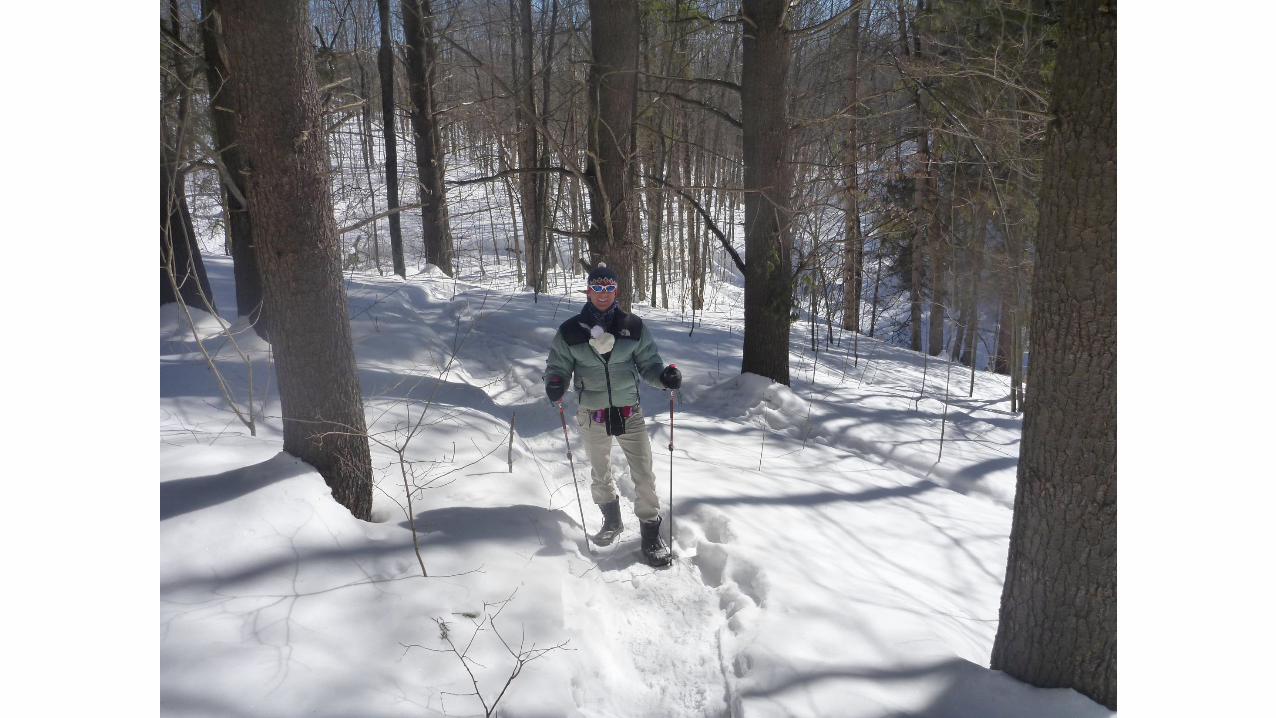
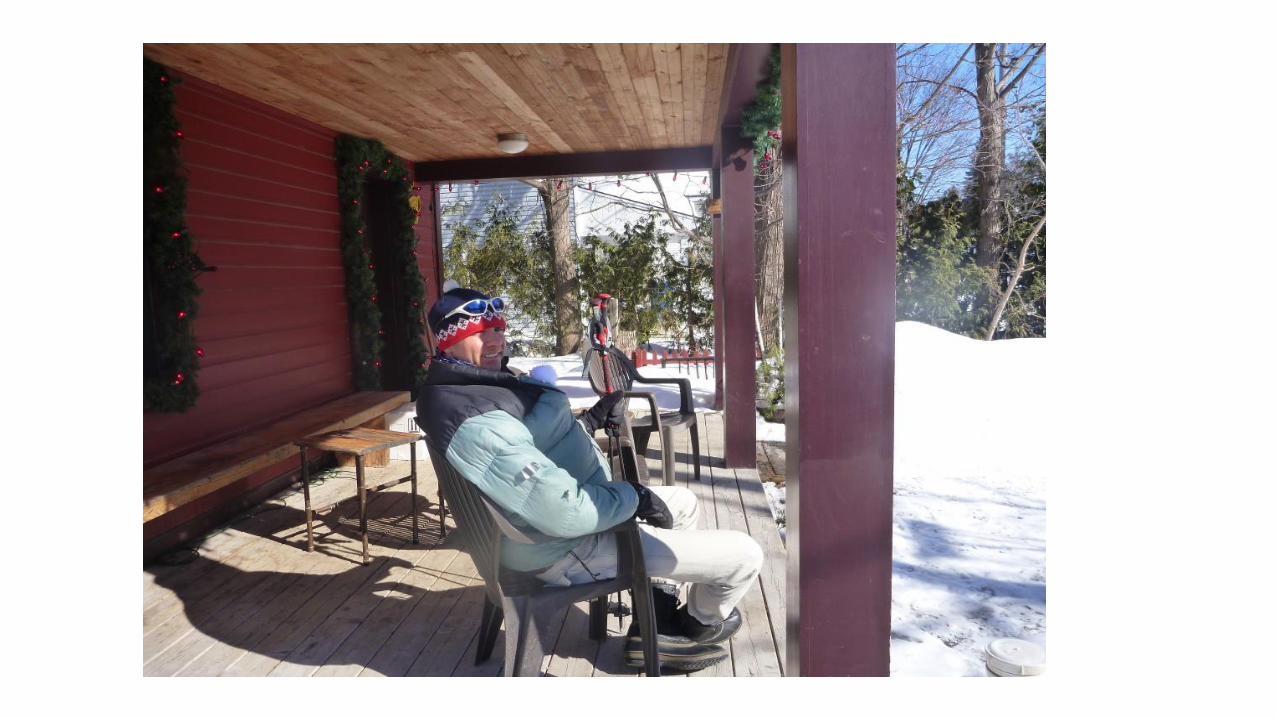
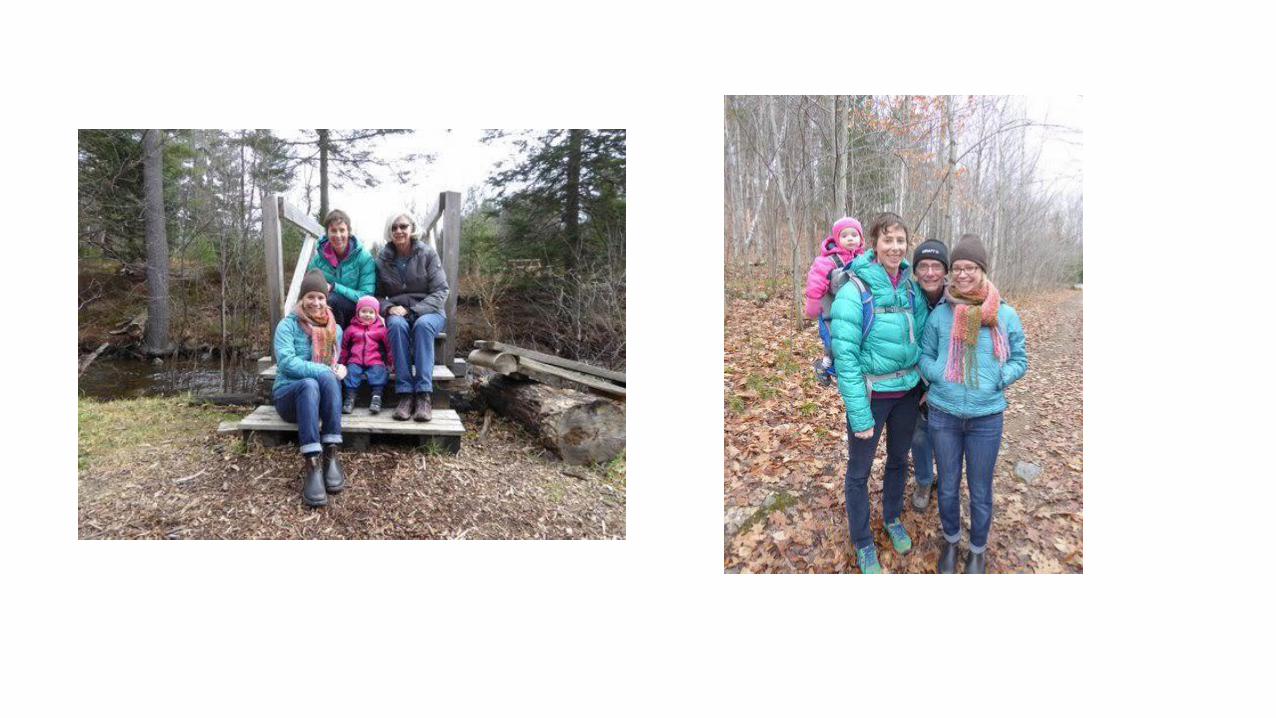
Particular advantages of off road trails/paths
A unique opportunity in Chelsea
• Particular advantages of off-road trails:
• No traffic
• Appealing
• Can help to create more direct routes
• Can work for walking, cycling, skiing, snowshoeing
• Practical and recreational potential
• Many already exist (a reflection of desire)
Trails…things to consider:
• Recreational vs. practical
• Obvious destinations
• Direct routes
• Topography
• Surface
• Multi-season use
Political challenges?
How can we overcome:
• North American and rural/surburban context• Lack of economic incentive to choose AT• Financial constraints (we have to find $)• Benefits not well understood ( these need to be better publicized )• Assumption of cars being #1 priority in planning (In AT-favourable planning, most
vulnerable road users considered 1st)• Existing road network/property development not favourable ( we are starting from
scratch )• Right of ways not established (private property) (We require considerable support
from landowners)
Political Strategies: Actions
1. Create/Demonstrate Public Demand
-Marketing (why is AT a good idea?)
-Demonstrate demand by constituents
-Understand your local neighbourhood
-Choose advocates for particular issues
-Collaboration between neighbourhoods/wards “we will support you on item A, in exchange for your support on item B”
-Be politically visible, especially at election time

Political strategies: Actions
2. Moderation, Collaboration, Compromise:• Strong, reasonable advocacy
• Don’t come across angry, superior, moralistic
• Humour works well, demonization does not
• Understand those who oppose…take their concerns seriously in planning.
• Collaborative effort, not “us vs. them”
• Minimize embarrassment
• Civility, compromise
• Push until you hit resistance..take a break…then push again
• Present a unified AT front (overcome divisions)
Political strategies: Actions
3. Pilot Projects• Give people a taste of livability and AT (usually, they will want more)
• Make it inviting and accessible (people should see it and want to be there)
• Demonstrate success (both qualitative and quantitative…start counting!)
• Be willing to acknowledge failures (builds trust)
Political strategies: Arguments
1. Economic• Explain/supply evidence of economic benefits of AT, e.g.,
• Trails, sidewalks and bike lanes are cheaper to build (can be VERY cheap) than vehicle lanes.
• Health, social and environmental costs/benefits
• Personal costs/benefits
• Good for business
• Funding likely to be available from other levels of government
• Municipal vs. Provincial vs. Federal….you will benefit somewhere.
Political strategies: Arguments
2. Safety arguments• Both real and perceived important
• Injuries and deaths are preventable

Political strategies: Arguments
3. Quality of life arguments:• “Is sitting in traffic fun? Cheap? Good for your health? What kind of life do
you want?”
• “Do you really want to live in a place dominated by cars and the noise, danger, and pollution that comes with them?”
• Would you like your children (or your neighbor’s) to be able to get around Chelsea in a safe, healthy way?
• Would you like to be able to walk, bike, and leave your car at home more often?

Political strategies: Arguments
4. Equity arguments• Promoting AT is about freedom of choice, not a restriction.
• It is reasonable to balance considerations for all types of users
• To offer reasonably safe/pleasant conditions for all types of users…young or old, drivers or not.
The future
• Transcollines service expanding/improving
• Car sharing, driverless cars, transportation apps
• Working from home, working from hubs
• Decline in number of young people getting licenses all over the world
• Service-based preferences
• Would prefer to work WHILE commuting
• What can we do about density/planning?
• Low car/ car-free living in Chelsea?