Embed Size (px)
Citation preview
Page 2 Source: Company, www.dynamiclevels.com
Indo Count Industries Limited
Company Overview and Stock price ……………………………………….……3
Product Overview……………………………………………………………….….…..4
Global Presence………………………………………………………………………….7
Certificates……………………………….…………….……………………….….….…8
Companies Capabilities ……………………………..………….………….….…….8
Customers and brand partner…………………..…………….………….….….. 9
Industry outlook…………….…………………………………………….……..…..10
Competitive edge of ICIL and Future Outlook………..……………....…. 11
Capex Plan……………………………………..…………….……..……………....….13
Company Financials………………………………………………………………….14
Peer Comparison……………………………………………………………………….17
Share holding pattern………………………………………………………………..18
Investment Rationale………………………………………...………….......…....19
Page 3 Source: Company, www.dynamiclevels.com
Company’s Overview and Stock Price
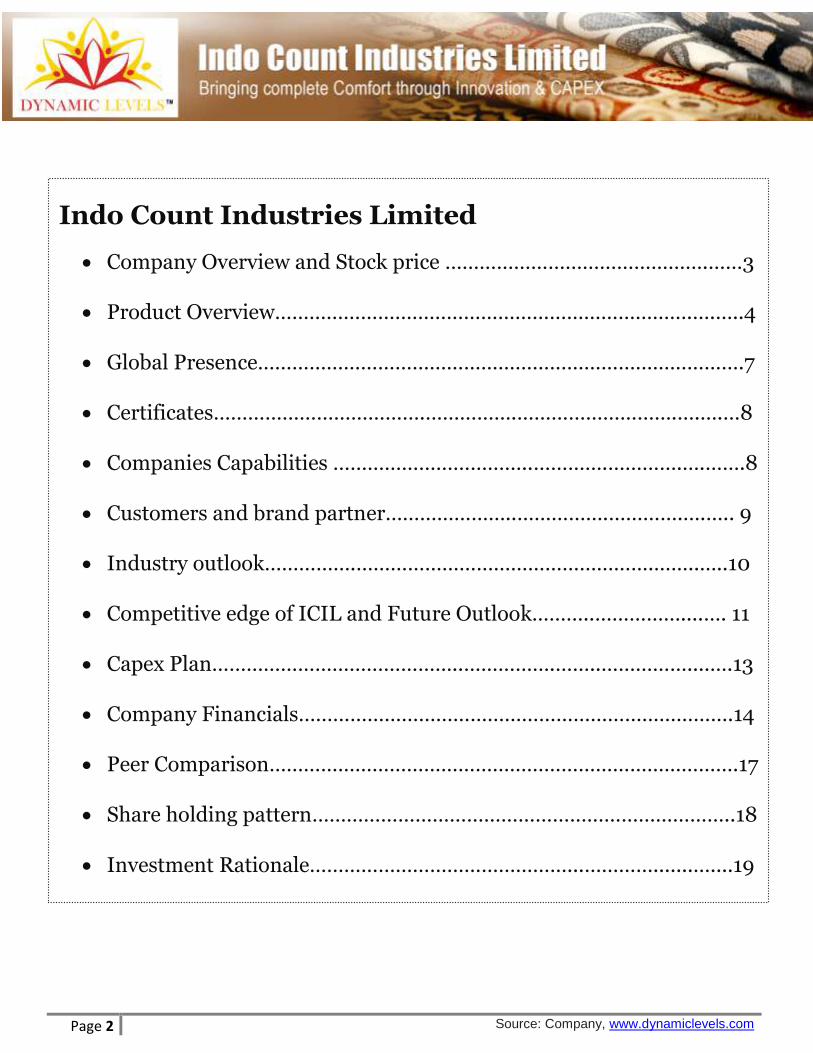
Chart Hypothesis: Below is the 1 year weekly price chart of Indo Count, in which we can see that stock has gained momentum from 500 levels and currently trading at 950. Chart is showing immediate upward target of 1250
Indo Count is a multibagger which has surged almost 265% from low of Rs. 243 made high of Rs. 1254 in last financial year 2015-2016. Stock is currently trading at Rs. 962. Stock has successfully increased share holders wealth in 1 year.
EXCHANGE SYMBOL INDO COUNT
Current Price * (Rs.) 967.8
Face Value (Rs.) 10
52 Week High (Rs.) 1254.00 (08-Feb-16)
52 Week Low (Rs.) 447.00 (13-May-15)
Life Time high (Rs.) 1254.00 (08-Feb-16)
Life Time low (Rs.) 2.50 (13-Jul-01)
Average Daily Movement 46.18
Average Volume [20 days] 70040
1 Month Return (%) -4.07
P/E Ratio (x) 15.21
Book Value 78.7
Market Cap 3538.18 (Cr)
% of Promoter holding pledged
0
Indo Count is one of the leaders in vertically integrated bedding in India. They have created greater
efficiencies, hence provided more value for their clients by controlling all aspects of the supply chain,
from spinning, to products and sales.
Company has a vision to be one of the leading players in global Home Textile industry on the strengths of technology, experience and innovation.
Company has a mission to be committed to provide all their customers desired quality, services and
value for money through our technological and organizational strengths.
Page 4 Source: Company, www.dynamiclevels.com
Product Overview
4 major Products:
Bed Sheets
Fashion Bedding
Utility Bedding
Institutional Bedding
Bed Sheets
The Perfect Sheet: Indo Count’s has brought revolution by their attention to detail and their dedicated to quality this has rewarded the company with reputation as the pre-eminent manufacturer. Company creates private label, licensed and their own premium brands. Their bed sheets come in a range of qualities starting from better to premium and are designed to meet the needs of their clients’ category and price point.
The Perfect Feel and Fit: Continuous research and
development has provided insights on what the key
parameters of sheet buying decisions are for consumers.
The feel of the sheet is the most important factor for
consumers and we achieve perfect feel with their
innovative weaving and processing technology. The second
most important attribute in the sheet buying decision is the
fit of the sheet. Company’s product development teams
have created True Grip® fit technology to provide the
perfect fit solution for consumers.
Quality: They started by sourcing the best cotton from
India and around the globe. Then they use state-of-the-art
equipment to spin, weave, bleach, dye and print. Finishing
and branding are also managed by their highly skilled
workforce who is solely focused on bedding. The result is
complete quality control across the entire process and
increased value for all our stakeholders. Over the years
Indo Count has received several global accolades and
awards on product consistency and superior quality
standards. We follow world-class standards in both our
Spinning and Home Textile divisions.
Page 5 Source: Company, www.dynamiclevels.com
Fashion Bedding Indo Count is also a leading manufacturer of fashion bedding. Their collections include
1. Matching and complementary sheets 2. Comforters 3. Duvet covers 4. Quilts 5. Pillows 6. Shams 7. Skirts
When consumers choose one of their collections, they have everything they need to create the perfect look, in the style they love.
Creative Process: Indo count’s internal designers and brand teams is based in
1. India, 2. U.S. 3. Australia 4. England
They work with their clients and partners to create brands that people love. They start with consumer surveys and market research to determine what consumers are looking for. Creative directors and product engineers brainstorm innovations that help their clients and retailers deliver superior quality products consumers are looking for.
Product Development: Innovative weaves and processes allow them to continue to expand their product offering to meet consumer demand. They combine a range of finishes including
1. Yarn dyed 2. Printed 3. Embroidered 4. Embellished
With a range of innovative benefits such as super soft, easy care and wrinkle free.
Page 6 Source: Company, www.dynamiclevels.com
Brand Development: Indo Count has the global experience and a reputation for bringing more value to its partners with the start-to-finish development of products and brands. From innovative development and design through to marketing and promotion, they have the experience to help with even the most demanding mandates and timelines.
Utility Bedding Indo count focus creates more quality and value for their clients and consumers. They use the latest technologies to create a variety of products with the properties consumers are looking for –
1. Namely anti-static 2. Waterproof 3. Antimicrobial qualities
That are supported by True Grip® technology, ensuring sleep accessories stay in place.
Institutional Bedding Company is proud to provide bedding for
1. Renowned hotels 2. Resorts 3. Other institutions.
They have a proven record providing institutional grade bedding that stands the test of time. They use more durable threads, weaving innovations and finishing processes to create bedding that continues to look inviting and ensure comfort. Quality Standards They use the highest quality threads, weaving practices and finishing processes to create bedding that continues to look inviting, and feel soft, wash after wash.
Company’s Brands
Boutique Living
The Pure Collection
Revival
Haven
Boutique Living: Their Boutique Living Collection appeals to consumers who prefer the sophistication of boutique hotels over large chains. It is inspiring and adds a designer’s touch to any bedroom. The Boutique Living Collection provides complete
modern comfort and style with matching sheets, comforters, duvets, pillows and shams.
The Pure Collection: For those looking for a return to nature, the Pure Collection is the breath of fresh air they’ve been longing for. Made from 100% organic cotton and free of all harmful chemicals, the collection’s back to basics, minimal designs and colors soothe the mind and quiet the soul.
Revival: Company’s “Revival” Collection celebrates the spirit of vintage. It is where classic designs meet urban jungle – but with a warm modern touches. Enzyme and stone washed, this collection is incredibly soft.
Haven: Haven is a line of top-quality sleep accessories created to fully protect your mattress while providing excellent breathability and comfort. It is where premium grade materials meet fine craftsmanship to create a truly superior sleep experience.
Page 7 Source: Company, www.dynamiclevels.com
Global Presence
The Indo Count group of companies is purposefully located in
every corner of the globe to better serve key markets in the U.S.,
Europe, Asia and Australia.
Indo Count Global Inc.
US Head Office & Showroom
New York, NY
Indo Count Global is a fully-owned subsidiary of Indo Count
Industries Ltd and services North America. They are located within
New York’s historic Textile Building placing them at the heart of the
textile universe. As their Head Office in the U.S., their world-class
design and development team is located there and always
available to discuss new ideas and innovations with clients and
partners.
US Distribution Center
Charlotte, NC
Indo Count Global’s US Distribution Center is ideally located in
Charlotte, NC and provides Indo Count Clients and partners with
fast and reliable replenishment. Maintaining the optimal inventory
is a key success factor for their customers businesses and allows
for improved cash flow and control.
Indo Count UK Ltd.
Manchester, United Kingdom
Indo Count UK is a fully-owned subsidiary of Indo Count Industries
Ltd and serves the UK and Europe. As their Head Office in Europe,
they provide a full range of services.
Indo Australia Pty Ltd.
Victoria, Australia
Indo Count Australia, a subsidiary of Indo Count Industries Ltd
services Australia and the Far East. We provide a full range of
services and our in-house design and development team is always
available to discuss new ideas, innovations and trends with clients
and partners.
SERVICES Rendered by foreign
entities
• EDI-based replenishment services
• E-Commerce fulfillment
• Modern warehousing services
• Supply chain management and
inventory planning
• Development and design team
for latest market research and
consumer insights
Page 8 Source: Company, www.dynamiclevels.com
Certificates
Companies Capabilities
Spinning Indo Count produces 14,000 tons of combed cotton yarn per year. They source the best cotton from India and around the globe and use state-of-the-art equipment and processes in their three spinning plants. They have
80,016 spindles at Kolhapur Maharashtra
59,520 spindles at Gokul Shirgaon plant
20,496 at Pranavaditya Spinning Mills Ltd
Weaving Indo Count’s weaving facilities are second to none and utilize air jet looms for wide width fabrics including sateen, yarn dyed and dobby textures. All their equipment is imported from the best manufacturers in the business. Processing
All bleaching, dyeing, printing and finishing are completed using
the latest technologies and processes at Kagal MIDC Plant, the first
of its kind in the state of Maharashtra.
Cut-n-Sew
Cut-n-sew factories are capable of
producing sheet sets, mattress pads,
pillow covers, duvet covers,
comforters, quilts, cushion covers, and
shams. They use the best automated
equipment to provide consistent
quality and time-bound deliveries.
Page 9 Source: Company, www.dynamiclevels.com
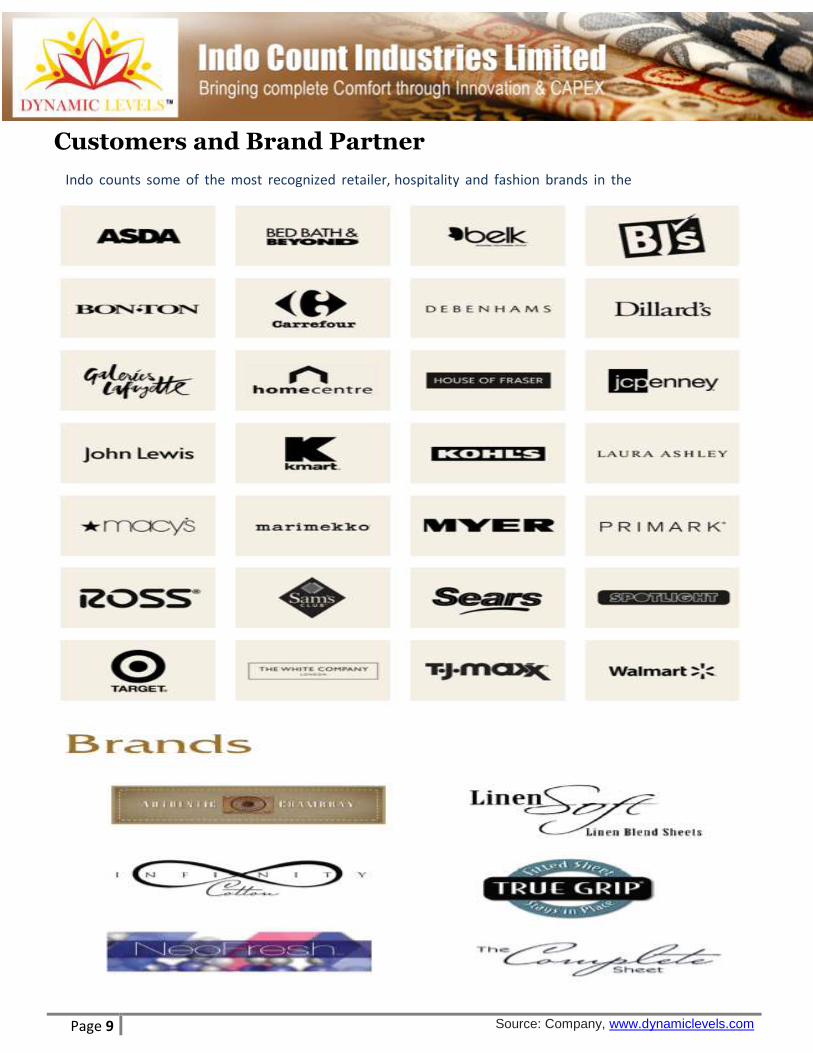
Customers and Brand Partner
Indo counts some of the most recognized retailer, hospitality and fashion brands in the world.
Page 10 Source: Company, www.dynamiclevels.com
Industry Outlook
The global home textiles industry
Textile Industry is expected to grow by 5% and sustain through
2017
Home linen is expected to grow nearly 21% of the total home
textiles industry (by volume)
Growing market for higher value home linen
Widening home linen product mix
Indian home textiles industry
Indian textiles industry contributes ~14% of Index of Industrial
Production (IIP) and for around 5% of GDP
Textiles contribute around 13% of India’s export earnings
Indian textiles market around US$110 billion
Indian textile industry projected to five-fold in ten years (US$500
bn)
India’s sectoral advantage
Everyday India is creating skilled workers force
Competitive cost structure is an added advantage for price
determination
India provide abundant raw cotton to the industry
As this is a labour intensive industry Government provide
favorable policies like cheap credit and capex subsidy to boost the
economy
Free trade ASEAN agreements to connect globally
Abundant availability of raw material (cotton, synthetic yarn,
wool, silk, jute)
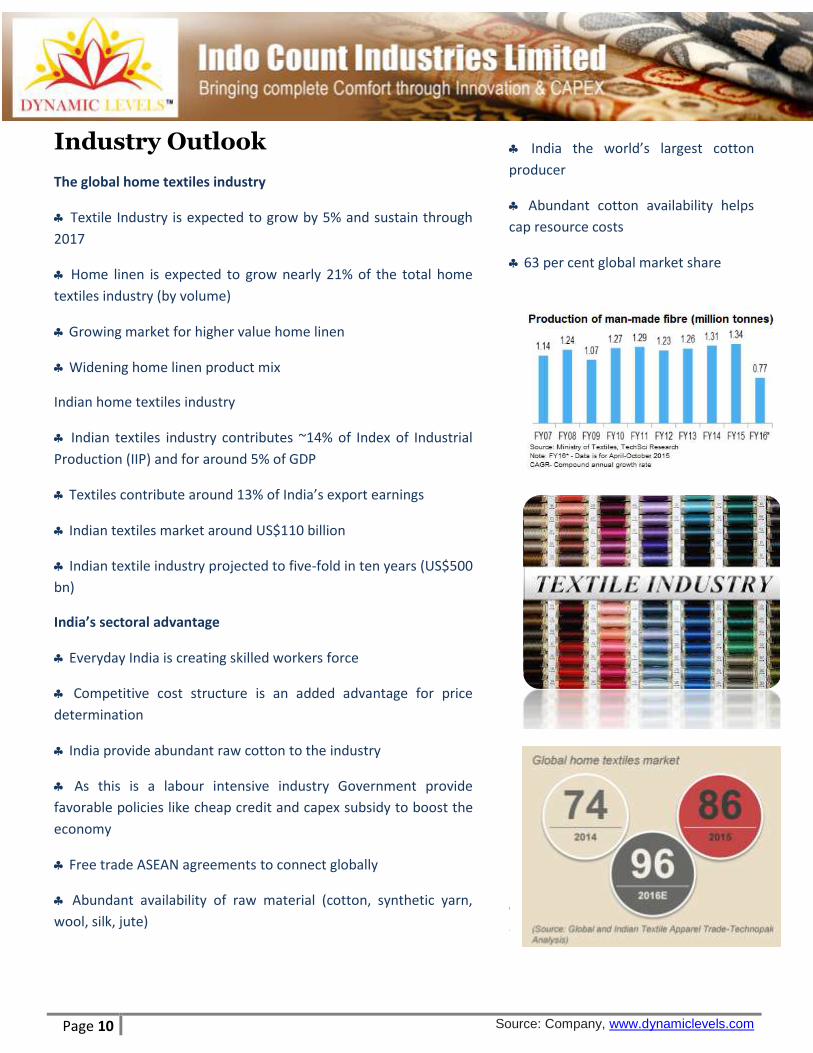
India the world’s largest cotton
producer
Abundant cotton availability helps
cap resource costs
63 per cent global market share
Competitive advantage in people skills
and production costs
Page 11 Source: Company, www.dynamiclevels.com
Union Budget 2015-16 announced policy for integrated textile
parks in India
Growing global respect for Indian products; dependable modern
long-term partner.
Growing premium products demand
Reason for bed linen market to be attractive
Focus on capability and capacity
Greater respect for small volume / short runs
Extends the sector from thin-margin segments (yarn etc.)
Represents value-addition
Driven by enduring customer relationships (hence sustainable)
Make-to-order
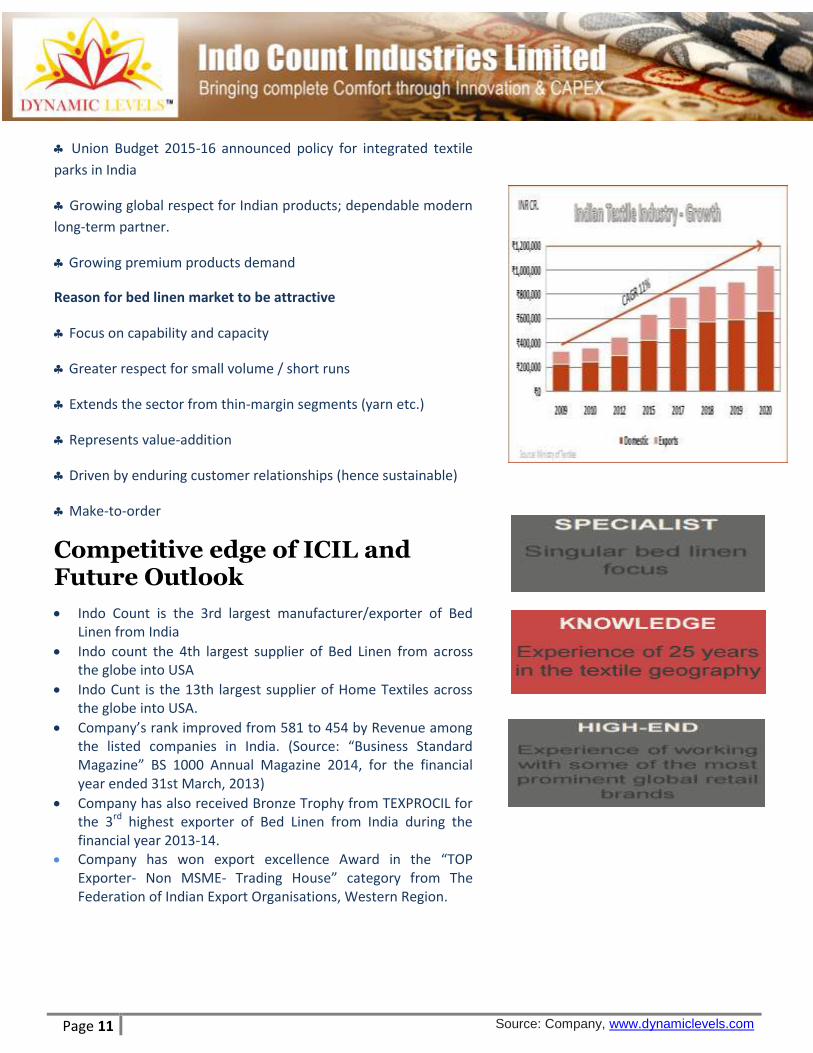
Competitive edge of ICIL and Future Outlook
Indo Count is the 3rd largest manufacturer/exporter of Bed Linen from India
Indo count the 4th largest supplier of Bed Linen from across the globe into USA
Indo Cunt is the 13th largest supplier of Home Textiles across the globe into USA.
Company’s rank improved from 581 to 454 by Revenue among the listed companies in India. (Source: “Business Standard Magazine” BS 1000 Annual Magazine 2014, for the financial year ended 31st March, 2013)
Company has also received Bronze Trophy from TEXPROCIL for the 3rd highest exporter of Bed Linen from India during the financial year 2013-14.
Company has won export excellence Award in the “TOP Exporter- Non MSME- Trading House” category from The Federation of Indian Export Organisations, Western Region.
Page 12 Source: Company, www.dynamiclevels.com
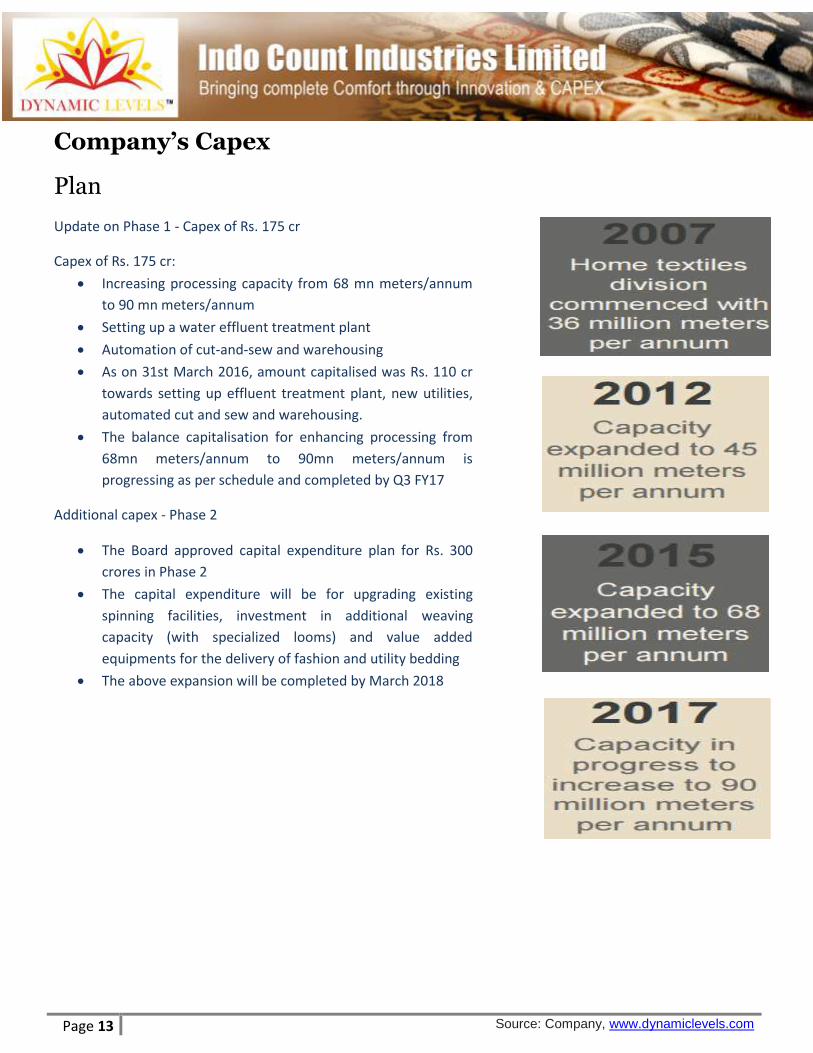
The Company has expanded its capacity by 50% from 45 million meters to 68 million meters p.a. As a result, capacity of bed sheet too has increased from 12 million bed sheet per annum to 17 million bed sheet per annum.
To penetrate deeper into the markets with flexible production and wider product mix, the Company has set up a UK subsidiary and have formed a joint venture with an Australian Home Textile supplier (established for the last 25 years).
Compared to sheet sets, Utility bedding and Fashion bedding are expected to be generating improved margins.
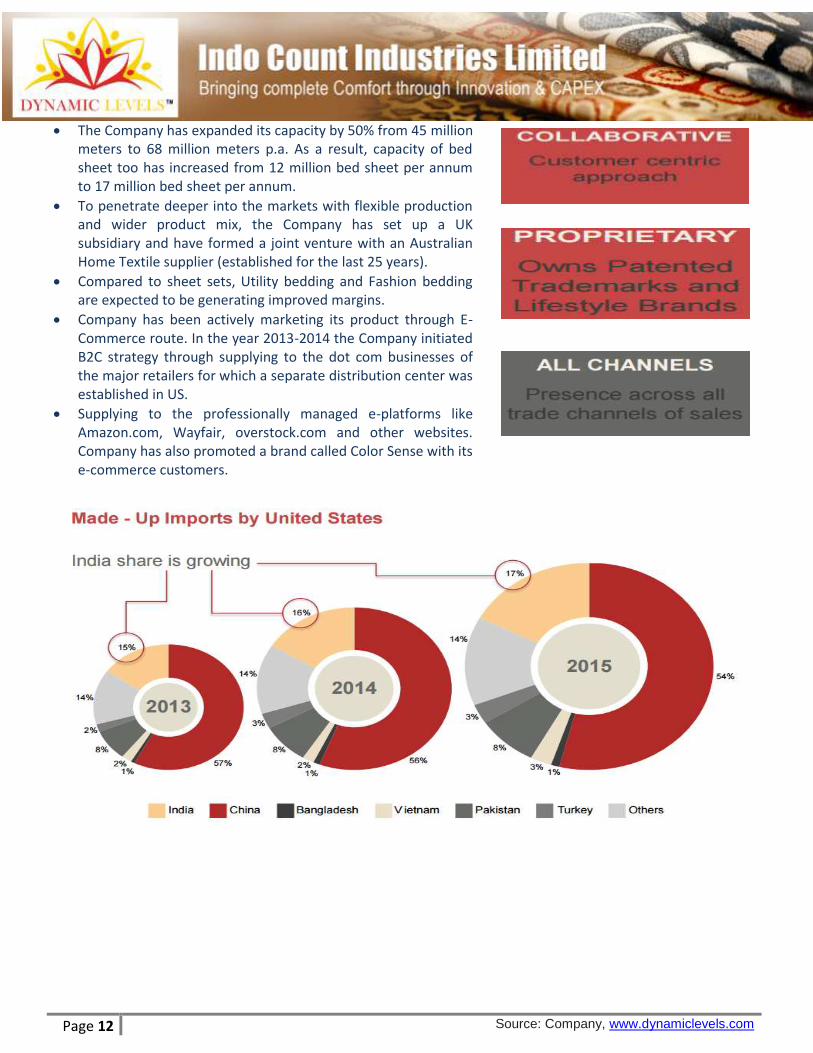
Company has been actively marketing its product through E-Commerce route. In the year 2013-2014 the Company initiated B2C strategy through supplying to the dot com businesses of the major retailers for which a separate distribution center was established in US.
Supplying to the professionally managed e-platforms like Amazon.com, Wayfair, overstock.com and other websites. Company has also promoted a brand called Color Sense with its e-commerce customers.
Page 13 Source: Company, www.dynamiclevels.com
Company’s Capex
Plan
Update on Phase 1 - Capex of Rs. 175 cr
Capex of Rs. 175 cr:
Increasing processing capacity from 68 mn meters/annum
to 90 mn meters/annum
Setting up a water effluent treatment plant
Automation of cut-and-sew and warehousing
As on 31st March 2016, amount capitalised was Rs. 110 cr
towards setting up effluent treatment plant, new utilities,
automated cut and sew and warehousing.
The balance capitalisation for enhancing processing from
68mn meters/annum to 90mn meters/annum is
progressing as per schedule and completed by Q3 FY17
Additional capex - Phase 2
The Board approved capital expenditure plan for Rs. 300
crores in Phase 2
The capital expenditure will be for upgrading existing
spinning facilities, investment in additional weaving
capacity (with specialized looms) and value added
equipments for the delivery of fashion and utility bedding
The above expansion will be completed by March 2018
Page 14 Source: Company, www.dynamiclevels.com
Company Financials
In Cr March-16 March-15 March-14 % Growth
Annual Annual Annual 2015-2016 2015-2014
Net Sales/Income from operations 2173.72 1716.89 1467.63 26.61% 16.98%
Other Operating Income 39.08 64.91 30.27
Total Income From Operations 2212.8 1781.80 1497.90 24.19% 18.95%
Increase/Decrease in Stocks -46.99 -62.76 -56.01
Consumption of Raw Materials 1092.48 1008.73 937.44 8.30% 7.60%
Purchase of Traded Goods -- 0.62 8.87
Power And Fuel 70.76 69.69 66.23
Employees Cost 104.71 79.88 64.48 31.08% 23.88%
Depreciation 18.85 15.97 19.56
Other Expenses 518.29 371.99 287.79 39.33% 29.26%
Total Expenditure 1758.10 1484.12 1328.36 18.46% 11.73%
Operating Profit 454.70 297.68 169.54 52.75% 75.58%
Interest 54.91 65.02 49.89 -15.55% 30.33%
P/L Before Exceptional Items & Tax 399.79 232.66 119.65 71.83% 94.45%
Exceptional Item -- -25.74 --
P/L Before Tax 399.79 206.92 119.65 93.21% 72.94%
Tax 135.05 61.05 9.26
PAT 264.74 145.87 110.39 81.49% 32.14%
Minority Interest -0.02 -0.21 -0.43
Net Profit/(Loss) For the Period 264.72 145.66 109.96 81.74% 32.47%
Equity Share Capital 39.48 39.48 35.48 0.00% 11.27%
Reserves 521.25 275.75 133.12 89.03% 107.14%
EPS (Rs.) [After Extraordinary items] 67.04 38.95 30.96 72.12% 25.81%
Promoters & Promoter Group Shareholding Pledged -- 31.78 32.79
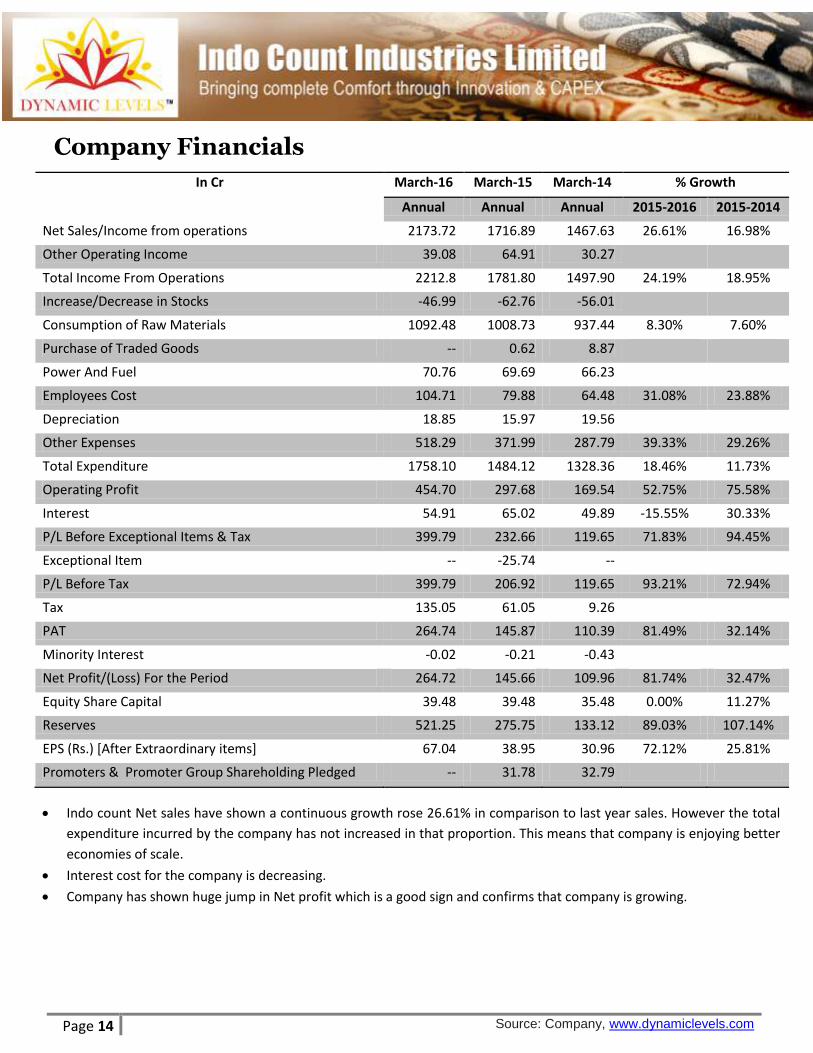
Indo count Net sales have shown a continuous growth rose 26.61% in comparison to last year sales. However the total
expenditure incurred by the company has not increased in that proportion. This means that company is enjoying better
economies of scale.
Interest cost for the company is decreasing.
Company has shown huge jump in Net profit which is a good sign and confirms that company is growing.
Page 15 Source: Company, www.dynamiclevels.com
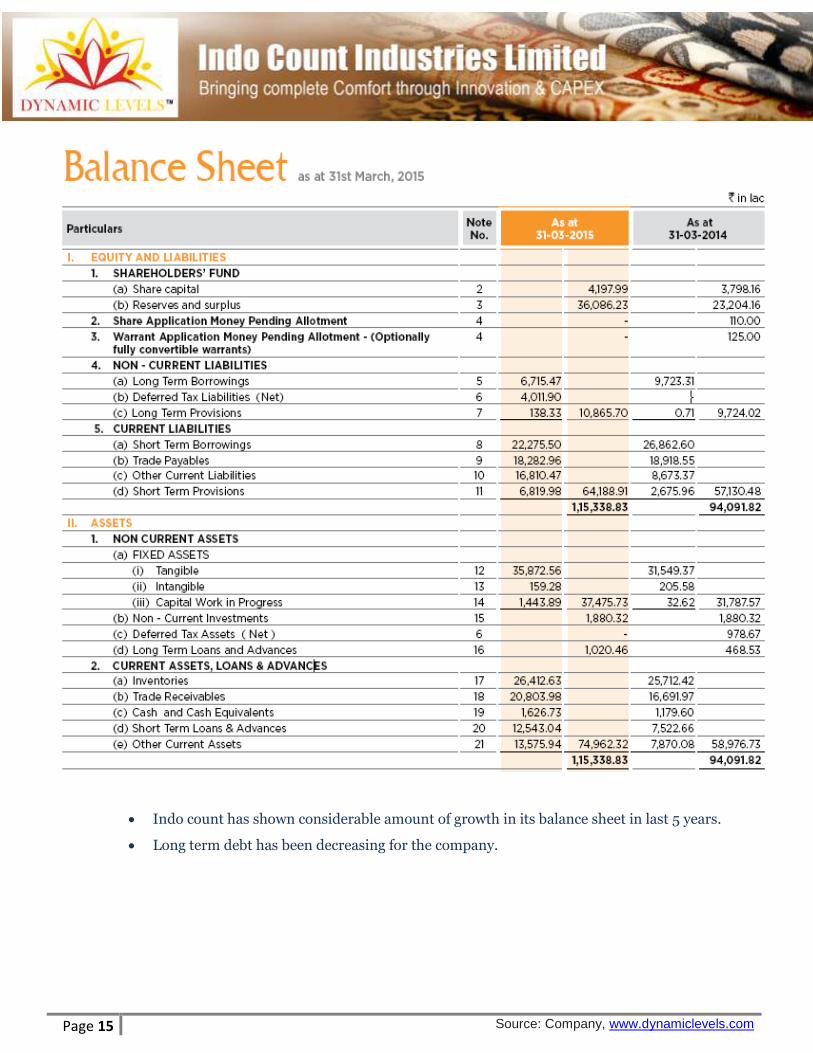
Indo count has shown considerable amount of growth in its balance sheet in last 5 years.
Long term debt has been decreasing for the company.
Page 16 Source: Company, www.dynamiclevels.com
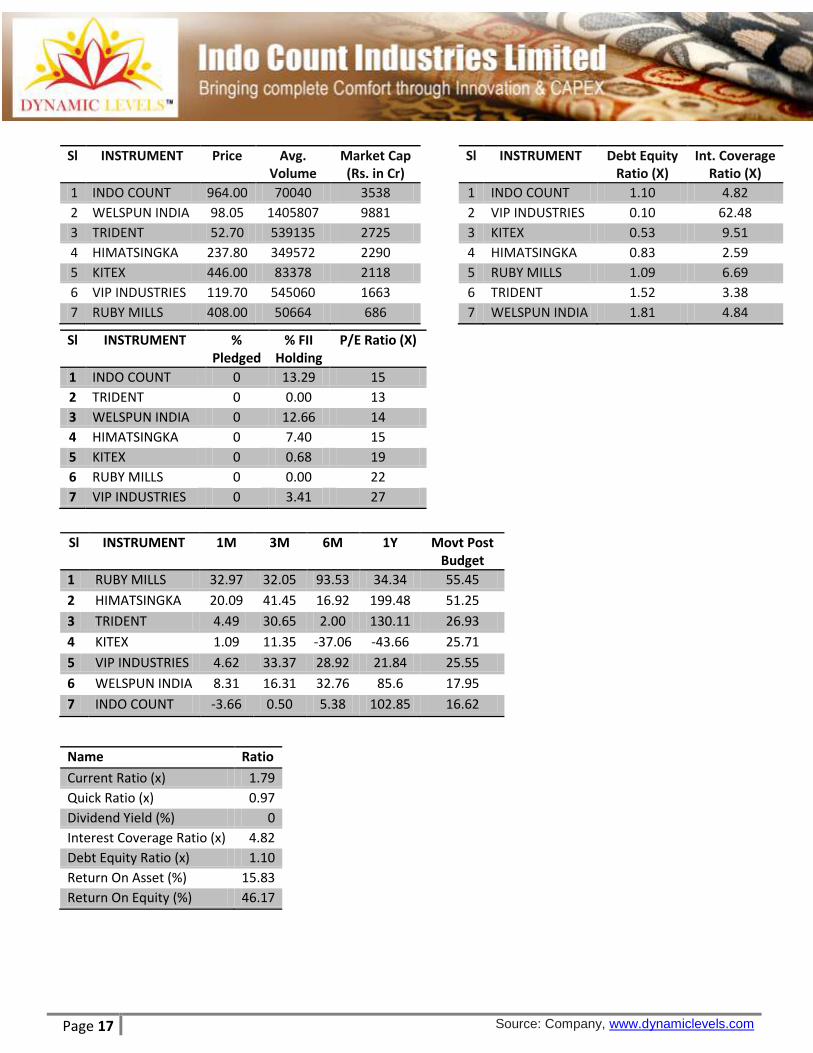
Peer Comparison
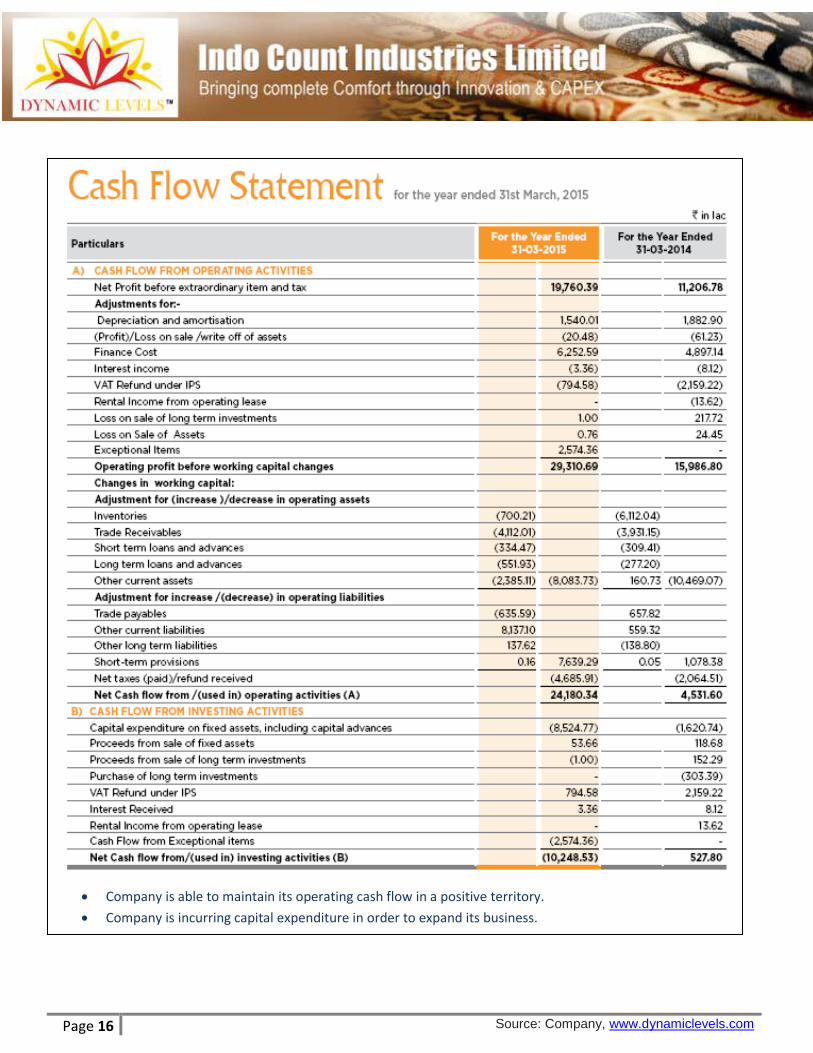
Company is able to maintain its operating cash flow in a positive territory.
Company is incurring capital expenditure in order to expand its business.
Page 17 Source: Company, www.dynamiclevels.com
Sl INSTRUMENT Price Avg. Volume
Market Cap (Rs. in Cr)
1 INDO COUNT 964.00 70040 3538
2 WELSPUN INDIA 98.05 1405807 9881
3 TRIDENT 52.70 539135 2725
4 HIMATSINGKA 237.80 349572 2290
5 KITEX 446.00 83378 2118
6 VIP INDUSTRIES 119.70 545060 1663
7 RUBY MILLS 408.00 50664 686
Sl INSTRUMENT % Pledged
% FII Holding
P/E Ratio (X)
1 INDO COUNT 0 13.29 15
2 TRIDENT 0 0.00 13
3 WELSPUN INDIA 0 12.66 14
4 HIMATSINGKA 0 7.40 15
5 KITEX 0 0.68 19
6 RUBY MILLS 0 0.00 22
7 VIP INDUSTRIES 0 3.41 27
Sl INSTRUMENT Debt Equity Ratio (X)
Int. Coverage Ratio (X)
1 INDO COUNT 1.10 4.82
2 VIP INDUSTRIES 0.10 62.48
3 KITEX 0.53 9.51
4 HIMATSINGKA 0.83 2.59
5 RUBY MILLS 1.09 6.69
6 TRIDENT 1.52 3.38
7 WELSPUN INDIA 1.81 4.84
Sl INSTRUMENT 1M 3M 6M 1Y Movt Post Budget
1 RUBY MILLS 32.97 32.05 93.53 34.34 55.45
2 HIMATSINGKA 20.09 41.45 16.92 199.48 51.25
3 TRIDENT 4.49 30.65 2.00 130.11 26.93
4 KITEX 1.09 11.35 -37.06 -43.66 25.71
5 VIP INDUSTRIES 4.62 33.37 28.92 21.84 25.55
6 WELSPUN INDIA 8.31 16.31 32.76 85.6 17.95
7 INDO COUNT -3.66 0.50 5.38 102.85 16.62
Name Ratio
Current Ratio (x) 1.79
Quick Ratio (x) 0.97
Dividend Yield (%) 0
Interest Coverage Ratio (x) 4.82
Debt Equity Ratio (x) 1.10
Return On Asset (%) 15.83
Return On Equity (%) 46.17
Page 18 Source: Company, www.dynamiclevels.com
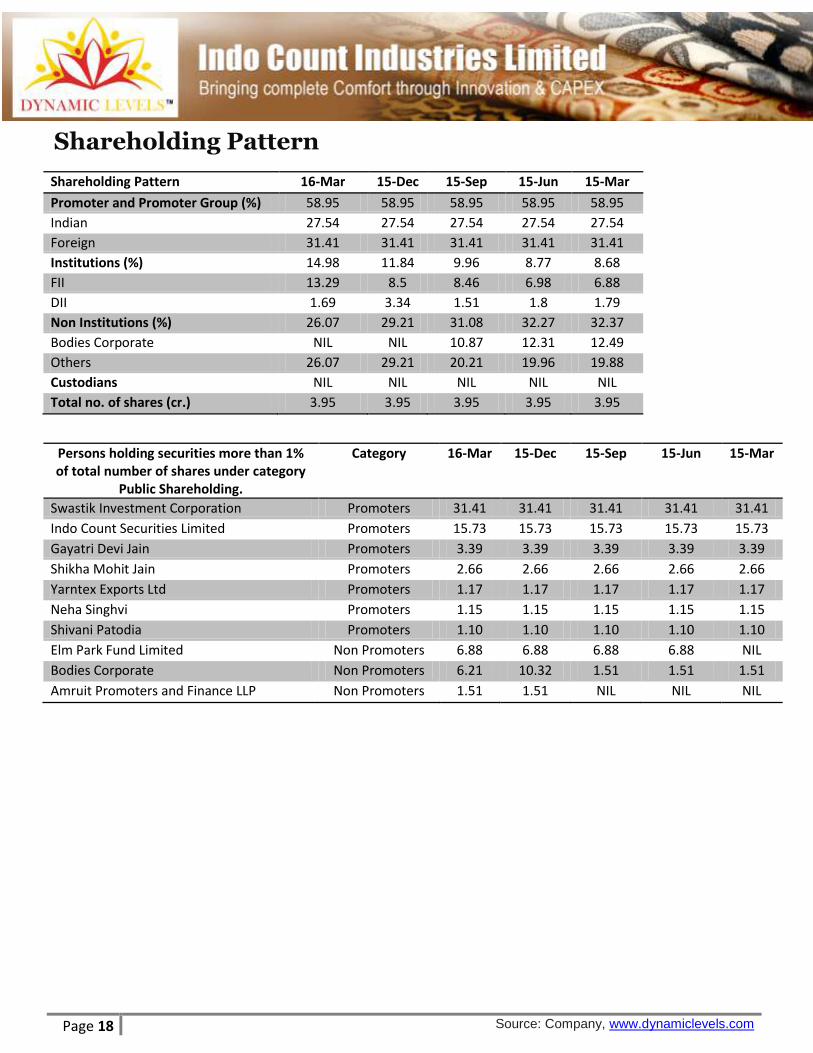
Shareholding Pattern
Shareholding Pattern 16-Mar 15-Dec 15-Sep 15-Jun 15-Mar
Promoter and Promoter Group (%) 58.95 58.95 58.95 58.95 58.95
Indian 27.54 27.54 27.54 27.54 27.54
Foreign 31.41 31.41 31.41 31.41 31.41
Institutions (%) 14.98 11.84 9.96 8.77 8.68
FII 13.29 8.5 8.46 6.98 6.88
DII 1.69 3.34 1.51 1.8 1.79
Non Institutions (%) 26.07 29.21 31.08 32.27 32.37
Bodies Corporate NIL NIL 10.87 12.31 12.49
Others 26.07 29.21 20.21 19.96 19.88
Custodians NIL NIL NIL NIL NIL
Total no. of shares (cr.) 3.95 3.95 3.95 3.95 3.95
es not any significant investment by FII and DII.
Persons holding securities more than 1% of total number of shares under category
Public Shareholding.
Category 16-Mar 15-Dec 15-Sep 15-Jun 15-Mar
Swastik Investment Corporation Promoters 31.41 31.41 31.41 31.41 31.41
Indo Count Securities Limited Promoters 15.73 15.73 15.73 15.73 15.73
Gayatri Devi Jain Promoters 3.39 3.39 3.39 3.39 3.39
Shikha Mohit Jain Promoters 2.66 2.66 2.66 2.66 2.66
Yarntex Exports Ltd Promoters 1.17 1.17 1.17 1.17 1.17
Neha Singhvi Promoters 1.15 1.15 1.15 1.15 1.15
Shivani Patodia Promoters 1.10 1.10 1.10 1.10 1.10
Elm Park Fund Limited Non Promoters 6.88 6.88 6.88 6.88 NIL
Bodies Corporate Non Promoters 6.21 10.32 1.51 1.51 1.51
Amruit Promoters and Finance LLP Non Promoters 1.51 1.51 NIL NIL NIL
Page 19 Source: Company, www.dynamiclevels.com
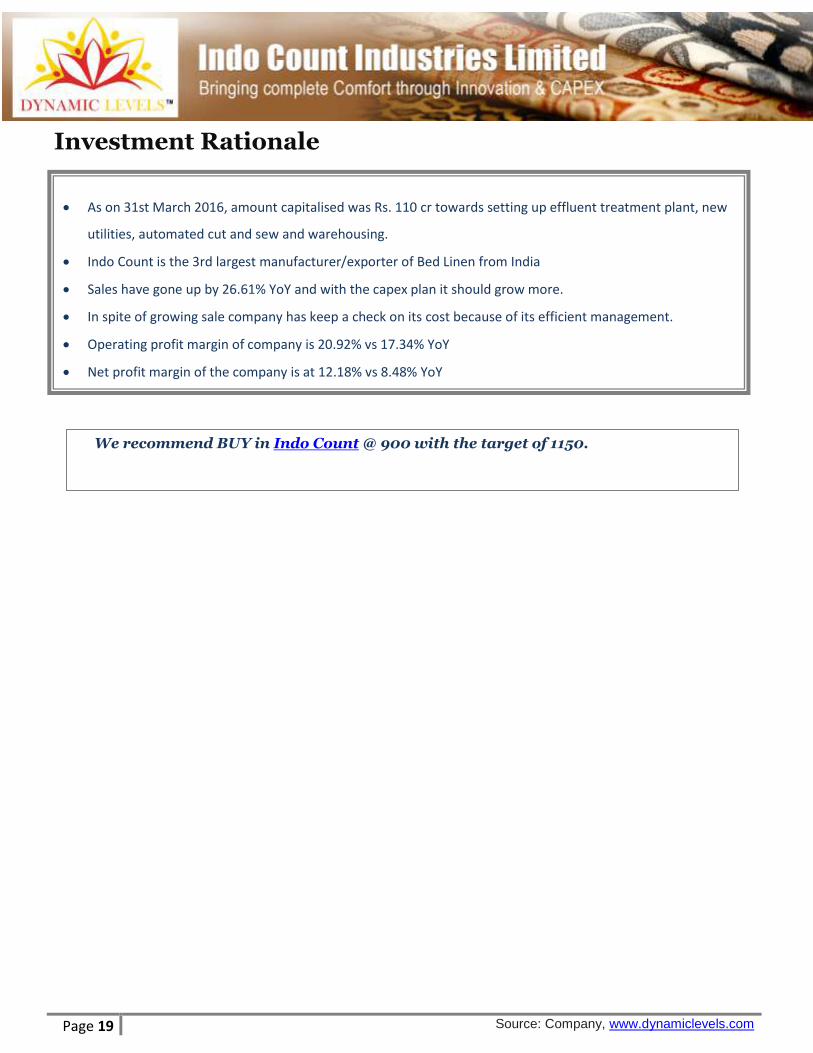
Investment Rationale
As on 31st March 2016, amount capitalised was Rs. 110 cr towards setting up effluent treatment plant, new
utilities, automated cut and sew and warehousing.
Indo Count is the 3rd largest manufacturer/exporter of Bed Linen from India
Sales have gone up by 26.61% YoY and with the capex plan it should grow more.
In spite of growing sale company has keep a check on its cost because of its efficient management.
Operating profit margin of company is 20.92% vs 17.34% YoY
Net profit margin of the company is at 12.18% vs 8.48% YoY
We recommend BUY in Indo Count @ 900 with the target of 1150.
Page 20 Source: Company, www.dynamiclevels.com
Disclaimer: Research Disclaimer and Disclosure inter-alia as required under Securities and Exchange Board of India (Research Analysts) Regulations, 2014. Dynamic Equities Pvt. Ltd. is a member of National Stock Exchange of India Ltd. (NSEIL), Bombay Stock Exchange Ltd (BSE), Multi Stock Exchange of India Ltd (MCX-SX) and also a depository participant with National Securities Depository Ltd (NSDL) and Central Depository Services Ltd.(CDSL). Dynamic is engaged in the business of Stock Broking, Depository Services, Investment Advisory Services and Portfolio Management Services. Dynamic Equities Pvt. Ltd. is holding company of Dynamic Commodities Pvt. Ltd. , a member of Multi Commodities Exchange (MCX) & National Commodity & Derivatives Exchange Ltd.(NCDEX). We hereby declare that our activities were neither suspended nor we have defaulted with any stock exchange authority with whom we are registered. SEBI, Exchanges and Depositories have conducted the routine inspection and based on their observations have issued advise letters or levied minor penalty on for certain operational deviations. Answers to the Best of the knowledge and belief of Dynamic/ its Associates/ Research Analyst who prepared this report
DYANMIC/its Associates/ Research Analyst/ his Relative have any financial interest in the subject company? No
DYANMIC/its Associates/ Research Analyst/ his Relative have actual/beneficial ownership of one per cent or more securities of the subject company? No
DYANMIC/its Associates/ Research Analyst/ his Relative have any other material conflict of interest at the time of publication of the research report or at the time of public appearance? No
DYANMIC/its Associates/ Research Analyst/ his Relative have received any compensation from the subject company in the past twelve months? No
DYANMIC/its Associates/ Research Analyst/ his Relative have managed or co-managed public offering of securities for the subject company in the past twelve months? No
DYANMIC/its Associates/ Research Analyst/ his Relative have received any compensation for investment banking or merchant banking or brokerage services from the subject company in the past twelve months? No
DYANMIC/its Associates/ Research Analyst/ his Relative have received any compensation for products or services other than investment banking or merchant banking or brokerage services from the subject company in the past twelve months? No
DYANMIC/its Associates/ Research Analyst/ his Relative have received any compensation or other benefits from the Subject Company or third party in connection with the research report? No
DYANMIC/its Associates/ Research Analyst/ his Relative have served as an officer, director or employee of the subject company? No
DYANMIC/its Associates/ Research Analyst/ his Relative have been engaged in market making activity for the subject company? No
General Disclaimer: - This Research Report (hereinafter called “Report”) is meant solely for use by the recipient and is not for circulation. This Report does not constitute a personal recommendation or take into account the particular investment objectives, financial situations, or needs of individual clients. The recommendations, if any, made herein are expression of views and/or opinions and should not be deemed or construed to be neither advice for the purpose of purchase or sale of any security, derivatives or any other security through Dynamic nor any solicitation or offering of any investment /trading opportunity on behalf of the issuer(s) of the respective security (ies) referred to herein. These information / opinions / views are not meant to serve as a professional investment guide for the readers. No action is solicited based upon the information provided herein. Recipients of this Report should rely on information/data arising out of their own investigations. Readers are advised to seek independent professional advice and arrive at an informed trading/investment decision before executing any trades or making any investments. This Report has been prepared on the basis of publicly available information, internally developed data and other sources believed by Dynamic to be reliable. Dynamic or its directors, employees, affiliates or representatives do not assume any responsibility for, or warrant the accuracy, completeness, adequacy and reliability of such information / opinions / views. While due care has been taken to ensure that the disclosures and opinions given are fair and reasonable, none of the directors, employees, affiliates or representatives of Dynamic shall be liable for any direct, indirect, special, incidental, consequential, punitive or exemplary damages, including loss profits arising in any way whatsoever from the information / opinions / views contained in this Report. The price and value of the investments referred to in this Report and the income from them may go down as well as up, and investors may realize losses on any investments. Past performance is not a guide for future performance. Dynamic levels do not provide tax advice to its clients, and all investors are strongly advised to consult with their tax advisers regarding taxation aspects of any potential investment. Opinions expressed are our current opinions as of the date appearing on this Research only. We do not undertake to advise you as to any change of our views expressed in this Report. User should keep this risk in mind and not hold dynamic levels, its employees and associates responsible for any losses, damages of any type whatsoever. Dynamic and its associates or employees may; (a) from time to time, have long or short positions in, and buy or sell the investments in/ security of company (ies) mentioned herein and it may not be construed as potential conflict of interest with respect to any recommendation and related information and opinions. Without limiting any of the foregoing, in no event shall Dynamic and its associates or employees or any third party involved in, or related to computing or compiling the information have any liability for any damages of any kind. We and our affiliates/associates, officers, directors, and employees, Research Analyst(including relatives) worldwide may: (a) from time to time, have long or short positions in, and buy or sell the securities thereof, of company (ies) mentioned herein or (b) be engaged in any other transaction involving such securities and earn brokerage or other compensation or act as a market maker in the financial instruments of the subject company/company (ies) discussed herein or act as advisor to such company (ies) or have other potential/material conflict of interest with respect to any recommendation and related information and opinions at the time of publication of Research Report. Dynamic may have proprietary long/short position in the above mentioned scrip(s) and therefore may be considered as interested. The views provided herein are general in nature and does not consider risk appetite or investment objective of particular investor; readers are requested to take independent professional advice before investing. This should not be construed as invitation or solicitation to do business with Dynamic. Dynamic Equities Pvt. Ltd. are also engaged in Proprietary Trading apart from Client Business.
https://www.dynamiclevels.com/en/disclaimer