Embed Size (px)
Citation preview

Economic and social confl icts concerning
subjective well being


Economic and social confl icts concerning
subjective well being
Editors: Zoltán Bugovics
andPéter Tóth
L’Harmattan France7 rue de l’Ecole Polytechnique
75005 ParisT.: 33.1.40.46.79.20
L’Harmattan Italia SRLVia Bava, 37
10124 Torino–ItaliaT. / F.: 011.817.13.88
ISBN 978-963-236-981-5
Editor in chief: Ádám GyenesL’Harmattan Hungary
1053 Budapest, Kossuth L. u. 14–16.Telefon: 267-59-79
Cover design: Kára László Design Kardos Gábor,
Printed and bound by Robinco Kft.
This book titled „Economic and social confl icts subjective well being concerning” has been supported by No. TÁMOP-4.2.2.A-11/1/KONV-2012-0069 project,
sponsored by the European Union and the Hungarian State, co-fi nanced by the European Social Fund.
Editors: Zoltán Bugovics, Péter TóthAuthors: Zoltán Bugovics, Zoltán Csizmadia, Tamás Dusek,
Helga Horváth, Péter Róbert, Péter Tóth
Scientifi c lector: Antal Bőhm
INVESTING IN YOUR FUTURE
European SocialFund

5
Contents
Foreword . . . . . . . . . . . . . . . . . . . . . . . . . . . . . . . . . . . . . . . . . . . . . . . . . . . . . . 9
Theoretical Foundation of Social Confl ict Research New Points of View and Fields of Research . . . . . . . . . . . . . . . . . . . . . . . 17
1. Introduction . . . . . . . . . . . . . . . . . . . . . . . . . . . . . . . . . . . . . . . . . . . . . . 172. A few new basic points of the confl ict-theoretical approaching method . . . . . . . . . . . . . . . . . . . . . . . . . . . . . . . . . . . . . . . 183. The theoretical position of confl ict theory and problem fi elds in confl ict . . . . . . . . . . . . . . . . . . . . . . . . . . . . . . . . . . . 204. The main research fi elds of social confl icts these days . . . . . . . . . . 235. The conceptual framework of the social problem . . . . . . . . . . . . . . 276. The logical structure of a possible confl ict-research approach . . . . . . . . . . . . . . . . . . . . . . . . . . . . . . . . . . . . . . . . . . . . . . . . . 297. Summary . . . . . . . . . . . . . . . . . . . . . . . . . . . . . . . . . . . . . . . . . . . . . . . . . 31
Correlation of Well-being with Socio-Demographic Factors . . . . . . . . . 331. Introduction . . . . . . . . . . . . . . . . . . . . . . . . . . . . . . . . . . . . . . . . . . . . . . 332. Examination of subjective well-being . . . . . . . . . . . . . . . . . . . . . . . . 35
2.1 Concept of subjective well-being . . . . . . . . . . . . . . . . . . . . . . . . . 352.2 Measurements of subjective well-being . . . . . . . . . . . . . . . . . . . 38
3. Subjective well-being: condition of the Hungarian society . . . . . . . . . . . . . . . . . . . . . . . . . . . . . . . . . . . . . . . . . . . . . . . . . . . 39
3.1 International comparison, temporal changes . . . . . . . . . . . . . . 393.2 The Hungarian situation in 2013 . . . . . . . . . . . . . . . . . . . . . . . . . 43
4. The socio-demographic background of subjective well-being . . . 475. Summing up the results . . . . . . . . . . . . . . . . . . . . . . . . . . . . . . . . . . . . 53
Urban-Rural Differences in Neighborhood Satisfaction, Trust and Happiness in Hungary . . . . . . . . . . . . . . . . . . . . . . . . . . . . . . . . . . . . . 57
1. Introduction . . . . . . . . . . . . . . . . . . . . . . . . . . . . . . . . . . . . . . . . . . . . . . 572. General conceptual and methodological questions . . . . . . . . . . . . 58
2.1 Defi nition of neighborhood . . . . . . . . . . . . . . . . . . . . . . . . . . . . . . 582.2 The spatial level of analysis . . . . . . . . . . . . . . . . . . . . . . . . . . . . . 592.3 The spatial factor, as a unique explanatory variable . . . . . . . . 60

6
2.4 Measurement of trust and happiness . . . . . . . . . . . . . . . . . . . . . 612.5 The abundance of general literature of the subject . . . . . . . . . . 62
3. Empirical analysis . . . . . . . . . . . . . . . . . . . . . . . . . . . . . . . . . . . . . . . . . 643.1 Neighborhood satisfaction . . . . . . . . . . . . . . . . . . . . . . . . . . . . . . . 643.2 The trust . . . . . . . . . . . . . . . . . . . . . . . . . . . . . . . . . . . . . . . . . . . . . . 703.3 The happiness . . . . . . . . . . . . . . . . . . . . . . . . . . . . . . . . . . . . . . . . . 72
A Few Characteristics of the Problems in the Private Life and in the Social Relationshipsand of the Resulting Confl icts . . . . . . . . 75
1. Introduction . . . . . . . . . . . . . . . . . . . . . . . . . . . . . . . . . . . . . . . . . . . . . . 752. Methodological questions – possibilities of measuring problems/confl icts in the private life with questionnaires . . . . . . . 783. The basic characteristics of problem indicators . . . . . . . . . . . . . . . . 814. Connection of problem and confl ict situations . . . . . . . . . . . . . . . . . 915. Social characteristics of groups with private problems and confl icts . . . . . . . . . . . . . . . . . . . . . . . . . . . . . . . . . . . . . . . . . . . . . . 936. Correlation between confl ict load and wealth . . . . . . . . . . . . . . . . 1017. Summary . . . . . . . . . . . . . . . . . . . . . . . . . . . . . . . . . . . . . . . . . . . . . . . . 105
The Characteristics of Well-being from the Perspective of Spatial-Social Attachments and Social Relationships . . . . . . . . . . . . 107
1. Introduction . . . . . . . . . . . . . . . . . . . . . . . . . . . . . . . . . . . . . . . . . . . . . 1072. Theoretical background . . . . . . . . . . . . . . . . . . . . . . . . . . . . . . . . . . . 1073. Well-being and attachment . . . . . . . . . . . . . . . . . . . . . . . . . . . . . . . . 1104. Results of the examination . . . . . . . . . . . . . . . . . . . . . . . . . . . . . . . . . 114
4.1. Patterns of space and attachment . . . . . . . . . . . . . . . . . . . . . . . 1144.2. Satisfaction, happiness and attachment . . . . . . . . . . . . . . . . . . 1174.3. Type of settlements and attachment . . . . . . . . . . . . . . . . . . . . . 1294.4. Genders, age groups and attachment patterns . . . . . . . . . . . . 1314.5. Importance of social relationships . . . . . . . . . . . . . . . . . . . . . . 1334.6. Environment and attachment . . . . . . . . . . . . . . . . . . . . . . . . . . 1364.7. Happiness and attachment . . . . . . . . . . . . . . . . . . . . . . . . . . . . . 1374.8. Trust and attachment . . . . . . . . . . . . . . . . . . . . . . . . . . . . . . . . . . 1404.9. Satisfaction and attachment . . . . . . . . . . . . . . . . . . . . . . . . . . . . 143
5. Summary . . . . . . . . . . . . . . . . . . . . . . . . . . . . . . . . . . . . . . . . . . . . . . . 150
Factors of subjective safety in Hungary . . . . . . . . . . . . . . . . . . . . . . . . . 1561. Introduction . . . . . . . . . . . . . . . . . . . . . . . . . . . . . . . . . . . . . . . . . . . . . 1562. The crime situation in Hungary and the European trends . . . . . . . . . . . . . . . . . . . . . . . . . . . . . . . . . . 157
2.1 The subjective judgement of the crime situation in Hungary . . . . . . . . . . . . . . . . . . . . . . . . . . . . . . . . . . . . . . . . . . . . 1592.2 Opinions about the background of the causes of crimes . . . . . . . . . . . . . . . . . . . . . . . . . . . . . . . . . . 163
3. The theoretical model of the factors, which determine the fear of crime . . . . . . . . . . . . . . . . . . . . . . . . . . . . . . . . . . . . . . . . . . 165
3.1 The dimensions of the theoretical model . . . . . . . . . . . . . . . . . 1663.2 Measurability of the dimensions of the theoretical model . . . . . . . . . . . . . . . . . . . . . . . . . . . . . . . . . 169
4. Analysis of factors, which determine the fear of crime according to the results of the survey . . . . . . . . . . . . . . . . . . . . . . . 1725. Further possibilities in the research of this topic . . . . . . . . . . . . . . 177
References . . . . . . . . . . . . . . . . . . . . . . . . . . . . . . . . . . . . . . . . . . . . . . . . . . . 179


9
ForewordZOLTÁN BUGOVICS
This volume is the summary of a basic research, which was carried out in 20131 and contains the main outcomes of the disclosure of the socio-eco-nomic confl icts. The central statement of the research goal in the area of the social confl icts, based on four subprojects2, is that these infl uence the competitiveness of a country regarding both economic and social aspects. And with the disclosure of these confl icts a new model of competitiveness can be developed, based on a new complex approach for the creation of an inclusive, affl uent society and for the strengthening of the cultural cohesion of the majority society. The studies of this volume are based on the analy-sis of a national representative survey questionnaire, which was carried out by the Institute of Social Research Tárki at the end of the year, in 2013.
Certainly, this study does not offer a complete conceptual framework for the representation of all four issues and examinations. However, it deals strictly with the analysis of the socio-economic inequalities, with the dis-closure of the sources of the resulting confl icts and with the discussion of the consequences, based on the development of the index of subjective well-being. These can help eliminate or moderate the obstacles of the so-cio-economic development, caused by confl icts. This is one of the reasons why the emphasis of the social and economic subsystems and the analysis of the confl icts and factors of well-being in these subsystems are impor-tant. Thus, the fi rst component of the research is the disclosure and iden-tifi cation of the inequalities, resulting from the two subsystems. Further-more, it has been formulated, as one of the important principles, that the border between the social and economic confl icts is a rarely researched
1 The study was supported by the operative program TÁMOP-4.2.2.A-11/1/KONV-2012-0069 Social confl icts – social well-being and safety, competitiveness and social develop-ment.2 Subproject I: Disclosure and mitigation of the confl icts of economic and social subsys-
tems. Subproject II: Development of a new competitiveness model, based on a complex ap-
proach. Subproject III: Creation of the foundation of an inclusive, well-being society. Subproject IV: Strengthening the cultural cohesion between the national and ethnical
minorities and the majority society.

10
area. At this point it is important to emphasize how essential the Stiglitz-Re-port (2009) is, which interprets well-being, in contrast to the value of the GDP, in eight dimensions: material living conditions; health conditions; educational level; work; political participation and representation; social and individual relationships; environment; economic and physical safety.
For the examination of economic and social confl icts the following methods have been applied: within the theoretical framework, the related Hungarian and international literature has been summarized and within the framework of empirical examination, a representative national survey with 2000 persons has been carried out. For the exploration of the connec-tions of social confl icts and safety, an additional examination of the sub-jective feeling of safety, based on comparative statistical data analysis, has been carried out.
The exploration of the connections between social confl icts and spatial inequalities is an important goal of the scientifi c research. The previous studies have revealed the effect of spatial differences in generating confl icts. The connections are, however, not unambiguous, since inequalities in Hungary today are far more severe than the resulting social confl icts and social confl icts appear not in the most disadvantaged regions, but in areas populated by people with a higher social status. Therefore, the research examines the problems of the spatial inequalities in that way that, contrary to the methods applied previously, it explores those other historical, social, economic and cultural (subcultural) dimensions, which are transmitted, overshadowed or even generated by the specifi c areas.
The volume can be divided, based on the logic of the research, on the following main structural elements: after a theoretical introduction there is a paper about well-being and socio-demographic relationships, after that there are two studies about the problems of areal-residential confl icts. Afterwards the topics labour market, income and cultural aspects will be explained, which are followed by in-depth analyses of private and social confl icts and the group of analyses will be completed, as a kind of specif-ic topic, by a paper, which refl ects on the feeling of safety. All studies are based on a common methodological guideline and these aspects were applied already at the editing the elements of the questionnaire. If talking about a common base in connection with confl icts and well-being, the use of a uniform index of subjective well-being should be emphasized, which was utilized at the writing of almost all of the studies. This subjective index of well-being considers, besides the satisfaction, the presence of positive

11
emotions and the lack of negative emotions as crucial. The framework in the category satisfaction is to be considered from the life of the individual, as a starting point, his/her residential environment or even his/her set-tlement up to the national economic, political and social processes. In the case of positive feelings there is also a broad spectrum on the basis of the measurements, as for example happiness, in connection to many things, such as in connection to life, work or family. And fi nally the lack of nega-tive emotions is also a variable, which can be measured, since the lack of temper, sadness or depression and the lack of confl icts with neighbours or colleagues is also a valuable aspect. Besides, an index of residence and main component residence have been developed, which could be taken into consideration in the analyses at the level of settlements, the satisfaction with the residential area and the examinations of attachments.
Considering the whole structure of the studies a step-like system can be observed. After the formulation of the theoretical bases and background, the condition of well-being of the Hungarian society will be overviewed in an international comparison and the situation in 2013 will be empha-sized.
The writing of Zoltán Csizmadia offers the reader, as a theoretical foun-dation, an insight into the topic with an impressive confl ict theoretical background and serves as a kind of orientation. The aspects of the various confl ict-theoretical and social confl ict approaches are compared to the related guidelines of the scientifi c researches and in relation to the entries of encyclopaedias and the list of fi elds, which are published in scientifi c collections. As a whole, it can be pointed out that this is about a current subject area, especially if the topic list with 55 topics of the problem areas of confl ict research will be taken as a basis. Confl icts are the inevitable consequences of the social being and development and at the same time they play a role in the mechanisms of the well-being as well. Our social confl icts can be divided from a constructive aspect in a subjective and in an objective approach, which create, as a matrix, the conceptual framework of the social problems.
The basis of this scientifi c approach is that social confl icts are brought into life and increased by the socio-economic inequalities, which can lead to the reduction of well-being. Considering all of these theoretical back-grounds, this examination analyses this issue along fi ve contentual di-mensions (demographic, private, work, residential and power-institu-tional).

12
The examination of correlation of well-being with the socio-demograph-ic factors has proven that regarding men and women there is no signifi cant difference regarding sense of well-being. The young people have the highest averages of well-being and this is decreasing with the advance of age, not linear, though, that is that the data show the lowest values in the case of persons in their fi fties and above 70. However, from another aspect, not the pensioners but rather the unemployed can be characterized by the lowest value of the feeling of well-being. It can be observed along the ed-ucational level that the value of the index of subjective well-being is de-creasing along low educational level and unskilled work. It could be proven as well that a good income situation improves well-being, where-as the deterioration of fi nancial circumstances infl uences well-being neg-atively. It can be proven that satisfaction with the residence as well as feeling healthier improves the level of well-being signifi cantly.
It can be claimed, synchronous with the previous statements, in con-nection to the private and social-relationship problems and a few charac-teristics of the arising confl icts, that material living conditions are deter-minant in the everyday confl icts and a higher social status mitigates the confl icts. It is interesting that most confl icts are linked to the working environment and to the partnerships and the most balanced relationships occur along friendly and family relations and as people need a support in solving confl icts they activate the same relationships. It has turned out from the survey that almost one quarter of the population was already confronted with negative attitudes towards life, like being ignored or despised. Those people, who have a lot of diffi culties coping with their problems, can be characterized by a more complex confl ict system and the lower the social segment is examined the more the superposition of chal-lenges and confl icts and the deterioration of life expectations increases and accumulates.
The analysis comes to important objective and subjective fi ndings along the demographic variables, like age groups, educational level and social status, residence and residential area. Considering the hierarchy of types of settlements, the dimensions of happiness, trust and satisfaction also appear as a difference and the reader can be confronted by differences, which can be measured between cities and villages. The most striking difference between city and village is the homelessness and the mildest difference is the increase of poverty, which is not necessarily a regional problem but can be considered as a social element, which can also have
13
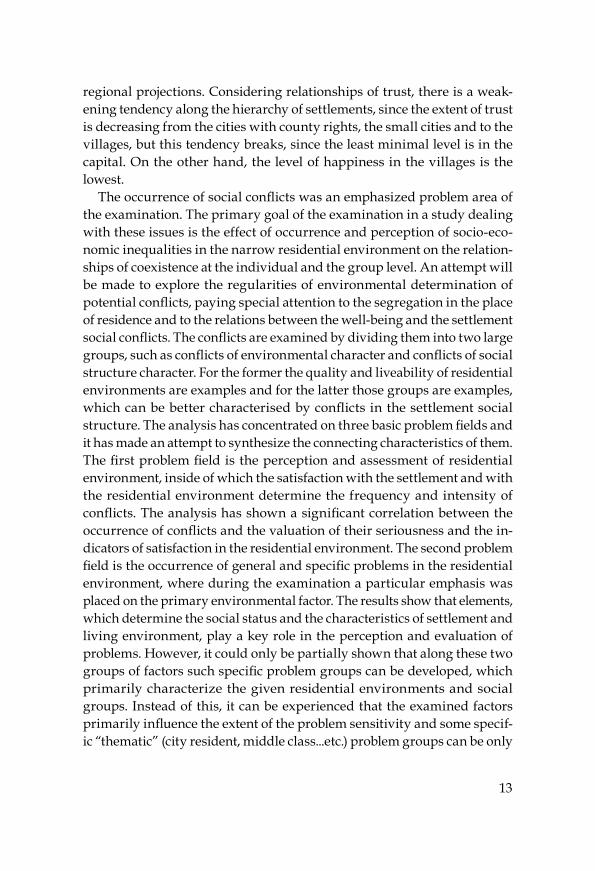
regional projections. Considering relationships of trust, there is a weak-ening tendency along the hierarchy of settlements, since the extent of trust is decreasing from the cities with county rights, the small cities and to the villages, but this tendency breaks, since the least minimal level is in the capital. On the other hand, the level of happiness in the villages is the lowest.
The occurrence of social confl icts was an emphasized problem area of the examination. The primary goal of the examination in a study dealing with these issues is the effect of occurrence and perception of socio-eco-nomic inequalities in the narrow residential environment on the relation-ships of coexistence at the individual and the group level. An attempt will be made to explore the regularities of environmental determination of potential confl icts, paying special attention to the segregation in the place of residence and to the relations between the well-being and the settlement social confl icts. The confl icts are examined by dividing them into two large groups, such as confl icts of environmental character and confl icts of social structure character. For the former the quality and liveability of residential environments are examples and for the latter those groups are examples, which can be better characterised by confl icts in the settlement social structure. The analysis has concentrated on three basic problem fi elds and it has made an attempt to synthesize the connecting characteristics of them. The fi rst problem fi eld is the perception and assessment of residential environment, inside of which the satisfaction with the settlement and with the residential environment determine the frequency and intensity of confl icts. The analysis has shown a signifi cant correlation between the occurrence of confl icts and the valuation of their seriousness and the in-dicators of satisfaction in the residential environment. The second problem fi eld is the occurrence of general and specifi c problems in the residential environment, where during the examination a particular emphasis was placed on the primary environmental factor. The results show that elements, which determine the social status and the characteristics of settlement and living environment, play a key role in the perception and evaluation of problems. However, it could only be partially shown that along these two groups of factors such specifi c problem groups can be developed, which primarily characterize the given residential environments and social groups. Instead of this, it can be experienced that the examined factors primarily infl uence the extent of the problem sensitivity and some specif-ic “thematic” (city resident, middle class...etc.) problem groups can be only

14
remotely identifi ed. Finally, the third segment has concentrated on the occurrence, intensity and change of confl icts. In this case the existence of confl icts between the various social groups and the impact of the presence of possibly affected social groups and their segregation in the residential area on these confl icts was examined. Basically, it can be seen that where-as in the case of a lower social status the perception of confl icts based on “more obvious” factors (age, status in the labour market, fi nancial situation) is stronger. In the case of persons under more favourable circumstances more abstract problems (such as political-institutional, areal, legal problems) occur at a relatively greater extent, which identifi cation in their specifi c form is more diffi cult.
The research, connected tightly to the settlement and residential envi-ronment, compared attachments with the elements of well-being and confl icts from many aspects. With the examination of layered spatial categories (neighbourhood, settlement, surroundings, region, nation, Europe) an answer for the question, which patterns can be shown along attachment, satisfaction, happiness, trust and social relationships was searched. The strongest correlation could be observed between the social relationships and the attachments, be it in the relation of the categories settlement, nation or Europe. Neighbourhood, as a spatial category of at-tachment, has deviated from the streams of data and it could be explained by the question about confl icts that where the relationship with the neigh-bours was not burdened by confl icts the rate of attachment was high and it was otherwise low.
The results have shown that the factors of happiness, satisfaction and trust are creating a stronger attachment, but the signifi cance cannot be proven in each case. The attachment to the different socio-spatial factors can generally be regarded as stable and the elements of well-being are strengthening the attachment.
The research of subjective feeling of safety is a multidisciplinary issue of the last fi fty years and it is connected to criminology, sociology, psy-chology, political science and law. The Hungarian research of the last years paid a lot of attention to the spatial aspects of crime and committing a crime. Although, it is well known from the statistics that the number of crimes, which have increased since the political transformation, are still below the European average in Hungary and the country can be considered as moderately infected. However, the perception and the clear-sightedness of the people regarding crime are infl uenced signifi cantly by other dimen-

15
sions as well. Subjective feeling of safety is an important aspect of confl ict research, because it is about a perception, which penetrates the everyday life of citizens considerably. However, the subjective feeling of safety can differ in many areas from the research, which is based on the offi cial sta-tistics. Part of the citizens will not fi le a police report if they have been affected by miner criminal activity only, because they believe that it is unlikely that the criminal offender will be identifi ed. Nevertheless, it is still worth to analyse the correlations between confl icts and crimes com-paratively, considering county statistics as well.
The research is based on the representation of effects of major socio-de-mographic characteristics behind people’s personal experiences and be-lieves. It illustrates and exposes the situation of crime in Hungary, com-paring it to the trends in the European Union and its correct or distorted judgement in the Hungarian society. The research compares the objective data of settlement related, national and county statistics of the last six years to the subjective opinion of the questioned individuals relating to their own community. It turns out that 45% of the Hungarian population believes the crime situation of their own community being better than reality. Especially the population of the capital tends to misconceive the situation, where a signifi cant proportion of the questioned believes the crime situa-tion of the capital being much better, than it actually is. In contrast to this is the population of the villages, where a large number of people draw a much worse picture about their community than the national average. This means that the placement of the own community in a reference system is signifi cantly infl uenced by the type of settlement and the spatial location of the peer groups.
Also within this issue, the research attempts to conceptualize and op-erationalize factors, which infl uence the fear of crime, based on the current international literature. It is an interesting relationship that those confl icts and elements of well-being (related to settlement or health, mental, sub-jective, objective) presented as the main topics of this volume are among those dimensions, which determine the extent of fear of crime. It can in this case also be shown that the previously widespread opinion appears to be right, according to which the perception of a person, who experienced a crime or was informed about a crime by his/her immediate environment, will be much more negative, than the perception of those, who did not have such experiences. Besides that, the strongest relationship was proven between the judgement of the condition of the built environment and the
16
residential factors on the development of fear of crime. This confi rms the effect and the applicability of the theories of broken windows, used by the conservative criminology.
According to the intention of the participants, the research with this volume has not been fi nished yet, but it has just been started. This is sup-ported by the fact that further studies are being prepared, moreover a volume will be published soon, as part of a monograph, which also includes the data of this study. The research group will continue working and will carry out further analyses of the database and comparative studies, which will in the future result in a series of further publications and confer-ence-presentations.

17
Theoretical Foundation of Social Confl ict Research New Points of View and Fields of ResearchCSIZMADIA ZOLTÁN
1. Introduction
Social confl icts of certain kind of levels and forms arising from social diffe-rences and inequalities and interweave deeply the everyday life. They (can) show in their form, manifestation and effects a close correlation to the so-cial well-being (or to the lack of it). In spite of this, a more thorough exami-nation of these questions, based also on theoretical and empirical work, cannot be considered as a systematic, coherent research program, neither in the national nor in the international sociological research.
This can be explained by at least three fundamental problems. Firstly, the term of social confl ict is unexplained, plastic and has different inter-pretations, which makes it diffi cult working with it. Secondly, the confl ict theory, as a fundamental sociological and social paradigm, has lost sig-nifi cantly from its function of inducing and guiding research, in the last three decades. Additionally, it has reached out its theoretical “arms” in form of mosaic-like, postmodern theories in a lot of directions, causing further diffi culties on the level of empirical research. The third problem is that there are surprisingly only a few quantitative researches about the different forms, characteristics and effects of social confl icts on the level of individuals, households or the whole society.
The focus of a current research project is on confl icts, which arise from socio-economic inequalities and have an effect on social life. This question will be examined with a nationwide, representative, large sample survey (N = 2031 persons) in fi ve confl ict dimensions (confl icts in private life–so-cial life, regional–place of residence, labour market-income, power-insti-tution) on the level of the individual, group and the whole society. Therefore, it is a particularly important step to overview the above mentioned theo-retical problems. The foundation of this process can be from our previous-ly published research papers about this subject matter (Csizmadia 2007;

18
Csizmadia 2009). In these works, without claiming to be exhaustive, the following topics have been reviewed: the most important questions about the term social confl ict, the different conceptual approaches (Boudon 1998; Collins 1974; Coser 1956; Cseh-Szombathy 1985; Turner 1982), the basic principles of conception method of confl ict theory in the sociology, laid down by Dahrendorf (1959), possible forms and types of confl icts, the basic principles of classifying and the positive and negative functions of social confl icts. Based on these conclusions, in this paper the new developments, the new interpretations of confl icts and tendencies from the last decade will be summarised.
2. A few new basic points of the confl ict-theoretical approaching method
The fi rst problem is the immensely far-reaching, complex and often cont-roversial characteristic of the term and the theoretical framework. Thus, it is worth starting the conceptual foundation with an overview of thema-tisation and placement of the concept on the meta-theoretical level by to-day’s social theory.
Confl ict theory used to be connected with Marxist and neo-Marxist theories, which appeared as a reaction to the functionalist and positivist theoretical traditions. On the contrary, in the paradigm system of today’s social science this perspective can rather be described as a conceptual, theoretical network of much more complex, interconnected theoretical fi elds. An approach on confl ict theoretical foundation is also applied by the followers of the critical theory, the feminist theory, the postmodern theory, the post-structuralist theory, the post-colonial theory, the world-sys-tems theory, the queer theory – only to mention the largest theoretical fi elds.
A consequence of this is the problem that the paradigmatic baselines, which can be regarded as the common core of the confl ict theoretical ap-proach, have been signifi cantly disarranged since the classical period and it can be very diffi cult to unite them as a uniform guiding principle. Only a few common points remained, which can be used as a kind of sound basis for empirical researches with such focus. Alan Sears (2008: 34-36) has pointed out the prominent role of the following common theoretical corner points as a pre-hypothesis in his study:

19
− The societies can be apprehended in the form of confl icts caused by inequalities and not as a guardian of order and consensus. Social inequalities lead inevitably to confl icts. Therefore, this can be regard-ed as the fundamental characteristics of social organizations, contrary to stability and harmony.
− Confl icts caused by inequalities can be solved by transformation of today’s social relationships solely up to the bases. Thus, the new social relationships and interactions can be only developed by confl icts.
− The structural interest of social groups, which are currently at dis-advantage, is to intervene against the ruling conditions, which is in this way one of the important driving forces of social changes and transformations. In this sense, those groups, which are suppressed, excluded and at a disadvantage have to be treated as active agents and not as passive subjects of sympathy and compassion.
− No talk about real social consensus is possible. As a matter of fact, the dominant groups are able to enforce and to make the majority accept their conceptions, interests, ideology and even discourses.
− A theory is not just a neutral tool of explanation or a sequence of thought to maintain and legitimate the current social establishment, but it has also critical characteristics and it is also an active component, which brings human potential to the fullest and move the society to change (to transfer) (Sears 2008: 34-36).
Thus, the key terms are inequalities, confl ict, change, new social rela-tions, active agent, suppression masked as consensus, critical attitudes...etc. A similar theoretical basic concept appears in the work of Sanderson (2007: 662). He makes a distinction between four fundamental presuppo-sitions of the confl ict theory:
− The confl ict or fi ght is the essence and substantial component of social life because it develops among individuals and groups, which have different interests and/or competition with each other for the scarce resources.
− A lot of different kind of competitions and confl icts can be observed in our everyday life. Primarily, the power and the economic resourc-es are the main sources of confl icts.
− A confl ict appears typically as a few individuals or groups infl uence and control others.
− The dominant groups have a particular infl uence on the distribution of the resources and on the development/transformation of the struc-ture of the whole society (Sanderson 2007: 662).

20
The presuppositions, which can be considered as a common base, demonstrate the fundamental relationship system behind the arising problems in this research: economic and social inequalities create social confl icts, which fundamentally infl uence everyday social interactions on the level of individuals, families, communities and larger groups and in-stitutions as well. Therefore, the perception of inequalities and social confl icts and the examination of attitudes towards them have an important role because by this also the factors behind the present forms of social behaviour can be understood better.
3. The theoretical position of confl ict theory and problem fi elds in confl ict
In the last two decades, disintegration of a confl ict theoretical approach or its integration and/or absorption in other theoretical approaches can be observed. The goal with this overview of a few new and crucial stan-dard works is to show, according to the newest, relevant reference mate-rials, how the question of social confl icts is thematised in professional dis-courses.
In the new encyclopaedia of social theory (Ritzer 2005) Jonathan H. Turner wrote the entry about confl ict theory (Turner 2005: 134-139). Turner distinguishes three main classical fi elds of confl ict theory. These fi elds are the Neo-Marxism, the Neo-Weberianism and the Historical Comparative fi eld. These fi elds have, however, fl ourished in the seventies, based on their critical refl exions on the functional paradigm. According to his point of view, confl ict theory became insomuch a part of the mainstream of social theory (mainstream theory) that there is no need to hang an extra label on this theory. This can be called even as dissolution by integration. In fact, as the central core or basis of the most theoretical fi elds, the position can be considered that social inequalities play a crucial role in understanding and analysis of the allocation of different resources. Also, the issues of social tensions and confl icts on the individual, group, institutional and communal level, arising from these social inequalities, are inevitable parts of theories these days. This new position is illustrated properly by the time interval of the referred literature of the entry, which is almost exclusively from the sixties and seventies. The list of the other entries in the encyclo-paedia in connection with this topic, regarding the main connection points

21
is also remarkable: globalization, historical-comparative theory, power, revolution, social class, theory of social movements, state and world-system theory.
The comprehensive sociological interpretation of these problems can be found in the newest international encyclopaedia of social and behaviour-al sciences (Smelser – Baltes 2001) under the entry „confl ict sociology” (Crouch 2001). Also Crouch talks about the disintegration and disappear-ance of the labelled confl ict sociology around the millennium. The inter-pretation of confl icts in western sociology has headed these days, accord-ing to his perception, towards regarding confl icts as a fundamental component of social relationships and not as a specifi c, particular aspect of social life. The more appear confl icts as normal and everyday incidents, the more will be pushed a specifi c theory, which focuses on them, into the background. This conclusion will also be confi rmed by his classifi cation of the fi elds of confl ict theory (Crouch 2001: 2555).
According to Crouch there is a confl ict on the most general level, if the interests of two or more social actors cannot be reconciled; this is the base of the confl ict as a social relationship. However, on the theoretical level, these relationships can be decomposed into four larger dimensions with the use of two basic “variables”. A difference can be made between confl icts of considerable importance (momentous) and everyday, daily (mundane) confl icts, or they can be perceived as extraordinary (exceptional), occa-sionally or widely spread (endemic) confl icts. As a consequence of these, the theories, dealing with confl icts, have to make two fundamental choic-es. On the one hand, a decision has to be made about whether normal social life is burdened with confl icts or those confl icts are only exception-al, individual incidents, which arise from the inappropriate functioning of the society. Thus, the existence or even the lack of confl icts can be re-garded as a pathological case? On the other hand, it also has to be consid-ered, whether the occurring confl icts will be approached primarily as a momentous event of considerable importance or as a mundane incident, which is a part of everyday life. From this, a four-cell matrix can be drawn, which is a heuristic tool of visualization of the positions and focuses of the different fi elds (Figure 1).

22
Figure 1: System of the main confl ict theoretical fi elds
Source: Crouch 2001: 2555.
These days the interpretation of confl icts has been shifted towards the corner of cell IV, which can be treated as the neo-Weberian sociological tradition. This became the dominant approach of the Western sociology regarding the theoretical understanding of meaning, forms, characteristics and effects of social confl icts.
The relevant entries of the encyclopaedia are expressive also in this case, regarding the hubs in which the issues of social confl icts emerge out of the network of professional clouds of the problems of social sciences: confl ict management, social psychology of confl icts, confl ict and war, ar-chaeology and anthropological aspects of confl icts, confl ict and consensus, organisational confl icts, psychology of cooperation and competition, eth-nical confl icts, racial and gender differences, violence, sociology of war.
For an interpretation of confl icts within sociology, the best starting point can be the new Blackwell encyclopaedia (Ritzer 2007). In this ap-proach, the comparison of the two main schools (neo-Marxism and neo-We-berianism) plays the main role. Additionally, the questions of confl icts

23
regarding stratifi cation, class antagonism, crime, racial and ethnical con-fl icts, dependency theories and the critical theory will be presented in form of separate entries. According to Stephen K. Sanderson (the author of the entry), confl ict theory is alive and it fl ourishes these days too. It is an important fi eld of the modern sociology and many sociologist approach social questions within this framework (Sanderson 2007: 665).
To decide about how true this statement is, however, the questions of social confl icts have to be put in a broader perspective. Accordingly, it is worth overviewing in which areas of the sociology interpretation of con-fl icts plays a role these days and with which professional fi elds the study of confl icts can be combined.
4. The main research fi elds of social confl icts these days
For answering the question, the new sociological encyclopaedia, previously referred to, will be applied (Ritzer 2007). In this work, with more than 5000 pages, there are altogether 70 entries for the combination of words „social confl ict” and 1768 entries for the expression „confl ict”. Thus, almost every third page on average has an occurrence. The purpose of the analysis of the content is to fi nd out the topics, in connection with which the expres-sion “confl ict” appears and to detect the research areas of sociological examination of social confl icts, through this.
The fi rst surprising thing is that there are only very few references in form of entries, in the work of 10 volumes, to the social confl icts. The ex-pression “confl ict” appears only in the titles of eight entries, as the ency-clopaedia deals with the more important confl ict-research fi elds, which are popular these days:
– confl ict theory– theory of crime and confl icts– family confl icts– inter-generation confl icts– world confl icts
– class confl icts– racial and ethnical confl icts– stratifi cation: theories based on func-
tionalism and confl icts
On the contrary, considering the whole content of the encyclopaedia, a picture of a research fi eld, which is indeed very wide-ranging, can be seen (Figure 1). After having overviewed the more than 1500 entries, the more important and relevant points have been highlighted. The disintegration

24
effect, previously introduced, which is the fi nal integration of the aspects of confl icts in the social discourse, has already taken place. Therefore, it is in fact diffi cult to highlight a specifi c area (probably besides the theoreti-cal line of research), which would require a separate labelling. The list below confi rms the assumption that research of confl icts does not mean the analysis from the perspective of a specifi c theoretical and methodo-logical school, but the conceptual and methodological emphasis of and distinguished interest on a social phenomenon and the resulting problems and furthermore the systematic research of appearance and role of confl icts in social organizations.
Table 1: The most important topics and questions of confl ict research, these days1. Absence – as a potential source of confl icts in the workplace and in organisa-
tions2. Living conditions – an appropriate accommodation reduces confl icts3. Aggression – confl icts within groups4. Ageing – being at the mercy of sb./sth., confl icts resulting from dependency5. Alliances, coalitions – reduction of confl icts between groups6. Anti-Semitism – religious confl icts7. Anti-war and peace movements – violence, armed confl icts8. Assimilation – reduction of violent confl icts within groups9. Benefi t zone and victimized zone – particular social spaces: in the explanation
of confl icts and the diffi culty of consensus, areal and environmental confl icts10. Multicultural and multilingual education – school confl icts11. Bio-sociological theories – biological determination of confl icts, how the eco-
logical environment affects the interaction patterns of confl icts between the actors
12. Capitalism – reducing trend of confl icts, increasing willingness to cooperate13. Change management – running out of confl icts and possibilities of reconcil-
iation14. Protection of children – treatment of confl icts within the family, confl ict be-
tween parents15. Social classes – confl icts between classes, confl icting class interests, class-con-
sciousness, class relations and power16. A potentially confl ict-laden characteristics of collective actions, identity, mem-
ory and trauma17. Collective confl icts18. Racial and ethnic confl icts19. Crime and deviation – causes, reasons and consequences20. Critical theory – confl icts between classes, political confl icts, confl icts of power21. Environmental pollution – effects on everyday life, health damage

25
22. Deviant forms of behaviour, unlawful behaviours, causes and consequences of deviation
23. Problems, confl icts resulting from social division of labour24. Diad / triad – the fundamental components of social relationships and mech-
anisms25. Ecological problems – the relationship of environment and economy26. Ethnical, minority confl icts, ethnical enclaves, ethnical groups27. Migration, refugee problem, spatial mobility28. Cultural confl icts, ethnocentrism29. Confl icts within the family, new family models, family structure, division of
labour, role confl icts30. Feminist theories, movements31. Gay and lesbian movements32. Gender issue, gender inequalities and differences (gender bias)33. Inter-generation confl icts, generation change, mobility, ageing, gerontology34. Confl icts from globalisation35. Education, training – reproduction of social inequalities36. Relationship of social inequalities and confl icts37. Genetic experiments and genetic engineering – as social problems and the
accompanying confl icts38. Group theories – in-group, out-groups, group cohesion39. Crime: lack of sense of security, fear of crime, sense of danger40. Leader-subordinate relationship, confl icts in workplace, sub- and superordi-
nated relationships41. Marginalisation, liminality, exclusion, barred persons and groups42. Market – as the area of power and confl ict, exclusiveness, monopoly43. Media research – social role, function and effect of media, publicity44. Organisational confl icts45. Post-industrial society, postmodern conceptions of society46. Mobilization, activation – social changes, protest, social movements47. Racial, ethnical, minority consciousness – identity, minority politics48. Theories of resource-mobilization49. Hazard, risk – risks and damages generated by society and their effect50. Role confl icts – Role theories (role taking)51. Scapegoating52. Social movements and networks – tensions, dissatisfaction, representation of
interests, for/against inequalities, suppression...etc.53. Transition – political transformation, economy in transition, transformation
of political and social system54. Urbanization – as the source and hotbed of social confl icts, city confl icts,
suburbanization confl icts55. Global confl icts, sociology of war, violence
Source: Ritzer 2007.

26
The more and more intensive embedment of confl ict research in the mainstream of social science studies can also be easily followed in the dy-namic growth of the published publications. According to the online cat-alogue of ScienceDirect (www.sciencedirect.com), the growth of the num-ber of such kind of publications has been signifi cant in the last two dec-ades. While searching titles of publications, which contain the terms “confl ict” or “social confl ict”, the results are shocking. There are more than 11 million publications altogether in the database. For the search term “confl ict” (in title, keyword or abstract) there were 22,259 hits in June 2013, considering all fi elds of science. From these 5,122 were published before 1994. This value is equivalent to 23 percent of all papers. Thus, three-quar-ter of the publications of the online catalogue were written in the last two decades. From all of the publications 6,314 (28%) belong to the area of the social sciences and a dynamic growth can be observed here, similar to the whole statistical series, which include all scientifi c areas (Figure 2). While at the beginning of the nineties, only 100-150 publications with such top-ics has been published every year, there were already 400 papers, on the average, each year in the last fi ve years.
Figure 2: Appearance of the term “confl ict” in title, key words or abstract

27
Source: www.sciencedirect.com – June 2013
However, in the case of the term „social confl ict” a radical decrease can be observed in the hits. There are altogether 327 publications in the Science-Direct database with the term “social confl ict” in the titles or in the ab-stract. This means 15-20 publications annually. According to the fi gures, it can also be seen, how sensitive the research area is, regarding fast inter-pretation of larger processes with global impact (see the extreme values of the years 2001 and 2008).
Thus, the statistical series clearly confi rm that the research of social confl icts has not fallen into the background. Moreover, those assumptions according to which the problem fi eld is basically integrated in the concep-tual-theoretical and methodological-empirical practice of the research fi elds and approaches of the sociology and other social sciences are con-fi rmed.
5. The conceptual framework of the social problemThe confl ict based approach, focusing on the social confl icts, means in a broader sense, also a kind of problem sensitivity because of the larger emphasize on the social challenges. The manifestation of confl icts namely is the reason or the consequence of some social diffi culties. As a result of the above mentioned the social problems behind or as a consequence of the confl icts can be considered as the broader subject of the examination.
28
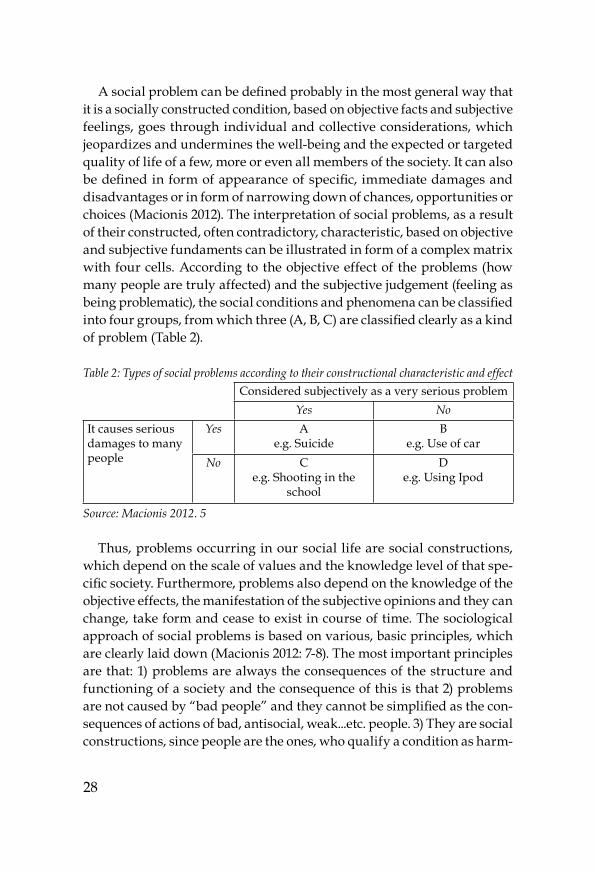
A social problem can be defi ned probably in the most general way that it is a socially constructed condition, based on objective facts and subjective feelings, goes through individual and collective considerations, which jeopardizes and undermines the well-being and the expected or targeted quality of life of a few, more or even all members of the society. It can also be defi ned in form of appearance of specifi c, immediate damages and disadvantages or in form of narrowing down of chances, opportunities or choices (Macionis 2012). The interpretation of social problems, as a result of their constructed, often contradictory, characteristic, based on objective and subjective fundaments can be illustrated in form of a complex matrix with four cells. According to the objective effect of the problems (how many people are truly affected) and the subjective judgement (feeling as being problematic), the social conditions and phenomena can be classifi ed into four groups, from which three (A, B, C) are classifi ed clearly as a kind of problem (Table 2).
Table 2: Types of social problems according to their constructional characteristic and effectConsidered subjectively as a very serious problem
Yes NoIt causes serious damages to many people
Yes Ae.g. Suicide
Be.g. Use of car
No Ce.g. Shooting in the
school
De.g. Using Ipod
Source: Macionis 2012. 5
Thus, problems occurring in our social life are social constructions, which depend on the scale of values and the knowledge level of that spe-cifi c society. Furthermore, problems also depend on the knowledge of the objective effects, the manifestation of the subjective opinions and they can change, take form and cease to exist in course of time. The sociological approach of social problems is based on various, basic principles, which are clearly laid down (Macionis 2012: 7-8). The most important principles are that: 1) problems are always the consequences of the structure and functioning of a society and the consequence of this is that 2) problems are not caused by “bad people” and they cannot be simplifi ed as the con-sequences of actions of bad, antisocial, weak...etc. people. 3) They are social constructions, since people are the ones, who qualify a condition as harm-

29
ful and as ready for change. Moreover, 4) there is no uniform, objective basis of the interpretation of problems, people see problems differently, therefore most of such kind of questions are accompanied by contradictions. 5) The defi nition and thematisation of problems also changes in the course of time, each age-group see the social problems differently. 6) The inter-pretation of problems is based not only on objective facts, but it also includes subjective values and interests. Moreover, 7) many – but fortunately not all – social problems cannot even be solved and in many cases 8) these are connected and interact with each other. These eight basic principles sum-marize practically the presuppositions and dilemmas in connection with researches in this fi eld and the problems, which make empirical research-es more diffi cult. Moreover, the list even makes it clear, why planning and starting, but especially comparing of such kind of quantitative, empirical researches is a serious methodological challenge.
6. The logical structure of a possible confl ict-research approach
After overviewing the conceptual-theoretical questions, the context sys-tem of a current quantitative, empirical confl ict research and a confl ict-ty-pology, which was worked out in this research, will be represented. In this interpretation, the social confl icts are an organic part of the everyday so-cial interactions, on the level of individuals, groups and social organisa-tions and institutions. As a consequence of this, such kinds of approaches are not connected by a specifi c, theoretical aspect - this already became obsolete these days - but a contentual point of focus. The fundamental hy-pothesis is that those interpersonal and intraorganisational relations, which develop and function, as a consequence of the interest of the parties invol-ved, on the basis of incompatible values, interests, information and resour-ces, are specifi c types of social relationships. Confl icts are organic elements of the most social relations and organisations. They play a role in the de-velopment (causes), characteristics (forms) and effects (goals and consequ-ences) of most social relationships and organisations. Furthermore, they infl uence at the same time the process of dynamisation, change and de-velopment and social disintegration.
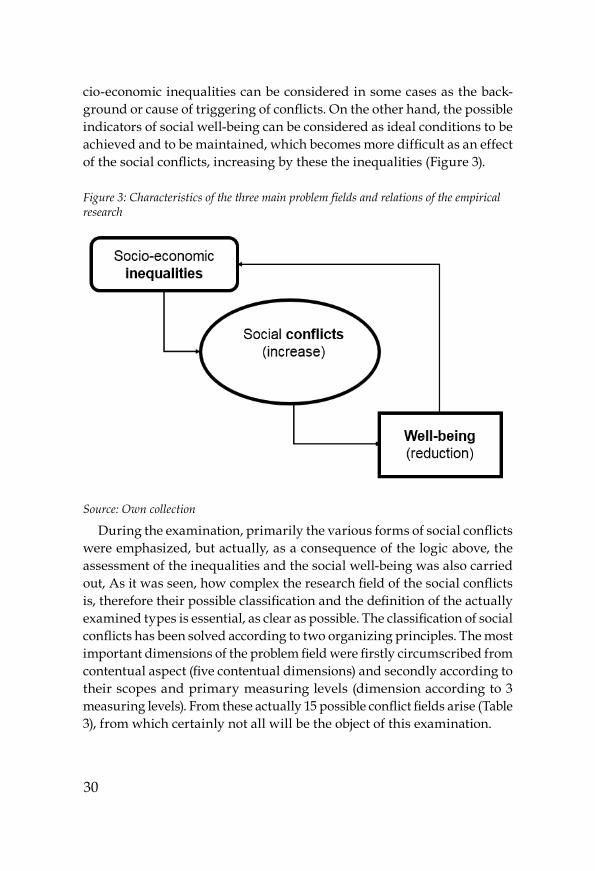
In a broader context, social confl icts can also be considered as a central element of a larger theoretical system, in which on the one hand the so-
30
cio-economic inequalities can be considered in some cases as the back-ground or cause of triggering of confl icts. On the other hand, the possible indicators of social well-being can be considered as ideal conditions to be achieved and to be maintained, which becomes more diffi cult as an effect of the social confl icts, increasing by these the inequalities (Figure 3).
Figure 3: Characteristics of the three main problem fi elds and relations of the empirical research
Source: Own collection
During the examination, primarily the various forms of social confl icts were emphasized, but actually, as a consequence of the logic above, the assessment of the inequalities and the social well-being was also carried out, As it was seen, how complex the research fi eld of the social confl icts is, therefore their possible classifi cation and the defi nition of the actually examined types is essential, as clear as possible. The classifi cation of social confl icts has been solved according to two organizing principles. The most important dimensions of the problem fi eld were fi rstly circumscribed from contentual aspect (fi ve contentual dimensions) and secondly according to their scopes and primary measuring levels (dimension according to 3 measuring levels). From these actually 15 possible confl ict fi elds arise (Table 3), from which certainly not all will be the object of this examination.

31
Table 3: Possible types of empirical examination of social confl icts
Measuring level / scopeContentual dimensions
Individualmicro-level
Groupmezzo-level
Collectivemacro-level
1. Demographic concerning age-group, generation, gender, ethnics/minorities
2. Private-social concerning family, social life, personal relationships3. Labour market concerning income, working,
superior-subordinate relationships
4. Territorial-residential concerning residence, neighbourhood, region-area, urbanisation
5. Power-institutional concerning sub- or superordination, politics, decisionmaking, representation
Sources: Own collection
There are only examples in the typologies, based in particular on the topics in focus of this research. Regarding scope, in the case of the empha-sized social confl icts, certainly all three typologies can be effective, since e.g. confl icts in the working place can also have personal, familiar and organisational or even collective impacts. In spite of this, a certain logical shift can still be effective in the system, since going down in the conten-tual dimensions more and more a shift in the scope in the direction of group and community can be observed.
7. Summary
In this study, an attempt has been made to overview the newest develop-ments of confl ict theory and views of social sciences, based on confl icts, according to the international literature. Furthermore, to make a few ques-tions clear regarding defi nitions, classifi cations and relations, which are essential for national, empirical research about this topic. The most im-portant conclusion on the meta-theoretical research level is probably that the confl ict theory as a sociological tendency has lost from its importance and it cannot be considered as a viable, independent orientation. Howe-ver, the problem fi eld of the social confl icts concerns the scientifi c public more and more. The confl icts weave through all segments, processes and mechanisms of our social life; they show fundamental relations with the

32
socio-economic inequalities and the dimensions of well-being. In order to make this problem fi eld empirically understandable, this merging and in-tegration process has to be followed and the presence and effect of confl i-cts has to be observed in different forms of the social relationships. Ho-wever, this requires a complex typology. In this study, also regarding this, the possible theoretical solutions have been overviewed and a new clas-sifi cation method was recommended.
33
Correlation of Well-being with Socio-Demographic FactorsPÉT ER RÓBERT
1. Introduction
Well-being is a category, which turns up more and more frequently at the assessment and the characterization or at the spatial and temporal com-parison of societies. The spread of the concept was supported signifi cantly by the report of the Stiglitz Commission (Stiglitz et. al., 2009, Stiglitz, 2010). Its largest merit is probably that it goes beyond the concept that economic development, measured mostly as the GDP (per capita), is the only criteria of well-being. Instead of this it recommends the consideration of more di-mensions1. According to the report, many objective indicators of macro cha-racter can be assigned to the dimensions, which can be measured on the whole level of the given society, country and economy.2 This indicator sy-stem enables the assessment, the international comparison and the ran-king of societies in many aspects. The most important feature of this study is that it does not approach well-being by objective indicators, but it crea-tes and examines subjective well-being indicators, based on the data of a public-opinion poll research. This approach is in conformity with the po-sition of the Stiglitz Commission, in so far as the authors – according to the previous literature of the topic, which is to a signifi cant extent (socio)psychological literature – recommend and encourage the consideration of subjective factors during the measurement of well-being (Stiglitz et al., 2009 p. 15-16). Such factors are, among others, happiness, satisfaction with
1 There are altogether eight dimensions: material living standards; health; education; per-sonal activities including work; political voice and governance; social connections and re-lationships; environment; insecurity of economic as well as physical nature. Nussbaum and Sen emphasize, in fact, also very similar dimensions (1993) regarding the quality of life: fi nancial situation, life expectancy, health condition and quality of health provisions, edu-cation, work, political and legal situation, family relationships.2 Without any claim to comprehensiveness: personal incomes; educational level; educa-tional expenditures; mortality; unemployment rate; participation in elections; extent of cor-ruption; civil participation; environmental expenditures; extent of crime, etc.

34
life, pleasure, pride and other positive emotions, or pain, fear, worry and other negative emotions, which people can feel in their everyday life. In fact, psychological measures and creation of indicators and scales concer-ning this matter and the relevant literature precede considerably the mea-surement and the examination of well-being in the society – but the pre-sentation of these goes beyond the fundamentally sociological approach of this study.3 The psychological literature deals with general human emo-tions, whereas the sociological approach – also in this analysis - wants to know how general human emotions correlate with such individual so-cio-economic characteristics, which are fundamentally related to the di-mensions emphasized by the Stiglitz Commission. These dimensions are educational level, fi nancial situation, work, residential circumstances, health conditions, etc. This position is related to the classical statement of Stein Ringen, considered as relevant, which argues that in well-being so-cieties from the perspective of the quality of life, it should be considered as very important how members of the society are infl uenced by their cir-cumstances and life experiences (Ringen, 1995, p. 3).
First, there is an overview in this study of the literature related to the measuring of subjective well-being. After that, it represents a few meas-urement methods and indicators, which were created by the research team of Széchenyi University in Győr with the data of the survey Economic and social confl icts (2013), all within the framework of the project. After that there is a description of subjective well-being of the Hungarian society and in the chapter the indices above will be used. Besides, the two indices of well-being (satisfaction, happiness), which can be considered as funda-mental, also appear in the international and temporal comparison and in the context of other indicators regarding the question of satisfaction with life and for the further widening of the comparison. Finally, the study will be concluded by a multivariate regression analysis, which examines the correlation between the socio-economic and demographic characteristics of individuals and well-being.
3 It is probably not an overstatement as Diener and his colleagues have already been talk-ing for one and a half decades about the examination of subjective well-being, namely that it has a past of three decades and professional references go back to the sixties (Diener et. al., 1999).

35
2. Examination of subjective well-being
2.1 Concept of subjective well-beingAs it was mentioned previously, subjective well-being is an emotional ori-entation, which is closely related to the individuals and has in many aspe-cts psychological bases (e.g. see Kahneman et. al. 1999). Even if this resear-ch cannot undertake the examination of such kind of determination, the question arises: How can such kinds of data become information and in-dicators, which characterize countries and societies? The short answer for this question can be found in the text of the Stiglitz report: „individuals are the best judges of their own conditions” (Stiglitz et al., 2009, p. 145).4 In fact, objective and subjective indicators of well-being are not that far from each other as it seemed at fi rst. Many objective criteria, mentioned above, such as qualifi cation, work, salary, specialties of residence, are cha-racteristics (also) on the individual level, from which the macro level in-dicators will be created by aggregation on the national and social level. The same process takes place in the case of measuring the subjective well-be-ing as well, as the individual satisfaction or happiness will be the indica-tor of the quality of the society (Kruger, 2009).
The journal Social Indicators Research has dealt with the examination of subjective well-being, in a special issue, in 2013. The introductory study of the paper overviews the topic both regarding weaknesses and strengths (Noll, 2013). According to the critics of the concept of subjective well-being, such information is too “soft” compared to the objective factors of well-be-ing. Their reliability and validity is weaker, since the source of data is a public-opinion research, where there can be distortion and uncertainty both in taking of samples and in individual answers. The correlation be-tween the objective and subjective indicators is sometimes surprisingly low: it happens quite often that the subjective well-being of people living under good living conditions is low and the subjective well-being of peo-ple living under bad living conditions is high. According to Noll, especial-ly this occurrence makes the examination of subjective well-being inter-esting. Besides, considering strengths of this concept, its relevance to the public policy can be emphasized, according to which the infl uence of subjective judgements and opinions is signifi cant (it can be even bigger
4 Similarly appropriate is another English phrasing: „perception is reality”, which express-es that not only is the well-being, wealth and happiness of somebody genuine, but it is also real, how satisfi ed and happy somebody is and how wealthy or healthy he/she feels him-self/herself.

36
than that of the objective factors) in case of individual choices and decisions. Therefore, the examination of subjective well-being in the public policy plays an important role for many researchers (Diener, 2006, Dolan et. al., 2011, Deeming, 2013). Also, this fact can be the reason for the recommen-dation in the Stiglitz Report for the national statistical offi ces (Stiglitz et al., 2009, p. 58 and p. 151), that they should ask the people of the population in questionnaires about how they evaluate their life, what their subjective experiences are and what priorities they have in making decisions in various situations in their life.
The examination of the topic has signifi cant domestic backgrounds but the previous Hungarian researches have used the concept of well-being less but rather the concept of quality of life (see Kopp, Kovács, 2006), which is probably a more widely spread terminology in Hungary. A reason for this can be that the previous domestic researches and measurements – among others, those of Rudolf Andorka – have followed such Scandinavian and German examples, which have also used the term quality of life (Allardt, 1978, Zapf, 1984). At the same time, any detailed elaboration of the conceptual differences would not help. The content behind the two labels is strongly overlapping, their common feature is that they both try to conceive instead of the quantitative characteristics the qualitative char-acteristics of life. Diener (2006, p. 401) see the difference that at the exam-ination of the quality of life the objective circumstances are emphasized more, whereas the object of the research of well-being is rather the per-sonal experience. This objective-subjective difference is possibly indicated furthermore by two widespread “measuring instruments”, which are used in international comparison, as well. The components of the Human Development Index, which can be connected to Amartya Sen as well, are the following: life expectancy at birth (a health indicator); knowledge and education, which are measured with the national data from the adult lit-eracy measurements; and the quality of life, which is measured by the GDP per capita, calculated with purchasing power parity. Veenhoven (1996) uses at the same time the term subjective quality of life, where according to him the key term is the satisfaction with life: the satisfaction is the characteristic of the quality of life. The World Happiness Report (the editors of the publications are John Helliwell, Richard Layard and Jeffrey Sachs) goes even further and puts another ranking, the national gross happiness, with similar values and validity, based on a subjective ranking, to the one, based on national gross product.

37
In determining the subjective well-being, the main concern is put on the individual judgement of the quality of life, in particular – as it was mentioned before – at each person according to his/her own criteria. Own criteria mean at the same time that there are different factors and empha-sis behind the well-being of different persons. The related researches therefore in many cases set different dimensions, life domains, as people are asked about, how they assess or judge their family relationships, fi -nancial situations, working conditions, health conditions, residence or home conditions. A topic of a separate examination could be, to what extent judgement of each area of life contributes to the sense of general well-be-ing or happiness. It obviously differs from person to person, how important the satisfaction with their job, fi nancial situation, family and social contacts, health conditions and residence is. Consequently, the correlation of per-ceived confl icts in each area of life with the well-being is different, as well. The more important an area of life (work, family, residence, etc.) is for somebody the more a confl ict, occurring in that area, (can) reduce the well-being and the feeling of happiness. This is the so called bottom-up model, which assumes that the assessment of each area of life has an impact on the judgement of the entire life, e.g. satisfaction with the job, family and residence has an impact on the satisfaction with life. The opposite, top-down model claims, on the other hand, that the judgement of area of life has no impact on the general satisfaction (or happiness). The opposite is true: the generally satisfi ed person views the different areas of his/her life, work, family, residence, health condition as more favourable and he/she is more satisfi ed with them. Without examination of casual relationships between the different areas of life, the analysis of Spéder and his colleagues on the data of the Hungarian Household Panel, showed that in the nineties the satisfaction with the quality of life or with the income had been stable but low, whereas the satisfaction with work, residence, living environment and health conditions were characterized by deteriorating from a higher level (Spéder et. al., 1998).
The concept of well-being of this study is not that detailed, but – as it will be seen – it builds the applied indices of well-being from many spe-cifi c questions and it considers both satisfaction and happiness, but it will not decompose these concepts on the various possible areas of life. One fundamental conceptual element is, on which the study is based, the psy-chological approach, where in the examination of well-being a distinction has to be made between a cognitive and an affective aspect (Diener, 1984.
38
Diener et. al, 1999). The cognitive aspect corresponds many times to the satisfaction and the affective aspect to the happiness, in the questionnaire examinations. All the assessments, the satisfaction and the emotional well-being can be positive and negative. According to all these, the dis-tinction of the three aspects is of importance: the fi rst is the satisfaction with life; the second is the positive feelings, emotions, as happiness, vital-ity and energy; the third is the lack of negative emotions, such as anger, sadness or depression (Argyle, 1996. Diener et. al., 2006). The study is based on these conceptions during the empirical examination of well-being and the creation of the indices of well-being.
2.2 Measurements of subjective well-beingThe research group of the Széchenyi University has created four indices of well-being and these indices will be used in this chapter. The question can arise, why more measurements are needed, why the “best” indicator can-not be selected. On the one hand, the subjective well-being conceptionaly-ly sets various priorities. On the other hand, the problem of validity and reliability has arisen during the measurement of subjective indicators. If the results of the different measurements lay in one direction, there are no signifi cant differences between them and this will enhance the validity and reliability of the results regarding the subjective well-being of the Hungarian society.
The fi rst index of well-being was based essentially on questions related to happiness, but this was extended by a question about optimism and about the proper development of life. This is the narrowed index of well-be-ing with 4 elements.5 The second index considered 3 more variables besides the 4 questions above: where would the questioned person place himself/herself on a scale with 0-10 grades according to his/her employment, fi -nancial conditions, education and abilities.6 The third and fourth indices were based on the introduced concept of Argyle and Diener, i.e. they were composed from three dimensions: satisfaction, positive emotions, lack of
5 The questions: All things concerned, how happy do you feel? How satisfi ed do you feel? (measured on a 0-10 grade scale) I am optimistic regarding the future. My life is going as I would like it to be (1=not at all, 5=completely). The variable, which was created by the main component analysis, is based on a sole unrotated factor, which eigenvalue is above 1 and this factor explains 71 percent of the deviations of the 4 factors.6 This index was created again with a main component, so that it only has 1 unrotated factor and this factor explained 61 percent of the deviation of the 7 variables.

39
negative emotions.7 The correlations between the fi rst pair of factors and the second pair of factors are high, their value is 0.7.
3. Subjective well-being: condition of the Hungarian society
3.1 International comparison, temporal changesThis subchapter in the fi rst step examines the Hungarian society in an in-ternational comparison. For this the data of the European Social Survey (ESS) from the year 2012 are used.8 In the database there are the data of altogether 27 European countries, where the two questions, which are considered as the most frequent measurement of subjective well-being, were asked in a similar way.9 Figure 1 and 2 ranks the countries according to the average of the answers. The two fi gures show a similar picture, showing that the two questions, which are connected (also) with each other measure presumably indeed the same attitude.10 As a difference can be re-garded probably that satisfaction is a “more rigorous” measurement, the endpoints of the 0-10 scale are between 8.6 and 4.3; whereas at happiness,
7 The content in the part of the questionnaire about positive feelings is altogether from four questions: agreement with those two mentioned statements, which are related to op-timism and the way of life; classifi cation of the residential area as pleasant in the assess-ment; positive answer to the question about happiness. The questions about the lack of neg-ative feelings were the following: negation of fear from criminals; no feeling of being ig-nored in the society; he/she cannot be characterized by the lack of ability of fi nding his/her own way in the life; lack of acknowledgement is not present; feeling of being despised is not present. The extended version of the index contained also a question related to stress-ful work, (those, who did not work got all a favourable value without stress in this question). This element was not contained in the second, narrowed version in the index. The creation of the indices was carried out by the analysis of the main component, in both cases an un-rotated factor was created, where the eigenvalue was above 1. This factor explained 56 per-cent of the variables (extended) or 57 percent (narrowed, less by 1 element).8 In international context these data are considered as „fresh”. The analysis of Vecernik and Mysikova (2014) about the data of the European Value Study (EVS) is extended until 2008. Hungary’s participation in the European Social Survey is supported by the Hungar-ian Science Foundation (OTKA Grant NN101921).9 The one question is: All things concerned, how satisfi ed are you with your life as whole nowadays? The other question is: Taking all things together, how happy would you say you are? In case of both questions the answers are on a scale with 0-10 grades, where 0 means the valuation not at all and 10 means extremely. In the 27 countries, more than 50 thousand people answered these two questions; the persons, who answered, represented the popu-lation above 15 in these given countries.10 The correlation between the two variables in the sample from the 27 countries was 0.717 in 2012.

40
with similar highest value, the lower endpoint lies higher, at 5.3 – that is the extent of dissatisfaction with life can be larger than that of unhappi-ness.
Figure 1: The average of the answers for the question how satisfi ed are you with your life in 27 European countries, in 2012.
Source: The global database of the surveys of ESS 1-6
The extent of the subjective well-being is the highest, around a value of 8, in the Scandinavian countries (Denmark, Iceland, Norway, Finland, Sweden), but this high value was characteristic also for Switzerland or the Netherlands. At the other endpoint of the scale, with a value of 6 or below it, were the former socialist societies (Baltic States, Russia, Hungary, Ukraine and Bulgaria). Hungary is exactly the third from the end in both rankings. Portugal is also around the end of the ranking, whereas among the former socialist countries the situation of Poland and Slovenia is the best, these countries are mid-table in the ranking.11
11 It is worth mentioning, that Lelkes (2005) claimed that Hungary, Slovenia and Poland were still the happier part of Eastern-Europe around the 1990s, which was characteristical-ly different from other Eastern European countries or from the former Soviet Union (CIS). According to this, it has been changed in the last one and a half decades since then.

41
Figure 2: The average of the answers for the questions how happy do you feel in 27 European countries, in 2012
Source: The global database of the surveys of ESS 1-6
The ESS data make the examination of temporal changes possible as well – within some limits. On the one hand, the foregoing 6 surveys (2002, 2004, 2006, 2008, 2010, 2012) covered a relatively short time period, the last 10 years. On the other hand, much less countries participated in all ESS surveys. If the comparison is, let it be said, narrowed to the former social-ist countries, than the comparison is possible with the two “not typical” countries (Poland and Slovenia) only. Because of the similarity of the two ESS measurements, Figure 3 contains the answers for the question about satisfaction with life only.
Comparing the level of subjective well-being to the two formerly social-ist countries, the Polish society was similar to the Hungarian conditions in 2002. However, the satisfaction with life has continuously increased among the population in Poland. The trend was increasing also in Slovenia, at a smaller extent as to Poland, though, and the average was higher dur-ing the whole examined period. In Hungary the level of subjective well-be-ing (as the satisfaction with life) had been deteriorated between 2002 und 2008. A value relatively standing out had appeared in 2010, but this value (5.83) is still lower than the Polish and Slovenian values by 1 grade. In comparison with this, the indicator had been deteriorated up to 2012 again,

42
it was still higher than in the 2000s, though. It is worth mentioning that in Hungary all indicators of satisfaction were outstandingly good in 2010, as shown in Figure 4, which was also calculated from the ESS data. It is im-portant to know regarding this that the ESS survey from the year 2010 had been made in autumn of that year, a few months after the parliamentary elections, in which the political party Fidesz had a victory and won two thirds of the parliamentary seats. At that time, after the ruling of the party MSZP for two legislative periods, there was a specifi c (political) emotion-al-sentimental atmosphere (Messing et. al., 2013). It is not surprising that after the elections, between 2008 and 2010, mostly the satisfaction with the democracy and the government has been improved. According to the data of ESS, the satisfaction with life was otherwise in Hungary higher each year than the other indicators of satisfaction.
Figure 3: The change of the average values of the answers for the question “How satisfi ed are you with your life?” in 16 European countries between 2002 and 2012.
Source: The global database of the surveys of ESS 1-6, own calculation

43
Figure 4: Change of average values of indices of satisfaction in Hungary between 2002 and 2012
Source: The global database of the surveys of ESS 1-6, Messing et al. 2013
Regarding the other countries in Figure 3, it does not make much sense to compare Hungary with the Scandinavian countries and not even with the market economies in the middle of the rank order. In these countries the subjective well-being was always higher, than in Hungary and had not shown any temporal fl uctuation. Ireland and Portugal could probably be a basis for comparison, where there were, similar to the Hungarian situa-tion, more fl uctuations. In Ireland, the satisfaction with life has been sig-nifi cantly reduced between 2004 and 2010 and this trend has changed in 2012. The subjective well-being is in Portugal similarly low as in Hungary, but the tendency as a whole is slightly improving. The situation in each country and at each time was slightly better than in Hungary.
3.2 The Hungarian situation in 2013There are more current data available about satisfaction with life and happi-ness for Hungary, based on the representative survey made within the pro-ject in 2013. In case of satisfaction the average was in 2012 (5.59) and in 2013 (6.1) a little higher, the difference is approximately half a grade. This avera-ge would place Hungary of ESS between Estonia and Portugal in the satis-

44
faction ranking. In the case of happiness, the average in 2013 (6.84) was also better than in 2012 (6.1), the difference was more than half a grade. Hunga-ry would be placed higher with this data in the happiness ranking of ESS, between Ireland and Estonia. However, it can be noticed that the condition of subjective well-being in Hungary is low even according to these data.12
The more detailed examination of the four indices of well-being, which were created according to the database from 2013, had taken place along a few socio-demographic variables: education, income, residence and re-gion, age and occupation. The picture on subjective well-being, based on the four indices, is largely homogenous with similar break points.13 In Figure 5, there is a higher well-being related to a university degree, but the values are positive in case of a secondary school qualifi cation, as well. With only a vocational training the well-being turned into negative and this trend became stronger in case of only a primary school education. In case of a household income per capita, a higher (positive) subjective well-be-ing belongs to the values above average and in case of a below average income the various indices has negative values.
Regarding residence, both the type of settlement and the regional loca-tion are of interest. First of all, a larger settlement does not necessarily mean a higher well-being. The subjective well-being seems to be general-ly the highest in case of city residents.14 In the case of Budapest, the values of the indices were close to the average. However, the well-being in the cities with county rights and in the villages the well-being was low and negative. Apart from Budapest, the regional deviation behind each type of settlement was certainly substantial. Considering the 7 regions, Hungary is almost split in two: the subjective well-being is high (positive) in Central Hungary, in Central Transdanubia and in West Transdanubia, but it is very low (negative) in South Transdanubia and in North Transdanubia and it is low, but to a smaller extent, in North Lowland and in South Lowland.
12 Both surveys in 2012 and 2013 were carried out on national representative sample by TÁRKI in a similar way. The difference is that in the case of the ESS survey the minimum age in the sample was 15 years and in the case of the TÁMOP survey it was 18 years.13 Since the indices were created, as it was already mentioned before, by factor analysis, their average was 0, their standard deviation was 1, the higher negative values mean a lower level of subjective well-being and the higher positive values mean a higher level of subjec-tive well-being.14 An exception is the index of well-being, which includes 7 variables and contains sub-jective classifi cations about individual occupation, educational level and fi nancial situation. It seems that these factors are more favourable among people, who live in larger settlements. This index differentiates more also along other background variables, such as school, oc-cupation or income, and its extreme values are higher.
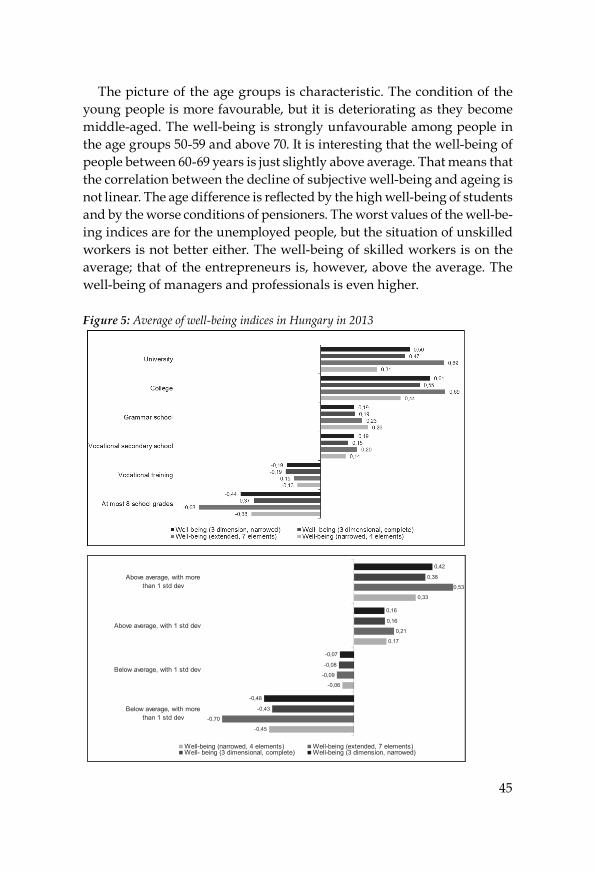
45
The picture of the age groups is characteristic. The condition of the young people is more favourable, but it is deteriorating as they become middle-aged. The well-being is strongly unfavourable among people in the age groups 50-59 and above 70. It is interesting that the well-being of people between 60-69 years is just slightly above average. That means that the correlation between the decline of subjective well-being and ageing is not linear. The age difference is refl ected by the high well-being of students and by the worse conditions of pensioners. The worst values of the well-be-ing indices are for the unemployed people, but the situation of unskilled workers is not better either. The well-being of skilled workers is on the average; that of the entrepreneurs is, however, above the average. The well-being of managers and professionals is even higher.
Figure 5: Average of well-being indices in Hungary in 2013
-0,45
-0,06
0,17
0,33
-0,70
-0,09
0,21
0,53
-0,43
-0,08
0,16
0,38
-0,48
-0,07
0,16
0,42
Below average, with morethan 1 std dev
Below average, with 1 std dev
Above average, with 1 std dev
Above average, with morethan 1 std dev
Well-being (narrowed, 4 elements) Well-being (extended, 7 elements)Well- being (3 dimensional, complete) Well-being (3 dimension, narrowed)

46

47
Source: Database of the survey “Economic and social confl icts”
4. The socio-demographic background of subjective well-being
In the last part of the study, the correlation between the subjective well-be-ing and the socio-demographic factors is examined with the method of the multivariate analysis. The application of such a statistic model fi ts into that conceptual framework, which examines the relationship between the socio-demographic situation and the related experience, i.e. the well-be-ing. In this context, the most known research issue is whether or not the increase of the income advantages will cause a similar increase in the fa-vourable assessment of the living conditions, well-being or happiness (c.f. Easterlin paradox – Easterlin, 1973. 1995). At the same time, according to Veenhoven (1989), who identifi es well-being primarily with a feeling re-lated to happiness, there is a provable correlation between the wealth on national level and the individual happiness. More recent data and analy-ses have also confi rmed this positive correlation between, on the one hand the economy, the economic growth and the happiness (Deaton, 2008) and on the other hand, the satisfaction with life (Diener et. al., 2013). The last part of the study examined essentially at which extent in Hungary the in-dividual, familiar economic situation and the fi nancial living circumstan-ces correlate with well-being.15 For this, some other sociological and de-
15 Richard Layard also deals with the mentioned dilemma between wealth, becoming wealthy on the one hand and happiness on the other hand, which is not increasing propor-tionally to those, whose book can be read also in Hungarian (Layard, 2005).

48
mographical factors, such as educational level, occupation, age, residence, health conditions, etc. are taken into consideration, which are not inde-pendent from the fi nancial situation; that means they correlate to each other.
In the model, the dependent variables are the subjective well-being, which means the four well-being indices, introduced above. The explan-atory variables are the social and demographic criteria, which characterize the questioned person (and his/her household) and a few questions about opinions and attitudes. The statistic model examines the connection be-tween the subjective well-being and the explanatory variables in three steps. The fi rst model contains the demographic characteristics. These are the gender, age, family structure for the respondent and the place of the residence16. The second model adds the sociological characteristics of the person (household) to the former, such as education, occupation, income and various factors of the fi nancial situation.17 Finally, in the third model there are three more factors: satisfaction with the residence, judgement of the health condition and belonging to a denomination.18
16 The code of gender is: male=1, female=0. Measurement of age: age + age squared. One factor of the composition of the family is the size of the family, measured by two dichoto-mous variables: household with 1 person=1, other=0; 6 persons or more=1, other=0; refer-ence: household with 2-5 persons; the other factor is the number of children, which is meas-ured also with two dichotomous variables: no children=1, other=0; 3 and more children=1, other=0; reference point= 1-2 children. In case of residence the usual 7 regions are separat-ed by 6 dichotomous variables and the reference is: Central-Hungary.17 Measurements of educational level with an ordinal scale with 6 grades: 1=at most 8 school grades, 2=vocational training, 3= vocational secondary school, technical school, 4=grammar school, 5=college, 6=university. Occupation is characterised in the model by three dichotomous variables: unemployed=1, other=0; self-employed=1, other=0; upper or middle management=1, other=0. The income is the household income per capita (the miss-ing data have been replaced). One of the factors of the fi nancial situation is the number of durable goods measured on a 0-13 grade scale; the other is the number of saving methods, on a 0-5 grade scale; the third is the number of debts, on a 0-3 grade scale; and fi nally a four grade scale related to the payment of the utility costs, which is from the case, that they do not have any problems with the payment, until the case of the inability to pay the utilities. (The exact questions about the fi nancial situation and the list of the durable goods and the saving and debt forms are in the questionnaire.)18 The satisfaction with residence is a factor developed by analysis of main component, which elements are the satisfaction with the residential environment and with the settle-ment, both measured on a 0-10 grade scale. Health condition is measured by a 7 grade scale, based on the common distribution of answers for the following two questions: How is your general health condition? 5=very good, 1=very bad; Are you hindered in your everyday ac-tivity by any kind of long-lasting illness, invalidity, bad health condition or mental prob-lem? 1= very much, 2= to some extent, 3=no. Religiosity is a dichotomous variable, where the value of belonging to a religion or denomination is 1, otherwise 0.

49
The results of the regression model are in Table 1 and Table 2. Table 1 contains regression estimations for the fi rst two indices of well-being and Table 2 for the second two (three dimensional) well-being indices.
Table 1: Correlations between subjective well-being indices and socio-demographic variables
Narrowed well-being (4 elements)
Extended well-being (7 elements)
Explanatory variables
Model 1 Model 2 Model 3 Model 1 Model 2 Model 3
Gender (male=1) -0.018 -0.032 -0.042 0.022 0.031 0.026Age -0.006*** -0.008*** -0.002 -0.005** -0.006*** -0.001Age squared 0.081*** 0.083*** 0.070*** 0.026 0.051** 0.041*No children (=1) -0.094 -0.154** -0.108* -0.049 -0.137** -0.104*More (3+) children -0.329* -0.040 -0.048 -0.309* -0.008 -0.015One person household -0.236** -0.093 -0.122+ -0.292*** -0.115+ -0.140*
Large (6+) household -0.071 0.119 0.087 -0.270+ 0.001 -0.043
R: Central Transdanubia 0.036 0.152* 0.127+ -0.116 0.080 0.060
R: West Transdanubia -0.085 0.015 -0.007 -0.170+ 0.031 -0.002
R: South Transdanubia -0.333*** -0.030 -0.036 -0.511*** -0.059 -0.059
R: North Hungary -0.125 0.165* 0.176* -0.236** 0.140* 0.147**R: North Lowland 0.024 0.403*** 0.356*** -0.074 0.410*** 0.366***R: South Lowland -0.132+ 0.143* 0.113+ -0.290*** 0.094 0.077Educational level 0.031+ 0.021 0.114*** 0.107***Unemployed (=1) -0.372*** -0.374*** -0.494*** -0.491***Self-employed (=1) 0.165* 0.167* 0.132+ 0.131+In manager position (=1) 0.139 0.158 0.294* 0.319**
Income per capita 0.001* 0.001+ 0.002*** 0.002***Material goods 0.045*** 0.037*** 0.061*** 0.054***Number of savings 0.052** 0.044* 0.044* 0.036*Number of debts -0.105*** -0.096** -0.109*** -0.099***Problem with paying the utilities -0.423*** -0.365*** -0.392*** -0.345***

50
Narrowed well-being (4 elements)
Extended well-being (7 elements)
Satisfaction with residence 0.167*** 0.136***
Health condition 0.133*** 0.110***Religiosity 0.086* 0.115**Constant 0.414*** 0.645*** -0.357* 0.469*** 0.152 -0.692***Adjusted R-square 0.035 0.300 0.353 0.047 0.434 0.472
Signifi cant: *** p<0.001; ** p<0.01; * p<0.05; + p<0.10Reference: 1-2 children; families with 2-5 persons; Central Hungary; not unemployed; not self-employed; not a manager; not religiousSource: Database of the survey “Economic and social confl icts”(2013), own calculation
According to the model, there is no signifi cant difference between men and women in perception of well-being, be it the narrowed or the extend-ed measurement. According to the bivariate analysis of age groups (Figure 5), the defi cit of well-being occurs primarily at persons in the age groups 50-59 and above 70, which means that the effect of the age is not linear. Therefore the model contains the age in quadratic term, too. The negative effect of the age and the positive effect of its square confi rmed in fact the U-shape correlation: well-being is reduced with ageing, but not evenly. This effect appears better, as the narrower version of well-being is exam-ined. Regarding the family structure, the analysis shows that well-being is infl uenced negatively by childlessness and if somebody has a one person family. In families with more than three children, the extent of subjective well-being is also lower, but this effect is statistically not signifi cant – by controlling of other variables. Regarding the regional differences the pre-vious picture will be modifi ed according to the multivariate model (Figure 5), that is, it comes into sight that the regional differences are caused part-ly by the social composition of the regions. Compared to Central Hungary, which was regarded as a basis of comparison, the extent of well-being was according to model 1 in South Transdanubia less favourable and signifi -cantly negative impacts has arisen in case of South Lowland and North Hungary at the estimation of the extended wealth, where the index con-tained the “self classifi cation” of occupation, fi nancial situation and edu-cation. After including further objective and subjective sociological crite-ria, model 2 and 3 already shows that the regions North Hungary and North Lowland, which are less favourable regarding education, work and

51
income, and is in a relatively better position than Central Hungary, the effects will be positive.
It was obvious in the bivariate analysis (Figure 5) from the sociological criteria in model 2 that a higher education level increases the extent of subjective well-being, which shows a signifi cant increase from primary school qualifi cation until university degree. In the multivariate analysis the effect of education in that model is signifi cant, which is related to the extended version, since there also subjective status criteria are part of the measuring. In the case of measuring of the narrowed well-being, the pos-itive effect of the school is only at a level of 1 percent signifi cant and it is in the last model no longer signifi cant. In the case of employment, the unemployment reduces the well-being signifi cantly in the case of any measurement, also in the case of the multivariate analysis, similar to the bivariate analysis. Regarding occupation the well-being of unskilled work-ers is the lowest (Figure 5), but this effect is not indicated in the regression model, since (low) education measures essentially the same and it is ap-propriate not to further increase the multicollinearity between the explan-atory variables. However, there are two factors in the analysis, which correlate less with the education. The occupation as a self-employed en-trepreneur infl uences the extent of well-being signifi cantly, especially in the case of the narrowed measurement. The situation is just the opposite in the case of being in managerial position. The variable related to this improves the grade of extended wealth signifi cantly (where there are also subjective status elements), but its effect is not signifi cant in case of the narrowed well-being.
Considering fi nancial situation, a higher per capita household income, a larger number of consumer durable goods and many kinds of savings increases well-being signifi cantly. On the other hand, well-being is reduced by more debts and by the diffi culty of paying overhead costs. The effect of the income is, similar to that of the educational level, stronger in the model for measuring of the extended well-being. In the case of the narrowed well-being, the income in the last model is only on a level of 1 percent signifi cant. As a whole, the effect of the fi nancial living conditions can be regarded as strong, especially considering that the model includes the educational level and some occupational characteristics, e.g. unemployment, which means a bad fi nancial situation, or a manger position, which means a good fi nancial situation.
Model 3 fi nally shows that well-being is increased, if somebody is more satisfi ed with him/her residence, where he/she lives. Well-being is also

52
positively infl uenced if somebody thinks that he/she is healthy and does not suffer from such illness, which would hinder him/her in his/her everyday life. Finally, those, who classify themselves as religious also have better values in the well-being factors.
It can be seen in Table 2 that the patterns of estimations related to indi-ces, which are based on the three dimensional conception of subjective well-being (satisfaction, positive emotions, lack of negative emotions), are very similar. Here no gender differences can be seen either. The nonlinear effect of the age is also present and childlessness and living in a one per-son household also reduces the well-being, measured in this way. The regional differences are modifi ed by the combination effects, educational level and occupation. The model indicates the highest relative well-being in the North Hungary region, which is, regarding the fi nancial situation, probably the least favourable region.
Table 2: Correlation of subjective well-being indices and socio-demographic variablesSubjective well-being
(3 dimensions)Subjective well-being 2
(3 dimensions)Explanatory variables
Model 1 Model 2 Model 3 Model 1 Model 2 Model 3
Gender (male=1) 0.033 0.028 0.026 0.042 0.038 0.034Age -0.005*** -0.005*** -0.002 -0.007*** -0.007*** -0.003+Age squared 0.071*** 0.087*** 0.071*** 0.029 0.049* 0.034+No children (=1) -0.083 -0.141** -0.103* -0.083 -0.144** -0.105*More (3+) children -0.294* 0.003 0.006 -0.341* -0.050 -0.049One person household -0.242*** -0.091 -0.119+ -0.244*** -0.091 -0.119+
Large (6+) household -0.204 0.002 -0.026 -0.227 -0.011 -0.040
R: Central Transdanubia 0.148+ 0.283*** 0.258*** 0.138+ 0.283*** 0.258***
R: West Transdanubia -0.097 0.022 -0.006 -0.105 0.027 0.001
R: South Transdanubia -0.179* 0.155* 0.159* -0.192* 0.158* 0.161*
R: North Hungary -0.257*** 0.059 0.071 -0.268*** 0.077 0.087R: North Lowland -0.155* 0.232*** 0.191*** -0.153* 0.247*** 0.205***R: South Lowland -0.162* 0.133+ 0.109 -0.170* 0.144* 0.118+Educational level 0.054*** 0.048*** 0.064*** 0.057***Unemployed (=1) -0.267*** -0.264*** -0.396*** -0.393***
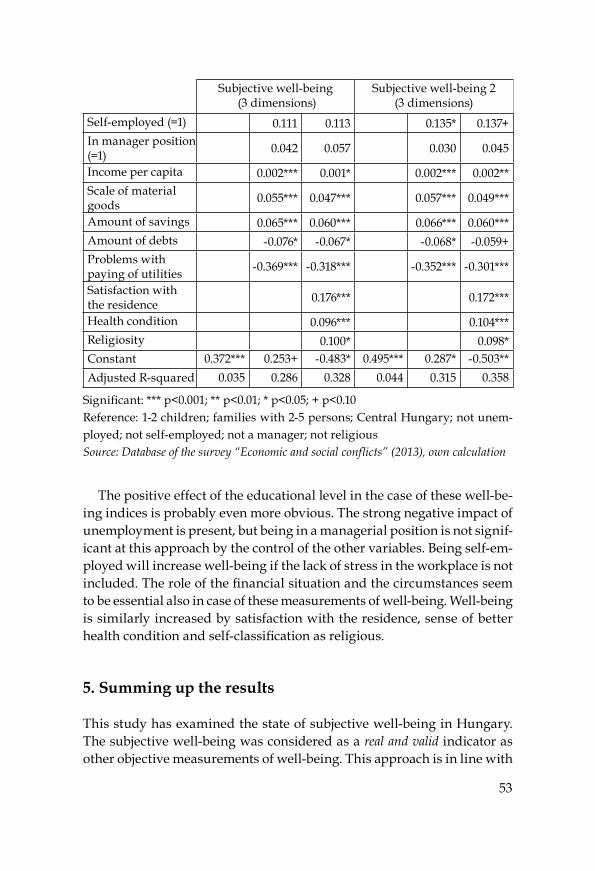
53
Subjective well-being (3 dimensions)
Subjective well-being 2 (3 dimensions)
Self-employed (=1) 0.111 0.113 0.135* 0.137+In manager position (=1) 0.042 0.057 0.030 0.045
Income per capita 0.002*** 0.001* 0.002*** 0.002**Scale of material goods 0.055*** 0.047*** 0.057*** 0.049***
Amount of savings 0.065*** 0.060*** 0.066*** 0.060***Amount of debts -0.076* -0.067* -0.068* -0.059+Problems with paying of utilities -0.369*** -0.318*** -0.352*** -0.301***
Satisfaction with the residence 0.176*** 0.172***
Health condition 0.096*** 0.104***Religiosity 0.100* 0.098*Constant 0.372*** 0.253+ -0.483* 0.495*** 0.287* -0.503**Adjusted R-squared 0.035 0.286 0.328 0.044 0.315 0.358
Signifi cant: *** p<0.001; ** p<0.01; * p<0.05; + p<0.10Reference: 1-2 children; families with 2-5 persons; Central Hungary; not unem-ployed; not self-employed; not a manager; not religiousSource: Database of the survey “Economic and social confl icts” (2013), own calculation
The positive effect of the educational level in the case of these well-be-ing indices is probably even more obvious. The strong negative impact of unemployment is present, but being in a managerial position is not signif-icant at this approach by the control of the other variables. Being self-em-ployed will increase well-being if the lack of stress in the workplace is not included. The role of the fi nancial situation and the circumstances seem to be essential also in case of these measurements of well-being. Well-being is similarly increased by satisfaction with the residence, sense of better health condition and self-classifi cation as religious.
5. Summing up the results
This study has examined the state of subjective well-being in Hungary. The subjective well-being was considered as a real and valid indicator as other objective measurements of well-being. This approach is in line with

54
the spirit of the Stiglitz Report and with that point of view of the literatu-re that a determinant element of the quality of life and the well-being is its experience on the individual level. Empirically, based on the literature, many kinds of indices of subjective well-being have been developed – ba-sically in connection with that concept that there are partly cognitive eva-luative and partly affective emotional attitudes behind well-being. The purpose of representation of the different (altogether four) indices of well-being (and by this the quadruplicating of the results), was to make the study generally more valid and reliable for the reader. The use of the data in the study from the European Social Survey – as a data source in an ad-dition to the own survey in the TÁMOP project – also served the same purpose, namely widening the context of interpretation.
In international comparison the extent of subjective well-being, mea-suring the satisfaction and happiness, can be regarded in Hungary as low. In an international ranking from 2012, Hungary is the third from the bottom among 27 countries; the means are only lower in the Ukraine and in Bulgaria. This picture is just slightly eased by the fact that according to the questions related to satisfaction or happiness the situation in the former socialist countries is generally less favourable than in most of the member states of the EU and especially in the Scandinavian countries. The reliabil-ity of this statement is shown by the fact that besides this ranking, accord-ing to the data of the European Social Survey, there is a similar overall picture according to the European Value Studies (Vecernik, Mysikova, 2014).
In Hungary the well-being measured with satisfaction is fl uctuating at a low level. In the last decade decreasing was rather typical. This trend has been interrupted only once, in 2010, by a measurement with more favourable results, a consequence of a political atmosphere, which seemed widely as favourable. However, this study has not undertaken to carry out a more accurate examination about the background of the various forms of satisfaction, which are moving apparently together and are related to democracy, government and economy. The process of changes in satisfac-tion with life was similar to this in this period.
The correlation of the subjective well-being and the socio-demograph-ic factors shows typical breaking points lines in the Hungarian society, as it has turned out from the analysis, in which partly bivariate, partly mul-tivariate methods were applied. It can be regarded as an interesting result that there is no difference between men and women. This is partly due to the fact that the study did not make any difference between the various

55
areas of life, e.g. work, fi nancial circumstances, family, where gender dif-ferences could have expected. It is not trivial that subjective well-being among younger people is the strongest and it is deteriorating with the advance of age. It is probably less surprising that the average of well-being is the lowest for elder people, above 70, but the possible reasons for this, such as the worsening fi nancial conditions, the deteriorating health con-dition and the reduction of the social relationships, should be further ex-amined. It is more surprising that the situation is as bad among the people aged 50-59 as for those above 70. On the one hand, it can be assumed that members of this cohort have achieved the peak of their professional career and income (be it any kind of occupation, among the Hungarian circum-stances), which could mean some kind of satisfaction and happiness. On the other hand, these people are the so called „sandwich” generation, who support both their growing children, who still depend on their help, and their old parents, who already depend on their help and this lays a double burden on them, which deteriorates their well-being. Otherwise, the sat-isfaction defi cit of the middle-aged has been also shown in a previous analysis of Lelkes (2003). Compared to them the well-being condition of people aged 60-69 is more favourable, below average, and shows a similar value as that of pensioners. The members of this cohort are really fresh pensioners with possibly more benefi ts than losses, e.g. ceasing of stress from occupation and working; since neither their fi nancial condition, nor their health condition, nor their social integration have started to deterio-rate yet. Otherwise, pensioners are not really the group, which is in the worst situation regarding subjective well-being. The state of the unemployed is much worse than theirs. That means that losing a job in an active age is a more serious defi cit than in an older age. This phenomenon, the negative correlation of unemployment and well-being, has also been previously shown by Lelkes (2003) using Hungarian data.
The correlation between the social status and the subjective well-being is clearly positive. A higher educational level (college or university degree) and in this context a higher occupational status, a professional job or a managerial position presume a higher subjective well-being as opposed to a lower educational level and the resulting unqualifi ed work. Besides, the analysis has proven clearly that in Hungary a better income situation and more favourable fi nancial circumstances improve, whereas fi nancial diffi culties (e.g. problems with debts or with payment of utilities) deteri-orate the extent of well-being. Thus, the Hungarian case fi ts in the row, which disputes the validity of the Easterlin paradox. The relative measur-

56
ing of income in the bivariate analysis (the extent of the deviations from the average) and the absolute measuring of income in the multivariate analysis show equally signifi cant differences in the extent of well-being. Previous Hungarian analyses have also found a signifi cant positive dif-ference in the extent of well-being. (Lelkes, 2003. Hajdú, Hajdú, 2011).
Further important results of the analysis are the residential and spatial differences. On the one hand, well-being is not necessarily higher among those people, who live in a larger settlement, e.g. in Budapest. On the other hand, a residence in a smaller settlement, like a village, means a lower level of well-being. A reason for this can obviously be that the education, occupation and the other fi nancial living circumstances of the population in villages is worse. This compositional effect is typically in effect for the regional differences, as well. Well-being is, in absolute term, above average among those people, who live in the more prosperous areas of the country, in Central Hungary, in Central Transdanubia or in West Transdanubia. But if the statistical model considers that the educational level of the pop-ulation in these regions is higher, the unemployment is lower, the incomes are higher, more people can save money and less people get into debt or struggle with paying for utilities, than it seems as if well-being in North Lowland or in South Lowland would be higher.
The last step of the statistical model has examined the effect of two specifi c areas of life. The results show on the one hand that satisfaction with the residence increases the level of well-being signifi cantly and on the other hand the level of well-being is higher for those people, who feel healthier. Finally, the data showed a higher well-being also among those, who defi ne themselves as religious. Lelkes (2005) has also shown that there is a positive correlation between religiosity (which is in her analysis a higher frequency of going to church) and the level of well-being.
The general purpose of the study was to show a relationship between selected socio-demographic factors and well-being. The results are in line with the previous studies and are basically plausible. Use of various kinds of well-being indices has led to similar results confi rming each other.

57
Urban-Rural Differences in Neighborhood Satisfaction, Trust and Happiness in HungaryTA M ÁS DUSEK
1. Introduction
Neighborhood satisfaction is a research issue which is not often examined in Hungary, in spite of the fact, that it is strongly connected to the every-day life, quality of life, personal contacts and mental health of people. Ne-ighborhood environment is not only a passive container of human beha-vior, but a factor which has infl uence on behavior, opinions and attitudes. Trust is a basic dimension of human capital and a very often used concept in everyday situations too. Positive attitudes towards one’s neighbors cont-ribute to cohesion within the local community, and thus leading to resi-dents’ willingness to participate in local affairs and to cooperate in every-day matters. It has been asserted that, in societies where people trust each other, social relations are solidifi ed, transaction cost are reduced, problems and confl icts are solved in a more effective way, economic activities and institutions function effectively, and government and political institutions work better. “Social life without trust would be intolerable and, most li-kely, quite impossible” (Newton, 2001, 202). Research of happiness is as old as the history of mankind. One small slice of this are the questions con-nected to the impact of location and environment on the level of happiness.
This paper gives an analysis of the three questions mentioned above, from the point of view of urban-rural dichotomy in Hungary. The empir-ical basis of the analysis is the county-level population survey (N=2031) conducted in 2013. The fi rst part of the paper deals with some conceptual and methodological questions, supplied by minor references to literature. The second part is an exploratory study, where besides the urban-rural aspects some important socio-demographic variables are taken into con-sideration too. The paper disregards from the various illusory, utopian suggestions, which is sometime ballasts this research topic.

58
2. General conceptual and methodological questions
2.1 Defi nition of neighborhoodNeighborhood can be interpreted in several different ways. It can be cap-tured as a smaller areal unit with its spatial, environmental-ecological characteristics, or as a local network between different persons. Among the various research topics it is a fundamental one, whether the behavior, personal contacts, opinions of persons who are satisfi ed with their en-vironment is different from those who are dissatisfi ed. On the other hand, what the role of the environmental elements is in the neighborhood satis-faction and in what extent these elements can be modifi ed for the sake of a higher satisfaction level. And, lastly, an important question is the con-nection between the various socio-demographic factors (age, gender, family status, education, ethnicity, labor market position and, so on) and other personal variables with the satisfaction level.
According to the previous studies, neighborhood satisfaction shows a strong relationship between mental health and general life satisfaction, the sense of security, and stability. Evidence has also supported that the dissatisfaction with the neighborhood decreases contacts with neighbors, and increases the likelihood of mobility out of the neighborhood. This has important implications for the long-range dynamics of the neighborhoods (Adams, 1992; Austin et al, 2002; Dassopoulos – Monnat, 2011; Oh, 2003). However, high level of neighborhood satisfaction and the positive sense of community has a circular relationship, both increases the other (Brower, 2003; Hur – Morrow-Jones, 2008).
The home or home address can be identifi ed mostly without problem, but the spatial extent of the neighborhood cannot be unambiguously de-limited, because the settlements are not contained of isolated units or is-lands. Unitary defi nition is hampered by the huge differences in structure and building method of settlements and parts of settlements. The most perfect defi nition of neighborhood and its delimitation would be different from the conceptualization of neighborhood for each person. Therefore, the spatial extent of neighborhood can be different from person to person, not only due to the objective spatial differences of neighborhoods, but due to the different conceptualization too. Some empirical surveys ask people to give an own defi nition of neighborhood. In this case, the answer is valid for an unstandardized territorial unit, which is at least interpretable for the respondent (Lee – Guest, 1983). The scale of these neighborhood defi -nitions is very different, ranging from their own street, the two-three
59
streets to the districts with more than ten thousand inhabitants. And besides this, some people are unable to give their own defi nition (Mullins, 1973). The mental processes behind the spatial relations are an interesting fi eld of research, but the different conceptualizations, apart from the extreme situations, does not mean (1) the unalasybility of the questions concerning the spatial relations (or: (2) that the questions concerning the spatial rela-tions cannot be analyzed), it is just a disturbing background noise. In this research, spatial questions are concerning the neighborhood, the vicinity of home, and to the settlement. The last one is unambiguous for the ma-jority of the respondents, the fi rst two are dependent from the persons more or less.
2.2 The spatial level of analysisThis research treats the settlements as basic spatial units. Interestingly, the majority of spatial research deals with either bigger units (countries) or smaller units (neighborhoods inside the settlements). In this analysis, neighborhoods are not analytical units, only the attitudes towards the ne-ighborhoods is analysed at the levels of settlements, from the point of view of urban-rural differences, that is, at aggregate level and not at the level of concrete settlements.
Urban-rural differences cannot be defi ned generally and principally. Each criterion (sociological, historical, legal, economical, human geograph-ical, size and functional) used for defi nition can be criticized. Each settle-ment lies somewhere in the farm – world metropolis continuum. However, this is not an obstacle for the practical analysis for examining the effects of obvious size and functional differences of settlements. This paper uses the legal settlement defi nition, which has a strong relation with the size categories of settlements. In Hungary, town status is given once in a year by the president and the parliament to the applicant villages. In 2013, there were 346 towns (or cities) in Hungary. Seven towns have less than two thousand inhabitants. The legal limits between towns and villages are strict and explicit, but the functional limit, of course, is indistinct: there are villages which are almost towns, there are towns which are almost villages. However, as groups, towns and villages are clearly different. The capital city, Budapest has 1740 thousand inhabitants, the second largest city, Debrecen, has 208 thousand inhabitants. There are 23 cities with county rights: the 18 county capitals, plus 5 cities with more than 50 thou-sand inhabitants. This paper distinguishes these three categories in the cities: Budapest (as a dominant city, without any other city close to it),

60
cities with county rights and other cities (named as towns for now). This categorization is good for that reason too, because it is almost the same, as the categorization according to the size of the settlements.
From the methodological point of view, the location of settlements would be important, besides the above mentioned difference in size and legal form. First of all, the difference between suburban villages, close to the cities, and the villages farther from the cities is potentially interesting. In these two categories, the spatial arbitrariness can occur, because there is no strict difference between the two categories. Secondly, an own catego-ry for the farm population would be reasonable. Due to the space limitation, these two aspects are not investigated in this paper. However, these two factors should be investigated in a more detailed analysis, as well as the various districts inside the settlements.
The duration of homeownership is also an important indicator, which mixes the spatial, temporal and personal characteristics. Several previous investigations have shown the importance of this factor and its relation with the evaluation of neighborhood environment. Longer residence means stronger local ties, stronger local integration, more friends, relatives and formal contacts too.
2.3 The spatial factor, as a unique explanatory variable Examination of socio-demographic characteristics can be extremely comp-lex in the case of simultaneous examination of several socio-demographic factors. This can be further complicated with the inclusion of behavioral and attitude variables. However, any inclusion of spatial characteristics leads to a more complex connections between various factors and makes the effect and directions of causality uneasy to arrange. The reason behind this is, that spatial characteristics are simultaneous with any other non-spa-tial variables, therefore it is necessarily a new and peculiar dimension. Spatial characteristics are categorically independent from the demogra-phical and behavioral characteristics, which can be cause (for example, the neighborhood has an infl uence on family status or on the choice of job) and effect too (for example, the family status or the job has an infl uence on the choice of neighborhood). The direction of causality cannot always be decided, the interrelated connections are more frequent.
Some basic forms of causal relationship, however, can be distinguished. Firstly, spatial variable has a direct effect on behavior. The most obvious case is the effect of climate or weather. Secondly, spatial variable has an

61
indirect effect on behavior, because the direct effect infl uences the so-cio-demographic characteristics through both the mobility of people and by autonomous spatial processes. Thirdly, the socio-demographic charac-teristics have an infl uence on the choice of location, and in this case so-cio-demographic characteristics have an effect simultaneously on location and behavior. Fourthly, socio-demographic characteristics have an indirect infl uence on behavior through the choice of location. The fourth case can be accepted by a spatial researcher, but it is a rare case in the mainstream sociology.
To put differently the main dilemma of explanation: either the neigh-borhood, settlement type has an infl uence on behavior through spatial mobility, or the settlement type has an effect on the behavior of inhabitants. Both forms of explanations can be true at the same time.
2.4 Measurement of trust and happinessThe concepts of trust and happiness are similar to each other from many points of view: both notions are widely used in everyday life, everybody has an opinion about them, their essence can be a subject of fi erce discus-sions. These concepts are examined by sociologists, economists, politician analysts, psychologists and other human sciences. Both notions became trendy for the research. This manifested also in the publication of new academic journals by famous publishers: Journal of Happiness Studies and Journal of Trust Research. Parallel to this tendency, operationalization of the concepts themselves is a popular research area. Tremendous sug-gestion exists for measurement of the concepts. For example, the world database of happiness research (worlddatabaseofhappiness.eur.nl) conta-ins 997 different surveys with different wording, scaling, and number of questions.
In spite of the mushrooming possibility of surveys, measurements can be made principally in two ways: either with only one question (general or global happiness and trust) or with many questions (forms of happiness, trust in something). It depends on the aim of the study, which is used. In this research trust was measured with 19 questions, and happiness with one question. This is a good sharing, because general or global trust means almost nothing. Trust can be interpreted much better as a trust in someone or something (person or institution), but general happiness is a much better concept than happiness in some specifi c area of life.

62
2.5 The abundance of general literature of the subjectResearch on neighborhood satisfaction is as old as sociology itself. From the historical forerunner, human ecology of the Chicago School in the fi rst half of the twentieth century has to be mentioned in the fi rst place. This approach examined the effect of environment and the density on human behavior and treated the city as an ecosystem in analogy to natural ecosy-stems (Park – Burgess, 1925). According to the school, the local communi-ties are a system of social ties: friendships, relatives, formal and informal contacts and local institutions are their main building blocks. Treating settlements as complex and organic structures is also a valid starting point of the analysis today, but the data, analytical methods and computational capacity that were available ninety years ago were inferior compared to the present. Research of neighborhood environment in the sixties and se-venties was based heavily on the Chicago School (Suttles, 1972; Michelson, 1976; Rapaport, 1977; La Gory – Pipkin, 1981). The school was criticized at the same time due to the excessive ecological, environmental approach and the de-emphasizing of social and occupational aspects (Szirmai, 2014).
The starting point of the contemporary neighborhood research is the empirical observation which in spite of the higher spatial mobility, the neighborhood continues to be a salient arena for everyday life for the high majority of people, and it can be an important explanatory variable for several behavioral characteristics. The majority of people spend most of their time at home, the biggest expenditure for most people is their dwell-ing. One of the morals of neighborhood research is the lack of general rules independent from space and time, only the classifi cation is possible of the various patterns. Therefore, empirical research is necessary to know the actual problems of local conditions and specifi c geographies and for giving advices for curing problems, at least, if it is possible.
Neighborhood research has a long tradition and this is mirrored in the introductory parts of contemporary papers. However, contemporary and recent research papers on trust and happiness often declare the novelty of this research topic. This is minimally questionable. Thoughts about trust of popular ideologist, such as Fukuyama, Putnam or Coleman are close to the triviality and well-known for classical economists too. Brereton et al (2008) writes that “However, it wasn’t until the 1990s that researchers began to examine this spatial aspect of well-being in the economic psychology literature. These more recent papers found that characteristics of people’s immediate surroundings (their locality) infl uenced their well-being, but
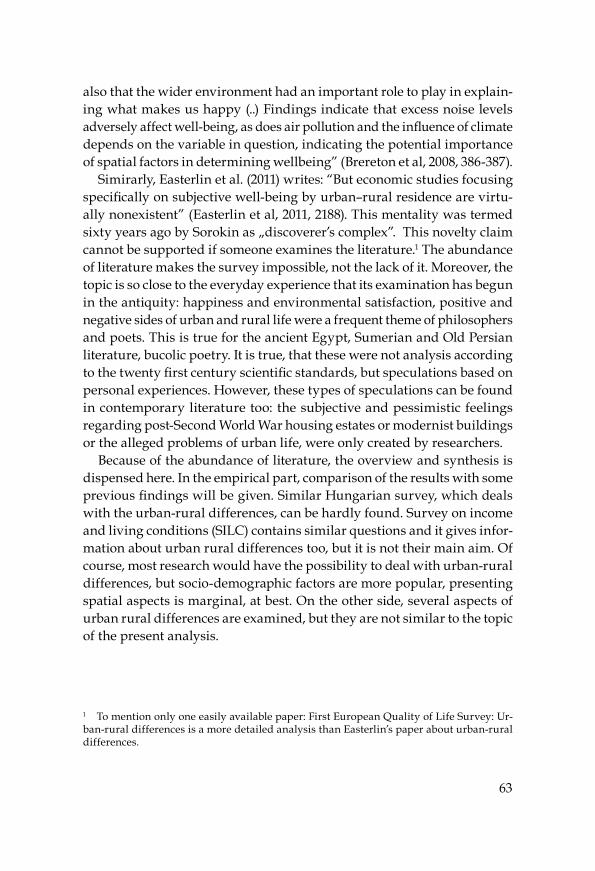
63
also that the wider environment had an important role to play in explain-ing what makes us happy (..) Findings indicate that excess noise levels adversely affect well-being, as does air pollution and the infl uence of climate depends on the variable in question, indicating the potential importance of spatial factors in determining wellbeing” (Brereton et al, 2008, 386-387).
Simirarly, Easterlin et al. (2011) writes: “But economic studies focusing specifi cally on subjective well-being by urban–rural residence are virtu-ally nonexistent” (Easterlin et al, 2011, 2188). This mentality was termed sixty years ago by Sorokin as „discoverer’s complex”. This novelty claim cannot be supported if someone examines the literature.1 The abundance of literature makes the survey impossible, not the lack of it. Moreover, the topic is so close to the everyday experience that its examination has begun in the antiquity: happiness and environmental satisfaction, positive and negative sides of urban and rural life were a frequent theme of philosophers and poets. This is true for the ancient Egypt, Sumerian and Old Persian literature, bucolic poetry. It is true, that these were not analysis according to the twenty fi rst century scientifi c standards, but speculations based on personal experiences. However, these types of speculations can be found in contemporary literature too: the subjective and pessimistic feelings regarding post-Second World War housing estates or modernist buildings or the alleged problems of urban life, were only created by researchers.
Because of the abundance of literature, the overview and synthesis is dispensed here. In the empirical part, comparison of the results with some previous fi ndings will be given. Similar Hungarian survey, which deals with the urban-rural differences, can be hardly found. Survey on income and living conditions (SILC) contains similar questions and it gives infor-mation about urban rural differences too, but it is not their main aim. Of course, most research would have the possibility to deal with urban-rural differences, but socio-demographic factors are more popular, presenting spatial aspects is marginal, at best. On the other side, several aspects of urban rural differences are examined, but they are not similar to the topic of the present analysis.
1 To mention only one easily available paper: First European Quality of Life Survey: Ur-ban-rural differences is a more detailed analysis than Easterlin’s paper about urban-rural differences.

64
3. Empirical analysis
3.1 Neighborhood satisfactionThere were many items on the neighborhood satisfaction in the question-naire. However, another paper also analyzes this question, therefore only the urban-rural aspects will be investigated here. The most general ques-tion was: “How satisfi ed are you with your neighborhood?”. Answers could be given in a 10 point Likert scale: 0 perfectly dissatisfi ed, 10 perfectly sa-tisfi ed. The means of answers can be seen on Figure 1, according to the genders. The differences are not big, similar to other aggregative studies. Cities with county rights are the most satisfi ed category on average, diffe-rences between genders are smaller in this category. The least satisfi ed ca-tegory is the villages, its average is 0.21 less than the cities with county rights. (The differences between the various categories are signifi cant at 5% level, if they are greater than 0.04; minor differences can occur because of small differences in the number of observations and standard devia-tion.) There are some differences between the various age categories: the smallest level of satisfaction is at the middle age category (5.82). This is a similar fi nding to the previous, long ago known empirical facts (La Gory et al, 1985; Lawton, 1980): the older persons are generally the most satisfi -ed with their neighborhood (in this survey the average of above 60 year old persons is 6.30).
Figure 1 Neighborhood satisfaction according to the settlement category and gender
Source: Questionnaire survey about economic and social confl icts, 2013

65
Age distribution is slightly distinct at various settlement categories, therefore age standardized averages were also calculated for both genders. The differences are minor: the biggest one occurred in villages and with women, but its size is only 0.03. Standardization with other socio-demo-graphic variables did not resulted with bigger differences. This is interest-ing, because it shows that only a small fraction of these spatial differences can be originated from the uneven spatial distribution of the socio-demo-graphic variables, their major part is pure spatial differences. According to the results, the inhabitants of cities with county rights are the most satisfi ed with their neighborhood, inhabitants of villages are the least satisfi ed. In the last case, worthy of note, that there are huge differences between the genders: women are more satisfi ed than men in villages.
Compared to the neighborhood satisfaction, satisfaction with the set-tlement is much higher in each category (Figure 2), the average difference is 0.28. The biggest difference between neighborhood and total settlement satisfaction can be seen in the case of Budapest, here the latter one is high-er with 0.55. Gender differences remained in villages, where women are more satisfi ed than the men with the total settlement, as well.
Figure 2 Settlement satisfaction according to settlement category and gender
Source: Questionnaire survey about economic and social confl icts, 2013
Compared to the neighborhood satisfaction, there is a slightly different result to the question of description of neighborhood. The answer to this question could be given in a 5 point Likert scale, from very depressing to very pleasant. The average became 3.52, the expected average is 3 (3 was the choice for average satisfaction). This means that own neighborhood is
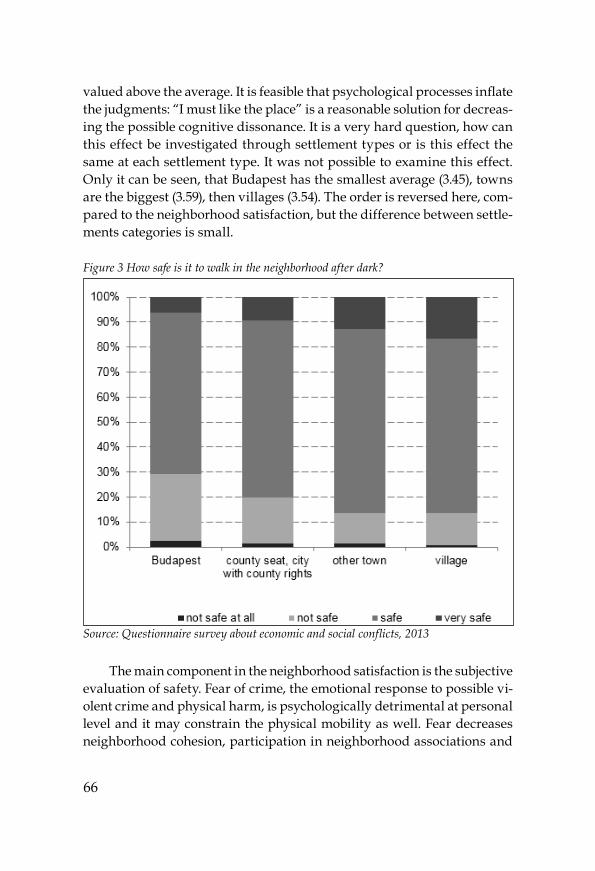
66
valued above the average. It is feasible that psychological processes infl ate the judgments: “I must like the place” is a reasonable solution for decreas-ing the possible cognitive dissonance. It is a very hard question, how can this effect be investigated through settlement types or is this effect the same at each settlement type. It was not possible to examine this effect. Only it can be seen, that Budapest has the smallest average (3.45), towns are the biggest (3.59), then villages (3.54). The order is reversed here, com-pared to the neighborhood satisfaction, but the difference between settle-ments categories is small.
Figure 3 How safe is it to walk in the neighborhood after dark?
Source: Questionnaire survey about economic and social confl icts, 2013
The main component in the neighborhood satisfaction is the subjective evaluation of safety. Fear of crime, the emotional response to possible vi-olent crime and physical harm, is psychologically detrimental at personal level and it may constrain the physical mobility as well. Fear decreases neighborhood cohesion, participation in neighborhood associations and

67
community ties (McCrea, 2005), but these consequences are not supported by every research (Baba – Austin, 1989). Many items in the questionnaire dealt with this problem, the most direct was the following: What is your opinion, how safe is walking alone in your neighborhood after dark? Answers could be given from perfectly safe (4) to not safe at all (1) scale. (Figure 3) The results are not surprising: in accordance with the expecta-tions and the previous research, Budapest has the least subjective sense of safety (2.57) and it is the highest in villages (2.89). Women are more fearful of crime than men in each settlement category, the average difference is 0.15. The difference between women and men is the smallest in villages, which is the safest settlement category.
Almost the same question was asked in the EU-SILC 2013 survey. Un-fortunately the answer is not presented in the research publication, only the answers for a very similar question: Sense of safety in the neighborhood at night. The possible answers: I feel myself in big danger, I feel myself in moderate danger, I feel myself in quite safe, I feel myself in very safe. The results are the same from the point of view, that the sense of safety is the highest in villages. However, in the EU-SILC survey, Budapest was the second one, then towns and the last one were cities with county towns. The other difference is that the two endpoints of the scale are much more represented in the EU-SILC survey than in our survey.
One obvious fi nding of previous research is that the best predictor of fear of crime is sex, at least from the socio-demographic variables (Hale, 1996). In our research the spatial aspect was more important. In the vil-lages the average of women was 2.84, in Budapest the average of men was 2.66, consequently the spatial differences overshadow the gender differ-ences, in spite of the high level of spatial aggregation. A more detailed spatial division may create a much bigger differences as well, but gender cannot be divided into more than two parts.
Fear of crime was asked in other forms too. This is advantageous, because global fear of crime mixes attacks on persons and wealth, burglary, robbery and homicide. These can be mostly hypothetical and unreal situations, therefore fear of crime can be overvalued (Hale, 1996; Farrall, 1997). This can be seen very well by the answer to the next question: Do you fear of-fenders while at home alone at night? The total average of the answers (scaling is the same as before) 3.49, opposite to the previous 2.72. This is a more concrete form of fear, 59 % of respondents never feel it, 33% only rarely. Gender differences (0.42) in this question are higher than in the

68
previous question and as between Budapest and villages (0.14). Thus this is a more personality dependent form of fear, but the neighborhood also plays a role in it. According to the answers, those who fear at home, he or she fears in the street as well, but the opposite is not true: those who fear in the street, he or she does not necessarily fear at home.
Another question also has a relative form: the chance of burglary or violent attack in the neighborhood, compared to the country average. There is no difference between Budapest and cities with county rights, towns have a better position and villages are the best. (Table 1) Country average became 2.19, which means averagely a better subjective fearing of safety of neighborhood as the country average. The answers are not very differ-ent according to the sex and age.
Table 1 Subjective relative safety of neighborhood compared to the country average
Total Men Women Younger adults
Middle age adults Elder adults
Budapest 2.38 2.43 2.33 2.34 2.42 2.38Cities with county rights 2.43 2.39 2.46 2.40 2.51 2.38
Other towns 2.15 2.15 2.15 2.06 2.30 2.08Villages 1.95 1.99 1.92 2.00 1.92 1.94Total 2.19 2.19 2.19 2.17 2.25 2.16
Source: Questionnaire survey about economic and social confl icts, 2013
Wide range of possible problems was asked, how important are they to the neighborhood. Six from these can be interpreted as direct and ob-vious neighborhood problem. The others either as general problems, not necessarily connected to the settlements (for example alcoholism, family violence), but their perception can be infl uenced by the home of the re-spondents. Or there are problems which are not at all true problems for the ordinary people, just constructed by the researchers: segregation of riches. Not important (1) and important (5) were the two endpoints of the scale, and besides this, there was a not at all (0) category too. The averages can be seen in Table 2 (more accurate presentation of the results is disre-garded). The most important differences are between the villages and towns/cities, differences among the three city categories are mainly not signifi cant. The only one problem which is as important in villages as in the cities is the increasing poverty. However, this is not a neighborhood or a spatial problem, but a social problem with spatial dimensions. The

69
biggest differences are in homelessness, which is understandable, because homelessness is a typical urban problem, independently form the spatial origins of homeless people.
Table 2 Problems of neighborhood
Short description of the problem Total Budapest
Cities with county rights
Other towns Villages
Increasing poverty 3.52 3.20 3.63 3.64 3.51Alcoholism 2.73 2.70 3.12 2.87 2.30Burglary, robbery 2.50 2.78 2.73 2.58 2.09Illegal waste deposit 2.43 2.42 2.62 2.57 2.13National, ethnic confl icts 2.29 2.59 2.44 2.62 1.64Family violence 2.19 2.27 2.51 2.42 1.66Rich and poor people living beside each other 2.03 2.23 2.40 2.12 1.54
Taking drugs 2.02 2.37 2.69 2.14 1.21Economic crime 2.02 2.09 2.50 2.33 1.32Segregation of rich and poor people 1.97 2.29 2.43 2.05 1.35
Homelessness 1.94 2.58 2.98 1.88 0.87Violent crimes against persons 1.88 2.14 2.35 1.99 1.30
Organized crime 1.68 2.06 2.23 1.78 1.02Prostitution 1.42 1.87 1.88 1.47 0.79
Source: Questionnaire survey about economic and social confl icts, 2013
Sense of safety is better and problems are moderate in villages. In spite of this, general satisfaction (neighborhood and settlement level too) was the lowest in villages. This shows the complexity of satisfaction: several objective circumstances (working possibilities, accessibility and quality of services, and so on) and subjective reasons and personal realities stand behind the valuation process. Optimal settlement, optimal neighborhood, optimal home from every imaginable point of view does not exist. Optimality belongs to the world of utopias at an individual level and much more on a group level.
This type of aggregate neighborhood research has serious constraints, because searching for the sources of neighborhood problems and of their possible solutions have to be based on the knowledge of individual situa-
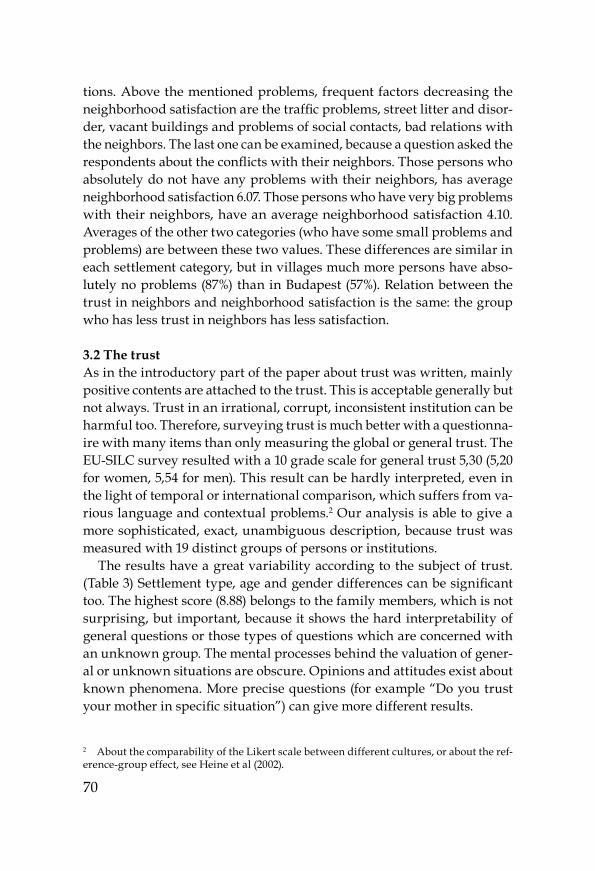
70
tions. Above the mentioned problems, frequent factors decreasing the neighborhood satisfaction are the traffi c problems, street litter and disor-der, vacant buildings and problems of social contacts, bad relations with the neighbors. The last one can be examined, because a question asked the respondents about the confl icts with their neighbors. Those persons who absolutely do not have any problems with their neighbors, has average neighborhood satisfaction 6.07. Those persons who have very big problems with their neighbors, have an average neighborhood satisfaction 4.10. Averages of the other two categories (who have some small problems and problems) are between these two values. These differences are similar in each settlement category, but in villages much more persons have abso-lutely no problems (87%) than in Budapest (57%). Relation between the trust in neighbors and neighborhood satisfaction is the same: the group who has less trust in neighbors has less satisfaction.
3.2 The trustAs in the introductory part of the paper about trust was written, mainly positive contents are attached to the trust. This is acceptable generally but not always. Trust in an irrational, corrupt, inconsistent institution can be harmful too. Therefore, surveying trust is much better with a questionna-ire with many items than only measuring the global or general trust. The EU-SILC survey resulted with a 10 grade scale for general trust 5,30 (5,20 for women, 5,54 for men). This result can be hardly interpreted, even in the light of temporal or international comparison, which suffers from va-rious language and contextual problems.2 Our analysis is able to give a more sophisticated, exact, unambiguous description, because trust was measured with 19 distinct groups of persons or institutions.
The results have a great variability according to the subject of trust. (Table 3) Settlement type, age and gender differences can be signifi cant too. The highest score (8.88) belongs to the family members, which is not surprising, but important, because it shows the hard interpretability of general questions or those types of questions which are concerned with an unknown group. The mental processes behind the valuation of gener-al or unknown situations are obscure. Opinions and attitudes exist about known phenomena. More precise questions (for example “Do you trust your mother in specifi c situation”) can give more different results.
2 About the comparability of the Likert scale between different cultures, or about the ref-erence-group effect, see Heine et al (2002).
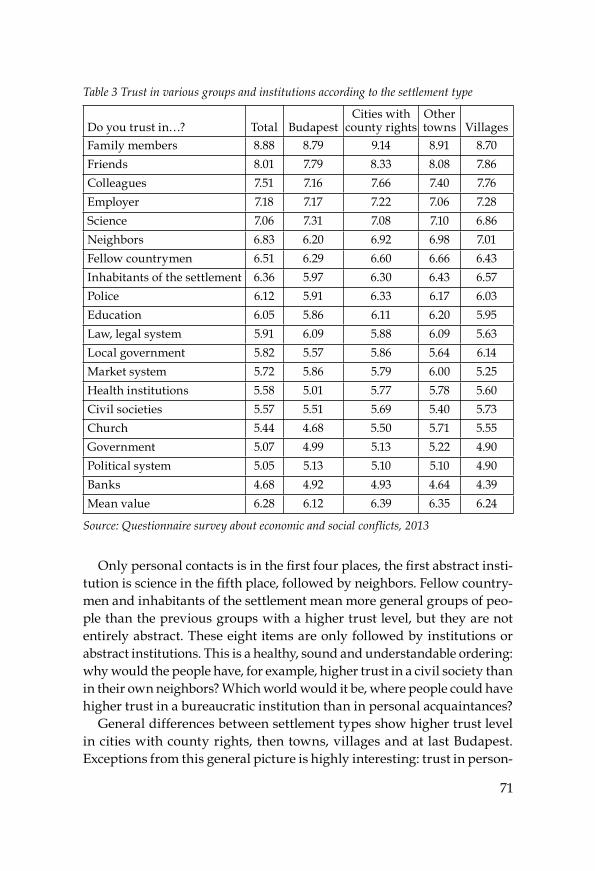
71
Table 3 Trust in various groups and institutions according to the settlement type
Do you trust in…? Total BudapestCities with
county rightsOther towns Villages
Family members 8.88 8.79 9.14 8.91 8.70Friends 8.01 7.79 8.33 8.08 7.86Colleagues 7.51 7.16 7.66 7.40 7.76Employer 7.18 7.17 7.22 7.06 7.28Science 7.06 7.31 7.08 7.10 6.86Neighbors 6.83 6.20 6.92 6.98 7.01Fellow countrymen 6.51 6.29 6.60 6.66 6.43Inhabitants of the settlement 6.36 5.97 6.30 6.43 6.57Police 6.12 5.91 6.33 6.17 6.03Education 6.05 5.86 6.11 6.20 5.95Law, legal system 5.91 6.09 5.88 6.09 5.63Local government 5.82 5.57 5.86 5.64 6.14Market system 5.72 5.86 5.79 6.00 5.25Health institutions 5.58 5.01 5.77 5.78 5.60Civil societies 5.57 5.51 5.69 5.40 5.73Church 5.44 4.68 5.50 5.71 5.55Government 5.07 4.99 5.13 5.22 4.90Political system 5.05 5.13 5.10 5.10 4.90Banks 4.68 4.92 4.93 4.64 4.39Mean value 6.28 6.12 6.39 6.35 6.24
Source: Questionnaire survey about economic and social confl icts, 2013
Only personal contacts is in the fi rst four places, the fi rst abstract insti-tution is science in the fi fth place, followed by neighbors. Fellow country-men and inhabitants of the settlement mean more general groups of peo-ple than the previous groups with a higher trust level, but they are not entirely abstract. These eight items are only followed by institutions or abstract institutions. This is a healthy, sound and understandable ordering: why would the people have, for example, higher trust in a civil society than in their own neighbors? Which world would it be, where people could have higher trust in a bureaucratic institution than in personal acquaintances?
General differences between settlement types show higher trust level in cities with county rights, then towns, villages and at last Budapest. Exceptions from this general picture is highly interesting: trust in person-
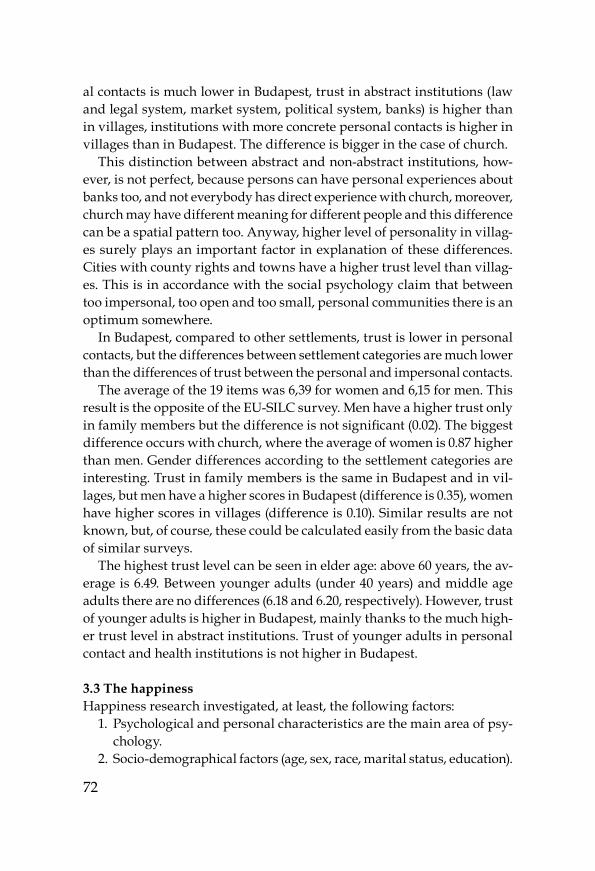
72
al contacts is much lower in Budapest, trust in abstract institutions (law and legal system, market system, political system, banks) is higher than in villages, institutions with more concrete personal contacts is higher in villages than in Budapest. The difference is bigger in the case of church.
This distinction between abstract and non-abstract institutions, how-ever, is not perfect, because persons can have personal experiences about banks too, and not everybody has direct experience with church, moreover, church may have different meaning for different people and this difference can be a spatial pattern too. Anyway, higher level of personality in villag-es surely plays an important factor in explanation of these differences. Cities with county rights and towns have a higher trust level than villag-es. This is in accordance with the social psychology claim that between too impersonal, too open and too small, personal communities there is an optimum somewhere.
In Budapest, compared to other settlements, trust is lower in personal contacts, but the differences between settlement categories are much lower than the differences of trust between the personal and impersonal contacts.
The average of the 19 items was 6,39 for women and 6,15 for men. This result is the opposite of the EU-SILC survey. Men have a higher trust only in family members but the difference is not signifi cant (0.02). The biggest difference occurs with church, where the average of women is 0.87 higher than men. Gender differences according to the settlement categories are interesting. Trust in family members is the same in Budapest and in vil-lages, but men have a higher scores in Budapest (difference is 0.35), women have higher scores in villages (difference is 0.10). Similar results are not known, but, of course, these could be calculated easily from the basic data of similar surveys.
The highest trust level can be seen in elder age: above 60 years, the av-erage is 6.49. Between younger adults (under 40 years) and middle age adults there are no differences (6.18 and 6.20, respectively). However, trust of younger adults is higher in Budapest, mainly thanks to the much high-er trust level in abstract institutions. Trust of younger adults in personal contact and health institutions is not higher in Budapest.
3.3 The happinessHappiness research investigated, at least, the following factors:
1. Psychological and personal characteristics are the main area of psy-chology.
2. Socio-demographical factors (age, sex, race, marital status, education).

73
3. Economic factors (income, wealth, employment).4. Contextual and situational factors (relation with family members,
friends, colleagues, neighborhood environment, working environ-ment).
5. Temporal closeness of unusual negative and positive life events (death and birth in family, traffi c and other accidents, robbery).
6. Amount of free time.7. Outer institutional, cultural, societal factors (political situation in a
country or other level, practice of religion).8. Environmental and societal catastrophes (wars, natural disasters).
An extra factor for these various factors is the spatial point of view. If some factor has a spatial pattern, then its effect on happiness may lead to spatial differences in happiness too. For example, natural disasters (fl oods, earthquakes) are spatially concentrated and at the same time they have detected short term effect on the level of happiness (Kimball, 2006; Uchida et al., 2014). The economic situation, development also has huge spatial differences, and this factor also has accepted effect on happiness (more wealth - more happiness). Complicated dilemmas of these questions are not treated here, because both country-level and personal-level investiga-tions have just a minor contact with the differences by settlement type. Shortly it will be mentioned, that the results of our survey are the same as the two principal fi ndings of the metaanalysis of happiness (Myers – Diener, 1995; Blanchfl ower – Oswald, 2008; Lelkes, 2008): women are happier than men (the difference is minor), according to the age there is a U shape, the less happiness level is at middle age, at older age there is on increasing tendency, but the happiness level does not reach the level of younger adults.
The main results can be seen in Table 4. The main averages of genders are apparently in contrast with the writing about the gender differences in the previous paragraph. In reality, the share of elder age groups is a little bit higher in the sample than the share of younger adults. Standardized results by age, women have a higher average than men. According to the settlement type, women have a higher happiness level in Budapest, but this is attributable to the big difference in middle ages (here the average of women is higher than men with 0.56). In villages, younger men are happier than women (this is the second largest difference among the 12 possible category differences), in middle age category the women are happier. For the interpretation of the size of difference, it is worth empha-sizing, that these are spatially highly aggregated units, and as this, small-

74
er differences can be treated more important than in the research of psy-chological characteristics.
Table 4 Happiness level according to the settlement categories, gender and age
Category TotalMen Women
Total Youth Middle age
Elder adults Total Youth Middle
ageElder adults
Budapest 6.76 6.68 7.14 6.19 6.62 6.81 7.13 6.75 6.61Cities with county rights
6.90 6.91 7.12 6.68 6.88 6.90 7.37 6.82 6.55
Other towns 6.84 6.93 7.13 6.98 6.66 6.76 7.32 6.49 6.56
Villages 6.71 6.70 7.35 6.21 6.48 6.72 7.14 6.69 6.40Total 6.80 6.81 7.20 6.54 6.64 6.79 7.24 6.67 6.52
Source: Questionnaire survey about economic and social confl icts, 2013
In the total population, the lowest happiness level is in villages. This result is similar to the European Quality of Live Survey (2006) and to the fi ndings of Easterlin et al (2011). In most developed countries, the happiness level is slightly higher in villages, in other countries (middle developed or underdeveloped) in cities. The differences can be mainly traced back to the economic factors and to the better general economic position of cities. This difference is disappearing in the most developed countries, but in other countries it is still valid.
The previously examined two factors, namely neighborhood satisfaction and trust, is connected to the level of happiness. This is a typical two-di-rectional connection: people with higher neighborhood satisfaction are happier, and happier people have higher neighborhood satisfaction. This is true for trust and happiness, as well. Claiming that from the two factors one is reason and the other one is effect is a rather philosophical or view of life question than a scientifi c research task.

75
A Few Characteristics of the Problems in the Private Life and in the Social Relationshipsand of the Resulting Confl ictsZOLTÁ N CSI Z M A DI A
1. Introduction
The purpose of this study is to present a few essential characteristics of personal-private problems in everyday life, interpersonal social-relationship problems in the private sphere, and social confl icts resulting from these problems by means of a nation-wide questionnaire survey (N = 2031 per-sons). The conceptual-theoretical framework of the research and the inter-pretation of social problems and confl icts were already previously expla-ined in detail. In this paper, an attempt is made for a detailed empirical analysis of one component of the fi ve dimensional, comprehensive confl i-ct model (problems of private life and social relationships).
In the fi rst step, after a short conceptual overview and a short overview of the literature, the method of the applied measuring by means of ques-tionnaires, the applied questions in the research, which make up the confl icts indicators, and all of the above mentioned are presented. After-wards, the burdens of problems and confl icts of the population in everyday life will be overviewed. As well as, the occurrence, connection and build-ing on each other of the different forms of problems and confl icts are overviewed. Answers about in which social groups and along which social characteristics the occurrence of such situations happen at a higher prob-ability, are also searched for. What are the characteristics of groups, which are burdened with social problems and confl icts? Finally, a look are taken at the connections between the two phenomena by using the developed indicators for measuring well-being. How close is the correlation between the personal, private and social problems and confl icts of everyday life and the objective and subjective indicators of well-being? Basically, the purpose is to provide a contribution to the issue, which is the background of the whole research program: namely the questions, to what extent, and in which direction different types of confl icts infl uence well-being.
Figure 1, can also be regarded as the content map of the research study,

76
which summarizes each dimension (factors) of the research, the empiri-cally measured components (variables) of the dimensions and the possible directions of correlations between them. The focus of the analysis is cer-tainly an in-depth description and representation of each confl ict variable and an identifi cation of negative attitudes towards life, which are at the same time both causes and consequences of problem situations experienced day-to-day. The possible explanatory factors serve to characterize those social groups, as accurately as possible, in which the private and personal problems and confl icts appear to a greater extent than usual. The arrows show here clearly that the effect and the role of these factors will be ex-plained in the next pages.
Figure 1: Elements and connections of the research
Source: Own collection
The possible determining factors are divided into two groups for a more thorough examination of social well-being, thus, besides the traditional socio-demographic elements, four dimensions of the well-being, can also be included when exploring the correlations. It is possible that the fi gure indicates clearly that the development of confl icts and problem situations is infl uenced by so many factors. In this case, the potential effective factors can also be interpreted from all three fi elds (factor groups).

77
During the examinations three fundamental conceptions are applied. In connection with the concept of the social confl ict, following the concep-tions explained in the theoretical, introductory chapter, it is assumed that there is a confl ict in the most general sense, if the interests of two or more social actors (persons, groups, institutions...etc.) are incommensurable and as a result there is a tension in their relationship to a certain extent (Crouch 2001). The possible most comprehensive defi nition of the concept of a social problem is that it is a socially constructed condition, based on objective facts and subjective perceptions, goes through individual and collective considerations, which jeopardize and undermine the well-being and the expected or targeted quality of life of some, many or all members of the society, in form of immediate damages or disadvantages or in form of narrowing of chances, opportunities or choices (Macionis 2012). Measuring social development, quality of life and well-being became a “hot topic” in the profession in the last years again (Harcsa 2011; Kopp, Martos 2011; Nagy 2014). In connection to well-being the multidimensional approach of the Stiglitz report (Stiglitz, Sen, Fitoussi 2010) is applied, which is based on the assumption that the quality of life of households should be examined in at least eight dimensions (material quality of life, health, education, individual activities, political representation, relationships, environment, factors of uncertainty) in such a way that besides the objective factors (e.g. income, education) also the subjective aspects of well-being (e.g. happiness, satisfaction, lack of negative attitudes toward life) are considered. Within the framework of this research the well-being is be measured in four di-mensions: objective well-being, subjective well-being, health condition, residential environment.
A comprehensive and complete overview of the literature is not the purpose of this paper. However, it should be at least emphasized that the number of scientifi c works, based partly on empirical research, in Hungarian research projects about private and social confl icts is surprisingly low and it concentrates around a few main topics. In the literature of social confl icts the political, social and ethnical, national, religious and environmental aspects are primarily emphasized. Concerning private life, everyday challenges and relationships, four main fi elds of research can be separat-ed. In the case of intra-familial confl icts, a few earlier papers (Cseh-Szombathy 1985; Lengyel 1990; Csepregi 1994) can be regarded even today as a starting point for characterization of marital, partnership and, in a broader sense, of interpersonal confl icts. The most recent literature deals with the instability in partnerships (Pilinszki 2013) and with the intergen-

78
erational confl icts (Janky 2005). In the last few years there is an increasing number of research studies, which review the question of balance, com-patibility and confl icts of work and private life (Barakonyi 2007; Koltai 2010; Makra, Farkas,Orosz 2012; Nagy 2014; Szalma 2014). The third main research fi eld concentrates on social problems and confl icts related to city life, in the broader context of competitiveness, considering challenges caused by areal-regional coexistence (Csizmadia, Molnár, Váradi 2007; Szirmai, Váradi 2009; Szirmai 2009). Finally, following the confl ict inter-pretation and defi nition of well-being of this paper, the examinations re-lated to the quality of life (Kopp, Kovács 2006) and to the mental state of the population (Kopp 2008; Susánszky, Szántó 2013) are the starting points, because satisfaction, happiness and negative attitudes towards life, as the subjective dimension of well-being and causal determinants of confl icts in the private life, are important issues in this work.
2. Methodological questions – possibilities of measuring problems/confl icts in the private life with questionnaires
The fi rst problem indicator perceives the main aspects of the issue generaly-ly, at the level of the Hungarian society, and not considering private house-holds or living conditions. The question was about, in which areas are there the most serious problems in Hungary nowadays, according to the test persons in the sample, who had to select the two most important problems from al-together 14 problems1. In general sense, the determination of scope and we-ight of determining factors behind these confl icts begins at this point.
Negative feelings, attitudes towards life have been measured independent-ly from the specifi c situation or event in general (collectively). The persons, who completed the test, had to respond to certain statements with the help of a fi ve-grade point system.2 Six statements have been formulated, from which two measured the existence of positive and the other four of rather
1 The list of problems, from which it could be selected, was the following: 1. low number of children; 2. condition of democracy; 3. health conditions of the people; 4. everyday liv-ing; 5. home situation; 6. environment pollution; 7. immorality; 8. alcoholism; 9. drug abuse; 10. imperfection of education; 11. number of suicides; 12. confl icts between older and young-er generations; 13. ethnical problems; 14. public safety.2 Answer codes based on a fi ve-grade point system: 1 point = do not agree at all; 5 points = completely agree.

79
negative attitudes.3 With merging of the answer categories „completely agree”, and „rather agree/do not agree” six status indicators of negative atti-tudes toward life as dummy variables have been developed: 1. pessimistic (20,1%, no answer: 0,4%); 2. unsatisfi ed (24,4%, no answer: 0,1%); 3. ignored (16,6%, no answer: 0,7%); 4. perplexed (22,2%, no answer: 0,2%); 5. not ac-knowledged/unappreciated (20,8%, no answer: 2,8%); 6. despised (11,7%, no answer: 3,3%). In the course of the analysis, the background factors behind each condition and the frequency of connection of each negative attitude towards life is examined.
Two specifi c confl ict questions can be regarded as the central part of the research. These questions measured, possible problems and confl ict situ-ations related to the private life situation or in a broader context, to the narrow environment of the person (family, workplace, social networks). The two questioned areas were the following: 1) probability and frequen-cy of various types of problems in the private life in the last year; 2) inten-sity of burden on interpersonal relationships caused by confl icts in the test persons’ lives.
Confl icts and problems in private life have been assessed with the following questions: „How frequently4 have the following problems, worries5 arisen, causing confl icts or arguments in your private life? In this case, the main purpose was the determination of confl ict-burden in the private life and the development of a list of hierarchical problems, based on the probabil-ity of occurrence of the problem areas.
The confl ict burden of social life and social networks have been measured with a very simple intensity indicator („How do you feel about the confl ict and tension load in your following social relationships in general?“), where among four options could be selected6 in that case, if the given relationship
3 Statements: 1. I am optimistic regarding the future. 2. The development of my life is as I would like it to be. 3. I feel myself ignored in society. 4. Life became so complicated these days that I can hardly fi nd my way. 5. I do not feel that what I am doing is acknowledged as a value. 6. Some people despise me because of my work/unemployment, income.4 Answer codes based on a four-grade point system: 1 point = hardly ever appears… 4 points = appears very often.5 Problems: 1. earning money, income, living problems; 2. management of larger invest-ments and expenses; 3. household tasks, works to do at home, split of duties; 4. individual ambitions and wishes pushed in the background; 5. problems resulting from learning or educating children; 6. health problems, illnesses; 7. problems from obligations regarding maintaining contacts with family members and relatives; 8. partnership problems; 9. other, especially.… 6 Answer codes based on a four-grade point system: 1 point = not burdened at all … 4 point = completely burdened.

80
form existed in the ego-network of the test person. The possible directions of connection have been classifi ed into ten types, in the questionnaire.7 With this question, the complexity and confl ict burden of the contact sys-tem could be examined with continuous consideration that the persons answering in the sample are presumably characterized by different contact confi gurations. This confl ict indicator measures essentially, which per-centage of all occurring contact types, which are relevant in the specifi c situation, are loaded at least to a small extent (a point value of at least 3 or 4) with confl icts or problems.8 In this case specifi c content of the problems and confl icts were not asked, because of the lack of time.
Besides the occurrence and intensity of confl icts, the determination of confl ict management features has also been considered as important. On the one hand, how easy (or on the contrary, diffi cult) it is for the test persons to cope with problems, what kind of confl ict management potential they possess. On the other hand, whom can they count on in the case of such problems rising, do they have external private supports, which can be mobilized in such situations, or do they have to rely essentially on them-selves? In this case is the scope of interest of this research the persons, who have been left on their own, without supportive or helping relationships.
In the fi rst step it has to be made clear, how diffi cult people believe con-fl ict management and coping with challenges to be in everyday life.9 Ability to cope with problems has been measured on a 11-grade scale10, where a larg-er value implies a potential of coping with a more diffi cult confl ict. Naturally, it was not possible to examine each problem area of the subject matter, due to the time constraint of the questionnaire. Therefore types of questions, which answers include the word “generally” were required, keeping in consideration that the starting point had to be the most serious challenge. The diffi culties of coping with rising challenges are also a part of the prob-lems in private life. Furthermore, the lower ability to cope with problems can play a role in the development of further confl icts, thus this indicator can be a part of a more complex description of the aspects of the confl ict.
7 1. with his/her partner or spouse; 2. with his/her parents; 3. with his/her children; 4. with his/her brothers and sisters; 5. with his/her other relatives; 6. with friends; 7. with his/her neighbours; 8. with his/her colleagues; 9. with his/her superiors; 10. with professional circles.8 49% of the test persons (996 persons) have not reported a single relationship confl ict therefore the indicator can be related to a narrower part of the sample (1035 persons).9 The question reads as follows: „How diffi cult is it for you, in your opinion, to cope with signifi cant problems in your life?“ 10 1 point = very easy… 11 points = very diffi cult

81
Additionally, a question under consideration is, on whom can rely the individual in such situations, only on him- or herself, or is there a support-ive, protective net around him/her, based on private relationships.11 The presence of supportive relationships has been asked in three areas12: men-tal and emotional support; fi nancial support; support and care in a phys-ical sense. The main question was to decide, to which extent was the indi-vidual left in these situations on their own and with their own resources and on whom they count primarily in the form of supportive relationships.13
3. The basic characteristics of problem indicators
In the context of the most important problems, perceived in present Hun-garian society, the way of thinking of the people follows a relatively simp-le pattern. Despite the 14 predefi ned problem areas, and the possibility of other answers, only two factors from the answers are striking remarkably (Figure 2).
Figure 2: The most important problems in the Hungarian society of today, % (N=1990)
Source: Questionnaire survey about economic and social confl icts, 2013
11 The question reads as follows: „Whom can you count on in the fi rst place, if you need help in the following areas in mitigating or solving of problems?“12 Relationship types used at the previous indicator was applied also in this case.13 The confl ict variables above with the exact question and frequency distributions can be found in the annexes.

82
In the fi rst place, as the most important problem, a major share (57%) of the test persons mentioned problems with everyday living, this is followed by the health condition (16%), which is the dominant factor of the second mentionings as well (43%). In the list housing situation, low number of children and public safety are also mentioned, with lower proportion of occurrence, though. The proportion of votes for the other factors is insig-nifi cant (it is only around 1-2 percent). The most test persons have presum-ably answered the questions by taking their own environment as a starting point. Therefore it seems to be practical to compare the answers with the logic and composition of the problem system defi ned by their own situation.
The probability of frequency of problems in private life, which led to frequent confl icts or disputes in the own life of the test persons in the last year, has a similar logic (Table 1). From the four answer options, only the categories “often” and “very often” are dealt with. The sample is divided in two equal groups. 50 percent of the test persons had at least one kind of problem in the private life often or very often in the last year. In the other half of the sample there are only rarely occurring problems.
Table 1: Problems occurred often or very often in the last year, %
Problems Question is irrelevant, %
Whole popu-lation, %
Only, if the question is relevant, %
Earning money, income, living diffi culties 12 33 38
Managing of larger invest-ments, expenses 15 23 28
Risk of losing job, unemploy-ment 50 12 25
Health problems, illnesses 11 19 22Individual ambitions, wishes pushed in the background 16 15 18
Household tasks, works to do at home, split of duties 10 13 14
Problems resulting from learn-ing or educating children 51 6 14
Maintaining contacts with fam-ily members and relatives 9 6 7
Problems in partnership 32 4 6
Source: Questionnaire survey about economic and social confl icts, 2013
83
In the problem system the main parts are defi nitely the factors related to fi nances, quality of life and living. During the weekdays the most vital problems are in connection with earning money, living, management of larger investments and expenditures and with the risk of losing job or unemployment. These generate disputes and confl icts in the households with the highest probability. In the middle of the order of frequency, roughly at each fi fth test person, health problems, individual ambitions and complications around diffi culties with self-fulfi lment play a role. The occurrence of problems based on social relationships is surprisingly low. Among those people concerned, the probability of occurrence often or very often of such private confl icts was only 6-7 percent.
A more serious accumulation of problems and confl icts, which occur more frequently and return many times, is very rare (Figure 3).14 In half of the sample there was no problem area, in 18 percent only one and in 13 percent at most two problem areas have occurred more often in the last year.
Figure 3: Index of complexity of problems in private life – How many problems have occurred, from the possible nine, at least often or very often, in the last year? % (N=2031)
Source: Questionnaire survey about economic and social confl icts, 2013
According to their complexity three groups are developed, which are examined later more thoroughly. The largest group is the set of those people, where none of the problems occurs frequently (50%), the second group belong to those, with two types of problems occurring more fre-
14 The complexity of problems in the private life has been measured in that way, that it was counted in how many cases the questioned person answered at least with the category of answer „occurs often”, or „occurs very often”.

84
quently (32%) at most and in the third group are those people, who are burdened by private problems to a greater and more intensive extent (18%).
With crosstab analysis the probability of occurrence of the 9 listed fac-tors is examined in the two groups with different problem loads (Table 2). The values are suitable to specify the phenomena, which are the core of the problem situations in the private life in the two groups.
Table 2: Occurrence of each problem types in the two groups, loaded with problems, %
Problems Group 2 – 32%(problems 1-2)
Group 3 – 18%(problems 3-8)
Earning money, income, living diffi culties 52% 90%Management of larger investments, expenses 26% 82%Risk of losing job, unemployment 17% 32%Health problems, illnesses 31% 51%Individual ambitions, wishes pushed in the background
13% 56%
Household tasks, works to do at home, split of duties
11% 52%
Problems resulting from learning or educating children
5% 26%
Maintaining contacts with family members and relatives
3% 30%
Problems in partnership 2% 18%Source: Questionnaire survey about economic and social confl icts, 2013
It can be easily noticed that in the group with the complex problem situation, the challenges of living (the fi rst two factors), which are present with almost everybody, are extended by nonmaterial factors with different probabilities. Particularly high is the probability of occurrence of disputes and confl icts in the area of health, self-fulfi lment and the split of duties at home.
The connections between the problems can also be measured by analysis of correlations between the total points indicating the occurrence (Figure 4). The correlation coeffi cients between the factors are signifi cant; each time they indicate a positive relationship and the values are spread between 0.245 and 0.642. In six cases the values of the positive correlation coeffi cients in pairs are particularly strong.

85
Figure 4: Connection of each problem area – correlation coeffi cient in pairs
Workplace 0.642 Earning moneyEarning money 0.630 Larger expenditures
Family relationships 0.601 PartnershipIndividual ambitions 0.540 Learning or educating childrenIndividual ambitions 0.520 Household, housework
Household, housework 0.488 Learning or educating children
Source: Questionnaire survey about economic and social confl icts, 2013
Our social relationships are essential confl ict channels in our everyday life; they are fi elds of development and refl exion of confl icts, while in some cases they are effi cient tools for handling confl icts as well. It is obvious that relationship confl icts are dependent on the interactions. It is diffi cult to generalize this question. It was not possible to carry out a more thorough examination of social networks during the questionnaire survey, therefore the tensions during interpersonal relationships could not be analysed with complete accuracy. In spite of this, questions had been asked about the load of some kind of social contact forms with confl icts and tensions (Table 3).15 A contact is considered as loaded with confl ict, if the test person had chosen at least the answer “loaded to a small extent” (the answers loaded very much and loaded completely clearly belonged to this category).16 Measuring the phenomenon in this way, mainly those questions could be answered, what is the probability of carrying signs of confl icts at each type of connection.
Table 3: How do you feel your social contacts are loaded with confl icts and tensions generally? – The relationship is loaded at least to a small extent, %
Direction of relationships
Do you have this kind of
relationship?, %
Was there a confl ict at least to a small
extent?, %With superiors 47 33With direct colleagues 49 30
15 At each direction of relationship, a general answer had to be given, not regarding a spe-cifi c person in the relationship, and the extent of the burdening had to be measured with a four-grade point system.16 It concerns only those, who have this given form of relationship. The probability of oc-currences has been calculated only related to these test persons.

86
Direction of relationships
Do you have this kind of
relationship?, %
Was there a confl ict at least to a small
extent?, %With partner, spouse 60 26With other relatives 96 24With neighbours 99 24With parents 62 23In professional relationships 48 22With brothers and sisters 81 21With own children 70 19With friends 96 14
Source: Questionnaire survey about economic and social confl icts, 2013
Basically all values are low, considering the fact that even a load to a small extent is regarded as an acceptable criterion. In case of all relationship forms, two-thirds of the population has not reported any tensions or prob-lems. Generally relations regarding working environment (30-33 percent-age of the concerned persons) and in the interactions of partnership rela-tions (one-quarter of the concerned persons) are loaded with confl icts to the highest extent. The most stable relationships are developed with inter-action forms which are based on strong bonds with friends, children and brothers and sisters.
An indicator for measuring the complexity of confl ict-load of the relationship system has been developed. From the 10 different listed relationship direc-tions, 7 types occured in the case of persons included in the sample. It can be concluded from this, that most of them have a complex relational system. Of course there is no information about connection points, which could be assigned to each type of relationship direction and this question will not be dealt with. On the other hand, it can be said at which proportion of all existing relationship directions some kind of confl ict, dispute or tension occurred, at least to a small extent. The higher the percentage indicator is, the higher the load ratio of the social relationships of the test person with confl icts is (Figure 5). Within the whole sample, problems and confl icts, based on the same kind of relationships, occurred to 1035 persons. On average in 43 percent of the relationship types a confl ict occurred, at least to a small extent. The values are between 10 and 100 percent, the standard deviation is 27.2. In the case of simpler, more restricted personal relation-

87
ships, which includes only a few types of binding (relationship types 1-5) the average value is 50 percent, while at truly complex relationship systems (relationship types 8-10) the load indicator is around 40 percent.
Figure 5: Indicators of confl ict load of relationship system
How many relationship types are loaded at least to a small extent with confl icts from the possi-ble 10?
The development of the average of the load
indicators, according to the number of
relationship types.
Development of load indica-tor, 4 groups
Valid answers: 1035 per-sonsAverage: 43%Median: 37%Standard deviation: 27%
1-4 types – 49%5-7 types – 46% 8-10 types – 40%
1-16% - 158 persons (15,3%)17-43% - 438 persons (42,3%)44-72% - 255 persons (24,6%)72-100% - 185 persons (17,8%)
The confl ict load of the relationship system is above average:
44-71%72-100%
255 persons (12,5% of the whole sample)
185 persons (9,1% of the whole sample)
Source: Questionnaire survey about economic and social confl icts, 2013
Categorizing the results, two groups are formed, in which it can be observed, that the number of participants’ interaction channels, loaded with confl icts, is more than average. Considering the whole sample, each fi fth person is a member in one of the two groups, but even the size of the category of a more complex load (72-100%) is 9 percent.
In the problem treatment area a simple question was measured generally, how easy or diffi cult is it for the test persons to overcome major problems in everyday life (Figure 6).17
17 The question had to be scored from zero until ten (0 = very diffi cult…10 = very easy). Because of the topics the scale had been turned around. The higher the value was, the more diffi cult it was for the test person to cope with larger problems.

88
Figure 6: Diffi culty of overcoming major problems, % (N=2011)
Source: Questionnaire survey about economic and social confl icts, 2013
The larger part of the population, following the usual answer pattern for these questions, considers the diffi culty of overcoming problems and confl icts as an average. However, in this study the extreme values are of importance. For the later examinations, the upper segment of the normal-ly distributed indicator will be of importance, which is the group of those persons, who consider the process of problem handling and overcoming confl icts rather diffi cult (7-8 points, 464 persons, 23%), or really diffi cult (9-11 points, 237 persons, 12%).
Figure 7: On whom can you count in the fi rst place, if you need help – the two most frequent categories of answers, %
Source: Questionnaire survey about economic and social confl icts, 2013
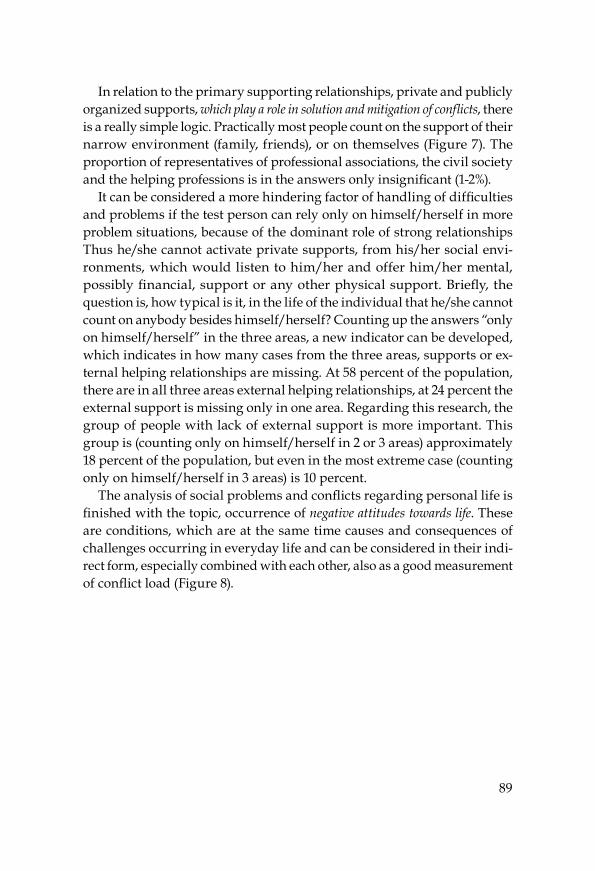
89
In relation to the primary supporting relationships, private and publicly organized supports, which play a role in solution and mitigation of confl icts, there is a really simple logic. Practically most people count on the support of their narrow environment (family, friends), or on themselves (Figure 7). The proportion of representatives of professional associations, the civil society and the helping professions is in the answers only insignifi cant (1-2%).
It can be considered a more hindering factor of handling of diffi culties and problems if the test person can rely only on himself/herself in more problem situations, because of the dominant role of strong relationships Thus he/she cannot activate private supports, from his/her social envi-ronments, which would listen to him/her and offer him/her mental, possibly fi nancial, support or any other physical support. Briefl y, the question is, how typical is it, in the life of the individual that he/she cannot count on anybody besides himself/herself? Counting up the answers “only on himself/herself” in the three areas, a new indicator can be developed, which indicates in how many cases from the three areas, supports or ex-ternal helping relationships are missing. At 58 percent of the population, there are in all three areas external helping relationships, at 24 percent the external support is missing only in one area. Regarding this research, the group of people with lack of external support is more important. This group is (counting only on himself/herself in 2 or 3 areas) approximately 18 percent of the population, but even in the most extreme case (counting only on himself/herself in 3 areas) is 10 percent.
The analysis of social problems and confl icts regarding personal life is fi nished with the topic, occurrence of negative attitudes towards life. These are conditions, which are at the same time causes and consequences of challenges occurring in everyday life and can be considered in their indi-rect form, especially combined with each other, also as a good measurement of confl ict load (Figure 8).

90
Figure 8: Occurrence of negative attitudes towards life („entirely true”, or „rather true” answers), %
Source: Questionnaire survey about economic and social confl icts, 2013
One-fi fth of the persons, who answered the questions, occasionally even a quarter, reported some kind of negative attitudes toward life (e.g. pessi-mistic about his/her future, unsatisfi ed with the course of his/her life until now, his/her merits will not be acknowledged, he/she is unsuccessful in today’s world), moreover 17 percent feel ignored in the society, 12 percent think that he/she is despised because of his/her job, income or standard of living. There is no connection of individual status indicators in the majority of the population: there are no such negative attitudes toward life in 49 percent of the sample, in 21 percent, at most in one case and in 19 percent, at most in 2-3 cases. On the other hand, 11 percent of the tested persons reported in at least 4 questions about such problems.
As it is apparent, the endeavour during the descriptive analyses at each confl ict and problem indicator is that the group of people should be high-lighted, in whose life the values of individual status indicators are below average or sometimes even unexpectedly high and extreme. After identi-fi cation of such persons, who are loaded with problems to a greater extent, it will be examined which common characteristics those groups have and what the connection system is of the individual problem indicators in the everyday life of individuals.

91
4. Connection of problem and confl ict situations
According to the descriptive analysis, altogether fi ve status indicator group variables18 have been proven as suitable for identifi cation of different aspe-cts of challenges in private life. In the next phase of the analysis, the cor-relation is examined between these status indicators of problem and confl i-ct situations. All fi ve index numbers (Table 4) represent some kind of con-dition or situation, thus they are suitable to separate such kind of specifi c groups in the national representative sample, in which it is characteristic for the participants that problems and confl icts in private life occur to a greater extent.
Table 4: Weight of the fi ve problem indicator status variables in the whole sampleVariables Number
of elementsFrequency
1. Occurrence of at least 3 different types of confl icts from the possible 9 in private life during the last year (e.g. living, health, split of duties in the family).
375 18,5%
2. At least 70 percent of relationship types are loaded with confl icts.
185 9,1%
3. Diffi cult or very diffi cult coping with major problems in his/her life.
237 11,8%
4. He/she can count only on himself/herself in case of problems or confl icts.
347 17,5%
5. Occurrence of negative attitudes to-ward life in at least three areas from the possible six (e.g. pessimism, dissatisfac-tion, state of being ignored).
354 17,5%
Source: Questionnaire survey about economic and social confl icts, 2013
The probability of connection of each condition has been examined with crosstab analysis (Figure 9). Apart from the lack of external, helping sup-ports, in each case, a signifi cant correlation can be observed between the problem indicator status variables (for the interpretation of the fi gure, see the explanation). The most obvious and logical correlation can be observed
18 Because of the kind of questions asked, variables with an ordinal measure level could be developed at most, which are calculated in the most cases from the occurrence of “some special situations”. Thus, it seems to be more suitable, if the presence of confl ict situations is measured primarily with the occurrence or lack of “some special situations” in everyday life.

92
between the ability of problem handling and the complexity of problems. Among those who can cope hardly with everyday challenges, the propor-tion of occurrence of a complex problem system is twice higher (44 percent compared to the average of 19 percent, of the sample). Similarly convincing is the relation of social network and accumulation of problems.
Figure 9: Correlation between the status variables – crosstab-analysis, cell frequency of characteristics by pairs, %
23%
24%
26%
20%
1. Complex problem
system 19%
2. Relationship system with conflicts 9%
3. He/she can hardly cope with problems
12%
4. He/she can rely mainly on
himself/herself 18%
30%
39%
28%%
44%%
Explanation: The values show the probability of occurrence of characteristics pair-wise. E.g. if the problem system is complex, then 28 percent of those persons also can hardly cope with problems, which is a much higher probability, than the av-erage of 12 percent in the whole sample. The arrow in the opposite direction implies that 44 percent of those, who have diffi culties coping with problems, report a complex problem system, although the proportion of people under such conditions is only 19 percent in the whole sample. The thickness of the arrows shows the strength of correlation.Source: Questionnaire survey about economic and social confl icts, 2013
Of course the concentration of confl ict situations and problems in private life also have an impact on the area of negative attitudes toward life. It is analysed in groups loaded to a greater extent with problems, to which extent are those participants overrepresented, who have more than one negative attitude towards life. In the complete sample, 17.5 percent of the test persons reported negative attitudes toward life in at least three areas. On the contrary, this proportion among people with a complex problem system is 36 percent, among those people, who can hardly cope with prob-

93
lems is 51 percent and among people with relationship system with confl icts is 25 percent. In case of lack of supportive, helping relationships no signif-icant differences can be observed among the answers. From the various forms of negative judgements of life situations, problems have the strongest infl uence on the dissatisfaction and on the pessimistic future prospects. Furthermore, it can clearly be seen in the results (Figure 10) that these values are also extraordinarily high among those, who have diffi culties coping with problems.
Figure 10: Occurrence of different forms of negative attitudes toward life in groups, which are loaded with problems to a greater extent, %
Source: Questionnaire survey about economic and social confl icts, 2013
5. Social characteristics of groups with private problems and confl icts
It has turned out previously that in the subjective judgement of problem situations and confl ict situations in the context of everyday life, the key factors are those incidents, which are related to fi nancial conditions, costs of living and work. That means that these are the most frequently occur-ring incidents in households with complex problem systems. Thus, it is not surprising that among the demographical background variables only those play a dominant role, which form these key factors, namely the edu-cational level, the position and the fi nancial conditions (Figure 11).

94
The results make it clear that even though it is not necessarily true that “money does not make you happy” but a more favourable social status will decrease the challenges of everyday life. The occurrence of primary confl ict resources among the population will be moderated signifi cantly by a higher educational level, position as a university/college graduate or by more favourable fi nancial circumstances.
Figure 11: Probability of occurrence of complex problem situations with at least three factors as a function of educational level, position and fi nancial conditions, 1 = 100%

95
Continuation of Figure 11…
Explanation: The horizontal line represents the whole sample average (18%).Source: Questionnaire survey about economic and social confl icts, 2013
If the fi rst three fi nancial factors are removed from the problem list and a problem complexity index is built only based on the remaining six ele-ments, then the picture will be slightly changed. At 64 percent of the population not a single problem has occurred during the last year. In the remaining 36 percent of the sample at most one or two types of problems occurred. In this index number, without those factors, which relate to the costs of living, the meaning of the complex problem system is that at least

96
two types of problems have occurred at the same time in the last year. 16 percent of the test persons can be characterized by such a life situation. Gender, age or type of settlement play no signifi cant role, even in this case, in the formation of values. On the other hand persons with a lower edu-cational background (22%), divorced people (23%), widows and widowers (19%), singles (22%) and unskilled blue-collar workers (21%) are even in this case overrepresented in the categories living under bad fi nancial conditions, indigents and living from month to month (32%). The list of “protecting factors”, which include higher educational level, higher occu-pational status and, as a result of these, more favourable fi nancial conditions can be extended to the partnership (both marriage and life partnership) and to the lack of loneliness.
It was shown previously from the point of view of coping with problems and challenges of everyday life that on the average it is diffi cult or very diffi cult for 35 percent of the population to cope with these situations and circumstances and within the whole sample this task is defi nitely very diffi cult for 12 percent. Also in this case, persons with a lower education level and with less favourable fi nancial conditions and the singles are overrepresented in the group of persons, who are having diffi culties or having a lot of diffi culties coping with problems. The most remarkable differences can be observed along the fi nancial factors, thus, from these factors two examples will be presented (Figure 12).
Figure 12: He/she has diffi culties or a lot of diffi culties coping with the problems and confl ict situations of everyday life, probability of YES answers as a function of the fi nancial situation. 1 = 100%
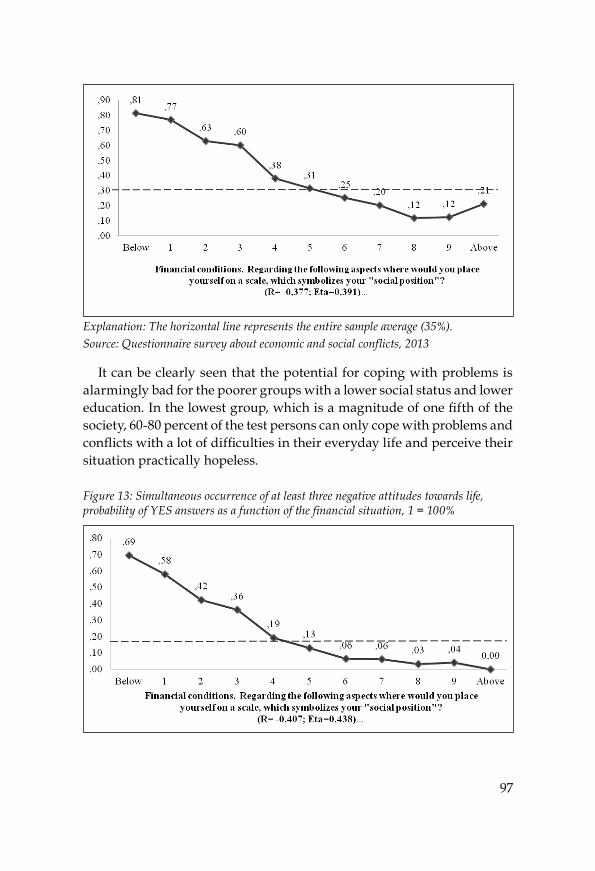
97
Explanation: The horizontal line represents the entire sample average (35%).Source: Questionnaire survey about economic and social confl icts, 2013
It can be clearly seen that the potential for coping with problems is alarmingly bad for the poorer groups with a lower social status and lower education. In the lowest group, which is a magnitude of one fi fth of the society, 60-80 percent of the test persons can only cope with problems and confl icts with a lot of diffi culties in their everyday life and perceive their situation practically hopeless.
Figure 13: Simultaneous occurrence of at least three negative attitudes towards life, probability of YES answers as a function of the fi nancial situation, 1 = 100%

98
Explanation: The horizontal line represents the entire sample average (17%).Source: Questionnaire survey about economic and social confl icts, 2013
Also related to bad mental conditions, which can be described as neg-ative attitudes towards life, a similar context system can be observed. Lower education level, lack of partnership, loneliness, manual work in a low level position and especially unfavourable living circumstances, signifi cantly increase the negative judgement of their life situation, the perspectives and the living opportunities, the social esteem and the social approval (Figure 13).
It can be clearly seen that the accumulation and the rate of occurrence of negative attitudes towards life are extraordinarily high in groups, which are poor, have a lower social status and a lower educational background. In the lowest group, with a magnitude of one fi fth of the society, 40-60 percent of the test persons are simultaneously in many aspects in an un-favourable emotional-mental condition, as a consequence of pessimism, dissatisfaction, perplexity, state of being ignored...etc. Persons in the low-est one fi fth of the society, regarding the ladder of fi nancial status, can be characterized for example, by the following: the proportion of those, who are unsatisfi ed with their life, is around 60 percent, the proportion of those, who have a pessimistic future perspective, is around 50 percent, the pro-portion of those, who feel themselves ignored, is around 40 percent, the proportion of those, who feel themselves not acknowledged or unappre-ciated in the world of work, is similar to the previous percentage and one third of these people think that he/she is despised because of his/her standard of living, income and status.

99
As a summary, the behaviour of the three confl ict indicators has been examined from the aspect, where the test person positioned himself/herself on a 10-grade scale according to his/her educational background, position at work and fi nancial condition. The probability occurrence of problem and confl ict indicators will be examined at each grade of the social stratifi cation, based on a certain kind of self-classifi cation (Figure 14).
Figure 14: Correlation between the social status, based on self-classifi cation, and the occurrence of confl ict indicators, proportion of YES answers, 1 = 100%
Source: Questionnaire survey about economic and social confl icts, 2013

100
Continuation of Figure 14…
Source: Questionnaire survey about economic and social confl icts, 2013
The negative, close, linear correlation between the status in the social ladder and some aspects of private problems and confl icts is clearly visible at all three “symbolical scales” and at all of the three confl ict indicators. In the lower segments of the social structure, especially in the lower one fi fth, complex confl ict situations and challenges with many problems si-multaneously, occur more frequently. Furthermore, because of the accu-mulation of problems, the persons concerned can cope with problems only with diffi culties or with a lot of diffi culties in everyday life. These unfa-vourable conditions infl uence them in the judgement of their life situation, in form of negative attitudes, such as pessimism, dissatisfaction, helpless-ness, the state of believing to be ignored or despised.
The correlation system above is logical and seems probably even trivial, but with empirical tools, the depth and complexity of this problem area and the extreme conditions present could hopefully be demonstrated. These extreme conditions, as it seems, tear apart the texture of the Hungarian society, not only in the fi nancial dimension, but they also generate confl ict situations, unfavourable mental concepts and emotional conditions in everyday life. Also from these relations it is clearly visible that these prob-lems are essential parts of the social wealth and a close correlation can be observed between the two groups of incidents. Therefore, the integration of such kind of examination of quality of life in the measuring of wealth is of crucial importance. Thus, after the examination of the classical so-
101
cio-demographic determination, it is worthwhile to examine also the correlations between the wealth indicators and the variables of everyday problems and confl icts, in more detail.
6. Correlation between confl ict load and wealth
There is presumably a correlation between the problems of private life, social-relations and the different dimensions of wealth, in which both ap-pearances are causes and consequences at the same time. A lower level of wealth will clearly generate tensions and problems in everyday life, in the micronet texture of social life. These results will clearly be enhanced by the social determination relations, which were presented above, especi-ally in the hard, objective dimensions of well-being (e.g. educational backg-round, occupational position, fi nancial situation, social status). In this ana-lysis the occurrence and connections of negative attitudes toward life re-fers to the lack of subjective well-being. The signifi cant relationships were also in this case convincingly visible. Lack or a less favourable condition of well-being increases defi nitely such confl icts and problems.
In this phase of the analysis the approach of the connection system is from the other point of view: answers for the questions will be examined, to see to what extent the occurrence and the increasing of the intensity of different confl ict indicators will harm the well-being indices (for the ques-tion of development and content of the indices, the methodological chap-ter of the book delivers important facts). Thus, the following questions arise: Are the indicators of well-being in those households less favourable, in which problems of private life and social-relationships can be identifi ed? What is the impact of complexity of problems on the well-being? Are the indicators of well-being signifi cantly worse in case of households with increased load? If yes, what is the extent of these differences?
The development of the four indices of well-being (objective, subjective, residential, relating to health) have been examined with variance analysis, as a function of composition and intensity of confl ict load in the private life, and in the social network of the test person. The average values of the four aggregated, standardized values of well-being have been compared to the categories of three confl ict variables (complexity of confl icts in pri-vate life, complexity of relationship confl icts, intensity of diffi culty of coping with problems) with ordinal measurement levels. In the question „on whom can you count with different problems” no signifi cant correla-

102
tion can be observed, therefore the presentation of this will be left out of consideration and the question “occurrence of negative attitudes toward life”, is a part of the variable subjective well-being (in form of lack of neg-ative attitudes toward life).
The categories in an extreme position with a small number of elements have been drawn together (e.g. problems, which occur at the type of rela-tionships 5-10, are one group, because of the low number of elements). As a result of standardization, the average value of the well-being indicators is zero. The positive sign indicates a feature, which is better than average and the negative sign implies a less favourable feature. The results are summarized on three fi gures (Figures 15-17), where our primary purpose is to demonstrate the direction and slope of the correlation as best as pos-sible.
In the context of confl icts and problems the four variables of well-being do not behave equally. In the dimensions of satisfaction with their place of residence and health condition no signifi cant correlation can be observed, or the correlation is very weak. This correlation is not surprising, since challenges, problems and confl ict situations on the level of everyday life are not connected very closely with the health conditions or the place of residence and the extent of satisfaction with this living environment. On the contrary, with the two most important components (objective and subjective well-being) there is a signifi cant, one-way, negative, linear dif-ferentiation, which appears in the average values of indices at each of the three confl ict variables. The other common point is that in each case, the strongest association index number can be observed regarding the indi-cator for subjective well-being. The indices of subjective well-being are lower and lower along the appearance of problems, the connection of confl icts and the more and more increasing diffi culties of coping with problems.
Regarding the eight types of confl icts the fi rst crucial “break” is at the distinction between occurring – not occurring. This can be illustrated on the fi gure with the fi rst steep fall after the point 0. It is clearly visible that the appearance of problems pushes the well-being indicators below aver-age. From here on, as the problem system becomes more and more hetero-geneous and as more and more different types of confl ict situations are accumulated on each other, the group averages of the well-being indices are shifted in a worse and worse range. All four indices are moving to-gether, but the behaviour of the subjective well-being is the most sensitive one.

103
Figure 15: Correlation between complexity of confl icts in private life and well-being
Source: Questionnaire survey about economic and social confl icts, 2013
For three problem-types (losing job, problems with earning money and living, diffi culty of larger investments and expenses) from the possible nine, there is a very close connection with the living dimension of well-be-ing. Therefore, as a control, the variance analysis has also been executed without these three items. In this case, the work is carried out through the following six forms: household tasks; works to do at home; splitting house-work in the family; individual ambitions; pushing desires into the back-ground; problems arising from learning or educating children; health problems, illnesses; problems arising from maintaining contact with fam-ily members and relatives and from the obligations towards them; part-nership problems. The tendencies have not been changed in this case either, only the association indices have been decreased slightly. The appearance and accumulation of non-fi nancial problems of private life also has a neg-ative impact on the indicators of well-being.
In the case of the heterogeneity indicator of confl icts based on relation-ships (Figure 16), it has no signifi cant impact on the two indices of well-be-ing (dimensions health and place of residence) and parallel to this a new tendency also arises in the trends. In connection with the index of objective well-being, a positive correlation can be observed. The reason for this is that at groups with a more favourable educational background and fi nan-cial situation, the relational capital is also generally higher and more complex. Nevertheless, also for the appearance and for the accumulation of relationship confl icts a many-sided connection system is required.

104
Figure 16: Correlation between confl icts in relationships and well-being
Explanation: In the case of health and place of residence dimensions, no signifi cant re-lationship can be observed.Source: Questionnaire survey about economic and social confl icts, 2013
As a whole, the differentiation of the indicators as a function of the relationship variable is much smaller and no such signifi cant negative effect can be observed as with the previous variable. On the other hand, the subjective indicator of well-being behaves according to the expectations: the average value of the index at each group deteriorates proportionally to the increase of the number of relationship confl icts.
Figure 17: Correlation between the intensity of diffi culties with problem and confl ict resolu
Source: Questionnaire survey about economic and social confl icts, 2013

105
As it was seen before, the diffi culty of coping with challenges in every-day life can be seen in itself as a challenge. The diffi culties of coping with problems are causes and consequences of such situations and conditions. From the data it is apparent that the higher the challenge of coping with problems and confl icts is, the lower the group averages of indices of well-be-ing are. Those persons, who can cope with problems in their life easily or rather easily, can be characterized by indicators of well-being above aver-age. Whereas, those who think that these tasks are rather diffi cult or real-ly diffi cult, have the least favourable average points for well-being.
7. Summary
The purpose of this study was, being aware of the limits of the method of a questionnaire survey, to enlighten the depth, complexity and those ext-reme conditions, which apparently tear apart the texture of the Hungari-an society, not only in the fi nancial dimension, but thely also generate confl ict situations, unfavourable mental concepts and emotional conditi-ons in everyday life.
Financial challenges in connection with living can be regarded as the primary factor of confl icts and problems, which appear in the everyday life of the population. Most people are faced with problems in connection with earning money, with larger investments and expenses and also with the risk of losing their job. Surprisingly on the other hand is the occurrence probability of confl icts, based on relationships. Considering all forms of relationships, two-thirds of the population has not reported about tensions or problems in this area. In fact, the relations in connection with the world of work and the interactions in the partnership are loaded with confl icts in the highest proportion. The most stable relationships develop in forms of interactions based on tight, strong bonds with friends, children and brothers and sisters. There is a really simple logic regarding the primary supporting relationships and the private and public supports, which play a role in solving and mitigating confl icts: most people can count either on the support of their narrow environment (family, friends) or on themselves. Regarding the mental condition of the population, really unfavourable phenomena have been found. One-fi fth, or in some cases even one-quarter, of the test persons reported some kind of negative attitudes toward life, 17 percent felt ignored and 12 percent thought that he/she is despised because of his/her job, income or quality of life. The individual confl ict

106
indicators can also be connected to each other. The most obvious correla-tion can be observed between the ability to deal with problems and the complexity of the problems. Among those, who have diffi culties coping with the challenges of everyday life, the proportion of occurrence of a complex problem system is twice as high. Similarly convincing is the re-lationship between the social relationship system loaded with confl icts and the accumulation of problems.
The results make it clear that even though it is not necessarily true that “money does not make you happy”, a more favourable social status de-creases the challenges of everyday life. The occurrence of primary confl ict resources within the population is signifi cantly moderated by a higher education level, occupation as a university/college graduate and more favourable fi nancial circumstances.
It can be clearly seen that the potential for coping with problems, at the poorer groups with a lower social status and education is alarmingly bad. In the lowest group, with a magnitude of one fi fth of the society, 60-80 percent of the test persons have a lot of diffi culties coping with problems and confl icts in their everyday life and perceive their situation, in fact, hopeless.
Also related to unfavourable mood, which can be described in connec-tion to negative attitudes toward life, a similar context system can be ob-served. Lower education level, lack of partnership, loneliness, low level of manual work and especially unfavourable living circumstances signifi -cantly increase the negative judgement of their own life situation, the perspectives and the chance in life, the social esteem and approval.
The close, negative, linear relationship between the position on the social ladder and certain conditions of problems in private life and confl icts is clearly visible. In the lowest segments of the social structure, especially in the last fi fth, there are much more complex confl ict situations and chal-lenges, resulting from simultaneous problems. Furthermore, because of the accumulation of problems, the persons concerned have diffi culties or a lot of diffi culties coping with problems in everyday life, and these unfa-vourable conditions have an impact on the judgement of their own oppor-tunities in life.

107
The Characteristics of Well-being from the Perspective of Spatial-Social Attachments and Social RelationshipsZOLTÁ N BUG OV ICS
1. Introduction
The research attempts to make statements with the elements of the well-be-ing index about social relationships according to the social-spatial attach-ment, which can also serve with explanations for social confl icts. The start-ing point is the spatial category belonging to communities, assuming the validity of the old principle according to which space is a social construc-tion. Thus, attachment to space means actually belonging to communities, extended with the presence of a few geographical or natural elements or even with the elements of the built environment. Besides the theoretical background of the attachment, the study starts at the narrowed index of well-being, used in the research, in which the satisfaction, the positive emotions and the lack of negative emotions were taken as a basis and as such it also includes the feeling of happiness. With the application of the well-being index, the study tries to analyse the characteristics of confl icts related to spatial categories as well. Another important aspect of this ap-proach is the trust, since it is a factor, which serves in the stability of com-munities and it can also explain the qualitative aspect of commitments to the communities.
2. Theoretical background
Although, the characteristics of modernizing societies, which begin the postmodern way of living, are different, but certainly the elements of the common sets can also be found, among which for example the following terms can be emphasized: fragmenting identity, identity confl icts, indivi-dualization, weakening of attachments, value confl icts, disintegration of communities...etc. (Erikson, 1959), (Goffman 1991), (Castells, 1997), (Bend-le, 2002) (Beck, 2003). At the same time, these indicate that in our age the

108
possibility of choosing values for the individuals has broadened. All these also strengthen the phenomenon that value choices are accompanied by the rearrangement and revaluation of confl icts, attachments and identiti-es and create new types of problems, which broaden the fi eld of characte-ristics of the postmodern society.
According to Tönnies the root of the individual relations can be appre-hended – also considering the theory of community – in the relationships mother-child and man-woman as spouses and siblings. In the fi rst case, the relation can be maintained by habit and memory, in the second besides habit, the affection to the children and generally to the property and estate is crucial and in the third case the memory “contributes the most to the creation, maintenance and strengthening of bonds between the hearts” (Tönnies, 2004).
Belonging to a community is not only an acceptance, but at the same time also exclusion. It can be connected here with the post-structuralist trend of the identity, according to which identity and territoriality are not existing in themselves, they can only be interpreted from the perspective of social life and power, in the system of acceptance and exclusion as an equivalent to the own group and the other group (Goffman, 1991).
Dating from the political transformation, a social transformation has begun, in which new identities occurred in the relations of new commu-nities. The consequences of this for a decade were summarized by Hankiss: The results are „the big disappointment”, „the chaotic relations”, „the in-difference” and „the cynicism”. He explains „relating to the impatience of elementary power” that “we are running after our missing or existing money, we are running from one job to another, we are running after the unachievable western standard of living, we are running a race with our competitors, we are running, because we have lost forty-fi ve years, because we are behind the West, we are running, because it is good to run, because the televisions broadcast the speed and the myth of devouring and rush-ing life; we are running, because we have to fulfi l ourselves every minute…” (Hankiss, 2002). The civilisation defi cit, which arises from the insuffi cien-cies of the institutional level, from the corruption and the defi cit in mod-ernization, which makes the cooperation more diffi cult on the level of each person, since each interaction is considered as a zero sum game by the people, instead of realizing that the benefi t of others can be profi table also for themselves and accordingly endeavouring cooperation. Lack of coop-eration is also a big defi cit in the behaviour of the Hungarian people. The lack of tolerance or the daily routine of violating the rules of behaviours
109
also belong here. The loss of trust is also a problem fi eld to emphasize, as well as the situation of social cohesion: „the lack of social integration and cohesion in such an extent makes functioning of a real democracy in prin-ciple impossible”. Finally comes the question of the civil society, which he qualifi es as poor, although “this is one of the most important requirements of good functioning of a democracy” (Hankiss, 2002).
One of the major functions of collective identity is to offer safety by “fi ll-ing the world around the individual with meaning and ensuring commu-nication within the community” and ensuring such a collective knowledge, by which “he/she does not need to formulate the meaning of all experienced things again and again […]. Individual and collective identities are mutu-ally dependent from each other.” And as a conclusion it can be declared that the “collective identities protect their meanings”. This is enforced through such mechanisms, which make the complete reception of foreign attitudes impossible; increase the ego consciousness by exclusion of uncertainties and enable the “enforcement of the disposing capacity” of the individual. However, “our increasing interest in the immaterial world means a danger, primarily for the different identities” (György Schöpfl in, 2004).
It can act as a cementing force, if considering identity as a kind of at-tachment narrative and the “societies are looking for narratives, which keep together and give stability especially during changes”. However, the new technologies with the development of new networks during the changes caused by the globalisation “weaken the national cohesion und strengthen the particularism”. This is the postmodern social phenomenon, which can be paralleled with the concept of „liquid modernity”, which can also be found in the concept of fl uidity and liquid space. The main point of this is that the individuals consider themselves as part of a larger com-munity because of the relativization of the space (in the space, which was transformed by the communication and transport technologies). Examples for this can be the phenomenon that the spatial categories, which are crossed by the internet or by the cellular phone “become liquid” and a consequence of these “the essentials of the term relevant community” undergo a transformation. The issue here is already about the postmodern or liquid characteristics of the term community expressed by Tönnies, in which the quasi character of community will be expressed by the disinte-gration of space. Thus, this approach describes a gloomy future about the disintegration of national identity, adding that with the new technologies, quasi communities or as he calls them “fi ctive communities” will be born (Price, Monroe E., 1998).

110
In fact, the identity shows in our age a more fragmented picture, where all the manifestations of identity in different life situations are related to collective relationships. However, these communities are less human groups, which can be indicated in the traditional way, but loose commu-nities, are palpable in quasi, liquid and postmodern networks.
Manuel Castells has generally formulated plausible statements, analys-ing the postmodern, according to the characteristics of the architecture: „the postmodernism is nothing different, as the almost immediate expres-sion of the new dominant ideology: according to these the end of history is here and it is time for dethronement of the positions in the space of streams […]. Since it does not belong any more to any kind of loyalties and cultures, the extreme version of postmodernism enforces its own codifi ed logic of decoding on everything […]. Behind the liberation from the dom-ination of the cultural codes, in fact the fl ight from the societies with historical roots is hidden. From this perspective, the postmodernism can be regarded as the architecture of the fl oating space”. According to his conclusions our age is characterized in the case of „social interactions and organisations” by the domination of “cultural patterns”, be it about tech-nologies, mass media or even architecture. „For that very reason the in-formation is a component of crucial importance to our social organisation and the streaming of messages and pictures are the connecting threads of our social structure among the networks”. The new “form of existence” we live in is the information society, in which basically not the material factor is dominant, but the autonomy of culture (Castells, Manuel, 2005). In this context, however – this is pointed out by Castells – the strengthen-ing of alienation, isolation, fragmentation and separation can be observed, in which self-refl ection gets a more and more broader space.
3. Well-being and attachment
Within the framework of examinations of social well-being usually eco-nomic, social inequality and deprivation factors are examined. This time, however, - in a not quite common way – this approach makes an attempt to analyse also the relationship between social trust and satisfaction, using the criteria of social identity. This inspiration has to be explained by re-ferring to many publications. First Anssi Paasi has to be mentioned, who interprets the appearance of the spatial awareness of identity alongside the conceptualization of the regional identity, as the social cohesion of

111
many kinds of spatial conceptions (Paasi, 2009). However, the realization of this conceptualization can only be imagined by a social agreement, in the case of existence of a common concept. Also an important element is the so called Stiglitz Report, which emphasizes the importance of the sub-jective evaluation of life of the individual for the measurement of well-be-ing, including the scale of emotional characteristics. Furthermore, this re-port also emphasizes that the quantitative assessment of these elements is a highly recommended method of measuring of the factor of well-being (Stiglitz, 2009). A basis of this research is the analysis of agglomeration areas, the analysis of their competitiveness, which was carried out with the lead of Viktória Szirmai and in which important connections were equally discovered about social characteristics, inequalities and economic factors (Szirmai, 2009).
The analysis of the empirical data can be established with the relations of the spatial categories, since these also can be regarded as reference points in the mirror of the previously mentioned theories. The spatial-categories of attachment can be summarized within the cover of the spatial identity according to the following; considering the conclusions of Paasi (Paasi, 2009).
The role of attachment and affi liation is dominant – especially in the process of spontaneous identity formation.
Antal Bőhm has emphasized in his researches in the eighties that the two main categories of spatial attachments are the national and the local level and according to the researches, after the political transformation, the attachment to the localities has increased further and it has increased the emergence of this spatial element through self-governance as a kind of identity revelation (Bugovics, 2014, Pathy, 2014, Tóth-Ditrói, 2014).
At the analysis of attachments and social confl icts in the geographical space, it is important to mention the fact, which spatial categories can be considered as spatial elements, which can be taken into account as a social construction.
The offi cial statistical territorial division of NUTS1 has been used for the territorial division only as a basis of comparison and the economic-cul-tural-historical characteristics of the Hungarian researches have been primarily used.
According to these, the following territorial units will be connected to the spatial elements of the social identity:
1 Nomenclature des Unités Territoriales Statistiques - NUTS I-V.

112
- neighbourhood – street- settlement (locality)- area/district- county/region- part of the country (e.g. Transdanubia or North Transdanubia)- country (equivalent to the category national identity)- Central Europe / East-Central Europe- EuropeRelatively lots of levels have been chosen, so that the persons questioned
have the opportunity to make a distinction between the different levels according to the elements of attachment.
Goffman has pointed out for example, examining the everyday phe-nomenon presentation of me, that a sphere can be found in the homes, which is opened to the outside world, and a hidden, more secret back sphere, which is deeper in its intimacy. In this interpretation of spatiality the fact of being circumscribed is crucial (Goffman,1981). Neighbourhood and street are the categories, where the confl icts of the individuals can appear, creating a social dimension as the source of tension, cooperation or even hostility, as a community or the lack of it.
Previous researches have emphasized that the locality as settlement is one of the most important determinants of the spatial identity (Bőhm A., 2000, Szoboszlai, 2003, Csepeli, 2004), which can be shown, especially from the middle of the nineties, in empirical studies. Thus, locality plays a par-ticularly emphasized role in this study, especially as a perspective, which can be analysed as litmus test paper of communal confl icts.
The circumscriptions of area and district are broad categories of relations, they are legally not agreeing aspects, though. Therefore, the questioned can decide according to his/her own judgement about the attachment to area or district. For that very reason, the questioned can decide independent-ly about the actual defi nition of the category because a lot of things depend on the historical, cultural and social background of his/her identity.
The categories county and region as a factor of analyses appear in the analysis in a contracted form and the attachment of the individuals to the middle level has been analysed as a general formula. At the same time, it is worth mentioning that the county system is not just a legal-administra-tive category, but it also became culturally and economically a determinant factor in the last thousand years – in spite of the fact that the counties have also been modifi ed territorially, they have overcome some fusions and renaming by the time they have attained their current form. However,

113
nowadays the county became an administrative level, which is neither small enough (to wander through it and to grasp it), neither is it big enough to form an appropriate unit for regional development.
With the state-wide or national level, the attachment to Hungary as a territory will be evaluated, which is to be understood as a whole organic unit of a country or even as a national-ideological category.
In the case of the European, as a continental, attachment a general cul-tural-historical category has been represented. There was no reference to the European Union, but the questioned persons could handle this aspect freely, that is, they could answer as a political interpretation at the selection of this category. It can be pointed out at the analysis of the European iden-tity that according to the historical perspective and the future goals a strengthening should be assumed.
As it can be seen, the list contains many such kinds of spatial categories, which are from the scientifi c perspective „soft”, but are still important because of the spatial identity examination, just in order to avoid the un-preparednesses resulting from the “imperfections” of the statistical clas-sifi cations and from the unexpected territorial names. However, it is im-portant that the right for all spatial categories to exist will be defi ned on a social base, that is, the spatial structure approached on the base of social identity is the object of the study. The aim of this study is to examine the characteristics of the connection between the attachment to these spatial categories and an index of well-being by taking the sketch of an analysis model as a basis (Analysis model 1). This model indicates that besides the elements of the used index of well-being (satisfaction, lack of negative emotions, positive emotions) the confl icts also will be compared with the extent of attachments to spatial categories.
Approaching this topic from the perspective of the confl ict analysis, the answers will be analysed and evaluated in the relations of private and social confl icts, the values of happiness and satisfaction and the attachment. The extent of trust between the inhabitants of the examined spatial cate-gories and the sample area of the attachment is an important category, which has to be emphasized especially and which contains the qualitative values of the social relationship.
Attachment means from the perspective of the social relationship not only a commitment, identity or affection towards space, but also a belong-ing to a community. Thus, it represents an attitude, which can be inter-preted as a part of the social relations, which can also be enlightened

114
certainly from the perspective of the relationship with the relatives or the neighbourhood relationship.
The major categories of space, which will be examined in this study are: a) neighbourhood, which means the living environment of the individual, b) settlement, which means the residence of the individual, be it a big city or a village, c) area or district, which covers an area smaller than a county d) the region, which does not necessarily mean the offi cial regional division according to NUTS, but it can mean those spatial units, which can be classifi ed from the perspective of the Hungarian history-policy in this middle category, be it a county or a part of the country or a region, which results in identifi cation (Bugovics 2007), e) nation, which represents the symbolics of the country, even in a geographical-social sense, and fi nally f) the European level, which symbolises primarily not the EU, but the European geographical- historical-political space.
Figure 1. Analysis model
Source: own work
4. Results of the examination
The attachment patterns can show the character of confl icts, which affect the social relationships, be it an issue regarding relatives, economic, living environment or even trust or lack of trust, by developing a kind of order.4.1. Patterns of space and attachment
Considering the various, examined aspects beginning with the extent of attachment towards spatial categories. The results show that a strong attachment characteristic, contrary to the weak values, is valid, regarding frequency, with the different level of attachment types, such as settlement,

115
area, region (county), nation and Europe. If from these data of frequency, the weak and very weak pairs will be compared with the strong and very strong attachment patterns, then the values of the attachment to settlement, region and nation have to be especially emphasized, according to the n-values (Figure 2).
In the category of neighbourhood, the weak attachment is remarkably high and in the other spatial categories the low attachment values are minimal. In the other spatial categories the strong attachments are signif-icant, but the weak data are also outnumbered by the very strong attachment patterns. It is an important basis for further analysis of the data, whether the weak value of attachment in the category neighbourhood covers con-fl icts or it mirrors only the weak attachment to this spatial element.
Figure 2: Attachment to spatial categories and their frequency:
Source: Questionnaire survey about economic and social confl icts, 2013 (Own edition)
Table 1: Number of elements, average and standard deviation from the perspective of attachment
Attachment to
neighbourhoodAttachment to settlement
Attachment to area
Attachment to region
Attachment to nation
Attachment to Europe
N 2030 2030 2029 2028 2030 2030Average 2.55 2.92 2.94 3.00 3.13 3.03Std. Dev, .909 .807 .823 .845 .823 .959
Source: Questionnaire survey about economic and social confl icts, 2013 (Own edition)
If starting the examination from the division according to various aspects, it is advisable fi rst to enlighten the problem area with the summarized

116
data. Therefore, categories like settlement environment, social relations, happiness and satisfaction, as general statements, will be highlighted, in order to fi nd characteristic values, with which subsequently deeper anal-yses can be carried out, and to fi nd relationships to be proven. Here it can be found that the importance of social relationships signifi cantly determines the extent of attachment to each spatial category. Obviously, the nature of social relationships includes, in this case, both the specifi c human relations and the national or even European spirit of the ideological relatedness but the determinant nature of the social aspect seems to be a crucial force in the relation of spatial attachments. It is worth making it clear at this point that the space, as a social construction, assumes a complicated network of human relationships and therefore attachment is not to be understood as an area remote from everyday life but as an environment attributed with human relations.
In case of the regions in Hungary, an interesting characteristic can be found, if taking the values of attachment to regions as a basis. The attach-ment values of the North Hungarian region are signifi cantly different from those of the other regions, both according to the percentage and the aver-age values (Table 2, Figure 2). Considering strong attachment, the attachment value is much lower in this region and the relatively high values of a very weak attachment are also striking, compared to the other regions. According to these, it can be said that in the North Hungary region, lower attachments to the region can be observed. At the same time, the strong and very strong attachment values are mainly characteristic in the other regions. The characteristically weak attachment values are typical especially in the areas Central Hungary (Budapest) and Transdanubia.
Table 2: Average values of attachment to region (N)
Region Mean NSouthern Lowland 3.00 268Southern Transdanubia 2.98 193Northern Lowland 2.98 299Northern Hungary 2.70 228Central Transdanubia 3.11 228Central Hungary 3.07 612Western Transdanubia 3.06 200Total 3.00 2028
Questionnaire survey about economic and social confl icts, 2013

117
Figure 3: Extent of attachment to region (NUTS II) in each Hungarian region (%)
(Signifi cance: 0.000, p<0.01, F=6.28)Questionnaire survey about economic and social confl icts, 2013 (Own edition)
4.2. Satisfaction, happiness and attachmentCertainly, also further elements can be highlighted, even if it would not be that spectacular. Also regarding the importance of the settlement en-vironment, it can be said that in the categories attachment to neighbour-hood and settlement, the factors attachment to area and the importance of environment mostly strengthen each other. When comparing the values of satisfaction and happiness with the values of spatial attachment in a si-milar way, the connection is not that obvious. It can be observed, both at happiness and satisfaction, that the extent of attachment to various spatial categories will be not maximized with the full evolvement of these factors, on the contrary, it decreases. Though, it is a fact that unhappiness and dis-satisfaction are accompanied by low attachment values (Figure 4-7). Consi-dering the analysis in the background of the data of Figure 3, the signifi -cance is strong everywhere (sig.: 0.000, p<0.01), except for the neighbour-hood, where the values do not show such a correlation (sig.: 0.185, p<0.01). According to the Eta values, which show the strength of the correlation, the strength of the connection is very low, the values explain only 5-10%. In Figure 4, strong signifi cant correlations also can be found, the exception is the case of the neighbourhood (sig.: 0.02, p<0.01) and the Eta value, which shows the strength of correlation, explains the strength of relationships also within broad limits, at an extent of 3-10%. Considering the fourth aspect, at the correlation of happiness and attachment also similar corre-

118
lations and explanations can be found. Apart the aspect attachment to the neighbourhood, signifi cant correlations can be found everywhere (sig.: 0.00, p<0.01), while the Eta value, which explains the strength of corre-lation, is between 1-10%. Finally, the previous results could be repeated also with the correlation of satisfaction and spatial attachment. All of these indicate that in the relation of spatial attachments similarly close corre-lations can be shown both in case of importance of social relationships, importance of residential environment and happiness as well as satisfac-tion. However, the neighbourhood is an exception and following an at-tempt will be made to explain this by examining these aspects separately.
Figure 4: Importance of social relationships considering socio-spatial attachment (N=2029) (See: Table 6)

119

120

121
Source: Questionnaire survey about economic and social confl icts, 2013 (Own edition (See: Table 6)
Figure 5: Importance of the settlement environment (built and natural) regarding attachment to neighbourhood, settlement and area (N=2029)

122
Source: Questionnaire survey about economic and social confl icts, 2013 (Own edition) (See: Table 6)

123
Figure 6: Strength of happiness considering spatial attachments (N=2029)
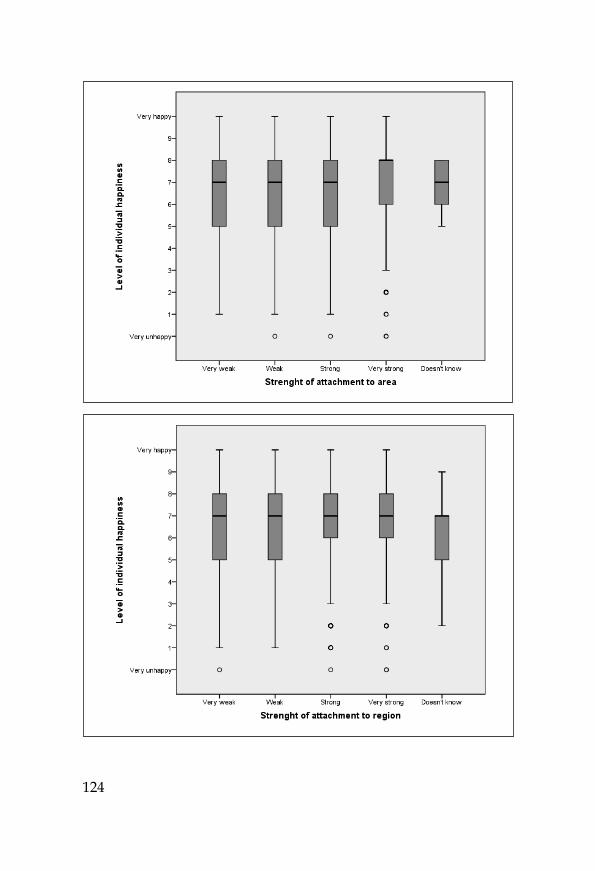
124

125
Source: Questionnaire survey about economic and social confl icts, 2013 (Own edition) (See: Table 6)

126
Figure 7: Strength of satisfaction according to spatial attachments (N=2029)
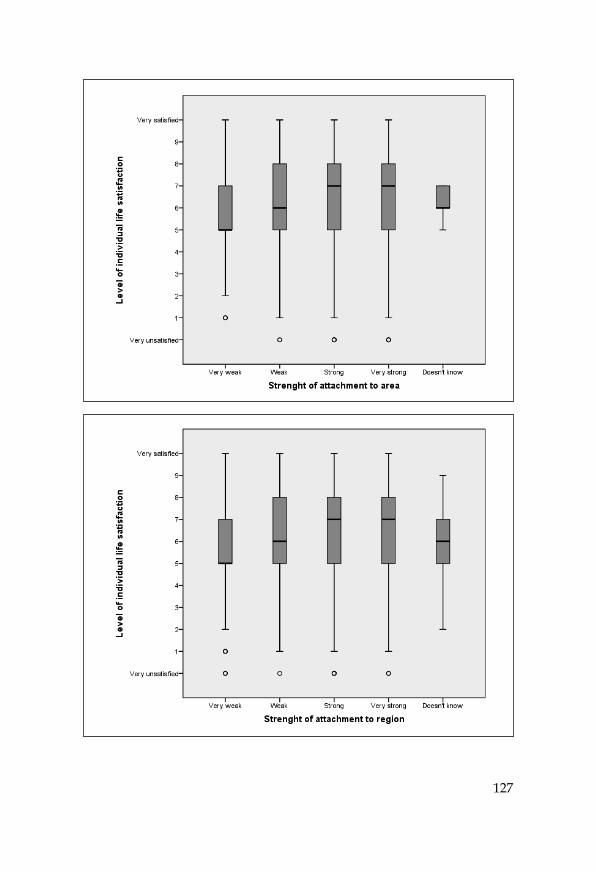
127
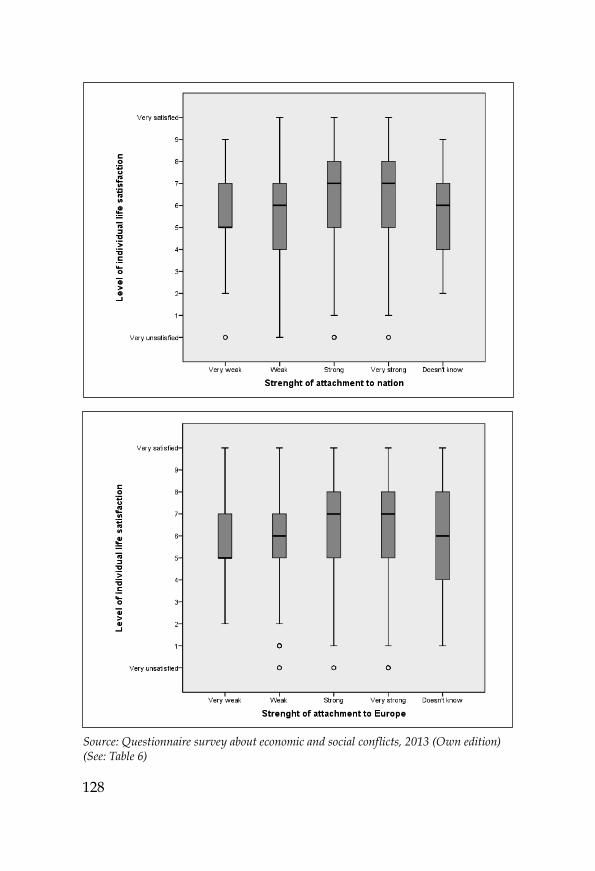
128
Source: Questionnaire survey about economic and social confl icts, 2013 (Own edition) (See: Table 6)

129
4.3. Type of settlements and attachmentConsidering attachment according to the various types of settlements, slight differences can be observed among the various types of settlements (Figure 6). Characteristic are the lower attachment values of settlements belonging to a higher settlement hierarchy, in comparison with the higher attachment values of units in a lower settlement hierarchy. This differen-ce can be observed in all attachment values. To sum it up, it can be stated that the strong and very strong spatial attachment patterns are in case of the capital and all cities with county rights show lower (almost half as high) values than in the case of small towns and villages. At the same time, the category weak and very weak attachment is similar in all types of sett-lements with minimal values. At spatial categories, which can be percei-ved by the individuals, such as the categories settlement, area, town and village, stronger attachments (strong and very strong) can be observed. Especially inhabitants of villages and small towns have an attachment to their neighbourhood and this attitude is less common with inhabitants of the capital and cities with county rights. It is interesting that when com-paring the types of settlements the largest differences are between the average values of such spatial categories, which can be considered as spe-cifi c, and the rather soft term Europe results in hardly any differences re-garding the same aspect. It can be seen that there is no signifi cant diffe-rence between attachment to nation and to Europe and the type of settle-ment. That means that the living space of the individual is the one, which results in signifi cant differences of attachments (Figure 8, Table 3). It has to be emphasized that in case of such spatial categories, which can be in-terpreted specifi cally, such as settlement, area or neighbourhood, the at-tachment of the inhabitants of large towns is weaker than that of inhabi-tants of villages or small towns.
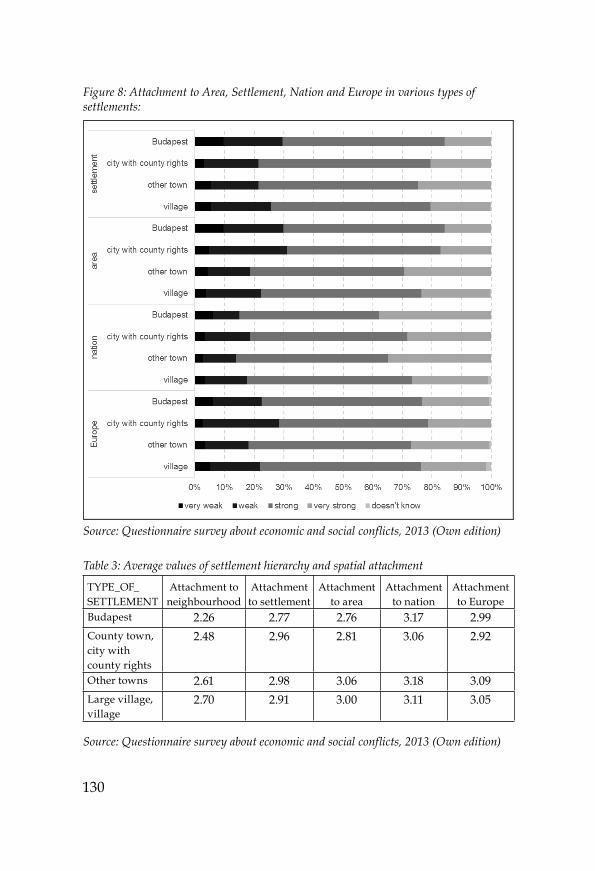
130
Figure 8: Attachment to Area, Settlement, Nation and Europe in various types of settlements:
Source: Questionnaire survey about economic and social confl icts, 2013 (Own edition)
Table 3: Average values of settlement hierarchy and spatial attachment
TYPE_OF_SETTLEMENT
Attachment to neighbourhood
Attachment to settlement
Attachment to area
Attachment to nation
Attachment to Europe
Budapest 2.26 2.77 2.76 3.17 2.99County town, city with county rights
2.48 2.96 2.81 3.06 2.92
Other towns 2.61 2.98 3.06 3.18 3.09Large village, village
2.70 2.91 3.00 3.11 3.05
Source: Questionnaire survey about economic and social confl icts, 2013 (Own edition)

131
4.4. Genders, age groups and attachment patternsThe examination of these factors, according to the demographic factors, is similar here as previously and it includes the comparison of a few categ-ories of spatial attachments. In the attachment patterns weak and very weak attachment have a low proportion, the strong attachment type is do-minant and the very strong type has again a lower value. This is a charac-teristic, which can be proven differently in the aspects of genders and age groups (Figure 8, Table 4). Considering genders, it seems as if women had consistently higher attachment values regarding attachment to settlement, nation or Europe, and men fall behind the former mentioned by fi ve per-cent, on average, but statistically there is no signifi cant difference between both genders.
The signifi cance is different at the various age groups, where also the strength of correlation can be shown at the values of Eta. In this approach lies the major difference between young adults and older people. Generally, it can be said that the weak attachment values are more frequent with young adults and weak attachments are less characteristic for older people. On the other hand, a very strong attachment is characteristic for older people and the strong attachment shows in each three age groups the maximum values. The difference is the strongest in the attachment to nation, where the very strong attachment of people in the older age group is outstanding, whereas it is almost just half as high with younger adults (Figure 8). Regarding the attachment to settlement and Europe the differ-ence is smaller, which is otherwise similar to all other spatial categories, not presented here, due to the lack of space. Considering the average values (Table 3), it can be seen that the values of attachment are increasing alongside the age groups in relation to the progress of age. The young and middle aged groups typically have a slightly weaker attachment to the neighbourhood and settlement space, which are in fact the specifi c living space. On the contrary, they have higher average values in case of the more abstract categories, such as region, nation or Europe. At the same time, older people can be described typically also in relation to the previously mentioned spatial categories with higher averages. Thus, the characteris-tic age group infl uences the attachment to spatial categories.

132
Figure 9: Strength of attachment to settlement, nation and Europe according to genders and age groups (See: Table 5)
Source: Questionnaire survey about economic and social confl icts, 2013 (Own edition)
Table 4: Spatial attachment according to gender and age
Gender/age of the questioned person
Att
achm
ent
to n
eigh
-bo
urho
od
Att
achm
ent
to s
ettle
-m
ent
Att
achm
ent
to a
rea
Att
achm
ent
to re
gion
Att
achm
ent
to n
atio
n
Att
achm
ent
to E
urop
e
men Average 2.52 2.88 2.93 3.00 3.14 3.03N 910 909 909 910 909 909Std. Dev. .893 .845 .875 .856 .856 1.025
women Average 2.57 2,95 2.94 3.00 3.13 3.02N 1120 1121 1120 1118 1121 1121Std. Dev. .921 .773 .779 .836 .795 .903

133
Gender/age of the questioned person
Att
achm
ent
to n
eigh
-bo
urho
od
Att
achm
ent
to s
ettle
-m
ent
Att
achm
ent
to a
rea
Att
achm
ent
to re
gion
Att
achm
ent
to n
atio
n
Att
achm
ent
to E
urop
e
younger (18-39)
Average 2.35 2.75 2.76 2.79 2.96 2.91N 680 680 680 680 680 680Std. Dev. .899 .810 .838 .825 .862 .960
mid-dle-aged (40-59)
Average 2.53 2,88 2.91 3,00 3.13 3.02N 668 667 667 668 668 667Std. Dev. .942 .806 .825 .836 .791 .947
older (60-xx)
Average 2.76 3.12 3.14 3.21 3.30 3.15N 681 682 681 679 681 682Std. Dev. .838 .761 .762 .823 .778 .956
Source: Questionnaire survey about economic and social confl icts, 2013
4.5. Importance of social relationshipsWhen getting to the fi eld of analysis of social confl icts, a reference has to be made back to the fi eld of social relationships, which were discussed previously. It was shown that social relationships infl uence the characte-ristics of the attachment to spatial categories crucially. Thus, human re-lationships result in a kind of humanization of space. Now, the validity of this aspect should be reviewed through an in-depth analysis.
In case of attachment to nation, the importance of the social relationships show the strongest correlation, when examining the relation between the importance of relationships and the strength of the attachment to the two spatial categories (nation and settlement) (p<0.001). The data show that in cases in which relationships are not considered as important at all, the values of attachments to nation and settlement are also extraordinarily low and this is true in relation of all spatial categories, such as for example the neighbourhood. At the same time, with the increasing of the importance of relationships, the strength of the attachment to nation and to settlement also increases. This relationship is maximized especially in the very im-portant and very strong categories. It should be mentioned that the pro-portion of a weak or very weak inverse correlation between the very im-portant relationship focus and the attachment to nation is only small. At the same time, these statements are only partly true in relation of attachment to neighbourhood and social relationships. Thus, there is a similarity in-sofar as for those persons, whose attachment to the neighbourhood is missing or weak, not even the social relationships are important. Contrary

134
to the characteristics of the previously mentioned spatial categories, with the increase of the importance of the social relationships both the strong and the weak attachment to the neighbourhood stand out. That is, in case of neighbourhood the signifi cance gets lost. Moreover, the very strong and the very weak attachments represent a similar proportion in case, when the answering persons consider the social relationships as maximally important. Thus, the factor neighbourhood takes up extremely contradic-tory values, when one would like to know, what kind of relation is char-acteristic between social relationships and each spatial category. It can be assumed that this fl uctuation is caused by bad neighbourhood relationships, as a source of confl ict, and at the same time it can be referred to the fact that this also indicates a source of social confl ict (Figure 10).
Therefore it is worth overviewing the relationship between the confl ict with the neighbours and the strength of attachment to the neighbourhood. The data (Figure 10) shows that attachment to neighbourhood is strong in the case of those, whose neighbourly relationship is not burdened by con-fl icts, but burdening with confl icts the attachment towards this spatial category will disappear, which seems to verify the previous assumption.
Figure 10: Importance of social relationships and extent of attachment to settlement and neighbourhood (See: Table 6)

135
Source: Questionnaire survey about economic and social confl icts, 2013 (Own edition)
Figure 11: Extent of confl icts with the neighbours and the strength of attachment to neighbourhood
Source: Questionnaire survey about economic and social confl icts, 2013 (Own edition)

136
4.6. Environment and attachment
The settlement and living environment of the individual is also an impor-tant element of a balanced life and the quality of life during the weekdays. From this approach it has to be emphasized that the settlement environ-ment, be it a built or a natural environment, equally shows a correlation (p<0.005) to the attachment to locality and area. In the case of the answe-ring persons, who think that the environment is very important, the strong and very strong characteristic of attachment to settlement and area can be considered as determinant. It is true that the strong attachment is not consistently intensive, however, as a whole, beside the fragmentation of the outlining graph, the correlation between the strong attachment and the importance of the natural and built environment is undeniably deter-minant (Figure 12). At the same time, the Eta values enlighten that the strength of the correlation is by no means complete and it can explain only a small part of the relationship in this context.
Figure 12: Importance of settlement and strength of attachment to settlement and area

137
Source: Questionnaire survey about economic and social confl icts, 2013 (Own edition)
4.7. Happiness and attachmentFrom the perspective of confl icts, it is also very important to analyse the values of satisfaction and trust in the overview of the results. First, the aspect of happiness will be overviewed alongside the spatial attachments (Figure 13).

138
Figure 13: Strength of attachment to settlement, nation, region and neighbourhood and the extent of happiness

139
Source: Q uestionnaire survey about economic and social confl icts, 2013 (Own edition)

140
The data of happiness shows a very large similarity in the case of at-tachment to nation, settlement or region, in which the strong and very strong attachment goes with relatively high values of happiness. However, it is a fact that also the weak attachment pattern is strengthened by high-er values of happiness, at a much smaller extent, though. A difference can be experienced, however, in the phenomenon called neighbourhood effect. Since in this category the weak attachment behaves almost similar like the strong attachment, that is, both of them show a high value as one part of the answering persons give voice to their happiness. It is worth mention-ing that no signifi cant relationship between the two factors can be found here (See: Table 6) and the Eta value is weak, thus, the relationship of neighbourhood and happiness is hardly compatible. A similar experience can be made also here as for the topic importance of social relationships, which was already discussed previously. That is, as the social relationships were evaluated highly, the extent of the weak and strong attachments towards neighbourhood has become more prominent. It can still be found that in the case of neighbourhood, the extent is fl uctuating, the weak and strong attachment equally go with strong feelings of happiness. That means that the neighbourhood is not a determinant factor and the possible neg-ative effect of the neighbourhood relationships will not affect the happiness of the individual. That implies that neighbourhood means also a source of confl ict from the perspective of attachment, since the individual mini-mizes his/her attachment to the neighbourhood so this does not infl uence his/her feeling of happiness.
4.8. Trust and attachmentThe other important aspect regarding social relationships is, especially if also the aspect of social capital is emphasized, the factor of trust. Compa-ring the extent of trust with the appropriate spatial element, it can be found that the signifi cance is only minimal. For example, the correlation in the case of the trust to the fellow citizens and the attachment to the nation is a limit value (sig.: 0.047, p<0.05) and the Pearson-correlation is 0.037 in the context of attachment to settlement and local authorities (sig.: 0.019, p<0.05) and s correlated: 0.047 (See: Table 6). As it can be seen also from the deta-ils of the next fi gure (Figure 14), the relationships will be deteriorated by the fact that the high values of trust (be it a trust towards the settlement or even the fellow citizens) are not accompanied by high attachment va-lues. The attachment is maximized at the middle values of trust, thus, the relationship is weak and it moves, considering signifi cance, just on the

141
boundary line. The differences are very small, though, but the extent of trust towards fellow citizens with a very high attachment to nation is also present in higher areas of trust, which is probably not surprising. In the case of attachment to settlement, two relationships of trust have been examined, the trust in the local authorities and in the inhabitants of the settlement. The two aspects have produced similar results and also in these cases it is true that with the full extent of trust, the attachment values are not maximized, but they decrease proportionally. Thus, the proportion of those people who trust completely in their local authorities and in the in-habitants of their settlement is low. However, if cutting out the very low and very high extreme values of trust, the stronger attachment is more characteristic in case of high trust. At the same time, the strong attachment will be characteristic even for trust values, which are relatively lower than middle values. It can also be formulated in that way that the result of re-moval of extreme trust values is that a strong spatial-social attachment can be found in the relation of inhabitants belonging and living within the same spatial segment. However, this is accompanied by trust values, which can be even weaker than the average.
Figure14: Attachment to settlement and the extent of trust in those living there and the local authorities

142
Source: Questionnaire survey about economic and social confl icts, 2013 (Own edition)
Figure 15: Attachment to nation and Europe and extent of trust in the fellow citizens

143
Source: Questionnaire survey about economic and social confl icts, 2013 (Own edition)
4.9. Satisfaction and attachmentThe examination of the different kinds of satisfaction shows a similar pi-cture as in the case of trust. As the questioned persons reported about their satisfaction with life, the received data were compared with their attach-ment to settlement, region, nation and Europe. The reason why these spa-tial categories were selected to be examined is because these categories were the closest to the living conditions of the individuals, such as insti-tutional, lifestyle and way of life or spatial movement and these spatial categories are able to map almost all aspects of life in the space.
4.9.1. Aspect of satisfaction with lifeConsidering the data, it will be probably striking even at fi rst sight that the strong attachments in each spatial category have a similar form and these coincide very much with the logic, which can also be found in the case of trust. This time the satisfaction can be found in the place of trust and on the graphs (Figure 15) the extreme values are the high values. That means that the maximum satisfaction or a value close to it, is accompanied by a relatively low proportion of strong spatial attachment, be it a factor related to settlement, region or nation or possible to Europe. It can be seen, consi-dering the proportions of very strong attachment, that the proportion of

144
the answering persons with very strong attachment is high, if the extent of satisfaction is middle or a little stronger. But the values of a very strong attachment and the complete satisfaction do not coincide in any of the spa-tial categories. Considering the proportions of weak attachment, it shows slightly higher values for middle satisfaction and lower values for extreme satisfaction. Furthermore, the data of the especially weak attachment have a minimum proportion in each case, regardless of the extent of the satisfa-ction. However, it cannot be said that in the case of satisfaction, the weak or very weak attachment proportions towards the communities of spatial categories would increase, moreover, their percentage values will remain extremely low. Also a various presence of signifi cance can be observed in these cases. If the spatial categories examined in the graphs (Figure 16) will be taken as a basis, signifi cance is true everywhere (See: Table 6, A9). At the same time, it is indicatory that the same signifi cance will be lost between neighbourhood and satisfaction with life, as it can be seen from the table. Furthermore, it can be important to mention that there is also a valid sig-nifi cant correlation between happiness and satisfaction with life (See: Table 6, A8-A9) and moreover in the topic here a strong correlation can be found (Eta: 0.666), which otherwise shows very low values, along satisfaction and spatial attachments (Eta: between 0.1-0.2).
Figure 16: The extent of attachment to settlement, region and Europe and extent of satisfaction with life (See: Table 6, A9)
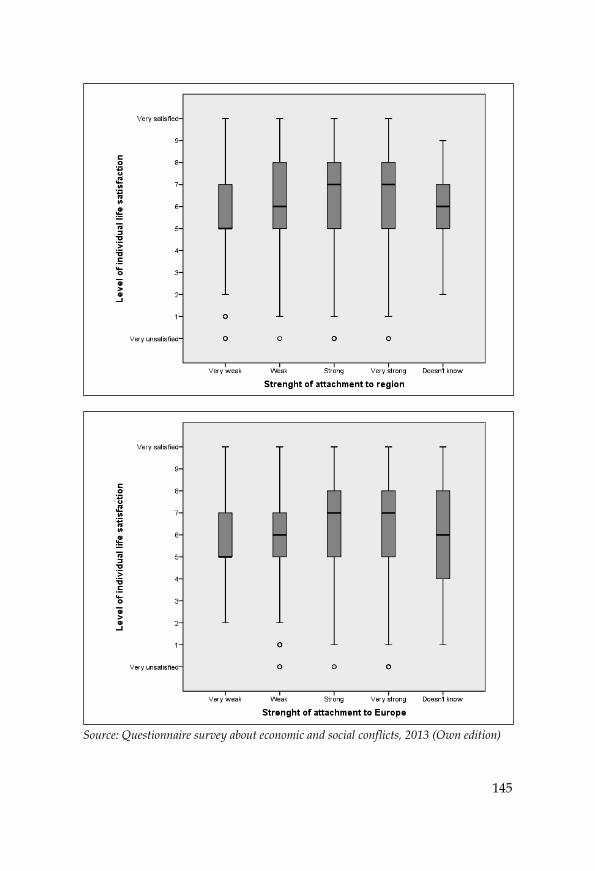
145
Source: Questionnaire survey about economic and social confl icts, 2013 (Own edition)
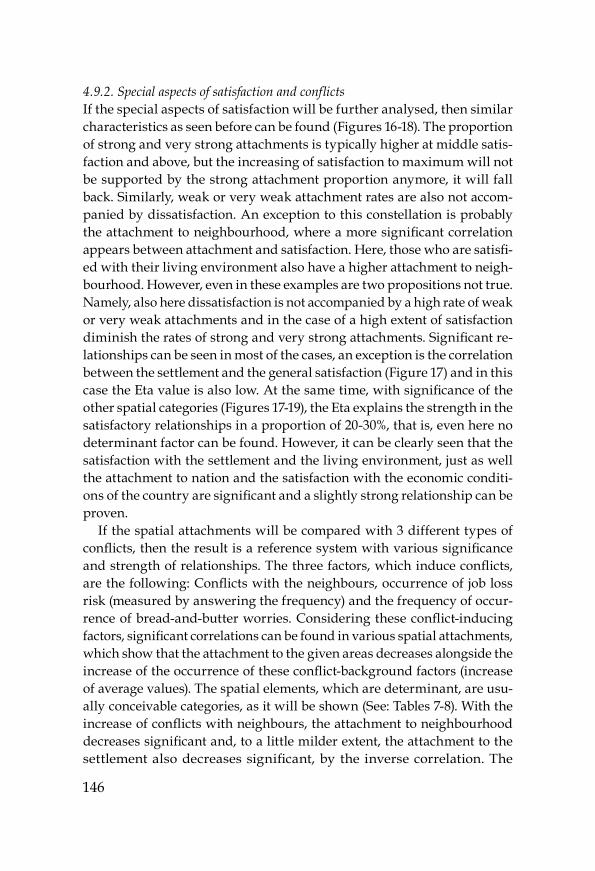
146
4.9.2. Special aspects of satisfaction and confl ictsIf the special aspects of satisfaction will be further analysed, then similar characteristics as seen before can be found (Figures 16-18). The proportion of strong and very strong attachments is typically higher at middle satis-faction and above, but the increasing of satisfaction to maximum will not be supported by the strong attachment proportion anymore, it will fall back. Similarly, weak or very weak attachment rates are also not accom-panied by dissatisfaction. An exception to this constellation is probably the attachment to neighbourhood, where a more signifi cant correlation appears between attachment and satisfaction. Here, those who are satisfi -ed with their living environment also have a higher attachment to neigh-bourhood. However, even in these examples are two propositions not true. Namely, also here dissatisfaction is not accompanied by a high rate of weak or very weak attachments and in the case of a high extent of satisfaction diminish the rates of strong and very strong attachments. Signifi cant re-lationships can be seen in most of the cases, an exception is the correlation between the settlement and the general satisfaction (Figure 17) and in this case the Eta value is also low. At the same time, with signifi cance of the other spatial categories (Figures 17-19), the Eta explains the strength in the satisfactory relationships in a proportion of 20-30%, that is, even here no determinant factor can be found. However, it can be clearly seen that the satisfaction with the settlement and the living environment, just as well the attachment to nation and the satisfaction with the economic conditi-ons of the country are signifi cant and a slightly strong relationship can be proven.
If the spatial attachments will be compared with 3 different types of confl icts, then the result is a reference system with various signifi cance and strength of relationships. The three factors, which induce confl icts, are the following: Confl icts with the neighbours, occurrence of job loss risk (measured by answering the frequency) and the frequency of occur-rence of bread-and-butter worries. Considering these confl ict-inducing factors, signifi cant correlations can be found in various spatial attachments, which show that the attachment to the given areas decreases alongside the increase of the occurrence of these confl ict-background factors (increase of average values). The spatial elements, which are determinant, are usu-ally conceivable categories, as it will be shown (See: Tables 7-8). With the increase of confl icts with neighbours, the attachment to neighbourhood decreases signifi cant and, to a little milder extent, the attachment to the settlement also decreases signifi cant, by the inverse correlation. The

147
strength of the relationship is not too high, though (F=7.444, F=4.89), but it is an explanatory factor. The other examined spatial categories are not infl uenced signifi cantly by this confl ict. The second aspect is the signifi cant correlation between the risk of losing job and the attachment to spatial categories, which can be proven in the case of attachment to neighbourhood, settlement, region and nation, showing that in these cases the average values of attachment decrease with the increase of the occurrence of risk. Thus, the unsafe working place damages the extent of the attachment in case of these spatial elements (See: Tables 7-8). And fi nally, in the case of occurrence of frequency of bread-and-butter worries (in the sense of fi -nancial, income problems...etc.) and the attachment to spatial categories, a signifi cant correlation can be proven at neighbourhood, region and nation and also its explanatory power is valid, though, not generally valid. Nevertheless, it can be said that both confl icts of private life and econom-ic character damage the attachment values to that given spatial unit, be it life-like elements, which can be perceived by the individual specifi cally, such as the neighbourhood or the settlement, or rather abstract categories, such as region, nation or European characteristics.
Figure 17: The extent of attachment to settlement and the general satisfaction and the extent of satisfaction with the condition of living environment and the settlement

148
Source: Questionnaire survey about economic and social confl icts, 2013 (Own edition)
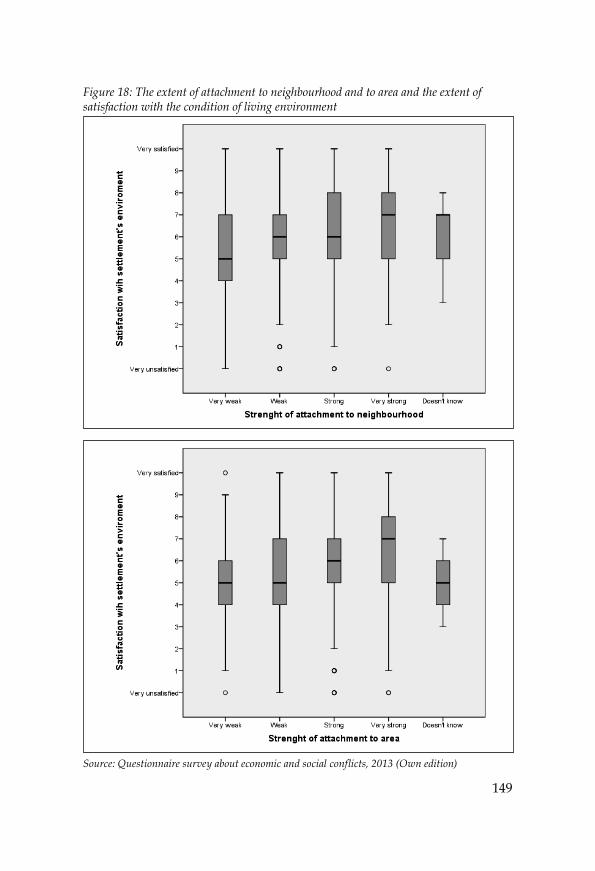
149
Figure 18: The extent of attachment to neighbourhood and to area and the extent of satisfaction with the condition of living environment
Source: Questionnaire survey about economic and social confl icts, 2013 (Own edition)
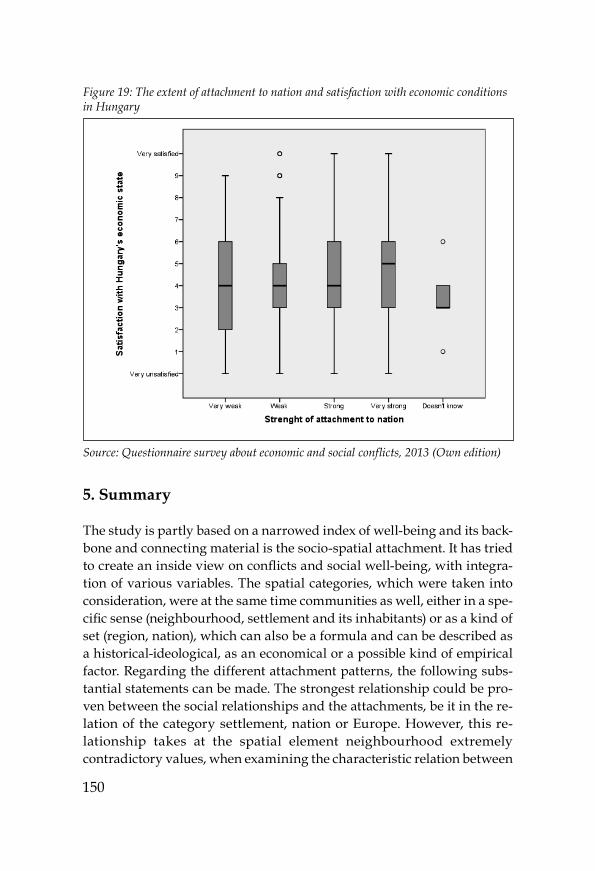
150
Figure 19: The extent of attachment to nation and satisfaction with economic conditions in Hungary
Source: Questionnaire survey about economic and social confl icts, 2013 (Own edition)
5. Summary
The study is partly based on a narrowed index of well-being and its back-bone and connecting material is the socio-spatial attachment. It has tried to create an inside view on confl icts and social well-being, with integra-tion of various variables. The spatial categories, which were taken into consideration, were at the same time communities as well, either in a spe-cifi c sense (neighbourhood, settlement and its inhabitants) or as a kind of set (region, nation), which can also be a formula and can be described as a historical-ideological, as an economical or a possible kind of empirical factor. Regarding the different attachment patterns, the following subs-tantial statements can be made. The strongest relationship could be pro-ven between the social relationships and the attachments, be it in the re-lation of the category settlement, nation or Europe. However, this re-lationship takes at the spatial element neighbourhood extremely contradictory values, when examining the characteristic relation between

151
social relationships and certain spatial categories. As a proof, regarding the question which was already asked at the beginning of the study, it can be shown that the neighbourhood, as a spatial category of attachment, di-verges from the data line. It can be explained with the survey questions about confl icts that where the relationship with the neighbours is not bur-dened by confl icts, the attachment rate is high, otherwise it is low. Neigh-bourhood is a kind of indicator, since those who have confl icts here, their values of attachments will be minimized at this level.
The low areal attachment in the North Hungary region is a strikingly different attachment value, compared to the other parts of the country. Another difference is that the regional attachments in Central Hungary and in Transdanubia are slightly higher than in the Eastern part of the country.
The results show relating to happiness, satisfaction and trust that a strong attachment implies, parallel to these factors, a high attachment rate, though, signifi cance cannot be proven not in the least in each case. As a whole, the attachment to different socio-spatial factors can be regarded as stable and satisfaction, happiness and trust as elements of well-being strengthen the attachment. Taking a look at the relationship between the spatial attachments and the confl ict-inducing factors, it can be seen that there are signifi cant relationships between them and that the negative economic events and the social confl icts reduce the extent of attachment.
Table 5: Correlations of genders and age groups in relation to spatial attachment
Correlations A1 A2 A3 A4 A5Attachment to settlement A1
Pearson correlation
1 .573** .415** .042 .187**
Sig. .000 .000 .061 .000N 2030 2029 2029 2030 2029
Attachment to nation A2
Pearson correlation
1 .647** -.009 .170**
Sig. .000 .700 .000N 2030 2029 2030 2029
Attachment to Europe A3
Pearson correlation
1 -.003 .105**
Sig. .883 .000N 2030 2030 2029

152
Gender of the questioned person A4
Pearson correlation
1 .093**
Sig. .000N 2031 2030
Age group of the questioned person A5
Pearson correlation
1
Sig. N 2030
** Correlation is signifi cant: 0.01
Table 6: Combined table of correlations
Correlations A1 A2 A3 A4 A5 A6 A7 A8 A9 A10 A11 A12Attachment to neigh-bourhood A1
Pearson correla-tion
1 .483** .384** .334** .260** .005 .014 .041 .076** .020 -.026 -.009
Sig. .000 .000 .000 .000 .824 .530 .067 .001 .359 .237 .698
N 2030 2029 2027 2029 2029 2029 2030 2028 2028 2019 2024 2020
Attachment to settlement A2
Pearson correla-tion
1 .647** .573** .415** .046* .042 .079** .119** .046* .007 .008
Sig. .000 .000 .000 .036 .061 .000 .000 .038 .746 .710
N 2030 2027 2029 2029 2029 2030 2028 2028 2019 2024 2020
Attachment to region A3
Pearson correla-tion
1 .746** .565** .040 .054* .087** .128** .039 .034 .001
Sig. 0.000 .000 .074 .014 .000 .000 .081 .125 .976
N 2028 2027 2027 2027 2028 2026 2026 2017 2022 2018
Attachment to nation A4
Pearson correla-tion
1 .647** .068** .060** .099** .137** .060** .099** .037
Sig. .000 .002 .007 .000 .000 .007 .000 .095
N 2030 2029 2029 2030 2028 2028 2019 2024 2020
Attachment to Europe A5
Pearson correla-tion
1 .064** .064** .057* .085** .050* .118** .067**
Sig. .004 .004 .010 .000 .024 .000 .003
N 2030 2029 2030 2028 2028 2019 2024 2020
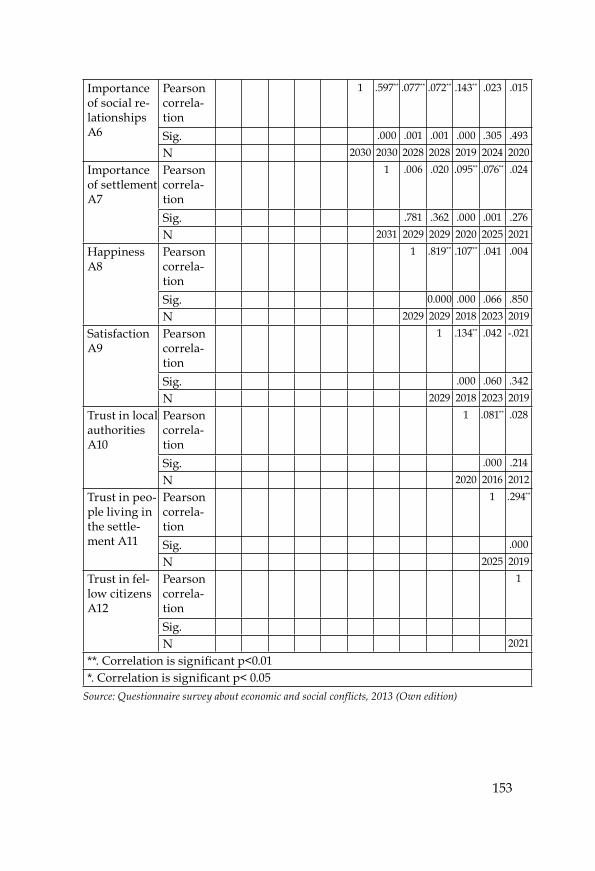
153
Importance of social re-lationships A6
Pearson correla-tion
1 .597** .077** .072** .143** .023 .015
Sig. .000 .001 .001 .000 .305 .493
N 2030 2030 2028 2028 2019 2024 2020
Importance of settlement A7
Pearson correla-tion
1 .006 .020 .095** .076** .024
Sig. .781 .362 .000 .001 .276
N 2031 2029 2029 2020 2025 2021
Happiness A8
Pearson correla-tion
1 .819** .107** .041 .004
Sig. 0.000 .000 .066 .850
N 2029 2029 2018 2023 2019
Satisfaction A9
Pearson correla-tion
1 .134** .042 -.021
Sig. .000 .060 .342
N 2029 2018 2023 2019
Trust in local authorities A10
Pearson correla-tion
1 .081** .028
Sig. .000 .214
N 2020 2016 2012
Trust in peo-ple living in the settle-ment A11
Pearson correla-tion
1 .294**
Sig. .000
N 2025 2019
Trust in fel-low citizens A12
Pearson correla-tion
1
Sig.
N 2021
**. Correlation is signifi cant p<0.01 *. Correlation is signifi cant p< 0.05
Source: Questionnaire survey about economic and social confl icts, 2013 (Own edition)

154
Table 7: Correlation between spatial attachments and 3 confl ict areas according to the averages
Neighbourhood confl ict A
ttac
hmen
t to
nei
gh-
bour
hood
Att
achm
ent
to s
ettl
e-m
ent
Att
achm
ent
to re
gion
Att
achm
ent
to n
atio
n
Att
achm
ent
to E
urop
e
Not burdened at all
2.61 2.94 3.01 3.15 3.06
Burdened to a small extent
2.40 2.84 2.93 3.04 2.85
Highly burdened 2.08 2.98 3.14 3.20 3.14Completely burdened
2.10 3.00 3.20 3.10 2.80
Sig.: 0.000 0.000 0.255 0.113 0.002F 7.449 4.893 1.290 1.782 3.792
Risk of losing job, unemployment A
ttac
hmen
t to
nei
gh-
bour
hood
Att
achm
ent
to s
ettle
-m
ent
Att
achm
ent
to re
gion
Att
achm
ent
to n
atio
n
Att
achm
ent
to E
urop
e
Not relevant 2.62 3.01 3.09 3.22 3.10Very seldom 2.50 2.86 2.96 3.08 2.97Rarely 2.46 2.81 2.89 3.02 2.93Often 2.41 2.74 2.83 3.03 2.90Very often 2.32 2.73 2.87 2.95 2.88
Sig: 0.000 0.000 0.000 0.000 0.004F 4.245 6.927 5.624 5.215 3.425
Bread-and-butter worries A
ttac
hmen
t to
nei
gh-
bour
hood
Att
achm
ent
to s
ettle
-m
ent
Att
achm
ent
to re
gion
Att
achm
ent
to n
atio
n
Att
achm
ent
to E
urop
e
Not relevant 2.48 2.96 3.03 3.17 3.14Very seldom 2.62 2.94 3.05 3.17 3.03Rarely 2.64 2.98 3.10 3.19 3.07Often 2.41 2.85 2.90 3.08 2.97Very often 2.40 2.76 2.82 2.94 2.86
Sig: 0.000 0.013 0.000 0.004 0.029F 8.579 2.916 5.139 3.429 2.494
Questionnaire survey about economic and social confl icts, 2013 (Own edition)
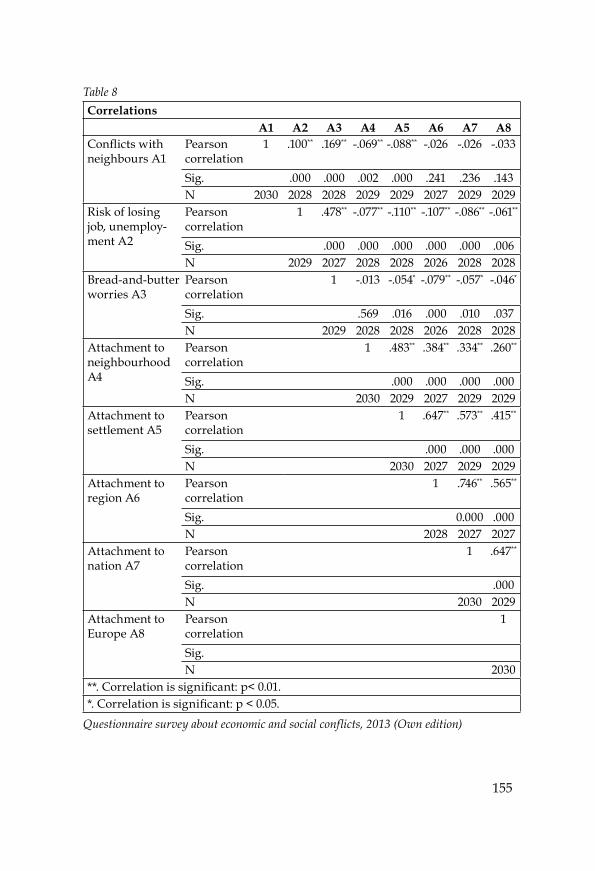
155
Table 8Correlations A1 A2 A3 A4 A5 A6 A7 A8Confl icts with neighbours A1
Pearson correlation
1 .100** .169** -.069** -.088** -.026 -.026 -.033
Sig. .000 .000 .002 .000 .241 .236 .143N 2030 2028 2028 2029 2029 2027 2029 2029
Risk of losing job, unemploy-ment A2
Pearson correlation
1 .478** -.077** -.110** -.107** -.086** -.061**
Sig. .000 .000 .000 .000 .000 .006N 2029 2027 2028 2028 2026 2028 2028
Bread-and-butter worries A3
Pearson correlation
1 -.013 -.054* -.079** -.057* -.046*
Sig. .569 .016 .000 .010 .037N 2029 2028 2028 2026 2028 2028
Attachment to neighbourhood A4
Pearson correlation
1 .483** .384** .334** .260**
Sig. .000 .000 .000 .000N 2030 2029 2027 2029 2029
Attachment to settlement A5
Pearson correlation
1 .647** .573** .415**
Sig. .000 .000 .000N 2030 2027 2029 2029
Attachment to region A6
Pearson correlation
1 .746** .565**
Sig. 0.000 .000N 2028 2027 2027
Attachment to nation A7
Pearson correlation
1 .647**
Sig. .000N 2030 2029
Attachment to Europe A8
Pearson correlation
1
Sig. N 2030
**. Correlation is signifi cant: p< 0.01.*. Correlation is signifi cant: p < 0.05.
Questionnaire survey about economic and social confl icts, 2013 (Own edition)

156
Factors of subjective safety in Hungary HELGA HORVÁT H– PÉT ER TÓT H
1. Introduction
Research of the subjective feeling of safety is a multidisciplinary approa-ched subject from the last fi fty years, in which criminology, sociology, psy-chology, political science and law are also involved. The Hungarian re-searches of the last years paid a lot of attention to the territorial aspects of crime and committing crime. Although it is well-known from the statistics that Hungary still has indices below the European average and can be re-garded as a middle-infected country, considering the number of criminal acts, which increased since the political transformation. However, the per-ception and clear-sightedness of the people is signifi cantly infl uenced by other dimensions as well. In this study, no notice will be taken of the effects of the media and the public life, which form the conceptions about crimes. Instead of this, the effects of the main socio-demographic characteristics, which are behind the personal experiences and beliefs, will be presented.
This will be carried out on many levels. First, the Hungarian criminal situation will be analysed, by comparing it with the trends in the European Union and the true or deformed judgement about it in the Hungarian society will be introduced. The objective data from settlement, national and county statistics from the last 6 years will be compared with the sub-jective opinion of the questioned persons about their settlement, from which it has turned out that 45% of the Hungarian population judge the criminal situation of their own settlement better than reality. Considering the group of bad judgement about the crime situation the opinion of in-habitants of the capital is especially striking, where a signifi cant proportion of the questioned persons have a much better opinion about the criminal situation in the capital, than it is in reality. Contrary to this, the population of the villages, where there is a signifi cant number of people, draws a much worse picture about their settlement, than it is in reality. Thus, the spatial situation and the type of settlement signifi cantly infl uence the placement of the own settlement in a relationship system.

157
The questioned persons indicated poverty and unemployment in the highest percentage and the ethnical confl icts as the cause of crimes, which is related to the previously mentioned ripple effects of public life.
In the second place, an attempt will be made, based on the current in-ternational literature, to conceptualize and operationalize the factors, which infl uence the fear of crime. It is an interesting relation that the confl icts and the elements of well-being (related to settlement, health, mental and subjective and objective) are among those dimensions, which determine the extent of the fear of crime.
Furthermore, it will be shown that also in this case, the previously widespread opinion seems to be right in our case, that the perception of a person, who experienced a crime or was informed about a crime from his/her immediate environment, will be much more negative, than that of those, who do not have such experiences. On the other hand, the strongest relationship was proven between the judgement of the condition of the built environment, the residential factors, and the development of the fear of crime. This confi rms the effect and the applicability of the broken win-dows theory, used by the conservative criminology. The effect of each dimension on each other will be demonstrated with the path model.
2. The crime situation in Hungary and the European trends
The crime situation in Hungary has already been analysed in various stu-dies. In this case the overview of the Hungarian situation and its place-ment in international relations cannot be abandoned, in order to interpret the data of this research and to put it into a frame. The importance of this is supported by the fact that the public safety and its judgement became an important political-economic factor, since it has an immediate effect on areas of national strategy such as tourism, investments, capital infl ow and not in the least, the mental condition of the population.
To demonstrate the situation, a general picture will be drawn about the characteristic crime trends of the European Union, and in connection with this an attempt will be made to present the Hungarian data in the form of a general overview.
The number of crimes, which became known, is an objective index, which delivers valid data about the situation in the specifi c country and allows the international data to be compared. In order to ensure compa-

158
rability, the number of crimes per 10,000 inhabitants will be examined and interpreted (an exception is the homicide, where because of the small number of elements the basis of comparison is 1,000,000 inhabitants). The source of the crime data was the statistical database about crime and ju-risdiction on the homepage of Eurostat.
The number of crimes in the European Union peaked in 2003 and since then a continuously decreasing tendency can be observed. This phenom-enon was examined by Van Dijk and his research colleagues (Van Dijk et al., 2005). According to their opinion, the favourable trends are usually explained by the demographic changes, since a large part of the crimes are committed by young men. Thus, the development of the number of crimes is determined by the population in these age groups. Besides, there are also other explanations, according to which there is also a connection with the more effective legislation and the tightening of punishments. An additional aspect is the importance of the prevention of crime, which in-cludes the more effi cient measures of property protections of the inhabitants (Aebi-Linde, 2010).
Figure 2: Change in the number of known crimes per 10, 000 inhabitants in 27 member states of the EU
Source: Piskóti-Kovács, 2014
159
The Hungarian situation is similar to that in Europe, but considering the peak of crime, Hungary (and the Czech Republic) exceeded Europe, since in these countries the number of known crimes was the highest in the year 1998-1999. In Hungary (similar to the other Visegrád Group coun-tries) the average of the number of the known crimes was below the European average.
Regarding the subject of crime, a difference has to be made between the crime against property and violent crimes (crimes against person), because these have different effects on the fear of the individuals of crime, accord-ing to the international researches and the literature.
Analysing the data, it can be seen that the number of thefts (crimes against property) and homicides (crimes against person) has been de-creased. However, in the same period, the number of other violent crimes and crimes against persons has continuously increased, though at a small extent. This is important, because it can be used later as an explanatory factor for the analysis of the data.
2.1 The subjective judgement of the crime situation in HungaryFirst, the answer to the question, how good is the judgement of the Hun-garian population regarding the crime situation in their own settlement was looked for, compared with the national average. That means, what is the proportion of those, who assess their situation truly and how many people assess their current situation much worse or better than the objec-tive statistical data. The crime data of Hungary, compared with the Europe-an statistical data, has already previously been shown. However, the ave-rage spreading of crime in the settlements of the country is different. In this case no difference has been made between each type of crime, but the average of fi ve years of the number of registered crimes were taken as a basis from the database of KSH-TEIR (Hungarian Central Statistical Offi -ce-National Information System for Country Development and Country Planning).
Considering crimes, clearly the capital and the county seats are the most infected settlements. These cities have indices above the Hungarian aver-age. As it can be seen in Table 1, in the column, Number of registered crimes per 10,000 inhabitants, there are signifi cant differences not only between the types of settlements, but also between the counties of the country. However, the average values are not spreading so much, as in the case of types of settlements. Considering the crime statistics of the last fi ve years, Fejér, Hajdú-Bihar and Somogy counties have above average values, and

160
the lowest values have Vas and Tolna counties.1 (If separating the capital, the values of Pest county also are below the national average).
Table 3: Distribution of the groups of the population, who assess the crime rate of their settlement in comparison with the national average truly and wrong, according to each county and the type of settlement and the actual crime statistics of each spatial element.
He/she assesses the crime situation in his/her settlement compared
to the national average
Number of registered
crimes per 10,000
inhabitants*Correctly
(%)
Better than the actual
situation (%)
Worse than the actual
situation (%)Bács-Kiskun 41.6 23.4 35 339Baranya 34.3 29.9 35.8 382Békés 19.1 41.2 39.7 328Borsod-Abaúj-Zemplén
33.1 15.5 51.4 376
Csongrád 42 44 14 437Fejér 32.9 51.3 15.8 504Győr-Moson-Sopron 35.5 37.6 26.9 353
Hajdú-Bihar 30 64.3 5.7 527Heves 43.8 15.,6 40.6 375Jász-Nagykun-Szolnok
56.8 35.8 7.4 409
Komárom-Esztergom 52.2 40.3 7.5 361
Nógrád 100 0 0 367Pest 38.1 25.4 36.4 334Somogy 55.1 25.6 19.2 477Szabolcs-Szatmár-Bereg
28.2 52.8 19 367
Tolna 74.4 23.1 2.6 321Vas 21.4 40.5 38.1 316Veszprém 46.2 50 3.8 334
1 From the crime statistics the year 2010 is missing, for which no data could be found from the database of KSH TEIR. Therefore, for the calculation of the average of fi ve years the data from the year 2007 were also used.

161
He/she assesses the crime situation in his/her settlement compared
to the national average
Number of registered crimes per
10,000 inhabitants*
Correctly (%)
Better than the actual
situation (%)
Worse than the actual
situation (%)Zala 40 15 45 331Budapest 6.1 93.9 0 642County seat Cities with county rights
35.8 56.7 7.5 575
Other towns 44.5 33,3 22,2 377Large villag-es, villages 36.4 18,7 44,9 264
Hungary 33.3 45 21,7 425* Calculated from the average of the data in the time period 2007-2012Sources: Own edition according to the data of the KSH TEIR
After assessment of the situation in the country and the calculation of the above presented values for each settlement, these values have been paired with the questionnaires of the sample of the people in the research. Thus, it was also possible to represent the differences between the subjec-tive opinion of the questioned persons and the objective statistical data. The procedure with the settlement data was the following: those settlements with averages with one standard deviation distance from the calculated national average (425 crimes/10,000 inhabitants) got the label worse than average or better than average (depending on the positive or the negative direction of the distance from the average), and settlements with averages with a distance of two standard deviations got the label much worse than average or much better than average. This settlement variable has been paired with the answers on the following question in the questionnaire: How would you assess your settlement in comparison to the national average according to the following: extent of crime, the chance of being a victim of a burglary or a violent attack?
It can be seen that the two big types of crimes, the crime against person and the crime against property, have been treated in this case together. The answers for these questions are equivalent with a four-grade scale. (The proportion of those with the answer I do not know, and with No answer was 4.4%, which was not used.)

162
With the simultaneous examination of the two variables in a matrix, 16 new types were created, from which seven and later three categories were fi ltered for each settlement. The essence of this was, at which extent is the scale value of the answering person similar with or different from the objective indicator of the settlement. The distribution of these three cate-gories is shown in Table 1 on the county level and in the case of each type of settlements.
One third of the Hungarian population perceives and assesses the crime situation in their settlement compared to the national situation correctly, be it a good or a bad situation. The clearest judgement can be found in the Hungarian cities, where the proportion of the questioned people, who assess their situation correctly, is 44.5%. The lowest proportion is in Budapest, where only 6.1% of the questioned people see the situation cor-rectly. However, it has to be remarked that in the question about the resi-dence and not the settlement, where the person in question lives, was asked. If the answering person believed the question to be about his/her neighbourhood or district and not about the capital, then this proportion could be higher, since in Budapest regarding the extent of crime signifi cant differences can be shown. For example, the central districts have signifi cant tourist traffi c and related to this there are specifi c crimes there and there-fore the indices of these districts are signifi cantly different from the aver-ages of the other districts.
The question is further, if the inhabitants do not see the real situation correctly, then the subjective opinion is better or worse than the reality. In this case, it can be seen that the smaller a settlement is, where the ques-tioned person lives, the worse considers he/she the crime situation in his/her settlement compared to the national average. There is a break in the pattern at the city level. Regarding the cities with county rights and the capital, it can be said that the questioned persons report a rather better than the real situation.
There are also problems on the county level, as for example in Nógrád county, where all the values of data are from the same city, which infl uence the fi nal results. It can be assumed that it is possible that in counties with large border crossing points the number of registered crimes includes also the crimes at these border crossing points, but these crimes have not much everyday impact on the population of that certain county and therefore they assess their situation better than the statistical data. This presupposition could not be proven, since the inhabitants of Borsod-Abaúj-Zemplén coun-

163
ty perceive their situation as much worse than the reality. On the contrary, the population of Fejér and Veszprém counties with no border crossing points consider their situation as better than the statistical data. In this case, the reason for the higher crime rate can be due to Lake Balaton and the holiday area, though this assumption is not confi rmed by the data of the counties along the south shore of Lake Balaton, which are different from those data (Table 1). The proportion of those people, who assess their situa-tion wrongly – be it in the positive or in the negative direction – is not in-fl uenced by the real spatial statistics. The counties with the highest propor-tion of negative difference in the judgements compared to the real situation were besides the previously mentioned Borsod-Abaúj-Zemplén county and Zala and Heves counties. And the counties with the highest proportion of positive difference in the judgement of the population, excluding the capi-tal, besides the previously mentioned Veszprém and Fejér counties, the population of Hajdú-Bihar and Szabolcs-Szatmár-Bereg counties.
2.2 Opinions about the background of the causes of crimesFurthermore, the question to examine was which social processes are re-cognised by the Hungarian population as reasons for the violation of laws and crimes. Certainly, it was not exactly formulated even in this case, which crimes and trespasses belong to the term of the violation of laws, but ob-viously such crimes belong to this theoretical category, which are recog-nised as typical crimes in the residential area of the people and therefore they can be experienced and interpreted by them. White collar crime does not typically belong to this type. Those elements have the highest value in the order of importance of the causes, which determine the economic situation, confi rming the remark above. Almost half of the answering per-sons said that poverty can be a very important reason for the violation of the law (Figure 2). Unemployment, which is connected to the previous di-mension in many aspects, is similarly an important factor for the answe-ring persons. Thus, crimes, which are arising from deprivation, are those, which can be recognised the most by the members of the Hungarian so-ciety.

164
Figure 3: How signifi cant is the role of certain social characteristics in the development of violation of laws (%)
Source: Own edition
Klára Kerezsi and her colleagues have proven last year that there is not necessarily a correlation between the ethnical composition of a settlement and the number of crimes (Kerezsi et. al. 2014). However, the connection between the ethnicity and certain types of crime was mentioned in some of the answers, as a consequence of the political skirmishes in the last years, which have infl uenced the public opinion. 72% of the questioned persons said that the ethnical composition of a community can be an im-portant or a very important cause for the violation of the law.
It is interesting that no correlation could be found between the real ethnical composition of the settlement of the questioned and the distribu-tion of the severity of the causes in the opinions. To the questions of the questionnaires the data about the ratio of the Roma ethnic group were assigned in the statistical series of the National Census 2011 and the cor-relation of these data with the opinions was analysed. In this regard no signifi cant correlation could be found between a higher ratio of the Roma

165
population in a community and a higher rate of crime perception of the people in this community related to the ethnical composition. However, the above mentioned elements are considered as real relationships by the Hungarian population, which have to be considered defi nitely in the future.
It can be seen from this short review of the situation that the judgement of the crime situation and the assessment of the causes are infl uenced by a lot of factors. In the following the factors, which cause a fear of crime will be dealt with.
3. The theoretical model of the factors, which determine the fear of crime
The phenomenon of the fear of crime was invented by science in the 1960s and after this it became an area researched regularly and from more and more aspects (Lee, 2007). In the decades since then the literature of this topic became more and more interdisciplinary. It was researched, how the fear of crime infl uences everyday activities, how individual patterns of cautious behaviour develops, to what extent do people feel themselves safe in their home or in the street, which emotional reactions are caused by th-reat of fear in people and how the insecurity of the social situation or the deterioration of a living environment affects the feeling of safety of the people living there.
The effect of the fear of crime on individuals and communities has been shown. It was proven that it can damage the health conditions and phys-ical functions of the individuals, it undermines the social cohesion and the trust, transforms the long run development of certain surroundings and areas, infl uences the independence of children. Furthermore, it strengthens and supports the more and more rigorous and punishment-cen-tred criminal investigation and jurisdiction (Jackson, Kuha 2014).
The conceptual net used for understanding the problem refl ects well, how each dimension, which was examined many times one by one, affects each other and affects the fear of crime directly or indirectly through another factor (Lorenc et al., 2012).
The model specifi es 5 key factors, which shape and infl uence the extent of fear of crime and during this process they also affect each other. These key factors can also be divided into many subfactors. Subsequently, these subfactors will be presented because the goal of the analysis was the mea-
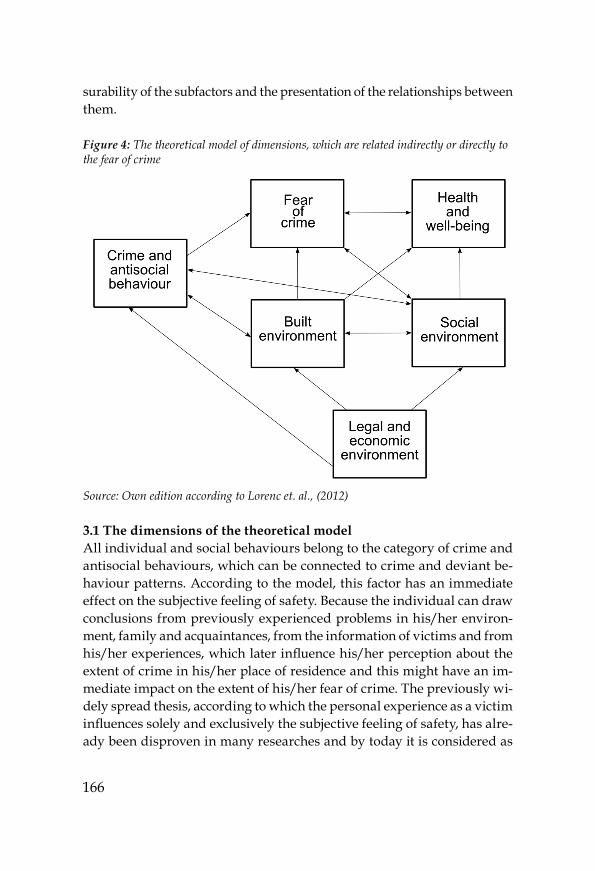
166
surability of the subfactors and the presentation of the relationships between them.
Figure 4: The theoretical model of dimensions, which are related indirectly or directly to the fear of crime
Source: Own edition according to Lorenc et. al., (2012)
3.1 The dimensions of the theoretical modelAll individual and social behaviours belong to the category of crime and antisocial behaviours, which can be connected to crime and deviant be-haviour patterns. According to the model, this factor has an immediate effect on the subjective feeling of safety. Because the individual can draw conclusions from previously experienced problems in his/her environ-ment, family and acquaintances, from the information of victims and from his/her experiences, which later infl uence his/her perception about the extent of crime in his/her place of residence and this might have an im-mediate impact on the extent of his/her fear of crime. The previously wi-dely spread thesis, according to which the personal experience as a victim infl uences solely and exclusively the subjective feeling of safety, has alre-ady been disproven in many researches and by today it is considered as

167
invalid. However, the presence of this factor should still be considered as one of many factors.
Related to the phenomena crime and antisocial behaviour in the society and fear of crime, a cognitive heuristic, which simplifi es thinking, plays an important role. According to this heuristic, the individual estimates his/her chance of being a victim each time in that certain situation and he/she returns later to this schema to make the judgement of his/her sit-uation easier. During this process he/she uses a factor as a cognitive anchor, groups the other acquired information to this factor and draws the essen-tial consequences for him/her.
As a cognitive simplifi cation strategy all measures of the decision maker, which simplify the decision process are called. There is a dispute about under which circumstances and with which effi ciency can cognitive heu-ristics be used. However, the literature agrees that the heuristic decision making in most of the cases has better results, is faster and requires less resources (Tversky et al. 1974).
The factor of health and well-being includes physical and mental health, health conscious behaviour and well-being, which can be interpreted from a social aspect.
According to the model, the fear of crime and health are factors, which interact with each other and infl uence the extent and condition of each other fundamentally. Besides, both the built environment and the social environment infl uence the factor of health and well-being.
Crime can have direct and indirect effects on health and well-being. By direct effects such situations are understood, in which somebody suffers injury and pain because of a crime, in which he/she is the passive party, the victim. These are unambiguously the negative effects of violent crimes against his/her person. Furthermore, the crimes in the environment of the individual also affect the person indirectly, especially on the neighbour-hood and living environment level.
The effect of the subjective feeling of safety on the mental and physical health can also be examined from many aspects. The effect of the anxiety caused by fear of crime on the mental health of the individual and the realisation of a process in the opposite direction, namely the effect of the weak mental condition on the developing fear, can be considered as par-allel processes, acting side by side.
The fear of crime can activate such avoidance mechanisms, which can infl uence the movement of the individual outside of his/her home and

168
causing a negative impact on the social relationships and physical activity of the individual in the long run.
The built environment contains those dimensions of the physical envi-ronment, which were formed by humans. These are the spaces of everyday life. Some theories attach important roles also to some environmental ef-fects. Belonging to these are the noise effects, noise pollution, traffi c, de-prived living environment, overcrowded living environment, which are characteristic for the living environment, be it inside or outside the home. Parallel to this, some additional factors have to be examined, such as the frequency of social interactions and the structure of the social relationships.
According to the chain of thought above, how the built environment affects the mental health of the individual can be determined, by infl uenc-ing health conscious and health related behaviour of the individuals and by infl uencing crime, fear of crime and social environment.
The social environment conceptually contains the inequalities within the society, the net of social relationships, the spatial pattern of the social relationships (e.g. living environment, neighbourhood), which already forms a transition to the built environment and also includes overlapping with it.
The legal and economic environment infl uences, according to the the-oretical model, the fear of crime intermediately only, but at the same time from many directions. This factor includes the political decisions in a broader sense, the trends, the guidelines of the legislation and the practice and orientation of the government and the jurisdiction.
The publication of crime statistics, the interpretation of cases and events highlighted in the media affect the fear of crime by infi ltration, even un-intentionally, in the risk assessment of the individual.
Two theoretical approaches deal with the effects of the social and eco-nomic environment. The social chaos theory emphasizes the effects of crimes in the narrow environment and the personally experienced anti-social behaviour, but the signs of vandalism, the deterioration of ownerless areas and the problems of the social environment also belong to this theory, for example the visible signs of drug trade. This orientation also even appears in conservative sociological theories as the broken windows theory (Wilson and Kelling 1982).
The social integration theory emphasizes the role of the local commu-nities in the development of fear. It was observed that even the local, social relationships of a larger intensity can reduce the subjective feeling of

169
safety, because mention of crime is more often made in everyday conver-sation and there are more sources of information about disturbing events (Skogan, 1986).
3.2 Measurability of the dimensions of the theoretical modelFurthermore, an attempt was made to create the dimensions, which were described in the previous chapter, by aggregation of the variables from the questionnaires. As it could be seen above, all of the aspects of well-be-ing, which were considered in this study, could be found among the ele-ments, which were listed in the theoretical approach. That means that all of the dimensions of well-being, which were previously developed by the research team, could be integrated in the examination of the practical app-licability of the theoretical model. Additionally to these dimensions, the integration of other dimensions was required. The development of these will be described now in more detail. The description of all dimensions and the variables, which ensure their measurability, are in Table 2.
The fact that fear of crime is a complex phenomenon, was previously referred to, which contains the conceptions, knowledge and previous ex-perience of the individual, but, additionally to the beliefs, the real actions and feelings are parts of it as well. This duality is addressed by the cog-nitive and affective type of fear, where the cognitive side means the opin-ions about the public safety (the topic about opinions related to the change of public safety in the community of the questioned person, presented previously), and the affective side means the sensation of fear itself. For the affective side the fear of possible crimes is described in the living area or outdoor and the fear of possible indoor crimes in the own property of the questioned person. From these two variables the aggregated fear index by factor analysis was developed, which preserved 73.261% from the vari-ance of the two variables and can be used as the general dimension of fear.
The summing up of the attitudes and experiences related to crime and other antisocial behaviours, in order to make the dimensions interpretable, was even more complicated. In this case, the number of situations in which the individual became an actual victim and confl ict situations, which are caused by antisocial behaviour of others, are considered. The effect of the experienced victim role in their own private circles and among acquain-tances can be considered as insignifi cant according to the literature. However, with its particular interpretation in this research the relationship above could be tested. The different quantity of the experienced confl icts

170
could be calculated by summing up the strength of each experienced confl ict-types (scale values) and by standardization of the received variable. (It has turned out at the separate examination of each confl ict, at compar-ison of the medians, that according to the Hungarian population the homelessness, the burglaries and the robberies are the largest problems in Hungary.)
The well-being indices, developed by the research team, are among the variables related to health and well-being, the built environment, the questions measuring the social environment and the social status. The detailed description of the development of these indices is not available here.
Table 4: The conceptualization and operationalization of fear of crime
Name of dimension
Elements of dimension Variables used in the research
Fear of crime
cognitive sz33e – Public safety. How has the condition of your community changed, in your opinion, in the recent past considering the following?
affective Aggregated fear index: sz24 – In your opinion how safe is it to walk in the neighbourhood of your living area after dark alone?sz25 – Are you afraid of criminals, if you are alone in your fl at/house at night?
Crime and antisocial behaviour
actual committed crimes
sz24 – Have you been or any members of your household a victim of burglary or a violent assault in the last 5 years?
experienced confl icts
Problem index from the starting points of wrongful acts in the community- Please states, how severe are the following problems in your living area and in the neighbourhood of your home?sz34a - homelessness sz34d - alcoholismsz34e – drug abusesz24f - prostitutionsz34g - national, ethnical confl ictssz34h – burglaries, robberiessz34i - violence, attempted manslaughtersz34j – economic crimesz34k – organized crimesz34l – violence within the family

171
Name of dimension
Elements of dimension Variables used in the research
Health and well-being
mental condition subjective index of well-being – according to Argyle (excluding work stress)
subjective well-being
subjective index of well-being – according to Argyle (excluding work stress)
health condition eg_2 – variable health condition
Built environment
condition of public places and buildings
living_area_4 – Variable living area major component
environmental stress
living_area_4 – Variable living area major component
Social environment
relationships, networks
sz50_count – How many different kinds of relationships do you have in your life?
social status, income inequalities
well_being_4 – index of subjective well-beingobj_2 – index of objective well-being
neighbourhood factors
sz52r – How much do you trust your neighbours?
social capital, social cohesion
sz48_count – In how many life areas can you rely only on yourself?
ethnical discrimination
This dimension cannot be measured in this form. Ratio of Roma population in the community.
Legal and economic environment
This dimension from the side of the individual cannot be measured in this case.
Source: Own edition
Among the various elements of the social environment dimension, in the variable sets, which infl uence the extent of social capital, can be looked into. On the one hand, this can be obtained by counting the various types of relationships and on the other hand by the presentation of the aspect of loneliness (in how many areas of life can the answering person count on himself/herself only). In connection to this is the measurement of the relationships with the neighbourhood.
The ethnical discrimination could not be measured in this case because most of the questions were about, whether there is a problem of such kind in that given community, and not about confl icts related to the ethnical background of the questioned person. Similarly, the functioning of the legal and economic environment was not presented because these appear also in the theoretical model indirectly, as external effects.

172
4. Analysis of factors, which determine the fear of crime according to the results of the survey
First, the relations of each variable to each other have been examined. Ac-cording to the correlations between the variables previously presented, summarized in Table 3, a number of observations can be made.
The attitudes related to the crime itself cannot be necessarily treated together in a complex index of fear, since it can be seen that each element relates to the other differently or not at all. Where signifi cant relationships can be shown, those elements do not show a strong but rather a weak correlation. For example, the cognitive element of fear of crime shows a correlation only to the variable experienced confl icts and it has no signif-icant correlation to the two other variables in connection to crime. There is a correlation between the judgement of the crime rate in the communi-ty and the perception of confl icts, which leads to crime in some cases (X1 and X4 in the table).
When further analysing the variables regarding crime, considering correlation pairwise, the variable describing the actual fear of crime, which describes the affective side of fear (marked with X2 in the table) is the one, which correlates, with the exception of the cognitive dimension, with the other two dimensions. Moreover, the correlation coeffi cients are the high-est here in the whole segment. Although according to the literature the effects of real experiences regarding the shaping of fear of crime are neg-ligible, the results here are different. The highest correlation (0.271) for the variables in relation to crime is measured between the actual events and the affective side of crime. However, only a weak or no correlation can be found to the other variables, which infl uence the fear of crime indirectly or directly.
It is useful to return to the affective side of the fear of crime, since most of the international researches use this in the presentation of this topic and this index has proven as the variable expressing fear with the strongest and most correlations from the four approaches used in connection with crime in this study. The correlation is the strongest to the subjective well-be-ing (0.282) and the built environment of the residence (0.283) of the ques-tioned person. Both variables mentioned here have a strong correlation to their variables, which describe the social environment and aggregate the income inequalities, which show their effects on the fear of crime with high probability indirectly, through these variables.
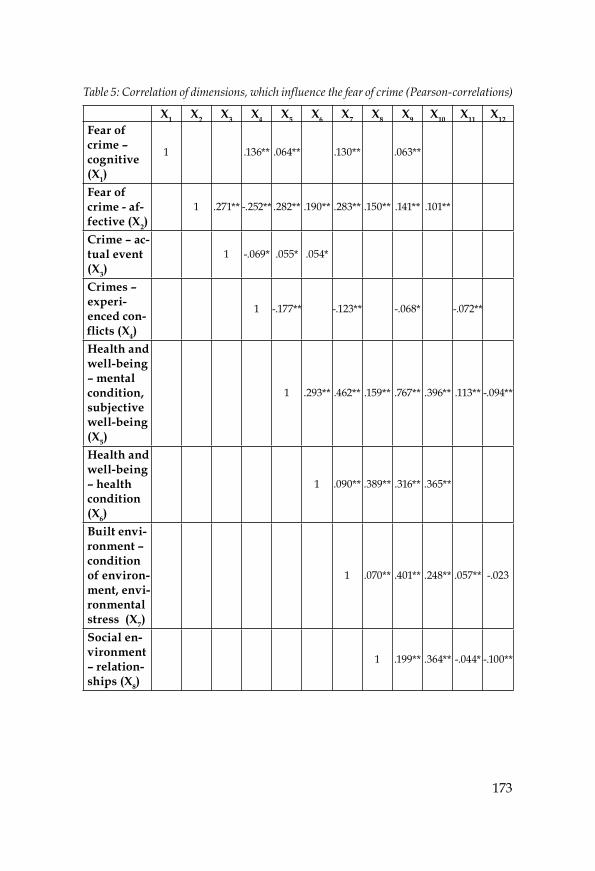
173
Table 5: Correlation of dimensions, which infl uence the fear of crime (Pearson-correlations)
X1 X2 X3 X4 X5 X6 X7 X8 X9 X10 X11 X12
Fear of crime – cognitive (X1)
1 .136** .064** .130** .063**
Fear of crime - af-fective (X2)
1 .271** -.252** .282** .190** .283** .150** .141** .101**
Crime – ac-tual event (X3)
1 -.069* .055* .054*
Crimes – experi-enced con-fl icts (X4)
1 -.177** -.123** -.068* -.072**
Health and well-being – mental condition, subjective well-being (X5)
1 .293** .462** .159** .767** .396** .113** -.094**
Health and well-being – health condition (X6)
1 .090** .389** .316** .365**
Built envi-ronment – condition of environ-ment, envi-ronmental stress (X7)
1 .070** .401** .248** .057** -.023
Social en-vironment – relation-ships (X8)
1 .199** .364** -.044* -.100**

174
Social en-vironment – income inequali-ties (sub-jective) (X9)
1 .369** .074** -.117**
Social en-vironment – social status (ob-jective) (X10)
1 .009 -.094**
Social en-vironment – neigh-bourhood (X11)
1 -.038
Social en-vironment – social ca-pital (X12)
1
** Correlation is signifi cant 0.01 * Correlation is signifi cant 0.05Source: Own edition
Subsequently an attempt will be made to develop a model, similar to that in the theoretical literature, with a multiple regression path model. If all previously listed variables are listed in a regression model, it turns out that neither the cognitive side of crime nor the questions of social envi-ronment about neighbourhood and social capital infl uence the extent of affective fear in this model. The regression, executed with the remaining variables, explained 25% of the variance of the affective fear, that means that in the path model also a 75% other/external effect had to be considered.
In this model fear is affected the most by the subjective well-being (measured by psychological methods), that is, the fear as a mental factor is infl uenced the most by other mental factors (beta=0.358). This is followed by the fi nancial side of the subjective well-being, that is, the effect of the differences arising from income inequalities, which has a reversed effect on the analysed fear, which means the more wealthy somebody feels him-/herself and the higher somebody places him-/herself on the social ladder, the less he/she fears (beta=0.271) (Table 4).

175
Table 6: Regression coeffi cients of the dimensions, which determine the affective element of the fear of crime (R2=0.255)
Beta t Sig.Constant -10.375 .000Crimes – actual event (X3) .244 10.340 .000
Crime - experienced confl icts (X4) -.161 -6.643 .000Health and well-being – mental condition, sub-jective well-being (X5)
.358 8.318 .000
Health and well-being – health condition (X6) .091 3.379 .001Built environment – condition of environment, environmental stress (X7)
.208 7.674 .000
Social environment – relationships (X8) .088 3.375 .001Social environment – income inequalities (sub-jective) (X9)
-.271 -6.907 .000
Social environment – social status (objective) (X10)
-.090 -3.229 .001
Source: Own edition
Fear is signifi cantly infl uenced by the awareness of actual crimes, that is by their own information or the information from others about becom-ing a victim (beta=0.244), that is in this case the consensus in the literature has to be modifi ed a little. The previously experienced events here have a visible effect on the fear. After this comes the relation to the built environ-ment and to the living area, which affects the fear inversely, similarly to the income inequalities. Therefore, the higher the questioned person as-sesses his/her environment, the less stress he/she has in everyday life and the less fear is induced in his/her weekdays.
On the other side are those variables, whose effect is insignifi cant and negligible. These affect the development of fear rather indirectly with a high probability. Among these are the health condition, the social relationships and the social status of the questioned person. Also the latter affects fear reversely, that is the higher the educational level and the income of a person is, the less the probability that fear of crime will develop in him/her.
Another issue, which was not yet mentioned, is the effects of events, which can be experienced or are experienced in the community and will not necessarily be transformed into crimes. The effects of experienced confl icts can be considered, compared to the other variables as medium and will be integrated in this model inversely (beta=-0.161). That means that those, who are aware of the other confl icts in their environment can probably better judge the social environment of their residential area, from

176
which they can draw a more accurate picture about the contamination of this area with crime, thus their fear can be reduced.
With the execution of further regressions, the path model, which deter-mines the affective element of fear of crime, will be created (Figure 4). It appears from this model that the objective well-being and the social status (X10) affect fear indirectly because they determine both subjective mental well-being (X5) and the health condition of the individual (X6) and the number of relationships in the environment of the individual (X8). As the most important factor was the dimension, which showed the mental con-dition (X5), because this has the largest direct effect and furthermore this indirectly forwards the effects most of the dimensions towards the analysed dimension of fear.
Figure 5: Path model of dimensions, which determine the fear of crime
Source: Own edition
The following dimensions were left out from the path model: description of the cognitive side of crime (X1), role of neighbourhood and the relation-ship with the neighbourhood (X11) and the effect of the social capital (X12). These dimensions do not even have an indirect effect on the analysed dimensions. Thus, it can be stated that one part of the dimensions, which are described in the theoretical model are not suitable, if the goal is to

support the relationships with empirical methods, and only a part of the elements of the dimension are in interaction with the development and extent of fear.
5. Further possibilities in the research of this topic
It was shown in this research that fear of crime is a complex phenomenon, which development is impacted by various elements and which have to be analysed separately. The researcher is in a diffi cult situation, since there is word about a very subjective phenomenon. It was seen that there are large differences between the reality of the settlement of the answering persons and its interpretation. Two thirds of the Hungarian population cannot accurately assess how large the risk of the phenomenon crime can be in their residential area. The smaller communities usually perceive their situation worse, whereas the inhabitants of larger communities are more positive than in reality.
However, it became clear during the research that a difference has to be made between the aggregated data of the settlement units or the larger spatial units and the data on the level of the living environment. This is the level, where most of the questioned persons can make a value judge-ment, which can be true or false but can still be considered as a real one, about the crime situation of the environment and he/she can assess, wheth-er his/her fear has a real basis. On this level the mental side and the im-pressions from the immediate residential environment are those, which determine the beliefs/feelings of the population the most. However, behind these immediate effects, the effect of the differences is also there, which arises from the social status. It has turned out, interestingly, that fear is not larger there, where the problem can be the loss of accumulated prop-erty values and the elements ensuring objective well-being, but fear is more characteristic for people with a lower social status.
It could not be proven that being a victim has no effect on fear, since this factor also has a signifi cant impact, in this model.
Possible direction of further researches can map the perception of res-idential area and the relationship systems, related to it, better; because the effect of the residential area appeared to be one of the most important factors.

179
References
Adams, R. E. (1992): Is Happiness a Home in the Suburbs? The Infl uence of Urban versus Suburban Neighborhood on Psychological Health. Journal of Community Psychology, 20., 353-372
Aebi, F., Linde, A. (2010): Is There a Crime Drop in Western Europe? Euro-pean Journal on Criminal Policy and Research, 16. évf., 4., 251-277.
Allardt, E. (1976): Dimensions of welfare in a comparative Scandinavian study. Acta Sociologica, 19., 227–240.
Argyle, M. (1996): Subjective Well-Being. In: Offer, A. (szerk.) Pursuit of the Quality of Life. Oxford University Press, Oxford. 18-45.
Austin, D. M., Furr. L. A., Spine, M. (2002): The Effect of Neighborhood Conditions on Perception of Safety. Journal of Criminal Justice, 30., 417-427.
Baba, Y., Austin, D. M. (1989): Neighborhood Environmental Satisfaction, Victimization, and Social Participation as Determinants of Perceived Neighborhood Safety. Environment and Behavior, 21., 763-780.
Barakonyi, E. (2007): A munka és a magánélet egyensúlyának megteremtése. Tudásmenedzsment, 8. évf., 2., 79–90.
Bauman, Z. (2001): The Individualised Society. Polity Press, Cambridge, 19–37., 78–103., 129–131 ., 201–223.
Beck, U. (2003): A kockázat-társadalom – Út egy másik modernitásba. Andorka Rudolf Társadalomtudományi Társaság – Századvég Kiadó, Budapest. 79–86., 138–288.
Bendle, F. M. (2002): The crisis of ‘identity’ in high modernity. The British Journal of Sociology, 1., 1–17.
Blanchfl ower, D. G., Oswald, A. J. (2008): Is Well-Being U-shaped Over the Life Cycle? Social Science and Medicine, 66., 1733–1749.
Boudon, R. [et al.] (szerk.) (1998): Szociológiai lexikon. Corvina Kiadó, Buda-pest
Bőhm, A. (2000): Új demokrácia és a helyi hatalom. In: Táll É. (szerk.): Az új demokrácia önkormányzati vezetői. MTA PTI [Magyar Tudományos Akadémia, Társadalomtudományi Kutatóközpont, Politikatudományi Intézet], Budapest, 97–102.

180
Bőhm, A. (2003): Az ezredvég magyar társadalma. Rejtjel kiadó, Budapest, 88–129., 235–241. (Rejtjel politológiai könyvek 17.)
Braudel, F. (2003): Franciaország identitása - A tér és a történelem. Helikon, Budapest
Brereton, F., Clinch, J. P., Ferreira, S. (2008): Happiness, Geography and the Environment. Ecological Economics, 65., 386-396.
Brower, S. (2003): Designing for Community. University of Maryland Press, College Park
Bugovics, Z. (2007): Társadalom, identitás és területfejlesztés, L’Harmattan kiadó, Budapest
Bugovics, Z. (2014): A győri identitás háttértényezőinek vizsgálata. In: Csizmadia Z., Tóth P. (szerk.): Helyi társadalom és intéznyrendszer Győrben. Universitas-Győr Nonprofi t Kft, Győr, 100-115.
Castells, M. (1997): The Power of Identity. Blackwell, Oxford, 23–45., 69–78., 129–187.
Collins, R. (1974): Confl ict Sociology. Academic Press, New YorkCoser, A. L. (1956): The Functions of Social Confl ict. Free Press, Glencoe, Illi-
noisCrouch, C. J. (2001): Confl ict sociology. In: Smelser, N. J., Baltes, P. B. (szerk.)
(2001): International Encyclopedia of Social and Behavioral Sciences. Perga-mon Press, Oxford, 2554-2559.
Cseh-Szombathy, L. (1985): A házastársi konfl iktusok szociológiája. Gondolat Kiadó, Budapest
Csepregi, G. (1994): A konfl iktusok szerepe a családban. Vigilia. 59. évf., 12., 894–901.
Csizmadia, Z. (2007): Társadalmi konfl iktusok és kutatási módszerek. In: Hervainé, Sz. Gy., Szirmai, V. (szerk.): Versenyképesség és város térségi egyenlőtlenségek. Tanulmánykötet II-III. Kodolányi János Főiskola, MTA Veszprémi Területi Bizottság, MTA Szociológiai Kutatóintézet, Székes-fehérvár, 164-177.
Csizmadia, Z. (2009): A társadalmi konfl iktus problematika elméleti me-galapozása. In.: Szirmai, V. (szerk.): A várostérségi versenyképesség tár-sadalmi tényezői. Dialóg Campus Kiadó, Pécs, 123–129.
Csizmadia, Z., Molnár, B., Váradi, Zs. (2007): Társadalmi konfl iktusok a magyarországi nagyvárosokban. In: Hervainé, Sz. Gy., Szirmai V. (szerk.): Versenyképesség és várostérségi egyenlőtlenségek. Tanulmánykötet II-III. Kodolányi János Főiskola, MTA Veszprémi Területi Bizottság, MTA Szociológiai Kutatóintézet, Székesfehérvár, 177–196.

181
Dahrendorf, R. (1959): Class and Class Confl ict in an Industrial Society. Stan-ford University Press, Stanford
Dassopoulos, A., Monnat, S. M. (2011): Do Perceptions of Social Cohesion, Social Support, and Social Control Mediate the Effects of Local Com-munity Participation on Neighborhood Satisfaction? Environment and Behavior, 43., 546-565.
Deaton, A. (2008): Income, health and well-being around the world: Evi-dence from the Gallup World Poll. Journal of Economic Perspectives, 22., 53-72.
Deeming, Ch. (2013): Addressing the Social Determinants of Subjective Wellbeing: The Latest Challenge for Social Policy. Journal of Social Pol-icy, 42 évf., 3., 541 – 565.
Diener, E. (1984): Subjective well-being. Psychological Bulletin, 95. évf., 3, 542-575.
Diener, E. (2006): Guidelines for national indicators of subjective well-being and ill-being. Journal of Happiness Studies, 7., 397–404.
Diener, E., Lucas, R. E., Scollon, C. (2006): Beyond the hedonic treadmill: Revising the adaptation theory of well-being. American Psychologist, 61., 305-314.
Diener, E., Suh, E.M., Lucas, R.E., Smith, H.L. (1999): Subjective well-being: Three decades of progress, Psychological Bulletin, 125., 276-302.
Diener, E., Tay, L., Oishi, S. (2013): Rising income and subjective wellbeing in nations. Journal of Personality and Social Psychology, 104., 267-276.
Dolan, P., Layard, R., Metcalfe, R. (2011): Measuring Subjective Wellbeing for Public Policy. Offi ce for National Statistics. Newport, South Wales
Doxiadis, C. (1968): Ekistics: An Introduction to the Science of Human Settle-ments. Oxford University Press, New York
Easterlin, R. A. (1973): Does Money Buy Happiness? The Public Interest, 30., 3-10.
Easterlin, R. A. (1995): Will raising the incomes of all increase the happiness of all? Journal of Economic Behavior and Organization, 27., 35-47.
Easterlin, R. A., Angelescu, L., Zweig, J. S. (2011): The Impact of Modern Economic Growth on Urban-Rural Differences in Subjective Well-Being. World Development, 39., 2187-2198.
Erikson, E. H. (1959): Identity and the life cycle: selected papers. International Universities Press, New York, 23-41.
Eurofound [European Foundation for the Improvement of Living and Working Conditions] (2006): First European Quality of Life Survey: Ur-

182
ban-rural differences. Offi ce for Offi cial Publications of the European Communities, Luxembourg
Farrall, S. J., Bannister, J. D., Gilchrist, E. (1997): Questioning the Measure-ment on the „Fear of Crime”. British Journal of Criminology, 37., 658-679.
Godó, N. (2002): A viselkedésföldrajz alapjai. In: Tóth J. (szerk): Általános társadalomföldrajz II. Dialóg Campus kiadó, Budapest-Pécs
Goffman, E. (1991): Stigma és szociális identitás. In: Goffman E.: A hétközna-pi élet szociálpszichológiája. Gondolat, Budapest, 192–211.
Hajdu, G., Hajdu, T. (2011): Elégedettség és relatív jövedelem: a referenci-acsoport összetételének hatása az információs és státuszhatás erőssé-gére. Szociológiai Szemle, 21 évf., 3., 83-106.
Hale, C. (1996): Fear of Crime: A Review of the Literature. International Review of Victimology, 4., 79-150.
Hankiss, E. (2002): Új Diagnózisok. Osiris Kiadó, Budapest, 37–38., 82., 88–90.Harcsa, I. (2011): Gondolatok a társadalmi fejlődés méréséről. Statisztikai
Szemle, 89. évf., 10-11., 1081–1097.Heine, S. J., Lehman, D., Peng, K., Greenholtz, J. (2002): What’s Wrong with
Cross-Cultural Comparisons of Subjective Likert Scales?: The Refer-ence-Group Effect. Journal of Personality and Social Psychology, 82., 903-918.
Helliwell, J., Layard, R., Sachs, J. (2013): World Happiness Report, http://unsdsn.org/wpcontent/uploads/2014/02/WorldHappinessReport2013_online.pdf
Hur, M., Morrow-Jones, H. (2008): Factors That Infl uence Residents’ Satis-faction With Neighborhoods. Environment and Behavior, 40., 619-635.
Jackson, J., Kuha, J. (2014): Worry about crime in a cross-national context: A model-supported method of measurement using the European Social Survey. Survey Research Methods. 8. évf., 2., 109-205.
Janky, B. (2005): Intergenerációs konfl iktusok a modern jóléti államokban: áttekintés. Demográfi a, 48. évf., 2-3., 291–309.
Kahneman, D., E., Diener, E., N. Schwarz (szerk.) (1999): Well-being: The foundations of hedonic psychology, Russell Sage Foundation, New York
Kerezsi, K., Gosztonyi, M., Polák, A. (2014): A roma és nem roma együttélés konfl iktusai, kriminális vonatkozásai. Belügyi Szemle, 62. évf., 7-8., 5-51.
Kimball, K., Levy, H., Ohtake, F., Tsutsui, Y. (2006): Unhappiness after Hurricane Katrina. NBER Working Papers 12062. National Bureau of Economic Research, Cambridge

183
Koltai, L. (2010): A munka és a magánélet összeegyeztetése a Visegrádi országokban. In: Simonyi Á. (szerk.): Családpolitikák. Szociálpolitikai és Munkaügyi Intézet, Budapest, 68–78.
Kopp, M. (szerk.) (2008): Magyar lelkiállapot 2008. Semmelweis Kiadó és Multimédia Stúdió, Budapest
Kopp, M., Kovács, M. E. (szerk.) (2006): A magyar népesség életminősége az ezredfordulón. Semmelweis Kiadó, Budapest
Kopp, M., Martos, T. (2011): A magyar gazdasági növekedés és a társadal-mi jóllét, életminőség viszonya. Magyar Pszichofi zikai é s Egészség-lélektani Társaság, Budapest, http://beszamolo2010.jno.hu/cd/fug-gelekek/2_kutatasok_eredmenyei/kopp_gazdasagi_novekedes.pdf Letöltés: 2014. szeptember
Kruger, A. B. (szerk.) (2009): Measuring the Subjective Well-being of Nations: National Accounts of Time Use and Well-Being. University of Chicago Press, Chicago
KSH [Központi Statisztikai Hivatal] (2014a): A háztartások életszínvonala. Budapest
KSH [Központi Statisztikai Hivatal] (2014b): A jóllét magyarországi indikátor-rendszere 2013. Budapest
KSH [Központi Statisztikai Hivatal] (2014c): Érdekességek a szubjektív jóllét (well-being) magyarországi vizsgálatából. Statisztikai Tükör, 8. évf., 2.
La Gory, M., Pipkin, J. (1981): Urban Social Space. Wadsworth, BelmontLa Gory, M., Ward, R., Sherman, S. (1985): The Ecology of Aging: Neigh-
borhood Satisfaction in an Older Population. Sociological Quarterly, 26., 405-418.
Lawton, P. (1980): Environment and Aging. Wadsworth, BelmontLayard, R. (2005): Boldogság. Fejezetek egy új tudományból. Lexecon Kiadó,
GyőrLayard, R. (2005): Happiness: Lessons from a New Science. Penguin Books,
New YorkLee, B. A., Guest, A. M. (1983): Determinants of Neighborhood Satisfaction:
A Metropolitan-Level Analysis. Sociological Quarterly, 24., 287-303.Lee, M. (2007): Inventing Fear of Crime: Criminology and the Politics of Anxiety.
Willan, CollumptonLelkes, O. (2003): A pénz boldogít? A jövedelem és hasznosság kapcsolatá-
nak empirikus elemzése. Közgazdasági Szemle, 50. évf., 5., 383–405.
184
Lelkes, O. (2005): A szabadság íze: boldogság, vallás és gazdasági átmenet. Századvég, 11., 57–90.
Lelkes, O. (2008): Happiness across the life cycle: Exploring age-specifi c preferences. European Centre for Social Welfare Policy and Research, Policy Brief, March (2), 1–16.
Lengyel, Zs. (1990): Interperszonális konfl iktusok. Társadalmi Szemle, 3., 9–36.
Lorenc, T. [et al.] (2012): Crime, fear of crime, environment, mental health and wellbeing: Mapping review of theories and causal pathways. Health and Place, 18., 757-765.
Macionis, J, J. (2012): Social problems. 2010 census update, 4th edition. Pear-son.
Makra, E., Farkas, D., Orosz, G. (2012): A munka-család konfl iktus kérdőív magyar validálása és a munka-család egyensúlyra ható tényezők. Magyar Pszichológiai Szemle, 67. évf., 3., 491–518.
McCrea, R., Shyy, T.-K., Western, J., Stimson, R. J. (2005): Fear of crime in Brisbane: Individual, Social and Neighborhood Factors in Perspective. Journal of Sociology, 41., 7-27.
Messing, V., Róbert, P., Ságvári, B., Szabó, A. (2013): A magyar társadalom demokráciaképe. ESS Magyarország Gyorsjelentés 1. MTA Társadalomtu-dományi Kutatóközpont, Budapest
Michelson, W. (1976): Man and His Urban Environment. Addison-Wesley, Reading
Mullins, P. (1973): Neighborhood Perception and the Effects of Forced Residental Mobility. Journal of Sociology, 9., 45-48.
Nagy, B. (2014): A munka és a magánélet határán: hogyan kutassunk egy régi témát új megközelítéssel? Kultúra és közösség, 5. évf., 1., 7–8.
Nagy, G. (2014): A jólét-index megjelenése és tartalmi, módszertani fejlődése a hazai szakirodalomban. Perspective: Revista De Stiinta Si Cultura, 20., 126–140.
Nahavandi, A., Malekzadeh, A. R. (1999): Organizational Behavior. Prentice Hall, Michigan
Noll, H.-H. (2013): Subjective Social Indicators: Benefi ts and Limitations for Policy Making—An Introduction to this Special Issue. Social Indica-tors Research, 114., 1-11.
Nussbaum, M., Sen, A. (1993): The Quality of Life. WIDER Studies in Devel-opment Economics. Clarendon Press, Helsinki.

185
Oh, J. H. (2003): Social Bonds and the Migration Intentions of Elderly and Urban Residents: The Mediating Effect of Residental Satisfaction. Pop-ulation Research and Policy Review, 22., 127-146.
Paasi, A. (2009): The resurgence of the ‘Region’ and ‘Regional Identity’: theoretical perspectives and empirical observationson regional dy-namics in Europe. Review of International Studies, 35., 121-146.
Park, R. E., Burgess, E. (1925): The city. Suggestions for Investigation of Human Behavior in the Urban Environment. Chicago University Press, Chicago
Páthy, Á. (2014): A társadalmi szerkezet belső területi sajátosságai. In: Csizmadia Z., Tóth P. (szerk.): Helyi társadalom és intéznyrendszer Győrben. Universitas-Győr Nonprofi t Kft, Győr, 48-74.
Pilinszki, A. (2013): Konfl iktusok hatása a párkapcsolati instabilitásra. Demográfi a, 56. évf., 2-3., 144–170.
Piskóti-Kovács, Zs. (2014): A bűnözésföldrajz modern irányzatainak alkalmazá-si lehetőségei különböző területi szinteken. Doktori értekezés Miskolci Egyetem Műszaki Földtudományi Kar Mikovinyi Sámuel Földtudo-mányi Doktori Iskola, Miskolc.
Price, M. E. (1998): A televízió, a nyilvános szféra és a nemzeti identitás. Magvető Kiadó, Budapest, 96–102., 283–312., 379–397.
Rapaport, A. (1977): Human Aspects of Urban Form. Pergamon, New YorkRechnitzer, J. (2010): Húsz év múltán - A gazdaság és a társadalom térsze-
rkezetének változásai. In: Barta Gy., Beluszky P., Földi Zs., Kovács K. (szerk.): A területi kutatások csomópontjai. MTA RKK [Magyar Tudomá-nyos Aka démia, Regionális Kutatások Központja], Pécs, 317-336.
Rechnitzer, J. [et al.] (szerk.) (2007): Település és fejlesztés. KSZK ROP 3.1.1. Programigazgatóság, 30-39.
Riesman, D. (1958): The Lonely Crowd: A Study of the Changing American Character. Yale University Press, New Haven
Ringen, S. (1995): Well-being, measurement and preferences. Acta Sociolog-ica, 38., 3-15.
Ritzer, G. (szerk.) (2005): Encyclopedia of Social Theory. Sage Publications. Ritzer, G. (szerk.) (2007): The Blacwell Encyclopedia of Sociology. Volume I. – X.
Blackwell, OxfordRóbert, P. (2009): Stratifi cation and Social Mobility. In: Immerfall, S., Ther-
born, G. (szerk.): Handbook of European Societies. Social Transformation in the 21st Century. Springer, London. 493-530.
186
Sanderson, S. K. (2007): Confl ict sociology. In: Ritzer, G. (szerk.): The Blacwell Encyclopedia of Sociology. Blackwell, Oxford, 662-665.
Schöpfl in, Gy. (2004): Az identitás dilemmái. Attraktor, Máriabesenyő-Gödöllő. 41–44., 211–214., 255–261.
Sears, A. (2008): A Good Book, In Theory: A Guide to Theoretical Thinking. Higher Education University of Toronto Press, North York
Skogan, W. (1986): Fear of crime and neighborhood change. Crime and Justice, 8., 203-229.
Smelser, N. J., Baltes, P. B. (szerk.) (2001): International Encyclopedia of Social and Behavioral Sciences. Pergamon Press, Oxford
Spéder, Z., Paksi, B., Elekes, Zs. (1998): Anómia és elégedettség a 90-es évek elején. In: Kolosi T., Tóth I. Gy., Vukovich Gy. (szerk.): Társadalmi riport 1998. TÁRKI, Budapest, 490–513.
Stiglitz, J. E. (2010): The Stiglitz Report: Reforming the International Monetary and Financial Systems in the Wake of the Global Crisis. The New Press, New York
Stiglitz, J. E., Sen, A., Fitoussi, J. P. (2009): Report by the Commission on the measurement of economic performance and social progress. Commission on the measurement of economic performance and social progress, Paris http://www.stiglitz-sen-fi toussi.fr/documents/rapport_anglais.pdf
Stiglitz, J. E., Sen, A., Fitoussi, J. P. (2010): A Bizottság jelentése a gazdasági teljesítmény és a társadalmi fejlődés méréséről. Statisztikai Szemle, 88. évf., 3., 305–320. http://www.ksh.hu/statszemle_archive/2010/2010_03/2010_03_305.pdf
Susánszky, É., Szántó, Zs. (szerk.) (2013): Magyar lelkiállapot 2013. Semmel-weis Kiadó és Multimédia Stúdió, Budapest
Suttles, G. D. (1972): The Social Construction of Communities. University of Chicago Press, Chicago, Illinois
Szalai, P. (2014): Nők a nemzetgazdaságban. 22 éves csúcson a 15-64 éves nők foglalkoztatási rátája 2013-ban Magyarországon. Polgári Szemle, 10. évf., 1-2. http://www.polgariszemle.hu/?view=v_article&ID=586 Le-töltés: 2015. január 5.
Szalma, I. (2014): Hogyan alakult a kétkeresős családok munka és magánélet közötti konfl iktusa a válság hatására 2004 és 2010 között Európában? Szociológiai Szemle, 24. évf., 1., 102–129.
Szirmai, V. (2014): The Social Well-being Issues of the European Urbanisa-tion Stages and the Possibilities of their Management by the Creation of Spatial Confi gurations. Deturope [The Central European Journal of Regional Development and Tourism], 6 évf., 2., 64-76.
187
Szirmai, V. (szerk.) (2009): A várostérségi versenyképesség társadalmi tényezői: hogyan lehetnek a magyar nagyvárostérségek versenyképesebbek. Dialóg-Cam-pus, Budapest – Pécs
Szoboszlai, Zs. (2003): Kistérségek társadalma Magyarországon. In: Ágh A., Németh J. (szerk): Kistérségi Közigazgatás. Magyar Közigazgatási Intézet, Budapest, 319–339.
Tóth, P., Ditrói, Z. (2014): A helyi társadalom dimenziói. In: Csizmadia, Z., Tóth, P. (szerk.): Helyi társadalom és intézményrendszer Győrben. Univer-sitas-Győr Nonprofi t Kft, Győr, 75-99.
Tönnies, F. (2004): Közösség és társadalom. Gondolat Kiadó, Budapest, 9., 14–15., 20–22., 30–32., 195–198., 201., 233–236., 242–243.
Turner, J. (1982): The Structure of Sociological Theory. Dorsey Press, Home-wood Ill
Turner, J. H. (2005): Confl ict theory. In: Ritzer, G. (szerk.): Encyclopedia of Social Theory. Sage Publications. 134-139.
Tversky, A., Kahneman, D. (1974): Judgement under Uncertainty: Heuristics and Biases. Science, New Series, 185. évf., 4157., 1124-1131.
Uchida, Y., Takahashi, Y., Kawahara, K. (2014): Changes in Hedonic and Eudaimonic Well-Being After a Severe Nationwide Disaster: The Case of the Great East Japan Earthquake. Journal of Happiness Studies, 15., 207-221.
Utasi, Á. (2000): A helyi vezetők és a lakossági participáció formálódása. In: Táll É. (szerk.): Az új demokrácia önkormányzati vezetői. MTA PTI [Magyar Tudományos Akadémia, Társadalomtudományi Kutató köz-pont, Politikatudományi Intézet], Budapest, 154–178.
Váradi, M. M. (1999): A szuburbanizáció arcai a budapesti agglomerációban. Falu, Város, Régió. 3., 9-14.
Van Dijk, J.J.M., Manchin, R., Van Kesteren, J., Nevala, S., Hideg, G. (2005): The Burden of Crime in the EU. Research Report: A Comparative Analysis of the European Crime and Safety Survey (EU ICS) 2005
Vecernik, J., Mysikova, M. (2014): (Un)happy transition? Subjective Well-being in European Countries in 1991-2008 and Beyond. WIFO Working Papers, No. 467. Österreichisches Institut für Wirtschaftsforschung, Wien
Veenhoven, R. (1989): National wealth and individual happiness. In: Gru-nert, K.G., Olander, M. (szerk.): Understanding Economic Behavior, Klu-wer Academic Press, The Netherlands, 9-32.
Veenhoven, R. (1996): Developments in Satisfaction Research. Social Indi-cators Research, 37., 1-46.

Wallerstein, S. R., Goldberger, L. (szerk.) (1998): Ideas and Identities: The Life and Work of Erik Erikson. International Universities Press, New York
Wilson, J. Q., Kelling G. L. (1982): The police and neighborhood safety: broken windows. Atlan0tic Monthly, 127., 29-38.
World Database of Happiness [A világ boldogság adatbázisa], http://worlddatabaseofhappiness.eur.nl/ Letöltés: 2014. augusztus 30.
Zapf, W. (1984): Individuelle Wohlfahrt: Lebensbedingungen und wahr-genommene Lebensqualität. In: Glatzer, W., Zapf W. (szerk.): Lebensqual-ität in der Bundesrepublik Deutschland. Objektive Lebensbedingungen und subjetives Wohbefi nden. Campus, Frankfurt am Main, 13-26.