Embed Size (px)
Citation preview
2014
EDI
TIO
N BELGIUM AND ITS NEIGHBOURS’ BUSINESS CLIMATES COMPAREDベルギーと周辺国の投資環境の比較
A publication ofBelgium-Japan Association & Chamber of CommerceLouizalaan / Avenue Louise 287 box 71050 Brussels, BelgiumT +32(0)2 644 14 05E-mail [email protected] www.bja.beRoyal Association | Founded in 1963Belgium-Japan Association & Chamber of Commerce asbl-vzw | 日白協会兼商工会議所 | Registration n° 408.948.139Editor: Anja Oto-Kellens, Executive Director
© Copyright 2014, Belgium-Japan Association & Chamber of Commerce.Reproduction in whole or in part without permission of the publisher is prohibited.Opinions expressed by contributors are not necessarily those held by the BJA.
Belgium-Japan AssociationChamber of Commerce日白協会兼商工会議所
Belgium-Japan AssociationChamber of Commerce日白協会兼商工会議所
A t l a n t i cO c e a n
Norwegian Sea
Barents Sea
North Sea
M e d i t e r r a n e a n S e a
Mediterranean Sea
Baltic Sea
B l a c k S e a
Bayof
Biscay
UNITEDKINGDOM
UKRAINE
T U R K E Y
TUNISIA
L I B Y A E G Y P T
SYRIA
SWITZERLAND
SWEDEN
SPAIN
SLOVENIA
SLOVAKIA
SERBIA
R U S S I A
K A Z A K H S T A N
ROMANIAPORTUGAL
POLAND
NORWAY
THE NETHERLANDS
MOROCCO
MOLDOVA
MALTA
MACEDONIA
LUXEMBOURG
LITHUANIA
LEBANON
LATVIA
KUWAITJORDAN
S A U D I A R A B I A
ITALY
ISRAEL
IRELAND
I R A Q
I R A N
ICELAND
HUNGARY
GREECE
GERMANY
GEORGIA
F R A N C E
FINLAND
ESTONIA
DENMARK
CZECH REP.
CYPRUS
BULGARIA
BELGIUMBELARUS
AZERBAIJAN
AUSTRIA
ARMENIA
A L G E R I A
ALBANIA
MONTENEGRO
CROATIABOSNIA& HERZ.
10˚ 20˚ 30˚ 40˚ 50˚ 60˚ 70˚
60˚
50˚
40˚
30˚
40˚30˚20˚10˚0˚
30˚
40˚
50˚
0˚10˚20˚30˚60˚
900 km
600 km
300 km
2 3
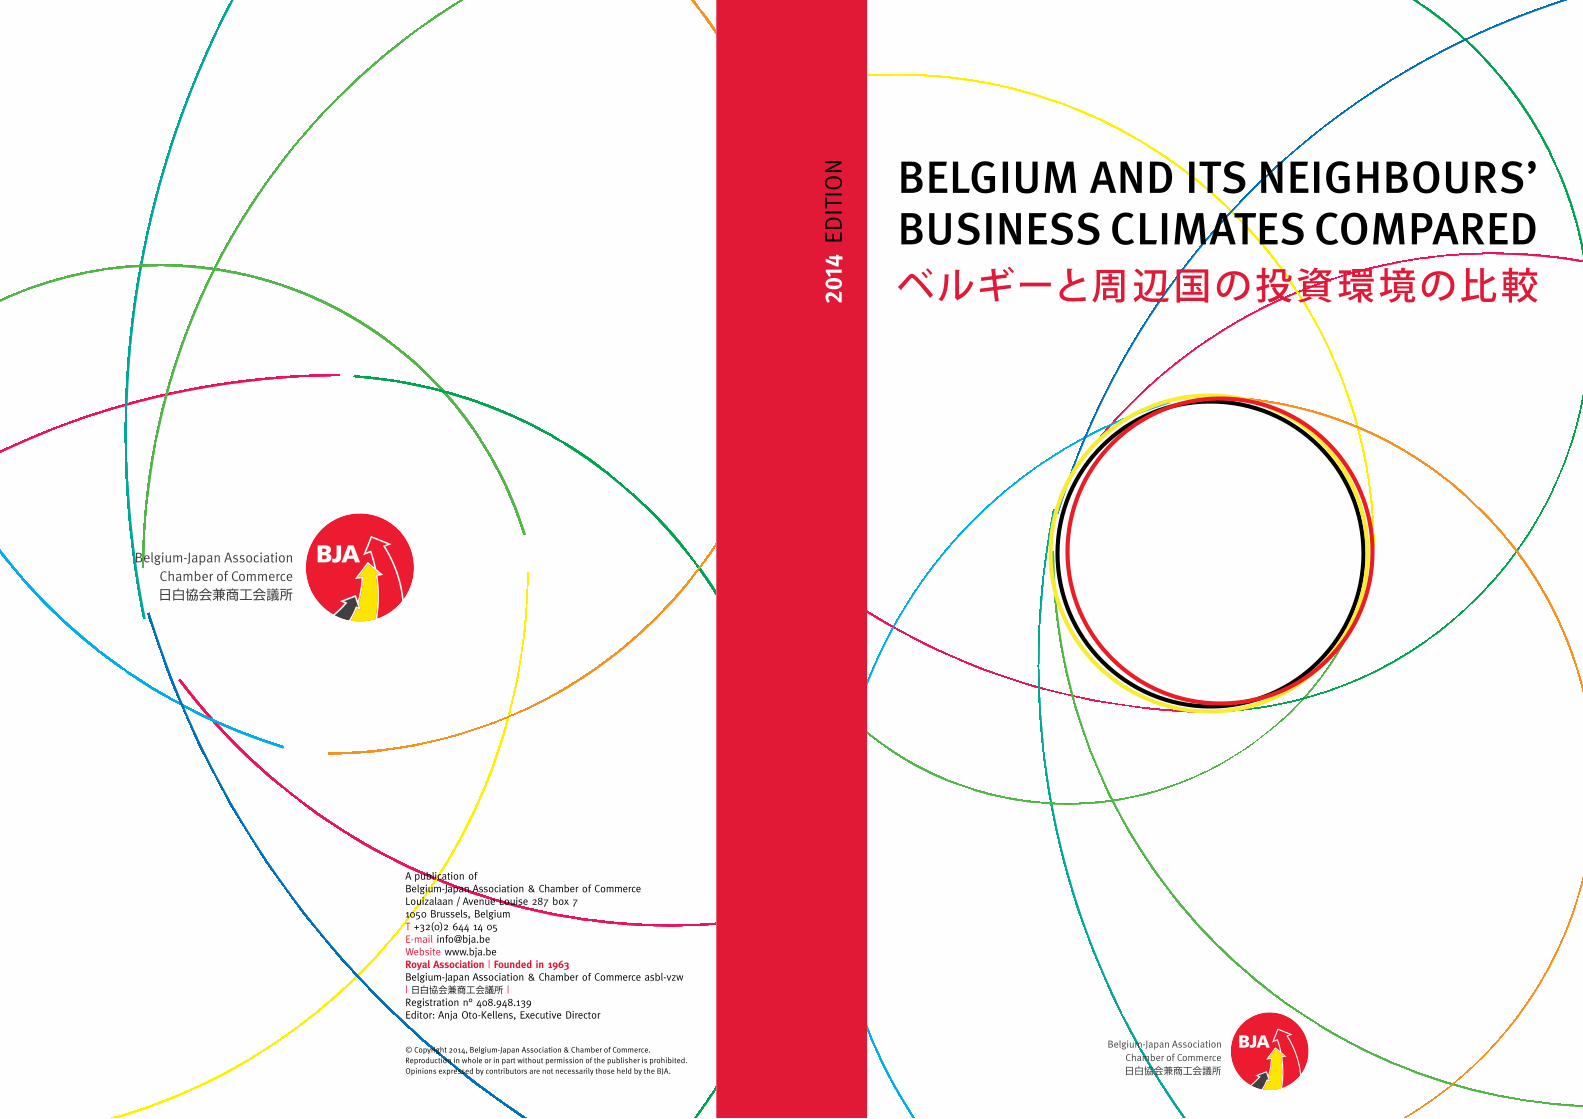
This brochure has been created by the Investment Committee of the Belgium-Japan Association & Chamber of Commerce (BJA) to provide you with a comparison of the business environment in Belgium and the surrounding countries. We have endeavoured to be as objective as possible and have only taken comparisons from select internationally-renowned studies. In this ‘study of studies’, you will find some interesting facts and figures that are worth having a closer look at.
This study of studies looks at four areas: global attractiveness; headquarters and holding companies; logistics; and research and development.
• As the pages on global attractiveness show, there is a rather big gap between the perception of Belgium and reality. In other words, the recognition of ‘Belgium’ as a brand is low, but in reality the Belgian economy is highly globalised and investors discover pleasant surprises afterwards.
• The pages on headquarters and holding companies show that Brussels is one of the leading cities in Europe for business. Not only because of its central location in Europe, but also because of its internationally open business culture and the ease of doing business, reasonable level of office rent and an investor-friendly tax regime, Belgium is a highly regarded location.
• When it comes to logistics, Belgium ranks number 1 in Europe because of the strong combination of excellent infrastructure, accessibility and superb cost efficiency for distribution.
• Concerning research and development, Belgium is in the top four countries for the quality of scientific research institutions. The quality of mathematics and science education is among the top 3 in the world. University-industry collaboration is very active, which shows potential to bring the results of research to the market.
As many of these surveys confirm, Belgium is a leading destination in Europe for inward investment. If you decide to set up headquarters, a distribution hub or a research and development centre, Belgium may be one of the best possible locations on your short list.
If you have any questions or want to know more about one of the studies featured in this publication, please do not hesitate to contact us.
Masatomo NomuraChairman BJA Investment CommitteeBelgium-Japan Association & Chamber of Commerce (BJA)
この 小 冊 子 は 、ベ ル ギ ーと周 辺 の 国 の ビジ ネス 環 境 を比 較 することを目 的として、日白 協 会 兼 商 工 会 議 所 (BJA) の投資委員会が作成いたしました。できるだけ客観的な比較を行うために、国際的評価の高い調査報告書を多数検討した上で厳選し、分析しています。その結果、大変興味深い調査結果をまとめることができたと、自負しております。
この「調 査 の 調 査」で は、総 合 力、本 部・持 株 会 社、物 流、研 究 開 発 の 4 分 野 につ いて、ビジネス環 境 の 国 際比較を行いました。
• 総合力の分野で示されているように、ベルギーのイメージと実際の評価は、異なる傾向があります。「ブランド」としてのベルギーの認知度は高くありませんが、ベルギー経済は高度にグローバル化しており、投資後の満足度は極めて高いと言えます。
• 欧州統括本部、欧州持株会社を設置するケースを考えてみましょう。ブリュッセルは、欧州のトップ・ビジネス都市のひとつに位置づけられています。欧州の中心に位置するという地理的な好条件だけではなく、国際的、ビジネスが行いやすい、オフィスの賃貸料が安い、有利な税制を持つなどの特色が、高い評価の理由となっています。
• 物流の分野で、ベルギーは欧州トップの評価を得ています。物流インフラが整備されていること、欧州各地へのアクセスが容易であること、費用対効果が優れていることがその理由です。
• 研究開発の分野では、科学研究機関および教育制度の質は非常に高い評価を受けています。特に数学と科学教育は、世界のトップ・レ ベルにあるとされています。また、産学協同研究開発に参加している企業が多いため、研究開発の成果の市場化の潜在力があります。
投資ロケーションの選定においては、企業固有の要素が重要な判断材料となることが多く、一般的な評価をそのまま利用することは難しいかもしれません。しかし、欧州における候補地のひとつとして、ベルギーは、少なくともショートリストに入れるべき国であると言えるでしょう。
この小冊子についてのご質問などがございましたら、日白協会兼商工会議所 (BJA) までお問い合わせくださるようお願い申し上げます。
日白協会兼商工会議所 (BJA) 投資委員会委員長
野 村 正 智
OVERVIEW はじめに
4 5
There is a big gap between the perception of Belgium and reality. It may be because of its small size or the modesty of the people.
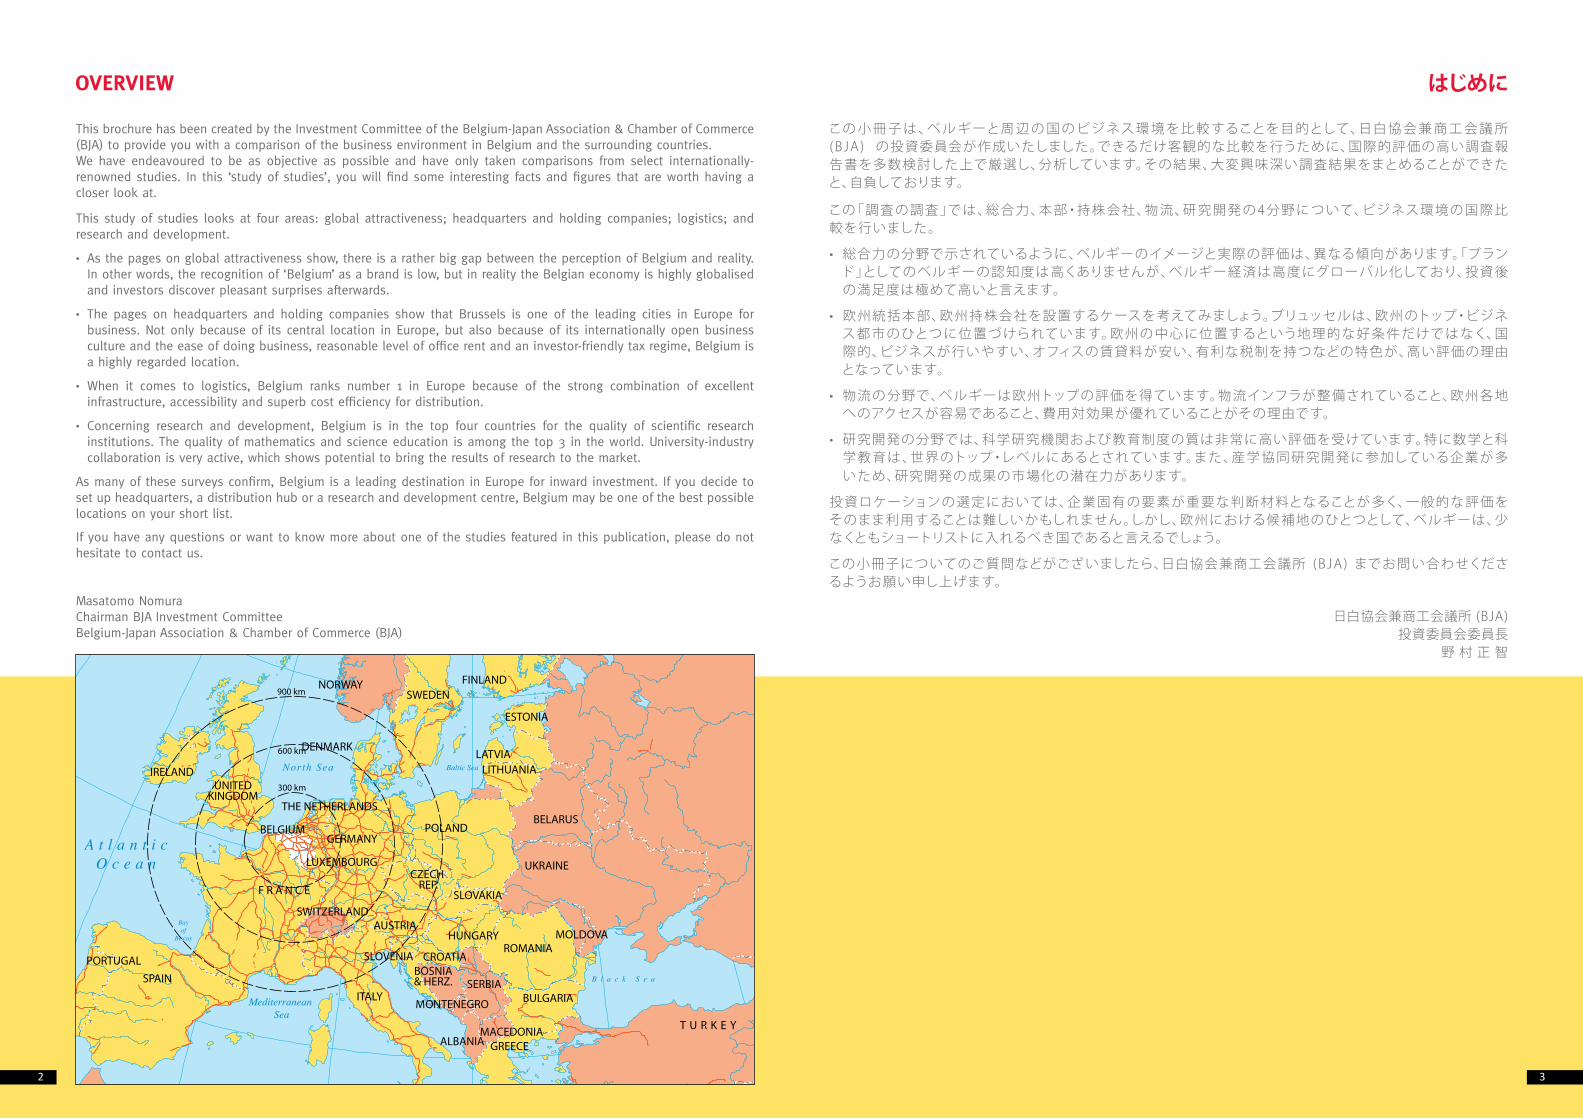
In the 2013 Country RepTrakTM Study (Reputation Institute), 27,000 people from the G8 countries were surveyed about the reputation and perception of 50 countries. Belgium came 13th. (table 1)
However, when researchers measure the real performance, Belgium is often ranked top.
According to IMD, the productivity of the Belgian workforce is at the top in the EU. (table 2)
• availability of a highly educated and productive workforce;• availability of a multilingual workforce (page 7, table 8);
• investor-friendly tax environment;• geographical location and access to other European countries; and• presence of the key institutions of the European Union.
• 労働者の教育水準が高いので、生産性が高い。• 多言語を使用できる人を、容易に雇用できる (7ページ 表8)。
• 投資家にとって有利な税制を持つ。• 地理的に欧州の中心にあり、他の国々へのアクセス が容易である。• EU(欧州連合)の本部が置かれている。
KOFスイス経済研究所の「グローバル化指標」調査では、ベルギーが第1位となっています(表3)。アーンストアンドヤングによると、外国企業による欧州での投資先国として、ベルギーは、大国に伍して第5位に入っています
(表4)。
ベルギーの評価が高い理由として、次の点が挙げられます。
一般的なベルギーに対するイメージと、ベルギーの経済的な実力の間には大きなギャップがあるようです。これはベルギーが国土の小さな国だからかも知れませんし、対外的なアピールが不足していることに原因があるのかも知れません。
2013年にレピュテーション・インスティテュートによって行われた調査では、G8諸国の国民合計27,000人に、50カ国の「イメージ」を尋ねたところ、ベルギーは第13位でした(表1)。
しかし、「実際の評価」を行う調査では、ベルギーはしばしばトップに位置づけられます。
例えば、国際経営開発研究所(IMD)は、ベルギーの労働者の生産性を、EUで最も高いとしています(表2)。
In the KOF Index of Globalization (KOF Swiss Economic Institute), Belgium is number 1 (table 3), and, for new investments in Europe, Belgium competes well among far larger countries (Ernst & Young table 4).
Belgium’s high scores are based on the following:
GLOBAL ATTRACTIVENESS 総合力Comparison 1 比較 1
Table 1 Country RepTrakTM Study表 1 国の評判調査
Score
1 Canada カナダ 76.6
2 Sweden スウェーデン 76.5
3 Switzerland スイス 76.3
4 Australia オーストラリア 76.1
5 Norway ノルウェー 74.1
6 Denmark デンマーク 73.3
7 New Zealand ニュージーランド 72.5
8 Finland フィンランド 71.8
9 Netherlands オランダ 70.6
10 Austria オーストリア 70.6
13 Belgium ベルギー 67.1
Perception イメージSource: 2013 Country RepTrakTM, Reputation Institute, June 2013
Table 2 Overall productivity (GDP per person employed, US$)
表 2 総合的な生産性(従業員1人当たりGDP、単位USドル)
Reality 実際の評価Source: 2013 KOF Index of Globalization, Dreher, Axel (2006): Does Globalization Affect Growth? Evidence from a new Index of Globalization, Applied Economics 38, 10: 1091-1110
Table 3 Globalization Index
表 3 グローバル化指数Score
1 Belgium ベルギー 92.30
2 Ireland アイルランド 91.79
3 The Netherlands オランダ 91.33
4 Austria オーストリア 89.48
5 Singapore シンガポール 88.89
6 Denmark デンマーク 88.12
7 Sweden スウェーデン 87.37
8 Portugal ポルトガル 87.07
9 Hungary ハンガリー 86.85
10 Switzerland スイス 86.28
Reality 実際の評価Source: IMD World Competitiveness Yearbook 2013
Table 4 Top European destinations of FDI in 2013
表 4 2013年外国直接投資の受入国別件数
Number of projects /件数
1 UK イギリス 697
2 Germany ドイツ 624
3 France フランス 471
4 Spain スペイン 274
5 Belgium ベルギー 169
6 Netherlands オランダ 161
7 Poland ポーランド 148
8 Russia ロシア 128
9 Ireland アイルランド 123
10 Turkey トルコ 95
Reality 実際の評価Source: Ernst & Young’s European Investment Monitor 2013
Belgium ベルギー 106,392
France フランス 101,040
Netherlands オランダ 91,940
UK イギリス 82,764
Germany ドイツ 81,634
6 7
HEADQUARTERS AND HOLDING COMPANIES 本部・持株会社
Brussels is recognised as a leading city for business in Europe. The reasons are as follows:
Taxation systems can have a significant impact on the profits of a business. In particular, due to the Japanese tax regime on foreign dividends received, there is a direct relationship between the effective tax rate on profits made outside Japan and the after-tax profits of the parent company in Japan.
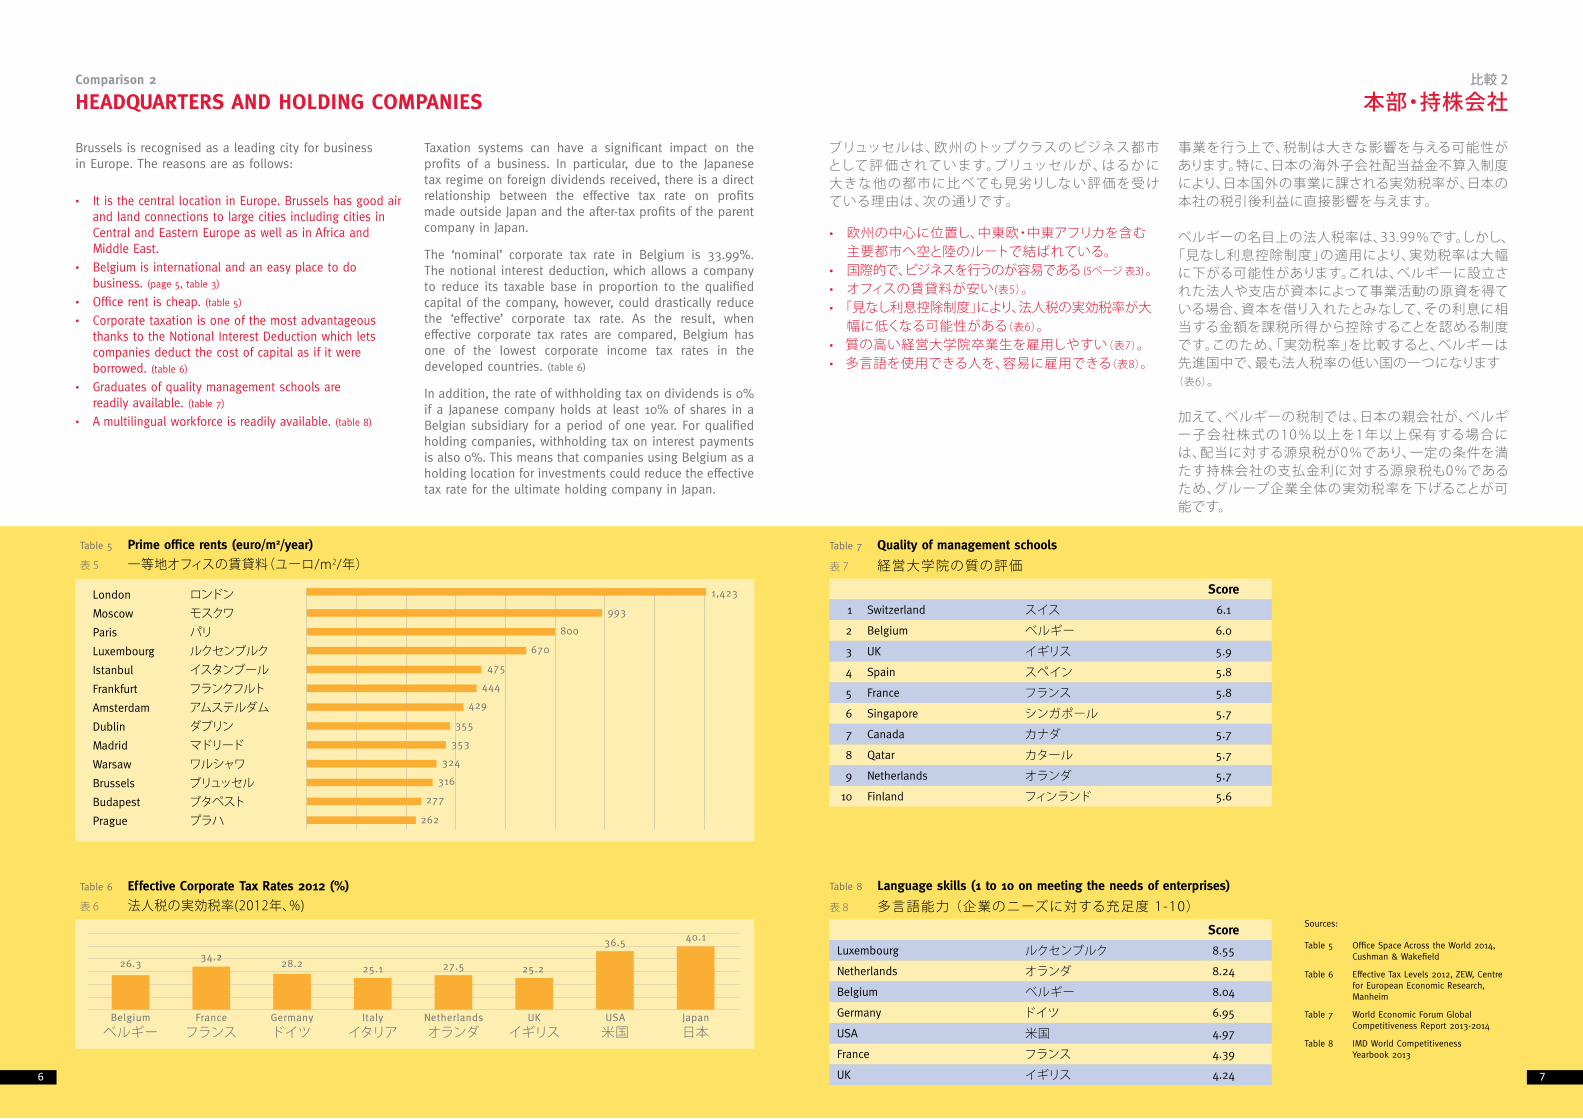
The ‘nominal’ corporate tax rate in Belgium is 33.99%. The notional interest deduction, which allows a company to reduce its taxable base in proportion to the qualified capital of the company, however, could drastically reduce the ‘effective’ corporate tax rate. As the result, when effective corporate tax rates are compared, Belgium has one of the lowest corporate income tax rates in the developed countries. (table 6)
In addition, the rate of withholding tax on dividends is 0% if a Japanese company holds at least 10% of shares in a Belgian subsidiary for a period of one year. For qualified holding companies, withholding tax on interest payments is also 0%. This means that companies using Belgium as a holding location for investments could reduce the effective tax rate for the ultimate holding company in Japan.
ブリュッセル は、欧 州 のトップクラスのビジネス都 市として評 価されています。ブリュッセ ル が 、はるか に大きな他の都市に比べても見劣りしない評価を受けている理由は、次の通りです。
事業を行う上で、税制は大きな影響を与える可能性があります。特に、日本の海外子会社配当益金不算入制度により、日本国外の事業に課される実効税率が、日本の本社の税引後利益に直接影響を与えます。
ベルギーの名目上の法人税率は、33.99%です。しかし、「見なし利息控除制度」の適用により、実効税率は大幅に下がる可能性があります。これは、ベルギーに設立された法人や支店が資本によって事業活動の原資を得ている場合、資本を借り入れたとみなして、その利息に相当する金額を課税所得から控除することを認める制度です。このため、「実効税率」を比較すると、ベルギーは先進国中で、最も法人税率の低い国の一つになります
(表6)。
加えて、ベルギーの税制では、日本の親会社が、ベルギー子会社株式の10%以上を1年以上保有する場合には、配当に対する源泉税が0%であり、一定の条件を満たす持株会社の支払金利に対する源泉税も0%であるため、グループ企業全体の実効税率を下げることが可能です。
• It is the central location in Europe. Brussels has good air and land connections to large cities including cities in Central and Eastern Europe as well as in Africa and Middle East.• Belgium is international and an easy place to do business. (page 5, table 3)
• Office rent is cheap. (table 5) table 7)
• Corporate taxation is one of the most advantageous thanks to the Notional Interest Deduction which lets companies deduct the cost of capital as if it were borrowed. (table 6)
• Graduates of quality management schools are readily available. (table 7)
• A multilingual workforce is readily available. (table 8)
• 欧州の中心に位置し、中東欧・中東アフリカを含む 主要都市へ空と陸のルートで結ばれている。• 国際的で、ビジネスを行うのが容易である (5ページ 表3) 。• オフィスの賃貸料が安い(表5)。• 「見なし利息控除制度」により、法人税の実効税率が大 幅に低くなる可能性がある(表6)。• 質の高い経営大学院卒業生を雇用しやすい(表7)。• 多言語を使用できる人を、容易に雇用できる(表8)。
Table 5 Prime office rents (euro/m2/year)
表 5 一等地オフィスの賃貸料(ユーロ/m2/年)
Table 6 Effective Corporate Tax Rates 2012 (%)
表 6 法人税の実効税率(2012年、%)
Comparison 2 比較 2
London
Moscow
Paris
Luxembourg
Istanbul
Frankfurt
Amsterdam
Dublin
Madrid
Warsaw
Brussels
Budapest
Prague
ロンドンモスクワパリルクセンブルクイスタンブールフランクフルトアムステルダムダブリンマドリードワルシャワブリュッセルブタペストプラハ
1,423
993
800
670
475
444
429
355
353
324
316
277
262
670
Belgium
ベルギーNetherlands
オランダGermany
ドイツUSA
米国France
フランスUK
イギリスItaly
イタリア
25.1
Japan
日本
26.3 27.528.2
36.534.2
25.2
40.1
Table 7 Quality of management schools
表 7 経営大学院の質の評価
Score
1 Switzerland スイス 6.1
2 Belgium ベルギー 6.0
3 UK イギリス 5.9
4 Spain スペイン 5.8
5 France フランス 5.8
6 Singapore シンガポール 5.7
7 Canada カナダ 5.7
8 Qatar カタール 5.7
9 Netherlands オランダ 5.7
10 Finland フィンランド 5.6
Table 8 Language skills (1 to 10 on meeting the needs of enterprises)
表 8 多言語能力 (企業のニーズに対する充足度 1-10)
Score
Luxembourg ルクセンブルク 8.55
Netherlands オランダ 8.24
Belgium ベルギー 8.04
Germany ドイツ 6.95
USA 米国 4.97
France フランス 4.39
UK イギリス 4.24
Sources:
Table 5 Office Space Across the World 2014, Cushman & Wakefield
Table 6 Effective Tax Levels 2012, ZEW, Centre for European Economic Research, Manheim
Table 7 World Economic Forum Global Competitiveness Report 2013-2014
Table 8 IMD World Competitiveness Yearbook 2013
8 9
LOGISTICS 物流
The advantages of Belgium as the location for European logistics and distribution centres have been shown in numerous renowned international studies in the past.
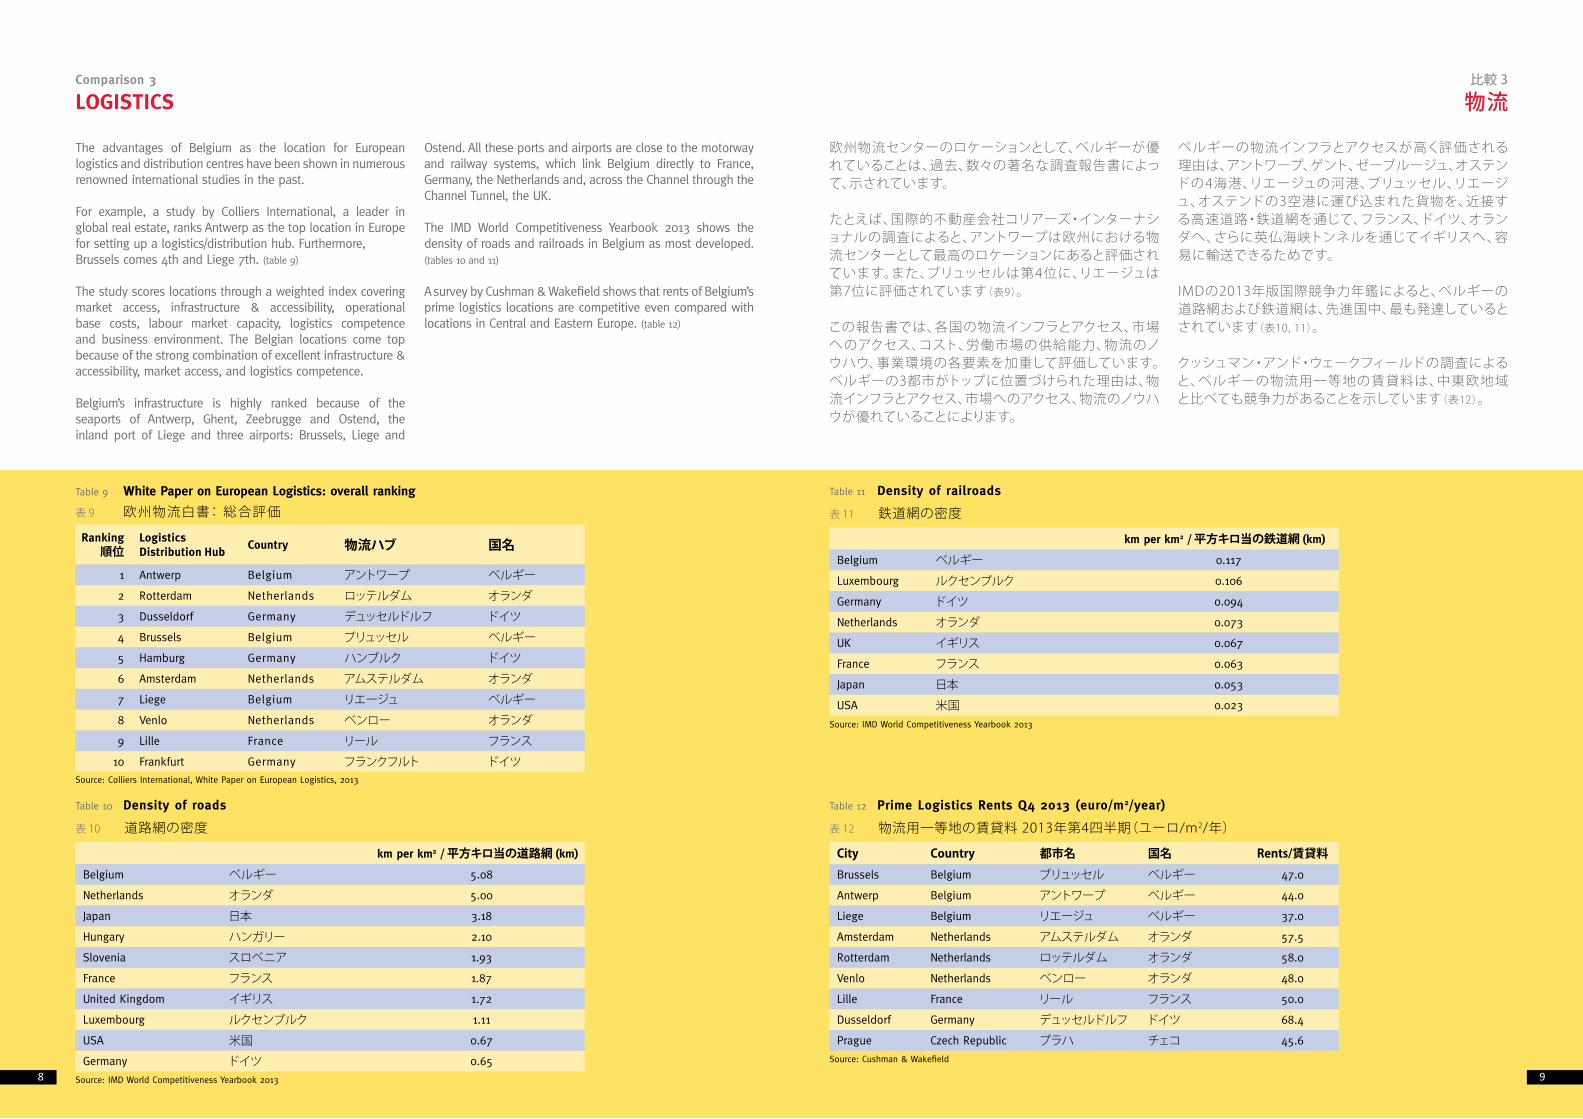
For example, a study by Colliers International, a leader in global real estate, ranks Antwerp as the top location in Europe for setting up a logistics/distribution hub. Furthermore, Brussels comes 4th and Liege 7th. (table 9)
The study scores locations through a weighted index covering market access, infrastructure & accessibility, operational base costs, labour market capacity, logistics competence and business environment. The Belgian locations come top because of the strong combination of excellent infrastructure & accessibility, market access, and logistics competence.
Belgium’s infrastructure is highly ranked because of the seaports of Antwerp, Ghent, Zeebrugge and Ostend, the inland port of Liege and three airports: Brussels, Liege and
Ostend. All these ports and airports are close to the motorway and railway systems, which link Belgium directly to France, Germany, the Netherlands and, across the Channel through the Channel Tunnel, the UK.
The IMD World Competitiveness Yearbook 2013 shows the density of roads and railroads in Belgium as most developed. (tables 10 and 11)
A survey by Cushman & Wakefield shows that rents of Belgium’s prime logistics locations are competitive even compared with locations in Central and Eastern Europe. (table 12)
欧州物流センターのロケーションとして、ベルギーが優れていることは、過去、数々の著名な調査報告書によって、示されています。
たとえば、国際的不動産会社コリアーズ・インターナショナルの調査によると、アントワープは欧州における物流センターとして最高のロケーションにあると評価されています。また、ブリュッセルは第4位に、リエージュは第7位に評価されています(表9)。
この報告書では、各国の物流インフラとアクセス、市場へのアクセス、コスト、労働市場の供給能力、物流のノウハウ、事業環境の各要素を加重して評価しています。ベルギーの3都市がトップに位置づけられた理由は、物流インフラとアクセス、市場へのアクセス、物流のノウハウが優れていることによります。
ベルギーの物流インフラとアクセスが高く評価される理由は、アントワープ、ゲント、ゼーブルージュ、オステンドの4海港、リエージュの河港、ブリュッセル、リエージュ、オステンドの3空港に運び込まれた貨物を、近接する高速道路・鉄道網を通じて、フランス、ドイツ、オランダへ、さらに英仏海峡トンネルを通じてイギリスへ、容易に輸送できるためです。
IMDの2013年版国際競争力年鑑によると、ベルギーの道路網および鉄道網は、先進国中、最も発達しているとされています(表10, 11)。
クッシュマン・アンド・ウェークフィールドの調査によると、ベルギーの物流用一等地の賃貸料は、中東欧地域と比べても競争力があることを示しています(表12)。
Comparison 3 比較 3
Table 9 White Paper on European Logistics: overall ranking
表 9 欧州物流白書: 総合評価
Ranking順位
Logistics Distribution Hub Country 物流ハブ 国名
1 Antwerp Belgium アントワープ ベルギー
2 Rotterdam Netherlands ロッテルダム オランダ3 Dusseldorf Germany デュッセルドルフ ドイツ4 Brussels Belgium ブリュッセル ベルギー5 Hamburg Germany ハンブルク ドイツ6 Amsterdam Netherlands アムステルダム オランダ7 Liege Belgium リエージュ ベルギー8 Venlo Netherlands ベンロー オランダ9 Lille France リール フランス
10 Frankfurt Germany フランクフルト ドイツ
Table 12 Prime Logistics Rents Q4 2013 (euro/m2/year)
表 12 物流用一等地の賃貸料 2013年第4四半期(ユーロ/m2/年)
City Country 都市名 国名 Rents/賃貸料Brussels Belgium ブリュッセル ベルギー 47.0
Antwerp Belgium アントワープ ベルギー 44.0
Liege Belgium リエージュ ベルギー 37.0
Amsterdam Netherlands アムステルダム オランダ 57.5
Rotterdam Netherlands ロッテルダム オランダ 58.0
Venlo Netherlands ベンロー オランダ 48.0
Lille France リール フランス 50.0
Dusseldorf Germany デュッセルドルフ ドイツ 68.4
Prague Czech Republic プラハ チェコ 45.6
Table 10 Density of roads
表 10 道路網の密度
km per km2 / 平方キロ当の道路網 (km)
Belgium ベルギー 5.08
Netherlands オランダ 5.00
Japan 日本 3.18
Hungary ハンガリー 2.10
Slovenia スロベニア 1.93
France フランス 1.87
United Kingdom イギリス 1.72
Luxembourg ルクセンブルク 1.11
USA 米国 0.67
Germany ドイツ 0.65
Source: Colliers International, White Paper on European Logistics, 2013
Source: IMD World Competitiveness Yearbook 2013
Table 11 Density of railroads
表 11 鉄道網の密度
km per km2 / 平方キロ当の鉄道網 (km)
Belgium ベルギー 0.117
Luxembourg ルクセンブルク 0.106
Germany ドイツ 0.094
Netherlands オランダ 0.073
UK イギリス 0.067
France フランス 0.063
Japan 日本 0.053
USA 米国 0.023
Source: IMD World Competitiveness Yearbook 2013
Source: Cushman & Wakefield
10 11
RESEARCH & DEVELOPMENT 研究開発
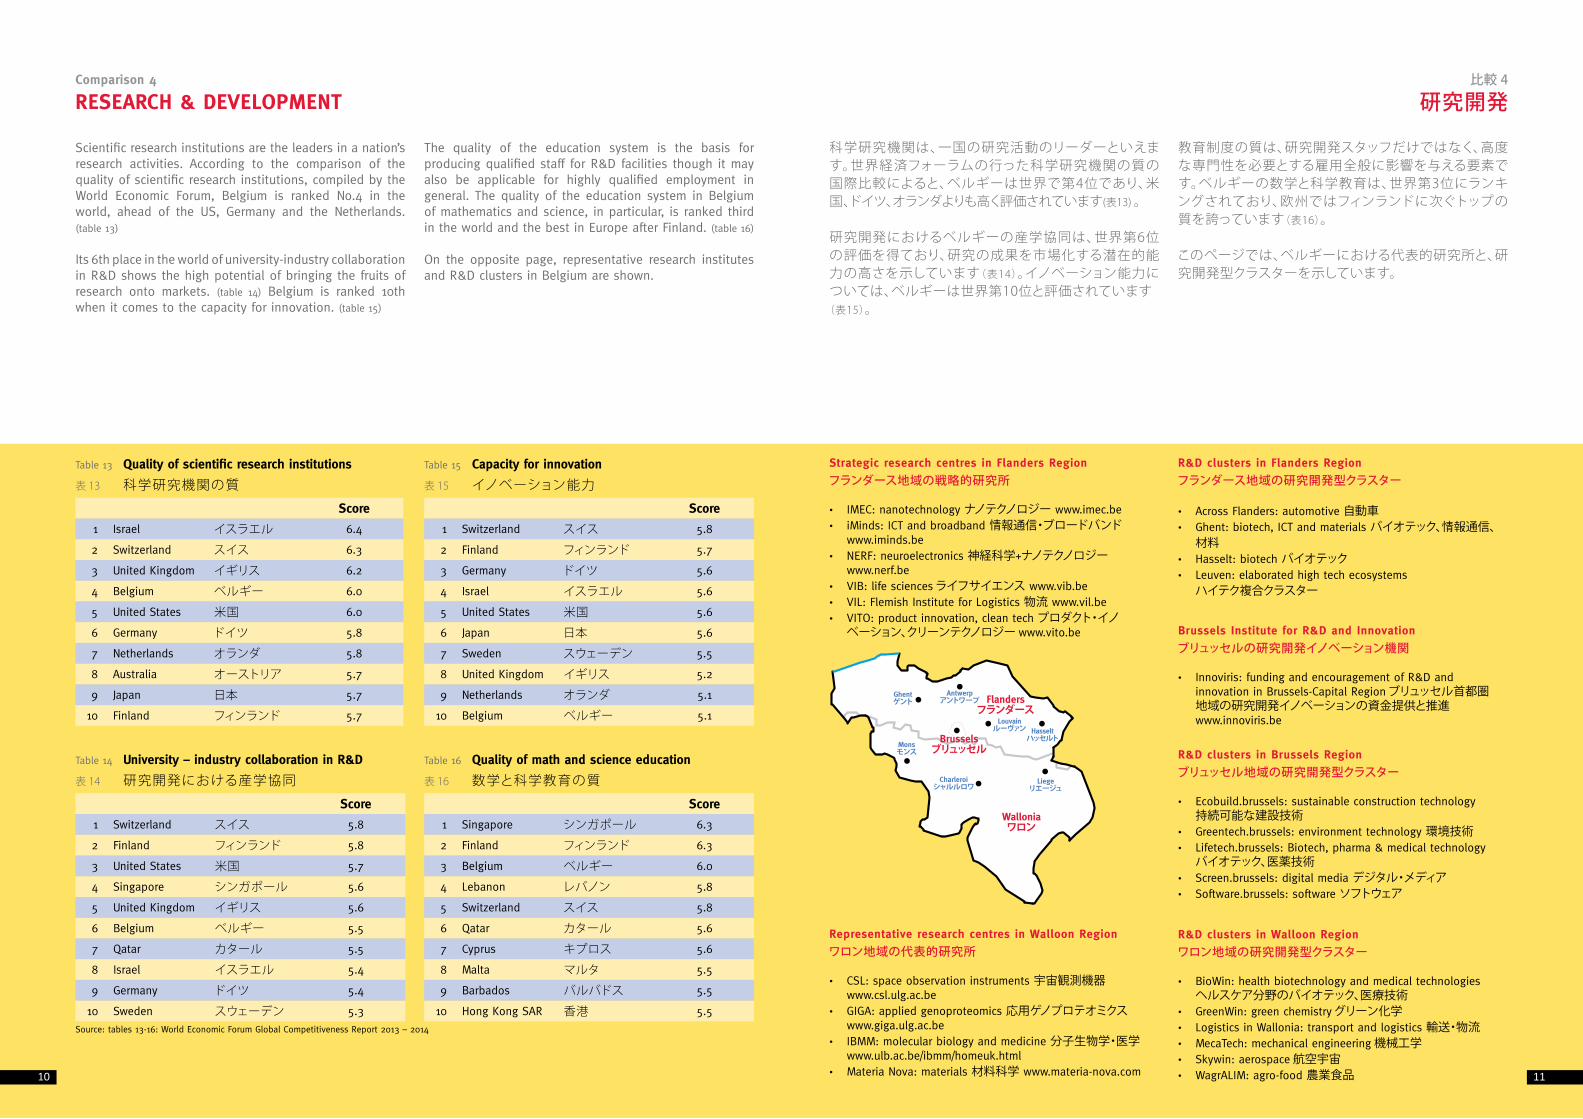
Scientific research institutions are the leaders in a nation’s research activities. According to the comparison of the quality of scientific research institutions, compiled by the World Economic Forum, Belgium is ranked No.4 in the world, ahead of the US, Germany and the Netherlands. (table 13)
Its 6th place in the world of university-industry collaboration in R&D shows the high potential of bringing the fruits of research onto markets. (table 14) Belgium is ranked 10th when it comes to the capacity for innovation. (table 15)
The quality of the education system is the basis for producing qualified staff for R&D facilities though it may also be applicable for highly qualified employment in general. The quality of the education system in Belgium of mathematics and science, in particular, is ranked third in the world and the best in Europe after Finland. (table 16)
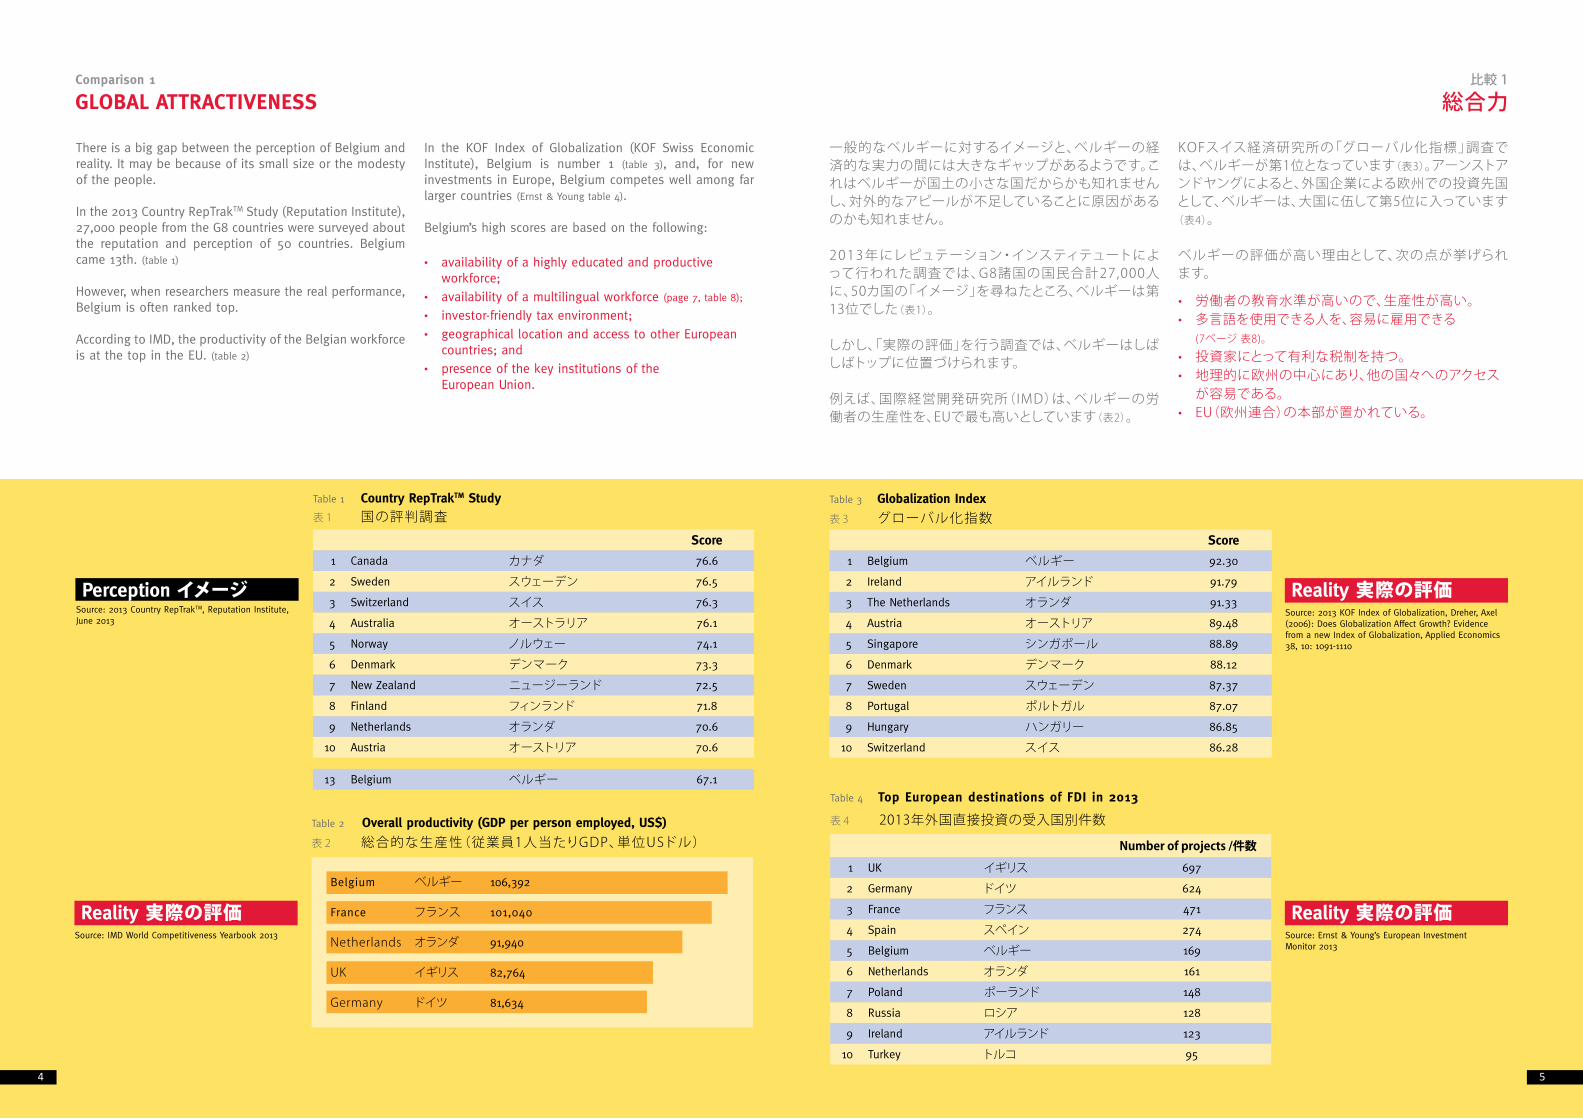
On the opposite page, representative research institutes and R&D clusters in Belgium are shown.
科学研究機関は、一国の研究活動のリーダーといえます。世界経済フォーラムの行った科学研究機関の質の国際比較によると、ベルギーは世界で第4位であり、米国、ドイツ、オランダよりも高く評価されています(表13) 。
研究開発におけるベルギーの産学協同は、世界第6位の評価を得ており、研究の成果を市場化する潜在的能力の高さを示しています(表14)。イノベーション能力については、ベルギーは世界第10位と評価されています
(表15)。
教育制度の質は、研究開発スタッフだけではなく、高度な専門性を必要とする雇用全般に影響を与える要素です。ベルギーの数学と科学教育は、世界第3位にランキングされており、欧州ではフィンランドに次ぐトップの質を誇っています(表16)。
このページでは、ベルギーにおける代表的研究所と、研究開発型クラスターを示しています。
Comparison 4 比較 4
Table 13 Quality of scientific research institutions
表 13 科学研究機関の質
Score
1 Israel イスラエル 6.4
2 Switzerland スイス 6.3
3 United Kingdom イギリス 6.2
4 Belgium ベルギー 6.0
5 United States 米国 6.0
6 Germany ドイツ 5.8
7 Netherlands オランダ 5.8
8 Australia オーストリア 5.7
9 Japan 日本 5.7
10 Finland フィンランド 5.7
Table 14 University – industry collaboration in R&D
表 14 研究開発における産学協同
Score
1 Switzerland スイス 5.8
2 Finland フィンランド 5.8
3 United States 米国 5.7
4 Singapore シンガポール 5.6
5 United Kingdom イギリス 5.6
6 Belgium ベルギー 5.5
7 Qatar カタール 5.5
8 Israel イスラエル 5.4
9 Germany ドイツ 5.4
10 Sweden スウェーデン 5.3
Table 15 Capacity for innovation
表 15 イノベーション能力
Score
1 Switzerland スイス 5.8
2 Finland フィンランド 5.7
3 Germany ドイツ 5.6
4 Israel イスラエル 5.6
5 United States 米国 5.6
6 Japan 日本 5.6
7 Sweden スウェーデン 5.5
8 United Kingdom イギリス 5.2
9 Netherlands オランダ 5.1
10 Belgium ベルギー 5.1
Table 16 Quality of math and science education
表 16 数学と科学教育の質
Score
1 Singapore シンガポール 6.3
2 Finland フィンランド 6.3
3 Belgium ベルギー 6.0
4 Lebanon レバノン 5.8
5 Switzerland スイス 5.8
6 Qatar カタール 5.6
7 Cyprus キプロス 5.6
8 Malta マルタ 5.5
9 Barbados バルバドス 5.5
10 Hong Kong SAR 香港 5.5
Brusselsブリュッセル
Walloniaワロン
Flandersフランダース
Antwerpアントワープ
Louvainルーヴァン Hasselt
ハッセルト
Ghentゲント
Liegeリエージュ
Charleroiシャルルロワ
Monsモンス
Strategic research centres in Flanders Region
フランダース地域の戦略的研究所
• IMEC: nanotechnology ナノテクノロジー www.imec.be• iMinds: ICT and broadband 情報通信・ブロードバンド www.iminds.be• NERF: neuroelectronics 神経科学+ナノテクノロジー www.nerf.be• VIB: life sciences ライフサイエンス www.vib.be• VIL: Flemish Institute for Logistics 物流 www.vil.be • VITO: product innovation, clean tech プロダクト・イノ ベーション、クリーンテクノロジー www.vito.be
R&D clusters in Flanders Region
フランダース地域の研究開発型クラスター
• Across Flanders: automotive 自動車• Ghent: biotech, ICT and materials バイオテック、情報通信、 材料• Hasselt: biotech バイオテック• Leuven: elaborated high tech ecosystems ハイテク複合クラスター
Brussels Institute for R&D and Innovation
ブリュッセルの研究開発イノベーション機関
• Innoviris: funding and encouragement of R&D and innovation in Brussels-Capital Region ブリュッセル首都圏 地域の研究開発イノベーションの資金提供と推進 www.innoviris.be
R&D clusters in Brussels Region
ブリュッセル地域の研究開発型クラスター
• Ecobuild.brussels: sustainable construction technology 持続可能な建設技術• Greentech.brussels: environment technology 環境技術• Lifetech.brussels: Biotech, pharma & medical technology バイオテック、医薬技術 • Screen.brussels: digital media デジタル・メディア• Software.brussels: software ソフトウェア
R&D clusters in Walloon Region
ワロン地域の研究開発型クラスター
• BioWin: health biotechnology and medical technologies ヘルスケア分野のバイオテック、医療技術• GreenWin: green chemistry グリーン化学• Logistics in Wallonia: transport and logistics 輸送・物流• MecaTech: mechanical engineering 機械工学• Skywin: aerospace 航空宇宙 • WagrALIM: agro-food 農業食品
Representative research centres in Walloon Region ワロン地域の代表的研究所
• CSL: space observation instruments 宇宙観測機器 www.csl.ulg.ac.be• GIGA: applied genoproteomics 応用ゲノプロテオミクス www.giga.ulg.ac.be• IBMM: molecular biology and medicine 分子生物学・医学 www.ulb.ac.be/ibmm/homeuk.html • Materia Nova: materials 材料科学 www.materia-nova.com
Source: tables 13-16: World Economic Forum Global Competitiveness Report 2013 – 2014