Embed Size (px)
Citation preview

荷電粒子飛跡検出器ドリフトチェンバーの構造と性能テスト
Shibata-lab.
Shou Miyasaka
2011/10/22 1
1. MWPC(Multi Wire Proportional Chamber) およびDC(Drift Chamber) とは何か
2. E906 実験の物理と spectrometer 3. Station 3 Drift Chamber の性能テスト 4. まとめ
- Contents -

1. MWPC(Multi Wire Proportional Chamber) およびDC(Drift Chamber) とは何か
• 私は2011年10月に博士課程に進学したので、主として修士課程での研究内容を発表する。
• 素粒子物理学や原子核物理学の実験では、ビーム同士や、ビームとターゲットの衝突により生成された粒子の軌跡を検出する検出器が良く使わる。
• MWPC (Multi Wire Proportional Chamber) は、その軌跡検出器の一つである。 • MWPC は1968年に Charpak によって発明された。
• Charpak はこの功績により1992年にノーベル物理学賞を受賞した。
MWPC
2011/10/23 2
<電子雪崩>
ワイヤーの付近では電場が強いため、電子が急激に加速される。その電子は他のガス原子を電離させて、それを繰り返し、電子の数が急激に増える。
2 mm
初期電子

- MWPC の特徴-
2011/10/23 3
• 荷電粒子により生成された電子は、通過した場所から最も近いワイヤーに集められる。
• 信号を読みだしたワイヤーの位置から、荷電粒子がどこを通ったかが分かる。
• MWPCを多層に重ねることにより、3次元の軌跡を求めることが出来る。
• ワイヤー間隔が狭いため、大型のものを製作するのは大変。
• 印加電圧によって、陽極ワイヤーに集められる電子の数が変わる。
• MWPC は比例計数管領域で使う。
• 陽極ワイヤーに集められる電子の数は初期電子数に比例する。
• 増幅率: M = 103~ 106 , M = KeCV
荷電粒子

- DC (Drift Chamber) の構造と原理 -
・ワイヤーの電圧のかけ方と適切なガス の選択でドリフト領域の電子のドリフト 速度を一定にする。
・ドリフト速度w が一定なので、 t₀ とt₁ を 測定することにより、荷電粒子の入射 位置x を決定できる。
)( 01
1
0
ttwwdtxt
t
t₀: 荷電粒子の入射時刻
t₁: 検出時刻 ・検出の基本原理はMWPCと同じ。
DC のセルの概念図
・セルは、 - 中心:陽極センスワイヤー - 右端と左端: フィールドワイヤー - 上下: 陰極ワイヤー で構成されている。
・DC は、数百個のセルで構成される。
4
陽極センスワイヤー(GND)
カソードワイヤー(~-2kV)
フィールドワイヤー(~ -2kV )
荷電粒子
初期電子
・DC は、大面積を(MWPC に比べて)少ない ワイヤー数で精度良く(~数百μm)検出する目的で開発された。
2cm

• Targets
– 水素、重水素、原子核 targets
• First dipole magnet
• Second dipole magnet
• 4 tracking stations
– Hodoscopes
– Drift chamber or drift tubes
• 私たちは3番目の Station 用に Drift Chamber を製作した
5 25 m
𝝁−
2. E906 実験の物理と spectrometer
2011/10/22
• 陽子構造を探る • Drell-Yan 過程(𝑞𝑞 → 𝛾∗ → 𝜇+𝜇−)を利用する
• ミューオンを観測する
E906 physics motivation
E906 spectrometer

• 新しい Drift chamber の性能
– 検出面積 : 1.6 m (vertical) x 2.2 m (horizontal)
– 6 Active layers : U, U’ (+14o), X, X’
(+0o) , V, V’ (-14
o)
– 位置 resolution : < 400 μm per plane
– Rate 耐性 : ~300 kHz per wire at maximum.
• Gas 選択
– Argon : CO2 (80:20)
2011/10/22 6
Station 3 drift chamber
U U’
V X
V’ X’
- Station 3 Drift Chamber -
1.7 m

- Station 3 drift chamber and the test drift chamber -
2011/10/22 7
Station 3 drift chamber @Fermilab The test drift chamber @Tokyo Tech
1.7 m 1.7 m
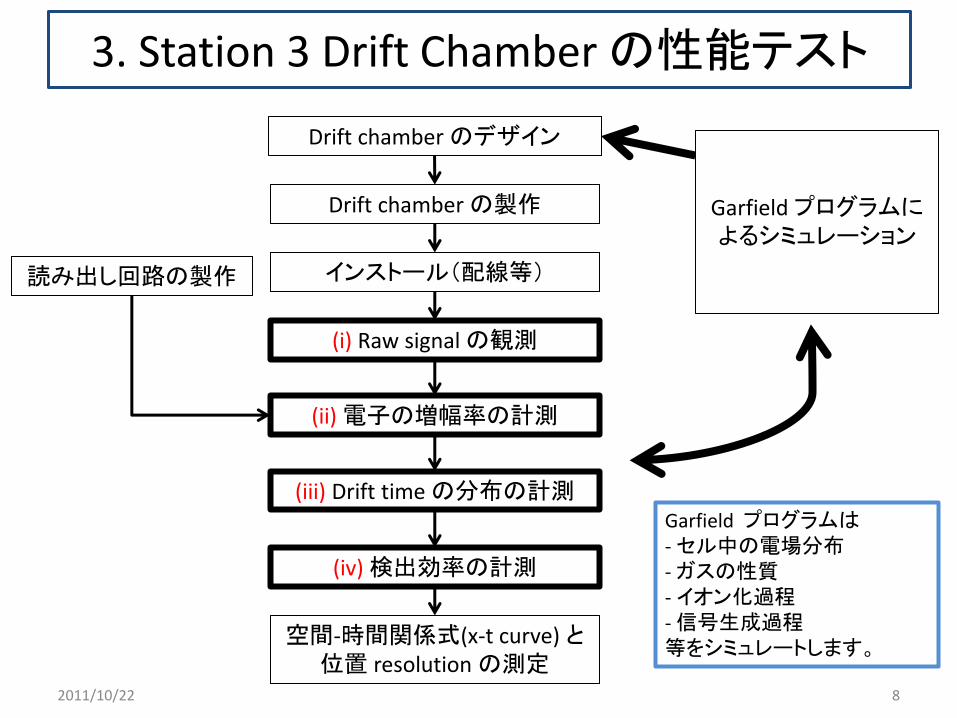
Drift chamber の製作
インストール(配線等)
(i) Raw signal の観測
(ii) 電子の増幅率の計測
(iii) Drift time の分布の計測
(iv) 検出効率の計測
空間-時間関係式(x-t curve) と位置 resolution の測定
読み出し回路の製作
Garfield プログラムによるシミュレーション
2011/10/22 8
Garfield プログラムは - セル中の電場分布 - ガスの性質 - イオン化過程 - 信号生成過程 等をシミュレートします。
Drift chamber のデザイン
3. Station 3 Drift Chamber の性能テスト

- (i) Raw signal の観測 -
• Raw signal とは、陽極ワイヤーから直接得られる信号。
• 宇宙線ミューオンを測定
– E906実験で測定するミューオンと
落とすエネルギーの量がほぼ同じ。
2011/10/22 9
1 cm
8 cm
15 cm
40 cm
Drift chamber
Scintillator
• 綺麗な Raw signal が観測された。 • ノイズは抑制された。
Setup
Setup
< Top view > < Side view >
< Front view >

2011/10/23 10
- (ii) 電子の増幅率の計測 -
400 ns
30 mV
• 電子の増幅率は、初期電子の数と、信号として読み出された電子の数の比
• 読み出された電子の数はRaw signal の面積を求めることにより算出される
• 初期電子数はガスの種類と荷電粒子が落とすエネルギーの量から算出される
• 増幅率:M = KeCV • 測定の結果は上の式に従う
• 測定の結果はシミュレーションの結果とオーダーが同じ
初期電子 読み出された電子

- (iii) Drift time の分布の計測、(iv) 検出効率の計測 -
11
350 ns
Drift time の分布 検出効率
• トリガーと、実際に信号を得た時の時間差を計測。
• 最大のドリフト時間が分かる。
• トリガーに対して信号を得る確率(1レイヤー)
• 電圧を上げるに連れて、検出効率も上がる

4. まとめ
• MWPC は Charpak によって発明された、荷電粒子軌跡検出器である。
• Drift Chamber は、大面積を(MWPC に比べて)少ないワイヤー数で精度良く(~数百μm)検出する目的で開発された。
• E906 実験は、Drell-Yan 過程 (𝑞𝑞 → 𝛾∗ → 𝜇+𝜇−)を用いて、陽子構造を探る。
• E906の日本グループはミューオンの飛跡を検出するための大型のDrift Chamber を製作した。
• 私はこの Drift Chamber の基本的な性能テストを行った。 – (i)Raw signal の観測、(ii)電子の増幅率の計測、(iii)Drift time の分布の計測、(iv)検出効率の計測
• 私たちは現在、空間-時間関係式(x-t curve) と位置 resolution の測定を行なっている。
2011/10/24 12
Back-up slides
2011/10/22 13

Flavor symmetry breaking in sea quark • A proton consists of valence quarks,
gluons, and sea quarks.
• Gluons can split into quark-anti quark pairs.
• Bjorken 𝑥 =𝑝𝑝𝑎𝑟𝑡𝑜𝑛
𝑃𝑝𝑟𝑜𝑡𝑜𝑛
• The distribution of the parton in the proton : 𝑞(𝑥)
• We focus on the anti-quarks distribution in the sea quarks.
• Naïve assumption
• NMC (Muon deep inelastic scattering ,1991)
• NA51 (Drell-Yan process )
• E866/NuSea (Drell-Yan process)
𝑑 𝑥 > 𝑢 𝑥 at 𝑥 = 0.18
𝑑 𝑥 𝑢 𝑥 for 0.015 ≤ 𝑥 ≤ 0.35
2011/10/24 14
𝑑 𝑥 = 𝑢 (𝑥) in the proton
[𝑑 𝑥 − 𝑢 (𝑥)] 1
0𝑑𝑥 > 0
No theoretical models can reproduce this
𝑑 (𝑥) 𝑢 (𝑥)
𝑥
𝑢
𝑢 𝑑
𝑑

SeaQuest experiment
2011/10/24 15
• SeaQuest experiment will extend the x region of Drell-Yan measurement .
• 𝑑 𝑥 𝑢 𝑥 for 0.1 ≤ 𝑥 ≤ 0.45 • SeaQuest will use a 120 GeV proton beam. • Cross section for Drell-Yan process
DY measured
Expected errors are shown on the CTEQ6 curve
Mass of the virtual photon
16
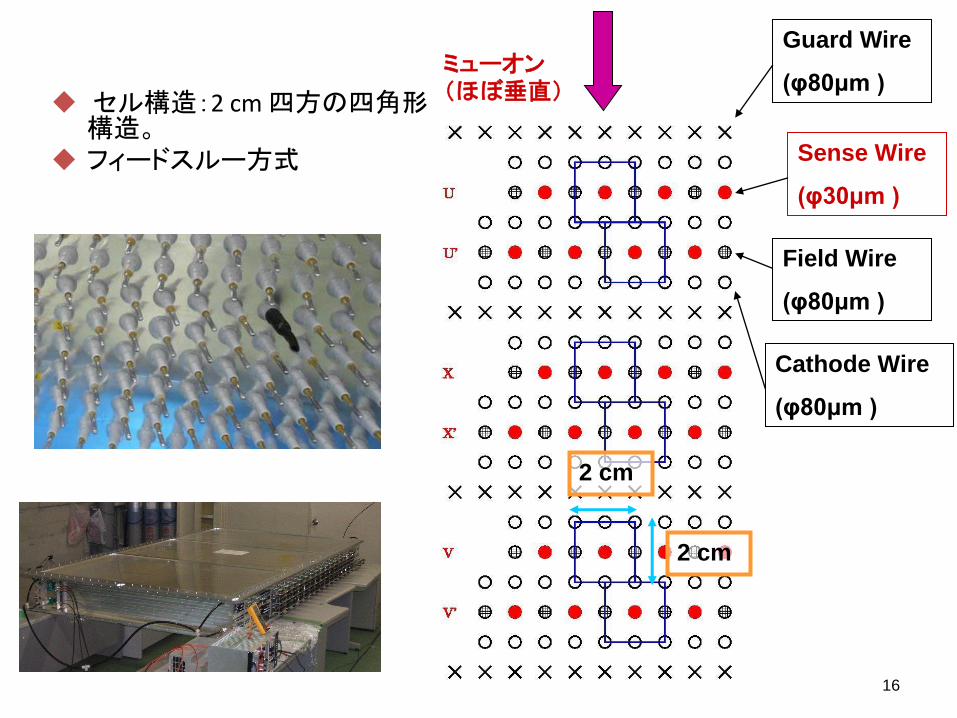
セル構造:2 cm 四方の四角形構造。
フィードスルー方式
ミューオン(ほぼ垂直)
Guard Wire
(φ80μm )
Field Wire
(φ80μm )
Cathode Wire
(φ80μm )
Sense Wire
(φ30μm )
2 cm
2 cm

• We call the amplification of electrons “Gas gain”.
• Gas Gain 𝑀 = 𝑁𝑡 𝑁𝑝
𝑁𝑝 = (Number of primary electrons)
=𝑑𝐸
𝑑𝑥⋅ 𝑥 ⋅
1
𝑊= 179 electrons
𝑁𝑡 = (Number of total electrons)
=1
𝑒 𝐼𝑑𝑡 =
1
𝑒⋅𝑅 𝑉𝑑𝑡
=1
1.6×10⁻¹⁹[𝐶]⋅500[Ω]⋅ 𝑉𝑑𝑡
P10 (Argon : Methane (90:10)) gas was filled in the drift chamber.
Cosmic-ray muons
2011/10/22 17
𝑒 : Elementary charge R : Readout resistance
𝑉𝑑𝑡 : Area of raw signal
𝑑𝐸
𝑑𝑥 : Energy deposit of muon
𝑥 : Path length of muon 𝑊 : Energy to create one electron
(ii) Measurements of amplification of electrons
400 ns
30 mV
2011/10/22 18
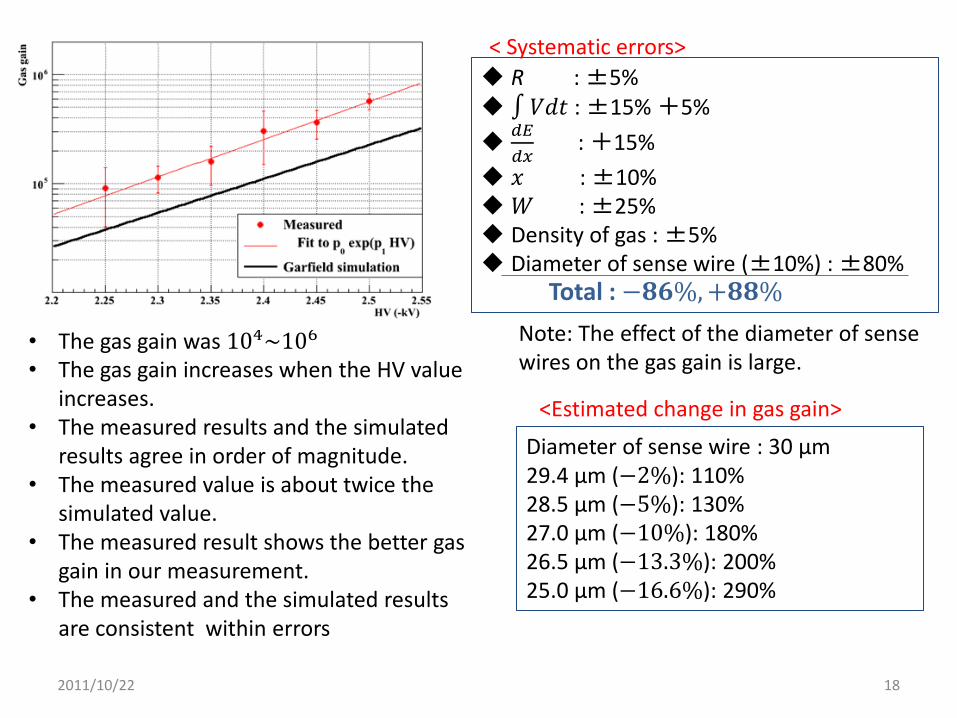
• The gas gain was 104~106 • The gas gain increases when the HV value
increases. • The measured results and the simulated
results agree in order of magnitude. • The measured value is about twice the
simulated value. • The measured result shows the better gas
gain in our measurement. • The measured and the simulated results
are consistent within errors
Diameter of sense wire : 30 μm 29.4 μm (−2%): 110% 28.5 μm (−5%): 130% 27.0 μm (−10%): 180% 26.5 μm (−13.3%): 200% 25.0 μm (−16.6%): 290%
R : ±5% 𝑉𝑑𝑡 : ±15% +5%
𝑑𝐸
𝑑𝑥 : +15%
𝑥 : ±10% 𝑊 : ±25% Density of gas : ±5% Diameter of sense wire (±10%) : ±80%
Total : −𝟖𝟔%,+𝟖𝟖%
<Estimated change in gas gain>
< Systematic errors>
Note: The effect of the diameter of sense wires on the gas gain is large.

(iii) Measurements of distribution of drift time
19
• ASDQ card, Level Shifter board : Readout electronics of SeaQuest
350 ns 250 ns
Measured result Simulated result
• There is a peak at the short drift time. • The forms of the distributions are similar. • The width of the distribution is about 350 ns. It is wider than the simulated result.
• The calibration of TDC was checked and is correct. • Incident angle of muons does not change the simulated result. • I will study further.
• Expected muon rate in SeaQuest : 300 kHz = 1 signal / 3.3 μs • This drift chamber can tolerate the muon rate (300 kHz) in the SeaQuest experiment.
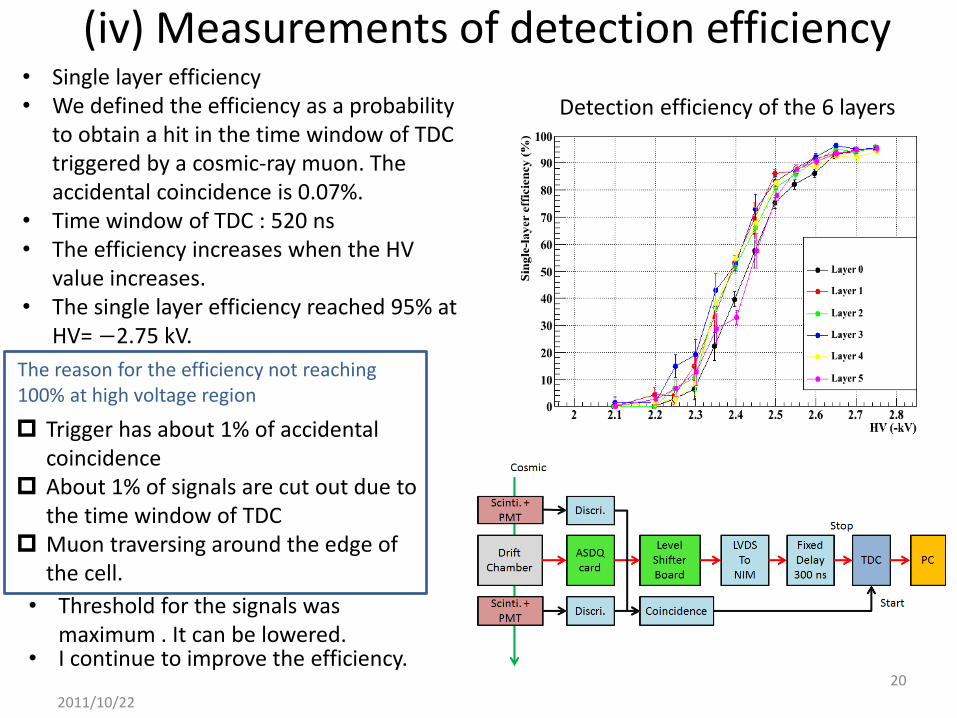
(iv) Measurements of detection efficiency
2011/10/22
20
• Single layer efficiency • We defined the efficiency as a probability
to obtain a hit in the time window of TDC triggered by a cosmic-ray muon. The accidental coincidence is 0.07%.
• Time window of TDC : 520 ns • The efficiency increases when the HV
value increases. • The single layer efficiency reached 95% at
HV= −2.75 kV.
Trigger has about 1% of accidental coincidence
About 1% of signals are cut out due to the time window of TDC
Muon traversing around the edge of the cell.
The reason for the efficiency not reaching 100% at high voltage region
• I continue to improve the efficiency.
Detection efficiency of the 6 layers
• Threshold for the signals was maximum . It can be lowered.

• Valence quarks in beam at high-x.
• Anti sea quarks in target at low -x.
2011/10/24 21
Drell-Yan process and how to measure the ratio of 𝑑 and 𝑢
• For 𝑑 𝑥1 ≪ 4𝑢 𝑥1 , measured 𝜎𝑝𝑑
2𝜎𝑝𝑝 is directly sensitive to
𝑑 𝑥2
𝑢 𝑥2
beam target
• Fixed target experiment

電子の拡散
上式よりわかるように、σ はε に依存している。これよりε の小さいガス を選ぶことがDC の位置分解能を上げるために重要である。
陽極に向かいドリフトしている電子は拡散している。
ドリフトしている 電子群の拡散の様子
電子群
位置分解能を上げるために電子の拡散を抑える必要がある。
衝突断面積を最小にする(ラムザウア効果) ときの電子の持つエネルギー
eE
x
E
Dx
w
DxDt
2222 σ
D:拡散係数 [cm^2/s]
ε:特性エネルギー [eV]
μ:易動度 [cm^2/Vs]
電子の広がり σ は以下のように表される。
w: ドリフト速度
E: 電場
x: ドリフト距離
ex) Ar – isobutane (75% - 25%)
・ ε ~0.2eV at 1kV/cm
・電場にかかわらずσ ~200μmをとる。

Ar:CO2
2011/10/24 23

Electric field of MWPC
2011/10/22 24
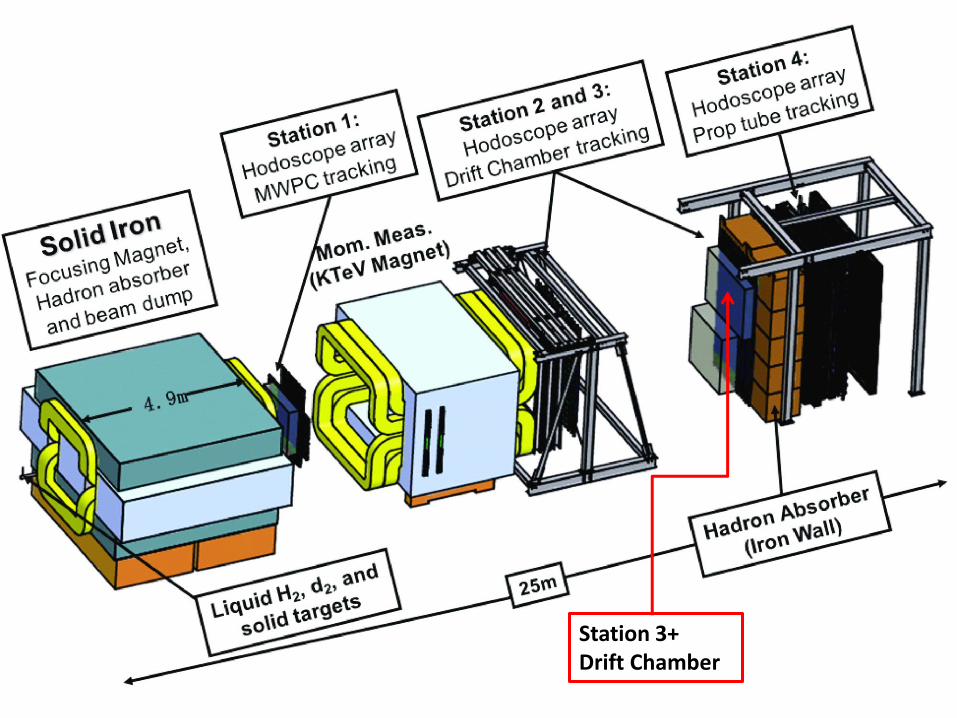
Station 3+ Drift Chamber

Station 3+ Drift Chamber


Target
Magnet Magnet DC1 DC2 DC3 St.4 Iron wall
< Top view >
< Side view >
Target
Magnet Magnet DC1 DC2 DC3 St.4 Iron wall
R
L
θ
φ 𝑥
𝑧 𝑦
𝑦
𝑧 𝑥 ×
𝑝 = 𝑒𝐵𝑅,𝜙 = 𝐿 𝑅

Single hit rate
2011/10/24 29

Monte Carlo simulation
2011/10/24 30
Mass of the virtual photon
X (beam) X (target)
Feynman X
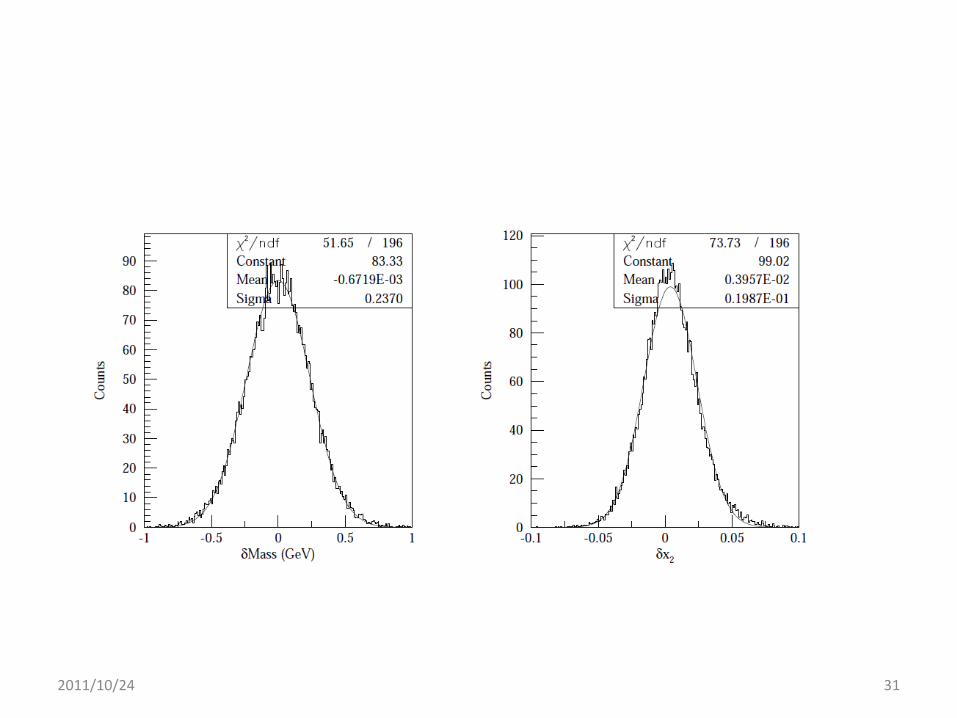
2011/10/24 31

CTEQ
2011/10/24 32
𝑥