Embed Size (px)
Citation preview
Published: July 22, 2011
r 2011 American Chemical Society 10239 dx.doi.org/10.1021/jp204785t | J. Phys. Chem. B 2011, 115, 10239–10250
ARTICLE
pubs.acs.org/JPCB
Effect of Interfacial Water Transport Resistance on Coupled Protonand Water Transport Across NafionMay Jean Cheah,† Ioannis G. Kevrekidis,†,‡ and Jay Benziger*,†
†Department of Chemical and Biological Engineering and ‡Program in Applied and Computational Mathematics, Princeton University,Princeton, New Jersey 08544, United States
bS Supporting Information
’ INTRODUCTION
Water management is a major engineering challenge forpolymer electrolyte membrane (PEM) fuel cells. Excess watercan flood the gas flow channels, hindering mass transport ofhydrogen at the anode or oxygen at the cathode, decreasing thefuel cell current. But insufficient water can dehydrate the PEM,increasing the membrane resistance, also decreasing the fuel cellcurrent.
It is widely accepted that electro-osmotic drag (EOD), wherethe proton current drags water molecules from the anode to thecathode, dehydrates the anode side of the PEM.1,2 Many EODstudies have claimed that each proton drags one or more watermolecules from the anode to the cathode, which would necessi-tate humidification of the hydrogen feed to PEM fuel cells toensure that the entire PEM is sufficiently hydrated to conduct theproton current.
However, Nafion PEM fuel cell operation with dry feeds is welldocumented.3,4 Commercial units with dead-ended anodesfunction with no anode humidification and water must even bepurged from the anode.5,6 Hogarth and Benziger showed thatoperation of Nafion PEM fuel cells with dry feeds (autohu-midified operation) could be sustained even at temperaturesabove 100 �C.7 Is there an explanation for the apparent contra-diction between autohumidified PEM fuel cell operation, and
reports that EOD drags one or more water molecules per protonfrom the anode to the cathode?
A number of papers have been written discussing the mechan-ism of proton transport and electro-osmotic drag in polymerelectrolyte membranes.8�11 In addition to EOD transport, wateris also transported by diffusion across the PEM.Within the PEM,it is usually assumed that the water flux is the sum of watertransport by diffusion and by EOD. At the membrane/electrodeinterface, the proton current stops but water can be transportedacross the interface. In this paper, we will examine the relation-ship between the intrinsic electro-osmotic drag of water in aNafion membrane and the net overall transport of water across amembrane-electrode assembly (MEA).
Inside the membrane, we define the intrinsic EOD coefficient,ξm = number of water molecules transported per proton. Wedefine the effective, or net, electro-osmotic drag coefficient as thechange in water flux across an MEA with current density, ξnet =F(d(water flux)/d(current density)), where F is Faraday’s con-stant. We shall show that the two quantities are equal whenthe membrane/electrode interfacial water transport resistancesare negligible. However, when water transport is limited by
Received: May 23, 2011Revised: July 20, 2011
ABSTRACT: Dynamic and steady-state water flux, current density,and resistance across a Nafion 115 membrane-electrode-assembly(MEA) were measured as functions of temperature, water activity,and applied potential. After step changes in applied potential, thecurrent, MEA resistance, and water flux evolved to new values over3000�5000 s, indicating a slow redistribution of water in themembrane. Steady-state current density initially increased linearlywith increasing potential and then saturated at higher appliedpotentials. Water flux increases in the direction of current flow resulting from electro-osmotic drag. The coupled transport ofwater and protons was modeled with an explicit accounting for electro-osmotic drag, water diffusion, and interfacial water transportresistance across the vapor/membrane interface. Themodel shows that water is dragged inside themembrane by the proton current,but the net water flux into and out of the membrane is controlled by interfacial water transport at the membrane/vapor interface.The coupling of electro-osmotic drag and interfacial water transport redistributes the water in the membrane. Because waterentering themembrane is limited by interfacial transport, an increase in current depletes water from the anode side of themembrane,increasing the membrane resistance there, which in turn limits the current. This feedback loop between current density andmembrane resistance determines the stable steady-state operation at a fixed applied potential that results in current saturation. Weshow that interfacial water transport resistance substantially reduces the impact of electro-osmotic drag on polymer electrolytemembrane fuel cell operation.
10240 dx.doi.org/10.1021/jp204785t |J. Phys. Chem. B 2011, 115, 10239–10250
The Journal of Physical Chemistry B ARTICLE
interfacial transport resistances, the net electro-osmotic dragcoefficient is reduced compared to the intrinsic EOD coefficientinside the membrane, i.e., ξnet/ξm , 1.
Over the past 20 years, there have been numerous measure-ments of EOD in Nafion as a function of temperature (T) andwater activity (aw = Pw/Pw�). A review of the various studies onEOD in polymer electrolyte membranes was published in2006.12 Table 1 provides an updated summary of the studieson the electro-osmotic drag of protons in Nafion. The literaturehas not distinguished between the intrinsic EOD coefficient, ξmand the net EOD coefficient, ξnet. The majority of the studiesreported electro-osmotic drag coefficients, ξ g 1; we will use ξunsubscripted where no distinction is made between ξm and ξnet.
The values of ξ for Nafion show a large scatter. The mostconsistent observation is that the reported electro-osmotic dragcoefficients are larger when membranes are equilibrated withliquid water and are smaller when membranes are equilibratedwith water vapor. Also, for both vapor and liquid equilibratedmembranes, the electro-osmotic drag coefficients seem to increasewith temperature. It is difficult to compare values of ξ because theenvironmental conditions are not always fully defined.
We present here experiments and analysis that attempt todistinguish between the intrinsic electro-osmotic drag coefficient
(ξm) and the net EOD coefficient associated with the overallwater flux across the MEA (ξnet). We have paid specific attention
Table 1. Summary of EOD Studies
technique (driving force) source conditions electro-osmotic drag coefficient, ξ
activity gradient (chemical potential) Fuller and Newman, 199224 vapor equilibrated
temperature: 25 �C, 37.5 �C1.4
Zawodzinski et al., 199523 temperature: 30 �Cvapor equilibrated 1.0
liquid equilibrated 2.5
Gallagher et al., 200925 vapor equilibrated
temperature: �25 �C, 10 �C∼1
electro-osmotic drag cell (applied potential) Zawodzinski et al., 199322 temperature: 30 �Cvapor equilibrated 0.9
liquid equilibrated 2�2.9
streaming potential (applied pressure) Xie and Okada, 199526 vapor equilibrated
temperature: 25 �C2.6
electrophoretic NMR (applied potential) Ise et al., 199927 temperature: 27 �Cvapor equilibrated
1.5�2.5
methanol fuel cell (electrochemical) Ren and Gottesfeld, 200128 liquid equilibrated
temperature: 15 �C 2.0
temperature: 130 �C 5.1
hydrogen fuel cell (electrochemical) Park and Caton, 200829 vapor equilibrated
temperature: 70 �C0.50�0.82
hydrogen pump (applied potential) Weng et al., 199630 vapor equilibrated
temperature: 135 to 185 �C0.2�0.6
Ge et al., 200631 vapor equilibrated
temperature: 30 to 50 �C0.2�0.9
liquid equilibrated
temperature: 15 to 85 �C1.8�2.7
Ye and Wang, 200732 vapor equilibrated
temperature: 80 �C1.1
Luo et al., 201033 liquid equilibrated
temperature: 20 to 90 �C2�3.4
vapor equilibrated
temperature: 25 �C1.2�2
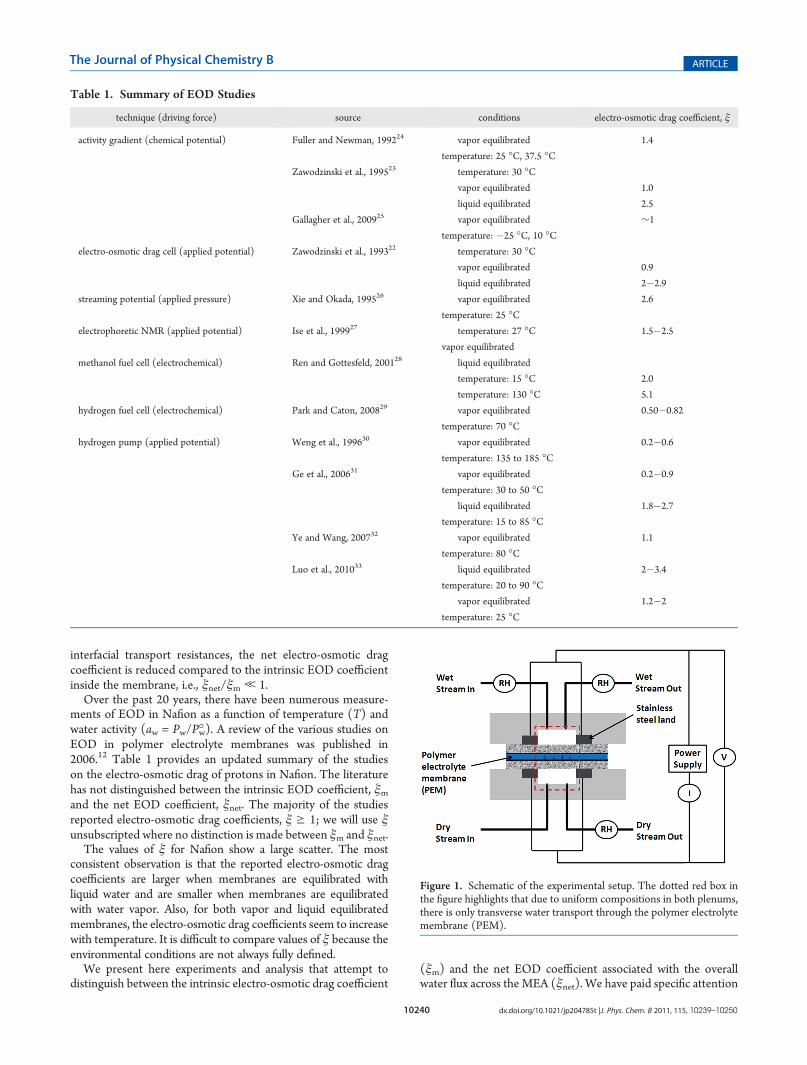
Figure 1. Schematic of the experimental setup. The dotted red box inthe figure highlights that due to uniform compositions in both plenums,there is only transverse water transport through the polymer electrolytemembrane (PEM).
10241 dx.doi.org/10.1021/jp204785t |J. Phys. Chem. B 2011, 115, 10239–10250
The Journal of Physical Chemistry B ARTICLE
to the coupling of interfacial water transport resistance withelectro-osmotic drag. This work extends our previous studies ofinterfacial transport resistances for water transport at theNafion/vapor interface.13�15
The paper is organized as follows: (a) Experimental Methodsdescribe the “one-dimensional” permeation cell used in experi-ments, where water flux, current, and MEA resistance weremeasured while water activity, temperature, and applied potentialwere controlled; (b) Results report the dynamic and steady-statecurrent density, water flux, and MEA resistance measurements;(c) the Discussion analyzes the effects of interfacial transportresistance on the net electro-osmotic drag coefficient, and thewater and proton transport processes.
’EXPERIMENTAL METHODS
Water flux across the Nafion membrane was measured in theabsence and in the presence of a protonic current using a “one-dimensional” permeation cell (Figure 1). Details of the cellfabrication are described elsewhere.15 A humidified gas streamwas supplied to one side of the membrane and a dry gas stream tothe other side. The relative humidities of the exiting streams weremonitored as a function of time. The water flux was calculated bymass balances. The cell was modified by the addition of stainlesssteel electrodes to apply an electrical potential across themembraneelectrode assembly (MEA). TheMEA used in the experiments wasmade using two silicon gaskets, two carbon cloth gas diffusionlayers (GDLs) with a carbon microporous layer on one side(Electrochem Inc., Woburn, MA), and a catalyst coated Nafion115membrane (the catalyst coatedmembranewas purchased fromIon Power Inc., New Castle, DE. The anode and cathode catalystloadings were listed as 0.3 (mg Pt/cm2)/side). The surface area ofthe MEA exposed to the open plenum was 1 cm2. The MEA wasclamped between the plates of the cell and the entire cell assemblywas placed inside a temperature-controlled insulated box.
The cell was run in three different flux configurations, definedby the direction of current flow in relation to the external wateractivity gradient. Hydrogen was supplied to the anode. Theapplied potential oxidized H2, and protons flowed from theanode to the cathode. A humidified gas stream was supplied toeither the anode or cathode. (i) Co-current flux: Humidifiedhydrogen was fed to the anode, and dry nitrogen was fed to thecathode. The vapor phase water activity gradient and the currentwere in the same direction. (ii) Counter-current flux: Dryhydrogen was fed to the anode, and humidified nitrogen wasfed to the cathode. The vapor phase water activity gradient andthe current were in opposing directions. (iii) No-current:Humidified nitrogen was fed to the “anode”, and dry nitrogenwas fed to the “cathode”.
The water activity of the humidified feed stream was con-trolled by mixing a water saturated gas stream with a dry gasstream using mass flow controllers. The humidified feed streamwas run in large excess to minimize the compositional changesdue to current flow. The flow rates of both the humidified feedstream and the dry gas stream were not varied; because of theGDLs, there was a stagnant layer that was not affected by the gasflow rates.
Open plenums on each side of the cell permitted good mixingin the gas phase to ensure that the water vapor activity wasspatially uniform in the anode and cathode plenums respectively;this assured that the outlet compositions of the anode andcathode were equal to the compositions inside the plenums.
The relative humidity and temperature of the anode and cathodeoutlets and the humidified feed stream were measured withSensirion Model SHT75 sensors.
All measurements were taken with the anode and cathodeplenums at a total pressure, Ptotal, of 101 kPa. The net watertransport across the membrane (i.e., water flux) was equal to themolar water flow exiting the dry side plenum given by eq 1.
water flux ¼ ðRH=100ÞP�WðTÞPtotal � ðRH=100ÞP�WðTÞ
PstdQgas, exit
RgTstdmol=s
ð1Þ
In eq 1, RH is the measured relative humidity of water, Pw�(T) isthe saturation pressure of water (kPa) at temperature, T, Pstandardis the standard pressure (101.325 kPa), Qgas,exit is the volumetricflow rate of the gas stream exiting the dry side plenum (m3/s), Rgis the ideal gas constant [8.314 � 103 (kPa m3)/(mol K)], andTstandard is the standard temperature (298 K).
The water fluxes at the anode and cathode inlets werecompared to the water fluxes at the outlets. The overall watermass balances at steady state closed to <5% in all the reportedexperiments.
Co-current flux experiments were conducted at three differentanode feed relative humidities (RH: 30%, 50%, and 70%) andthree different temperatures (37, 50 and 70 �C). Additionalexperiments were done at anode feed RH of 86% and 100%. Wewere unable to get good quantitative results from the high RHexperiments. At high RH, the removal of hydrogen from theanode gas phase as protons were pumped across the PEM causedliquid water to condense, resulting in 20% fluctuations in theoverall water balance. Counter-current flux experiments wereconducted at 50 �C with a cathode feed RH of 50%. No-currentexperiments were conducted at 50 �C with “anode” feed RH of50% and 80%.
TheMEAwas equilibrated at open circuit for 4�12 h until therelative humidity of the anode and cathode outlets, as well as theMEA’s resistance, had equilibrated. After equilibration, an ArbinMSTAT4+ test station was used to apply a sequence of potentialsacross the cell, where the duration of each applied potential stepwas 2 h. During each applied potential step, the current andrelative humidities of the gas streams were logged by computerevery second. The MEA resistance, RMEA, was measured bypulsed current relaxation every 15 min, from the voltage dropafter a 4 � 10�5 coulomb pulse. The reported RMEA was theaverage resistance from 10 such pulses.
’RESULTS
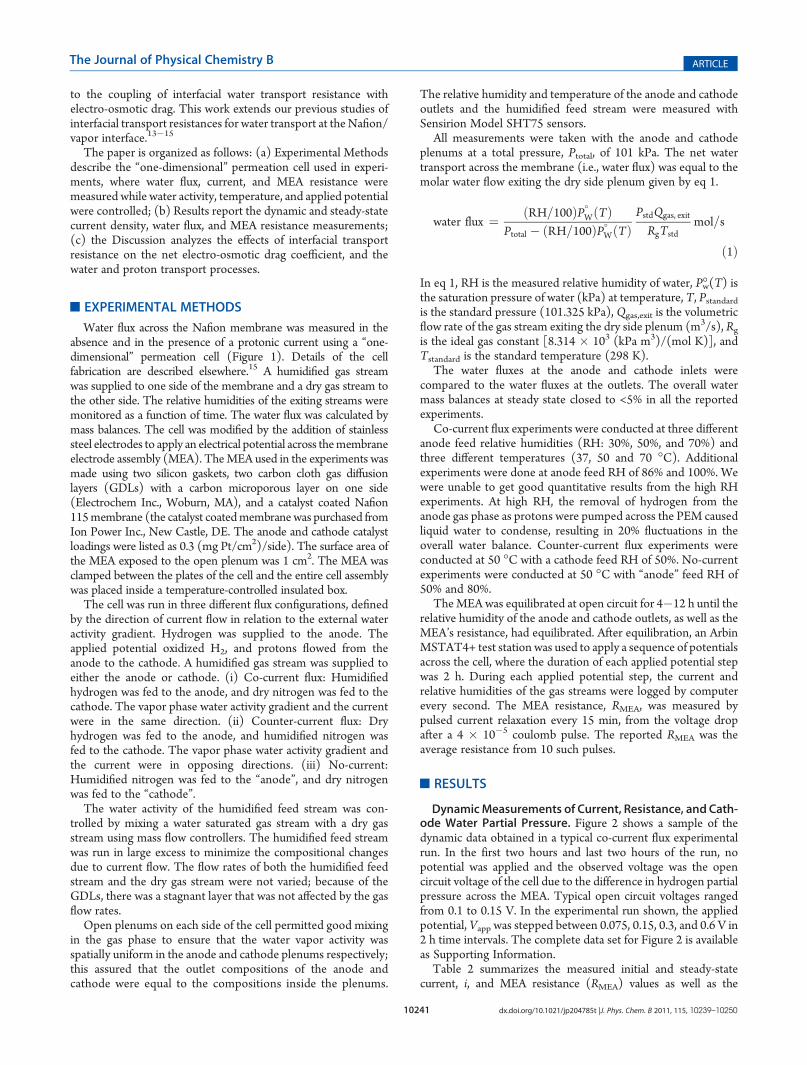
DynamicMeasurements of Current, Resistance, and Cath-ode Water Partial Pressure. Figure 2 shows a sample of thedynamic data obtained in a typical co-current flux experimentalrun. In the first two hours and last two hours of the run, nopotential was applied and the observed voltage was the opencircuit voltage of the cell due to the difference in hydrogen partialpressure across the MEA. Typical open circuit voltages rangedfrom 0.1 to 0.15 V. In the experimental run shown, the appliedpotential, Vapp was stepped between 0.075, 0.15, 0.3, and 0.6 V in2 h time intervals. The complete data set for Figure 2 is availableas Supporting Information.Table 2 summarizes the measured initial and steady-state
current, i, and MEA resistance (RMEA) values as well as the
10242 dx.doi.org/10.1021/jp204785t |J. Phys. Chem. B 2011, 115, 10239–10250
The Journal of Physical Chemistry B ARTICLE
measured cathode water partial pressure, pw,gcathode at each applied
potential step based on the experimental data shown in Figure 2.We highlight four key results in Figure 2 and Table 2 for the
reader.(1) At hour 2, the applied potential was stepped from 0 to
0.075 V and then held at 0.075 V. The resulting currentjump was consistent with Δi = ΔVapp/RMEA(@t = 2 h).The relative humidity at the cathode increased. Therelative humidity change indicated that there was addi-tional water flux due to electro-osmotic drag.
(2) Between hours 2 and 4, the current increased and RMEA
decreased, consistent with Ohm’s law i(t)RMEA(t) = Vapp.These transient changes in i and RMEA followed decayingexponentials with a time constant of ∼3000 s.
(3) At hour 8, the applied potential was increased from 0.3 to0.6 V. There was a large immediate current increaseconsistent with Δi = ΔVapp/RMEA(@t = 8 h). The waterflux increased, corresponding to a net electro-osmoticdrag coefficient of Δwater flux/Δi = 0.2.
(4) Between hours 8 and 10, the applied potential was held at0.6 V. The current decreased; the steady-state currentdecreased almost to the same current obtained at theapplied potential of 0.3 V. RMEA increased proportionallyto the decrease in current. While the current decreased,the water flux increased; this would appear to imply anegative electro-osmotic drag!
The highlighted results suggest that when there is a change inthe applied potential, the resulting change in current causes aredistribution of the water in the PEM. The water redistributiontakes a long time (>3000 s) and alters the membrane resistanceand, in turn, the current. We propose that the water redistribu-tion in the membrane also caused the increase in water flux evenas current was decreasing in hours 8�10.When the cell was returned to open circuit, the current
immediately dropped to zero. RMEA decayed exponentially tothe initial open circuit RMEA value. The cathode water partialpressure also decayed exponentially to its initial open circuit value.A total of 45 experimental runs similar to those shown in
Figure 2 were conducted with different applied potential profiles,at different temperatures, relative humidities, and flux configura-tions. At least two data sets were collected at each appliedpotential for every temperature, feed RH, and flux configurationcombination. Experimental runs were obtained with both in-creasing and decreasing applied potential profile. Data wereobtained with several different MEAs, and the results (bothwater flux measurements and IV responses) were highly repro-ducible for the same experimental conditions. The completedynamic data sets are available from ourWeb site (http://pemfc.princeton.edu/EOD_Data).To reduce the complexity of reviewing all the dynamic data,
steady-state results were compiled by taking the limiting values ofcurrent, water partial pressures at the anode and cathode, andMEA resistance at the end of each two hour time interval. Waterflux was calculated from the cathode water partial pressure usingeq 1.
Figure 2. Data set of a typical co-current flux experimental run. This run was conducted with humidified hydrogen (anode feed RH of 50%) and drynitrogen, at 50 �C. From the second to the 10th hour, the applied potential was stepped from 0.075 to 0.15, 0.3, and 0.6 V in 2 h time intervals.
Table 2. Dynamic Experimental Data at 50 �C, 50% AnodeRH
current (A)
MEA
resistance (Ω)
time (h)
applied potential
(V) initial
steady
state initial
steady
state
pw,gcathode
(kPa)
0�2 0 0 0 0.36 0.34 1.65
2�4 0.075 0.24 0.32 0.34 0.23 2.04
4�6 0.15 0.61 0.54 0.23 0.26 2.26
6�8 0.3 0.92 0.65 0.26 0.39 2.69
8�10 0.6 0.9 0.69 0.39 0.59 3.68
10�12 0 0 0 0.59 0.39 1.66
10243 dx.doi.org/10.1021/jp204785t |J. Phys. Chem. B 2011, 115, 10239–10250
The Journal of Physical Chemistry B ARTICLE
Co-current Flux: Current, MEA Resistance, andWater FluxMeasurements. Humidified hydrogen was supplied to theanode while dry nitrogen was supplied to the cathode. Themeasured steady-state open circuit voltages (OCV) of 0.1�0.15V were due to the difference in hydrogen partial pressure, PH2
across the membrane: VH = (RgT/2F) ln(PH2
anode/PH2
cathode), whereF is the Faraday constant (96 485 C/mol). Molecular hydrogendiffused through the membrane from the anode to the cathodeand was swept away by the nitrogen purge at the cathode. Themolecular H2 diffusion, or crossover flux, is given by eq 2.
H2 crossover flux ¼ xanodeH2
PstdQ cathodeg
RgTstdexp �2FVH
RgT
!ð2Þ
In eq 2, xH2
anode is the mol fraction of hydrogen at the anode. Fromeq 2, the measured OCV corresponded to hydrogen partialpressures ca. 1 Pa at the cathode and a crossover flux of <1 mA/cm2. Application of a potential caused a proton current of100�1000 mA/cm2 to flow from the anode to the cathode;the proton current was much greater than the crossover flux.Thus, in our analysis, the crossover flux was neglected.The proton current flow from anode to cathode was co-
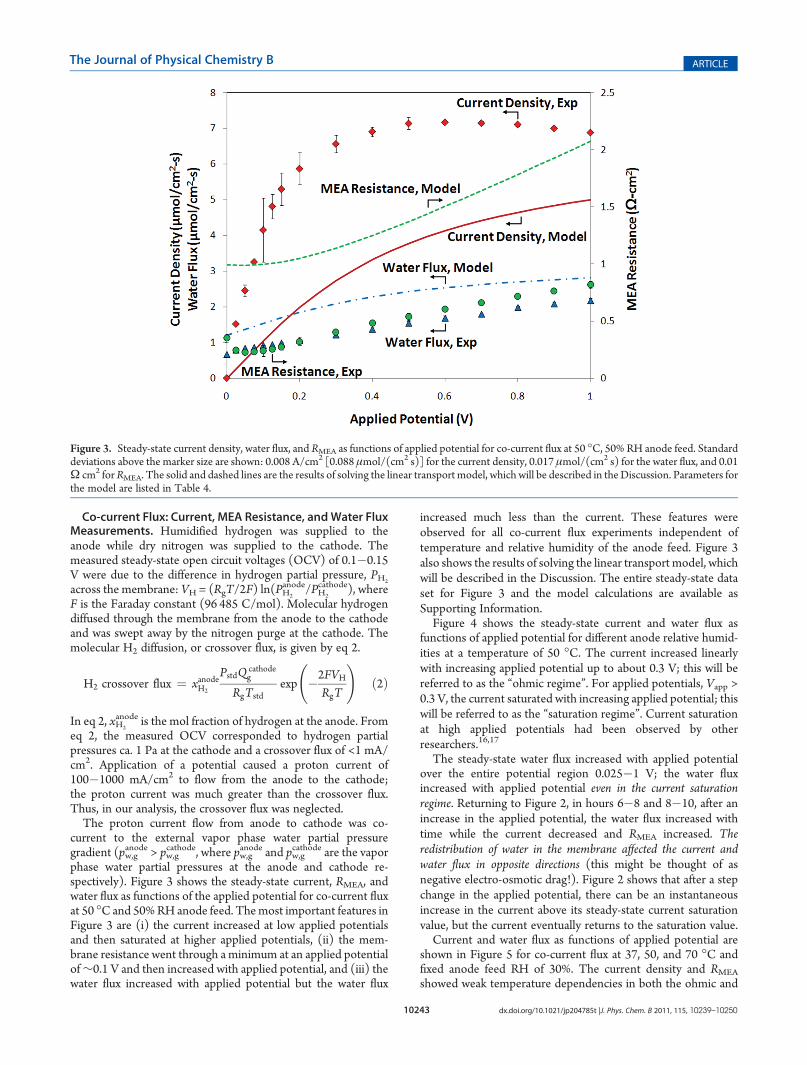
current to the external vapor phase water partial pressuregradient (pw,g
anode > pw,gcathode, where pw,g
anode and pw,gcathode are the vapor
phase water partial pressures at the anode and cathode re-spectively). Figure 3 shows the steady-state current, RMEA, andwater flux as functions of the applied potential for co-current fluxat 50 �C and 50%RH anode feed. Themost important features inFigure 3 are (i) the current increased at low applied potentialsand then saturated at higher applied potentials, (ii) the mem-brane resistance went through a minimum at an applied potentialof∼0.1 V and then increased with applied potential, and (iii) thewater flux increased with applied potential but the water flux
increased much less than the current. These features wereobserved for all co-current flux experiments independent oftemperature and relative humidity of the anode feed. Figure 3also shows the results of solving the linear transport model, whichwill be described in the Discussion. The entire steady-state dataset for Figure 3 and the model calculations are available asSupporting Information.Figure 4 shows the steady-state current and water flux as
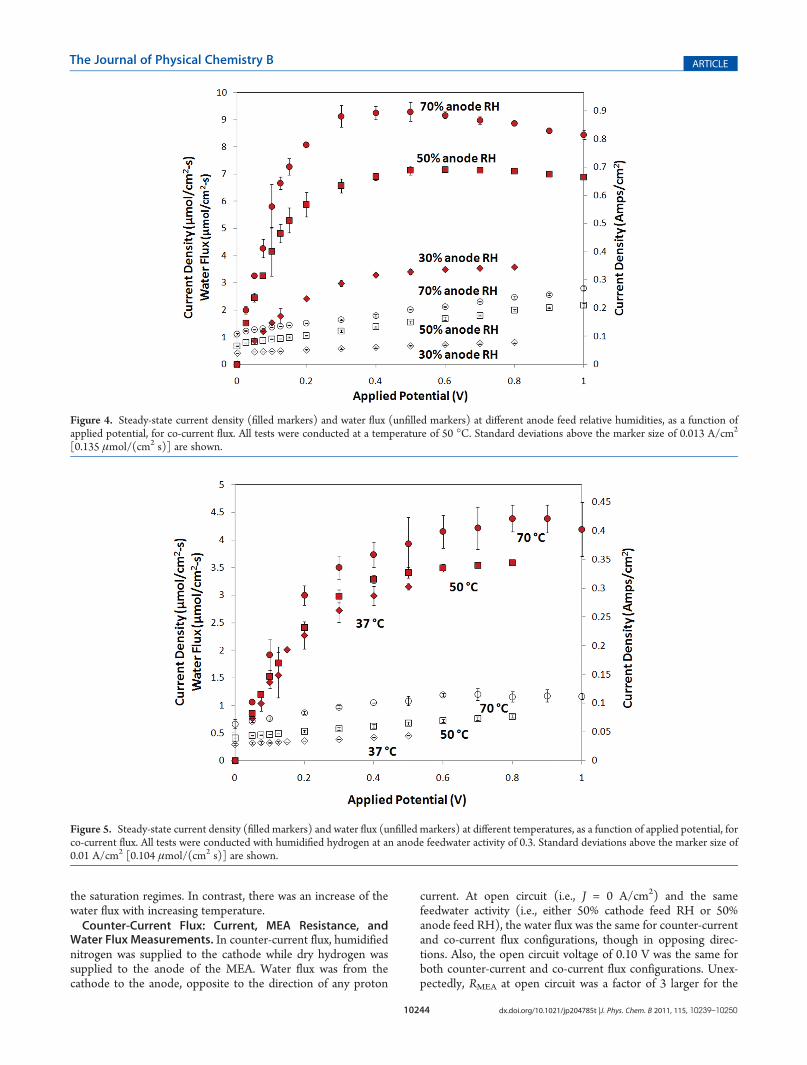
functions of applied potential for different anode relative humid-ities at a temperature of 50 �C. The current increased linearlywith increasing applied potential up to about 0.3 V; this will bereferred to as the “ohmic regime”. For applied potentials, Vapp >0.3 V, the current saturated with increasing applied potential; thiswill be referred to as the “saturation regime”. Current saturationat high applied potentials had been observed by otherresearchers.16,17
The steady-state water flux increased with applied potentialover the entire potential region 0.025�1 V; the water fluxincreased with applied potential even in the current saturationregime. Returning to Figure 2, in hours 6�8 and 8�10, after anincrease in the applied potential, the water flux increased withtime while the current decreased and RMEA increased. Theredistribution of water in the membrane affected the current andwater flux in opposite directions (this might be thought of asnegative electro-osmotic drag!). Figure 2 shows that after a stepchange in the applied potential, there can be an instantaneousincrease in the current above its steady-state current saturationvalue, but the current eventually returns to the saturation value.Current and water flux as functions of applied potential are
shown in Figure 5 for co-current flux at 37, 50, and 70 �C andfixed anode feed RH of 30%. The current density and RMEA
showed weak temperature dependencies in both the ohmic and
Figure 3. Steady-state current density, water flux, and RMEA as functions of applied potential for co-current flux at 50 �C, 50% RH anode feed. Standarddeviations above the marker size are shown: 0.008 A/cm2 [0.088 μmol/(cm2 s)] for the current density, 0.017 μmol/(cm2 s) for the water flux, and 0.01Ω cm2 forRMEA. The solid and dashed lines are the results of solving the linear transport model, which will be described in theDiscussion. Parameters forthe model are listed in Table 4.
10244 dx.doi.org/10.1021/jp204785t |J. Phys. Chem. B 2011, 115, 10239–10250
The Journal of Physical Chemistry B ARTICLE
the saturation regimes. In contrast, there was an increase of thewater flux with increasing temperature.Counter-Current Flux: Current, MEA Resistance, and
Water Flux Measurements. In counter-current flux, humidifiednitrogen was supplied to the cathode while dry hydrogen wassupplied to the anode of the MEA. Water flux was from thecathode to the anode, opposite to the direction of any proton
current. At open circuit (i.e., J = 0 A/cm2) and the samefeedwater activity (i.e., either 50% cathode feed RH or 50%anode feed RH), the water flux was the same for counter-currentand co-current flux configurations, though in opposing direc-tions. Also, the open circuit voltage of 0.10 V was the same forboth counter-current and co-current flux configurations. Unex-pectedly, RMEA at open circuit was a factor of 3 larger for the
Figure 4. Steady-state current density (filled markers) and water flux (unfilled markers) at different anode feed relative humidities, as a function ofapplied potential, for co-current flux. All tests were conducted at a temperature of 50 �C. Standard deviations above the marker size of 0.013 A/cm2
[0.135 μmol/(cm2 s)] are shown.
Figure 5. Steady-state current density (filled markers) and water flux (unfilled markers) at different temperatures, as a function of applied potential, forco-current flux. All tests were conducted with humidified hydrogen at an anode feedwater activity of 0.3. Standard deviations above the marker size of0.01 A/cm2 [0.104 μmol/(cm2 s)] are shown.
10245 dx.doi.org/10.1021/jp204785t |J. Phys. Chem. B 2011, 115, 10239–10250
The Journal of Physical Chemistry B ARTICLE
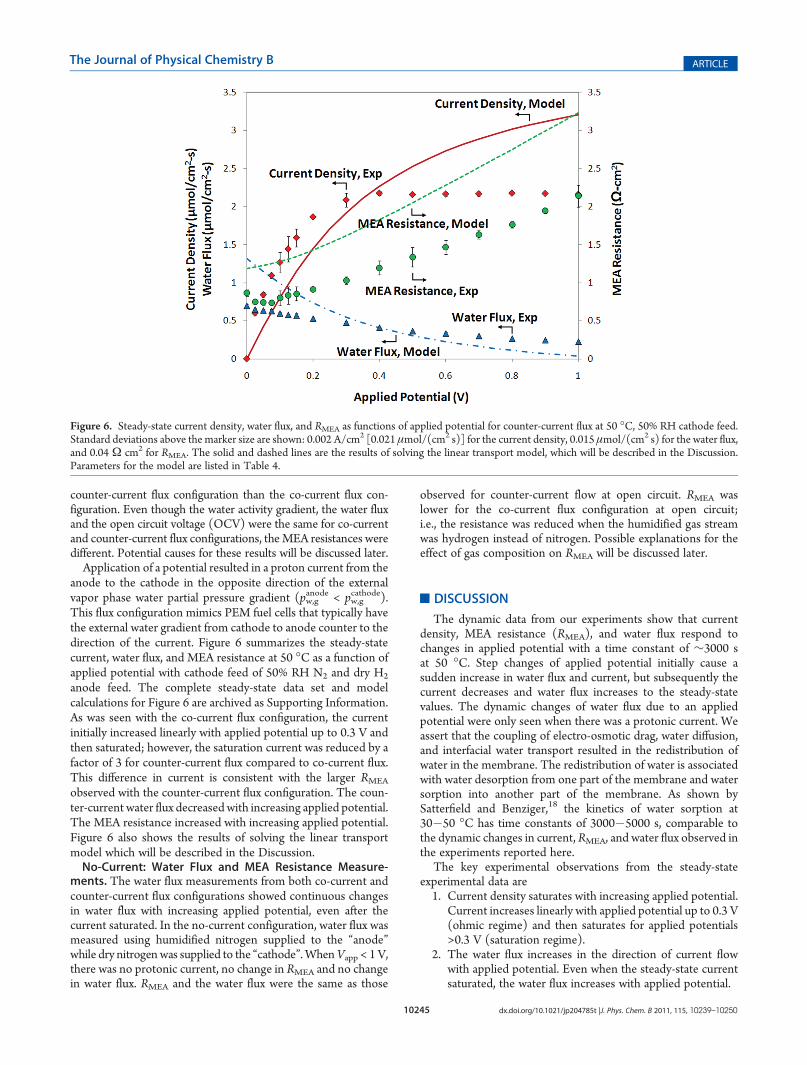
counter-current flux configuration than the co-current flux con-figuration. Even though the water activity gradient, the water fluxand the open circuit voltage (OCV) were the same for co-currentand counter-current flux configurations, theMEA resistances weredifferent. Potential causes for these results will be discussed later.Application of a potential resulted in a proton current from the
anode to the cathode in the opposite direction of the externalvapor phase water partial pressure gradient (pw,g
anode < pw,gcathode).
This flux configuration mimics PEM fuel cells that typically havethe external water gradient from cathode to anode counter to thedirection of the current. Figure 6 summarizes the steady-statecurrent, water flux, and MEA resistance at 50 �C as a function ofapplied potential with cathode feed of 50% RH N2 and dry H2
anode feed. The complete steady-state data set and modelcalculations for Figure 6 are archived as Supporting Information.As was seen with the co-current flux configuration, the currentinitially increased linearly with applied potential up to 0.3 V andthen saturated; however, the saturation current was reduced by afactor of 3 for counter-current flux compared to co-current flux.This difference in current is consistent with the larger RMEA
observed with the counter-current flux configuration. The coun-ter-current water flux decreasedwith increasing applied potential.The MEA resistance increased with increasing applied potential.Figure 6 also shows the results of solving the linear transportmodel which will be described in the Discussion.No-Current: Water Flux and MEA Resistance Measure-
ments. The water flux measurements from both co-current andcounter-current flux configurations showed continuous changesin water flux with increasing applied potential, even after thecurrent saturated. In the no-current configuration, water flux wasmeasured using humidified nitrogen supplied to the “anode”while dry nitrogenwas supplied to the “cathode”. WhenVapp < 1 V,there was no protonic current, no change in RMEA and no changein water flux. RMEA and the water flux were the same as those
observed for counter-current flow at open circuit. RMEA waslower for the co-current flux configuration at open circuit;i.e., the resistance was reduced when the humidified gas streamwas hydrogen instead of nitrogen. Possible explanations for theeffect of gas composition on RMEA will be discussed later.
’DISCUSSION
The dynamic data from our experiments show that currentdensity, MEA resistance (RMEA), and water flux respond tochanges in applied potential with a time constant of ∼3000 sat 50 �C. Step changes of applied potential initially cause asudden increase in water flux and current, but subsequently thecurrent decreases and water flux increases to the steady-statevalues. The dynamic changes of water flux due to an appliedpotential were only seen when there was a protonic current. Weassert that the coupling of electro-osmotic drag, water diffusion,and interfacial water transport resulted in the redistribution ofwater in the membrane. The redistribution of water is associatedwith water desorption from one part of the membrane and watersorption into another part of the membrane. As shown bySatterfield and Benziger,18 the kinetics of water sorption at30�50 �C has time constants of 3000�5000 s, comparable tothe dynamic changes in current, RMEA, and water flux observed inthe experiments reported here.
The key experimental observations from the steady-stateexperimental data are1. Current density saturates with increasing applied potential.
Current increases linearly with applied potential up to 0.3 V(ohmic regime) and then saturates for applied potentials>0.3 V (saturation regime).
2. The water flux increases in the direction of current flowwith applied potential. Even when the steady-state currentsaturated, the water flux increases with applied potential.
Figure 6. Steady-state current density, water flux, and RMEA as functions of applied potential for counter-current flux at 50 �C, 50% RH cathode feed.Standard deviations above the marker size are shown: 0.002 A/cm2 [0.021 μmol/(cm2 s)] for the current density, 0.015 μmol/(cm2 s) for the water flux,and 0.04 Ω cm2 for RMEA. The solid and dashed lines are the results of solving the linear transport model, which will be described in the Discussion.Parameters for the model are listed in Table 4.
10246 dx.doi.org/10.1021/jp204785t |J. Phys. Chem. B 2011, 115, 10239–10250
The Journal of Physical Chemistry B ARTICLE
3. RMEA increases with applied potential when there is aprotonic current.
Water transport in PEMs has typically assumed a linearsuperposition of water diffusion and electro-osmotic drag givenby eq 3.
water flux ¼ cwDwdawdx
þ ξJ ð3Þ
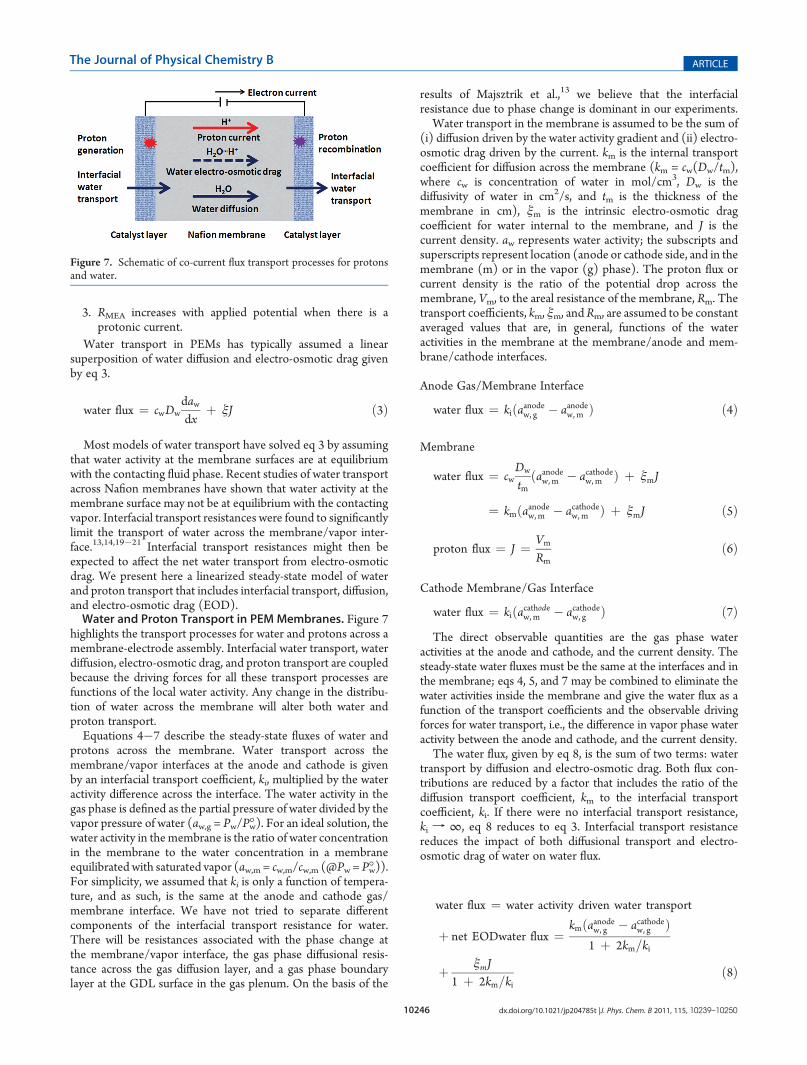
Most models of water transport have solved eq 3 by assumingthat water activity at the membrane surfaces are at equilibriumwith the contacting fluid phase. Recent studies of water transportacross Nafion membranes have shown that water activity at themembrane surface may not be at equilibrium with the contactingvapor. Interfacial transport resistances were found to significantlylimit the transport of water across the membrane/vapor inter-face.13,14,19�21 Interfacial transport resistances might then beexpected to affect the net water transport from electro-osmoticdrag. We present here a linearized steady-state model of waterand proton transport that includes interfacial transport, diffusion,and electro-osmotic drag (EOD).Water and Proton Transport in PEM Membranes. Figure 7
highlights the transport processes for water and protons across amembrane-electrode assembly. Interfacial water transport, waterdiffusion, electro-osmotic drag, and proton transport are coupledbecause the driving forces for all these transport processes arefunctions of the local water activity. Any change in the distribu-tion of water across the membrane will alter both water andproton transport.Equations 4�7 describe the steady-state fluxes of water and
protons across the membrane. Water transport across themembrane/vapor interfaces at the anode and cathode is givenby an interfacial transport coefficient, ki, multiplied by the wateractivity difference across the interface. The water activity in thegas phase is defined as the partial pressure of water divided by thevapor pressure of water (aw,g = Pw/Pw�). For an ideal solution, thewater activity in the membrane is the ratio of water concentrationin the membrane to the water concentration in a membraneequilibrated with saturated vapor (aw,m = cw,m/cw,m (@Pw = Pw�)).For simplicity, we assumed that ki is only a function of tempera-ture, and as such, is the same at the anode and cathode gas/membrane interface. We have not tried to separate differentcomponents of the interfacial transport resistance for water.There will be resistances associated with the phase change atthe membrane/vapor interface, the gas phase diffusional resis-tance across the gas diffusion layer, and a gas phase boundarylayer at the GDL surface in the gas plenum. On the basis of the
results of Majsztrik et al.,13 we believe that the interfacialresistance due to phase change is dominant in our experiments.Water transport in the membrane is assumed to be the sum of
(i) diffusion driven by the water activity gradient and (ii) electro-osmotic drag driven by the current. km is the internal transportcoefficient for diffusion across the membrane (km = cw(Dw/tm),where cw is concentration of water in mol/cm3, Dw is thediffusivity of water in cm2/s, and tm is the thickness of themembrane in cm), ξm is the intrinsic electro-osmotic dragcoefficient for water internal to the membrane, and J is thecurrent density. aw represents water activity; the subscripts andsuperscripts represent location (anode or cathode side, and in themembrane (m) or in the vapor (g) phase). The proton flux orcurrent density is the ratio of the potential drop across themembrane, Vm, to the areal resistance of the membrane, Rm. Thetransport coefficients, km, ξm, andRm, are assumed to be constantaveraged values that are, in general, functions of the wateractivities in the membrane at the membrane/anode and mem-brane/cathode interfaces.
Anode Gas/Membrane Interface
water flux ¼ kiðaanodew, g � aanodew, m Þ ð4Þ
Membrane
water flux ¼ cwDw
tmðaanodew, m � acathodew, m Þ þ ξmJ
¼ kmðaanodew, m � acathodew, m Þ þ ξmJ ð5Þ
proton flux ¼ J ¼ Vm
Rmð6Þ
Cathode Membrane/Gas Interface
water flux ¼ kiðacathodew, m � acathodew, g Þ ð7ÞThe direct observable quantities are the gas phase water
activities at the anode and cathode, and the current density. Thesteady-state water fluxes must be the same at the interfaces and inthe membrane; eqs 4, 5, and 7 may be combined to eliminate thewater activities inside the membrane and give the water flux as afunction of the transport coefficients and the observable drivingforces for water transport, i.e., the difference in vapor phase wateractivity between the anode and cathode, and the current density.The water flux, given by eq 8, is the sum of two terms: water
transport by diffusion and electro-osmotic drag. Both flux con-tributions are reduced by a factor that includes the ratio of thediffusion transport coefficient, km to the interfacial transportcoefficient, ki. If there were no interfacial transport resistance,ki f ∞, eq 8 reduces to eq 3. Interfacial transport resistancereduces the impact of both diffusional transport and electro-osmotic drag of water on water flux.
water flux ¼ water activity driven water transport
þ net EODwater flux ¼ kmðaanodew, g � acathodew, g Þ1 þ 2km=ki
þ ξmJ1 þ 2km=ki
ð8Þ
Figure 7. Schematic of co-current flux transport processes for protonsand water.
10247 dx.doi.org/10.1021/jp204785t |J. Phys. Chem. B 2011, 115, 10239–10250
The Journal of Physical Chemistry B ARTICLE
Electro-osmotic Drag Coefficient. The net electro-osmoticdrag coefficient (ξnet) is the change in water flux due to theapplied potential divided by the current density as given by eq 9.Net electro-osmotic drag coefficients, ξnet, are reduced fromelectro-osmotic drag within the membrane, ξm, as a result of theinterfacial transport resistance, ki.
ξnet ¼ðwater flux@Vapp > 0Þ � ðwater flux@Vapp ¼ 0Þ
J
¼ ξm1 þ 2km=ki
ð9ÞNet electro-osmotic drag coefficients, ξnet, were calculated forthe different flux configurations and are summarized in Table 3.ξnet ranges from 0.05 to 0.22, which are among the lower valuesreported in the literature. Low values of ξnet may in part be due tothe low water activities tested, but we suggest that the majorcontributor to the low values is interfacial transport resistance.Majsztrik et al.13 and Zhao et al.14 recently measured water
liquid and vapor transport coefficients for Nafion. Table 3summarizes km, ki, and the ratio of ξnet to ξm for the experimentalconditions of the present study. The values in Table 3 suggestthat ξnet is substantially reduced compared to ξm when there isonly water vapor present at the membrane interface.According to eq 9, ξnetf ξm when ki becomes large, i.e., when
there is negligible interfacial resistance for water transport.Majsztrik et al. and Zhao et al. showed that interfacial watertransport is nearly equilibrated at the liquid water/membraneinterface. Experiments with liquid water present at both sides ofthe membrane should measure net electro-osmotic drag coeffi-cients values that are close to ξm. Zawodzinski et al. carried outsuch an experiment and measured ξ between 2 and 2.9;22 this isamong the larger values of ξ reported and one we suggest is mostrepresentative of ξm. In another paper, Zawodzinski and co-workers reported lower ξ values with saturated vapor than withsaturated liquid.23We submit that the lower ξ values reported forvapor equilibrated membrane are due to the interfacial transportresistance. Experiments conducted with one or both sides of themembrane exposed to water vapor (instead of liquid water) willdetermine ξnet, and not ξm.How does temperature affect ξnet? A model for vapor/
membrane interfacial transport was developed by Monroeet al.;19 it predicted that ki should increase proportionally tothe vapor pressure of water. That prediction is consistent with theexperimental values of ki determined by Majsztrik et al.13 Zhaoet al.14 showed that the internal transport coefficient for diffusionin Nafion, km ≈ cwDm/tm, increases more slowly with tempera-ture than ki. Therefore, we predict that for the same feedwateractivity, ξnet should increase with increasing temperature. The
experimental data presented in Table 3 shows an increase in ξnetwith increasing temperature.It is difficult to attempt to rescale all the ξ values reported in
the literature because experimental details are not always fully
Table 3. Steady-State Transport: Net Electro-osmotic Drag Coefficient
configuration Jsat (A/cm2)water flux [μmol/(cm2 s)]ki [μmol/(cm2 s)]km [μmol/(cm2 s)]ξnet/ξm = 1/(1 + 2km/ki)ξnet = Δwater flux/(J/F)
co-current flux 30% RH, 37 �C 0.304 0.454 4.82� 10�6 5.23� 10�6 0.315 0.051
co-current flux 30% RH, 50 �C 0.346 0.801 6.75� 10�6 7.13� 10�6 0.321 0.108
co-current flux 30% RH, 70 �C 0.405 1.164 1.15� 10�5 9.93� 10�6 0.366 0.119
co-current flux 50% RH, 50 �C 0.664 2.179 6.75� 10�6 2.80� 10�5 0.108 0.219
co-current flux 70% RH, 50 �C 0.815 2.804 6.75� 10�6 5.39� 10�5 0.059 0.170
counter-current flux 50% RH, 50 �C 0.209 0.226 6.75� 10�6 2.20� 10�5 0.133 0.217
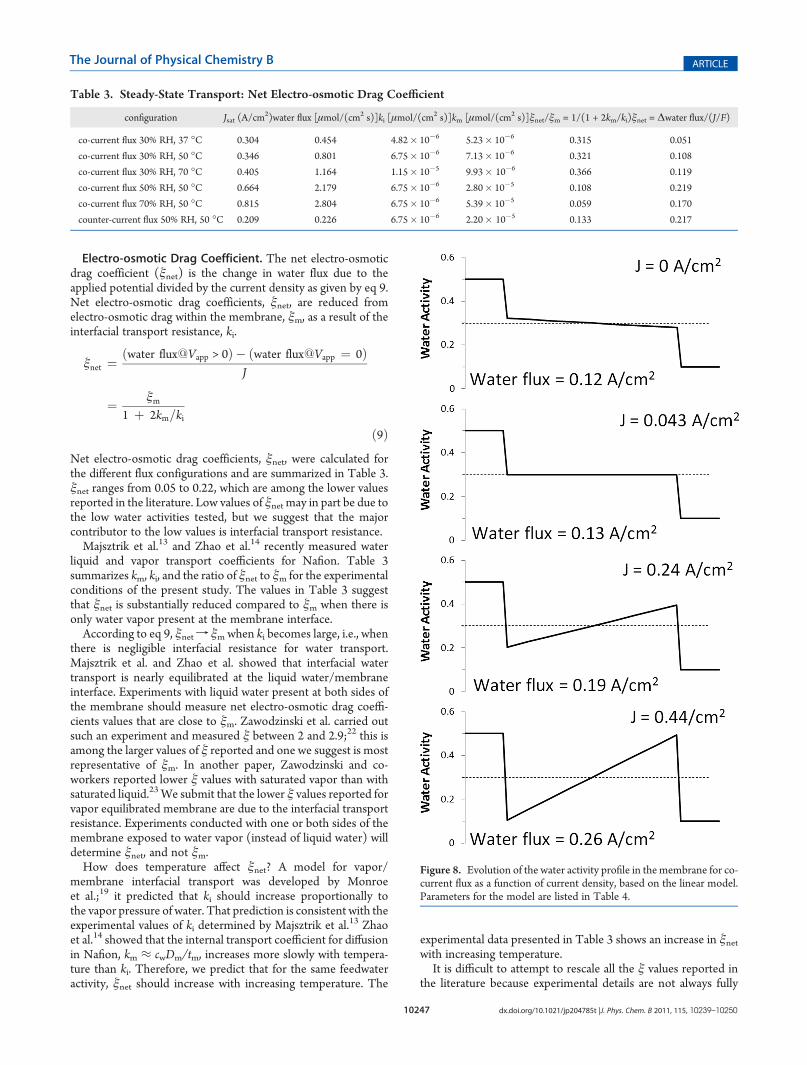
Figure 8. Evolution of the water activity profile in themembrane for co-current flux as a function of current density, based on the linear model.Parameters for the model are listed in Table 4.
10248 dx.doi.org/10.1021/jp204785t |J. Phys. Chem. B 2011, 115, 10239–10250
The Journal of Physical Chemistry B ARTICLE
documented. However, the general trend of the studies summar-ized in Table 1 shows that the studies involving liquid waterreport larger ξ values. Studies with vapor equilibrated mem-branes report reduced ξ values and these ξ values are larger whenthe temperature is higher. We suggest that many of the differ-ences in reported values of ξ may be the result of neglecting theinterfacial transport resistance at the membrane/vapor interface.Effect of the Applied Potential on Current, Water Flux,
and RMEA. The coupling of interfacial water transport withelectro-osmotic drag causes the water to redistribute across themembrane. Figure 8 shows a sequence of water activity profilesand the water flux across an MEA for increasing current densityfor co-current flux operation assuming constant values of km, ki,and ξm. The water activity profiles and water flux were calculatedfrom eqs 4�7 with fixed gas phase water activity at the anode andcathode. Averaged values of km were evaluated assuming a linearwater activity profile in the membrane.The membrane water activity decreased from anode to
cathode at open circuit (i.e., J = 0 A/cm2). As the current densityincreases, the water activity profile flipped and the water activityin the membrane increased from the anode to the cathode.Electro-osmotic drag removes water from the anode side of themembrane and interfacial transport limits restocking of waterinto the membrane, thus causing water activity at the anode todecrease.The water profiles shown in Figure 8 assumed that the current
density could be set arbitrarily. However, the current density isnot an independent parameter; it is dependent on the appliedpotential and the membrane resistance. A decrease in membranewater activity causes the membrane resistance to increase, thuslimiting the current and in turn, the electro-osmotic drag.The areal membrane resistance, Rm, is given by the integral of
the local resistivity across the membrane as shown by eq 10.
Rm ¼Z tm
0FmðawðxÞÞ dx ð10Þ
Membrane resistivity, Fm, as a function of water activity is wellapproximated by Fm = F0/aw
2 (Ω cm). Assuming a linear wateractivity gradient in the membrane (as shown in Figure 8), withaw,manode and aw,m
cathode as the water activities in the membrane at therespective interfaces, the areal membrane resistance is given byeq 11.
Rm ¼ F0tm=aanodew, m acathodew, m ð11Þ
To explicitly include the effect of applied voltage on the waterand the proton fluxes, eqs 6 and 11 were combined with eq 8 togive the expression for the water flux shown in eq 12:
water flux ¼kmðaanodew, g � acathodew, g Þ þ ξmVmaanodew,m acathodew,m
F0tm1 þ 2km=ki
ð12ÞThe linear transport model was solved as a function of appliedpotential; the values of the parameters ki, km, F0, and ξm wereestimated from literature and listed in Table 4. tm is 0.0127 cm forthe Nafion 115 membrane.The model is compared to the experimental data in Figure 3
for the co-current flux configuration. The model is semiquanti-tative, capturing the essential experimental trends with increasingapplied potential: (i) the water flux increased; (ii) the current
density initially increased linearly, followed by saturation athigher applied potentials; (iii) theMEA resistance first decreasedand then increased. The fit to the data is remarkable as the onlyadjustable parameter introduced was the intrinsic electro-osmo-tic drag coefficient; the other parameters were from independentwater uptake and transport experiments. The model did assumeaveraged parameter values based on linear water activity profiles;relaxation of that assumption would improve the quantitative fitto the data.The minimum in the MEA resistance coincides with the water
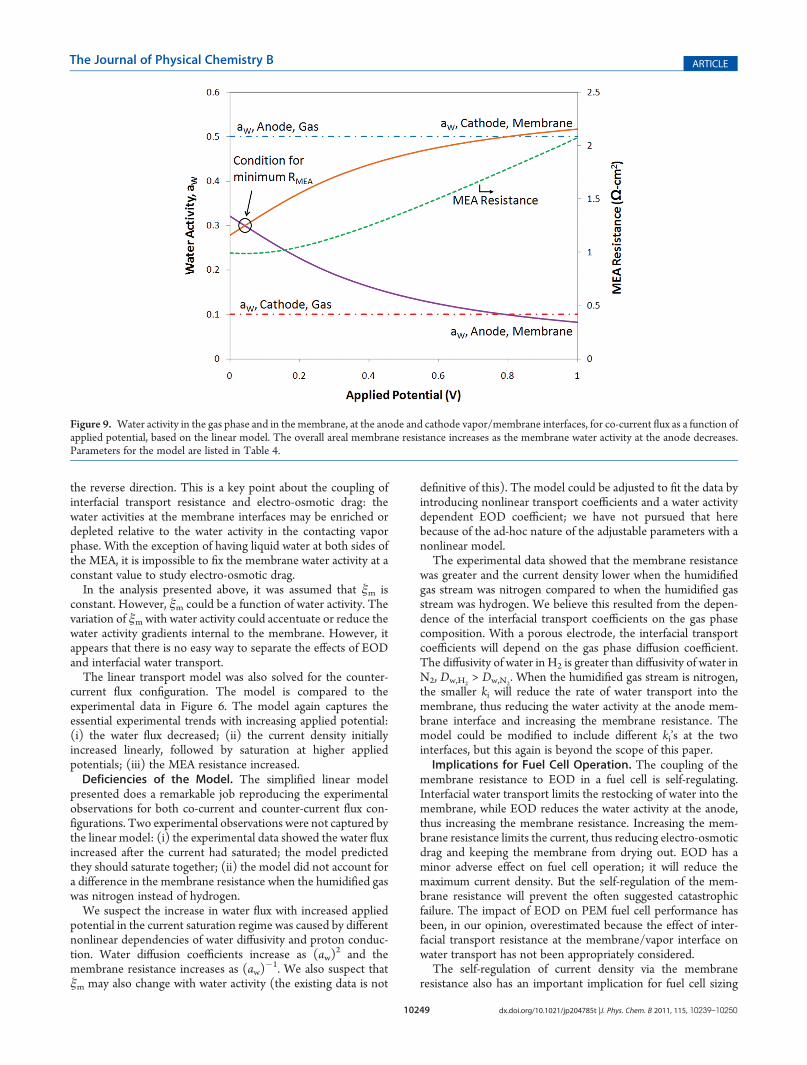
activity becoming uniform within the membrane. The wateractivity profile in the membrane changes with increasing appliedpotential due to the redistribution of water. Figure 9 shows thechange in the water activity as functions of the applied potential,both in the vapor and in the membrane, at the anode and cathodesides of the membrane. Coupling of EOD and interfacial watertransport causes the membrane water activity to decrease at theanode and increase at the cathode. The current density and waterflux both saturate and the membrane water activity approaches alimiting value. As EOD depletes water from the anode side of themembrane, the local membrane resistivity increases rapidly andthe overall MEA resistance increases superlinearly, as shown inFigure 9.The large increase in resistance limits the current density; the
membrane is self-regulating. If EOD starts to dry out themembrane, then the membrane resistance increases, limitingthe current, keeping the membrane from further drying out.Figure 9 shows how the water activity at the anode side of themembrane approaches a limiting value of aw,m
anode f 0.1 withincreasing applied potential. Experimentally, this self-regulationis seen in Figure 2 at hours 8�10. The increase in appliedpotential caused the current to increase, which led to a redis-tribution of the water in the membrane that increased themembrane resistance. As the membrane resistance increased,the current decrease to its steady-state value. At steady state, theinterfacial transport of water into the membrane at the anode isbalanced by the electro-osmotic drag of water away from theanode and the back-diffusion of water from the cathode to theanode (because the water activity is increasing from the anode tothe cathode; refer to Figure 8 for J > 0.043 A/cm2).Figures 8 and 9 highlight how electro-osmotic drag causes a
redistribution of water in the membrane. Even though theexternal water activities at the anode and cathode may be fixed,the water activity gradient internal to the membrane may be in
Table 4. Model Parameter Values
parameter values
specific resistivity, F0 7.0 Ω cm
membrane thickness, tm 0.0127 cm
interfacial transport coefficient, ki 6.75 μmol/(cm2 s)
intrinsic electro-osmotic drag coefficient, ξm 3
co-current flux configuration:
water activity of the anode vapor phase, aw,ganode 0.5
water activity of the cathode vapor phase, aw,gcathode 0.1
internal transport coefficient for diffusion, km 28.0 μmol/(cm2 s)
counter-current flux configuration:
water activity of the anode vapor phase, aw,ganode 0.05
water activity of the cathode vapor phase, aw,gcathode 0.5
internal transport coefficient for diffusion, km 22.0 μmol/(cm2 s)
10249 dx.doi.org/10.1021/jp204785t |J. Phys. Chem. B 2011, 115, 10239–10250
The Journal of Physical Chemistry B ARTICLE
the reverse direction. This is a key point about the coupling ofinterfacial transport resistance and electro-osmotic drag: thewater activities at the membrane interfaces may be enriched ordepleted relative to the water activity in the contacting vaporphase. With the exception of having liquid water at both sides ofthe MEA, it is impossible to fix the membrane water activity at aconstant value to study electro-osmotic drag.In the analysis presented above, it was assumed that ξm is
constant. However, ξm could be a function of water activity. Thevariation of ξm with water activity could accentuate or reduce thewater activity gradients internal to the membrane. However, itappears that there is no easy way to separate the effects of EODand interfacial water transport.The linear transport model was also solved for the counter-
current flux configuration. The model is compared to theexperimental data in Figure 6. The model again captures theessential experimental trends with increasing applied potential:(i) the water flux decreased; (ii) the current density initiallyincreased linearly, followed by saturation at higher appliedpotentials; (iii) the MEA resistance increased.Deficiencies of the Model. The simplified linear model
presented does a remarkable job reproducing the experimentalobservations for both co-current and counter-current flux con-figurations. Two experimental observations were not captured bythe linear model: (i) the experimental data showed the water fluxincreased after the current had saturated; the model predictedthey should saturate together; (ii) the model did not account fora difference in the membrane resistance when the humidified gaswas nitrogen instead of hydrogen.We suspect the increase in water flux with increased applied
potential in the current saturation regime was caused by differentnonlinear dependencies of water diffusivity and proton conduc-tion. Water diffusion coefficients increase as (aw)
2 and themembrane resistance increases as (aw)
�1. We also suspect thatξm may also change with water activity (the existing data is not
definitive of this). The model could be adjusted to fit the data byintroducing nonlinear transport coefficients and a water activitydependent EOD coefficient; we have not pursued that herebecause of the ad-hoc nature of the adjustable parameters with anonlinear model.The experimental data showed that the membrane resistance
was greater and the current density lower when the humidifiedgas stream was nitrogen compared to when the humidified gasstream was hydrogen. We believe this resulted from the depen-dence of the interfacial transport coefficients on the gas phasecomposition. With a porous electrode, the interfacial transportcoefficients will depend on the gas phase diffusion coefficient.The diffusivity of water in H2 is greater than diffusivity of water inN2, Dw,H2
> Dw,N2. When the humidified gas stream is nitrogen,
the smaller ki will reduce the rate of water transport into themembrane, thus reducing the water activity at the anode mem-brane interface and increasing the membrane resistance. Themodel could be modified to include different ki’s at the twointerfaces, but this again is beyond the scope of this paper.Implications for Fuel Cell Operation. The coupling of the
membrane resistance to EOD in a fuel cell is self-regulating.Interfacial water transport limits the restocking of water into themembrane, while EOD reduces the water activity at the anode,thus increasing the membrane resistance. Increasing the mem-brane resistance limits the current, thus reducing electro-osmoticdrag and keeping the membrane from drying out. EOD has aminor adverse effect on fuel cell operation; it will reduce themaximum current density. But the self-regulation of the mem-brane resistance will prevent the often suggested catastrophicfailure. The impact of EOD on PEM fuel cell performance hasbeen, in our opinion, overestimated because the effect of inter-facial transport resistance at the membrane/vapor interface onwater transport has not been appropriately considered.The self-regulation of current density via the membrane
resistance also has an important implication for fuel cell sizing
Figure 9. Water activity in the gas phase and in the membrane, at the anode and cathode vapor/membrane interfaces, for co-current flux as a function ofapplied potential, based on the linear model. The overall areal membrane resistance increases as the membrane water activity at the anode decreases.Parameters for the model are listed in Table 4.
10250 dx.doi.org/10.1021/jp204785t |J. Phys. Chem. B 2011, 115, 10239–10250
The Journal of Physical Chemistry B ARTICLE
and control. The dynamic data showed that in the current satura-tion regime, when there was a step change in potential, the cur-rent can peak at almost 1.5 times its saturation value for ∼100 s.Fuel cell sizing is often based on peak power. But if the peakpower is only required intermittently for short periods of time(e.g., during engine acceleration), it may be possible to employsmaller fuel cells whose size is based on the steady-staterequirements.
’CONCLUSIONS
The present study showed that interfacial water transportplays a dominant role in the coupling of water and protontransport in Nafion. The key results are1. The dynamic changes in current, water flux, and MEA
resistance to step changes in applied potential, with a timeconstant of ∼3000 s, strongly suggest that water redis-tributes in the membrane due to the coupling of interfacialwater transport in and out of the Nafion membrane, andelectro-osmotic drag (EOD) inside the membrane.
2. Interfacial water transport resistance limits the rate at whichwater can enter or leave Nafion membranes. Both waterdiffusion and electro-osmotic drag in the membrane arereduced by the ratio of the diffusion transport coefficient tothe interfacial transport coefficient.
3. The net EOD is less than the intrinsic EOD internal to theNafion membrane because of interfacial transport resis-tance at the vapor/membrane interface. The differencebetween ξnet and ξm is minimized with liquid equilibratedmembranes.
4. EOD affects the water activity profile in the membrane,which in turn affects proton transport and water transportbecause both these transport processes are dependent onwater activity.
5. At low applied potentials, the protonic current increasedwith potential. For larger applied potentials, the currentsaturated. The saturation current increased with increasedfeedwater activity. The saturation current is controlled by abalance of interfacial water transport across the membrane/vapor interface, diffusion to the interface, and electro-osmotic drag away from the interface.
6. Interfacial transport resistance at the vapor/membraneinterface retains water in Nafion membranes in fuel cells,thus reducing the effect of electro-osmotic drag on overallwater flux.
7. Feedback coupling between electro-osmotic drag andmembrane resistance self-regulates the current in PEMfuel cells.
’ASSOCIATED CONTENT
bS Supporting Information. The complete data sets for (i)the dynamic data presented in Figure 2, (ii) the co-current steadystate-data presented in Figure 3, and (iii) the counter-currentsteady-state data presented in Figure 6, are available as Excelfiles. This material is available free of charge via the Internet athttp://pubs.acs.org.
’AUTHOR INFORMATION
Corresponding Author*Phone: (609) 258-5416. Fax: (609) 258-0211. E-mail: [email protected].
’ACKNOWLEDGMENT
We thank the National Science Foundation (CBET-0754715)and Department of Energy (DE-SC-0002097) for partial supportof this work. M.J.C. also thanks the Princeton University Programin Plasma Science and Technology for partial support under U.S.Department of Energy contract No. DE-AC02-76-CHO-3073.
’REFERENCES
(1) Eikerling, M.; Kharkats, Y. I.; Kornyshev, A. A.; Volfkovich, Y. M.J. Electrochem. Soc. 1998, 145, 2684.
(2) Buchi, F. N.; Scherer, G. G. J. Electrochem. Soc. 2001, 148, A183.(3) Buchi, F. N.; Srinivasan, S. J. Electrochem. Soc. 1997, 144, 2767.(4) Williams, M. V.; Kunz, H. R.; Fenton, J. M. J. Power Sources 2004,
135, 122.(5) Siegel, J. B.; McKay, D. A.; Stefanopoulou, A. G.; Hussey, D. S.;
Jacobson, D. L. J. Electrochem. Soc. 2008, 155, B1168.(6) Dhar, H. P. J. Power Sources 2005, 143, 185.(7) Hogarth, W. H. J.; Benziger, J. B. J. Power Sources 2006, 159, 968.(8) Kreuer, K. D. Chem. Mater. 1996, 8, 610.(9) Elliott, J. A.; Paddison, S. J. Phys. Chem. Chem. Phys. 2007,
9, 2602.(10) Eikerling, M.; Kornyshev, A. A.; Kuznetsov, A. M.; Ulstrup, J.;
Walbran, S. J. Phys. Chem. B 2001, 105, 3646.(11) Choi, P.; Jalani, N. H.; Datta, R. J. Electrochem. Soc. 2005,
152, E123.(12) Pivovar, B. S. Polymer 2006, 47, 4194.(13) Majsztrik, P.; Bocarsly, A.; Benziger, J. J. Phys. Chem. B 2008,
112, 16280.(14) Zhao, Q. A.; Majsztrik, P.; Benziger, J. J. Phys. Chem. B 2011,
115, 2717.(15) Majsztrik, P. W.; Satterfield, M. B.; Bocarsly, A. B.; Benziger,
J. B. J. Membr. Sci. 2007, 301, 93.(16) Rohland, B.; Eberle, K.; Strobel, R.; Scholta, J.; Garche, J.
Electrochim. Acta 1998, 43, 3841.(17) Casati, C.; Longhi, P.; Zanderighi, L.; Bianchi, F. J. Power
Sources 2008, 180, 103.(18) Satterfield, M. B.; Benziger, J. B. J. Phys. Chem. B 2008,
112, 3693.(19) Monroe, C.W.; Romero, T.; Merida, W.; Eikerling, M. J. Membr.
Sci. 2008, 324, 1.(20) Adachi, M.; Navessin, T.; Xie, Z.; Li, F. H.; Tanaka, S.;
Holdcroft, S. J. Membr. Sci. 2010, 364, 183.(21) Kientiz, B.; Yamada, H.; Nonoyama, N.;Weber, A. Z. J. Fuel Cell
Sci. Technol. 2011, 8, 011013.(22) Zawodzinski, T. A.; Springer, T. E.; Davey, J.; Jestel, R.; Lopez,
C.; Valerio, J.; Gottesfeld, S. J. Electrochem. Soc. 1993, 140, 1981.(23) Zawodzinski, T. A.; Davey, J.; Valerio, J.; Gottesfeld, S. Electro-
chim. Acta 1995, 40, 297.(24) Fuller, T. F.; Newman, J. J. Electrochem. Soc. 1992, 139, 1332.(25) Gallagher, K. G.; Pivovar, B. S.; Fuller, T. F. J. Electrochem. Soc.
2009, 156, B330.(26) Xie, G.; Okada, T. J. Electrochem. Soc. 1995, 142, 3057.(27) Ise, M.; Kreuer, K. D.; Maier, J. Solid State Ion. 1999, 125, 213.(28) Ren, X. M.; Gottesfeld, S. J. Electrochem. Soc. 2001, 148, A87.(29) Park, Y. H.; Caton, J. A. Int. J. Hydrog. Energy 2008, 33, 7513.(30) Weng, D.; Wainright, J. S.; Landau, U.; Savinell, R. F.
J. Electrochem. Soc. 1996, 143, 1260.(31) Ge, S. H.; Yi, B. L.; Ming, P. W. J. Electrochem. Soc. 2006,
153, A1443.(32) Ye, X. H.; Wang, C. Y. J. Electrochem. Soc. 2007, 154, B676.(33) Luo, Z. P.; Chang, Z. Y.; Zhang, Y. X.; Liu, Z.; Li, J. Int.
J. Hydrogen Energy 2010, 35, 3120.