Embed Size (px)
Citation preview
【연구논문】
Effects of Free Trade Agreements and Market Openness on U.S. Export Diversification
Geary Choe(Seoul National University)
Ⅰ. Introduction
According to classical international trade theories such as the
Ricardian Model or the Heckscher-Ohlin Model, it is beneficial for
countries to specialize in and export those goods in which they have
a comparative advantage.1) By doing so, the countries may export
more and ultimately grow faster. The 20th century saw how powerful
export-driven growth is through the experiences of Japan, Korea, and
Taiwan, among others. Yet, in the process of pursuing more exportation,
countries should be careful with regard to the degree to which they
specialize because specialization inevitably increases export risk. The
export risk emerges in two forms: product risk and market risk.2)
1) Paul R. Krugman and Maurice Obstfeld. International Economics: Theory & Policy, 8th Edition (New York: Prentice Hall, 2009).
2) Christian Wilhelms, “Export Diversification in Latin America,” Intereconomics 2
36 Geary Choe
Product risk can be easily illustrated by the example of oil
exporters. In countries like Lybia, Nigeria, Saudi Arabia, Iran, Venezuela,
Yemen and Gabon, petroleum occupies more than three quarters of
their total export value.3) Whenever the price of petroleum suddenly
drops, their national economies suffer greatly. Therefore, for all countries,
comparative advantage might actually make them worse off-unlike
what classical international economists had argued.
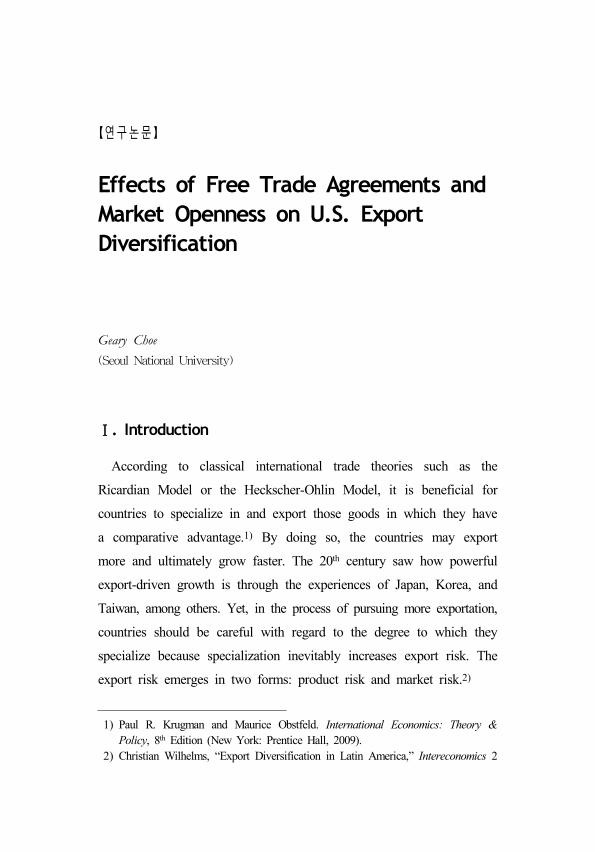
Another form of risk, market risk, literally means risks associated
with markets (i.e. importing countries). Canada’s export reliance on a
single economy, the United States clearly shows detrimental effects of
the market risk. As shown in Figure 1, from 1988 to 2010, more than
70% of Canada’s total exports are continuously directed to the United
States alone. As a result, following the 2008 Global Financial Crisis,
the Canadian economy suffered more than that of the United States,
the origin of the subprime mortgage crisis. From Figure 1, it can be
seen that when the United States, deep in the crisis, had to reduce its
imports dramatically in 2009, Canada took significant heat. Canada’s
total value of exports to the world was reduced by about the same
magnitude as its decreased value of exports to the United States. This
drastic decrease in Canadian exports led Canada’s GDP to shrink as
well. Whereas the real U.S. GDP shrank by 2.54% in 2009, the
Canadian economy registered a shockingly bad -5.45% growth.4)
(1967): 46-48.3) Luisito Bertinelli, Veronique Salins, and Eric Strobl. “Export Diversification and
Price Uncertainty in Sub-Saharan Africa and Other Developing Countries: A Portfolio Theory Approach,” Working Paper, Ecolé Polytechnique, Paris (2006).
4) My own calculations using the Penn World Table 7.0, Center for International Comparisons of Production, Income and Prices (University of Pennsylvania), http://pwt.econ.upenn.edu/. In calculating Canada’s growth rate, I simply
Effects of Free Trade Agreements 37
Source: UN Comtrade Database (SITC Rev.3 Total)
Figure 1: Canada’s Export Reliance on the U.S. Market5) (1988-2010)
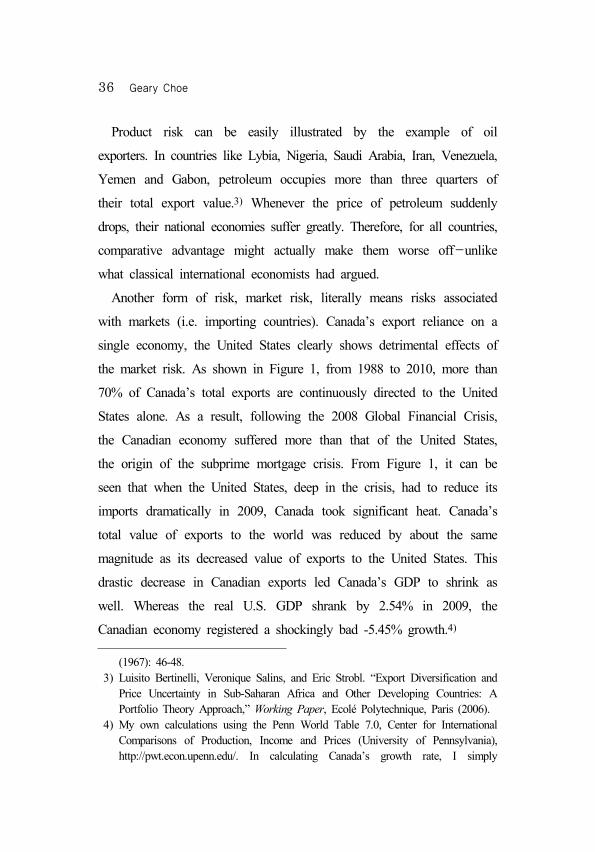
As illustrated by the above example, market risk could be just as
daunting as is the product risk. However, the Figure 2 shows that the
Source: U.N. Comtrade (SITC Rev.1 Total)
Figure 2: Number of Export Markets [World’s Top 7 Exporters]6) (1964-2009)
subtracted Canada’s 2008 GDP from its 2009 GDP and divided the result by its 2008 GDP, using tcgdp data provided by the Penn World Table 7.0 (Total PPP Converted GDP, G-K method, at current prices). The same method applies to calculating the growth rate of the United States.
5) Export values are in billion U.S. dollars.
38 Geary Choe
United States has diversified its export markets relatively well and
since mid-1990, has been exporting to almost all the countries in the
world. Hence, this paper focuses only on the product side of the story.
Raul Prebisch and Hans Singer in 1950 warned of the detrimental
effects of trade shocks in countries that depend on a few products for
their export earnings. Similarly, Murray C. Kemp and Nissan Liviatan,
Roy Ruffin, Ravi Batra, and James E. Anderson and John G. Riley
have all pointed out that basic implications of international trade
theory, such as comparative advantage and H-O theory, may no longer
be valid when considered within the context of uncertainty and risk
aversion.7) This has led scholars to devise export diversification
strategies that help countries make their export earnings less volatile to
external shocks. Manuel R. Agosin argued that the greater the degree
of export diversification, the less volatile will be export earnings.8) In
turn, less volatile exports are associated with lower variances of GDP
growth. Thus, export diversification is highly desirable.
Yet, most economists-even American ones as well-study export
6) WTO Press Release, “Trade growth to ease in 2011 but despite 2010 record surge, crisis hangover persists.” 2011 (2011. 11. 22: http://www.wto.org/english/news _e/pres11_e/pr628_e.htm). According to the press release, the seven largest exporters as of 2010 are China, Germany, United States, Japan, France, Netherlands, and Korea.
7) Murray C. Kemp and Nissan Liviatan. “Production and Trade Patterns under Uncertainty,” Economic Record 49 (1973): 215-227; Ruffin, Roy. “International Trade under Uncertainty,” Journal of International Economics 4 (1974): 243-259; Batra, Ravi. “Production Uncertainty and the Heckscher-Ohlin Theorem,” Review of Economic Studies 69 (1975): 259-268; Anderson, James E., and John G. Riley. “International Trade with Fluctuating Prices,” International Economic Review 17 (1976): 76-97.
8) Manuel R. Agosin, “Export Diversification and Growth in Emerging Economies,” Working Paper (no. 233), Universidad de Chile (2007).
Effects of Free Trade Agreements 39
diversification of developing countries only and not of the wealthy
United States. In particular, besides NAFTA, not many literatures
exist on effects of the U.S. FTAs on its export diversification.
Moreover, even when the scholars do study NAFTA, empirical
evidence on the effects of FTAs on export diversification is, at best,
mixed. Russell Hillberry and Christine McDaniel claim that NAFTA
resulted in a large extensive margin in post-NAFTA trade growth.9)
On the other hand, Styliani Christodoulopoulou and Pushan Dutt,
Ilian Mihov and Timothy Van Zandt argue that the intensive margin
grew much more due to FTAs.10)
Currently, the U.S. has FTA in force with 17 countries. In 2009,
the US export to FTA partners represented 40% of total US export,
and the import to these countries represented 30% of US import-and
the shares are on the rise.11) In addition, the growth in US exports
to its FTA partners from 2009 to 2010 has been 23%, which is
larger than exports to the rest of the world that grew by 20%.12) As
9) Russel Hillberry and Christine McDaniel. “A Decomposition of North American Trade Growth Since NAFTA,” International Economic Review, USITC Publication 3527 (2002): 1-6.
10) Styliani Christodoulopoulou, “The Effects of Multilateral Trade Liberalization on the Extensive and the Intensive Margins of Trade,” Munich Personal RePEC Archive Working Paper No. 29169 (2010); Dutt, Pushan, Ilian Mihov and Timothy Van Zandt. “Does WTO Matter for the Extensive and the Intensive Margins of Trade?” unpublished thesis, INSEAD (2011). Extensive margins and intensive margins are indices employed by trade economists to indicate the degree of export diversification. The intensive margin measures if a country is exporting larger quantities of each good while the extensive margin considers if the country is exporting a wider set of goods.
11) My own calculation using UN Comtrade Database (SITC Rev.3 Total). 12) Office of the United States Trade Representative. “U.S. Free Trade Agreements.”
2011. (2011. 11. 21: http://export.gov/FTA/index.asp).
40 Geary Choe
the WTO Doha Development Agenda negotiations have been stalled,
the United States focuses more heavily on bilateral or regional trade
arrangements. This trend makes it relevant and timely to discuss the
effects of FTAs on the U.S. export diversification.
Another point of interest is trade openness with respect to U.S.
partner countries. In WTO DDA negotiations and other bilateral or
regional trade arrangement negotiations, the U.S. is well known for
urging its trade partners to open up more. Therefore, this paper also
tries to see if the U.S. has a valid reason to do so.
The purpose of this paper is thus three-fold. It aims to conduct a
comprehensive study on the effects of U.S. FTAs on U.S. export
diversification. Another objective is to analyze how trade openness of
its partner countries affects U.S. export diversification. Lastly, the
paper concludes by suggesting some policy implications.
The rest of this paper will be addressed as follows: Section II
discusses ways to measure export diversification such as the widely
used Herfindahl-Hirschman Index and methodology to decompose
exports into intensive and extensive margins. In addition, equations
for gravity model estimations are provided. Section III introduces data
used in the paper. Data are mainly retrieved from three sources: UN
Comtrade Database, Penn World Tables and International Trade Data.
Section IV is devoted to analyzing the calculated margins and
empirical results. Lastly, section V concludes the paper.
Effects of Free Trade Agreements 41
Ⅱ. Methodology
1. Herfindahl-Hirschman Index
In order to measure export diversification, the paper employs a
number of methods such as measuring the degree to which exports are
concentrated, counting categories exported, and weighting categories of
goods by their overall importance in exports to a given country.
Firstly, the widely used Herfindahl-Hirschman Index, which measures
export concentration, is used to estimate the degree of U.S. export
diversification. The equation is as follows:
1)
In the paper, Sij is the share of jth commodity in the U.S. export
to its FTA partner i in a given year. In the original HHI which
ranges from 0 to 1; 0 means perfect diversification while 1 stands
for perfect concentration. In this paper, I subtracted the resulting HHI
from 1 so that as the number approaches 1, it would mean a higher
degree of diversification.
2. Number of U.S. Export Goods
As another measure of export diversification, the number of U.S.
export products to each FTA partner country is also used. An
increase in the number of products may be interpreted as an increase
in diversification and vice versa. However, simply counting the
numbers does not take into account each product’s share. Therefore, I
do not expect the number of products to be a highly precise
42 Geary Choe
measure. It nevertheless carries some value as it is always readily
available and thus easy to apply.
3. Intensive and Extensive Margins
As briefly mentioned above, the Herfindahl-Hirschman Index only
allows for a rough estimation of concentration at best; similarly,
simply counting the number of products does not take into account
volume. To solve these problems, David Hummels and Peter J.
Klenow’s intensive and extensive margins of trade have also been
used.13) Hummels and Klenow’s intensive and extensive margins are
calculated as follows:
2) ∑∈
∑∈
3) ∑∈
∑∈
i stands for a product and I denotes the total product basket. j is a
U.S. FTA partner country at concern and w is the world. Therefore,
Vwi stands for value of the U.S. exports in commodity i to the world.
Similarly, Vji is the value of the U.S. exports in commodity i to its
FTA partner country j.
The intensive margin measures if the United States is exporting
larger quantities of each good while the extensive margin considers if
the United States is exporting a wider set of goods. For this paper’s
purpose of measuring export diversification, the extensive margin is
13) David Hummels and Peter J. Klenow. “The Variety and Quality of a Nation’s Exports,” American Economic Review 95(3) (2005): 704-723.
Effects of Free Trade Agreements 43
more relevant.
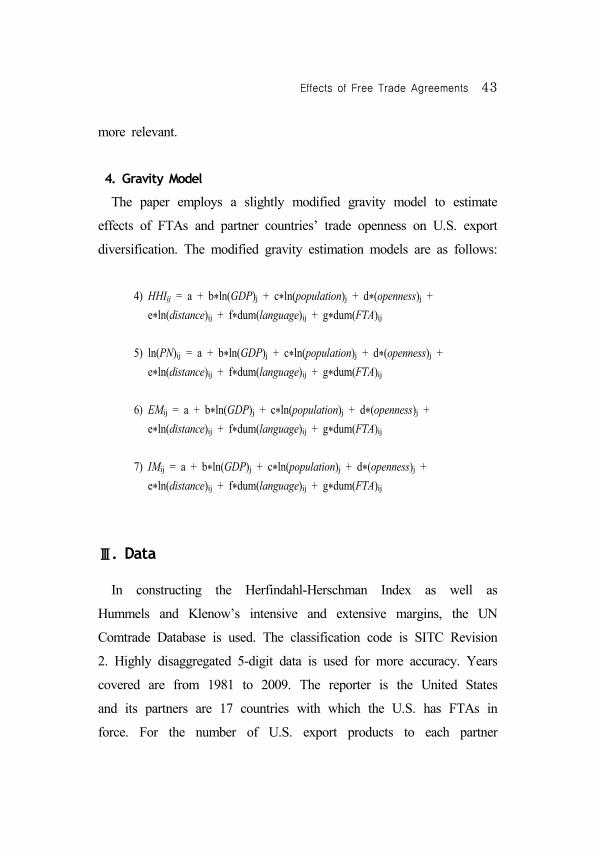
4. Gravity Model
The paper employs a slightly modified gravity model to estimate
effects of FTAs and partner countries’ trade openness on U.S. export
diversification. The modified gravity estimation models are as follows:
4) HHIij = a + b*ln(GDP)j + c*ln(population)j + d*(openness)j + e*ln(distance)ij + f*dum(language)ij + g*dum(FTA)ij
5) ln(PN)ij = a + b*ln(GDP)j + c*ln(population)j + d*(openness)j + e*ln(distance)ij + f*dum(language)ij + g*dum(FTA)ij
6) EMij = a + b*ln(GDP)j + c*ln(population)j + d*(openness)j + e*ln(distance)ij + f*dum(language)ij + g*dum(FTA)ij
7) IMij = a + b*ln(GDP)j + c*ln(population)j + d*(openness)j + e*ln(distance)ij + f*dum(language)ij + g*dum(FTA)ij
Ⅲ. Data
In constructing the Herfindahl-Herschman Index as well as
Hummels and Klenow’s intensive and extensive margins, the UN
Comtrade Database is used. The classification code is SITC Revision
2. Highly disaggregated 5-digit data is used for more accuracy. Years
covered are from 1981 to 2009. The reporter is the United States
and its partners are 17 countries with which the U.S. has FTAs in
force. For the number of U.S. export products to each partner
44 Geary Choe
country, I simply counted the 5-digit data from 1981 to 2009.
Traditional gravity model variables such as distance and common
language data are retrieved from International Trade Data website created
by Professor Jon Haveman of Macalester College. GDP, population and
trade openness data are taken from the Penn World Table version 7.0.
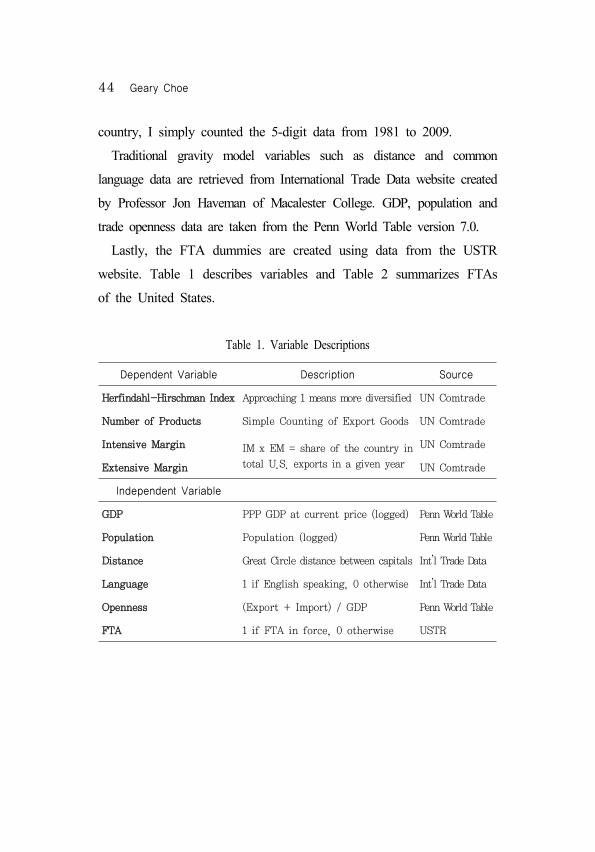
Lastly, the FTA dummies are created using data from the USTR
website. Table 1 describes variables and Table 2 summarizes FTAs
of the United States.
Dependent Variable Description Source
Herfindahl-Hirschman Index Approaching 1 means more diversified UN Comtrade
Number of Products Simple Counting of Export Goods UN Comtrade
Intensive Margin IM x EM = share of the country in
total U.S. exports in a given year
UN Comtrade
Extensive Margin UN Comtrade
Independent Variable
GDP PPP GDP at current price (logged) Penn World Table
Population Population (logged) Penn World Table
Distance Great Circle distance between capitals Int’l Trade DataLanguage 1 if English speaking, 0 otherwise Int’l Trade DataOpenness (Export + Import) / GDP Penn World Table
FTA 1 if FTA in force, 0 otherwise USTR
Table 1. Variable Descriptions
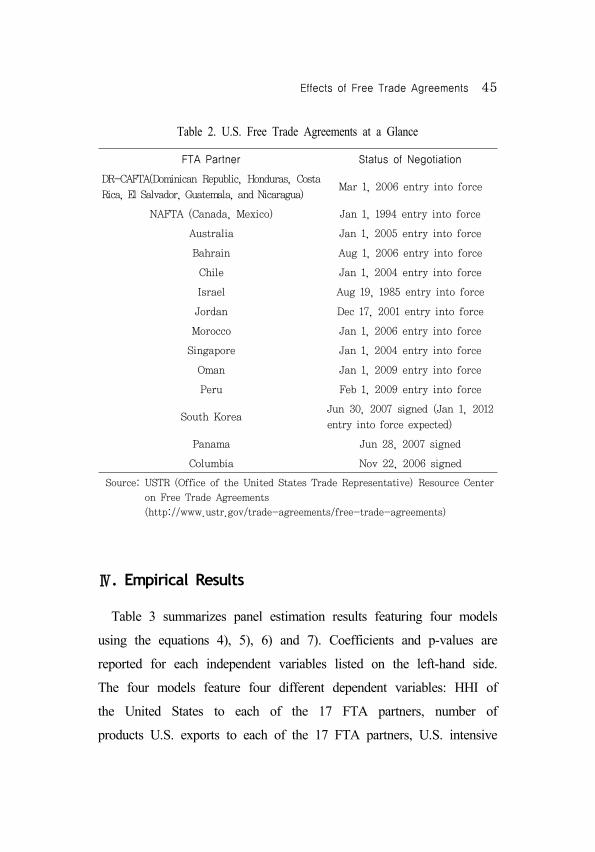
Effects of Free Trade Agreements 45
FTA Partner Status of Negotiation
DR-CAFTA(Dominican Republic, Honduras, Costa
Rica, El Salvador, Guatemala, and Nicaragua)Mar 1, 2006 entry into force
NAFTA (Canada, Mexico) Jan 1, 1994 entry into force
Australia Jan 1, 2005 entry into force
Bahrain Aug 1, 2006 entry into force
Chile Jan 1, 2004 entry into force
Israel Aug 19, 1985 entry into force
Jordan Dec 17, 2001 entry into force
Morocco Jan 1, 2006 entry into force
Singapore Jan 1, 2004 entry into force
Oman Jan 1, 2009 entry into force
Peru Feb 1, 2009 entry into force
South KoreaJun 30, 2007 signed (Jan 1, 2012
entry into force expected)
Panama Jun 28, 2007 signed
Columbia Nov 22, 2006 signed
Source: USTR (Office of the United States Trade Representative) Resource Center
on Free Trade Agreements
(http://www.ustr.gov/trade-agreements/free-trade-agreements)
Table 2. U.S. Free Trade Agreements at a Glance
Ⅳ. Empirical Results
Table 3 summarizes panel estimation results featuring four models
using the equations 4), 5), 6) and 7). Coefficients and p-values are
reported for each independent variables listed on the left-hand side.
The four models feature four different dependent variables: HHI of
the United States to each of the 17 FTA partners, number of
products U.S. exports to each of the 17 FTA partners, U.S. intensive
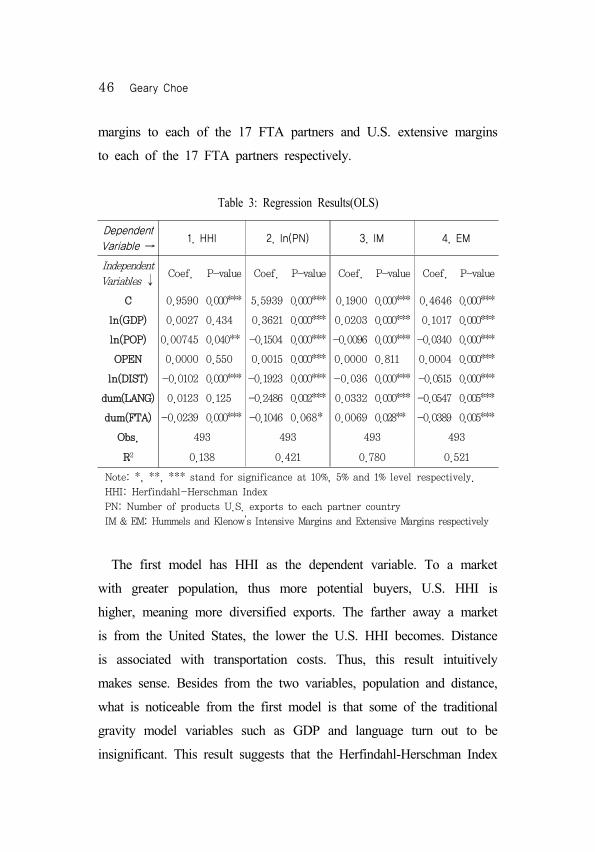
46 Geary Choe
margins to each of the 17 FTA partners and U.S. extensive margins
to each of the 17 FTA partners respectively.
Dependent Variable →
1. HHI 2. ln(PN) 3. IM 4. EM
Independent
Variables ↓ Coef. P-value Coef. P-value Coef. P-value Coef. P-value
C 0.9590 0.000*** 5.5939 0.000*** 0.1900 0.000*** 0.4646 0.000***
ln(GDP) 0.0027 0.434 0.3621 0.000*** 0.0203 0.000*** 0.1017 0.000***
ln(POP) 0.00745 0.040** -0.1504 0.000*** -0.0096 0.000*** -0.0340 0.000***
OPEN 0.0000 0.550 0.0015 0.000*** 0.0000 0.811 0.0004 0.000***
ln(DIST) -0.0102 0.000*** -0.1923 0.000*** -0.036 0.000*** -0.0515 0.000***
dum(LANG) 0.0123 0.125 -0.2486 0.002*** 0.0332 0.000*** -0.0547 0.005***
dum(FTA) -0.0239 0.000*** -0.1046 0.068* 0.0069 0.028** -0.0389 0.005***
Obs. 493 493 493 493
R2 0.138 0.421 0.780 0.521
Note: *, **, *** stand for significance at 10%, 5% and 1% level respectively.
HHI: Herfindahl-Herschman Index
PN: Number of products U.S. exports to each partner country
IM & EM: Hummels and Klenow’s Intensive Margins and Extensive Margins respectively
Table 3: Regression Results(OLS)
The first model has HHI as the dependent variable. To a market
with greater population, thus more potential buyers, U.S. HHI is
higher, meaning more diversified exports. The farther away a market
is from the United States, the lower the U.S. HHI becomes. Distance
is associated with transportation costs. Thus, this result intuitively
makes sense. Besides from the two variables, population and distance,
what is noticeable from the first model is that some of the traditional
gravity model variables such as GDP and language turn out to be
insignificant. This result suggests that the Herfindahl-Herschman Index
Effects of Free Trade Agreements 47
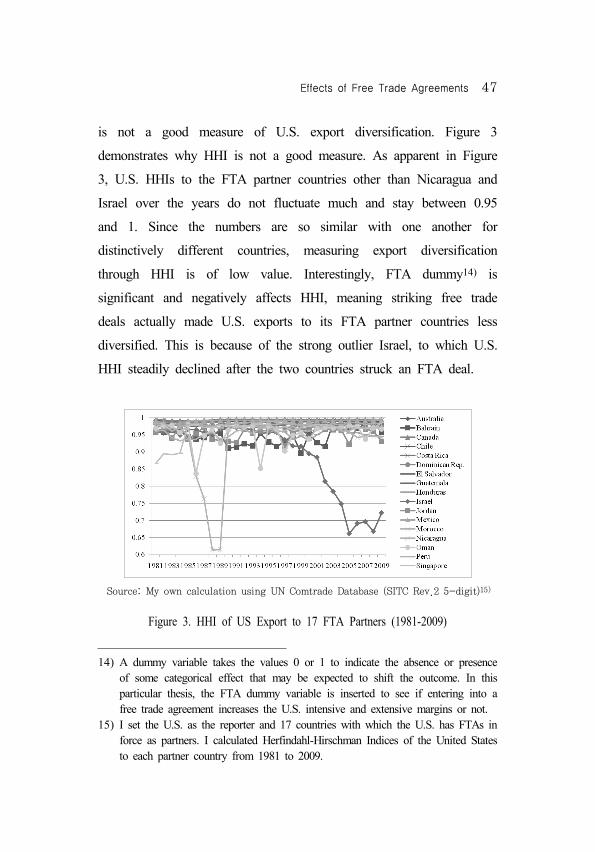
is not a good measure of U.S. export diversification. Figure 3
demonstrates why HHI is not a good measure. As apparent in Figure
3, U.S. HHIs to the FTA partner countries other than Nicaragua and
Israel over the years do not fluctuate much and stay between 0.95
and 1. Since the numbers are so similar with one another for
distinctively different countries, measuring export diversification
through HHI is of low value. Interestingly, FTA dummy14) is
significant and negatively affects HHI, meaning striking free trade
deals actually made U.S. exports to its FTA partner countries less
diversified. This is because of the strong outlier Israel, to which U.S.
HHI steadily declined after the two countries struck an FTA deal.
Source: My own calculation using UN Comtrade Database (SITC Rev.2 5-digit)15)
Figure 3. HHI of US Export to 17 FTA Partners (1981-2009)
14) A dummy variable takes the values 0 or 1 to indicate the absence or presence of some categorical effect that may be expected to shift the outcome. In this particular thesis, the FTA dummy variable is inserted to see if entering into a free trade agreement increases the U.S. intensive and extensive margins or not.
15) I set the U.S. as the reporter and 17 countries with which the U.S. has FTAs in force as partners. I calculated Herfindahl-Hirschman Indices of the United States to each partner country from 1981 to 2009.
48 Geary Choe
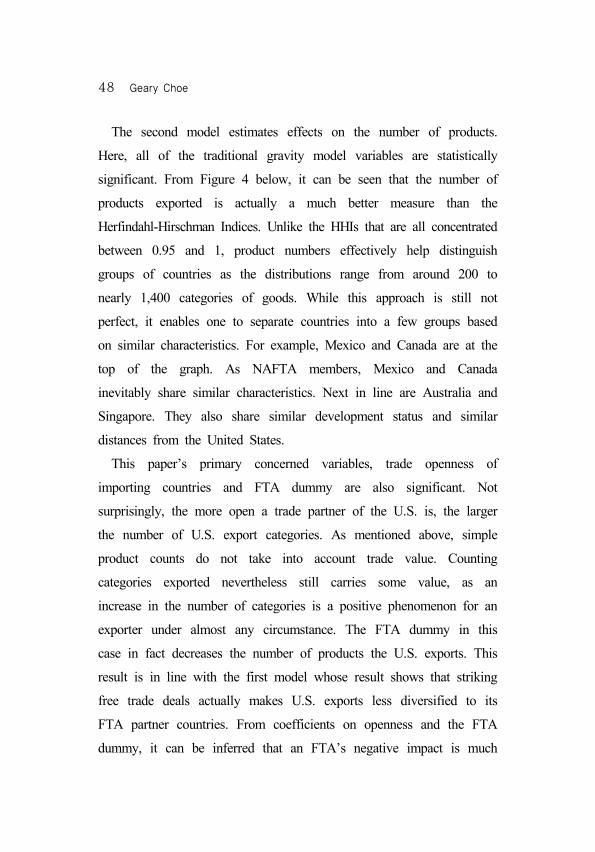
The second model estimates effects on the number of products.
Here, all of the traditional gravity model variables are statistically
significant. From Figure 4 below, it can be seen that the number of
products exported is actually a much better measure than the
Herfindahl-Hirschman Indices. Unlike the HHIs that are all concentrated
between 0.95 and 1, product numbers effectively help distinguish
groups of countries as the distributions range from around 200 to
nearly 1,400 categories of goods. While this approach is still not
perfect, it enables one to separate countries into a few groups based
on similar characteristics. For example, Mexico and Canada are at the
top of the graph. As NAFTA members, Mexico and Canada
inevitably share similar characteristics. Next in line are Australia and
Singapore. They also share similar development status and similar
distances from the United States.
This paper’s primary concerned variables, trade openness of
importing countries and FTA dummy are also significant. Not
surprisingly, the more open a trade partner of the U.S. is, the larger
the number of U.S. export categories. As mentioned above, simple
product counts do not take into account trade value. Counting
categories exported nevertheless still carries some value, as an
increase in the number of categories is a positive phenomenon for an
exporter under almost any circumstance. The FTA dummy in this
case in fact decreases the number of products the U.S. exports. This
result is in line with the first model whose result shows that striking
free trade deals actually makes U.S. exports less diversified to its
FTA partner countries. From coefficients on openness and the FTA
dummy, it can be inferred that an FTA’s negative impact is much
Effects of Free Trade Agreements 49
stronger than the positive effects of openness on U.S. product counts.
However, it should be noted that the FTA dummy in the second
model is only marginally significant at the 10% level.
Source: My own calculation using UN Comtrade Database (SITC Rev.2 5-digit)16)
Figure 4. Number of US Export Products to 17 FTA Partners (1981-2009)
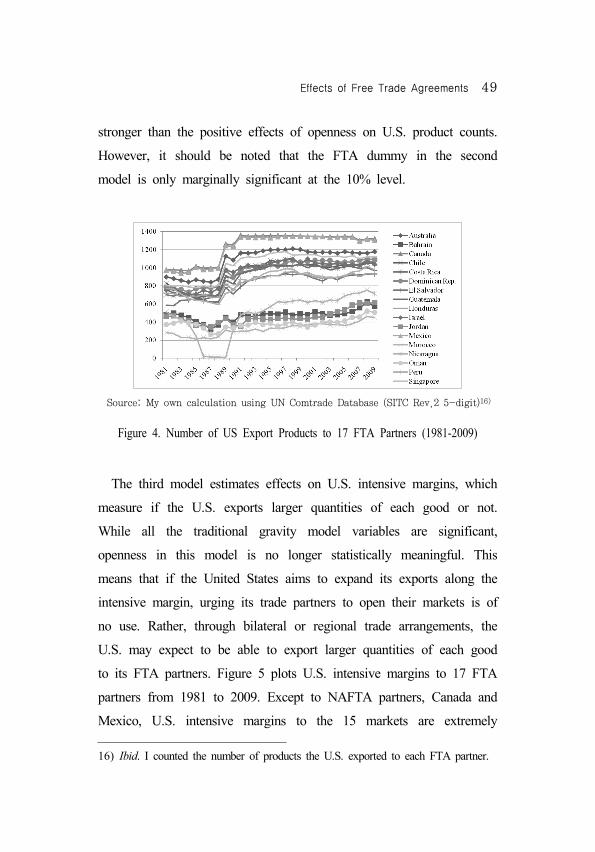
The third model estimates effects on U.S. intensive margins, which
measure if the U.S. exports larger quantities of each good or not.
While all the traditional gravity model variables are significant,
openness in this model is no longer statistically meaningful. This
means that if the United States aims to expand its exports along the
intensive margin, urging its trade partners to open their markets is of
no use. Rather, through bilateral or regional trade arrangements, the
U.S. may expect to be able to export larger quantities of each good
to its FTA partners. Figure 5 plots U.S. intensive margins to 17 FTA
partners from 1981 to 2009. Except to NAFTA partners, Canada and
Mexico, U.S. intensive margins to the 15 markets are extremely
16) Ibid. I counted the number of products the U.S. exported to each FTA partner.
50 Geary Choe
small. Besides proximity and shared border, the fact that NAFTA is
a relatively old agreement may have something to do with the higher
intensive margins. A large intensive margin growth is also observed
in post-NAFTA years. This result reaffirms the findings of
Christodoulopoulou and Dutt, Mihov and Zandt.17) As can be seen in
Figure 5, U.S. intensive margins to non-NAFTA countries were very
small in 1981 and have not changed much since. This suggests that
NAFTA is a very strong outlier causing the FTA dummy to be
statistically significant on U.S. intensive margins. Other FTAs of the
United States are comparatively new and thus may not have been in
effect long enough to influence the intensive margins yet. Another
possible explanation is that most recent FTA partners are small,
developing countries with which U.S. trade value stays quite minimal.
Source: My own calculation using UN Comtrade Database (SITC Rev.2 5-digit)18)
Figure 5. Intensive Margin of US Exports to 17 FTA Partners (1981-2009)
17) Christodoulopoulou. “Multilateral Trade Liberalization” (2010); and Dutt, Mihov and Zandt. “Does WTO Matter?” (2011).
18) I set the U.S. as the reporter and 17 countries with which the U.S. has FTAs in
Effects of Free Trade Agreements 51
The last model estimates effects on U.S. extensive margins, which
measure if the U.S. exports a wide set of goods or not. In this
model, all the variables turn out to be statistically significant at 1%
level. Trade openness of partner countries is now positive and
significant. This means that if the United States aims to expand its
exports along the extensive margin, which in turn is thought to
reduce export volatility, the United States should continue to persuade
its trade partners to open their markets more. Unfortunately, while
still statistically meaningful, the sign on FTA dummy switches to
negative in the fourth model. That is, FTAs of the United States in
fact make the U.S. export a smaller set of goods than before.
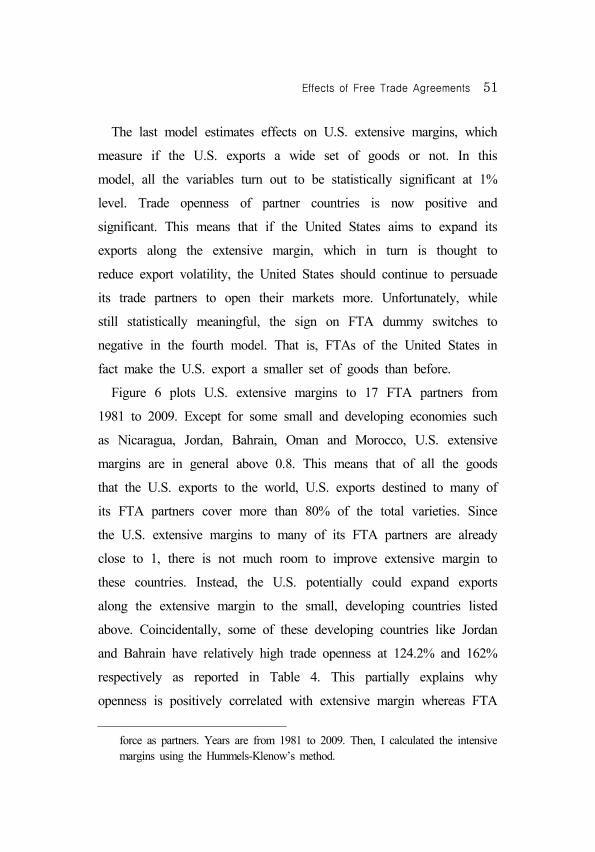
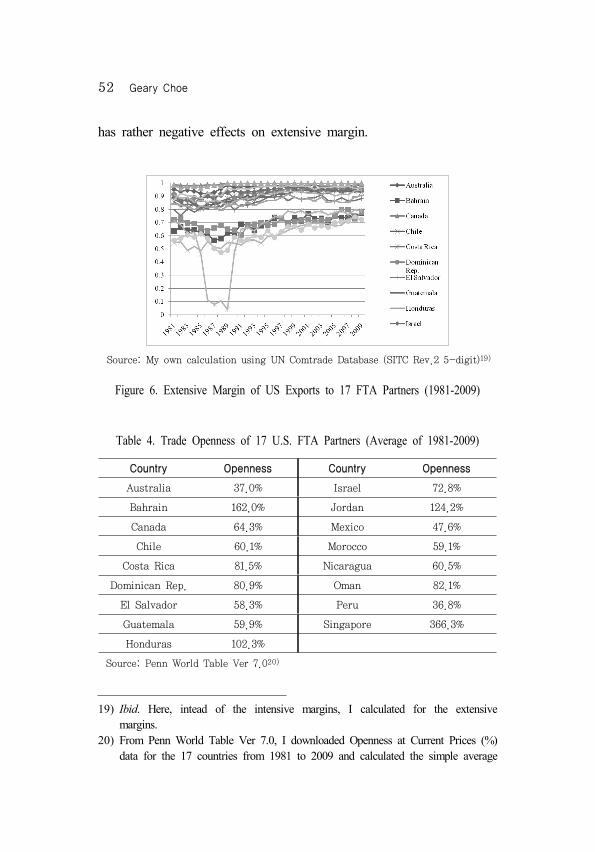
Figure 6 plots U.S. extensive margins to 17 FTA partners from
1981 to 2009. Except for some small and developing economies such
as Nicaragua, Jordan, Bahrain, Oman and Morocco, U.S. extensive
margins are in general above 0.8. This means that of all the goods
that the U.S. exports to the world, U.S. exports destined to many of
its FTA partners cover more than 80% of the total varieties. Since
the U.S. extensive margins to many of its FTA partners are already
close to 1, there is not much room to improve extensive margin to
these countries. Instead, the U.S. potentially could expand exports
along the extensive margin to the small, developing countries listed
above. Coincidentally, some of these developing countries like Jordan
and Bahrain have relatively high trade openness at 124.2% and 162%
respectively as reported in Table 4. This partially explains why
openness is positively correlated with extensive margin whereas FTA
force as partners. Years are from 1981 to 2009. Then, I calculated the intensive margins using the Hummels-Klenow’s method.
52 Geary Choe
has rather negative effects on extensive margin.
Source: My own calculation using UN Comtrade Database (SITC Rev.2 5-digit)19)
Figure 6. Extensive Margin of US Exports to 17 FTA Partners (1981-2009)
Country Openness Country Openness
Australia 37.0% Israel 72.8%
Bahrain 162.0% Jordan 124.2%
Canada 64.3% Mexico 47.6%
Chile 60.1% Morocco 59.1%
Costa Rica 81.5% Nicaragua 60.5%
Dominican Rep. 80.9% Oman 82.1%
El Salvador 58.3% Peru 36.8%
Guatemala 59.9% Singapore 366.3%
Honduras 102.3%
Source: Penn World Table Ver 7.020)
Table 4. Trade Openness of 17 U.S. FTA Partners (Average of 1981-2009)
19) Ibid. Here, intead of the intensive margins, I calculated for the extensive margins.
20) From Penn World Table Ver 7.0, I downloaded Openness at Current Prices (%) data for the 17 countries from 1981 to 2009 and calculated the simple average
Effects of Free Trade Agreements 53
Ⅴ. Policy Implications and Conclusion
Classical trade theories may no longer be applicable when
considered within the context of risk and uncertainty inherent in the
international market. This realization has led economists to devise
export diversification strategies. Most empirical studies on export
diversification, however, have largely ignored wealthy countries such
as the United States. With the DDA negotiations in a deadlock,
FTAs are flourishing and the U.S. is no exception, as it has FTAs in
force with 17 countries. At the same time, the U.S. always
emphasizes the importance of opening up markets at trade negotiating
tables. Thus, analyzing the effects of openness and FTAs on U.S.
export diversification is the main focus of this paper.
In this paper, I decomposed the U.S. exports into intensive and
extensive margins to analyze the extent to which the U.S. exports
more of each product (the intensive margin) and exports more
varieties (the extensive margin). Using trade data between the United
States and 17 FTA partners from 1981 to 2009, I found that the
openness of a partner country has no influence over U.S. intensive
margins, but it does increase U.S. extensive margins. On the other
hand, FTAs increase the U.S. intensive margins, but decrease the
U.S. extensive margins.
My estimates imply that if the United States is more concerned
with export risk management, which is often carried out by
increasing the extensive margins, the U.S. should continue to push
for more liberalization and openness of its trade partners. This
openness for each country.
54 Geary Choe
argument is in line with Hummels and Klenow and Simon J. Evenett
and Anthony J. Venables who claim that countries with more export
items not only reduce risks, but also export more.21)
However, my empirical results also suggest that openness has no
impact on U.S. intensive margins while FTAs in fact increase the
intensive margins. Scholars such as Tibor Besedes and Thomas J.
Prusa, Gabriel J. Felbermayr and Wilhelm Kohler, Jonathan Eaton et
al., Elhanan Helpman et al., and Mary Amiti and Caroline Freund
argue that majority of export growth is due to exporting more of the
same products (i.e. intensive margin is more important for overall
export growth).22) If the U.S. follows their argument, then the
openness of a partner country is not as important as whether the
U.S. has a free trade agreement with the country or not. John T.
Cuddington et al. point out this inherent dilemma of the tradeoff
between the greater returns due to specialization and greater exposure
to shocks on the world market.23)
21) Hummels and Klenow, “Variety and Quality”; Evenett, Simon J., and Anthony J. Venables. “Export Growth in Developing Countries: Market Entry and Bilateral Trade Flows,” working paper, University of Bern (2002).
22) Tibor Besedes and Thomas J. Prusa. “The Role of Extensive and Intensive Margins and Export Growth,” Working Paper 13628, The National Bureau of Economic Research (2007); Felbermayr, Gabriel J., and Wilhelm Kohler. “Exploring the Intensive and Extensive Margins of World Trade,” Review of World Economics 142.4 (2006): 642-674; Eaton, Jonathan, Marcela Eslava, Maurice Kugler, and James R. Tybout. “The Margins of Entry into Export Markets: Evidence from Colombia,” in The Organization of Firms in a Global Economy, ed. E. Helpman, D. Marin, and T. Verdier (Cambridge, MA: Harvard University Press, 2008): 231-272; Helpman, Elhanan, Marc Melitz, and Yona Rubinstein. “Estimating Trade Flows: Trading Partners and Trading Volumes,” Quarterly Journal of Economics 123.2 (2008); Amiti, Mary, and Caroline Freund. “The Anatomy of China’s Export Growth,” Working Paper (Policy Series 4628), World Bank, (2008).
Effects of Free Trade Agreements 55
Since the United States has a well-established economy and exports
in a large number of categories to almost all the markets in the
world, risk management may not be a big concern for the United
States. This explains why most economists largely excluded the U.S.
in their empirical analyses on export diversification. Simply put, the
United States is not as desperate as small and poor economies to
diversify its exports. In that case, what matters more is increasing the
absolute value of exports, which can be attained through increasing
the intensive margin.
In fact, Jean M. Imbs and Romain Wacziarg came up with a
theory that a country diversifies production in the initial stage of
development, but once it reaches a certain per capita income,
incentives to specialize take over.24) They estimate the income level
to be around $16,000 GDP per capita. Apparently, the United States
has crossed that turning point and is at the specialization phase.
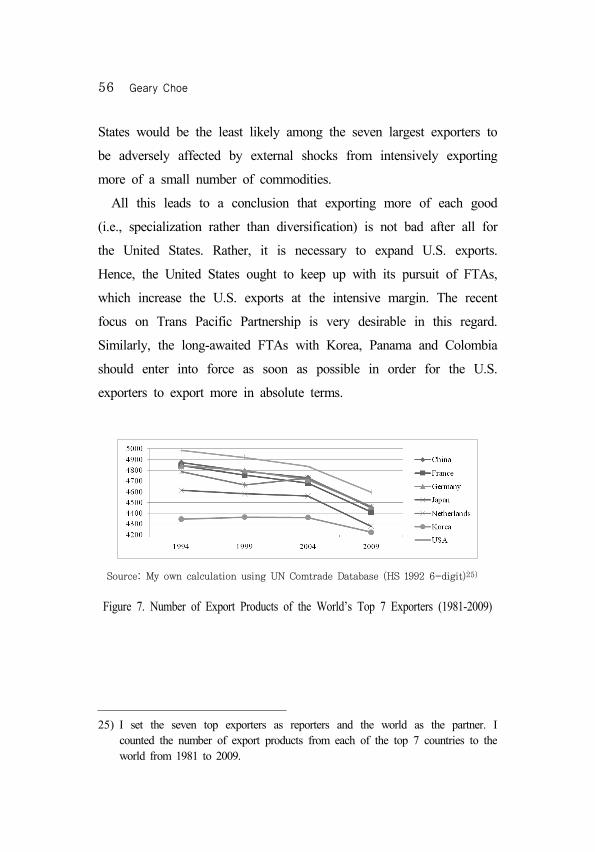
According to Figure 7 below, all of the major exporting countries are
decreasing the number of products and specializing. A point of
importance is that while these countries specialize, their export value
increased rapidly. Moreover, although these countries seem to be
decreasing the number of varieties, they still rank well above most
nations in the world in terms of variety. The United States in
particular ranks at the top of the world’s major exporters in terms of
variety with around 4,600 products in 2009. This means the United
23) John T. Cuddington, Hong Liang, and Shihua Lu, “Uncertainty, Trade, and Capital Flows in Sub-Saharan Africa,” Journal of African Economics 5.3 (1996): 192-224.
24) Jean M. Imbs and Romain Wacziarg. “Stages of Diversification,” American Economic Review, 93.1 (2003): 63-86.
56 Geary Choe
States would be the least likely among the seven largest exporters to
be adversely affected by external shocks from intensively exporting
more of a small number of commodities.
All this leads to a conclusion that exporting more of each good
(i.e., specialization rather than diversification) is not bad after all for
the United States. Rather, it is necessary to expand U.S. exports.
Hence, the United States ought to keep up with its pursuit of FTAs,
which increase the U.S. exports at the intensive margin. The recent
focus on Trans Pacific Partnership is very desirable in this regard.
Similarly, the long-awaited FTAs with Korea, Panama and Colombia
should enter into force as soon as possible in order for the U.S.
exporters to export more in absolute terms.
Source: My own calculation using UN Comtrade Database (HS 1992 6-digit)25)
Figure 7. Number of Export Products of the World’s Top 7 Exporters (1981-2009)
25) I set the seven top exporters as reporters and the world as the partner. I counted the number of export products from each of the top 7 countries to the world from 1981 to 2009.
Effects of Free Trade Agreements 57
Works Cited
BibliographyAgosin, Manuel R. “Export Diversification and Growth in Emerging
Economies,” Universidad de Chile Working Paper No.233 (2007).Anderson, James E. and G. Riley, John. “International Trade with Fluctuating
Prices,” International Economic Review 17 (1976): 76-97. Amiti, Mary and Freund, Caroline. “The Anatomy of China’s Export
Growth,” The World Bank Policy Research Working Paper Series 4628 (2008).
Batra, Ravi. “Production Uncertainty and the Heckscher-Ohlin Theorem,” Review of Economic Studies 69 (1975): 259-268.
Bertinelli, Luisito, Salins, Veronique, and Strobl, Eric. “Export Diversification and Price Uncertainty in Sub-Saharan Africa and Other Developing Countries: A Portfolio Theory Approach,” Working Paper, Ecolé Polytechnique, Paris (2006).
Besedes, Tibor and J. Prusa. Thomas. “The Role of Extensive and Intensive Margins and Export Growth,” NBER Working Papers 13628 (2007).
Christodoulopoulou, Styliani. “The Effects of Multilateral Trade Liberalization on the Extensive and the Intensive Margins of Trade,” Munich Personal RePEC Archive Working Paper No. 29169 (2010).
Cuddington, John T., Liang, Hong, and Lu, Shihua. “Uncertainty, Trade, and Capital Flows in Sub-Saharan Africa,” Journal of African Economies 5-3 (1996): 192-224.
Dutt, Pushan, Mihov, Ilian and Van Zandt, Timothy. “Does WTO Matter for the Extensive and the Intensive Margins of Trade?” unpublished thesis, INSEAD (2011).
Eaton, Jonathan, Eslava, Marcela, Kugler, Maurice, and R. Tybout, James. “The Margins of Entry into Export Markets: Evidence from Colombia,” in Elhanan Helpman, Dalia Marin, and Thiery Verdier, eds., The Organization of Firms in a Global Economy, Cambridge, MA: Harvard University Press (2008): 231-272.
Evenett, Simon J., and Venables, Anthony J. “Export Growth in Developing
58 Geary Choe
Countries: Market Entry and Bilateral Trade Flows,” working paper, University of Bern (2002).
Felbermayr, Gabriel J., and Kohler, Wilhelm. “Exploring the Intensive and Extensive Margins of World Trade,” Review of World Economics, 142 (4) (2006): 642-674.
Helpman, Elhanan, Melitz, Marc, and Rubinstein, Yona. “Estimating trade flows: trading partners and trading volumes,” Quarterly Journal of Economics,123 (2) (2008).
Hillberry, Russell, and McDaniel, Christine. “A Decomposition of North American Trade Growth Since NAFTA,” International Economic Review, USITC Publication 3527 (May/June) (2002): 1-6.
Hummels, David, and Klenow, Peter J. “The Variety and Quality of a Nation’s Exports,” American Economic Review, 95(3) (2005): 704-723.
Kemp, Murray C., and Liviatan, Nissan. “Production and Trade Patterns under Uncertainty,” Economic Record 49 (1973): 215-227.
Krugman, Paul R., and Obstfeld, Maurice. International Economics: Theory & Policy. 8th edition. (New York: Prentice Hall, 2009).
Prebisch, Raul. “The Economic Development of Latin America and its Principal Problems,” Reprinted in Economic Bulletin for Latin America, 7, 1 (1962).
Ruffin, Roy. “International Trade under Uncertainty,” Journal of International Economics 4 (1974): 243-259.
Singer, Hans. “The Distribution of Gains between Investing and Borrowing Sectors,” American Economic Review, 40.2 (1950): 473-485.
Wilhelms, Christian. “Export Diversification in Latin America,” Intereconomics, 2 (1967): 46-48.
Internet Resources
Bank of Korea (http://bok.or.kr)International Monetary Fund (http://www.imf.org)International Trade Data, Website of Jon Haveman, Professor at Macalester
College (http://www.macalester.edu/research/economics/PAGE/HAVEMAN/ Trade.Resources/TradeData.html)
Effects of Free Trade Agreements 59
Office of the United States Trade Representative (http://www.ustr.gov/)Penn World Table Version 7.0, Center for International Comparisons of
Production, Income and Prices at the University of Pennsylvania (http://pwt.econ.upenn.edu/)
United Nations Commodity Trade Statistics Database (http://comtrade.un.org)World Trade Organization (http://www.wto.org)
■ 논문 투고일자: 2011. 9. 29
■ 심사(수정)일자: 2011. 10. 4
■ 게재 확정일자: 2011. 11. 1
60 Geary Choe
Abstract
Effects of Free Trade Agreements and Market
Openness on U.S. Export Diversification
Geary Choe
(Seoul National University)
Classical international trade theories emphasize comparative advantages that arise from specialization without taking into account the fact that specialization exposes the exporting country to product risk and market risk. Therefore, in the second half of the 20th century, economists have studied diversification strategies to manage export risk. However, there has been almost no empirical study on the U.S export diversification. At the same time, preferential trade arrangements are flourishing with the Doha round in a stalemate. This paper thus tries to examine the relationships between FTAs as well as trade openness on export diversification of the United States.
Employing Hummels and Klenow’s intensive and extensive margins, proxies for degrees of export specialization and diversification, my empirical study suggests that trade openness of export partners increase the U.S. extensive margins while entering into FTAs increases the U.S. intensive margins. Extensive margins are often associated with export risk management while intensive margins tend to be regarded as increasing the total export value. This suggests that the U.S., just like any other country in the world, also faces an inherent tradeoff between greater returns due to specialization and greater exposure to shocks from the world market.
The United States nevertheless remains in a strong position that allows it not to worry about export risks because it is currently exporting the largest number of categories among the world’s top 7 exporters to almost all the export markets in the world. Hence, the United States would be far better off by keeping up with its pursuit of FTAs rather than trying to urge its
Effects of Free Trade Agreements 61
partners to open up more. Doing so would definitely help the U.S. increase its exports in absolute amount.
Key Words
Export Diversification, Trade Openness, FTA, Extensive Margin, Intensive Margin


![[CCKOREA 국제컨퍼런스] CCL & Openness on Daum](https://img.pdfslide.tips/doc/110x75/547dc8485806b5cc5e8b45be/cckorea-ccl-openness-on-daum.jpg)