Embed Size (px)
Citation preview

1
Eiropas Savienības fondu darbības programmas “Izaugsme un nodarbinātība” 9.2.3.specifiskā atbalsta
mērķa “Atbalstīt prioritāro (sirds un asinsvadu, onkoloģijas, perinatālā un neonatālā perioda un garīgās
veselības) veselības jomu veselības tīklu attīstības vadlīniju un kvalitātes nodrošināšanas sistēmas izstrādi
un ieviešanu, jo īpaši sociālās atstumtības un nabadzības riskam pakļauto iedzīvotāju veselības
uzlabošanai” ietvaros īstenotā projekta Nr.9.2.3.0/15/I/001 “Veselības tīklu attīstības vadlīniju un
kvalitātes nodrošināšanas sistēmas izstrāde un ieviešana prioritāro jomu ietvaros” 3. un 4.nodevums –
Summary Report of Bottleneck Analysis and survey instruments, manuals and analysis protocols

2
World Bank Reimbursable Advisory Services:
Support to Develop a Health System Strategy for Priority Disease Areas in Latvia
Bottleneck Analysis1
1 Author: Alaka Holla (PhD) ([email protected]), with contributions by Amit Chandra (MD), Paula Giovagnoli
(PhD), and Christel Vermeersch (PhD).

3
INTRODUCTION
Relative to other countries, Latvia exhibits excess mortality and morbidity in four areas – cardiovascular
disease, cancer, mental health, and maternal and perinatal health, and these conditions have become
priorities in the health sector’s ongoing reform agenda. This study, along with a number of other reports
prepared by the World Bank, use these four diseases areas as a lens to identify underlying performance
issues in the health system that may impede patients’ timely access to services and depress quality of
care.
While the other analytical pieces examined policy, practice, and capacity in particular functional
domains, such as provider payments and quality assurance, this report focuses on patients and how they
move through the health system. It is an empirical investigation of available administrative data and
aims to trace out a patient pathway, starting from screening and ending with follow-up care, in order to
identify where patients may be getting stuck and which elements of the pathway are bottlenecks that
prevent patients from the getting the care they need when they need it (Figure 1). For example, does
excess mortality in cancer more likely stem from late diagnoses or late treatments? Are cardiovascular
patients diagnosed late or are they missing appropriate follow-up care?
Figure 1: The patient pathway
This report also tests some general hypotheses suggested in the other accompanying studies, examining
whether there are delays between the steps along the patient pathway, whether the steps themselves
are carried out in the appropriate settings, and whether patients receive high quality care.
The findings suggest that each disease area faces a unique mix of challenges. Follow-up care appears
weak among cardiovascular patients, for example, while screening and timely diagnosis seem to be
major bottlenecks in cancer care. Mental health patients likely encounter bottlenecks all along the
patient pathway, while deficits in screening and management during the prenatal period may explain
Latvia’s relatively high rates of perinatal mortality.
It is important to note that because of the high use of privately financed care in Latvia, it is not possible
to completely track patients as they move through the health system, since there is no central
repository of information on all health care delivered in Latvia. Individual-level data on privately
financed care sits with each service provider, often in paper form. Nevertheless, as described in more
detail below, the study employs all payment data of the National Health Service (NHS), which has
Screening Diagnosis Treatment Management and follow-up

4
ostensibly been set up as a single payer. Thus, it is important to gauge how much care the NHS is
funding along the patient pathway. While any observed deficits could reflect a prominent role played by
the private sector for a particular step in the pathway, they also indicate that the NHS is not paying for
an entire package of essential care.
The next section describes the basic methods used in the analysis, including a description of the files
that have been submitted so that the analysis could be replicated on any computer that has the
appropriate software and the raw data files shared with the World Bank by the NHS, the Center for
Disease Prevention and Control (CDPC), and the State Emergency Services (SEMS). The subsequent four
sections present the main findings from the four priority conditions and general recommendations for
addressing some of the bottlenecks that have been observed, while the final section describes data-
related challenges that the Ministry of Health may want to address in order to monitor system-level
bottlenecks in the future. Four appendices present all of the assumptions that underlie all of the results
presented in the report and form an “operational manual” to guide future analyses of the data
generated by Latvia’s health system.
METHODS
The study uses administrative data provided by the NHS, CDPC, and SEMS to assess performance related
to the steps of the patient pathway in Figure 1 – screening, diagnosis, treatment, and management and
follow-up care - for select tracer conditions. The analysis required identifying all patients with these
tracer conditions and determining the receipt and timing of certain services corresponding to screening,
diagnosis, treatment, and disease management or follow-up care.
Tracer conditions
An exhaustive study of each disease area would have been beyond the scope of the present study, so
tracer conditions within each disease area were used to illuminate performance issues that could be
common to other conditions within the same disease area. Just as a radioactive tracer in medicine
allows a physician to track progress through a certain organ system, a tracer condition in this study
permits the tracking of performance through the multiple functions of the health system listed in Figure
1. Table 1 lists the tracer conditions used for each disease area. While high risk pregnancy was originally
intended to serve as a tracer for perinatal health, the analysis ultimately examined all pregnancies since
without additional clinical information about the patient, it is difficult to determine what a medically
ideal pathway would look like for a high risk pregnancy. Instead the study examines differences along
the pathway exhibited by mothers who have experienced a perinatal death and those who have not.
Table 1: Tracer conditions
Condition Tracers
Cardiovascular disease Hypertension, diabetes, acute myocardial infarction, and stroke
Cancer Breast cancer, cervical cancer, and colorectal cancer

5
Mental health Depression and substance abuse
Maternal and perinatal health None
Source data
The analysis uses multiple data sets shared by the NHS, CDPC, and SEMS, which are listed in Table 2.
Table 2: Data sets used in the analysis by source
Data set Source
All inpatient services paid by the NHS, 2009-2014 NHS
All outpatient services paid by the NHS, 2009-2014 NHS
All health care staff and their certifications NHS
Cancer Registry, 2009-2014 CDPC
Death Registry, 2009-2014 CDPC
Perinatal Death Registry, 2009-2014 CDPC
Diabetes Registry, 2009-2014 CDPC
Mental health registry, 2009-2014 CDPC
Substance abuse registry CDPC
Emergency calls SEMS
Cancer screening letters NHS
These data sets were shared in Excel format. All personal IDs had been anonymized following a protocol
outlined in a legal agreement among NHS, CDPC, and SEMS. The World Bank stored and analyzed all
data on two secure servers. For the analysis, all data were imported, cleaned, and merged when
necessary using Stata/MP 14.2 software.
Replicability
The Stata code for importing, cleaning, merging, and analysis has been written so that all analyses can
be fully replicated on any computer that has Stata software and all of the raw data furnished by the
NHS, CDPC, and SEMS. Two files in particular (00-master_path.do and 01-master_run.do) can be used to
replicate every figure that appears in this report (and in a supplementary PowerPoint that contains more
indicators), starting from the raw data, as they execute all data cleaning tasks, all database and variable
construction, and every calculation in the correct sequence.
Not only does this set up for replication offer a high degree of transparency, but it will also allow others
to easily modify assumptions made in the analysis and recalculate any figure fairly quickly.

6
Appendix 1 describes the calculation of each indicator presented in this report.
Identifying patients with tracer conditions
To construct lists of patients exhibiting a certain tracer condition – for example, all hypertension
patients for a given year – we searched all possible databases – namely, the inpatient and outpatient
records, the SEMS data sets, the disease-specific registries, and the death registry since it is possible for
patients to be diagnosed outside of inpatient or outpatient settings. Patients who had made little
contact with health services or remained undiagnosed despite seeking medical attention could be
diagnosed with a certain condition for the first time only at death or during an encounter for emergency
services. A patient was considered to have a disease in a given year if (s)he appeared in any database
that year with the ICD-10 code (or equivalent SEMS code) corresponding to that disease.
The NHS cautioned that this strategy for identifying diagnosed patients could yield a number of false
positives as physicians could record ICD-10 codes associated with a confirmed diagnosis for suspected
cases rather using the separate code that exists for suspected cases.2 Indeed this is the rationale behind
the NHS strategy for identifying hypertension patients, for example, of searching for at least two
outpatient instances or one inpatient record corresponding to the hypertension diagnosis code. As the
number of cases where a patient appears only once with a diagnosis in a single year is small and as
physicians in Latvia do appear to use ICD-10 codes corresponding to suspected cases, the subsequent
analysis does not impose the NHS restriction of having at least two outpatient instances or one inpatient
record for each tracer.3 For cancer cases, however, some indicators only include patients that appear in
the Cancer Registry. Appendix 4 lists the ICD-10 codes used for each tracer.4
Determining receipt and dates of services
These lists of patients diagnosed with the tracer conditions were then merged with the inpatient and
outpatient patient records, including “manipulations” (the term for billable expenses, which can include
examinations, diagnostics, treatments, and procedures), and with a data set of physicians with their
corresponding specialties. This permitted an assessment of the extent to which patients with certain
diagnoses received certain manipulations, the timing of these services, and the identity of the physician
providing them. Appendix 2 presents the codes used to identify specialists in a particular domain (for
example, mental health specialist). Appendix 3 also lists the manipulation codes corresponding to each
examination, diagnostic, treatment, and procedure used in the analysis.5
2 For example, they could use the code C50 meant for confirmed malignancies of the breast even though prior to
confirmation, they could use D49.3, N63, D48.6, or Z12.3. 3 For example, only 4 percent of patients diagnosed with diabetes had only one outpatient record in 2014, only 7
percent of those diagnosed with hypertension, and less than 4 percent for cancers. For depression and substance abuse and depression, these fractions rise to 13 and 22 percent, respectively. 4 It is important to note that errors of commission (in which ICD-10 codes currently not in use in Latvia were used
in the analysis) will not change any of the results. The algorithm would search for patients with these codes in the databases supplied by the NHS, CDPC, and SEMS and simply not find any. 5 It is important to note here as well that errors of commission (using too many manipulation codes to identify a
procedure, examination, or laboratory test) will either have no effect (when no patients have received the erroneous manipulations) or will inflate the corresponding indicator, making the situation appear better than it really is (when the erroneous manipulations are frequently received).

7
Unless otherwise stated, all reported figures have used all data sets to identify patients exhibiting the
tracer condition and NHS inpatient and outpatient data to identify the receipt and timing of services.
The NHS has cautioned that services may be recorded with some delay, but the dates in the payment
data may be the most accurate representation of the timing of visits and services, as the CDPC has
cautioned that the dates in the registries may be recorded with even greater delay. To deal with this
uncertainty, many indicators use multiple time spans (for example, 30, 60, and 90 days) to characterize
the timing of services.

8
CARDIOVASCULAR CONDITIONS
Tracer conditions: Hypertension, diabetes, acute myocardial infarction (AMI), and stroke
Summary of empirical findings
With no organized screening programs, performance in this dimension cannot be observed for
cardiovascular conditions without detailed clinical information, which is not present in currently
available data. The current surveillance of the health of the Latvian population by the Center for Disease
Prevention and Control also provides suggestive evidence that sizable fractions of a high risk group
(males between the ages of 45 and 54) are not getting their blood pressure (nearly 40% not getting it) or
cholesterol measured on an annual basis (more than 60% not getting it) (Figure 2).
The lack of clinical information also limits an assessment of diagnoses. However, it does not
appear that missed diagnoses largely contribute to excess mortality in cardiovascular disease. According
to the NHS payment data, in 2013, only 9% of AMI patients did not have a diagnosis of coronary artery
disease in the same year, and only 16% of stroke patients had not been diagnosed with hypertension in
that year.
Without standardized coding of pharmaceutical products, data on whether or not physicians
have made a prescription, and the exact times of medical interventions within hospitals, currently
available administrative data also provides little visibility on the quality of treatment for cardiovascular
patients. Mortality outcomes for AMI and stroke patients, however, suggest that Latvia struggles with
the treatment part of the patient pathway (Figures 3 and 4), as Latvia has among the highest rates of 30
day mortality following admission to a hospital for both AMI and stroke.
The data are clear that disease management and follow-up care pose significant challenges in
Latvia. Patients diagnosed with hypertension and diabetes are far from full compliance with the basic
tests used to monitor the progression of disease, such as electrocardiograms and creatinine and glucose
blood tests, and cholesterol tests (Figures 5-7). It is important to note that these patients are making
frequent contact with the health system - an average of 7.5 primary care visits per year for
hypertension patients and an average of 8.3 for diabetes patients (Figures 8 and 9) – and thus their
diseases are not being appropriately managed.
More alarmingly, there is little follow-up care after major cardiovascular incidents. In all years, more
than 80% of patients discharged with an AMI do not see a cardiac specialist within 90 days (Figure 10).
While these patients might be seeking care from private specialists, it is still the case that the NHS does

9
not pay for critical follow-up care for more than 80% of patients who have had a heart attack. Less than
half of the patients who do see a specialist within the 90 day interval see him/her within a month of
discharge. The follow-up pattern appears nearly identical for stroke patients (Figure 11). Within 90 days
of discharge, more than 80% have not seen a neurologist, and only half of those who do obtain follow-
up care get it within 30 days. Shortages of physicians cannot explain these patterns, as the human
resource mapping found surpluses of cardiologists in all regions, except Vidzeme (where there is neither
a surplus nor a deficit).
Recommendations
To monitor performance related to prevention and screening, the Ministry of Health, along with
the Health Inspectorate and medical faculties, may consider clinical audits through chart reviews or the
use of unannounced standardized patients.
The Ministry of Health may also consider implementing the World Health Organization’s STEP
survey in Latvia, which would permit the estimation of the true prevalence of hypertension and diabetes
and diagnosis rates, in addition to drug adherence.
Clinical audits within hospitals, along with requiring hospitals to report the exact timing of
interventions and tests that take place within the hospital, could help identify why outcomes for AMI
and stroke patients are so poor in Latvia. Currently, the NHS payment data only contains information on
the day a procedure or test has been performed. As the accompanying hospital-volume study also
suggests, volume-based standards for physicians may also decrease mortality among patients
undergoing percutaneous coronary interventions and abdominal aortic aneurysm repairs. It is also
possible that older physicians have found it difficult to implement the latest international standards of
care and may require more intensive continuing medical education. The accompanying human resource
mapping exercise found that nearly 60% of cardiologists are 55 years or older and that 20% are older
than 65 years.
Given that a large majority of heart attack and stroke patients are not getting follow-up care, the
NHS may consider exempting these patients from quotas (that is, their consultations would not count
against a quota). Hospitals and physicians may also need explicit financial incentives – for example,
bundling the payment for treatment with the payment for follow-up - to provide timely follow-up care
following an AMI or stroke, and it would be worth experimenting with such incentives to evaluate
whether they can work. Given that increasing the NHS’s strategic purchasing function is part of the
current reform agenda in Latvia, bundling payments for treatment and follow-up could be an initial
effort to link payments to quality of care.

10
Main findings
Figure 2: Fraction of men aged 45-54 years who have had their blood pressure and cholesterol measured
Source: Center for Disease Prevention and Control (2012) Health Behavior Among the Latvian Population
Figure 3: Thirty-day mortality after admission to hospital for AMI based on admission data, 2003 to 2013 (or nearest years)
Source: OECD Health Statistics 2015, http://dx.doi.org/10.1787/health-data-en.
0
10
20
30
40
50
60
70
During last year In the last 5 years Longer than the last 5
years
Never
Blood pressure Cholesterol
0
5
10
15
20
25
30
2003 2008 2013Age-sex standardised rate per 100 admissions of adults aged 45 years and over

11
Figure 4: Thirty-day mortality after admission to hospital for ischemic stroke based on admission data, 2003 to 2013 (or
nearest years)
Source: OECD Health Statistics 2015, http://dx.doi.org/10.1787/health-data-en.
Figure 5: Percentage of hypertension patients who had an annual electrocardiogram
0
5
10
15
20
25
2003 2008 2013Age-sex standardised rate per 100 admissions of adults aged 45 years and over
0%
20%
40%
60%
80%
100%
2009 2010 2011 2012 2013 2014
% o
f a
du
lts
wit
h
hy
pe
rte
nsi
on

12
Figure 6: Percentage of hypertension patients who had annual microalbuminuria, random blood glucose, and creatinine tests
Figure 7: Percentage of diabetes patients who had annual microalbuminuria, HgA1c, and creatinine tests
0%
20%
40%
60%
80%
100%
2009 2010 2011 2012 2013 2014
% o
f a
du
lts
wit
h h
yp
ert
en
sio
n
Albuminuria Glucose Creatinine
0%
20%
40%
60%
80%
100%
2009 2010 2011 2012 2013 2014
% o
f a
du
lts
wit
h d
iab
ete
s
Albuminuria HgA1c Creatinine

13
Figure 8: Number of outpatient visits to GP per year for people diagnosed with hypertension
Figure 9: Number of outpatient visits to GP per year for people diagnosed with diabetes
7.7 7.7 7.7 7.6 6.9
0.0
2.0
4.0
6.0
8.0
10.0
2009 2010 2011 2012 2013
Nu
mb
er
of
visi
ts
8.7 8.6 8.5 8.3 7.5
0.0
2.0
4.0
6.0
8.0
10.0
2009 2010 2011 2012 2013
Nu
mb
er
of
visi
ts

14
Figure 10: Timing of first follow-up visit with a cardiologist for inpatient discharges with an AMI diagnosis
Figure 11: Timing of first follow-up visit with a neurologist for inpatient discharges with a stroke diagnosis
81% 81% 82% 82% 82%
0%
10%
20%
30%
40%
50%
60%
70%
80%
90%
100%
2009 2010 2011 2012 2013
% o
f in
pa
tie
nt
dis
cha
rge
s w
ith
fo
llo
w-u
p
within 30 days within 31-60 days within 61-90 days no visit within 90 days
84% 83% 83% 83% 83%
0%
10%
20%
30%
40%
50%
60%
70%
80%
90%
100%
2009 2010 2011 2012 2013
% o
f in
pa
tie
nt
dis
cha
rge
s w
ith
fo
llow
-up
within 30 days within 31-60 days within 61-90 days no visit within 90 days

15
CANCERS
Tracer conditions: Breast cancer, cervical cancer, and colorectal cancer
Summary of empirical findings
There is considerable room for improvement in publicly funded cancer screening in Latvia. While
it is remotely possible that the private sector accounts for the more than 40% of women aged 50-69
who do not have mammograms every two years through NHS-contracted services (Figure 12) and the
nearly 60% of women aged 25-70 who are not screened for cervical cancer every three years (Figure 13),
this certainly cannot be the case for colorectal cancer, where less than 10% of individuals aged 50-74 are
meeting the EU guideline of yearly fecal occult blood tests (FOBT) (Figure 14). To put this figure in
perspective, FOBT compliance rates in other European countries can be as high as 42% (France), 45%
(Italy), 52% (United Kingdom), and 71% (Finland). 6
Perhaps due to this poor screening coverage, cancer diagnoses are occurring late. Only around
30% of breast cancer patients are being diagnosed in early stages of their disease, Stages 0 and 1 (Figure
15). In fact, women are slightly more likely to be diagnosed when they have already progressed to Stage
III or IV of their disease. Cervical cancer fares a little better, as nearly half of staged cancers are Stage 0
or Stage I (Figure 16). In each year, more than half of staged colorectal cancers are Stage III and Stage IV
(Figure 17).
When it comes to treatment, however, there do not appear to be major delays. In the NICE
referral guidelines for suspected cancer cases adopted by the National Health Service of the United
Kingdom, there should be no more than two months between a GP’s referral for suspected cancer and
the onset of treatment and no more than 31 days between the drafting of a treatment plan and the
start of treatment. As discussed earlier, it is difficult to discern the precise date of diagnosis with
available data in Latvia. Nevertheless, among patients that do receive treatment, the average time
elapsed between the first appearance of a confirmed cancer diagnosis in health system data and the
first cancer treatment is 35 days for breast cancer, 49 days for cervical cancer, and 40 days for colorectal
cancer (Figures 18-20).
The treatments that cancer patients are getting appear to be moderately successful when Latvia is
compared to OECD countries. Despite the late diagnoses, the five-year relative survival rate for breast
cancer in Latvia (84.2) is near the OECD average (84.9) (Figure 21), as are the rates for colorectal cancer
(Figure 22). The corresponding rate for cervical cancer, however, suggests some room for improvement
6 Miroslav Zavoral, Stepan Suchanek, Filip Zavada, Ladislav Dusek, Jan Muzik, Bohumil Seifert, and Premysl Fric
(2009), “Colorectal cancer screening in Europe,” World Journal of Gastroenterology, 15(47): 5907–5915.

16
in treatment. Women diagnosed with cervical cancer in Latvia, for example, are only 58.5% as likely to
live for another five years as women their same age who had not been diagnosed with cancer,
compared to an OECD average of 66% (Figure 23).
Without clinical information, it is difficult to assess the extent to which cancer patients in Latvia
receive appropriate follow-up care. Evidence from the accompanying review of the benefits package
suggests that an important co-morbidity of cancer – namely, depression - is being overlooked. The
American Cancer Society and the National Cancer Institute in the United States estimate that depression
affects approximately 15 to 25% of cancer patients, yet at most 2 percent of patients with active breast,
cervical, or colorectal cancer diagnoses in Latvia have been diagnosed with depression in any given year.
In the accompanying qualitative study, palliative care also surfaced as an issue for patient organizations,
which felt that cancer patients did not receive sufficient care related to pain management in their last
days of life.
Recommendations
The letters that the NHS c urrently uses for women who have not been screened recently for
breast and cervical cancers appear to have a decent response rate (Figures 24 and 25). To increase the
take-up rates of breast cancer and cervical cancer screening, it might be worth experimenting with the
format of the letters (specific wording, the identity of the sender, the use of social reference points) and
the use of text message reminders, as these ostensibly small modifications have proven effective in
improving responses in other domains, such as payment of taxes, savings, and drug adherence.7 The
NHS could also consider switching from the current practice of opportunistic screening for colorectal
cancer to more organized screening.
Improved screening for breast, cervical, and colorectal cancers should help decrease the
fractions of patients diagnosed in late stages for these diseases. If the Latvian health sector does start
developing clinical guidelines and clinical pathways, a referral guideline for suspected cancer cases
should help identify cases that could be exempt from quotas on important diagnostics, such as biopsies.
As demonstrated in the accompanying review of the benefits package, the number of biopsies
performed throughout the year tracks the schedule of quotas, which likely contributes to delays in
diagnosis for patients suspected of cancer in months in which quotas have been exhausted.
7World Bank (2015), World Development Report 2015: Mind, Society, and Behavior, Washington DC, World Bank.

17
Main findings
Figure 12: Percentage of women (50-69) receiving 2 -yearly screening mammogram
Figure 13: Percentage of women 25-70 screened for cervical cancer every 3 years
Figure 14: Percentage of 50-74 year olds receiving FOBT within the last year
45% 54% 56% 58% 59%
0%
20%
40%
60%
80%
100%
2010 2011 2012 2013 2014
% o
f w
om
en
50
-69
42% 42% 43% 42%
0%
20%
40%
60%
80%
100%
2011 2012 2013 2014
% o
f w
om
en
25-
70
ye
ars
old
5% 6% 6% 6% 8% 8%
0%
20%
40%
60%
80%
100%
2009 2010 2011 2012 2013 2014% o
f 50
-74
ye
ar
old
s

18
Figure 15: Percentage of breast cancers diagnosed at each stage, conditional on stage being known
Source: Cancer Registry, Center for Disease Prevention and Control
Figure 16: Percentage of cervical cancer diagnosed at each stage, conditional on stage being known
Source: Cancer Registry, Center for Disease Prevention and Control
1% 1% 1%
30% 28% 29%
36% 41% 39%
24% 22% 24%
9% 8% 7%
0%
20%
40%
60%
80%
100%
2011 2012 2013
% o
f d
iag
no
ses
Stage 0 Stage I Stage II Stage III Stage IV
15% 17% 11%
32% 33% 32%
12% 14%
14%
22% 25%
27%
18% 11% 15%
0%10%20%30%40%50%60%70%80%90%
100%
2011 2012 2013
% o
f d
iag
no
ses
Stage 0 Stage I Stage II Stage III Stage IV

19
Figure 17: Percentage of colorectal cancers diagnosed at each stage conditional on stage being known
Source: Cancer Registry, Center for Disease Prevention and Control
Figure 18: Time elapsed between confirmed breast cancer diagnosis and onset of treatment (radiation, chemo or surgery)
0% 0% 1% 10% 10% 14%
32% 35% 33%
23% 24% 26%
34% 30% 27%
0%10%20%30%40%50%60%70%80%90%
100%
2011 2012 2013
% o
f d
iag
no
ses
Stage 0 Stage I Stage II Stage III Stage IV
35 32
37 35
0
10
20
30
40
50
2011 2012 2013 2011-2013
Da
ys
2011 2012 2013 2011-2013

20
Figure 19: Time elapsed between confirmed cervical cancer diagnosis and onset of treatment (radiation, chemo or surgery)
Figure 20: Time elapsed between confirmed colorectal cancer diagnosis and onset of treatment (radiation, chemo or surgery)
45 49
0
10
20
30
40
50
2011 2012 2013 2011-2013
Da
ys
2011 2012 2013 2011-2013
42 38
41 40
0
10
20
30
40
50
2011 2012 2013 2011-2013
Da
ys
2011 2012 2013 2011-2013

21
Figure 21: Breast cancer five-year relative survival, 1998-2003 and 2008-2013 (or nearest periods)
Source: OECD Health Statistics 2015, http://dx.doi.org/10.1787/health-data-en.
0 20 40 60 80 100
Estonia 3
Poland 1
Chile 2
Czech Rep. 2
United Kingdom 2
Ireland 1
Austria 2
Slovenia 1
France 2
Latvia 2
OECD (22)
Netherlands 2
Germany 1
Italy 1
Korea 1
Belgium 1
New Zealand 1
Denmark 3
Iceland* 2
Japan 2
Canada 2
Israel 2
Portugal 2
Australia 1
Finland 1
Norway 1
United States 2
Sweden 2
Age-standardised survival (%)
2008-2013 1998-2003

22
Figure 22: Colorectal cancer, five-year relative survival by gender, 2008-2013 (or nearest period)
Source: OECD Health Statistics 2015, http://dx.doi.org/10.1787/health-data-en.
0 20 40 60 80 100
Chile 2
Poland 1
Estonia 3
Czech Rep. 2
United Kingdom 2
Latvia 2
Ireland 1
Denmark 3
Slovenia 1
Portugal 2
OECD (25)
New Zealand 1
Canada 2
Norway 1
Italy 1
Netherlands 2
Germany 1
United States 2
Austria 2
Finland 1
Sweden 2
Belgium 1
Japan 2
Australia 1
Iceland* 2
Israel 2
Korea 1
Age-standardised survival (%)
Men Women

23
Figure 23: Cervical cancer five-year relative survival, 1998-2003 and 2008-2013 (or nearest periods)
Source: OECD Health Statistics 2015, http://dx.doi.org/10.1787/health-data-en.
Figure 24: Percentage of women sent a mammogram invitation letter who receive a mammogram within 12 months of
sending of the letter
0 25 50 75 100
Chile 2
Poland 1
Slovenia 1
Latvia 2
United Kingdom 2
United States 2
Ireland 1
Austria 2
Portugal 2
Belgium 1
Netherlands 2
Germany 1
New Zealand 1
Czech Rep. 2
OECD (22)
France 2
Canada 2
Australia 1
Israel 2
Sweden 2
Estonia 3
Iceland* 2
Finland 1
Denmark 3
Japan 2
Italy 1
Korea 1
Norway 1
Age-standardised survival (%)
2008-2013 1998-2003
40% 44% 46% 49% 49%
0%
20%
40%
60%
80%
100%
2009 2010 2011 2012 2013
% o
f w
om
en
se
nt
a le
tte
r

24
Figure 25: Percentage of women sent an invitation letter who receive a Pap smear within 12 months
32% 33% 33% 32% 32%
0%
20%
40%
60%
80%
100%
2009 2010 2011 2012 2013
% o
f w
om
en
se
nt
a le
tte
r

25
MENTAL HEALTH
Tracer conditions: Depression, substance abuse
Summary of empirical findings
While the benefits package in Latvia does cover a psychological assessment during a wellness visit,
as with the other conditions that do not have explicit screening programs, it is difficult to assess
performance related to screening without more information about what happened during these visits.
There is some information that can be gleaned, however, from examining the location of initial
diagnoses. If they predominantly occur outside of the primary care setting, this could be suggestive of
weak screening. For patients who had received a depression diagnosis in Latvia during the 2010-2014
period, a majority of them received it in a primary care setting (Figure 26), although a non-trivial fraction
are first diagnosed in inpatient or emergency settings. In contrast, only a minority of substance abuse
patients are first diagnosed in a primary care setting (Figure 27), although over time initial diagnoses at
this level have been increasing.
Depression is underdiagnosed in Latvia. Less than 1 percent of the population appears in the
payment data with a diagnosis of depression in 2011, even though estimates of the incidence of
depression range from 3 to 6 percent according to the NICE standard and the WHO Mental Health
Surveys that suggest that 1 in 20 people suffer from depression.8 Depression is also markedly
underdiagnosed among patients with cancer and post-partum mothers (Figures 28 and 29). For the
latter, not only is the prevalence in this population far below the international benchmark of 10 to 15
percent, but it is also falls below prevalence in the general population.9 More telling is the finding
presented in the accompanying review of the benefits package that a mental health diagnosis does not
appear in the top five most frequent diagnoses among individuals committing suicide in the 2009-2014
period.
Without clinical information, it is not possible to assess whether patients are getting the
appropriate levels and combinations of psychotherapy and medication. Current de jure coverage under
the benefits package, however, suggests that treatment may fall short, as there is no coverage for
psychotherapy for basic depression and reimbursement rates of 50% for antidepressants.
8 Depression prevalence was measured by taking the total number of unique personal identification numbers with
a diagnosis of depression in 2011 in the payment data, disease registries, or death registry (numerator) and dividing this by the total number of people in Latvia in the 2011 Census (denominator). 9 Robertson, E., Celasun, N., and Stewart, D.E. (2003), “Risk factors for postpartum depression,” In Stewart, D.E.,
Robertson, E., Dennis, C.-L., Grace, S.L., & Wallington, T.(2003). Postpartum depression: Literature review of risk factors and intervention

26
Follow-up care for patients diagnosed with depression appears adequate. Throughout the year,
they make multiple contacts with both GPs and specialists (Figures 30 and 31), although close to 30% of
depression patients requiring hospitalization do not see a mental health specialist within 90 days of
discharge (Figure 32).
Follow-up care for substance abuse patients, on the other hand, is much weaker. While they still make
contact with both GPs and mental health specialists (Figures 33 and 34), a large majority do not receive
specialist care within 90 days of discharge (Figure 35).
Recommendations
The current wellness check contains a psychological assessment, but there is no way of currently
assessing the extent to which physicians are using this to screen for depression. Moreover, as a large
majority of the population does not receive an annual check-up, this service should not serve as the
health system’s main strategy for detecting depression (according to the NHS payment records, less
than one third of women over the age of 20 years had a wellness check in 2014). The Ministry of Health
and the National Health Service could encourage greater use of opportunistic screening at the primary
care level if electronic health records with decision support were introduced or if the GP performance
payments incentivized screening or penalized previously undiagnosed hospital admissions. For high risk
patients, such as cancer patients or new mothers, more organized screening would be warranted and
could be incorporated into clinical guidelines.
Improved screening should increase diagnosis rates.
The Ministry of Health has little visibility on the quality of care that mental health patients
receive in outpatient settings, at least from available data. This is an important knowledge gap,
especially as Latvia begins to deinstitutionalize patients currently in long-term facilities and to expand
coverage of mental health services in primary and ambulatory specialist settings. To shed light on this
issue, the Ministry of Health, together with the Health Inspectorate and the medical faculties, could
consider measuring quality of care through provider observations and unannounced standardized
patients.
To encourage more frequent and timelier follow-up care among patients hospitalized for
depression or substance abuse, the NHS could bundle payments for treatment and follow-up as earlier
suggested for AMI and stroke patients.

27
Main findings
Figure 26: Care setting of initial depression diagnoses
Figure 27: Care setting of initial substance abuse diagnoses
64% 61% 62% 56% 53%
30% 26% 25% 30% 34%
0%
20%
40%
60%
80%
100%
2010 2011 2012 2013 2014
% o
f in
itia
l dia
gn
ose
s
primary care outpatient specialist inpatient SEMS death registry
7% 15% 24% 25% 26%
51% 44% 38% 38% 35%
32% 26% 24% 24% 22%
0%
20%
40%
60%
80%
100%
2010 2011 2012 2013 2014
% o
f in
itia
l dia
gn
ose
s
primary care outpatient specialist inpatient SEMS death registry

28
Figure 28: Percentage of patients with active cancer diagnosis who also have a depression diagnosis
Figure 29: Percentage of postpartum patients who had a depression diagnosis within 12 months after birth
1.7% 1.9% 2.0% 2.1% 1.8% 1.8%
15%
0%
2%
4%
6%
8%
10%
12%
14%
16%
% o
f a
ctiv
e c
an
cer
pa
tie
nts
0.30% 0.35% 0.41% 0.44% 0.39% 0.35%
12.5%
0%
2%
4%
6%
8%
10%
12%
14%
% o
f p
ost
pa
rtu
m w
om
en

29
Figure 30: Number of outpatient visits to GP per year for people diagnosed with depression
Figure 31: Number of outpatient visits to mental health specialist per year for people diagnosed with depression
Figure 32: Timing of first follow-up visit with a mental health specialist for inpatient discharges with a depression diagnosis
7.5 7.6 7.4 7.3 6.6
0.0
2.0
4.0
6.0
8.0
10.0
2009 2010 2011 2012 2013
Nu
mb
er
of
visi
ts
4.0 4.3 4.2 4.1 4.5
0.0
1.0
2.0
3.0
4.0
5.0
2009 2010 2011 2012 2013
Nu
mb
er
of
visi
ts
0%
20%
40%
60%
80%
100%
2009 2010 2011 2012 2013
% o
f in
pa
tie
nt
dis
cha
rge
s w
ith
fo
llow
-up
within 30 days within 31-60 days within 61-90 days no visit within 90 days

30
Figure 33: Number of outpatient visits to GP per year for people diagnosed with substance abuse
Figure 34: Number of outpatient visits to mental health specialist per year for people diagnosed with substance abuse
Figure 35: Timing of first follow-up visit to a mental health specialist for inpatient discharges with a substance abuse
diagnosis
3.1 3.4
3.8 4.0 3.8
0.0
1.0
2.0
3.0
4.0
5.0
2009 2010 2011 2012 2013
Nu
mb
er
of
visi
ts
2.9 3.3 3.2 3.4 3.4
0.0
1.0
2.0
3.0
4.0
2009 2010 2011 2012 2013
Nu
mb
er
of
visi
ts
68% 58% 58% 57% 58%
0%
20%
40%
60%
80%
100%
2009 2010 2011 2012 2013
% o
f in
pa
tie
nt
dis
cha
rge
s w
ith
fo
llow
-up
within 30 days within 31-60 days within 61-90 days no visit within 90 days

31
MATERNAL AND PERINATAL CARE
This section compares the pathways of women who experienced a perinatal death in the 2009-2014
period and women who did not, where perinatal mortality is identified in the Newborn Registry. Given
the diverse set of case histories within these groups, it is difficult to assess performance related to
treatment and follow-up.
Summary of empirical findings
During the 2009-2014 period, screening for women who would go on to experience a perinatal
death was much less frequent compared to other women whose babies did not die in utero or at birth.
They were less likely to start prenatal care on time and they showed lower – sometimes markedly lower
– take-up rates for tests that are supposed to occur during the prenatal period, such as genetic
screening and blood tests for HIV, tuberculosis, and viral hepatitis (Table 3). They were also more likely
to forgo prenatal care completely.
Despite these differences in screening, the disease profiles of the two groups of women look
very similar, according to the “maternal diseases and unfavorable conditions during pregnancy” (Table
4) along with “complications during pregnancy” listed in the Birth Registry.
It is possible that these conditions that are getting diagnosed are not managed as well among
women who go on to experience a perinatal death, as they make fewer prenatal visits overall during
their pregnancies. According to the visit data in the NHS payment records, these women make an
average of 5.3 prenatal visits, compared to an average of 6.1 visits for women who do not experience a
prenatal death. Indeed more direct evidence that some deaths could be prevented with better
management comes from an examination of the causes of death and addictions among mothers. The
leading cause of perinatal mortality in Latvia is intrauterine hypoxia (Table 5), and while there are many
potential causes for this, maternal smoking is one cause that is considered preventable. During the
2009-2014 period, more than 17 percent of mothers experiencing a perinatal death exhibited an
addictive behavior, compared to less than 10 percent among mothers who did not have a perinatal
death, and smoking accounted for nearly 90 percent of these addictions.

32
Recommendations
The available evidence suggests room for improvement in prenatal care. While it is worth
exploring the extent to which providers can be financially incentivized through their contracts to
provide a complete package of prenatal care for their patients, experimenting with patient
incentives and outreach could also be options. The women who experienced perinatal deaths in
Latvia during the 2009-2014 period came from less advantaged backgrounds than the women
who did not, according to the information recorded in the Birth Registry (Only 32% of women
with perinatal deaths had progressed beyond secondary education, compared to 45% among
women without perinatal deaths). These women may face greater barriers in accessing care,
such as lack of transport options or less flexible work arrangements, and they may require
targeted assistance.
Main findings
Table 3: Prenatal screening for mothers with and without perinatal deaths, 2009-2014
Mothers without perinatal death Mothers with perinatal death
No prenatal care 1.76% 8.74%
Timely prenatal care 92.85% 79.33%
Genetic screening in first trimester 66.00% 58.71%
HIV test 97.36% 87.99%
Tuberculosis test 85.24% 6.71%
Viral hepatitis test 17.51% 4.45%
Number of observations 119,896 1,282
Source: Birth Registry, Center for Disease Prevention and Control. All differences between the two columns are
statistically significant at the 5% level.

33
Table 4: Maternal diseases and unfavorable conditions during pregnancy, 2009-2014
Women with perinatal deaths Women without perinatal deaths
Frequency Percent Frequency Percent
other diseases 189 38.81 other diseases 19,434 46.93
other diseases of genitourinary system 142 29.16 other diseases of genitourinary system 10,797 26.07 other endocrine, nutritional and metabolic 22 4.52 streptococcus, group B 1,866 4.51
other sexually transmitted diseases 18 3.7 other endocrine, nutritional and metabolic 1,719 4.15
gestational diabetes mellitus 18 3.7 other sexually transmitted diseases 1,182 2.85
viral hepatitis 16 3.29 diseases of circulatory system 946 2.28
syphilis in previous anamnesis 13 2.67 gestational diabetes mellitus 930 2.25
diseases of circulatory system 10 2.05 viral hepatitis 910 2.2
adiposity 8 1.64 adiposity 827 2
diabetes mellitus Type 1 7 1.44 renal disorder 568 1.37
HIV 7 1.44 syphilis also in previous anamnesis 546 1.32
chronical hypertension 7 1.44 in vitro fertilization IVF 365 0.88
renal disorder 7 1.44 thyroid dysfunction 357 0.86
in vitro fertilization IVF 6 1.23 HIV 272 0.66
streptococcus, group B 4 0.82 chlamydia 183 0.44
thyroid dysfunction 4 0.82 diabetes mellitus Type 1 142 0.34
chlamydia 3 0.62 chronical hypertension 135 0.33
in vitro fertilization ICSI 3 0.62 congenital malformations of circulatory 107 0.26
gonococcus infection 1 0.21 in vitro fertilization ICSI 59 0.14
diabetes mellitus Type 2 1 0.21 diabetes mellitus Type 2 33 0.08
congenital malformations of circulatory 1 0.21 insemination 19 0.05
gonococcus infection 18 0.04
Total observations 487 100 Total observations 41,415 100

34
Table 5: Top ten causes of perinatal death, 2009-2014
ICD-10 Code Frequency Percent
Intrauterine hypoxia before labor P20.0 429 33.46
Intrauterine hypoxia during labor and delivery P20.1 90 7.02
Neonatal cerebral ischaemia P91.0 75 5.85
Sudden Infant Death Syndrome R95 61 4.76
Multiple congenital malformations, not elsewhere classified Q89.7 54 4.21
Birth asphyxia, unspecified P21.9 50 3.9
Condition originating in the perinatal period, unspecified P96.9 49 3.82
Unspecified intraventricular (nontraumatic) haemorrhage of fetus and newborn P52.3 43 3.35
Congenital pneumonia, unspecified P23.9 31 2.42
Bacterial sepsis of newborn, unspecified P36.9 31 2.42

35
MONITORING FUTURE BOTTLENECKS
Calculating the indicators in the preceding sections (and the empirical evidence presented in
accompanying World Bank reports) has revealed a number of areas for improvement when it comes to
data quality. While it should be noted that much of the data used was not intended for analysis but
rather for making payments, investing more in data quality will not only improve the ability of the
Ministry of Health and the NHS to monitor system bottlenecks in the future. It will also help increase the
accuracy and transparency of medical billing.
There were three main data quality issues that made it difficult to track patients’ journeys through the
health system: accuracy, consistency, and completeness.
Accuracy
Data accuracy refers to the degree to which the data correctly describe the events or conditions they are
intending to describe. In the data used for this report and accompanying reports prepared by the World
Bank, a lack of accuracy surfaced for many fields:
Coding of diagnoses. Many physicians use ICD-10 codes for conditions with a confirmed
diagnosis (for example, C50 for confirmed breast cancer) for patients only suspected of the
illness, even though there are corresponding ICD-10 codes for suspected cases that are used by
some physicians in Latvia. There are also errors of omission. For example, 21% of inpatients
discharged from hospital with a self-harm diagnosis did not also have a mental health and
behavioral disorder diagnosis. For the bottleneck analysis, this made it difficult to identify the
people who needed to be tracked.
Recording of dates. The NHS and the CDPC have cautioned that dates are recorded with delay.
Indeed there are some cancer patients that receive treatment before they appear in the data
with a corresponding ICD-10 cancer code. For the bottleneck analysis, this complicates
interpreting any calculation related to the time elapsed between two events (for example,
diagnosis and treatment) and thus prevents accurate measurement of waiting times. Also, in the
health care person’s data base with certificates, there are many implausible dates, which makes
it challenging to count the number of currently certified physicians in a given specialty.
Consistency
Data consistency refers to a situation in which two or more representations of something have the same
value and format either within a database or across databases. In the Latvian data, there was a lack of
consistency within databases and across data sources:

36
In the reimbursable medicines database (not used in this report), the stated state-reimbursed
proportion of the total price of the medicine did not match the same proportion calculated from
the stated state contribution and the stated patient contribution. More than 80% of
observations were inconsistent in this sense.
SEMS does not use ICD-10 Codes for all calls but rather its own coding system. It also does not
record the patient IDs of patients receiving services from its cadre of specialists. This makes it
difficult to track patients across emergency services and services paid through NHS contracts.
For some cancers and some years, a non-trivial fraction (up to 15%) of patients who received
cancer treatment in the NHS payment data never appeared in the CDPC Cancer Registry.
The diabetes registry of the CDPC contained only 52% of people diagnosed with diabetes
between 2009 and 2014 in the NHS payment data.
Completeness
Data completeness refers to a situation in which there are no blank values for fields that should not be
blank. In the reimbursable medicines database, the coding of medication is highly incomplete and non-
standardized. Pharmacy IT systems do not seem to include standard codes and names for medications,
and information appears to be entered manually by pharmacists. This makes it very difficult to check
drug adherence for the restricted set of patients that do pick up prescriptions, as it would involve
performing string searches for multiple potential variants of a single drug’s name.
Missing information
Related to completeness is information that is just missing. In Latvia, the timing of some important
events is not currently recorded in the NHS payment data – in particular, the dates on which physicians
make a referral for a consultation or diagnostic test and the dates on which they prescribe a medication.
Currently, these dates appear in the NHS database only if patients do seek care from the referred
physician, do receive the referred diagnostic exam, or do pick up their prescriptions. Without recording
these dates for all patients, it is not possible to distinguish a situation in which a physician neglects to
make a referral or prescribe a medication from a situation in which the patient simply fails to follow
through on a referral or prescription. More importantly, it will not be possible to accurately measure
waiting times for certain specialties and diagnostic exams. Currently waiting times are self-reported to
the NHS by health care providers.
The lack of data on privately financed care is also problematic. Without this information, it will not be
possible to tell whether providers completely exhaust their quotas before charging patients or whether
they engage in price discrimination in order to maximize profits. It will also be impossible to completely
trace patients throughout the health system and accurately measure the extent to which they need to
37
rely on private services to meet their essential healthcare needs. Data on privately financed services will
also help the NHS both balance cost containment measures like quotas with more information on
population needs and more accurately predict the extent to which performance incentives contribute to
a provider’s total earnings.
Recommendations
Many, if not most, of these data issues stem from the absence of a real-time information system and
limited knowledge of disease coding, and investment in an Electronic Health Record (EHR) could be a
potential solution.
The current post-entry/upload system is highly vulnerable to manipulation of dates, especially in a quota
environment. It is also burdensome for both physicians and patients as data entry likely takes
considerable time away from patient care.
An EHR, on the other hand, would automatically record dates and other information relevant for
payments, in addition to clinical information that could be used in clinical audits and other assessments
of quality of care.
An EHR could also be vehicle for encouraging take-up of other reforms suggested in accompanying
World Bank reports, such as clinical guidelines and clinical pathways, as some elements of decision-
support could be incorporated into the interface. The EHR could also contribute more metrics that
could be used for augmenting performance-based payments. Moreover, having an EHR serve a
complete medical record for every patient would be a natural way to collect comparable information on
privately financed care.
Implementing an EHR in Latvia will require considerable training of all healthcare providers, which will
also provide an opportunity to offer guidelines and training for disease and procedure coding. The
clinical information of the EHR could provide sufficient information to carry out basic checks on the
usage of coding, which could be immediately incorporated as feedback to providers.
The EHR would not solve all of the data issues flagged above. Independently, the pharmaceutical
dispensing and payment data system needs to be updated. Options for the description of medication
and reimbursement rates would ideally be standardized and pre-coded.

38
APPENDIX 1: DIRECTORY OF INDICATORS
CARDIOVASCULAR CONDITIONS
Status DONE
Indicator Nr CVD5
Indicator Percentage of hypertension patients with annual serum renal function and albuminuria tests performed
Tracer Hypertension
Numerator or calculation Among people in the denominator: Number of people who had urine test for microalbuminaria within 365 days of the first appearance of diagnosis of hypertension in year t.
Denominator or set of people for whom to calculate
Number of people with a diagnosis of hypertension in year t, as per any NHS or SEMS database.
Source of data 1 Numerator: NHS outpatient manipulation data.
Source of data 2 Denominator: NHS inpatient and outpatient databases. SEMS database
Diagnosis and manipulation codes
Microalbuminaria: 41101
Outstanding issues
Notes Compute for 2009-2013. The denominator excludes cases where the initial diagnosis in year t appeared through the death registry.
References
Status DONE
Indicator Nr CVD6
Indicator Percentage of hypertension patients with annual (random) blood glucose tests
Tracer Hypertension
Numerator or calculation Among people in the denominator: Number of people who had blood glucose test within 365 days of the first appearance of diagnosis of hypertension in year t.
Denominator or set of people for whom to calculate
Number of people with a diagnosis of hypertension in year t, as per any NHS or SEMS database.
Source of data 1 Numerator: NHS outpatient manipulation data.
Source of data 2 Denominator: NHS inpatient and outpatient databases. SEMS database
Diagnosis and manipulation codes
Blood glucose tests: 41095 41096 41102 Also incude HgA1C because of potential co-morbidity: 41103 41104 41105 41097
Outstanding issues
Notes Compute for 2009-2013. The denominator excludes cases where the initial diagnosis in year t appeared through the death registry.
References

39
Status DONE
Indicator Nr CVD7
Indicator Percentage of hypertension patients with annual creatinine tests
Tracer Hypertension
Numerator or calculation Among people in the denominator: Number of people who had creatinine test within 365 days of the first appearance of diagnosis of hypertension in year t.
Denominator or set of people for whom to calculate
Number of people with a diagnosis of hypertension in year t, as per any NHS or SEMS database.
Source of data 1 Numerator: NHS outpatient manipulation data.
Source of data 2 Denominator: NHS inpatient and outpatient databases. SEMS database
Diagnosis and manipulation codes
Creatinine: 41006
Outstanding issues
Notes Compute for 2009-2013. The denominator excludes cases where the initial diagnosis in year t appeared through the death registry.
References
Status DONE
Indicator Nr CVD87
Indicator # of GP visits per year, conditional on hypertension diagnosis
Tracer Hypertension
Numerator or calculation For people in the denominator: Number of visits to a GP within 365 days of the first diagnosis of hypertension in year t
Denominator or set of people for whom to calculate
Number of people with a diagnosis of hypertension in year t, as per any NHS or SEMS database.
Source of data 1 Visits to GPs: NHS outpatient payment data and specialist certificate database
Source of data 2 Denominator: NHS inpatient and outpatient databases. SEMS database
Diagnosis and manipulation codes
See diagnosis codes in the diagnosis codes sheet
Outstanding issues
Notes Compute for 2009-2013. The denominator excludes cases where the initial diagnosis in year t appeared through the death registry. Uses the more narrow primary care physician approach (PCP specialist only), not the broader approach (PCP specialists plus non
References
Status DONE
Indicator Nr CVD87
Indicator # of GP visits per year, conditional on hypertension diagnosis
Tracer Hypertension
Numerator or calculation For people in the denominator: Number of visits to a GP within 365 days of the first diagnosis of hypertension in year t
Denominator or set of Number of people with a diagnosis of hypertension in year t, as per any NHS or

40
people for whom to calculate
SEMS database.
Source of data 1 Visits to GPs: NHS outpatient payment data and specialist certificate database
Source of data 2 Denominator: NHS inpatient and outpatient databases. SEMS database
Diagnosis and manipulation codes
See diagnosis codes in the diagnosis codes sheet
Outstanding issues
Notes Compute for 2009-2013. The denominator excludes cases where the initial diagnosis in year t appeared through the death registry. Uses the more narrow primary care physician approach (PCP specialist only), not the broader approach (PCP specialists plus non
References
Status DONE
Indicator Nr CVD88
Indicator # of outpatient visits to cardio specialists, conditional on hypertension diagnosis
Tracer Hypertension
Numerator or calculation For people in the denominator: Number of outpatient visits to a cardio specialist within 365 days of the first diagnosis of hypertension in year t
Denominator or set of people for whom to calculate
Number of people with a diagnosis of hypertension in year t, as per any NHS or SEMS database.
Source of data 1 Visits to cardio specialists: NHS outpatient payment data and specialist certificate database
Source of data 2 Denominator: NHS inpatient and outpatient databases. SEMS database
Diagnosis and manipulation codes
See diagnosis codes in the diagnosis codes sheet
Outstanding issues
Notes Compute for 2009-2013. The denominator excludes cases where the initial diagnosis in year t appeared through the death registry.
References
Status DONE
Indicator Nr CVD18a_total, CVD18b_LDL, CVD18c_HDL
Indicator Cholesterol (total & fraction) tests performed annually for diabetes patients
Tracer Diabetes
Numerator or calculation Among people in the denominator: Number of people who had total and fraction cholesterol tests within 365 days of the first appearance of diagnosis of diabetes in year t.
Denominator or set of people for whom to calculate
Number of people with a diagnosis of diabetes in year t, as per any NHS or SEMS database.
Source of data 1 Numerator: NHS outpatient manipulation data.
Source of data 2 Denominator: NHS inpatient and outpatient databases. SEMS database
Diagnosis and Total: 41056 41057 41045

41
manipulation codes LDL:41058 41059 41060 41055 HDL: 41047 41054
Outstanding issues
Notes Compute for 2009-2013. The denominator excludes cases where the initial diagnosis in year t appeared through the death registry.
References
Status DONE
Indicator Nr CVD19
Indicator Percentage of diabetes patients with annual serum renal function and albuminuria tests performed
Tracer Diabetes
Numerator or calculation Among people in the denominator: Number of people who had urine test for microalbuminaria within 365 days of the first appearance of diagnosis of diabetes in year t.
Denominator or set of people for whom to calculate
Number of people with a diagnosis of diabetes in year t, as per any NHS or SEMS database.
Source of data 1 Numerator: NHS outpatient manipulation data.
Source of data 2 Denominator: NHS inpatient and outpatient databases. SEMS database
Diagnosis and manipulation codes
Microalbuminaria: 41101
Outstanding issues
Notes Compute for 2009-2013. The denominator excludes cases where the initial diagnosis in year t appeared through the death registry.
References
Status DONE
Indicator Nr CVD20
Indicator Percentage of diabetes patients with an annual HgA1c tests performed
Tracer Diabetes
Numerator or calculation Among people in the denominator: Number of people who had HgAIc test within 365 days of the first appearance of diagnosis of diabetes in year t.
Denominator or set of people for whom to calculate
Number of people with a diagnosis of diabetes in year t, as per any NHS or SEMS database.
Source of data 1 Numerator: NHS outpatient manipulation data.
Source of data 2 Denominator: NHS inpatient and outpatient databases. SEMS database
Diagnosis and manipulation codes
HgA1C: 41103 41104 41105 41097
Outstanding issues
Notes Compute for 2009-2013. The denominator excludes cases where the initial diagnosis in year t appeared through the death registry.

42
References
Status DONE
Indicator Nr CVD21
Indicator Percentage of diabetes patients with annual creatinine tests
Tracer Diabetes
Numerator or calculation Among people in the denominator: Number of people who had creatinine test within 365 days of the first appearance of diagnosis of diabetes in year t.
Denominator or set of people for whom to calculate
Number of people with a diagnosis of diabetes in year t, as per any NHS or SEMS database.
Source of data 1 Numerator: NHS outpatient manipulation data.
Source of data 2 Denominator: NHS inpatient and outpatient databases. SEMS database
Diagnosis and manipulation codes
Creatinine: 41006
Outstanding issues
Notes Compute for 2009-2013. The denominator excludes cases where the initial diagnosis in year t appeared through the death registry.
References
Status DONE
Indicator Nr CVD89
Indicator # of GP visits per year, conditional on diabetes diagnosis
Tracer Diabetes
Numerator or calculation Among people in the denominator: Number of visits to a GP within 365 days of the first diagnosis of diabetes in year t
Denominator or set of people for whom to calculate
Number of people with a diagnosis of diabetes in year t, as per any NHS or SEMS database.
Source of data 1 Visits to GPs: NHS outpatient payment data and specialist certificate database
Source of data 2 Denominator: NHS inpatient and outpatient databases. SEMS database
Diagnosis and manipulation codes
See diagnosis codes in the diagnosis codes sheet
Outstanding issues
Notes Compute for 2009-2013. The denominator excludes cases where the initial diagnosis in year t appeared through the death registry. Uses the more narrow primary care physician approach (PCP specialist only), not the broader approach (PCP specialists plus non
References
Status DONE
Indicator Nr CVD90
Indicator # of outpatient visits to endocrinology specialists, conditional on diabetes diagnosis

43
Tracer Diabetes
Numerator or calculation For people in the denominator: (Sum of ) Number of outpatient visits to an endocrinology specialist within 365 dayshs of the first diagnosis of depression in year t
Denominator or set of people for whom to calculate
Number of people with a diagnosis of diabetes in year t, as per any NHS or SEMS database.
Source of data 1 Visits to endocrinology specialists: NHS outpatient payment data and specialist certificate database
Source of data 2 Denominator: NHS inpatient and outpatient databases. SEMS database
Diagnosis and manipulation codes
See diagnosis codes in the diagnosis codes sheet
Outstanding issues
Notes Compute for 2009-2013. The denominator excludes cases where the initial diagnosis in year t appeared through the death registry.
References
Status DONE
Indicator Nr CVD31a, CVD31b, CVD31c
Indicator Timing of first follow-up visit with a cardiologist for inpatient discharges with a CAD diagnosis (within 30 days, within 31- 60, within 61-90 days, none within 90 days)
Tracer CAD/ AMI/ CHF (separately)
Numerator or calculation For the inpatient discharges in the denominator: (Sum of) Dummy for whether the person discharged had a first follw-up visit with a cardiologist within 30/31-60/61-90 days of the discharge
Denominator or set of people for whom to calculate
Number of live hospital discharges for which the discharge diagnostic codes include a CAD/AMI/CHF code.
Source of data 1 Follow-up visits: NHS outpatient data; Specialties: specialty certificate database
Source of data 2 Inpatient discharges: Inpatient movement data
Diagnosis and manipulation codes
See diagnosis codes in the diagnosis codes sheet
Outstanding issues Only included cardiologist to be in line with the mental health indicator - ?Should we add GP visits to the indicator or not? Computed the indicator for CAD/AMI/CHF separately - should this be lumped together?
Notes Cross check results against previous calculations from Center for Health Economics, to ensure consistency.
References
Status DONE
Indicator Nr CVD37
Indicator Timing of first follow-up visit with a neurologist for inpatient discharges with a stroke diagnosis (within 30 days, within 31- 60, within 61-90 days, none within 90 days)
44
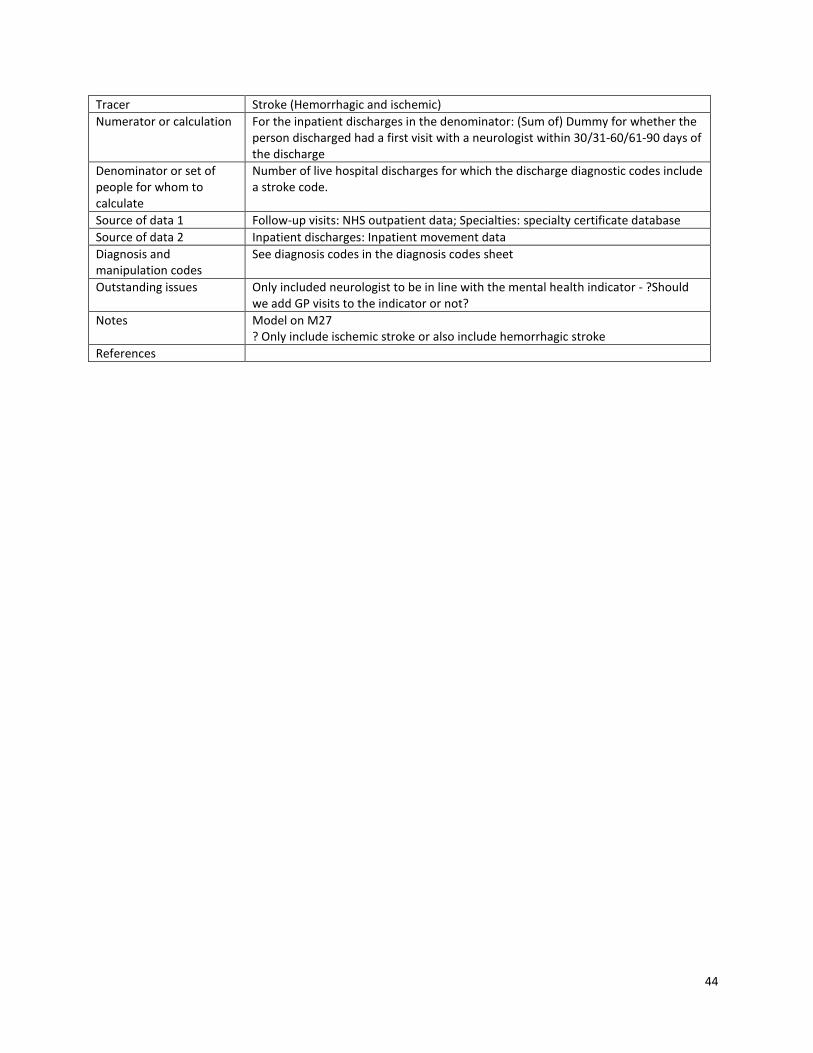
Tracer Stroke (Hemorrhagic and ischemic)
Numerator or calculation For the inpatient discharges in the denominator: (Sum of) Dummy for whether the person discharged had a first visit with a neurologist within 30/31-60/61-90 days of the discharge
Denominator or set of people for whom to calculate
Number of live hospital discharges for which the discharge diagnostic codes include a stroke code.
Source of data 1 Follow-up visits: NHS outpatient data; Specialties: specialty certificate database
Source of data 2 Inpatient discharges: Inpatient movement data
Diagnosis and manipulation codes
See diagnosis codes in the diagnosis codes sheet
Outstanding issues Only included neurologist to be in line with the mental health indicator - ?Should we add GP visits to the indicator or not?
Notes Model on M27 ? Only include ischemic stroke or also include hemorrhagic stroke
References

45
CANCERS
Status DONE
Indicator Nr C02
Indicator % of women aged 50-69 receiving 2 -yearly screening mammograms,
Tracer Breast cancer
Numerator or calculation Number of women age 51 to 69 in year t who had a mammogram in t or t-1
Denominator or set of people for whom to calculate
Total women aged 51-69 in year t
Source of data 1 NHS outpatient databases: manipulation database.
Source of data 2 Women database
Diagnosis and manipulation codes
Manipulation codes: Mammography in other diagnostics
Outstanding issues
Notes Compute for 2010-2014. Denominator includes only alive women at the time of the indicator is computed. If the women died the previous year, it does not count in the denominator. If the women died during the year of the manipulation/diagnosis, it does count for the denominator. We merged the women list into the manipulations database (to look for the relevant manipulation codes) OECD uses country specific guidelines in order to calculate this indicator. The data available excludes privately financed mammograms (private facilities or over-quota situations).
References http://www.oecd-ilibrary.org/docserver/download/8112121ec047.pdf?expires=1460136579&id=id&accname=guest&checksum=EA4C867E103BC33C7BB2ABAB858842FE definition used by OECD is based on the definition used in each country. According to OECD report for 2000-2010 in Latvia is 0.417 using survey data. See Graph 4.8.1
Status DONE
Indicator Nr C03
Indicator % of women sent a mammogram invitation letters in year t, who receive a mammogram within 12 months from sending of the letter.
Tracer Breast cancer
Numerator or calculation Women sent a breast cancer invitation letter on date d in year t and receive a mammogram by d+12 months
Denominator or set of people for whom to calculate
Women sent a breast cancer invitation letter in year t
Source of data 1 NHS outpatient manipulation database: mammogram codes NHS outpatient record database: start date of the outpatient record
Source of data 2
Diagnosis and manipulation codes
Manipulation codes: Mammography in other diagnostics
Outstanding issues
Notes Compute for 2009-2013

46
We merged the list of (PID/year) from invitation database into the outpatient manipulation database. we merged it into the records database (using opr_id) to extract the start date of the outpatient episode. We compared dates of sending letters and start date of the outpatient record. The data available excludes privately financed mammograms (private facilities or over-quota situations).
References
Status DONE
Indicator Nr C05
Indicator Percentage of breast cancers diagnosed at Stage s= 0, I, II, III, IV, Unknown, Unavailable separately by year for 2011, 2012, 2013
Tracer Breast cancer
Numerator or calculation Breast cancer cases diagnosed in year t at stage s or unkonwn or unavailable
Denominator or set of people for whom to calculate
Persons with first diagnosis of breast cancer in year t, conditional on not having the same code in the previous 24 months
Source of data 1 Staging : Cancer registry.
Source of data 2 People : Constructed database on patients with dates of diagnosis and source of data.
Diagnosis and manipulation codes
Diagnosis: breastcancer confirmed
Outstanding issues
Notes Compute for 2011-2013. Years 2009 and 2010 are missing because we need 24 month lead to initial diagnosis . We excluded diagnoses made through the death registry. Around 70% of patients with first diagnosis of breast cancer (confirmed) in year t were not found in cancer registry in year t. Date of diagnosis in cancer registry is not precise. Also, it is not clear if date in cancer registry refers to first date of diagnosis. Note that in year 2014 numbers of observations in the cancer registry dramatically declined since August onwards. We merged datasets (by PID and by year of diagnosis). If person with diagnosis is not in cancer registry, we set staging to "unavailable". Note that in order to merge stages of cancer from cancer registry with list of people first diagnosis with cancer (in a given year) we used year of diagnosis and PID variables. Whitin a given year, the same patient could have more than one stage. We considered only the first stage occurred in that year.
References Benchmark countries (stage I): Canada (43.9%) Denmark (30.1%) Norway (44.5%) Sweden (45.2%) Source: http://www.nature.com/bjc/journal/v108/n5/full/bjc20136a.html

47
Status DONE
Indicator Nr C08
Indicator % of diagnosed patients with at least one outpatient visit with a cancer specialist within 30/60/90/365 days or no visits within a year after diagnosis, separately by year
Tracer Breast cancer
Numerator or calculation Within the denominator, people with outpatient visit with a cancer specialist within 30/60/90/365 days of the initial diagnosis date or without any visits a year of the initial diagnosis date.
Denominator or set of people for whom to calculate
People with first occurence of diagnosis code of cancer (confirmed) in year t, conditional on not having the same code in the previous 24 months.
Source of data 1 Constructed database on patients with dates of diagnosis and source of data.
Source of data 2 Outpatient record data for cancer patients, specialist list for breast cancer
Diagnosis and manipulation codes
Diagnosis: breastcancer confirmed
Outstanding issues
Notes Compute for 2011-2013 as denominator is conditional on not having the same diagnosis 24 months ago, and numerator looks for visits within 365 days. Categories of the indicator should add up to 100%. This indicator is calculated in outpatient visits settings only.
References
Status DONE
Indicator Nr C09
Indicator Time elapsed (in days) between diagnosis (confirmed) and onset of treatment (radiation onc., chemo, surgery), separately by year.
Tracer Breast cancer
Numerator or calculation Onset of treatment: Start date of first inpatient or outpatient record that includes a manipulation code for treatment Date of diagnosis: first occurrence of diagnosis code of breast canacer in year t, conditional on not having the same code in the previo
Denominator or set of people for whom to calculate
People with first occurence of diagnosis code of breast cancer confirmed in year t, conditional on not having the same code in the previous 24 months, conditional on not having the diagnosis date coincide with date of inpatient or outpatient record with
Source of data 1 Constructed database on patients with dates of diagnosis and source of data.
Source of data 2 Outpatient record data for breast cancer confirmed patients, outpatient manipulation data Inpatient record data for breast cancer confirmed patients, inpatient manipulation data
Diagnosis and manipulation codes
Manipulation codes: under treatment codes for radiation therapy, cancer chemo procedure, breast cancer chemo, needle ablation of tumor, partial mastectomy, radical mastectomy. Diagnosis: breastcancer confirmed
Outstanding issues
Notes Compute for 2011-2013. Observations with diagnosis date that coincide with date of inpatient or outpatient
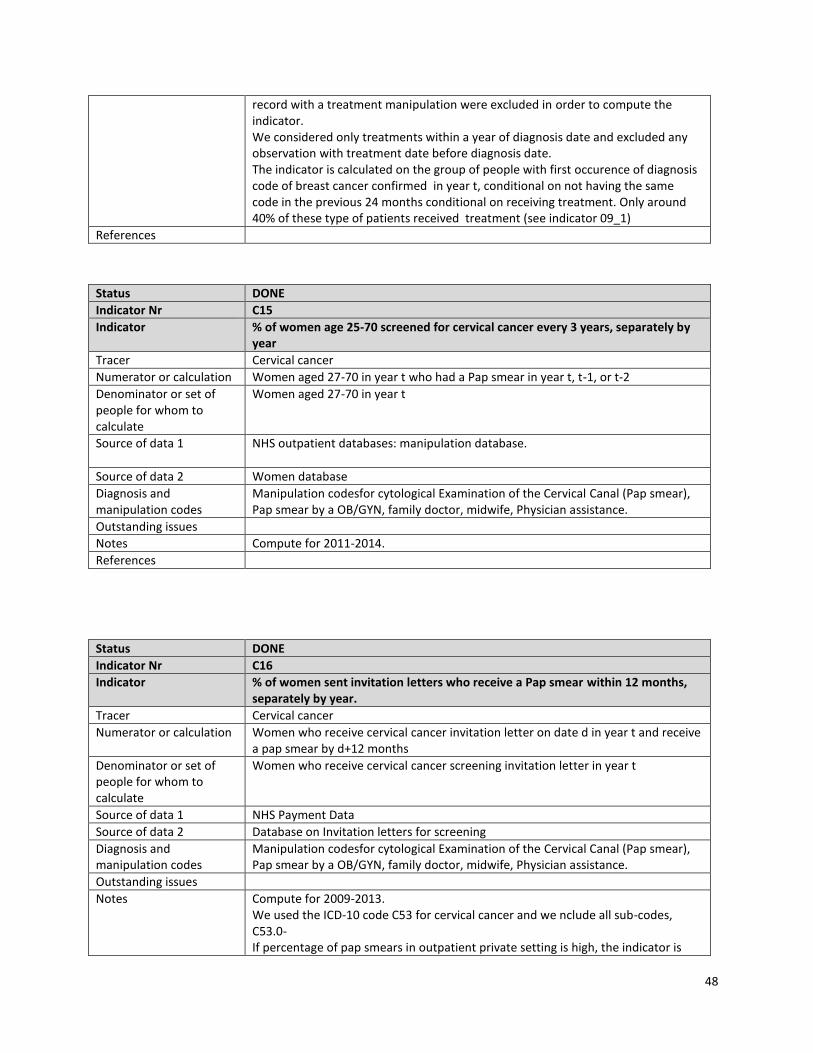
48
record with a treatment manipulation were excluded in order to compute the indicator. We considered only treatments within a year of diagnosis date and excluded any observation with treatment date before diagnosis date. The indicator is calculated on the group of people with first occurence of diagnosis code of breast cancer confirmed in year t, conditional on not having the same code in the previous 24 months conditional on receiving treatment. Only around 40% of these type of patients received treatment (see indicator 09_1)
References
Status DONE
Indicator Nr C15
Indicator % of women age 25-70 screened for cervical cancer every 3 years, separately by year
Tracer Cervical cancer
Numerator or calculation Women aged 27-70 in year t who had a Pap smear in year t, t-1, or t-2
Denominator or set of people for whom to calculate
Women aged 27-70 in year t
Source of data 1 NHS outpatient databases: manipulation database.
Source of data 2 Women database
Diagnosis and manipulation codes
Manipulation codesfor cytological Examination of the Cervical Canal (Pap smear), Pap smear by a OB/GYN, family doctor, midwife, Physician assistance.
Outstanding issues
Notes Compute for 2011-2014.
References
Status DONE
Indicator Nr C16
Indicator % of women sent invitation letters who receive a Pap smear within 12 months, separately by year.
Tracer Cervical cancer
Numerator or calculation Women who receive cervical cancer invitation letter on date d in year t and receive a pap smear by d+12 months
Denominator or set of people for whom to calculate
Women who receive cervical cancer screening invitation letter in year t
Source of data 1 NHS Payment Data
Source of data 2 Database on Invitation letters for screening
Diagnosis and manipulation codes
Manipulation codesfor cytological Examination of the Cervical Canal (Pap smear), Pap smear by a OB/GYN, family doctor, midwife, Physician assistance.
Outstanding issues
Notes Compute for 2009-2013. We used the ICD-10 code C53 for cervical cancer and we nclude all sub-codes, C53.0- If percentage of pap smears in outpatient private setting is high, the indicator is

49
not reliable.
References
Status DONE
Indicator Nr C18
Indicator Percentage of cervical cancers diagnosed at Stage s= 0, I, II, III, IV, Unknown, Unavailable separately by year.
Tracer Cervical cancer
Numerator or calculation Cervical cancer cases diagnosed in year t at stage s or unkonwn or unavailable
Denominator or set of people for whom to calculate
Persons with first diagnosis of this cancer at stage s in year t, conditional on not having the same code in the previous 24 months.
Source of data 1 Staging : Cancer registry.
Source of data 2 People: Constructed database on patients with dates of diagnosis and source of data.
Diagnosis and manipulation codes
Diagnosis: cervical cancer confirmed
Outstanding issues Over 60% of patients with first diagnosis of cervical cancer (confirmed) in year t were not found in cancer registry in year t. Date of diagnosis in cancer registry is not precise. It is not clear if date in cancer registry refers to first date of diag
Notes Compute for 2011-2013. Years 2009 and 2010 are missing because we need 24 month lead to initial diagnosis . We excluded diagnoses made through the death registry Categories of the indicator should add up to 100%. We merged datasets (by PID and by year of diagnosis). If person with diagnosis is not in cancer registry, we set staging to "unavailable". Note that in order to merge stages of cancer from cancer registry with list of people first diagnosis with cancer (in a given year) we used year of diagnosis and PID variables. Whitin a given year, the same patient could have more than one stage. We considered only the first stage occurred in that year.
References
Status DONE
Indicator Nr C22
Indicator Time elapsed (in days) between diagnosis (confirmed) and onset of treatment (radiation onc., chemo, surgery), separately by year.
Tracer Cervical cancer
Numerator or calculation Onset of treatment: Start date of first inpatient or outpatient record that includes a manipulation code for treatment Date of diagnosis: first occurrence of diagnosis code of this canacer in year t, conditional on not having the same code in the previous
Denominator or set of people for whom to calculate
People with first occurence of diagnosis code of this cancer confirmed in year t, conditional on not having the same code in the previous 24 months, conditional on not having the diagnosis date coincide with date of inpatient or outpatient record with a
Source of data 1 Constructed database on patients with dates of diagnosis and source of data.

50
Source of data 2 Outpatient record data for this cancer confirmed patients, outpatient manipulation data Inpatient record data for this cancer confirmed patients, inpatient manipulation data
Diagnosis and manipulation codes
Manipulation codes: under treatment codes for radiation therapy, cancer chemo procedure, cervical cancer chemo, hysterectomy, cone biopsy. We also include laser ablation (20065) and cryodestruction (20057 ) Diagnosis: cervical cancer confirmed
Outstanding issues
Notes Compute for 2011-2013. Observations with diagnosis date that coincide with date of inpatient or outpatient record with a treatment manipulation were excluded in order to compute the indicator. We considered only treatments within a year of diagnosis date and excluded any observation with treatment date before diagnosis date.
References
Status DONE
Indicator Nr C25
Indicator % of 50-74 year olds receiving FOBT within the last year (EU QA guideline for colorectal cancer screening), separately by year
Tracer Colorectal cancer
Numerator or calculation 51-74 year olds in year t receiving at least one FOBT in year t
Denominator or set of people for whom to calculate
Total patients 51-74 year old in year t
Source of data 1 NHS outpatient databases: manipulation database Patient database
Source of data 2
Diagnosis and manipulation codes
Manipulation Codes: 40161, 40173, 40172
Outstanding issues Figures for this indicatorare below 8%. Pls check if we are excluding any relevant manipulation code.
Notes
References
Status DONE
Indicator Nr C27
Indicator Percentage of colo-rectal cancers diagnosed at Stage s= 0, I, II, III, IV, Unknown, Unavailable separately by year.
Tracer Colorectal cancer
Numerator or calculation Colo-rectal cancer cases diagnosed in year t at stage s or unkonwn or unavailable
Denominator or set of people for whom to calculate
Persons with first diagnosis of this cancer at stage s in year t, conditional on not having the same code in the previous 24 months.
Source of data 1 Staging : Cancer registry.
Source of data 2 People: Constructed database on patients with dates of diagnosis and source of

51
data.
Diagnosis and manipulation codes
Diagnosis: colorectal cancer confirmed. ICD-10 code for colo-rectal cancer is C18. Include all sub-codes, C18.0- Recto-sigmoid: C19 Rectum: C20 Carcinoid tumor of appendix, large intestine, rectum: C7A.02.Include all sub-codes, C7A.020-C7A.029
Outstanding issues
Notes Compute for 2011-2013. Years 2009 and 2010 are missing because we need 24 month lead to initial diagnosis . We excluded diagnoses made through the death registry. Around 55% of patients with first diagnosis of colorectal cancer (confirmed) in year t were not found in cancer registry in year t. Date of diagnosis in cancer registry is not precise. Also, it is not clear if date in cancer registry refers to first date of diagnosis. Note that in year 2014 numbers of observations in the cancer registry dramatically declined since August onwards. We merged datasets (by PID and by year of diagnosis). If person with diagnosis is not in cancer registry, we set staging to "unavailable". Note that in order to merge stages of cancer from cancer registry with list of people first diagnosis with cancer (in a given year) we used year of diagnosis and PID variables. Whitin a given year, the same patient could have more than one stage. We considered only the first stage occurred in that year.
Status DONE
Indicator Nr C31
Indicator Time elapsed (in days) between diagnosis (confirmed) and onset of treatment (radiation onc., chemo, surgery), separately by year for 2011, 2012, 2013
Tracer Colorectal cancer
Numerator or calculation Onset of treatment: Start date of first inpatient or outpatient record that includes a manipulation code for treatment Date of diagnosis: first occurrence of diagnosis code of this canacer in year t, conditional on not having the same code in the previous
Denominator or set of people for whom to calculate
People with first occurence of diagnosis code of this cancer confirmed in year t, conditional on not having the same code in the previous 24 months, conditional on not having the diagnosis date coincide with date of inpatient or outpatient record with a
Source of data 1 Constructed database on patients with dates of diagnosis and source of data.
Source of data 2 Outpatient record data for this cancer confirmed patients, outpatient manipulation data Inpatient record data for this cancer confirmed patients, inpatient manipulation data
Diagnosis and manipulation codes
Manipulation codes: see colorectal chemo and colorectal cancer surgery. Diagnosis: colorectal cancer confirmed
Outstanding issues
Notes Observations with diagnosis date that coincide with date of inpatient or outpatient record with a treatment manipulation were excluded in order to compute the indicator. We considered only treatments within a year of diagnosis date and excluded any

52
observation with treatment date before diagnosis date.
References

53
MENTAL HEALTH
Status DONE
Indicator Nr M19
Indicator % of initial diagnoses occuring at primary level
Tracer Depression
Numerator or calculation Among people in the denominator: Number of people who had their initial diagnosis at the primary care level.
Denominator or set of people for whom to calculate
Number of people with a diagnosis of depression in year t, as per any NHS, SEMS or death registry database, who did not have this diagnosis in the preceding 12 months in any NHS or SEMS database.
Source of data 1 NHS inpatient and outpatient databases, SEMS database, death registry
Source of data 2
Diagnosis and manipulation codes
See diagnosis codes in the diagnosis codes sheet
Outstanding issues --
Notes Compute for 2010-2014 Indicators M19 to M23 should add up to 100%
References
Status DONE
Indicator Nr M20
Indicator % of initial diagnoses occuring at specialist outpatient level
Tracer Depression
Numerator or calculation Among people in the denominator: Number of people who had their initial diagnosis in an outpatient specialist setting.
Denominator or set of people for whom to calculate
Number of people with a diagnosis of depression in year t, as per any NHS, SEMS or death registry database, who did not have this diagnosis in the preceding 12 months in any NHS or SEMS database.
Source of data 1 NHS inpatient and outpatient databases, SEMS database, death registry
Source of data 2
Diagnosis and manipulation codes
See diagnosis codes in the diagnosis codes sheet
Outstanding issues --
Notes Compute for 2010-2014 Indicators M19 to M23 should add up to 100%
References
Status DONE
Indicator Nr M5
Indicator # of GP visits per year, conditional on depression diagnosis
Tracer Depression
Numerator or calculation For people in the denominator: Number of visits to a GP within 365 dayss of the first diagnosis of depression in year t
Denominator or set of people for whom to
Number of people with a diagnosis of depression in year t, as per any NHS or SEMS database.

54
calculate
Source of data 1 Numerator: Visits to GPs: NHS outpatient payment data
Source of data 2 Denominator: Diagnosis of depression: diagnostic code for depression in outpatient, inpatient data or SEMS data
Diagnosis and manipulation codes
See diagnosis codes in the diagnosis codes sheet
Outstanding issues
Notes Compute for 2009-2013 Excludes diagnoses made through the death registry Uses the more narrow primary care physician approach (PCP specialist only), not the broader approach (PCP specialists plus non GP primary care providers)
References
Status DONE
Indicator Nr M10
Indicator # of GP visits per year, conditional on substance abuse diagnosis
Tracer Substance abuse
Numerator or calculation For people in the set: Number of GP visits within 365 days after the first diagnosis of depression in year t
Denominator or set of people for whom to calculate
Number of people with a diagnosis of substance abuse in year t, as per any NHS or SEMS database.
Source of data 1 Visits to GPs: NHS outpatient payment data
Source of data 2 Diagnosis of substance abuse: diagnostic code for substance abuse in outpatient, inpatient data or SEMS data
Diagnosis and manipulation codes
See diagnosis codes in the diagnosis codes sheet
Outstanding issues
Notes Compute for 2009-2013 Excludes diagnoses made through the death registry Uses the more narrow primary care physician approach (PCP specialist only), not the broader approach (PCP specialists plus non GP primary care providers)
References
Status DONE
Indicator Nr M6
Indicator # of outpatient visits to mental health specialists, conditional on depression diagnosis
Tracer Depression
Numerator or calculation For people in the denominator: Number of outpatient visits to a relevant specialist within 365 dayshs of the first diagnosis of depression in year t
Denominator or set of people for whom to calculate
Number of people with a diagnosis of depression in year t, as per any NHS or SEMS database.
Source of data 1 Numerator: Visits to mental health specialists: NHS outpatient payment data and specialist certificate database
Source of data 2 Denominator: Diagnosis of depression: diagnostic code for depression in outpatient, inpatient data or SEMS data
Diagnosis and See diagnosis codes in the diagnosis codes sheet

55
manipulation codes
Outstanding issues
Notes Compute for 2009-2013 Excludes diagnoses made through the death registry
References
Status DONE
Indicator Nr M11
Indicator # of outpatient visits to relevant specialists per year, conditional on substance abuse diagnosis
Tracer Substance abuse
Numerator or calculation For people in the set: Number of ambulance visits within 365 days after the first diagnosis of substance abuse in year t
Denominator or set of people for whom to calculate
Number of people with a diagnosis of substance abuse in year t, as per any NHS or SEMS database.
Source of data 1 Visits to mental health specialists: NHS outpatient payment data and specialist certificate database
Source of data 2 Diagnosis of substance abuse: diagnostic code for substance abuse in outpatient, inpatient data or SEMS data
Diagnosis and manipulation codes
See diagnosis codes in the diagnosis codes sheet
Outstanding issues
Notes Compute for 2009-2013 Excludes diagnoses made through the death registry
References
Status DONE
Indicator Nr M19
Indicator % of initial diagnoses occuring at primary level
Tracer Substance abuse
Numerator or calculation Among people in the denominator: Number of people who had their initial diagnosis at the primary care level.
Denominator or set of people for whom to calculate
Number of people with a diagnosis ofsubstance abuse in year t, as per any NHS, SEMS or death registry database, who did not have this diagnosis in the preceding 12 months in any NHS or SEMS database.
Source of data 1 NHS inpatient and outpatient databases, SEMS database, death registry
Source of data 2
Diagnosis and manipulation codes
See diagnosis codes in the diagnosis codes sheet
Outstanding issues --
Notes Compute for 2010-2014 Indicators M19 to M23 should add up to 100%
References
Status DONE
Indicator Nr M20

56
Indicator % of initial diagnoses occuring at specialist outpatient level
Tracer Substance abuse
Numerator or calculation Among people in the denominator: Number of people who had their initial diagnosis in an outpatient specialist setting.
Denominator or set of people for whom to calculate
Number of people with a diagnosis ofsubstance abuse in year t, as per any NHS, SEMS or death registry database, who did not have this diagnosis in the preceding 12 months in any NHS or SEMS database.
Source of data 1 NHS inpatient and outpatient databases, SEMS database, death registry
Source of data 2
Diagnosis and manipulation codes
See diagnosis codes in the diagnosis codes sheet
Outstanding issues --
Notes Compute for 2010-2014 Indicators M19 to M23 should add up to 100%
References
Status DONE
Indicator Nr M21
Indicator % of initial diagnoses occuring in inpatient settings
Tracer Depression
Numerator or calculation Among people in the denominator: Number of people who had their initial diagnosis in an inpatient setting.
Denominator or set of people for whom to calculate
Number of people with a diagnosis of depression in year t, as per any NHS, SEMS or death registry database, who did not have this diagnosis in the preceding 12 months in any NHS or SEMS database.
Source of data 1 NHS inpatient and outpatient databases, SEMS database, death registry
Source of data 2
Diagnosis and manipulation codes
See diagnosis codes in the diagnosis codes sheet
Outstanding issues --
Notes Compute for 2010-2014 Indicators M19 to M23 should add up to 100%
References
Status DONE
Indicator Nr M21
Indicator % of initial diagnoses occuring in inpatient settings
Tracer Substance abuse
Numerator or calculation Among people in the denominator: Number of people who had their initial diagnosis in an inpatient setting.
Denominator or set of people for whom to calculate
Number of people with a diagnosis ofsubstance abuse in year t, as per any NHS, SEMS or death registry database, who did not have this diagnosis in the preceding 12 months in any NHS or SEMS database.
Source of data 1 NHS inpatient and outpatient databases, SEMS database, death registry
Source of data 2
Diagnosis and manipulation codes
See diagnosis codes in the diagnosis codes sheet
Outstanding issues --
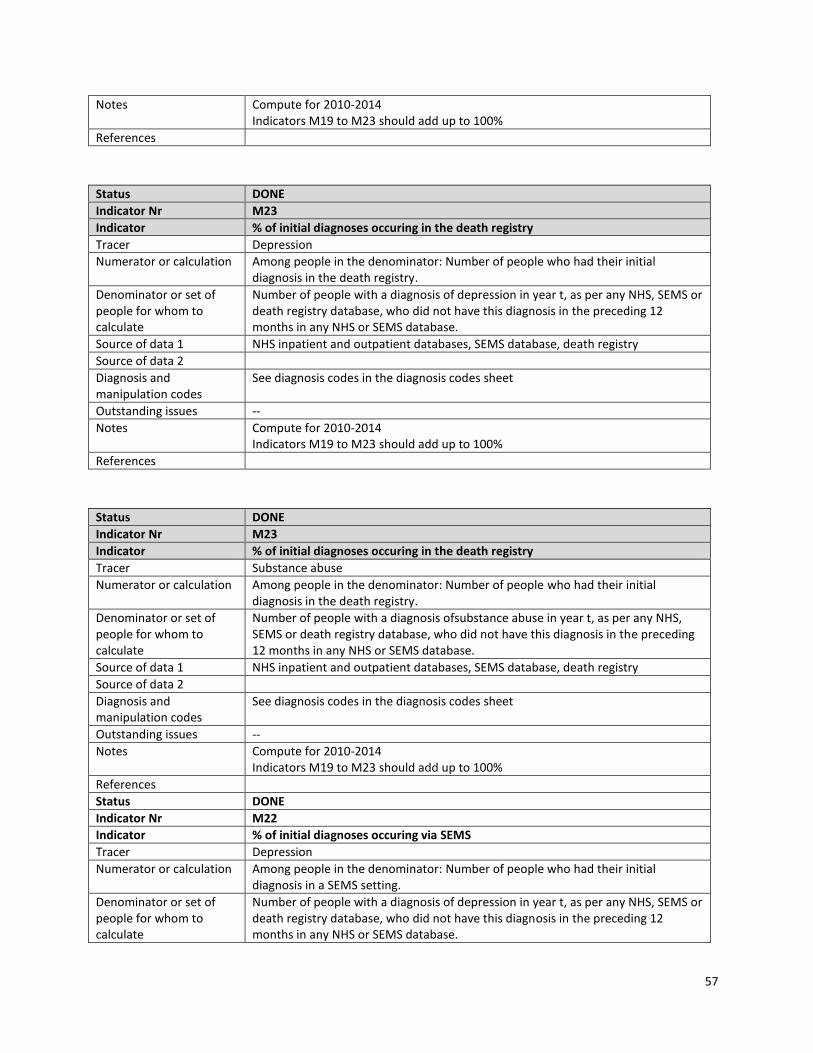
57
Notes Compute for 2010-2014 Indicators M19 to M23 should add up to 100%
References
Status DONE
Indicator Nr M23
Indicator % of initial diagnoses occuring in the death registry
Tracer Depression
Numerator or calculation Among people in the denominator: Number of people who had their initial diagnosis in the death registry.
Denominator or set of people for whom to calculate
Number of people with a diagnosis of depression in year t, as per any NHS, SEMS or death registry database, who did not have this diagnosis in the preceding 12 months in any NHS or SEMS database.
Source of data 1 NHS inpatient and outpatient databases, SEMS database, death registry
Source of data 2
Diagnosis and manipulation codes
See diagnosis codes in the diagnosis codes sheet
Outstanding issues --
Notes Compute for 2010-2014 Indicators M19 to M23 should add up to 100%
References
Status DONE
Indicator Nr M23
Indicator % of initial diagnoses occuring in the death registry
Tracer Substance abuse
Numerator or calculation Among people in the denominator: Number of people who had their initial diagnosis in the death registry.
Denominator or set of people for whom to calculate
Number of people with a diagnosis ofsubstance abuse in year t, as per any NHS, SEMS or death registry database, who did not have this diagnosis in the preceding 12 months in any NHS or SEMS database.
Source of data 1 NHS inpatient and outpatient databases, SEMS database, death registry
Source of data 2
Diagnosis and manipulation codes
See diagnosis codes in the diagnosis codes sheet
Outstanding issues --
Notes Compute for 2010-2014 Indicators M19 to M23 should add up to 100%
References
Status DONE
Indicator Nr M22
Indicator % of initial diagnoses occuring via SEMS
Tracer Depression
Numerator or calculation Among people in the denominator: Number of people who had their initial diagnosis in a SEMS setting.
Denominator or set of people for whom to calculate
Number of people with a diagnosis of depression in year t, as per any NHS, SEMS or death registry database, who did not have this diagnosis in the preceding 12 months in any NHS or SEMS database.
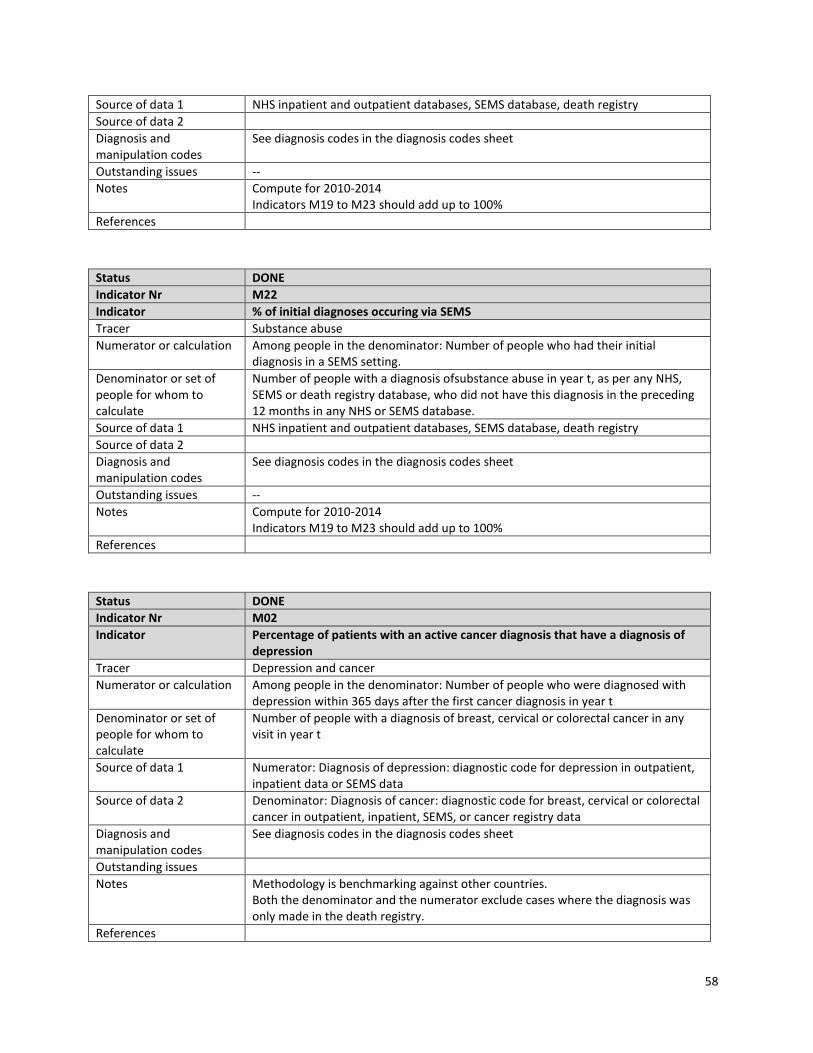
58
Source of data 1 NHS inpatient and outpatient databases, SEMS database, death registry
Source of data 2
Diagnosis and manipulation codes
See diagnosis codes in the diagnosis codes sheet
Outstanding issues --
Notes Compute for 2010-2014 Indicators M19 to M23 should add up to 100%
References
Status DONE
Indicator Nr M22
Indicator % of initial diagnoses occuring via SEMS
Tracer Substance abuse
Numerator or calculation Among people in the denominator: Number of people who had their initial diagnosis in a SEMS setting.
Denominator or set of people for whom to calculate
Number of people with a diagnosis ofsubstance abuse in year t, as per any NHS, SEMS or death registry database, who did not have this diagnosis in the preceding 12 months in any NHS or SEMS database.
Source of data 1 NHS inpatient and outpatient databases, SEMS database, death registry
Source of data 2
Diagnosis and manipulation codes
See diagnosis codes in the diagnosis codes sheet
Outstanding issues --
Notes Compute for 2010-2014 Indicators M19 to M23 should add up to 100%
References
Status DONE
Indicator Nr M02
Indicator Percentage of patients with an active cancer diagnosis that have a diagnosis of depression
Tracer Depression and cancer
Numerator or calculation Among people in the denominator: Number of people who were diagnosed with depression within 365 days after the first cancer diagnosis in year t
Denominator or set of people for whom to calculate
Number of people with a diagnosis of breast, cervical or colorectal cancer in any visit in year t
Source of data 1 Numerator: Diagnosis of depression: diagnostic code for depression in outpatient, inpatient data or SEMS data
Source of data 2 Denominator: Diagnosis of cancer: diagnostic code for breast, cervical or colorectal cancer in outpatient, inpatient, SEMS, or cancer registry data
Diagnosis and manipulation codes
See diagnosis codes in the diagnosis codes sheet
Outstanding issues
Notes Methodology is benchmarking against other countries. Both the denominator and the numerator exclude cases where the diagnosis was only made in the death registry.
References

59
Status DONE
Indicator Nr M03
Indicator Percentage of postpartum patients diagnosed with depression
Tracer Postpartum depression
Numerator or calculation Among women in the denominator: Number of women diagnosed with depression within 365 days after birth/delivery of their child
Denominator or set of people for whom to calculate
Number of women who had a birth/delivery in year t
Source of data 1 Numerator: Diagnosis of depression: NHS payment data, SEMS data
Source of data 2 Denominator: Births: Birth registry
Diagnosis and manipulation codes
See diagnosis codes in the diagnosis codes sheet
Outstanding issues ? Exclude women who died at birth
Notes Methodology is benchmarking against other countries. Compute for 2009-2013 The numerator exclude cases where the diagnosis of depression was only made in the death registry. For the yearly indicators: For women with multiple births in one year: only take
References
Status DONE
Indicator Nr M24
Indicator Timing of first follow-up visit with a mental health specialist for inpatient discharges with a depression diagnosis (within 30 days, within 31- 60, within 61-90 days, none within 90 days)
Tracer Depression
Numerator or calculation For the inpatient discharges in the denominator: dummy for whether the person discharged had a first follow-up visit with a mental health specialist within 30 /31-60/61-90 days of the discharge
Denominator or set of people for whom to calculate
Inpatient discharges for which the discharge diagnostic codes include a depression code. Include only discharges to home.
Source of data 1 Follow-up visits: NHS outpatient data; Specialties: specialty certificate database
Source of data 2 Inpatient discharges: Inpatient movement data
Diagnosis and manipulation codes
See diagnosis codes in the diagnosis codes sheet
Outstanding issues 5% of hospital discharges are ficitious and can't be matched to a follow up inpatient stay
Notes --
References
Status DONE
Indicator Nr M27
Indicator Timing of the first follow-up visit to a mental health specialist for inpatient discharges with a substance abuse diagnosis (within 30 days, within 31-60, within 61-90 days, or none within 90 days)

60
Tracer Substance abuse
Numerator or calculation For the inpatient discharges in the denominator: (Sum of) Dummy for whether the person discharged had a first follow-up visit with a mental health specialist within 30/31-60/61-90 days of the discharge
Denominator or set of people for whom to calculate
Number of hospital discharges for which the discharge diagnostic codes include a substance abuse code. Include only discharges to home.
Source of data 1 Follow-up visits: NHS outpatient data; Specialties: specialty certificate database
Source of data 2 Inpatient discharges: Inpatient movement data
Diagnosis and manipulation codes
See diagnosis codes in the diagnosis codes sheet
Outstanding issues --
Notes --
References

61
APPENDIX 2: SPECIALTY CODES
This table contains the specialty codes that were used to identify specialists in each specialty.
Specialist codes
Specialist name
Primary care physician (pcp)
P01 internist
P02 Family (general practice) doctor
Cardiology (cardio)
A011 cardiologist
A153 pediatric cardiologist
P06 heart surgeon
P05 thoracic surgeon
P52 cardiologist
Neurology (neuro)
P04 neurosurgeon
P20 neurologist
PP21 child neurologist
Oncology (onco)
A142 oncology gynecologist
A161 oncology chemotherapist
A162 oncology surgeon
A163 oncology gynecologist
P16 oncologist chemotherapist
P16_ oncologist
P55 oncologist
Mental health (mental)
A191 child psychiatrist
A192 forensic psychiatry expert
M41 psychoorganic psychoanalysis
N103 psychotherapist (AAP)
P19 psychiatrist
P28 drug addiction
P42 psychotherapist
n05 pyschologist

62
M46 alcohol, drugs and psychotropic substances impact test method
Endocrinology (diabetes)
A014 Endocrinologist
A156 child endocrinologist
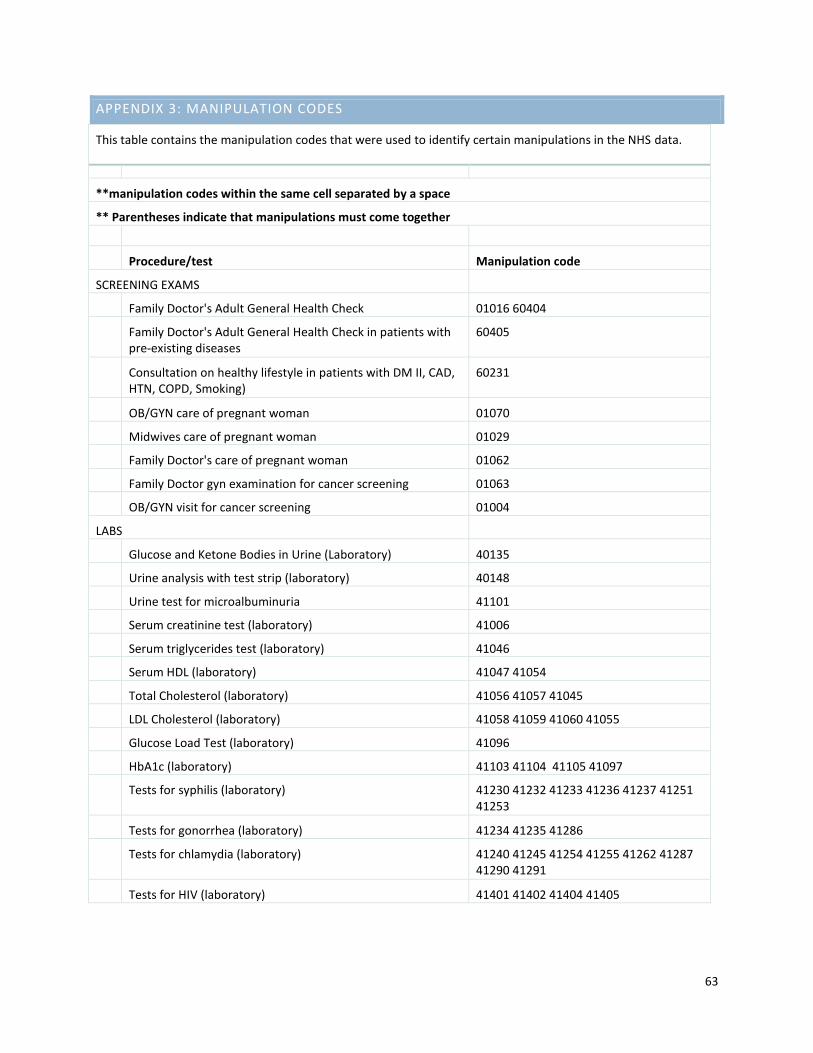
63
APPENDIX 3: MANIPULATION CODES
This table contains the manipulation codes that were used to identify certain manipulations in the NHS data.
**manipulation codes within the same cell separated by a space
** Parentheses indicate that manipulations must come together
Procedure/test Manipulation code
SCREENING EXAMS
Family Doctor's Adult General Health Check 01016 60404
Family Doctor's Adult General Health Check in patients with pre-existing diseases
60405
Consultation on healthy lifestyle in patients with DM II, CAD, HTN, COPD, Smoking)
60231
OB/GYN care of pregnant woman 01070
Midwives care of pregnant woman 01029
Family Doctor's care of pregnant woman 01062
Family Doctor gyn examination for cancer screening 01063
OB/GYN visit for cancer screening 01004
LABS
Glucose and Ketone Bodies in Urine (Laboratory) 40135
Urine analysis with test strip (laboratory) 40148
Urine test for microalbuminuria 41101
Serum creatinine test (laboratory) 41006
Serum triglycerides test (laboratory) 41046
Serum HDL (laboratory) 41047 41054
Total Cholesterol (laboratory) 41056 41057 41045
LDL Cholesterol (laboratory) 41058 41059 41060 41055
Glucose Load Test (laboratory) 41096
HbA1c (laboratory) 41103 41104 41105 41097
Tests for syphilis (laboratory) 41230 41232 41233 41236 41237 41251 41253
Tests for gonorrhea (laboratory) 41234 41235 41286
Tests for chlamydia (laboratory) 41240 41245 41254 41255 41262 41287 41290 41291
Tests for HIV (laboratory) 41401 41402 41404 41405

64
Cytological Examination of the Cervical Canal (Pap smear) 42004 42026 42027 42028 42029 42030 42031 42032 42033 42019 42020 42021 42022 42023 42024 42025 42003
Pap smear by a OB/GYN, family doctor, midwife, Physician assistance,
42026 42027 42028 42029 42030 42031 42003 01063 01004
Occult Blood in Stool 40161
Negative FOBT 40173
Positive FOBT 40172
OTHER DIAGNOSTICS
Electrocardiogram with 12 leads (EKG) 06003 06004 06006 06008 06011 06012.
Mammography 50096 50097 50102 50105 50188 50189 50190 50191 50192 60258
Ultrasound guided needle biopsy 50720 50721 50722
Guided needle biopsy 50731 50732 50735 50736 50737
Sentinel Lymph node biopsy or lymph node dissection 20041 50260 50406 50274
Breast biopsy wall 31175
Vagina and cervical biopsy using colposcopes 16001
Cervical cone elektroekscīzija 16007
Vagina and cervix biopsy 16008
Puncture biopsy in operation room 20039
Superficial tissue puncture biopsy 20040
Soft tissue and/or lymph node biopsy 29183
Biopsy or intra-abdominal abscess opening 21021
Rectoscopy 08110
Sigmoidoscopy with flexible instruments, including rektoskopiju
08111
Colon investigation with flexible instruments, including rektoskopiju to lean angle
08112
Colon investigation with flexible endoscopes, including rektoskopiju Sigmoidoscopy and sample excision and / or puncture
08113
Capsule endoscopy 08108
Endosonogrāfija using flexible endoscopes 08120
Diagnostic endoscopic ultrasonography with sectoral detector endoscope
08122
CT scan 50509 50609 50130
TREATMENT

65
Radiation Therapy (Radiotherapy) (60110 50300) (60110 50301) (60110 50302) (60110 50303) 50340 50341 50342 50343 50346 50349 50352 50353 50356 50357 50360 50366 50363 50370 50371 50372 50373 50374 50390 50393 50396 50397 50416 50417 50425 50426 50427 50428 50429 50430 50431 50432 50433 50434 50438
Cancer chemotherapy procedure 60008
Cervical cancer - chemo 61060 61118 61119 61100 61123 61124 61126 61127 61128 61129
Breast cancer - chemo 61074 61075 61076 61077 61078 61079 61080 61081 61082 61083 61084 61085 61086 61088 61089 61090 61091 61092 61093 61005 61024 61031 61074 61075 61076 61077 61081 61099 61100 61101 61102 61103 61106 61107 61108 61109 61110 61111 61112 61005 61024 61005 61031 61024
Colorectal - chemo 61019 61021 61023 61024 61025 61026 61027 61028
Colo-Rectal Cancer Surgery types 21040 21041 21042 21062 21063 21064 21065 21110 21111 21113 21114 21115 21190 21192
Needle ablation of tumor 50733
Breast sectoral resection (partial mastectomy) 21022
Radical mastectomy 21047
Thrombolytics 50118

66
APPENDIX 4: DIAGNOSIS CODES
This table contains the diagnosis codes that were used to identify persons with the listed condition in the NHS, SEMS, CDPC, medication and other data.
ICD-10 Code ICD-10 Name SEMS
Code SEMS Name
Acute myocardial infarction (AMI)
I21 + all sub-codes ST elevation (STEMI) and non-ST elevation (NSTEMI) myocardial infarction
I22 + all sub-codes Subsequent ST elevation (STEMI) and non-ST elevation (NSTEMI) myocardial infarction
I24.8 Other forms of acute ischemic heart disease
I24.9 Acute ischemic heart disease, unspecified
232 myocardial infarction
232A I21-I22 Myocardial infarction
232B I21.0-I21.3; I21.9; I22.0-I22.9 Acute coronary syndrome with ST depression,
2320 myocardial infarction
Stroke and cerebrovascular disease
I60+ all subcodes, I61+all subcode, I62+ all subcodes
Hemorrhagic stroke
I63 + all subcodes, I64 + all subcodes
Cerebral infarction
241D I63 Cerebral infarction
Cardiomyopathy
I42 + all subcodes Cardiomyopathy
I25.5 Ischemic cardiomyopathy
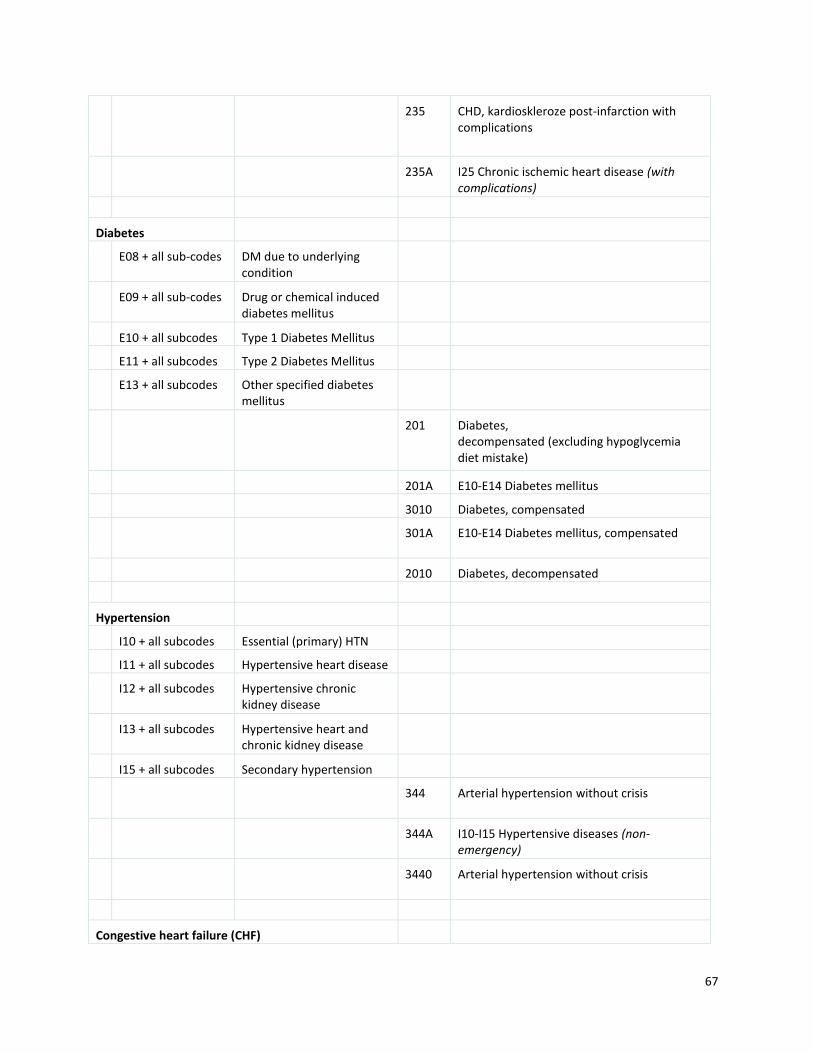
67
235 CHD, kardioskleroze post-infarction with complications
235A I25 Chronic ischemic heart disease (with complications)
Diabetes
E08 + all sub-codes DM due to underlying condition
E09 + all sub-codes Drug or chemical induced diabetes mellitus
E10 + all subcodes Type 1 Diabetes Mellitus
E11 + all subcodes Type 2 Diabetes Mellitus
E13 + all subcodes Other specified diabetes mellitus
201 Diabetes, decompensated (excluding hypoglycemia diet mistake)
201A E10-E14 Diabetes mellitus
3010 Diabetes, compensated
301A E10-E14 Diabetes mellitus, compensated
2010 Diabetes, decompensated
Hypertension
I10 + all subcodes Essential (primary) HTN
I11 + all subcodes Hypertensive heart disease
I12 + all subcodes Hypertensive chronic kidney disease
I13 + all subcodes Hypertensive heart and chronic kidney disease
I15 + all subcodes Secondary hypertension
344 Arterial hypertension without crisis
344A I10-I15 Hypertensive diseases (non-emergency)
3440 Arterial hypertension without crisis
Congestive heart failure (CHF)

68
I11.0 Hypertensive heart disease with heart failure
I11.3 Hypertensive heart and chronic kidney disease with heart failure and stage 1 through stage 4 chronic kidney disease, or unspecified chronic kidney disease
I50 + all subcodes Heart Failure
I09.81 Rheumatic heart failure
231 Arterial hypertension with urgent crisis Coupe
231A I10-I15 Hypertensive diseases (Coupe with urgent crisis)
2310 Arterial hypertension with urgent crisis Coupe
342 Rheumatic heart disease without exacerbation
342A I05-I09 Chronic rheumatic heart disease
3420 Rheumatic heart disease without exacerbation
236 Rheumatic heart disease with complications
236A I05-I09 Chronic rheumatic heart disease
2360 Rheumatic heart disease with complications
Coronary artery disease (CAD)
I20 + all subcodes Angina Pectoris
I25 + all subcodes Chronic ischemic heart disease
235 CHD, kardioskleroze post-infarction with complications
235A I25 Chronic ischemic heart disease (with complications)

69
2350 CHD, kardioskleroze post-infarction with complications
233 unstable angina
233A I20.0-I20.1 Unstable angina
2330 unstable angina
234 stenocardia
234A I20.8-20.9 Angina
2340 stenocardia
341 CHD without exacerbation
341A I25 Chronic ischemic heart disease (without exacerbation)
3410 CHD without exacerbation
Breast cancer
C50 + all subcodes Malignant neoplasm of breat
D05.1 + all subcodes
Carcinoma in situ of breast
319D C50 breast cancer
Cervical cancer
C53 + all subcodes Malignant neoplasm of cervix uteri
D06 + all subcodes Carcinoma in situ of cervix uteri
Colorectal cancer
C18 + all subcodes Malignant neoplasm of colon
C19 Malignant neoplasm of rectosigmoid junction
C20 Malignant neoplasm of rectum
C7A.02 + all subcodes
Malignant carcinoid tumors of the appendix, large intestine, and rectum
D01.0 Carcinoma in situ of colon
D01.1 Carcinoma in situ of rectosigmoid junction
D01.2 Carcinoma in situ of

70
rectum
3110 Digestive malignancies
Depression
F32 + all subcodes Major depressive disorder, single episode
F33 + all subcodes Major depressive disorder, recurrent
F34 + all subcodes Persistent mood [affective] disorders
F39 Unspecified mood [affective] disorder
F31 + all subcodes Bipolar disorder
F53 Puerperal psychosis (post-partum depression)
214 Life-threatening depression
214A F32-F33 major depressive episode; recurrent depressive disorder
2140 Life-threatening depression
Substance abuse
F10 + all subcodes Alcohol related disorders
F11 + all subcodes Opioid related disorders
F12 + all subcodes Cannabis related disorders
F13 + all subcodes Sedative, hypnotic, or anxiolytic related disorders
F14 + all subcodes Cocaine related disorders
F15 + all subcodes Other stimulant related disorders
F16 + all subcodes Hallucinogen related disorders
F17 + all subcodes Nicotine dependence
F18 + all subcodes Inhalant related disorders
F19 + all subcodes Other psychoactive substance related disorders
O99.31 + all subcodes
Alcohol use complicating pregnancy, childbirth, and the puerperium

71
O99.32 + all subcodes
Drug use complicating pregnancy, childbirth, and the puerperium
Z71.41 Alcohol abuse counseling and surveillance…of alcoholic
Z71.51 Drug abuse counseling and surveillance…of drug abuser
Z71.6 Tobacco abuse counselling
F55 Abuse of non-psychactive substances (antacids, herbal or folk remedies, laxatives, steroids or hormones, vitamins, and other non-psychoactive substances)
212 Alcohol intoxication and other psychoses, delirium
212A F10.4-F10.5 Withdrawal state with delirium, psychotic disorder due to alcohol
212B F10.9 Mental and behavioral disorders due to alcohol (alcohol effects, alcohol intoxication)
212C F10.9 Mental and behavioral disorders due to alcohol (alcohol effects, alcohol intoxication)
321 Chronic alcoholism, abstinence, raft
321A F10.2 Chronic alcoholism
321B F10.3 Alcohol withdrawal state
322 Drug addiction, toxic substance (t.sk.abstinence)
322A Addiction syndrome F19.2 use of psychoactive substances

72
322B F19.3 Withdrawal state of use of psychoactive substances
2120 Alcohol intoxication and other psychoses, delirium
3210 Chronic alcoholism, abstinence, raft
3220 Drug addiction, toxic substance (t.sk.abstinence)
Selfharm and suicide
T14.91 Suicide attempt
X60 + all subcodes Intentional poisoning non-narcotic analgesics, antipyretics and antirheumatic agents
X61 + all subcodes Intentional poisoning and exposure to anticonvulsants, hypnotics and sedatives, anti-parkinsonian and psychotropic drugs
X62 + all subcodes Intentional poisoning and exposure to narcotic and Psycholeptics (hallucinogens) preparations
X63 + all subcodes intentional contamination with other therapeutic agents that act on the autonomic nervous system
X64 + all subcodes Intentional poisoning by other and unspecified treatments, medicines and biological substances
X65 + all subcodes Intentional poisoning with alcohol
X66 + all subcodes Intentional poisoning and exposure to organic solvents and halogenated hydrocarbons and their vapors
X67 + all subcodes Intentional poisoning and exposure to other gases and vapors

73
X68 + all subcodes Intentional poisoning and exposure to pesticides
X69 + all subcodes Intentional poisoning and exposure to other and unspecified chemicals and noxious substances
X70 + all subcodes Intentional self-harm, by hanging, strangulation, suffocation
X71 + all subcodes Intentional self-harm, drowning and drowning
X72 + all subcodes Intentional self-harm, firing a hand gun
X73 + all subcodes Intentional self-harm, firing a rifle, shotgun and larger firearm
X74 + all subcodes Intentional self-harm, firing with other and unspecified firearm
X75 + all subcodes Intentional self-harm with explosives
X76 + all subcodes Intentional self-harm by smoke, fire and flames
X77 + all subcodes Intentional self-harm by steam, hot vapors and hot objects
X78 + all subcodes Intentional self-harm by sharp object
X79 + all subcodes Intentional self-harm by blunt object
X80 + all subcodes Intentional self-harm, jumped from a height
X81 + all subcodes Intentional self-harm, jumps or lying-moving object in front
X82 + all subcodes Intentional self-harm a motor vehicle accident
X83 + all subcodes Intentional self-harm by other specified means
X84 + all subcodes Intentional self-harm by unspecified means

74
172 Suffocation and hanging oneself
172A T71 Asphyxia
1720 Suffocation and hanging oneself