Embed Size (px)
Citation preview
1
April 2020
1Biogen, Cambridge, MA, USA
EMERGE and ENGAGE Topline Results: Two Phase 3
Studies to Evaluate Aducanumab in Patients With Early
Alzheimer’s Disease
AAT-AD/PD, Vienna, Austria
Samantha Budd Haeberlein,1 Christian von Hehn,1 Ying Tian,1 Spyros Chalkias,1 Kumar
Kandadi Muralidharan,1 Tianle Chen,1 Shuang Wu,1 Jie Li,1 LeAnne Skordos,1 Laura
Nisenbaum,1 Raj Rajagovindan,1 Gersham Dent,1 Katie Harrison,1 Ivan Nestorov,1 Ying
Zhu,1 Craig Mallinckrodt,1 Alfred Sandrock1
2
Forward-looking statements
• This presentation contains forward-looking statements, including statements made pursuant to the safe harbor provisions of the Private Securities Litigation Reform Act of 1995, relating to additional results from the Phase 3 clinical studies of aducanumab; the potential clinical effects of aducanumab; the potential benefits, safety, and efficacy of aducanumab; potential regulatory discussions, submissions, and approvals and the timing thereof; clinical development programs, clinical trials, data readouts, and presentations related to aducanumab; the enrollment of any future clinical studies of aducanumab; the treatment of Alzheimer’s disease; the potential of Biogen’s commercial business and pipeline programs, including aducanumab; the anticipated benefits and potential of Biogen’s collaboration arrangements with Eisai Co, Ltd; and risks and uncertainties associated with drug development and commercialization. These forward-looking statements may be accompanied by such words as “aim,” “anticipate,” “believe,” “could,” “estimate,” “expect,” “forecast,” “intend,” “may,” “plan,” “potential,” “possible,” “will,” “would,” and other words and terms of similar meaning. Drug development and commercialization involve a high degree of risk, and only a small number of research and development programs result in commercialization of a product. Results in early-stage clinical trials may not be indicative of full results or results from later-stage or larger-scale clinical trials and do not ensure regulatory approval. You should not place undue reliance on these statements or the scientific data presented.
• These statements involve risks and uncertainties that could cause actual results to differ materially from those reflected in such statements, including actual timing and content of submissions to and decisions made by the regulatory authorities regarding aducanumab; regulatory submissions may take longer or be more difficult to complete than expected; regulatory authorities may require additional information or further studies, or may fail or refuse to approve or may delay approval of Biogen’s drug candidates, including aducanumab; actual timing and enrollment of future studies of aducanumab; the occurrence of adverse safety events and/or unexpected concerns that may arise from additional data or analysis; risks of unexpected costs or delays; the risks of other unexpected hurdles; uncertainty of success in the development and potential commercialization of aducanumab; failure to protect and enforce Biogen’s data, intellectual property, and other proprietary rights and uncertainties relating to intellectual property claims and challenges; risks relating to the potential launch of aducanumab, including preparedness of healthcare providers to treat patients, the ability to obtain and maintain adequate reimbursement for aducanumab, and other unexpected difficulties or hurdles; product liability claims; third-party collaboration risks; the impact related to the effect of COVID-19 or other public health epidemics on our operations, including employees; and the other risks and uncertainties that are described in the Risk Factors section of our most recent annual or quarterly report and in other reports we have filed with the U.S. Securities and Exchange Commission. These statements are based on our current beliefs and expectations and speak only as of the date of this presentation. We do not undertake any obligation to publicly update any forward-looking statements, whether as a result of new information, future developments, or otherwise.
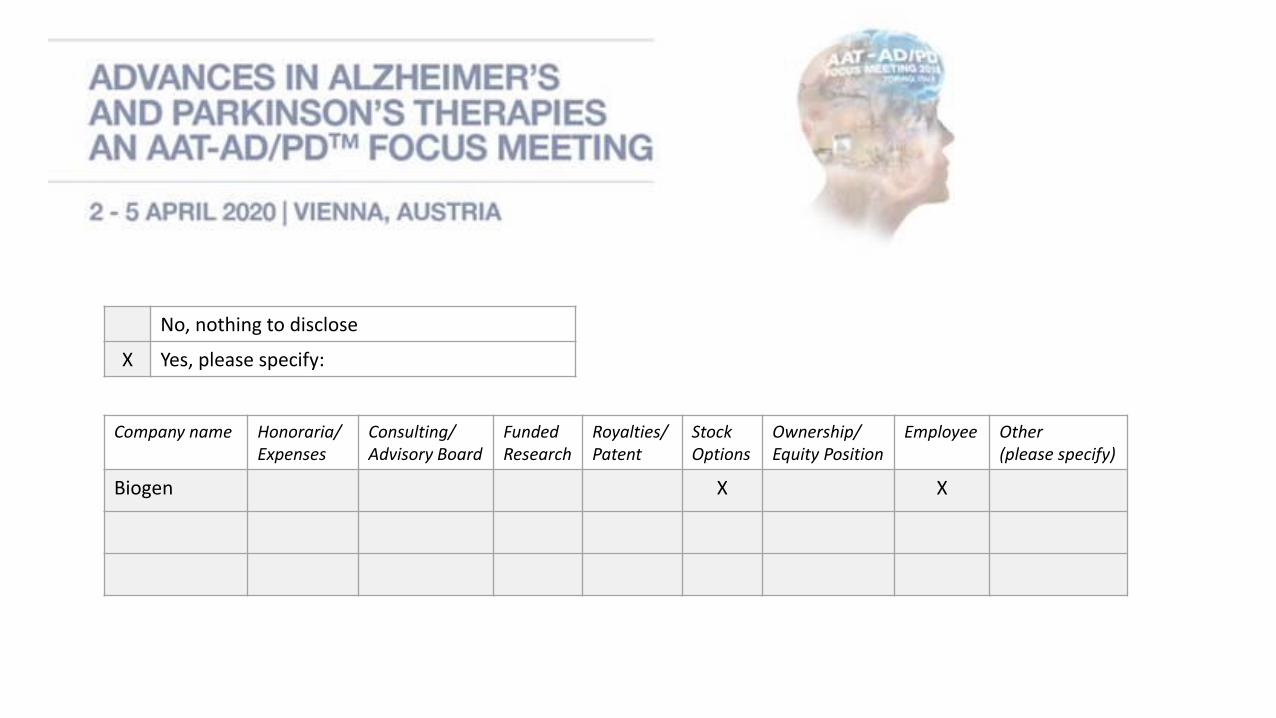
Company name Honoraria/ Expenses
Consulting/ Advisory Board
Funded Research
Royalties/ Patent
Stock Options
Ownership/ Equity Position
Employee Other (please specify)
Biogen X X
No, nothing to disclose
X Yes, please specify:
4
Legal disclaimer
• Aducanumab is an investigational compound and is not yet
approved in any country
• Biogen licensed the worldwide rights to aducanumab from
Neurimmune Holding AG in 2007 and is responsible for its
development and commercialization
• As of October 22, 2017, Biogen and Eisai are collaborating on
the development and commercialization of aducanumab globally
5
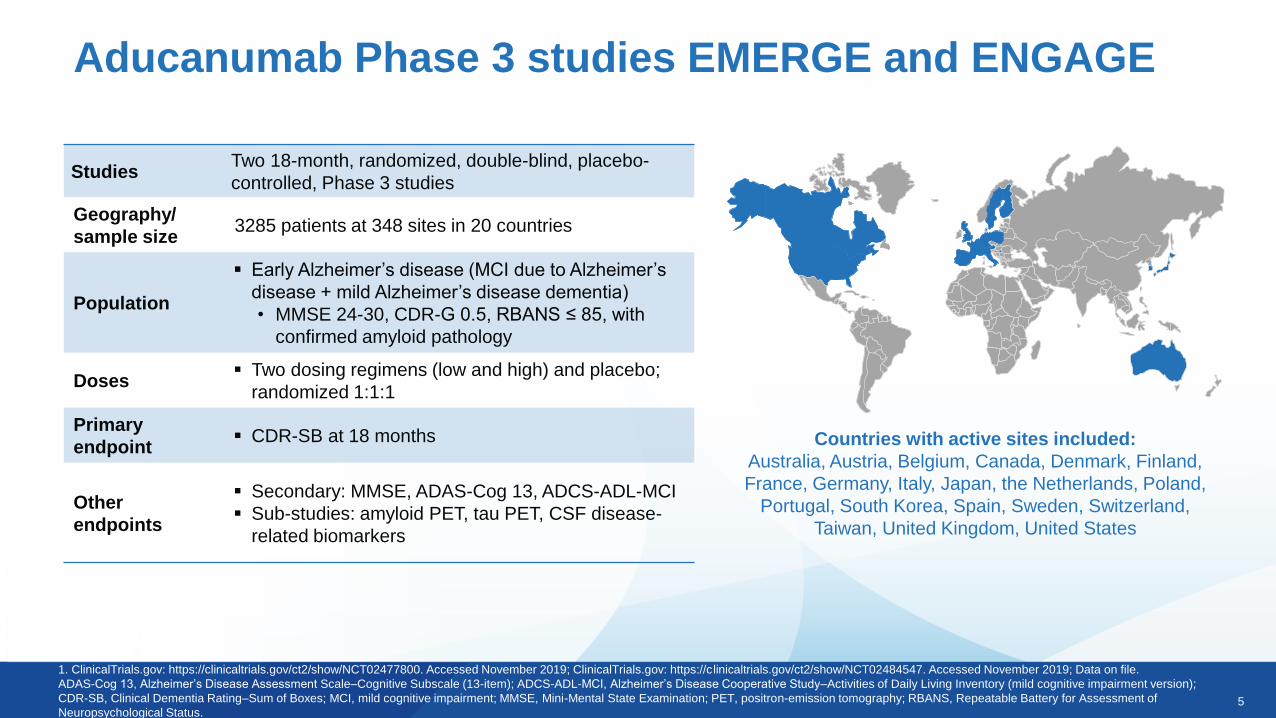
Aducanumab Phase 3 studies EMERGE and ENGAGE
StudiesTwo 18-month, randomized, double-blind, placebo-
controlled, Phase 3 studies
Geography/
sample size3285 patients at 348 sites in 20 countries
Population
▪ Early Alzheimer’s disease (MCI due to Alzheimer’s
disease + mild Alzheimer’s disease dementia)
• MMSE 24-30, CDR-G 0.5, RBANS ≤ 85, with
confirmed amyloid pathology
Doses▪ Two dosing regimens (low and high) and placebo;
randomized 1:1:1
Primary
endpoint▪ CDR-SB at 18 months
Other
endpoints
▪ Secondary: MMSE, ADAS-Cog 13, ADCS-ADL-MCI
▪ Sub-studies: amyloid PET, tau PET, CSF disease-
related biomarkers
1. ClinicalTrials.gov: https://clinicaltrials.gov/ct2/show/NCT02477800. Accessed November 2019; ClinicalTrials.gov: https://clinicaltrials.gov/ct2/show/NCT02484547. Accessed November 2019; Data on file.
ADAS-Cog 13, Alzheimer’s Disease Assessment Scale–Cognitive Subscale (13-item); ADCS-ADL-MCI, Alzheimer’s Disease Cooperative Study–Activities of Daily Living Inventory (mild cognitive impairment version);
CDR-SB, Clinical Dementia Rating–Sum of Boxes; MCI, mild cognitive impairment; MMSE, Mini-Mental State Examination; PET, positron-emission tomography; RBANS, Repeatable Battery for Assessment of
Neuropsychological Status.
Countries with active sites included:
Australia, Austria, Belgium, Canada, Denmark, Finland,
France, Germany, Italy, Japan, the Netherlands, Poland,
Portugal, South Korea, Spain, Sweden, Switzerland,
Taiwan, United Kingdom, United States
6
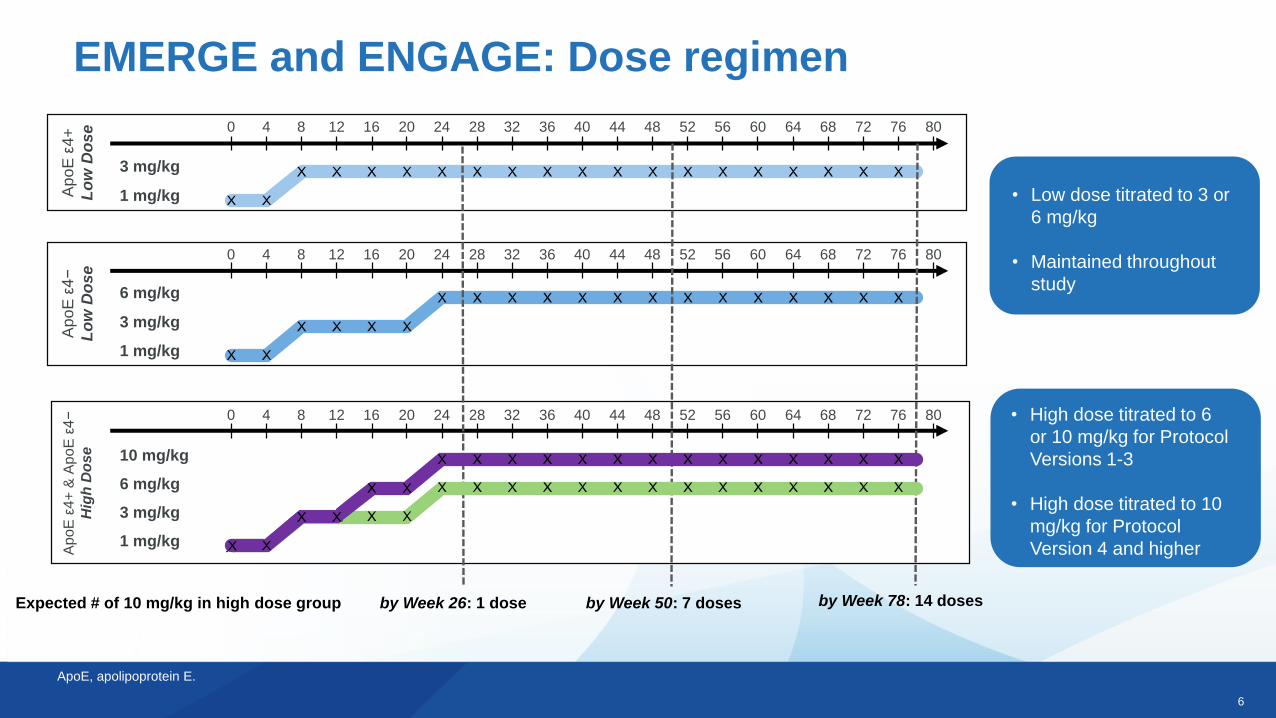
EMERGE and ENGAGE: Dose regimen
Expected # of 10 mg/kg in high dose group by Week 26: 1 dose by Week 50: 7 doses by Week 78: 14 doses
0
3 mg/kg
1 mg/kg
4 8 12 16 20 24 28 32 36 40 44 48 52 56 60 64 68 72 76 80
Ap
oE
ε4+
Lo
w D
os
e
3 mg/kg
6 mg/kg
1 mg/kg
0 4 8 12 16 20 24 28 32 36 40 44 48 52 56 60 64 68 72 76 80
Ap
oE
ε4−
Lo
w D
os
e
• Low dose titrated to 3 or
6 mg/kg
• Maintained throughout
study
ApoE, apolipoprotein E.
• High dose titrated to 6
or 10 mg/kg for Protocol
Versions 1-3
• High dose titrated to 10
mg/kg for Protocol
Version 4 and higher
3 mg/kg
6 mg/kg
10 mg/kg
1 mg/kg
0 4 8 12 16 20 24 28 32 36 40 44 48 52 56 60 64 68 72 76 80
Ap
oE
ε4+
& A
poE
ε4−
Hig
h D
ose
7
0
200
400
600
800
1000
1200
1400
1600
1800A
ug-
15
Sep
-15
Oct
-15
No
v-1
5
Dec
-15
Jan
-16
Feb
-16
Mar
-16
Ap
r-1
6
May
-16
Jun
-16
Jul-
16
Au
g-1
6
Sep
-16
Oct
-16
No
v-1
6
Dec
-16
Jan
-17
Feb
-17
Mar
-17
Ap
r-1
7
May
-17
Jun
-17
Jul-
17
Au
g-1
7
Sep
-17
Oct
-17
No
v-1
7
Dec
-17
Jan
-18
Feb
-18
Mar
-18
Ap
r-1
8
May
-18
Jun
-18
Jul-
18
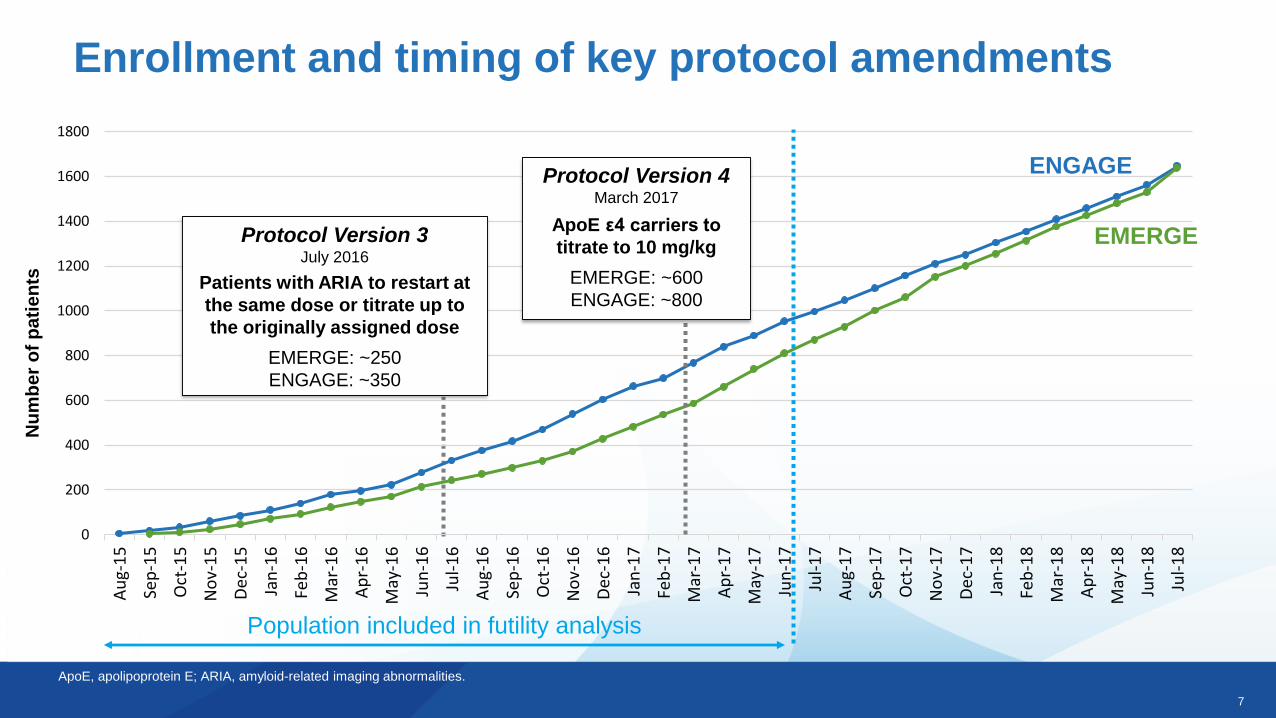
Enrollment and timing of key protocol amendmentsN
um
ber
of
pa
tie
nts
ApoE, apolipoprotein E; ARIA, amyloid-related imaging abnormalities.
Population included in futility analysis
EMERGE
ENGAGE
Protocol Version 3July 2016
Patients with ARIA to restart at
the same dose or titrate up to
the originally assigned dose
EMERGE: ~250
ENGAGE: ~350
Protocol Version 4March 2017
ApoE ε4 carriers to
titrate to 10 mg/kg
EMERGE: ~600
ENGAGE: ~800

8
EMERGE and ENGAGE Topline Results
9
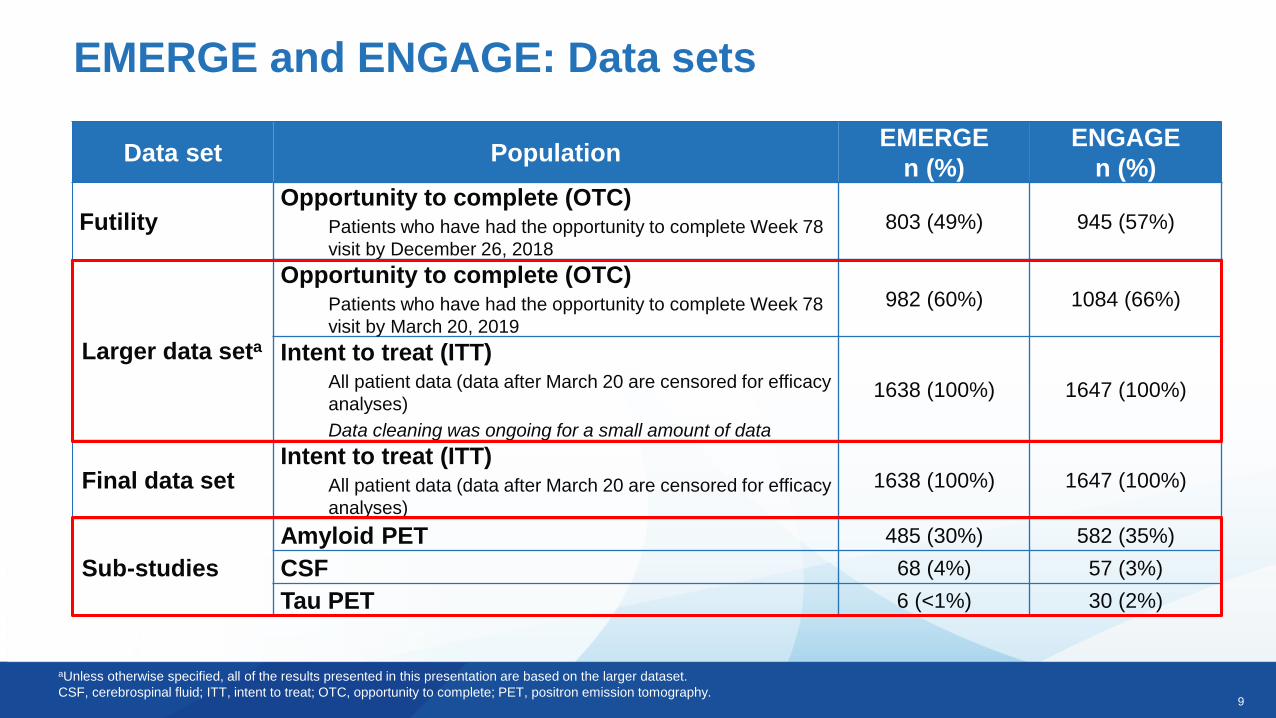
aUnless otherwise specified, all of the results presented in this presentation are based on the larger dataset.
CSF, cerebrospinal fluid; ITT, intent to treat; OTC, opportunity to complete; PET, positron emission tomography.
EMERGE and ENGAGE: Data sets
Data set PopulationEMERGE
n (%)
ENGAGE
n (%)
Futility Opportunity to complete (OTC)
Patients who have had the opportunity to complete Week 78
visit by December 26, 2018
803 (49%) 945 (57%)
Larger data seta
Opportunity to complete (OTC)Patients who have had the opportunity to complete Week 78
visit by March 20, 2019
982 (60%) 1084 (66%)
Intent to treat (ITT)All patient data (data after March 20 are censored for efficacy
analyses)
Data cleaning was ongoing for a small amount of data
1638 (100%) 1647 (100%)
Final data setIntent to treat (ITT)
All patient data (data after March 20 are censored for efficacy
analyses)
1638 (100%) 1647 (100%)
Sub-studies
Amyloid PET 485 (30%) 582 (35%)
CSF 68 (4%) 57 (3%)
Tau PET 6 (<1%) 30 (2%)

10
Futility analysis
EMERGE and ENGAGE
11
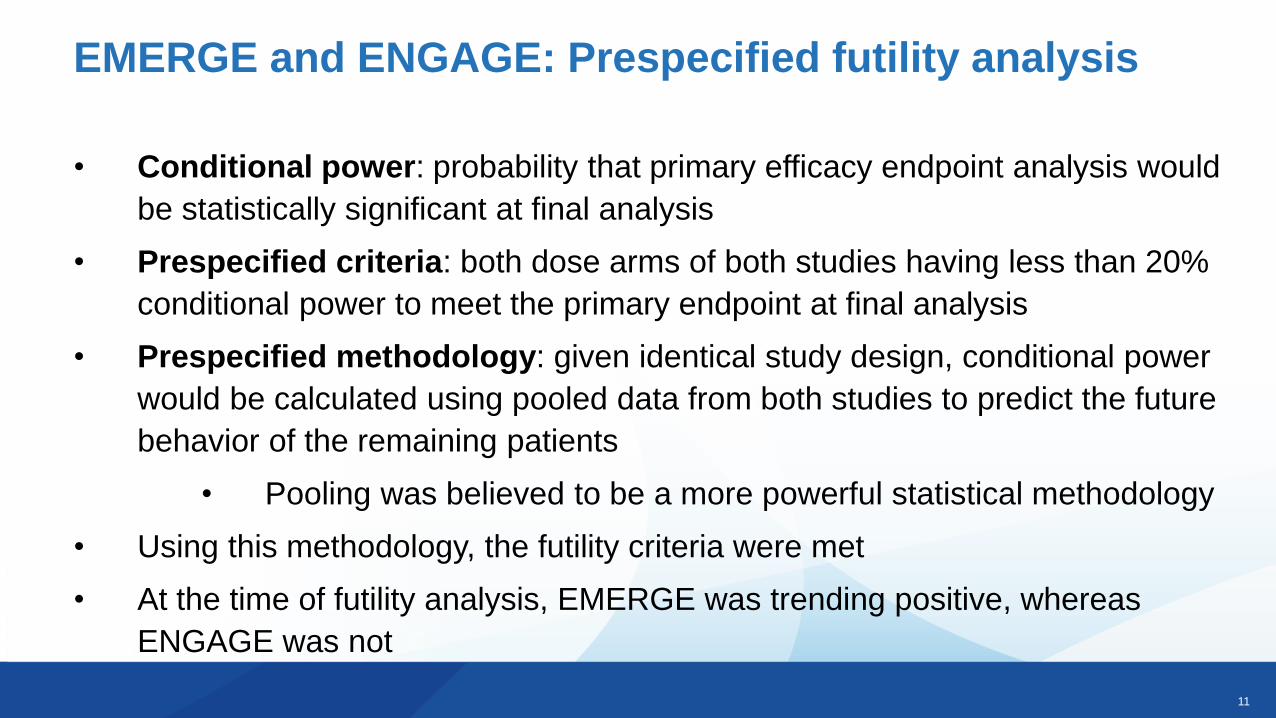
EMERGE and ENGAGE: Prespecified futility analysis
• Conditional power: probability that primary efficacy endpoint analysis would
be statistically significant at final analysis
• Prespecified criteria: both dose arms of both studies having less than 20%
conditional power to meet the primary endpoint at final analysis
• Prespecified methodology: given identical study design, conditional power
would be calculated using pooled data from both studies to predict the future
behavior of the remaining patients
• Pooling was believed to be a more powerful statistical methodology
• Using this methodology, the futility criteria were met
• At the time of futility analysis, EMERGE was trending positive, whereas
ENGAGE was not

12
EMERGE
Phase 3 Topline Results
13
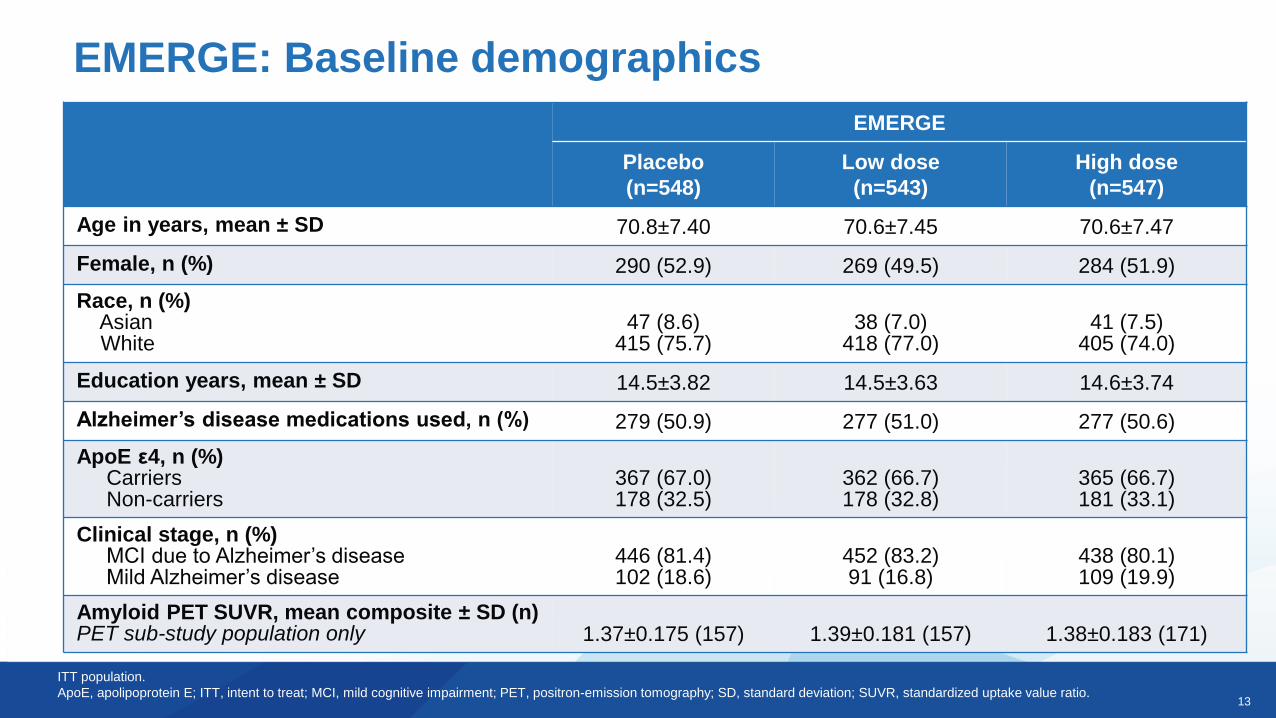
EMERGE
Placebo
(n=548)
Low dose
(n=543)
High dose
(n=547)
Age in years, mean ± SD 70.8±7.40 70.6±7.45 70.6±7.47
Female, n (%) 290 (52.9) 269 (49.5) 284 (51.9)
Race, n (%)AsianWhite
47 (8.6)415 (75.7)
38 (7.0)418 (77.0)
41 (7.5)405 (74.0)
Education years, mean ± SD 14.5±3.82 14.5±3.63 14.6±3.74
Alzheimer’s disease medications used, n (%) 279 (50.9) 277 (51.0) 277 (50.6)
ApoE ε4, n (%)CarriersNon-carriers
367 (67.0)178 (32.5)
362 (66.7)178 (32.8)
365 (66.7)181 (33.1)
Clinical stage, n (%)MCI due to Alzheimer’s diseaseMild Alzheimer’s disease
446 (81.4)102 (18.6)
452 (83.2)91 (16.8)
438 (80.1)109 (19.9)
Amyloid PET SUVR, mean composite ± SD (n)PET sub-study population only 1.37±0.175 (157) 1.39±0.181 (157) 1.38±0.183 (171)
EMERGE: Baseline demographics
ITT population.
ApoE, apolipoprotein E; ITT, intent to treat; MCI, mild cognitive impairment; PET, positron-emission tomography; SD, standard deviation; SUVR, standardized uptake value ratio.
14
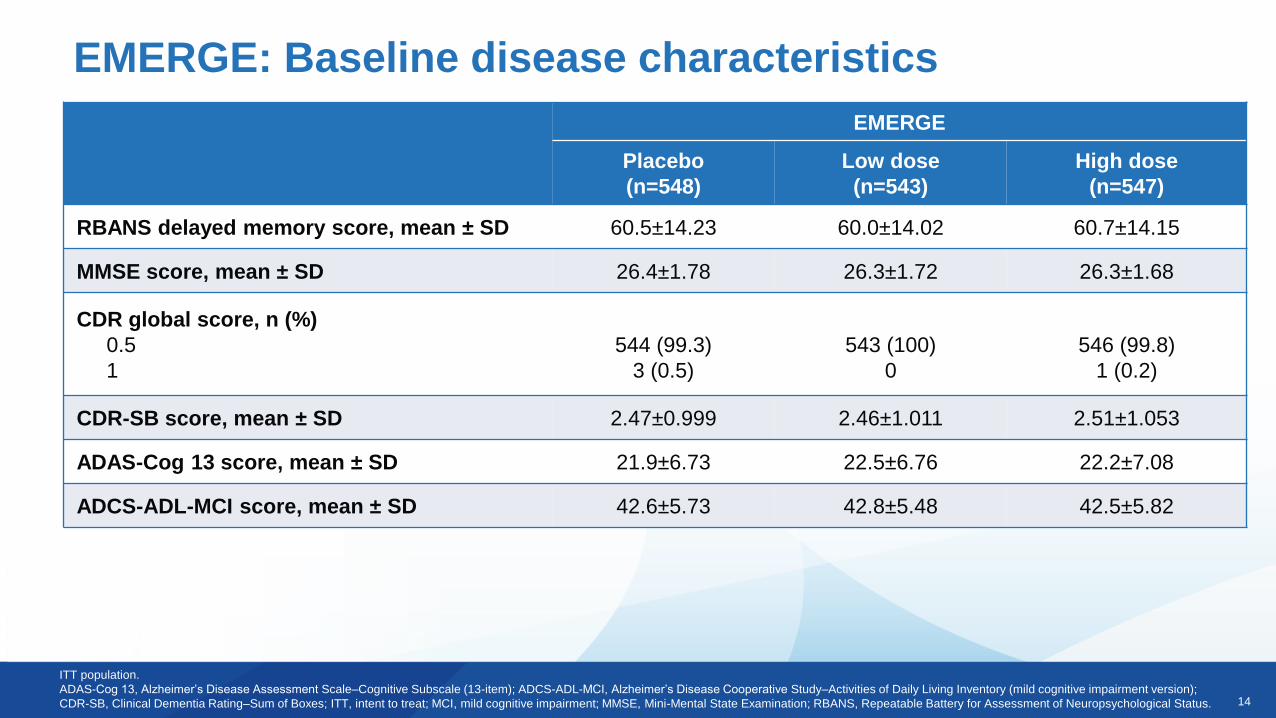
EMERGE: Baseline disease characteristics
ITT population.
ADAS-Cog 13, Alzheimer’s Disease Assessment Scale–Cognitive Subscale (13-item); ADCS-ADL-MCI, Alzheimer’s Disease Cooperative Study–Activities of Daily Living Inventory (mild cognitive impairment version);
CDR-SB, Clinical Dementia Rating–Sum of Boxes; ITT, intent to treat; MCI, mild cognitive impairment; MMSE, Mini-Mental State Examination; RBANS, Repeatable Battery for Assessment of Neuropsychological Status.
EMERGE
Placebo
(n=548)
Low dose
(n=543)
High dose
(n=547)
RBANS delayed memory score, mean ± SD 60.5±14.23 60.0±14.02 60.7±14.15
MMSE score, mean ± SD 26.4±1.78 26.3±1.72 26.3±1.68
CDR global score, n (%)
0.5
1
544 (99.3)
3 (0.5)
543 (100)
0
546 (99.8)
1 (0.2)
CDR-SB score, mean ± SD 2.47±0.999 2.46±1.011 2.51±1.053
ADAS-Cog 13 score, mean ± SD 21.9±6.73 22.5±6.76 22.2±7.08
ADCS-ADL-MCI score, mean ± SD 42.6±5.73 42.8±5.48 42.5±5.82

15
Randomized
Dosed
Discontinued treatmenta, n (%)
Adverse event
Consent withdrawn
Death
Study visit burden
Site terminated by sponsor
Other
Withdrew from studya, n (%)
Adverse event
Consent withdrawn
Death
Study visit burden
Site terminated by sponsor
Other
Completed placebo-controlled period, n (%)
EMERGE (N=1643)
n=1638
Placebo
n=548
Low dose
n=543High dose
n=547
82 (15.0)
16 (2.9)
6 (1.1)
5 (0.9)
2 (0.4)
21 (3.8)
23 (4.2)
39 (7.1)10 (1.8)
8 (1.5)
5 (0.9)
2 (0.4)
0
3 (0.5)
275 (50.2)
108 (19.9)41 (7.6)
22 (4.1)
0
7 (1.3)
10 (1.8)
23 (4.2)
54 (9.9)11 (2.0)
28 (5.2)
0
7 (1.3)
0
4 (0.7)
274 (50.5)
131 (23.9)46 (8.4)
18 (3.3)
5 (0.9)
5 (0.9)
14 (2.6)
28 (5.1)
66 (12.1)18 (3.3)
22 (4.0)
6 (1.1)
5 (0.9)
1 (0.2)
3 (0.5)
285 (52.1)
ITT population. aSome categories with less than 1% patients are not displayed, including lost to follow-up, disease progression, pregnancy, investigator decision, relocation, change of treatment, withdrawal by
parent/guardian, protocol amendment, site terminated by investigator and loss of capacity.
ITT, intent to treat.
EMERGE: Patient disposition
16
CDR-SB
MMSE
ADAS-Cog 13
ADCS-ADL-MCI
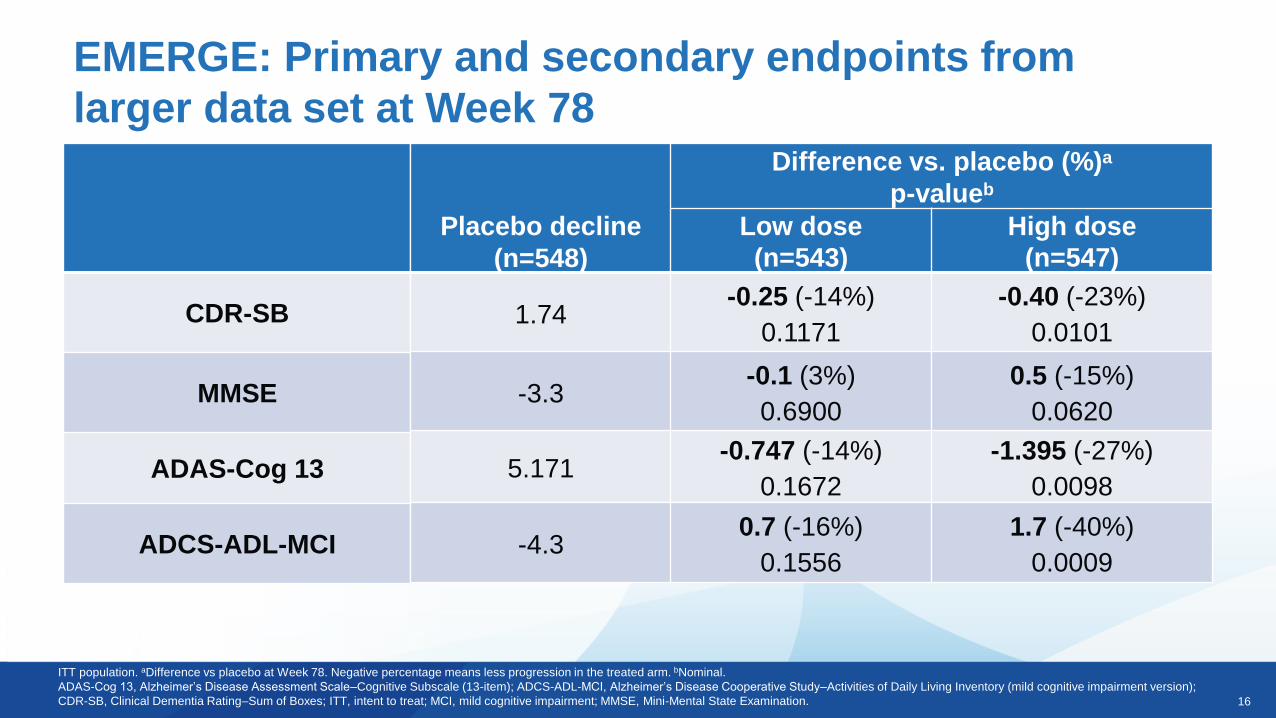
EMERGE: Primary and secondary endpoints from
larger data set at Week 78
ITT population. aDifference vs placebo at Week 78. Negative percentage means less progression in the treated arm. bNominal.
ADAS-Cog 13, Alzheimer’s Disease Assessment Scale–Cognitive Subscale (13-item); ADCS-ADL-MCI, Alzheimer’s Disease Cooperative Study–Activities of Daily Living Inventory (mild cognitive impairment version);
CDR-SB, Clinical Dementia Rating–Sum of Boxes; ITT, intent to treat; MCI, mild cognitive impairment; MMSE, Mini-Mental State Examination.
Placebo decline
(n=548)
Difference vs. placebo (%)a
p-valueb
Low dose
(n=543)
High dose
(n=547)
1.74-0.25 (-14%)
0.1171
-0.40 (-23%)
0.0101
-3.3-0.1 (3%)
0.6900
0.5 (-15%)
0.0620
5.171-0.747 (-14%)
0.1672
-1.395 (-27%)
0.0098
-4.30.7 (-16%)
0.1556
1.7 (-40%)
0.0009
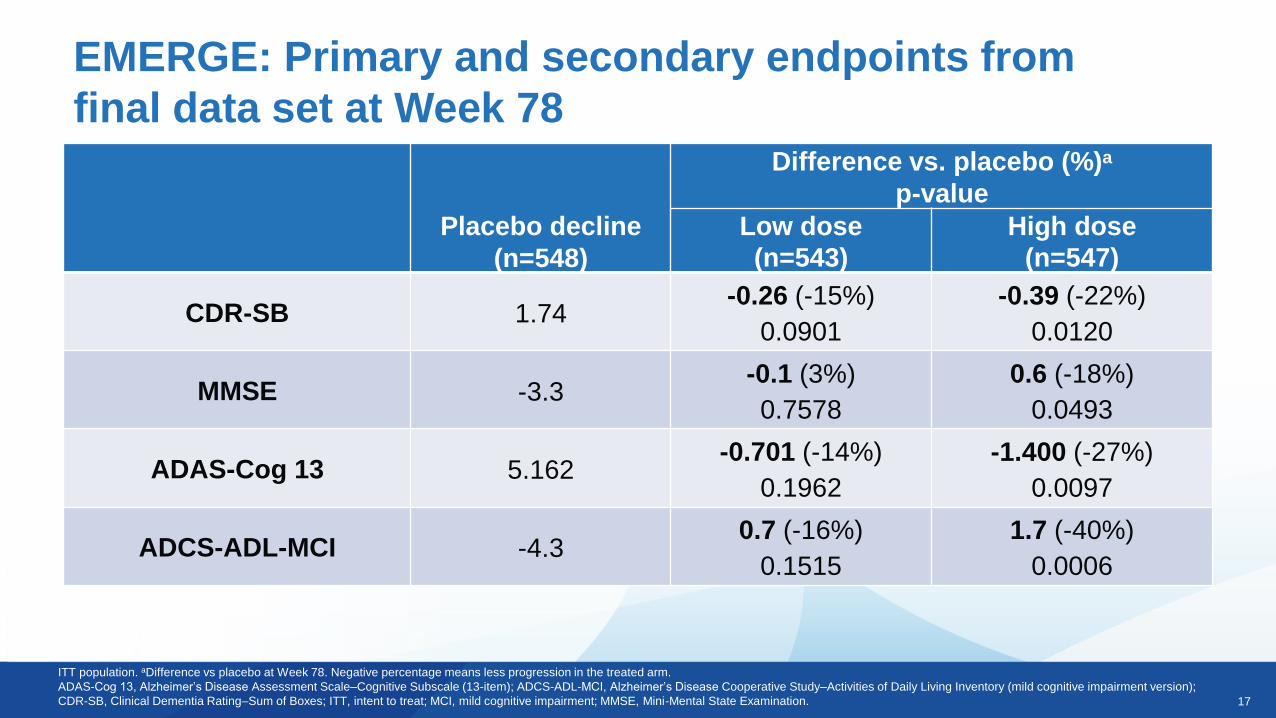
17
ITT population. aDifference vs placebo at Week 78. Negative percentage means less progression in the treated arm.
ADAS-Cog 13, Alzheimer’s Disease Assessment Scale–Cognitive Subscale (13-item); ADCS-ADL-MCI, Alzheimer’s Disease Cooperative Study–Activities of Daily Living Inventory (mild cognitive impairment version);
CDR-SB, Clinical Dementia Rating–Sum of Boxes; ITT, intent to treat; MCI, mild cognitive impairment; MMSE, Mini-Mental State Examination.
EMERGE: Primary and secondary endpoints from
final data set at Week 78
Placebo decline
(n=548)
Difference vs. placebo (%)a
p-value
Low dose
(n=543)
High dose
(n=547)
CDR-SB 1.74-0.26 (-15%)
0.0901
-0.39 (-22%)
0.0120
MMSE -3.3-0.1 (3%)
0.7578
0.6 (-18%)
0.0493
ADAS-Cog 13 5.162-0.701 (-14%)
0.1962
-1.400 (-27%)
0.0097
ADCS-ADL-MCI -4.30.7 (-16%)
0.1515
1.7 (-40%)
0.0006
18
0.00
0.50
1.00
1.50
2.00
0 26 50 78
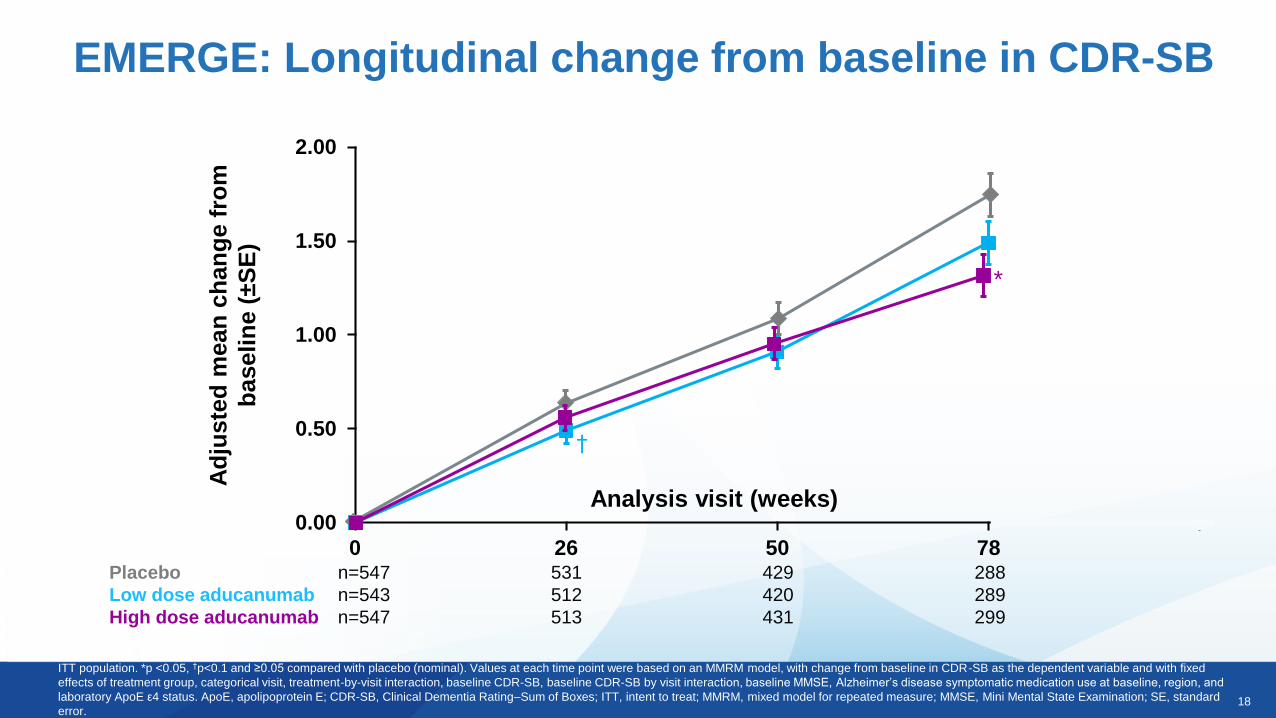
EMERGE: Longitudinal change from baseline in CDR-SB
ITT population. *p <0.05, †p<0.1 and ≥0.05 compared with placebo (nominal). Values at each time point were based on an MMRM model, with change from baseline in CDR-SB as the dependent variable and with fixed
effects of treatment group, categorical visit, treatment-by-visit interaction, baseline CDR-SB, baseline CDR-SB by visit interaction, baseline MMSE, Alzheimer’s disease symptomatic medication use at baseline, region, and
laboratory ApoE ε4 status. ApoE, apolipoprotein E; CDR-SB, Clinical Dementia Rating–Sum of Boxes; ITT, intent to treat; MMRM, mixed model for repeated measure; MMSE, Mini Mental State Examination; SE, standard
error.
Ad
juste
d m
ean
ch
an
ge f
rom
baselin
e (
±S
E)
Analysis visit (weeks)
Placebo n=547 531 429 288
Low dose aducanumab n=543 512 420 289
High dose aducanumab n=547 513 431 299
*
†
19
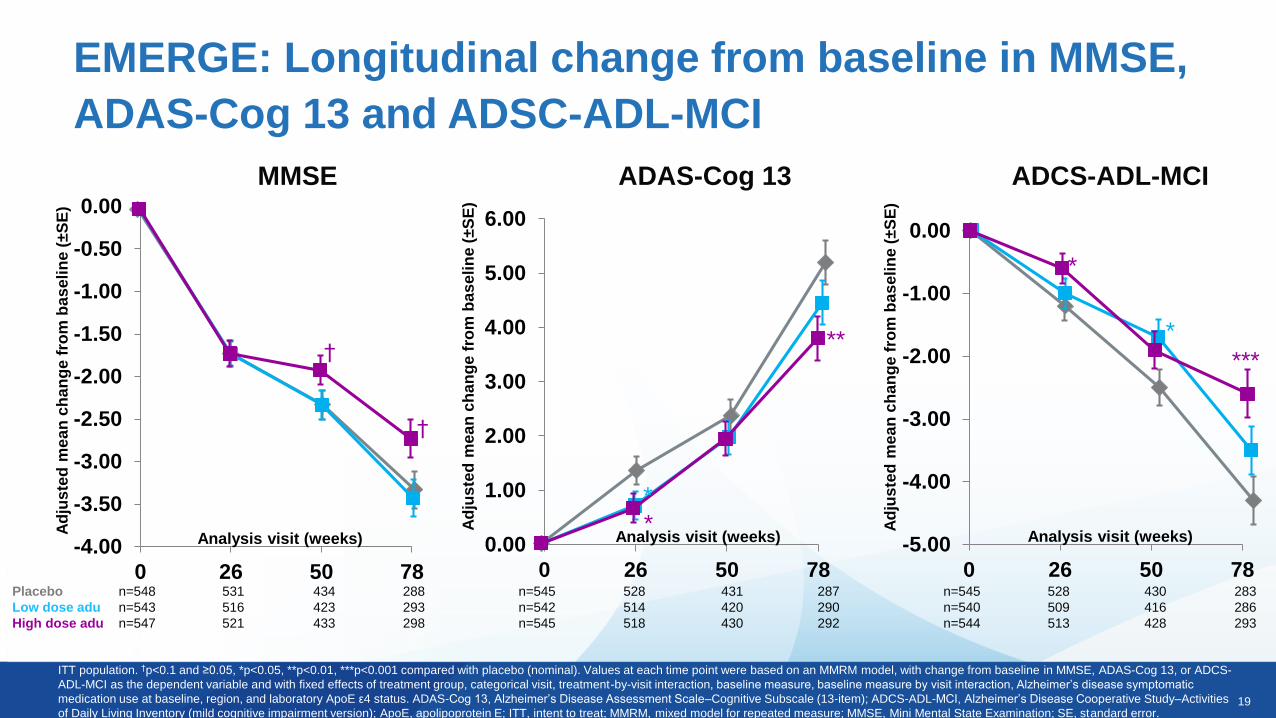
EMERGE: Longitudinal change from baseline in MMSE,
ADAS-Cog 13 and ADSC-ADL-MCI
ITT population. †p<0.1 and ≥0.05, *p<0.05, **p<0.01, ***p<0.001 compared with placebo (nominal). Values at each time point were based on an MMRM model, with change from baseline in MMSE, ADAS-Cog 13, or ADCS-
ADL-MCI as the dependent variable and with fixed effects of treatment group, categorical visit, treatment-by-visit interaction, baseline measure, baseline measure by visit interaction, Alzheimer’s disease symptomatic
medication use at baseline, region, and laboratory ApoE ε4 status. ADAS-Cog 13, Alzheimer’s Disease Assessment Scale–Cognitive Subscale (13-item); ADCS-ADL-MCI, Alzheimer’s Disease Cooperative Study–Activities
of Daily Living Inventory (mild cognitive impairment version); ApoE, apolipoprotein E; ITT, intent to treat; MMRM, mixed model for repeated measure; MMSE, Mini Mental State Examination; SE, standard error.
Placebo n=548 531 434 288
Low dose adu n=543 516 423 293
High dose adu n=547 521 433 298
n=545 528 431 287
n=542 514 420 290
n=545 518 430 292
n=545 528 430 283
n=540 509 416 286
n=544 513 428 293
-4.00
-3.50
-3.00
-2.50
-2.00
-1.50
-1.00
-0.50
0.00
0 26 50 78
Analysis visit (weeks)
†
†
Ad
jus
ted
me
an
ch
an
ge f
rom
ba
se
lin
e (
±S
E)
MMSE
-5.00
-4.00
-3.00
-2.00
-1.00
0.00
0 26 50 78
Analysis visit (weeks)
*
*
***
Ad
jus
ted
me
an
ch
an
ge f
rom
ba
se
lin
e (
±S
E)
ADCS-ADL-MCIADAS-Cog 13
0.00
1.00
2.00
3.00
4.00
5.00
6.00
0 26 50 78
Analysis visit (weeks)
**
**
Ad
jus
ted
me
an
ch
an
ge f
rom
ba
se
lin
e (
±S
E)
20
-0.35
-0.30
-0.25
-0.20
-0.15
-0.10
-0.05
0.00
0.05
Analysis visit (weeks)
***
***
***
***
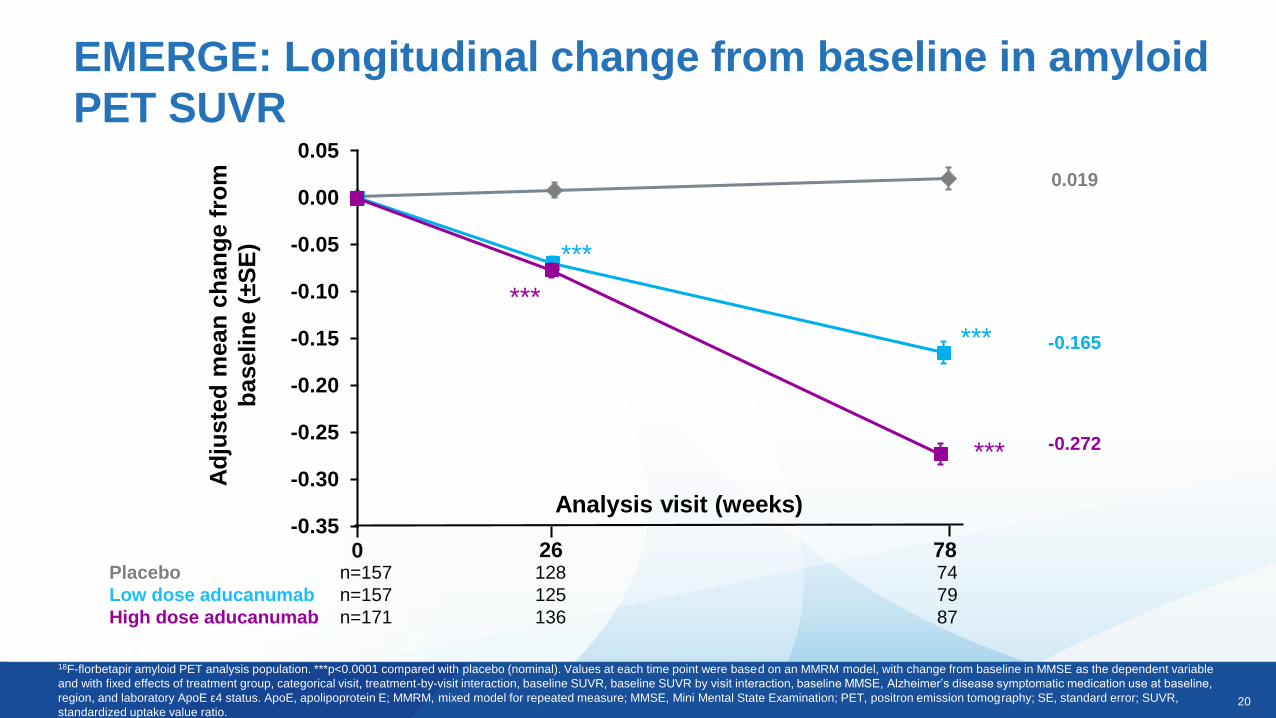
EMERGE: Longitudinal change from baseline in amyloid
PET SUVR
18F-florbetapir amyloid PET analysis population. ***p<0.0001 compared with placebo (nominal). Values at each time point were based on an MMRM model, with change from baseline in MMSE as the dependent variable
and with fixed effects of treatment group, categorical visit, treatment-by-visit interaction, baseline SUVR, baseline SUVR by visit interaction, baseline MMSE, Alzheimer’s disease symptomatic medication use at baseline,
region, and laboratory ApoE ε4 status. ApoE, apolipoprotein E; MMRM, mixed model for repeated measure; MMSE, Mini Mental State Examination; PET, positron emission tomography; SE, standard error; SUVR,
standardized uptake value ratio.
Placebo n=157 128 74
Low dose aducanumab n=157 125 79
High dose aducanumab n=171 136 87
26 780
Ad
juste
d m
ean
ch
an
ge f
rom
baselin
e (
±S
E)
0.019
-0.165
-0.272
21
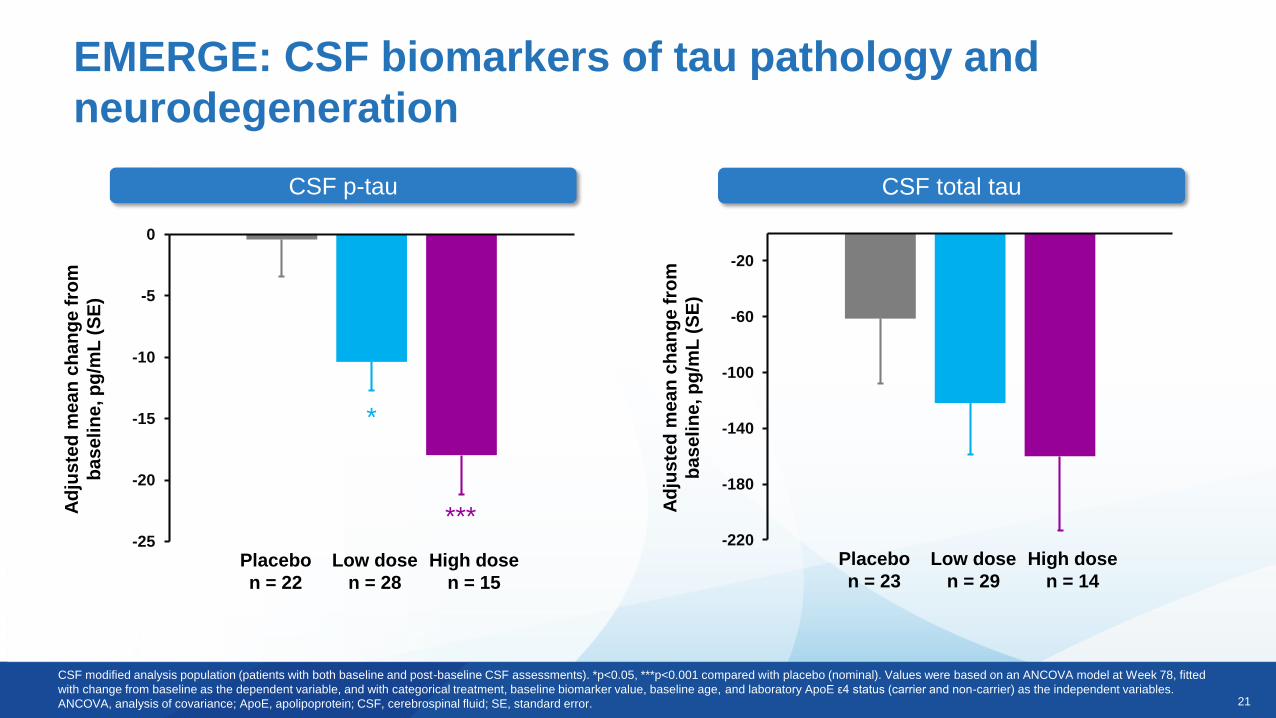
EMERGE: CSF biomarkers of tau pathology and
neurodegeneration
CSF p-tau CSF total tau
-220
-180
-140
-100
-60
-20
Ad
jus
ted
me
an
ch
an
ge
fro
m
ba
se
lin
e, p
g/m
L (
SE
)
Placebo
n = 23
Low dose
n = 29
High dose
n = 14
-25
-20
-15
-10
-5
0
Ad
jus
ted
me
an
ch
an
ge
fro
m
ba
se
lin
e, p
g/m
L (
SE
)
Placebo
n = 22
Low dose
n = 28
High dose
n = 15
*
***
CSF modified analysis population (patients with both baseline and post-baseline CSF assessments). *p<0.05, ***p<0.001 compared with placebo (nominal). Values were based on an ANCOVA model at Week 78, fitted
with change from baseline as the dependent variable, and with categorical treatment, baseline biomarker value, baseline age, and laboratory ApoE ε4 status (carrier and non-carrier) as the independent variables.
ANCOVA, analysis of covariance; ApoE, apolipoprotein; CSF, cerebrospinal fluid; SE, standard error.
22
ENGAGE
Phase 3 Topline Results
23
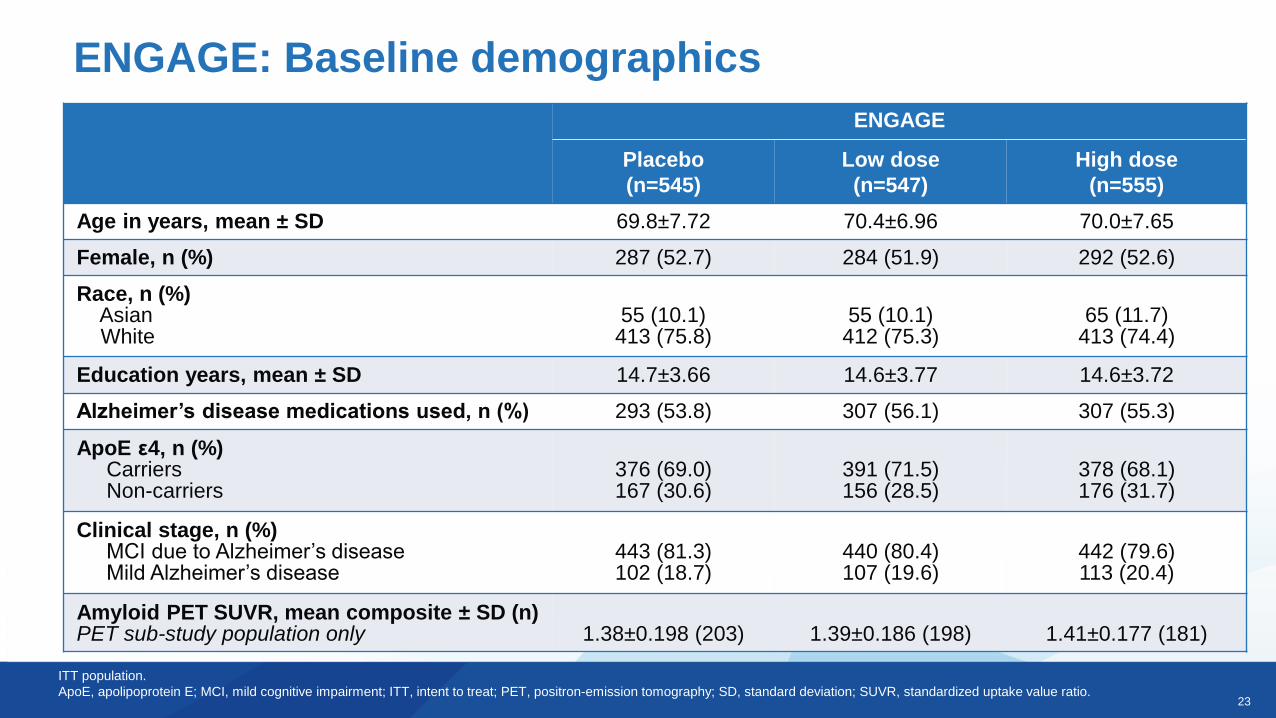
ENGAGE
Placebo
(n=545)
Low dose
(n=547)
High dose
(n=555)
Age in years, mean ± SD 69.8±7.72 70.4±6.96 70.0±7.65
Female, n (%) 287 (52.7) 284 (51.9) 292 (52.6)
Race, n (%)AsianWhite
55 (10.1)413 (75.8)
55 (10.1)412 (75.3)
65 (11.7)413 (74.4)
Education years, mean ± SD 14.7±3.66 14.6±3.77 14.6±3.72
Alzheimer’s disease medications used, n (%) 293 (53.8) 307 (56.1) 307 (55.3)
ApoE ε4, n (%)CarriersNon-carriers
376 (69.0)167 (30.6)
391 (71.5)156 (28.5)
378 (68.1)176 (31.7)
Clinical stage, n (%)MCI due to Alzheimer’s diseaseMild Alzheimer’s disease
443 (81.3)102 (18.7)
440 (80.4)107 (19.6)
442 (79.6)113 (20.4)
Amyloid PET SUVR, mean composite ± SD (n) PET sub-study population only 1.38±0.198 (203) 1.39±0.186 (198) 1.41±0.177 (181)
ENGAGE: Baseline demographics
ITT population.
ApoE, apolipoprotein E; MCI, mild cognitive impairment; ITT, intent to treat; PET, positron-emission tomography; SD, standard deviation; SUVR, standardized uptake value ratio.
24
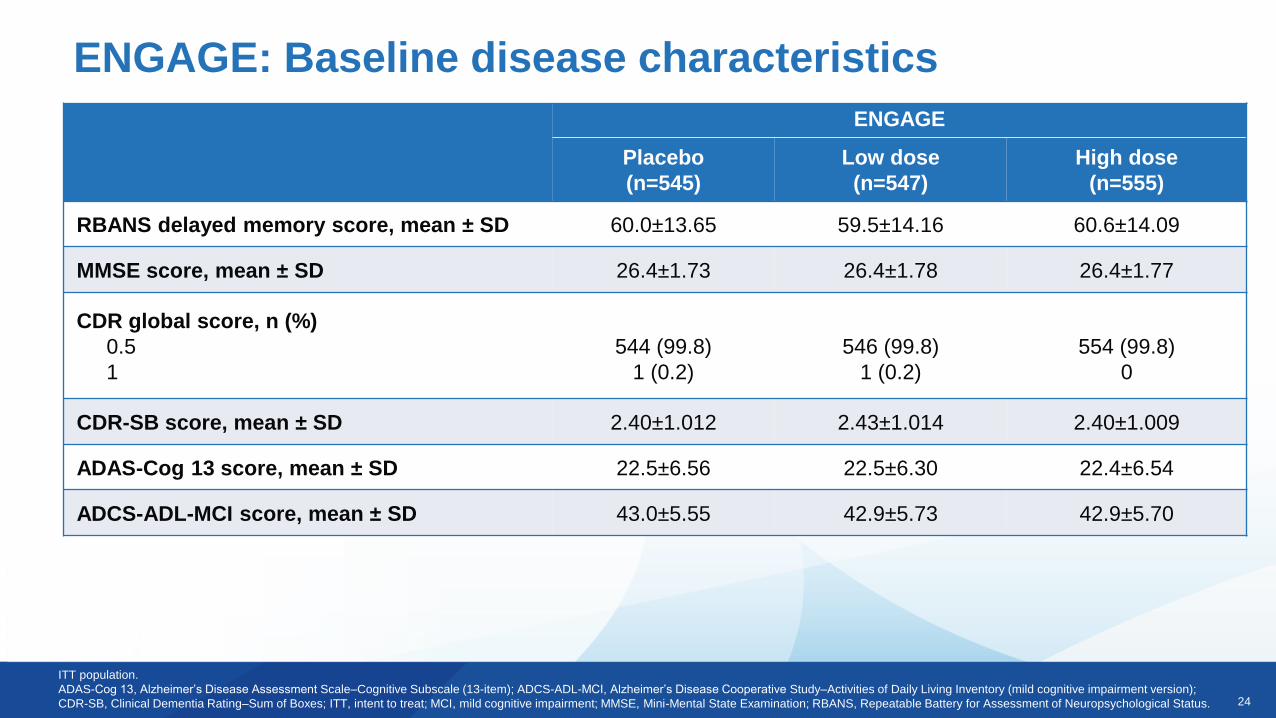
ENGAGE: Baseline disease characteristics
ITT population.
ADAS-Cog 13, Alzheimer’s Disease Assessment Scale–Cognitive Subscale (13-item); ADCS-ADL-MCI, Alzheimer’s Disease Cooperative Study–Activities of Daily Living Inventory (mild cognitive impairment version);
CDR-SB, Clinical Dementia Rating–Sum of Boxes; ITT, intent to treat; MCI, mild cognitive impairment; MMSE, Mini-Mental State Examination; RBANS, Repeatable Battery for Assessment of Neuropsychological Status.
ENGAGE
Placebo
(n=545)
Low dose
(n=547)
High dose
(n=555)
RBANS delayed memory score, mean ± SD 60.0±13.65 59.5±14.16 60.6±14.09
MMSE score, mean ± SD 26.4±1.73 26.4±1.78 26.4±1.77
CDR global score, n (%)
0.5
1
544 (99.8)
1 (0.2)
546 (99.8)
1 (0.2)
554 (99.8)
0
CDR-SB score, mean ± SD 2.40±1.012 2.43±1.014 2.40±1.009
ADAS-Cog 13 score, mean ± SD 22.5±6.56 22.5±6.30 22.4±6.54
ADCS-ADL-MCI score, mean ± SD 43.0±5.55 42.9±5.73 42.9±5.70
25
Randomized
Dosed
Discontinued treatmenta, n (%)
Adverse event
Consent withdrawn
Death
Study visit burden
Site terminated by sponsor
Other
Withdrew from studya, n (%)
Adverse event
Consent withdrawn
Death
Study visit burden
Site terminated by sponsor
Other
Completed placebo-controlled period, n (%)
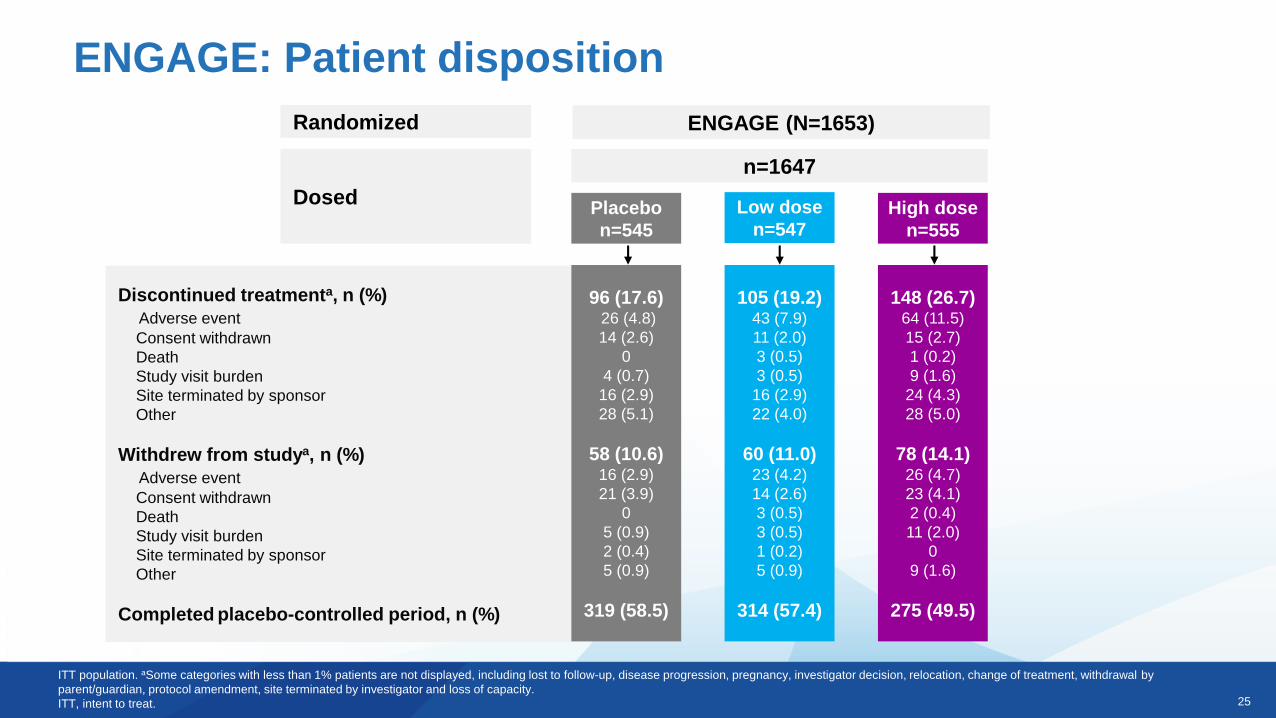
ENGAGE (N=1653)
n=1647
Placebo
n=545
Low dose
n=547High dose
n=555
96 (17.6)26 (4.8)
14 (2.6)
0
4 (0.7)
16 (2.9)
28 (5.1)
58 (10.6)16 (2.9)
21 (3.9)
0
5 (0.9)
2 (0.4)
5 (0.9)
319 (58.5)
105 (19.2)43 (7.9)
11 (2.0)
3 (0.5)
3 (0.5)
16 (2.9)
22 (4.0)
60 (11.0)23 (4.2)
14 (2.6)
3 (0.5)
3 (0.5)
1 (0.2)
5 (0.9)
314 (57.4)
148 (26.7)64 (11.5)
15 (2.7)
1 (0.2)
9 (1.6)
24 (4.3)
28 (5.0)
78 (14.1)26 (4.7)
23 (4.1)
2 (0.4)
11 (2.0)
0
9 (1.6)
275 (49.5)
ITT population. aSome categories with less than 1% patients are not displayed, including lost to follow-up, disease progression, pregnancy, investigator decision, relocation, change of treatment, withdrawal by
parent/guardian, protocol amendment, site terminated by investigator and loss of capacity.
ITT, intent to treat.
ENGAGE: Patient disposition
26
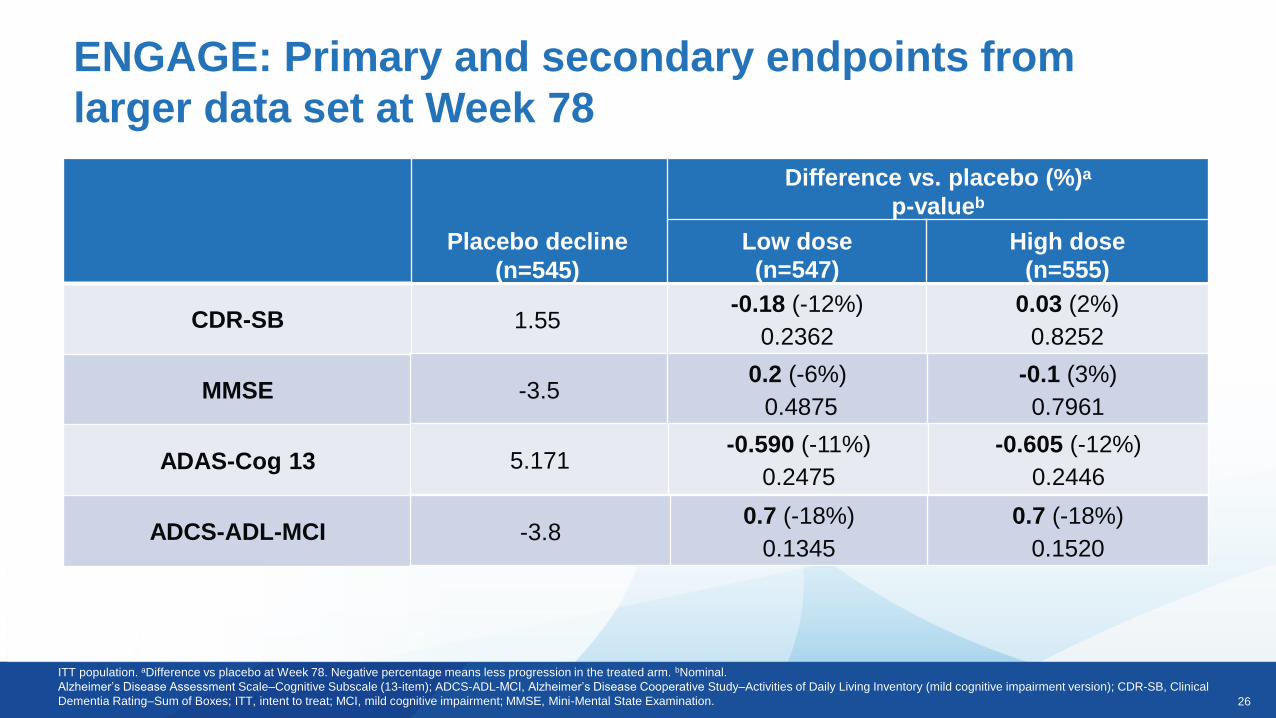
Placebo decline
(n=545)
Difference vs. placebo (%)a
p-valueb
Low dose
(n=547)
High dose
(n=555)
1.55-0.18 (-12%)
0.2362
0.03 (2%)
0.8252
ENGAGE: Primary and secondary endpoints from
larger data set at Week 78
ITT population. aDifference vs placebo at Week 78. Negative percentage means less progression in the treated arm. bNominal.
Alzheimer’s Disease Assessment Scale–Cognitive Subscale (13-item); ADCS-ADL-MCI, Alzheimer’s Disease Cooperative Study–Activities of Daily Living Inventory (mild cognitive impairment version); CDR-SB, Clinical
Dementia Rating–Sum of Boxes; ITT, intent to treat; MCI, mild cognitive impairment; MMSE, Mini-Mental State Examination.
CDR-SB
MMSE
ADAS-Cog 13
ADCS-ADL-MCI
-3.50.2 (-6%)
0.4875
-0.1 (3%)
0.7961
5.171-0.590 (-11%)
0.2475
-0.605 (-12%)
0.2446
-3.80.7 (-18%)
0.1345
0.7 (-18%)
0.1520
27
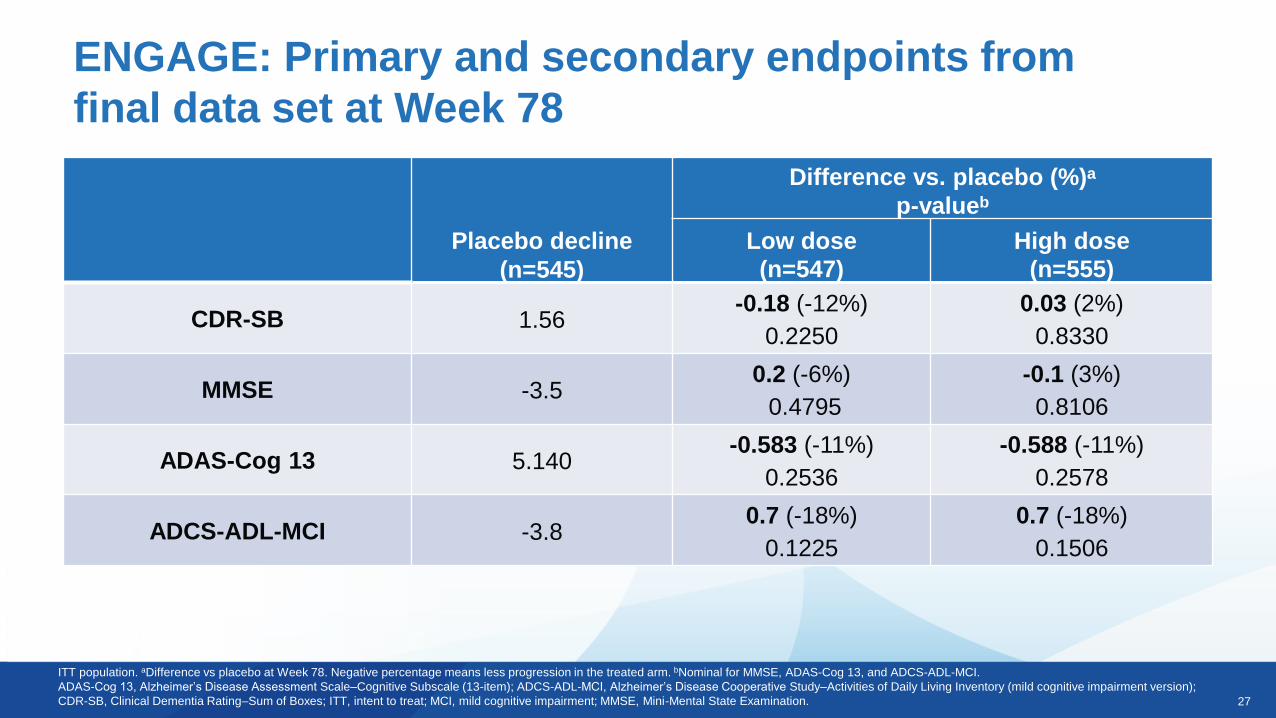
ITT population. aDifference vs placebo at Week 78. Negative percentage means less progression in the treated arm. bNominal for MMSE, ADAS-Cog 13, and ADCS-ADL-MCI.
ADAS-Cog 13, Alzheimer’s Disease Assessment Scale–Cognitive Subscale (13-item); ADCS-ADL-MCI, Alzheimer’s Disease Cooperative Study–Activities of Daily Living Inventory (mild cognitive impairment version);
CDR-SB, Clinical Dementia Rating–Sum of Boxes; ITT, intent to treat; MCI, mild cognitive impairment; MMSE, Mini-Mental State Examination.
ENGAGE: Primary and secondary endpoints from
final data set at Week 78
Placebo decline
(n=545)
Difference vs. placebo (%)a
p-valueb
Low dose
(n=547)
High dose
(n=555)
CDR-SB 1.56-0.18 (-12%)
0.2250
0.03 (2%)
0.8330
MMSE -3.50.2 (-6%)
0.4795
-0.1 (3%)
0.8106
ADAS-Cog 13 5.140-0.583 (-11%)
0.2536
-0.588 (-11%)
0.2578
ADCS-ADL-MCI -3.80.7 (-18%)
0.1225
0.7 (-18%)
0.1506
28
0.00
0.50
1.00
1.50
2.00
0 26 50 78
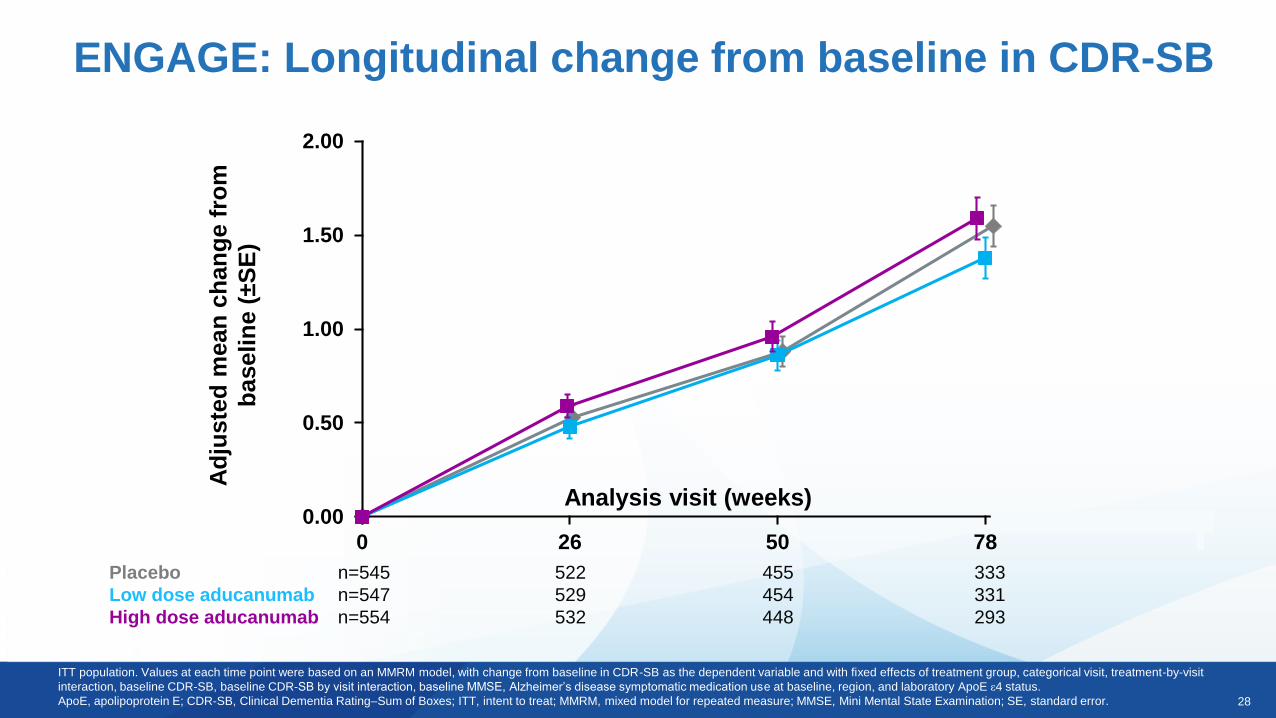
ENGAGE: Longitudinal change from baseline in CDR-SB
Analysis visit (weeks)
ITT population. Values at each time point were based on an MMRM model, with change from baseline in CDR-SB as the dependent variable and with fixed effects of treatment group, categorical visit, treatment-by-visit
interaction, baseline CDR-SB, baseline CDR-SB by visit interaction, baseline MMSE, Alzheimer’s disease symptomatic medication use at baseline, region, and laboratory ApoE ε4 status.
ApoE, apolipoprotein E; CDR-SB, Clinical Dementia Rating–Sum of Boxes; ITT, intent to treat; MMRM, mixed model for repeated measure; MMSE, Mini Mental State Examination; SE, standard error.
Placebo n=545 522 455 333
Low dose aducanumab n=547 529 454 331
High dose aducanumab n=554 532 448 293
Ad
juste
d m
ean
ch
an
ge f
rom
baselin
e (
±S
E)
29
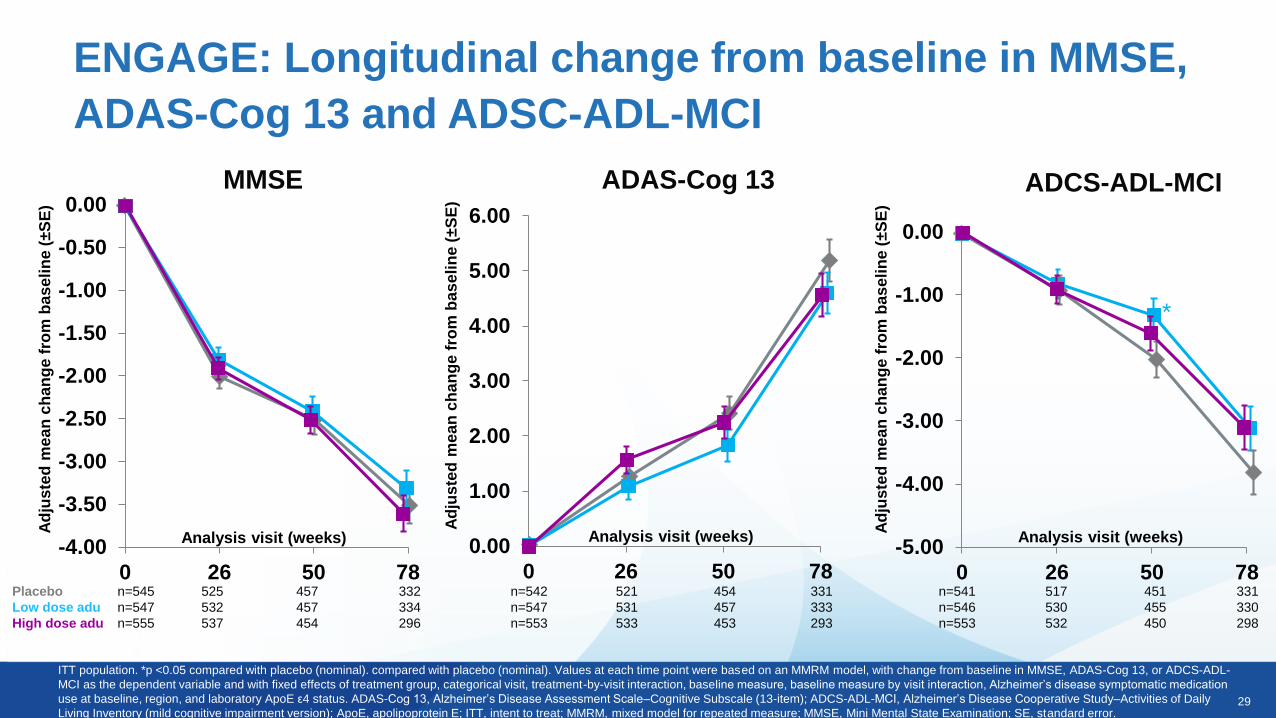
ENGAGE: Longitudinal change from baseline in MMSE,
ADAS-Cog 13 and ADSC-ADL-MCI
ITT population. *p <0.05 compared with placebo (nominal). compared with placebo (nominal). Values at each time point were based on an MMRM model, with change from baseline in MMSE, ADAS-Cog 13, or ADCS-ADL-
MCI as the dependent variable and with fixed effects of treatment group, categorical visit, treatment-by-visit interaction, baseline measure, baseline measure by visit interaction, Alzheimer’s disease symptomatic medication
use at baseline, region, and laboratory ApoE ε4 status. ADAS-Cog 13, Alzheimer’s Disease Assessment Scale–Cognitive Subscale (13-item); ADCS-ADL-MCI, Alzheimer’s Disease Cooperative Study–Activities of Daily
Living Inventory (mild cognitive impairment version); ApoE, apolipoprotein E; ITT, intent to treat; MMRM, mixed model for repeated measure; MMSE, Mini Mental State Examination; SE, standard error.
-4.00
-3.50
-3.00
-2.50
-2.00
-1.50
-1.00
-0.50
0.00
0 26 50 78
Analysis visit (weeks)
Ad
jus
ted
me
an
ch
an
ge f
rom
ba
se
lin
e (
±S
E)
MMSE
Placebo n=545 525 457 332
Low dose adu n=547 532 457 334
High dose adu n=555 537 454 296
0.00
1.00
2.00
3.00
4.00
5.00
6.00
0 26 50 78
Analysis visit (weeks)
Ad
jus
ted
me
an
ch
an
ge f
rom
ba
se
lin
e (
±S
E)
ADAS-Cog 13
n=542 521 454 331
n=547 531 457 333
n=553 533 453 293
-5.00
-4.00
-3.00
-2.00
-1.00
0.00
0 26 50 78
Analysis visit (weeks)
*
Ad
jus
ted
me
an
ch
an
ge f
rom
ba
se
lin
e (
±S
E)
ADCS-ADL-MCI
n=541 517 451 331
n=546 530 455 330
n=553 532 450 298
30
-0.35
-0.30
-0.25
-0.20
-0.15
-0.10
-0.05
0.00
0.05
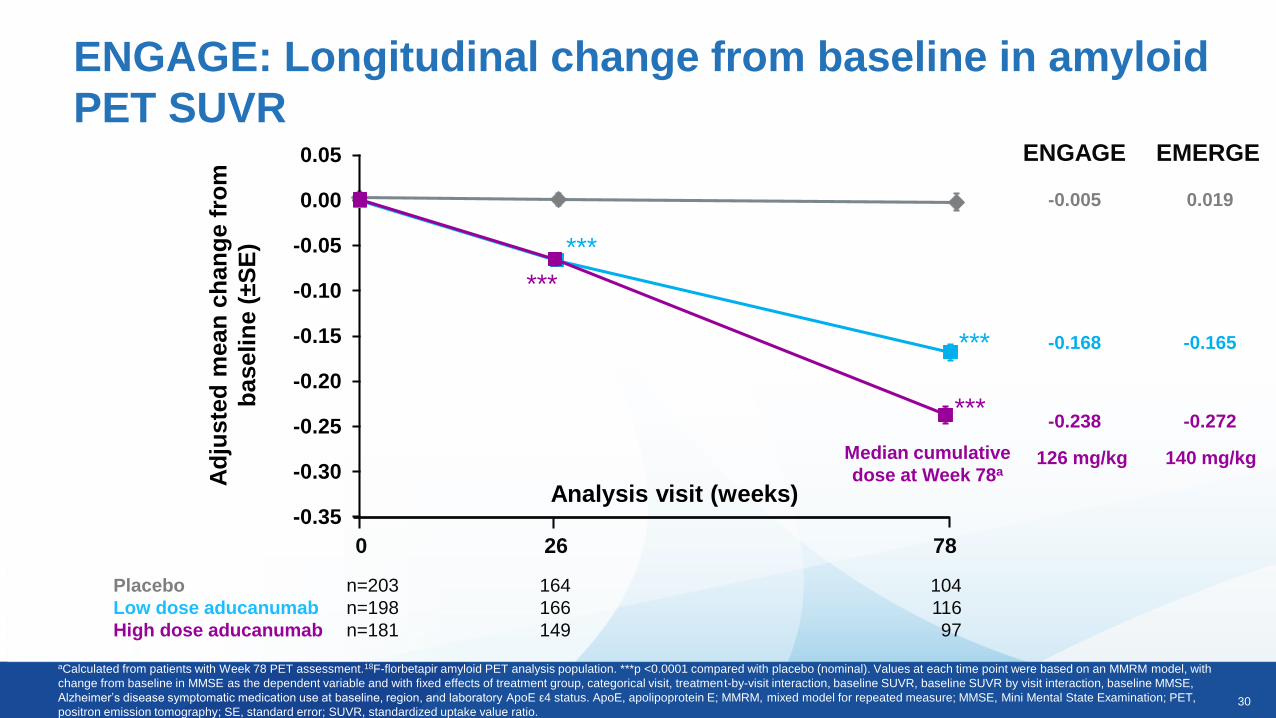
ENGAGE: Longitudinal change from baseline in amyloid
PET SUVR
aCalculated from patients with Week 78 PET assessment.18F-florbetapir amyloid PET analysis population. ***p <0.0001 compared with placebo (nominal). Values at each time point were based on an MMRM model, with
change from baseline in MMSE as the dependent variable and with fixed effects of treatment group, categorical visit, treatment-by-visit interaction, baseline SUVR, baseline SUVR by visit interaction, baseline MMSE,
Alzheimer’s disease symptomatic medication use at baseline, region, and laboratory ApoE ε4 status. ApoE, apolipoprotein E; MMRM, mixed model for repeated measure; MMSE, Mini Mental State Examination; PET,
positron emission tomography; SE, standard error; SUVR, standardized uptake value ratio.
Placebo n=203 164 104
Low dose aducanumab n=198 166 116
High dose aducanumab n=181 149 97
Analysis visit (weeks)
***
***
***
***
0 26 78
Ad
juste
d m
ean
ch
an
ge f
rom
baselin
e (
±S
E)
-0.005
-0.168
-0.238
ENGAGE EMERGE
0.019
-0.165
-0.272
Median cumulative
dose at Week 78a126 mg/kg 140 mg/kg
31
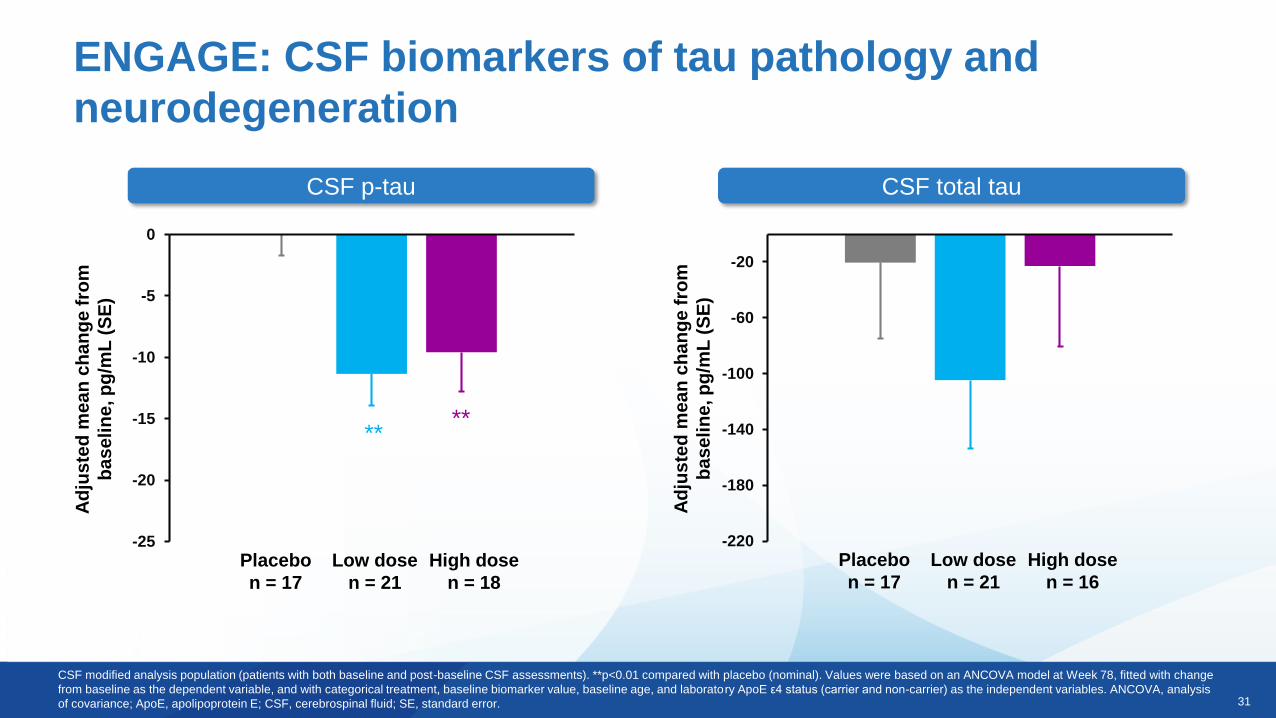
ENGAGE: CSF biomarkers of tau pathology and
neurodegeneration
CSF p-tau CSF total tau
-220
-180
-140
-100
-60
-20
Ad
jus
ted
me
an
ch
an
ge
fro
m
ba
se
lin
e, p
g/m
L (
SE
)
Placebo
n = 17
Low dose
n = 21
High dose
n = 16
-25
-20
-15
-10
-5
0
Ad
jus
ted
me
an
ch
an
ge
fro
m
ba
se
lin
e, p
g/m
L (
SE
)
Placebo
n = 17
Low dose
n = 21
High dose
n = 18
****
CSF modified analysis population (patients with both baseline and post-baseline CSF assessments). **p<0.01 compared with placebo (nominal). Values were based on an ANCOVA model at Week 78, fitted with change
from baseline as the dependent variable, and with categorical treatment, baseline biomarker value, baseline age, and laboratory ApoE ε4 status (carrier and non-carrier) as the independent variables. ANCOVA, analysis
of covariance; ApoE, apolipoprotein E; CSF, cerebrospinal fluid; SE, standard error.

32
Tau PET data
Phase 3 Results
33
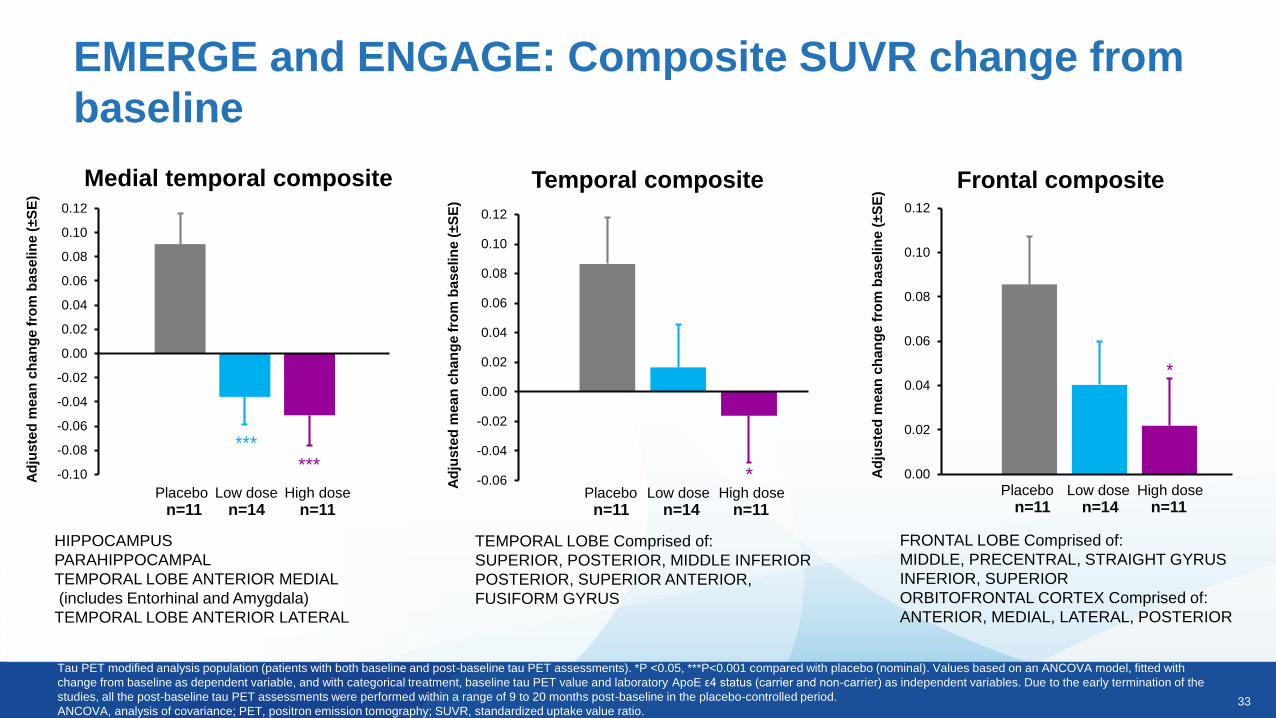
Medial temporal composite Frontal compositeTemporal composite
HIPPOCAMPUS
PARAHIPPOCAMPAL
TEMPORAL LOBE ANTERIOR MEDIAL
(includes Entorhinal and Amygdala)
TEMPORAL LOBE ANTERIOR LATERAL
FRONTAL LOBE Comprised of:
MIDDLE, PRECENTRAL, STRAIGHT GYRUS
INFERIOR, SUPERIOR
ORBITOFRONTAL CORTEX Comprised of:
ANTERIOR, MEDIAL, LATERAL, POSTERIOR
TEMPORAL LOBE Comprised of:
SUPERIOR, POSTERIOR, MIDDLE INFERIOR
POSTERIOR, SUPERIOR ANTERIOR,
FUSIFORM GYRUS
-0.10
-0.08
-0.06
-0.04
-0.02
0.00
0.02
0.04
0.06
0.08
0.10
0.12
Ad
jus
ted
me
an
ch
an
ge
fro
m b
as
elin
e (
±S
E)
******
n=11 n=11n=14Placebo Low dose High dose
0.00
0.02
0.04
0.06
0.08
0.10
0.12
Ad
jus
ted
me
an
ch
an
ge
fro
m b
as
elin
e (
±S
E)
*
n=11 n=11n=14Placebo Low dose High dose
-0.06
-0.04
-0.02
0.00
0.02
0.04
0.06
0.08
0.10
0.12
Ad
jus
ted
me
an
ch
an
ge
fro
m b
as
elin
e (
±S
E)
*
n=11 n=14 n=11Placebo Low dose High dose
EMERGE and ENGAGE: Composite SUVR change from
baseline
Tau PET modified analysis population (patients with both baseline and post-baseline tau PET assessments). *P <0.05, ***P<0.001 compared with placebo (nominal). Values based on an ANCOVA model, fitted with
change from baseline as dependent variable, and with categorical treatment, baseline tau PET value and laboratory ApoE ε4 status (carrier and non-carrier) as independent variables. Due to the early termination of the
studies, all the post-baseline tau PET assessments were performed within a range of 9 to 20 months post-baseline in the placebo-controlled period.
ANCOVA, analysis of covariance; PET, positron emission tomography; SUVR, standardized uptake value ratio.
34
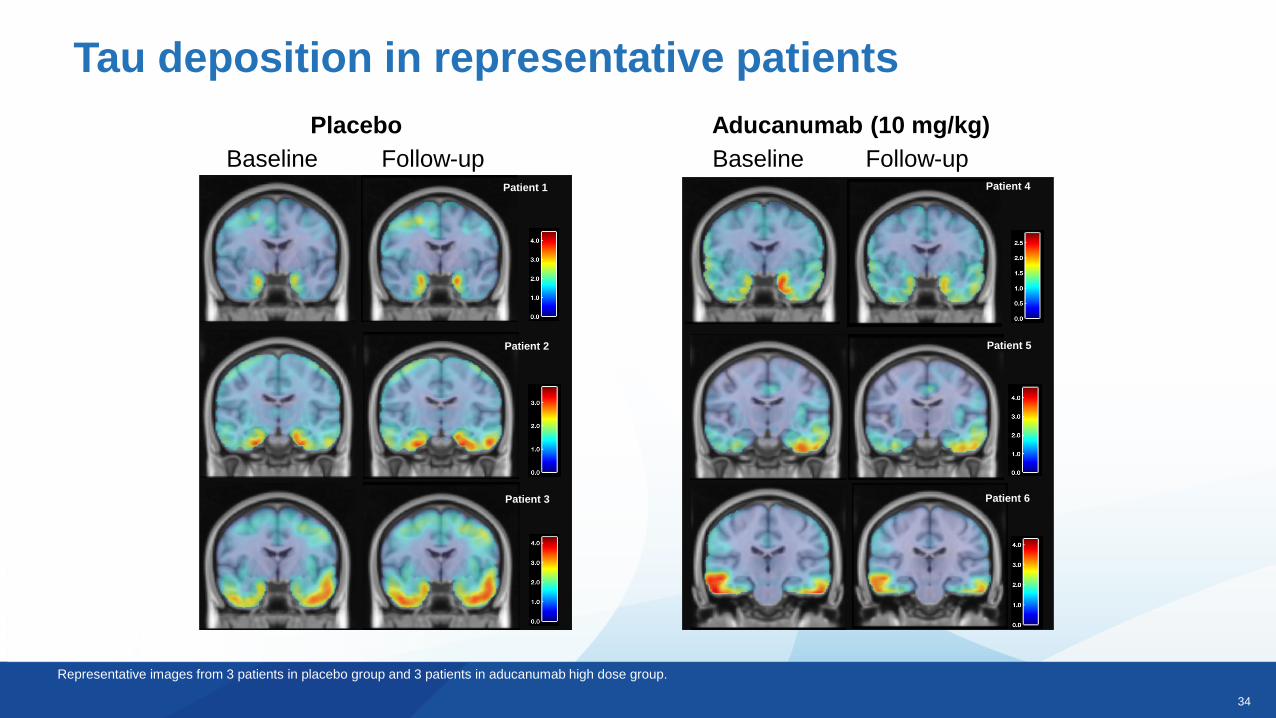
Tau deposition in representative patients
Representative images from 3 patients in placebo group and 3 patients in aducanumab high dose group.
Baseline Follow-up Baseline Follow-up
Placebo Aducanumab (10 mg/kg)
Patient 6
Patient 5
Patient 4Patient 1
Patient 3
Patient 2

35
Safety
Phase 3 Results
36
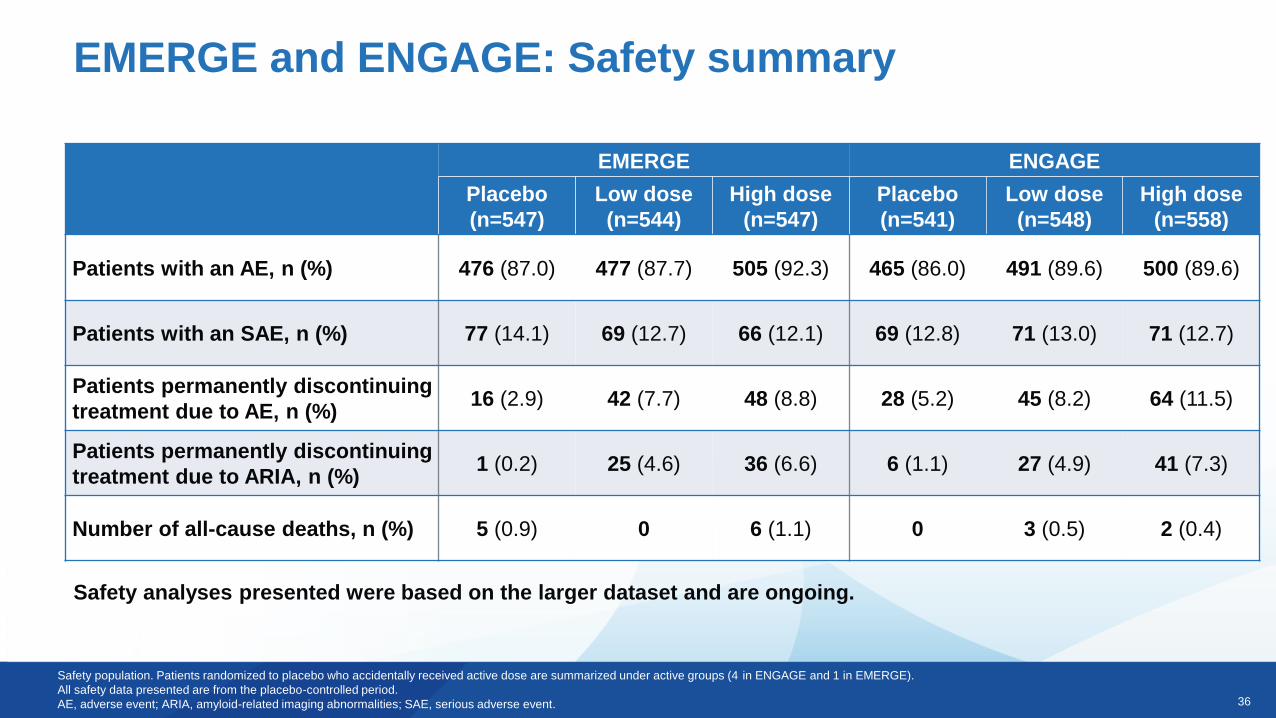
EMERGE and ENGAGE: Safety summary
EMERGE ENGAGE
Placebo
(n=547)
Low dose
(n=544)
High dose
(n=547)
Placebo
(n=541)
Low dose
(n=548)
High dose
(n=558)
Patients with an AE, n (%) 476 (87.0) 477 (87.7) 505 (92.3) 465 (86.0) 491 (89.6) 500 (89.6)
Patients with an SAE, n (%) 77 (14.1) 69 (12.7) 66 (12.1) 69 (12.8) 71 (13.0) 71 (12.7)
Patients permanently discontinuing
treatment due to AE, n (%)16 (2.9) 42 (7.7) 48 (8.8) 28 (5.2) 45 (8.2) 64 (11.5)
Patients permanently discontinuing
treatment due to ARIA, n (%)1 (0.2) 25 (4.6) 36 (6.6) 6 (1.1) 27 (4.9) 41 (7.3)
Number of all-cause deaths, n (%) 5 (0.9) 0 6 (1.1) 0 3 (0.5) 2 (0.4)
Safety population. Patients randomized to placebo who accidentally received active dose are summarized under active groups (4 in ENGAGE and 1 in EMERGE).
All safety data presented are from the placebo-controlled period.
AE, adverse event; ARIA, amyloid-related imaging abnormalities; SAE, serious adverse event.
Safety analyses presented were based on the larger dataset and are ongoing.
37
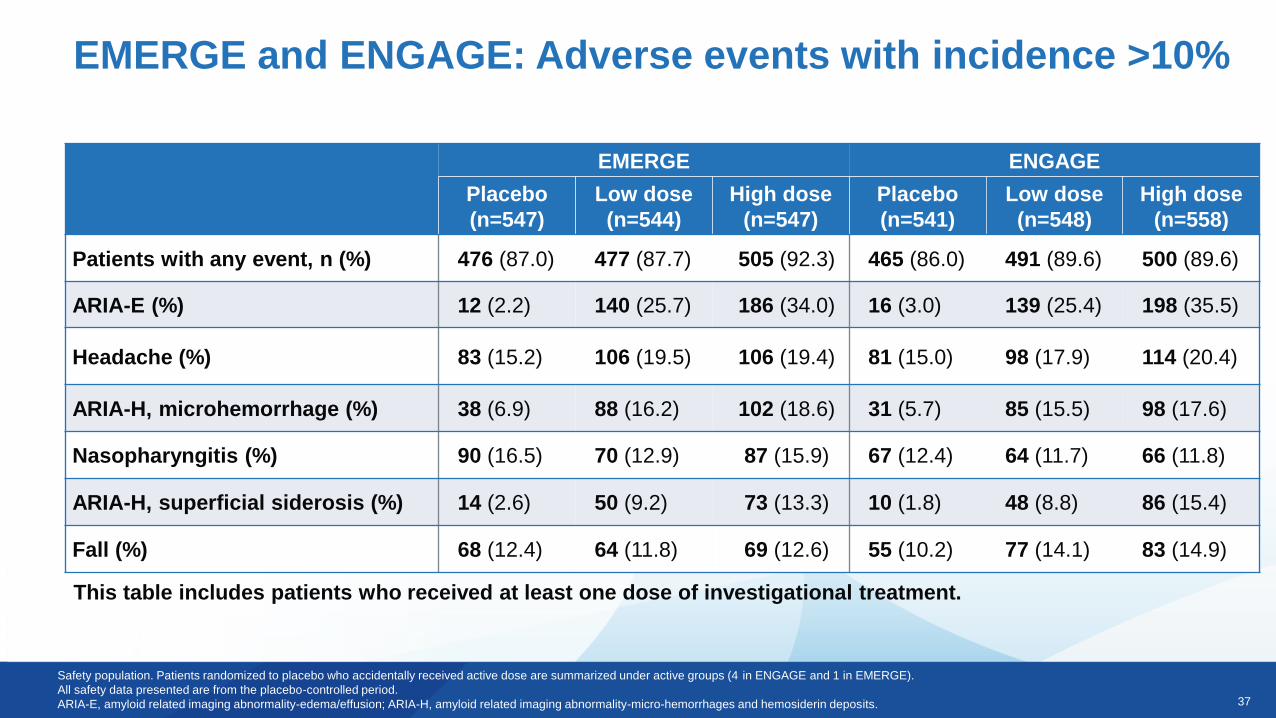
EMERGE and ENGAGE: Adverse events with incidence >10%
Safety population. Patients randomized to placebo who accidentally received active dose are summarized under active groups (4 in ENGAGE and 1 in EMERGE).
All safety data presented are from the placebo-controlled period.
ARIA-E, amyloid related imaging abnormality-edema/effusion; ARIA-H, amyloid related imaging abnormality-micro-hemorrhages and hemosiderin deposits.
This table includes patients who received at least one dose of investigational treatment.
EMERGE ENGAGE
Placebo
(n=547)
Low dose
(n=544)
High dose
(n=547)
Placebo
(n=541)
Low dose
(n=548)
High dose
(n=558)
Patients with any event, n (%) 476 (87.0) 477 (87.7) 505 (92.3) 465 (86.0) 491 (89.6) 500 (89.6)
ARIA-E (%) 12 (2.2) 140 (25.7) 186 (34.0) 16 (3.0) 139 (25.4) 198 (35.5)
Headache (%) 83 (15.2) 106 (19.5) 106 (19.4) 81 (15.0) 98 (17.9) 114 (20.4)
ARIA-H, microhemorrhage (%) 38 (6.9) 88 (16.2) 102 (18.6) 31 (5.7) 85 (15.5) 98 (17.6)
Nasopharyngitis (%) 90 (16.5) 70 (12.9) 87 (15.9) 67 (12.4) 64 (11.7) 66 (11.8)
ARIA-H, superficial siderosis (%) 14 (2.6) 50 (9.2) 73 (13.3) 10 (1.8) 48 (8.8) 86 (15.4)
Fall (%) 68 (12.4) 64 (11.8) 69 (12.6) 55 (10.2) 77 (14.1) 83 (14.9)
38
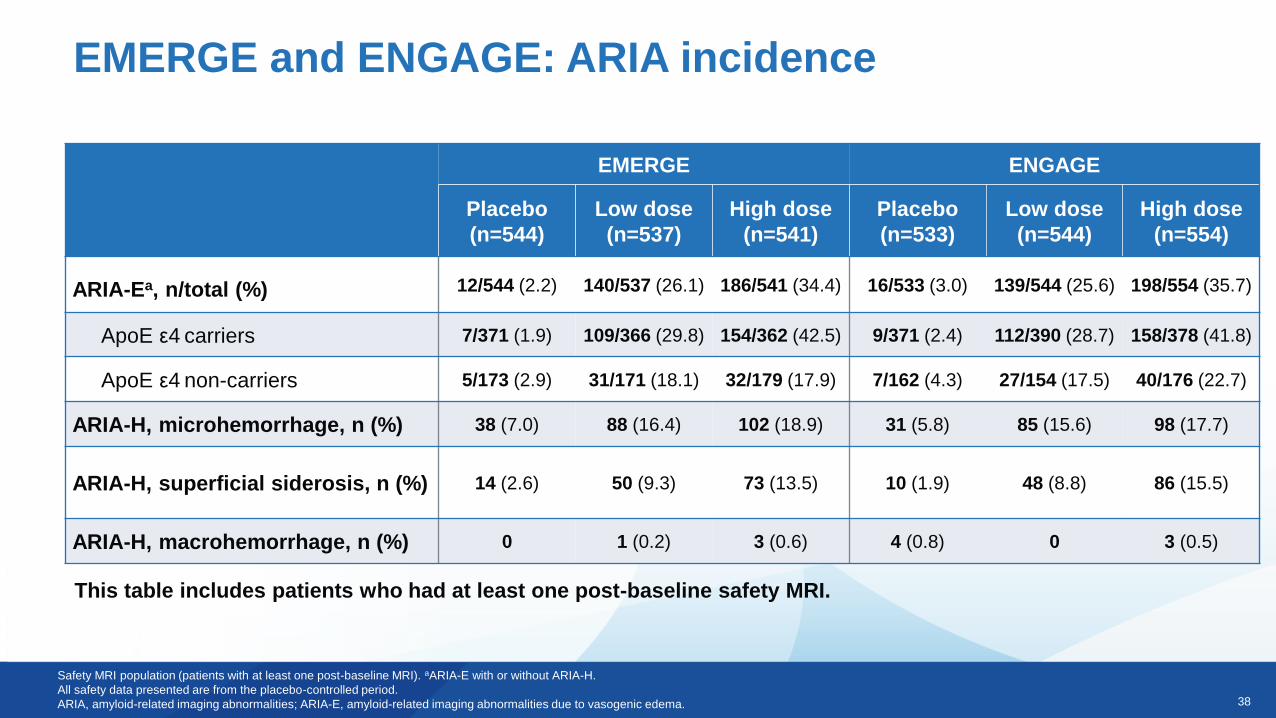
EMERGE and ENGAGE: ARIA incidence
Safety MRI population (patients with at least one post-baseline MRI). aARIA-E with or without ARIA-H.
All safety data presented are from the placebo-controlled period.
ARIA, amyloid-related imaging abnormalities; ARIA-E, amyloid-related imaging abnormalities due to vasogenic edema.
This table includes patients who had at least one post-baseline safety MRI.
EMERGE ENGAGE
Placebo
(n=544)
Low dose
(n=537)
High dose
(n=541)
Placebo
(n=533)
Low dose
(n=544)
High dose
(n=554)
ARIA-Ea, n/total (%) 12/544 (2.2) 140/537 (26.1) 186/541 (34.4) 16/533 (3.0) 139/544 (25.6) 198/554 (35.7)
ApoE ε4 carriers 7/371 (1.9) 109/366 (29.8) 154/362 (42.5) 9/371 (2.4) 112/390 (28.7) 158/378 (41.8)
ApoE ε4 non-carriers 5/173 (2.9) 31/171 (18.1) 32/179 (17.9) 7/162 (4.3) 27/154 (17.5) 40/176 (22.7)
ARIA-H, microhemorrhage, n (%) 38 (7.0) 88 (16.4) 102 (18.9) 31 (5.8) 85 (15.6) 98 (17.7)
ARIA-H, superficial siderosis, n (%) 14 (2.6) 50 (9.3) 73 (13.5) 10 (1.9) 48 (8.8) 86 (15.5)
ARIA-H, macrohemorrhage, n (%) 0 1 (0.2) 3 (0.6) 4 (0.8) 0 3 (0.5)
39
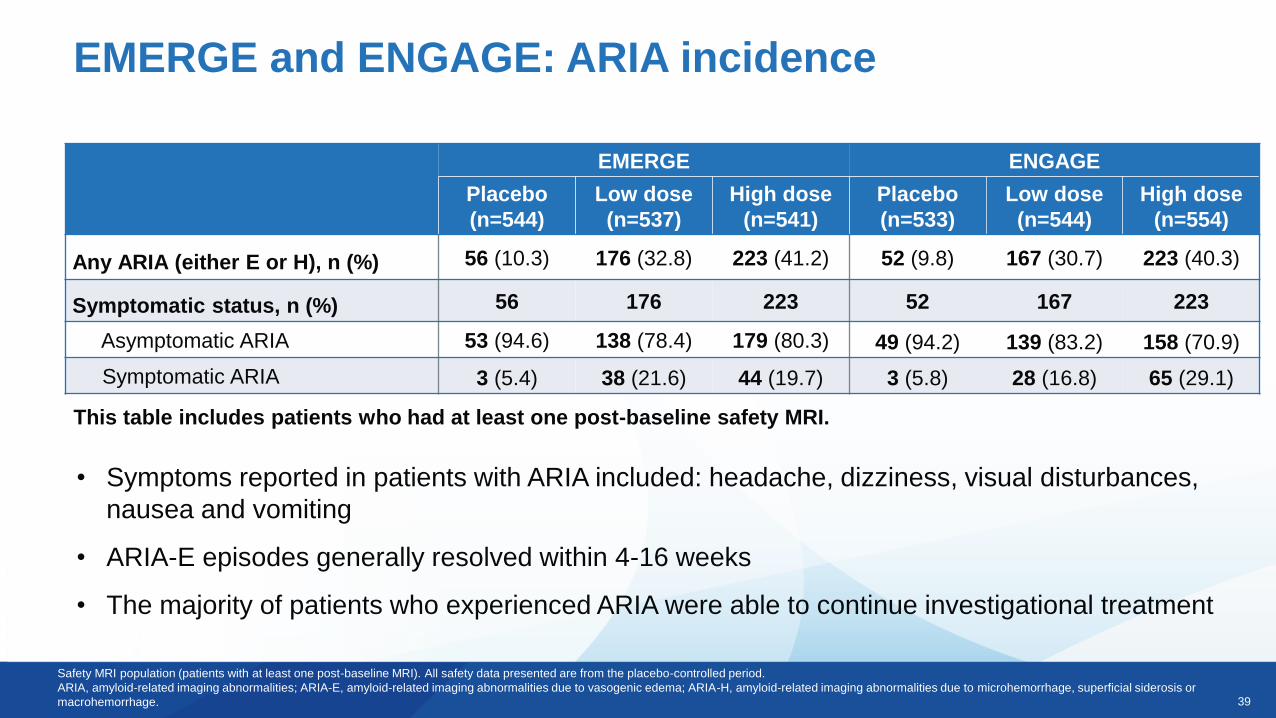
EMERGE and ENGAGE: ARIA incidence
Safety MRI population (patients with at least one post-baseline MRI). All safety data presented are from the placebo-controlled period.
ARIA, amyloid-related imaging abnormalities; ARIA-E, amyloid-related imaging abnormalities due to vasogenic edema; ARIA-H, amyloid-related imaging abnormalities due to microhemorrhage, superficial siderosis or
macrohemorrhage.
This table includes patients who had at least one post-baseline safety MRI.
• Symptoms reported in patients with ARIA included: headache, dizziness, visual disturbances,
nausea and vomiting
• ARIA-E episodes generally resolved within 4-16 weeks
• The majority of patients who experienced ARIA were able to continue investigational treatment
EMERGE ENGAGE
Placebo
(n=544)
Low dose
(n=537)
High dose
(n=541)
Placebo
(n=533)
Low dose
(n=544)
High dose
(n=554)
Any ARIA (either E or H), n (%) 56 (10.3) 176 (32.8) 223 (41.2) 52 (9.8) 167 (30.7) 223 (40.3)
Symptomatic status, n (%) 56 176 223 52 167 223
Asymptomatic ARIA 53 (94.6) 138 (78.4) 179 (80.3) 49 (94.2) 139 (83.2) 158 (70.9)
Symptomatic ARIA 3 (5.4) 38 (21.6) 44 (19.7) 3 (5.8) 28 (16.8) 65 (29.1)

40
EMERGE and ENGAGE
41
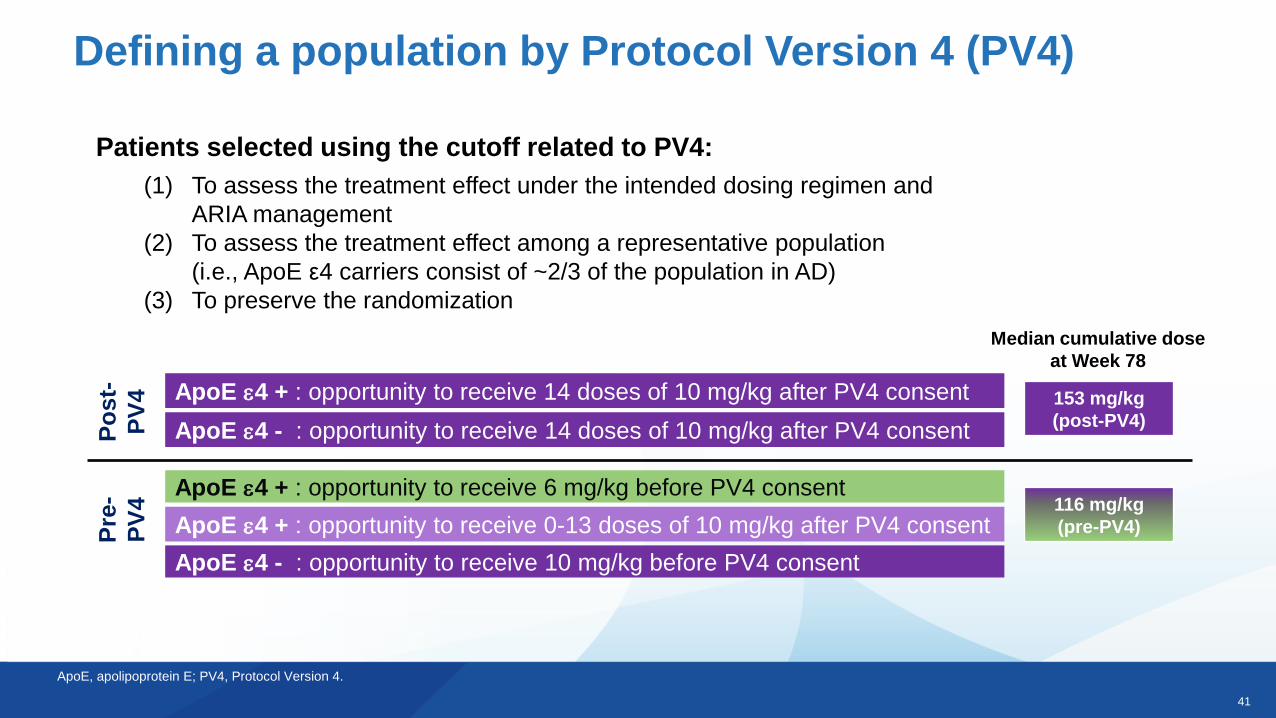
Defining a population by Protocol Version 4 (PV4)
ApoE e4 + : opportunity to receive 6 mg/kg before PV4 consent
ApoE e4 - : opportunity to receive 10 mg/kg before PV4 consent
ApoE e4 + : opportunity to receive 0-13 doses of 10 mg/kg after PV4 consent116 mg/kg
(pre-PV4)
153 mg/kg
(post-PV4)
Median cumulative dose
at Week 78
Pre
-
PV
4
Po
st-
PV
4 ApoE e4 + : opportunity to receive 14 doses of 10 mg/kg after PV4 consent
ApoE e4 - : opportunity to receive 14 doses of 10 mg/kg after PV4 consent
Patients selected using the cutoff related to PV4:
(1) To assess the treatment effect under the intended dosing regimen and
ARIA management
(2) To assess the treatment effect among a representative population
(i.e., ApoE ε4 carriers consist of ~2/3 of the population in AD)
(3) To preserve the randomization
ApoE, apolipoprotein E; PV4, Protocol Version 4.
42
Post-PV4
Wee
k 1
Wee
k 4
Wee
k 8
Wee
k 1
2
Wee
k 1
6
Wee
k 2
0
Wee
k 2
4
Wee
k 2
8
Wee
k 3
2
Wee
k 3
6
Wee
k 4
0
Wee
k 4
4
Wee
k 4
8
Wee
k 5
2
Wee
k 5
6
Wee
k 6
0
Wee
k 6
4
Wee
k 6
8
Wee
k 7
2
Wee
k 7
6
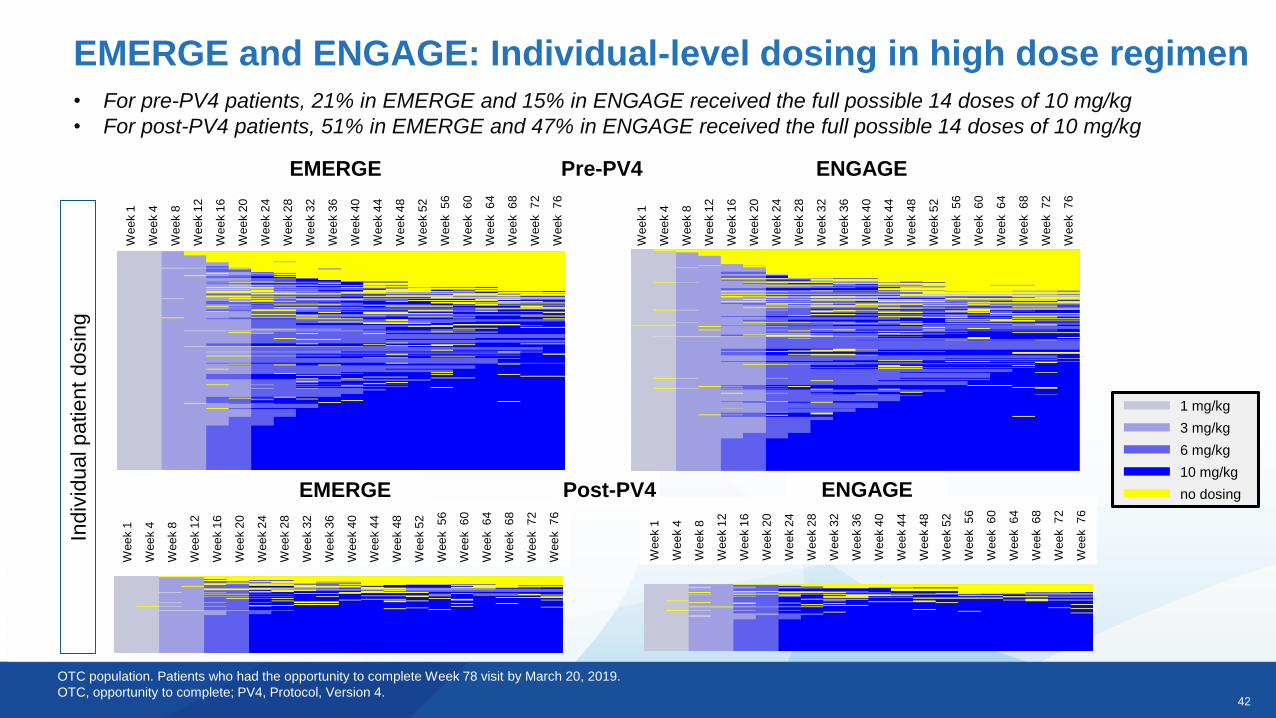
EMERGE and ENGAGE: Individual-level dosing in high dose regimen
1 mg/kg
3 mg/kg
6 mg/kg
10 mg/kg
no dosing
OTC population. Patients who had the opportunity to complete Week 78 visit by March 20, 2019.
OTC, opportunity to complete; PV4, Protocol, Version 4.
Indiv
idual patient dosin
g
Pre-PV4
Wee
k 1
Wee
k 4
Wee
k 8
Wee
k 1
2
Wee
k 1
6
Wee
k 2
0
Wee
k 2
4
Wee
k 2
8
Wee
k 3
2
Wee
k 3
6
Wee
k 4
0
Wee
k 4
4
Wee
k 4
8
Wee
k 5
2
Wee
k 5
6
Wee
k 6
0
Wee
k 6
4
Wee
k 6
8
Wee
k 7
2
Wee
k 7
6
ENGAGEEMERGE
• For pre-PV4 patients, 21% in EMERGE and 15% in ENGAGE received the full possible 14 doses of 10 mg/kg
• For post-PV4 patients, 51% in EMERGE and 47% in ENGAGE received the full possible 14 doses of 10 mg/kgW
ee
k 1
Wee
k 4
Wee
k 8
Wee
k 1
2
Wee
k 1
6
Wee
k 2
0
Wee
k 2
4
Wee
k 2
8
Wee
k 3
2
Wee
k 3
6
Wee
k 4
0
Wee
k 4
4
Wee
k 4
8
Wee
k 5
2
Wee
k 5
6
Wee
k 6
0
Wee
k 6
4
Wee
k 6
8
Wee
k 7
2
Wee
k 7
6
Wee
k 1
Wee
k 4
Wee
k 8
Wee
k 1
2
Wee
k 1
6
Wee
k 2
0
Wee
k 2
4
Wee
k 2
8
Wee
k 3
2
Wee
k 3
6
Wee
k 4
0
Wee
k 4
4
Wee
k 4
8
Wee
k 5
2
Wee
k 5
6
Wee
k 6
0
Wee
k 6
4
Wee
k 6
8
Wee
k 7
2
Wee
k 7
6
EMERGE ENGAGE
43
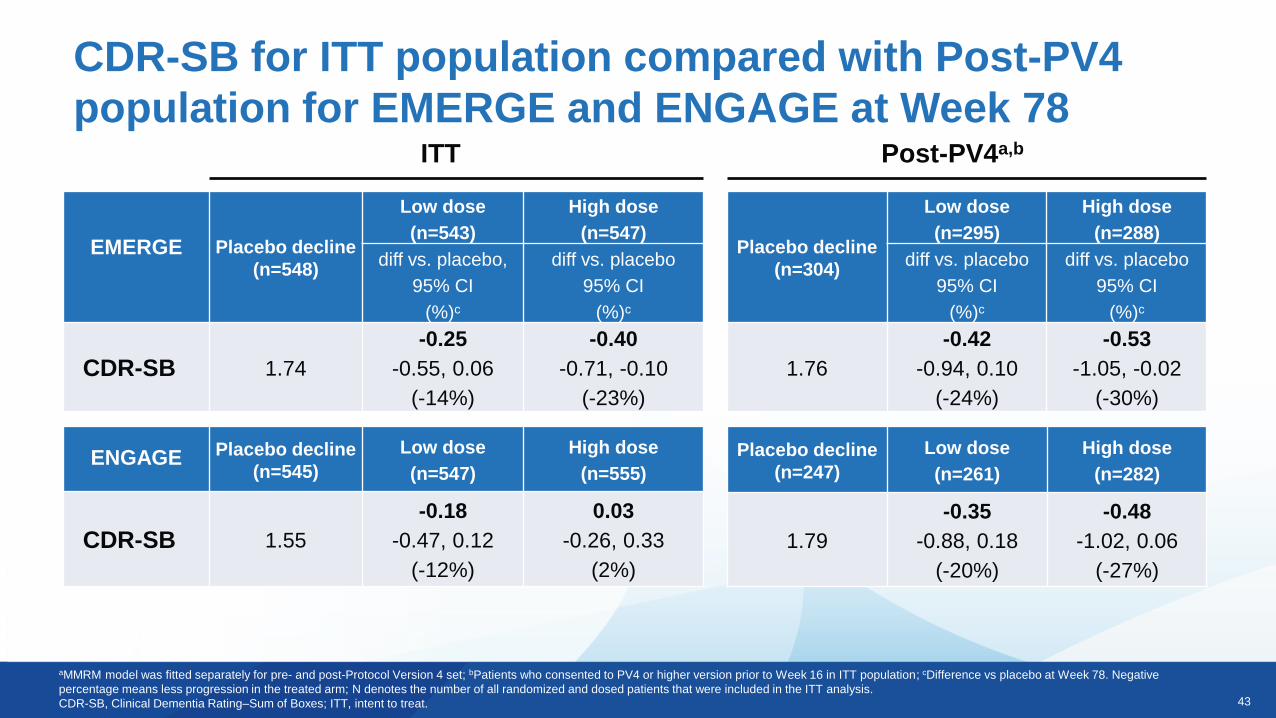
CDR-SB for ITT population compared with Post-PV4
population for EMERGE and ENGAGE at Week 78
aMMRM model was fitted separately for pre- and post-Protocol Version 4 set; bPatients who consented to PV4 or higher version prior to Week 16 in ITT population; cDifference vs placebo at Week 78. Negative
percentage means less progression in the treated arm; N denotes the number of all randomized and dosed patients that were included in the ITT analysis.
CDR-SB, Clinical Dementia Rating–Sum of Boxes; ITT, intent to treat.
ITT
EMERGE Placebo decline
(n=548)
Low dose
(n=543)
High dose
(n=547)
diff vs. placebo,
95% CI
(%)c
diff vs. placebo
95% CI
(%)c
CDR-SB 1.74
-0.25
-0.55, 0.06
(-14%)
-0.40
-0.71, -0.10
(-23%)
Post-PV4a,b
ENGAGE Placebo decline
(n=545)
Low dose
(n=547)
High dose
(n=555)
CDR-SB 1.55
-0.18
-0.47, 0.12
(-12%)
0.03
-0.26, 0.33
(2%)
Placebo decline
(n=304)
Low dose
(n=295)
High dose
(n=288)
diff vs. placebo
95% CI
(%)c
diff vs. placebo
95% CI
(%)c
1.76
-0.42
-0.94, 0.10
(-24%)
-0.53
-1.05, -0.02
(-30%)
Placebo decline
(n=247)
Low dose
(n=261)
High dose
(n=282)
1.79
-0.35
-0.88, 0.18
(-20%)
-0.48
-1.02, 0.06
(-27%)
44
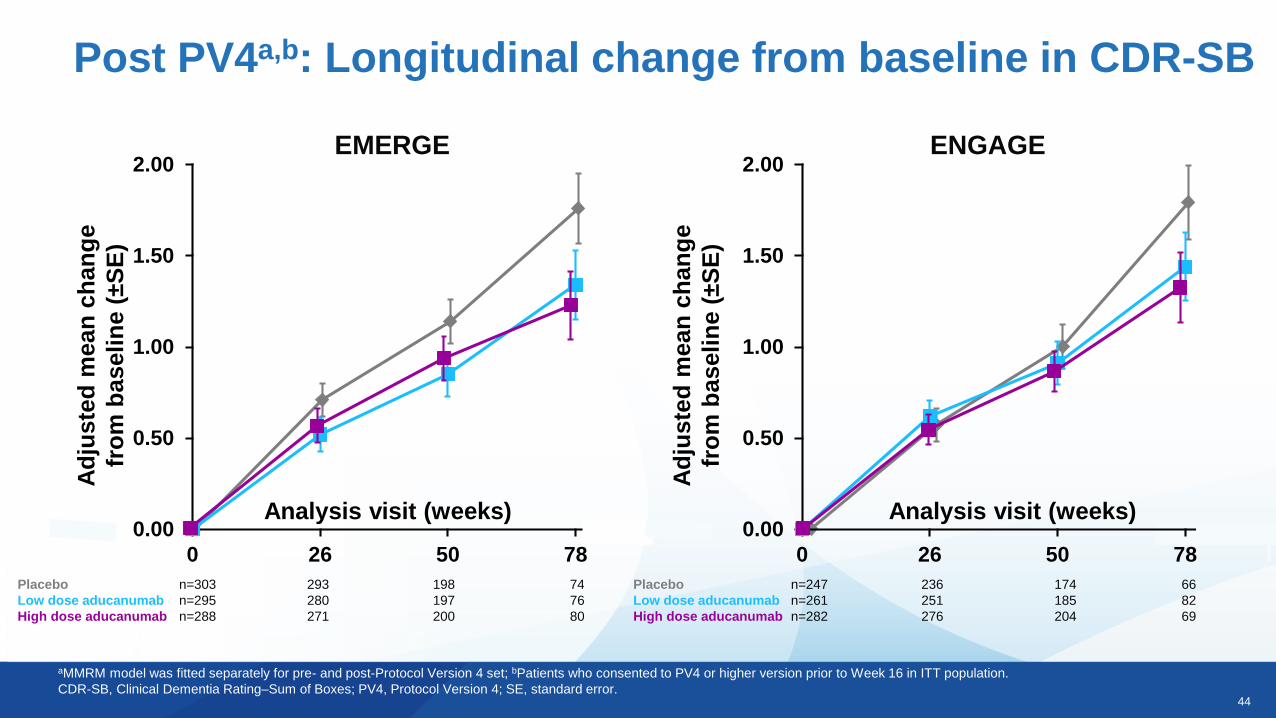
Post PV4a,b: Longitudinal change from baseline in CDR-SB
aMMRM model was fitted separately for pre- and post-Protocol Version 4 set; bPatients who consented to PV4 or higher version prior to Week 16 in ITT population.
CDR-SB, Clinical Dementia Rating–Sum of Boxes; PV4, Protocol Version 4; SE, standard error.
EMERGE
Ad
juste
d m
ean
ch
an
ge
fro
m b
as
eli
ne (
±S
E)
Analysis visit (weeks)
Placebo n=303 293 198 74
Low dose aducanumab n=295 280 197 76
High dose aducanumab n=288 271 200 80
0.00
0.50
1.00
1.50
2.00
0 26 50 78
ENGAGE
Ad
juste
d m
ean
ch
an
ge
fro
m b
as
eli
ne (
±S
E)
Analysis visit (weeks)0.00
0.50
1.00
1.50
2.00
0 26 50 78
Placebo n=247 236 174 66
Low dose aducanumab n=261 251 185 82
High dose aducanumab n=282 276 204 69
45
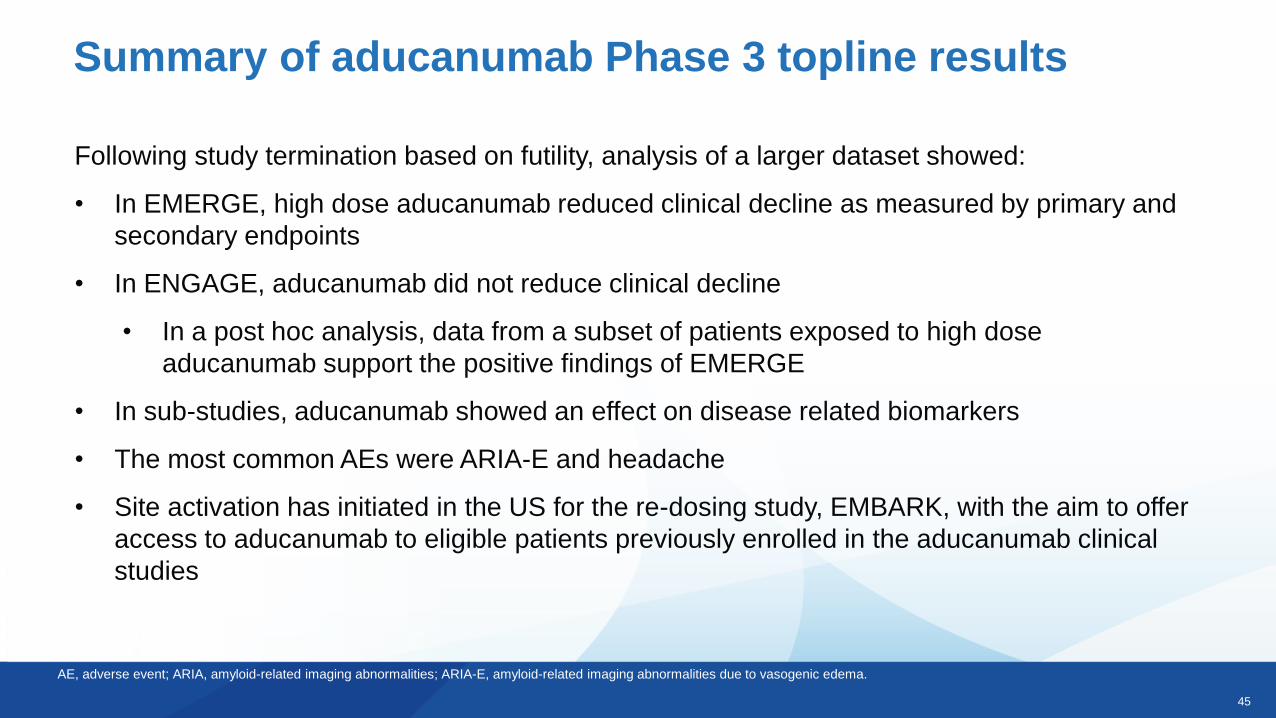
Following study termination based on futility, analysis of a larger dataset showed:
• In EMERGE, high dose aducanumab reduced clinical decline as measured by primary and
secondary endpoints
• In ENGAGE, aducanumab did not reduce clinical decline
• In a post hoc analysis, data from a subset of patients exposed to high dose
aducanumab support the positive findings of EMERGE
• In sub-studies, aducanumab showed an effect on disease related biomarkers
• The most common AEs were ARIA-E and headache
• Site activation has initiated in the US for the re-dosing study, EMBARK, with the aim to offer
access to aducanumab to eligible patients previously enrolled in the aducanumab clinical
studies
Summary of aducanumab Phase 3 topline results
AE, adverse event; ARIA, amyloid-related imaging abnormalities; ARIA-E, amyloid-related imaging abnormalities due to vasogenic edema.
46
Acknowledgments
• We thank all patients and family members who participated in the aducanumab studies and the investigators
and staff who conducted these studies, DSMB, and steering committee members
• We also thank those who contributed to this work, including Kimberly Umans, Stacy Lindborg, John
O’Gorman, Xiaopeng Miao, Charlie Cao, Carmen Castrillo-Viguera, Ping He, Carol Yurgalevitch, Ivana
Rubino, and Eric Ponton
Jan Grimm
Marcel Maier
Christoph Hock
Roger Nitsch