Embed Size (px)
Citation preview
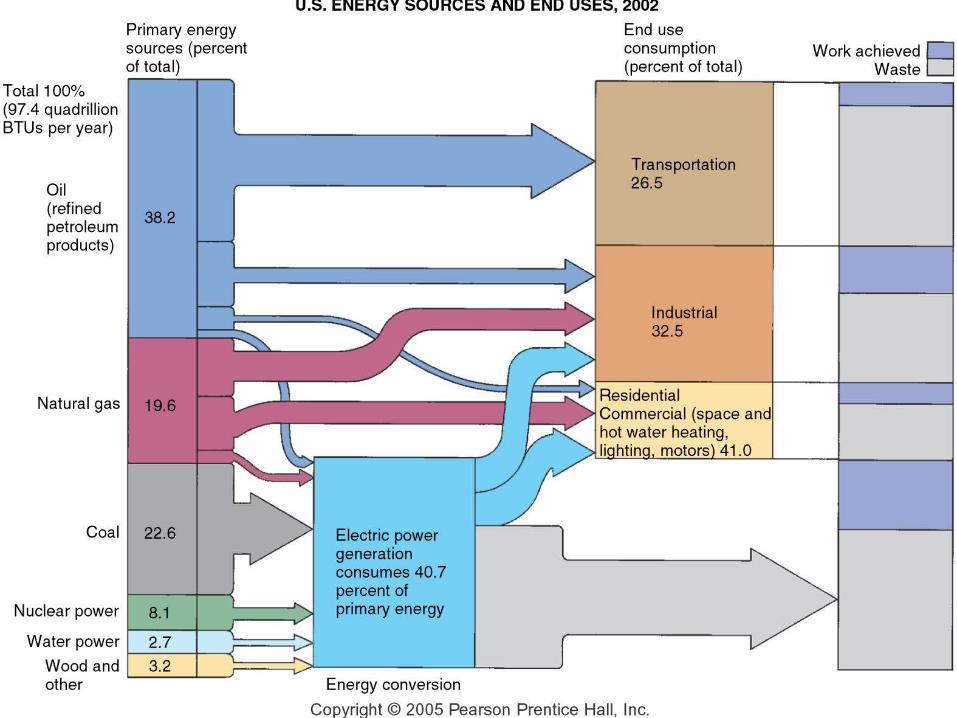
Energy Consumption in the United States
• Sequence of use1. Wood2. Water (steam)3. Coal4. Natural gas5. Oil6. Nuclear power
3, 4, and 5 = 83.5% of U.S. energy consumption
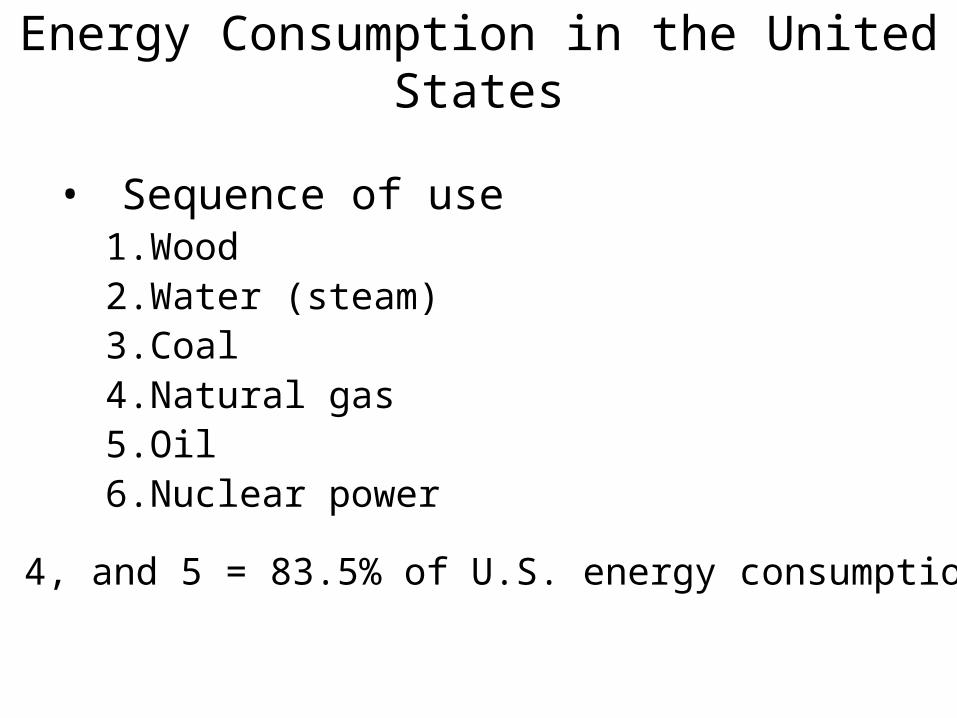
Global Primary Energy Supply
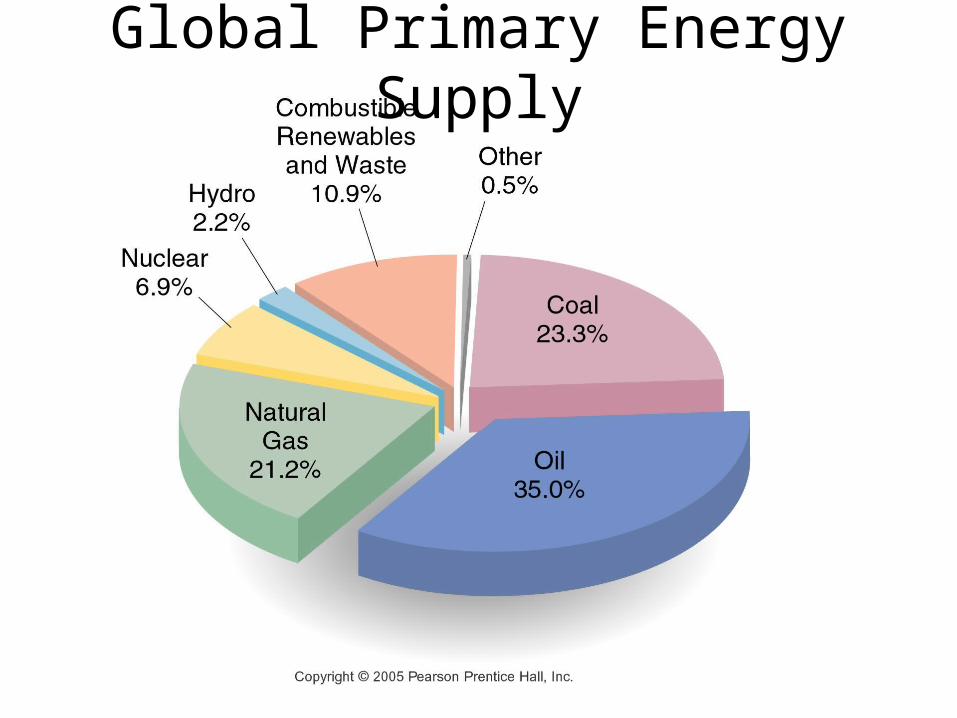
Energy Consumption in the United
States
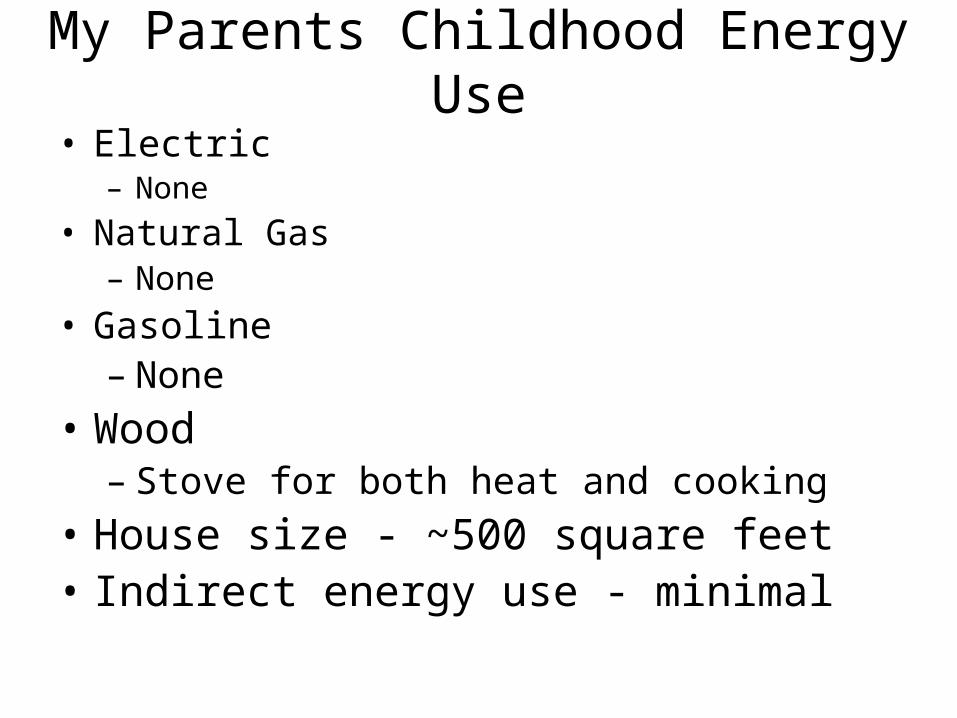
My Parents Childhood Energy Use• Electric
– None
• Natural Gas– None
• Gasoline– None
• Wood– Stove for both heat and cooking
• House size - ~500 square feet• Indirect energy use - minimal
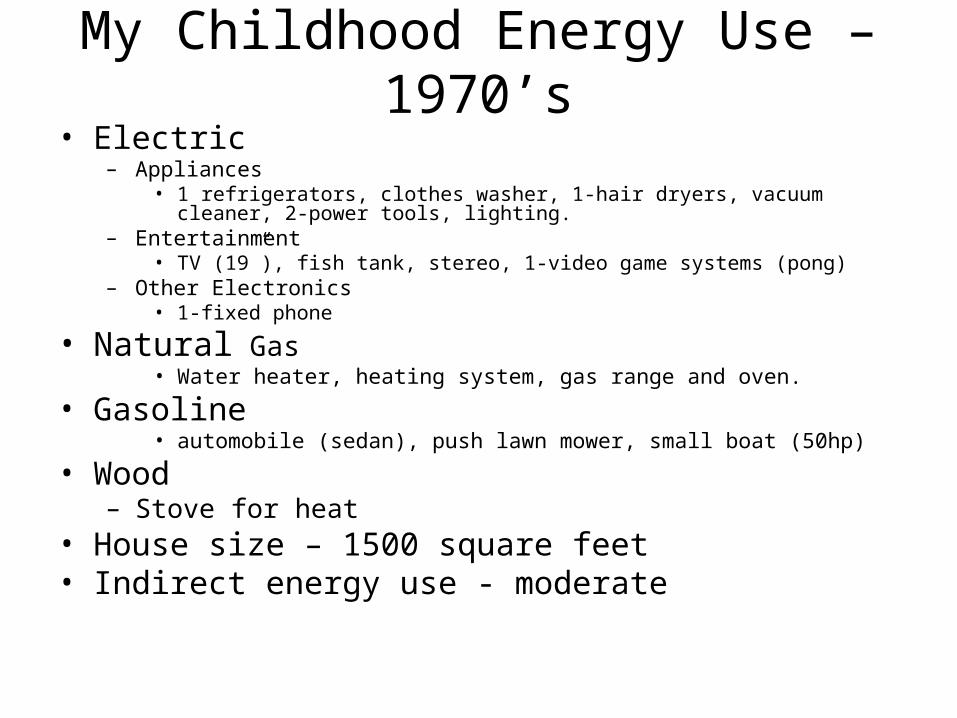
My Childhood Energy Use – 1970’s• Electric
– Appliances• 1 refrigerators, clothes washer, 1-hair dryers, vacuum cleaner, 2-power tools,
lighting.– Entertainment
• TV (19”), fish tank, stereo, 1-video game systems (pong)– Other Electronics
• 1-fixed phone
• Natural Gas• Water heater, heating system, gas range and oven.
• Gasoline• automobile (sedan), push lawn mower, small boat (50hp)
• Wood– Stove for heat
• House size – 1500 square feet• Indirect energy use - moderate
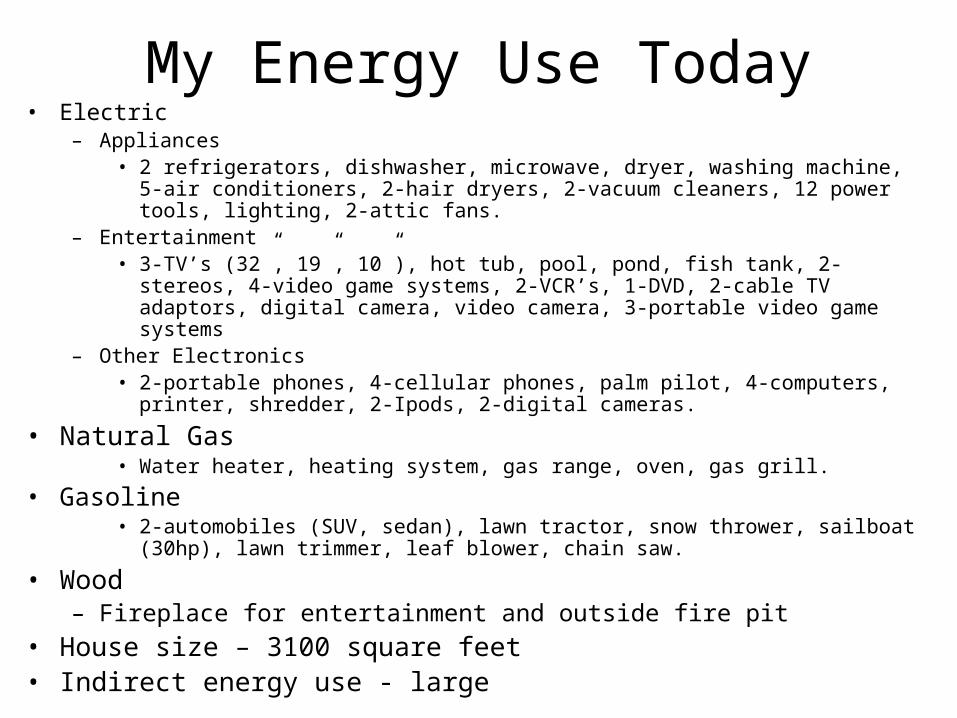
My Energy Use Today• Electric
– Appliances• 2 refrigerators, dishwasher, microwave, dryer, washing machine, 5-air conditioners,
2-hair dryers, 2-vacuum cleaners, 12 power tools, lighting, 2-attic fans.– Entertainment
• 3-TV’s (32”, 19”, 10”), hot tub, pool, pond, fish tank, 2-stereos, 4-video game systems, 2-VCR’s, 1-DVD, 2-cable TV adaptors, digital camera, video camera, 3-portable video game systems
– Other Electronics• 2-portable phones, 4-cellular phones, palm pilot, 4-computers, printer, shredder, 2-
Ipods, 2-digital cameras.
• Natural Gas• Water heater, heating system, gas range, oven, gas grill.
• Gasoline• 2-automobiles (SUV, sedan), lawn tractor, snow thrower, sailboat (30hp), lawn
trimmer, leaf blower, chain saw.
• Wood– Fireplace for entertainment and outside fire pit
• House size – 3100 square feet• Indirect energy use - large
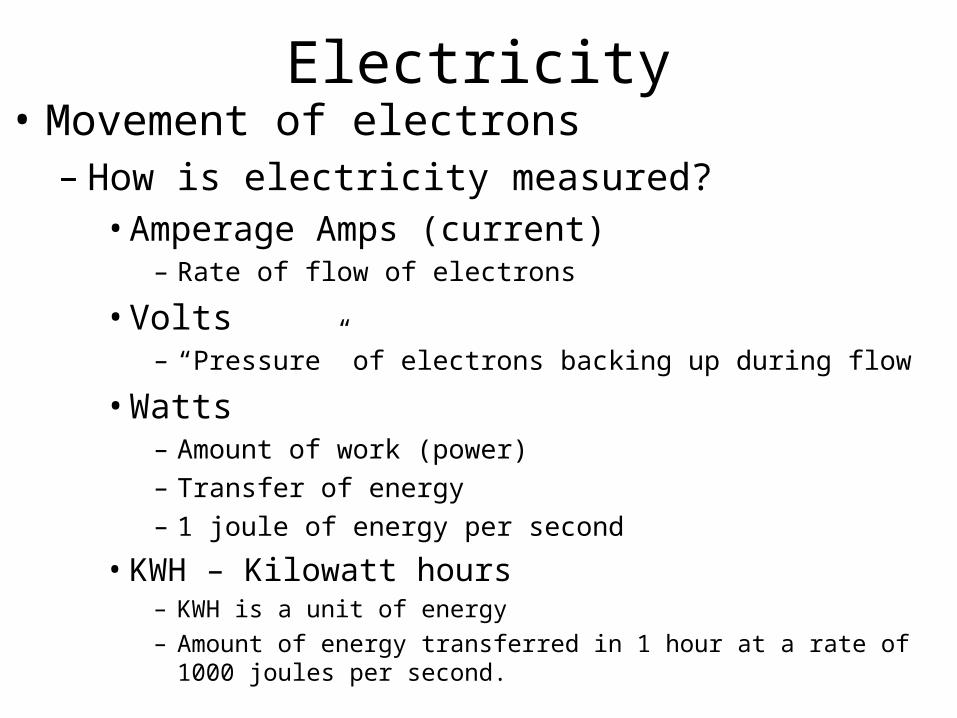
Electricity• Movement of electrons
– How is electricity measured?• Amperage Amps (current)
– Rate of flow of electrons
• Volts– “Pressure” of electrons backing up during flow
• Watts– Amount of work (power)– Transfer of energy– 1 joule of energy per second
• KWH – Kilowatt hours– KWH is a unit of energy
– Amount of energy transferred in 1 hour at a rate of 1000 joules per second.
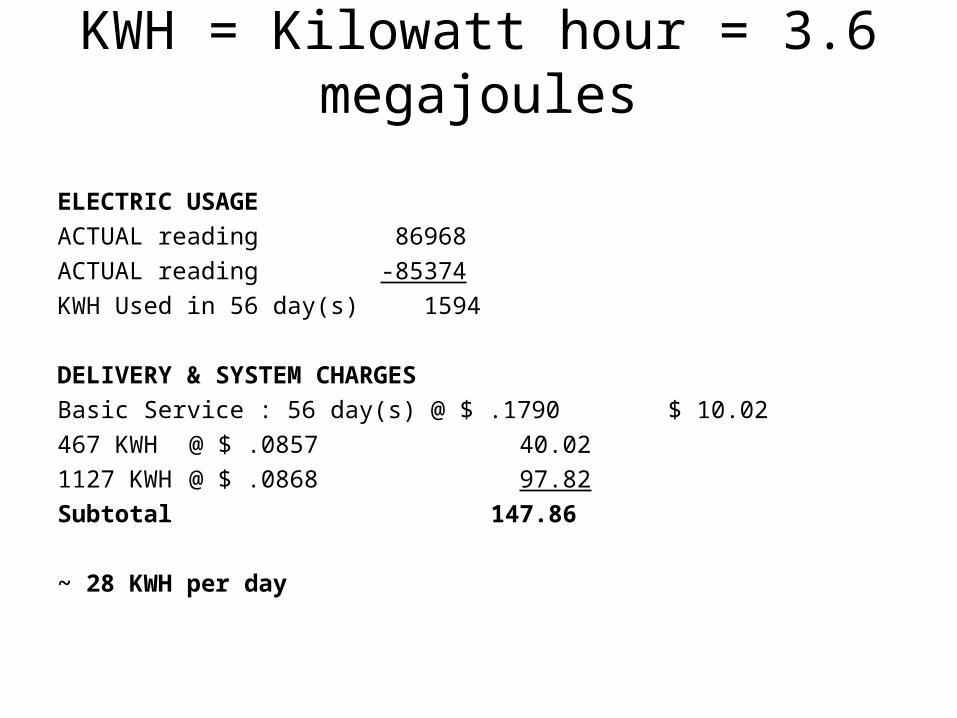
KWH = Kilowatt hour = 3.6 megajoules
ELECTRIC USAGE
ACTUAL reading 86968
ACTUAL reading -85374
KWH Used in 56 day(s) 1594
DELIVERY & SYSTEM CHARGES
Basic Service : 56 day(s) @ $ .1790 $ 10.02
467 KWH @ $ .0857 40.02
1127 KWH @ $ .0868 97.82
Subtotal 147.86
~ 28 KWH per day
Types of electric current
• DC – direct current– Electrons move in one direction– Example – battery
• AC – alternating current– Electrons reverse current ~60 times per
second– Example – household current
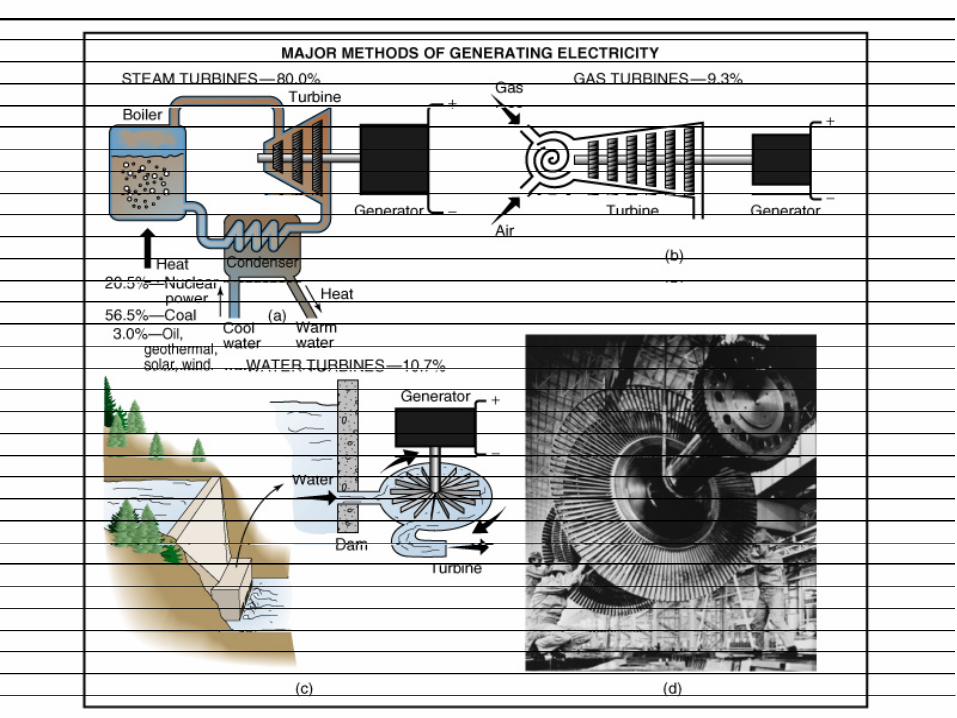
Generating Electricity
• Moving magnetic field causes electrons to flow through a wire
• Generator– Coil of wire spinning inside a magnetic field
generates electricity• Alternate source of energy required to turn coil of
wire– Hydroelectric turbine– Oil, gas or coal powered turbine– Wind driven propeller (windmill)
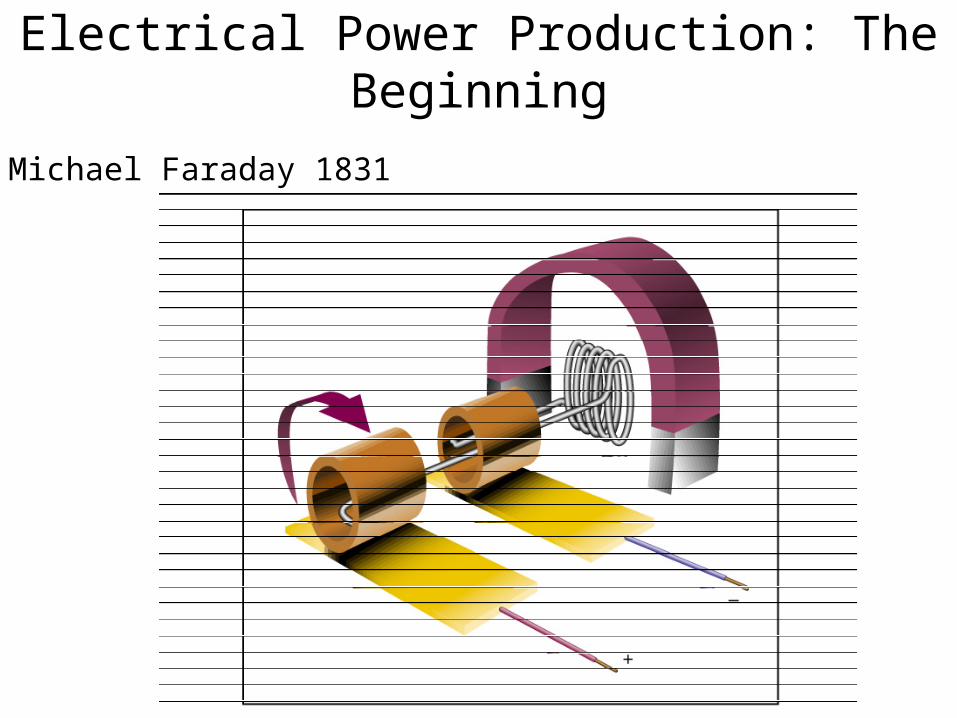
Electrical Power Production: The Beginning
Michael Faraday 1831
Why Fossil Fuels?
• High energy
• Available
• Portable
• Historical
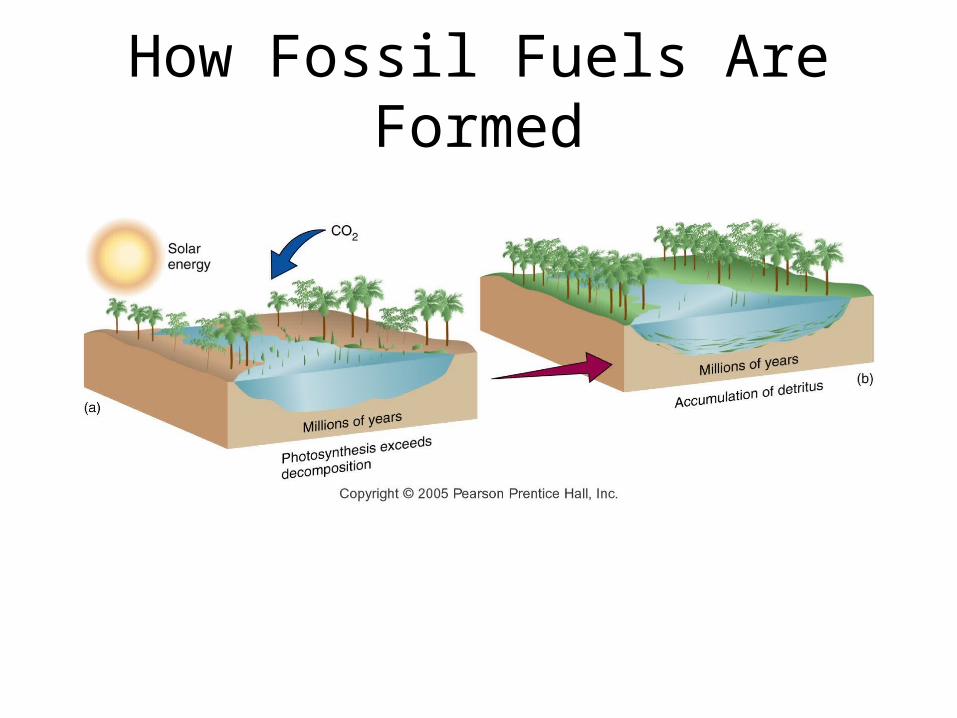
How Fossil Fuels Are Formed
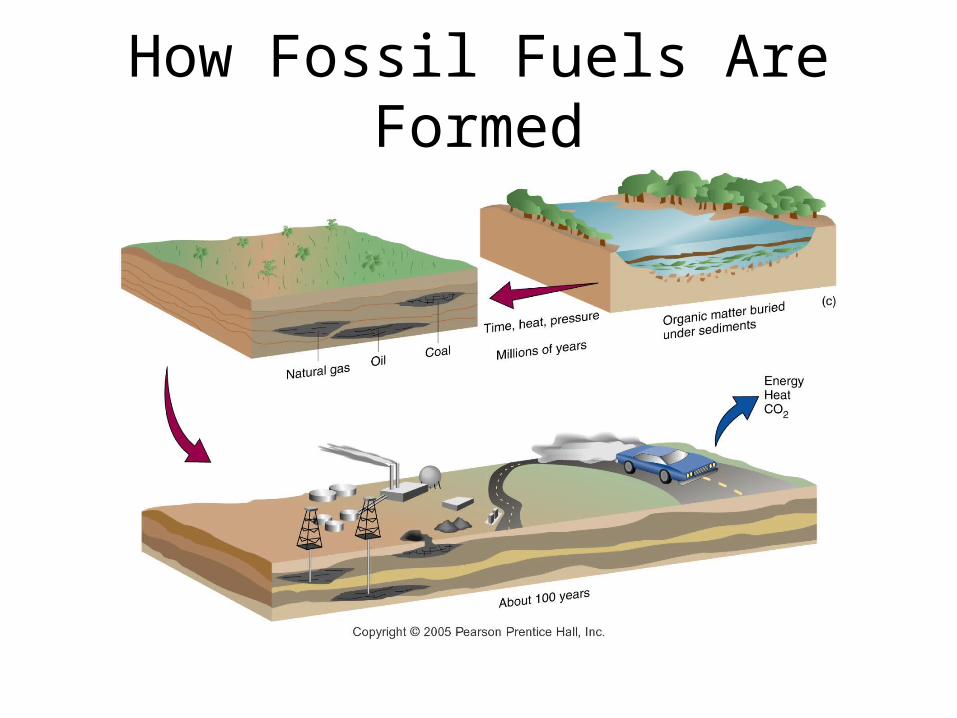
How Fossil Fuels Are Formed
Crude-Oil Reserves versus Production
• Estimated reserves: educated guesses about the location and size of oil or natural gas deposits
• Proven reserves: how much oil can be economically obtained from the oil field
• Production: withdrawal of oil or gas from the oil field
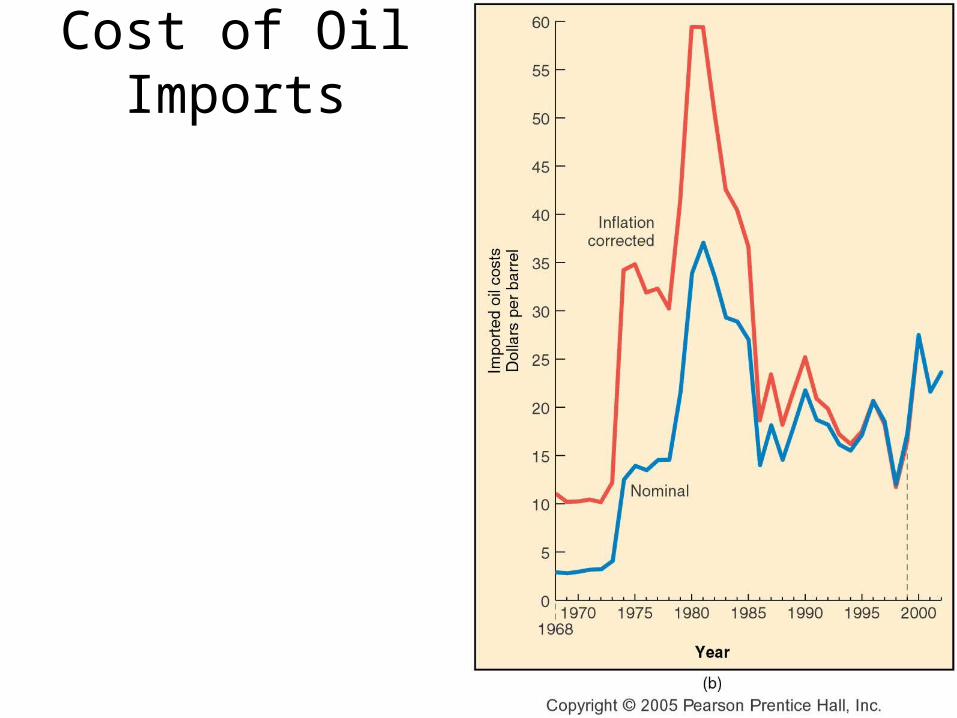
Cost of Oil Imports
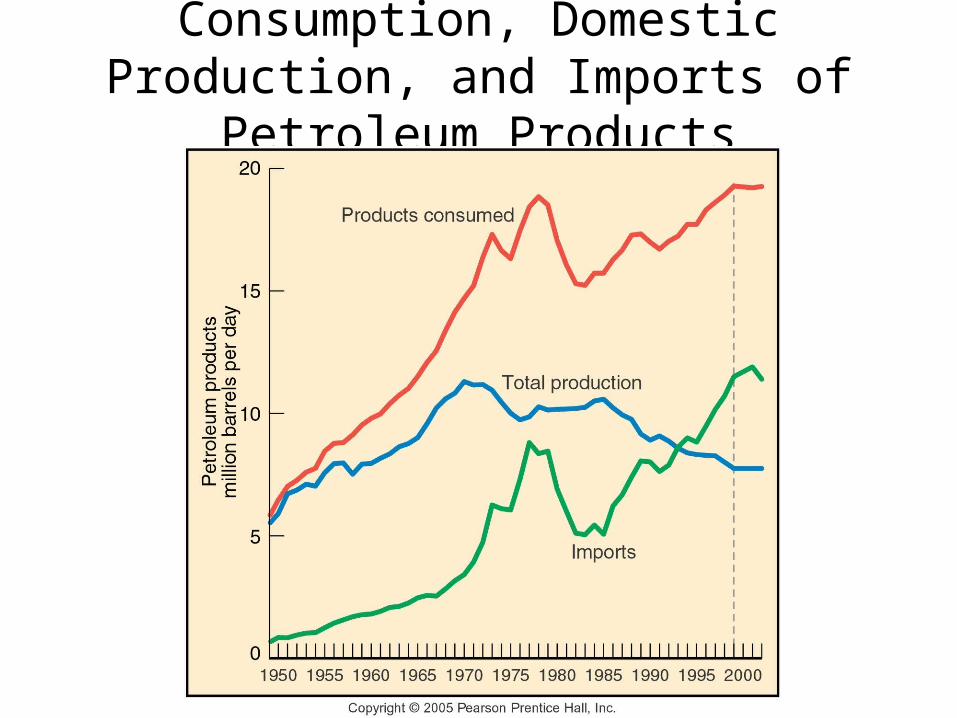
Consumption, Domestic Production, and Imports of Petroleum Products
Impacts of Foreign Oil Dependence
• Trade imbalances
• Military actions
• Pollution of oceans
• Coastal oil spills
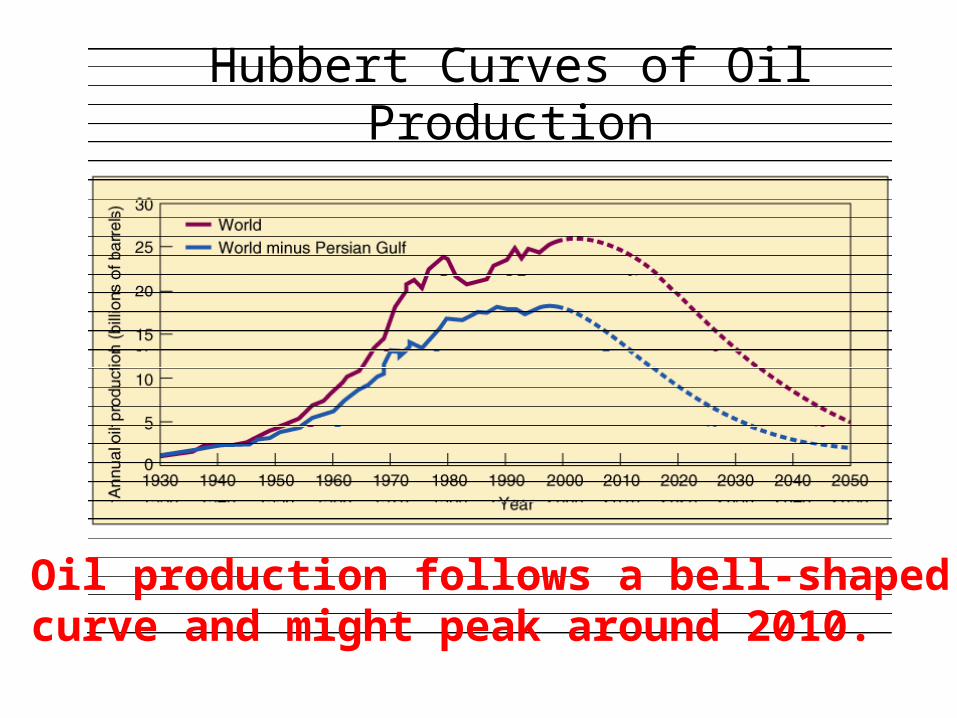
Hubbert Curves of Oil Production
Oil production follows a bell-shaped curve and might peak around 2010.
Hubbert Predictions
• U.S. oil production would peak (1970s)
• Dependence on OPEC oil will increase
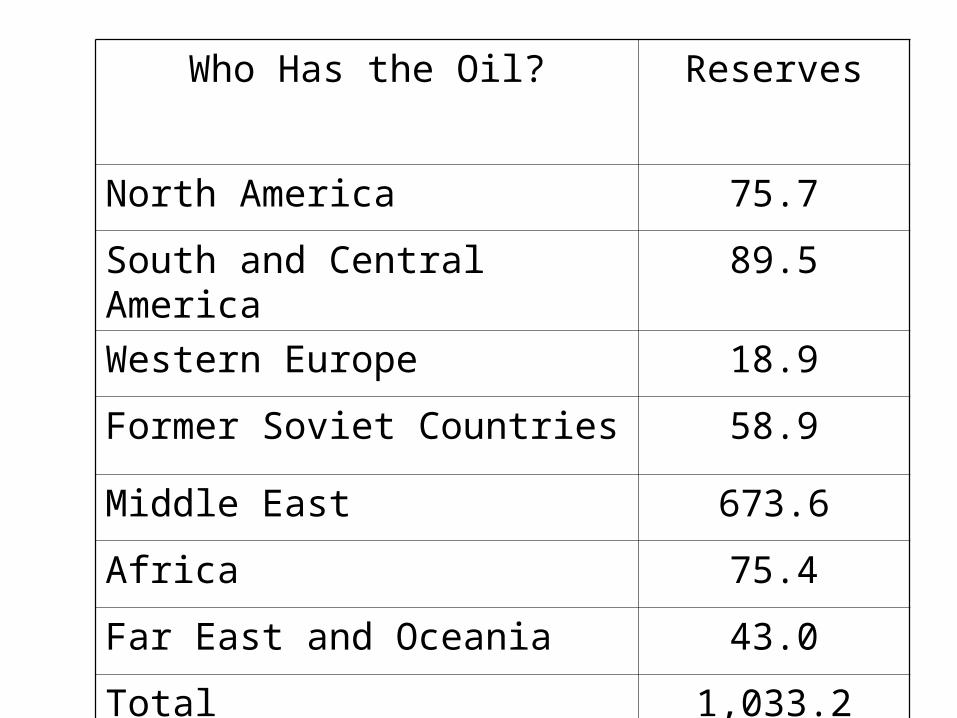
Who Has the Oil? Reserves
North America 75.7
South and Central America 89.5
Western Europe 18.9
Former Soviet Countries 58.9
Middle East 673.6
Africa 75.4
Far East and Oceania 43.0
Total 1,033.2
Organization of Petroleum Exporting Countries: OPEC
• Algeria• Indonesia• Iran• Iraq• Kuwait• Libya
• Nigeria• Qatar• Saudi Arabia• United Emirates• Venezuela
Other Fossil Fuels
• Natural gas – 50-year supply
• Coal – 400-year supply
• Oil shales and oil sands – complex extraction technologies


![[English] Samsung...SN, N, ST, T Annual energy consumption [ kWh/annum ], based on standard test results for 24 hours. Actual energy consumption will depend on how the appliance is](https://img.pdfslide.tips/doc/110x75/5f31a5428546c32bd2413442/english-samsung-sn-n-st-t-annual-energy-consumption-kwhannum-based.jpg)