Embed Size (px)
Citation preview
Manifestation of GIS Tools for Spatial Pattern Distribution Analysis of Dengue Fever Epidemic in the City of Subang Jaya, Malaysia
Nazri Che Dom a, b, Zulkiflee Abd Latif c, Abu Hassan Ahmad a, Rodziah Ismail b, Biswajeet Pradhan d
a School of Biological Sciences, Universiti Sains Malaysia, Pulau Pinang, Malaysiab Faculty of Health Sciences, Universiti Teknologi MARA, Selangor, Malaysia.
c Centre of Studies Surveying Science & Geomatics, Faculty of Architecture, Planning and Surveying,Universiti Teknologi MARA, Selangor, Malaysia.
d Faculty of Engineering, Department of Civil Engineering, University Putra Malaysia, 43400, UPM, Serdang, Selangor, Malaysia.
Abstract
Dengue has now emerged as one of the major public health problems in Malaysia. It was first reported in 1901 in Penang and since then the disease has become endemic concentrating mostly in urban areas. This study used the temporal-spatial model to determine high risk areas for dengue outbreak by measuring three temporal risk characteristics (i.e. frequency, duration and intensity) in order to define the severity and magnitude of outbreak transmission. This study examined a total of 4,651 confirmed dengue fever cases, geo-coded by address in the city of Subang Jaya between January 2006 and December 2009. The values of the three indices were considered high in a spatial unit when their standard values were positive. Measurement of the three temporal risk indices found that there were areas with significant high value for each of the temporal indices. This suggested that areas within Subang Jaya Municipality had different temporal characteristics for dengue occurrence. The utilization of three risk measures enabled to identify higher-risk areas for the occurrence of dengue fever. Even though case notification data are subjected to bias, this information is available in the health services and can lead to important conclusions, recommendations and hypotheses. As a recommendation, the temporal risk indices can be utilized by public health officials to characterize dengue rather than relying on the traditional case incidence data.
Keywords: spatial pattern distribution; dengue fever; Subang Jaya, Malaysia
1. Introduction
Dengue Fever (DF) is a complex health problem to manage due to a combination of factors varying from biophysical to social and economic. No single solution had been identified that could effectively reduce or eliminate the impact of dengue disease (Skae, 1902; Rudnick, 1965; Sharma et al., 2008). Hence it is important to identify the factors which really contribute to the transmission of dengue cases in different areas and then correlate these factors to identify high risk areas which could be used to plan cost effective control activities and also to predict future outbreaks (Barbazan, 2001; Kanchana et al., 2005; Chiravalloti, 2008). In addition, it is also important to understand the spreading mechanism of DF in the district during the epidemic period as this might be the primary factor that is essential for planning the application of preventive and control measures (Openshaw, 1996; Ratana, 1997). In Malaysia, the endemic level of DF has already changed morbidity indicators, and the magnitude of
these incidences in the last few years has surpassed the incidences of all other diseases of compulsory notification. The reasons for the dramatic emergence of DF are complex and not well understood, but many factors combine to produce epidemiological conditions that favor viral transmission by the main mosquito vector Ae. aegypti. Among them are population growth, inadequacies in urban infrastructure, including solid waste disposal, and rise in domestic and international travel. There is a general agreement that DF can attack anyone in areas which historically have experienced dengue virus outbreak. A high density of the vector or mosquito will increase the possibility of the dengue outbreak. It is well known that there are no vaccines available to protect people living in risk areas of the dengue epidemics and the best alternative is to avoid mosquito bites and to destroy the vector breeding sites. Therefore, it is important to understand the dynamic pattern of DF on a local scale that might influence the outbreak mechanism. According to Wen et al. (2006),
The international journal published by the Thai Society of Higher Education Institutes on Environment
EnvironmentAsia
Genotoxicity Assessment of Mercuric Chloride in the Marine Fish Therapon jaruba
Nagarajan Nagarani, Arumugam Kuppusamy Kumaraguru, Velmurugan Janaki Deviand Chandrasekaran Archana Devi
Center for Marine and Coastal Studies, School of Energy, Environment and Natural Resources,Madurai Kamaraj University, Madurai-625021, India
Abstract
The aim of the present study was to standardize and to assess the predictive value of the cytogenetic analysisby Micronucleus (MN) test in fish erythrocytes as a biomarker for marine environmental contamination. Micronucleusfrequency baseline in erythrocytes was evaluated in and genotoxic potential of a common chemical was determinedin fish experimentally exposed in aquarium under controlled conditions. Fish (Therapon jaruba) were exposed for 96hrs to a single heavy metal (mercuric chloride). Chromosomal damage was determined as micronuclei frequency infish erythrocytes. Significant increase in MN frequency was observed in erythrocytes of fish exposed to mercuricchloride. Concentration of 0.25 ppm induced the highest MN frequency (2.95 micronucleated cells/1000 cells comparedto 1 MNcell/1000 cells in control animals). The study revealed that micronucleus test, as an index of cumulativeexposure, appears to be a sensitive model to evaluate genotoxic compounds in fish under controlled conditions.
Keywords: genotoxicity; mercuric chloride; micronucleus
Available online at www.tshe.org/EAEnvironmentAsia 2 (2009) 50-54
1. Introduction
In India, about 200 tons of mercury and itscompounds are introduced into the environmentannually as effluents from industries (Saffi, 1981).Mercuric chloride has been used in agriculture as afungicide, in medicine as a topical antiseptic anddisinfectant, and in chemistry as an intermediate inthe production of other mercury compounds. Thecontamination of aquatic ecosystems by heavymetals and pesticides has gained increasing attentionin recent decades. Chronic exposure to andaccumulation of these chemicals in aquatic biotacan result in tissue burdens that produce adverseeffects not only in the directly exposed organisms,but also in human beings.
Fish provides a suitable model for monitoringaquatic genotoxicity and wastewater qualitybecause of its ability to metabolize xenobiotics andaccumulated pollutants. A micronucleus assay hasbeen used successfully in several species (De Flora,et al., 1993, Al-Sabti and Metcalfe, 1995). Themicronucleus (MN) test has been developedtogether with DNA-unwinding assays asperspective methods for mass monitoring ofclastogenicity and genotoxicity in fish and mussels(Dailianis et al., 2003).
The MN tests have been successfully used asa measure of genotoxic stress in fish, under both
laboratory and field conditions. In 2006 Soumendraet al., made an attempt to detect genetic biomarkersin two fish species, Labeo bata and Oreochromismossambica, by MN and binucleate (BN)erythrocytes in the gill and kidney erythrocytesexposed to thermal power plant discharge atTitagarh Thermal Power Plant, Kolkata, India.
The present study was conducted to determinethe acute genotoxicity of the heavy metal compoundHgCl2 in static systems. Mercuric chloride is toxic,solvable in water hence it can penetrate the aquaticanimals. Mutagenic studies with native fish speciesrepresent an important effort in determining thepotential effects of toxic agents. This study wascarried out to evaluate the use of the micronucleustest (MN) for the estimation of aquatic pollutionusing marine edible fish under lab conditions.
2. Materials and methods
2.1. Sample Collection
The fish species selected for the present studywas collected from Pudhumadam coast of Gulf ofMannar, Southeast Coast of India. Theraponjarbua belongs to the order Perciformes of thefamily Theraponidae. The fish species, Theraponjarbua (6-6.3 cm in length and 4-4.25 g in weight)was selected for the detection of genotoxic effect
Available online at www.tshe.org/EAEnvironmentAsia 5(2) (2012) 82-92
83
the clinical manifestation of dengue includes DF, DHF and the most severe and potentially fatal dengue shock syndrome (DSS). They have reported that more DF cases emerged from a dengue epidemic in endemic and hyper-endemic areas, which often correlated with more fatalities, especially with late medical care or when the cases are inappropriately managed (Wen et al., 2006; Wen et al., 2009). In recent years, the utilization of Geographic Information System (GIS) as a tool to manage diseases by public health organizations has become a necessity in line with the advancement of technology (Barbazan, 2001; Gong and Liang, 2006; Nitatpattana et al., 2007; Cringoli, 2008). With GIS, the precision of disease mapping in relation to the locality will be enhanced and therefore GIS is a valuable tool in the detection and monitoring of the response to disease outbreaks prior to mapping (Andrianasolo, 2001; Jirakajohnkool, 2006; Krishna, 2008; Wen et al., 2009). Wen et al. (2006) stated that the exclusive utilization of incidence rates to assess the occurrence of diseases provides limited results, and thus he explores the spatial distribution of dengue fever cases in Kaohsiung, a metropolitan in south Taiwan. GIS was employed to analyze the temporal and spatial model, such as frequency, duration and intensity of the dengue fever cases in each district. Based on those spatial analyses, the study concluded the districts with high risk may be the source of DF outbreak. Nazri et al. (2011) stated that Subang Jaya, Malaysia has been identified as having the highest number of reported cases occurred during the DF outbreak. The present study described the temporal-spatial model to assess high-risk areas for the occurrence of DF outbreak at Subang Jaya based on the model proposed by Wen et al (2006). From this criteria, the distribution and dynamics of dengue outbreak were analysed and the outcome from the result used as indicators of risk in a locality.
2. Materials and Methods
2.1. Study area
Subang Jaya is a suburban city in the Klang Valley, Selangor, Malaysia. It has a geographic area of 181 km2 and situated at latitude 3°05’48.74”North and longitude 101°33’02.39”East. Subang Jaya comprises the southern third of the district of Petaling, and a home to a third of the district population of 1.78 million.
2.2. Data collection
In this study, data on the annual cumulative
incidence of DF cases registered at the vector control Unit, Subang Jaya area (January 2004 to December 2008) were used as source of data. In Malaysia, the epidemiological surveillance system which includes data collected of DF was set up in 1971. Its cover every level of health administrative and service which provides monthly notification. The homogeneity of its protocol and clinical criteria (World Health Organisation) for DF among district and over decades allows a good level of data reliability and validity. The Subang Jaya area was selected as point of data collection because the data was summarized before it being sent to the Ministry of Health Malaysia (MOH) and the control strategies are defined and launched at this level. All the DF cases were confirmed by serological tests, virus isolation and detection of dengue ribonucleic acid at MOH labs.
2.3. Modeling approach
Traditional disease surveillance comprises a set of epidemiological procedures that monitor the spread of a disease and determine how it is spreading. These approach reports the number of cases for each location and time period. Wen et al. (2006) mentioned that the exclusive utilization of incidence rates to assess the occurrence of diseases provide limited results, and thus propose a spatio-temporal risk model to map geographic distribution of cases. In this study, all the confirmed DF cases with complete residential addresses were mapped using ArcGIS 9.1 (Barbazan, 2001; Cringoli, 2004) and further analyses on the risk patterns of the dengue epidemic in the epidemic period (2004-2008) were carried out. To identify potential risk areas and analyze different spatial patterns using appropriate temporal risk indices, the three above defined temporal indices were calculated for each spatial unit. The DF cases were summarized according to the spatial unit, on a weekly basis. Therefore, to identify potential risk areas and analyze different spatial patterns using temporal risk indices, the values of the three temporal risk indices were calculated for each locality and its descriptive statistics across the study areas. A risk model developed by Wen et al. (2006) was used to evaluate a dengue epidemic in both magnitude and severity of an outbreak in the study area. To pinpoint the difference in this distribution, the comparison among several categories was performed.
2.4. Calculation of the three temporal indices (Frequency, Duration and Intensity Index) as epidemiological measures.
To identify potential risk areas and analyze different
N. C. Dom et al. / EnvironmentAsia 5(2) (2012) 82-92
84
spatial patterns using temporal risk indices, the values of the three temporal risk indices were calculated for each locality and its descriptive statistics across the study areas. Each temporal index covered different size and numbers of spatial unit. From the temporal distribution of epidemics, several characteristic of DF epidemic may be described. Data from monthly reports on DF incidence during the 5 years of the study period (2004-2008), were calculated to three temporal risk indices for each spatial unit and seasonal year which was adopted from Wen et al. (2006) in order to assess the risk transmission severity and magnitude of the outbreak. Frequency index (α), defined as the probability that the total number of weeks with one or more dengue cases occurred during the entire epidemic period. It can be expressed as:
α = SE / ST (1)
where ST is the total number of weeks during the period in question, and SE is the total number of weeks with one or more cases occurring during the period in question. It represents the proportion of weeks with one or more cases or the probability that one or more cases occur in a given week, in the period studied (one year or 52 weeks). Duration index (β), define as the mean number of week per epidemic wave when cases successively occur. It can be expressed as:
β = SE / OE (2)
where SE is described above and OE is the total number of epidemic waves during the period in question. One epidemic wave, according to Wen et al. (2006), is defined as a sequence of weeks with the
occurrence of uninterrupted cases. This index gives an idea of the persistence of transmission and represents the average duration, in weeks, of epidemic waves that occurred in the given period. Intensity index (γ), characterized as the mean incidence of cumulative dengue cases occurring in consecutive weeks per epidemic wave that had persisted for more than two week. It can be expressed as:
γ = TI / OE (3)
where TI is the incidence rate during the given period and OE is described above. It assesses the severity of transmission, and is based on sequences of weeks with the occurrence of uninterrupted cases. High values mean time-concentrated transmission.
2.5. Identification of risk profile based on the combination of three temporal Indices
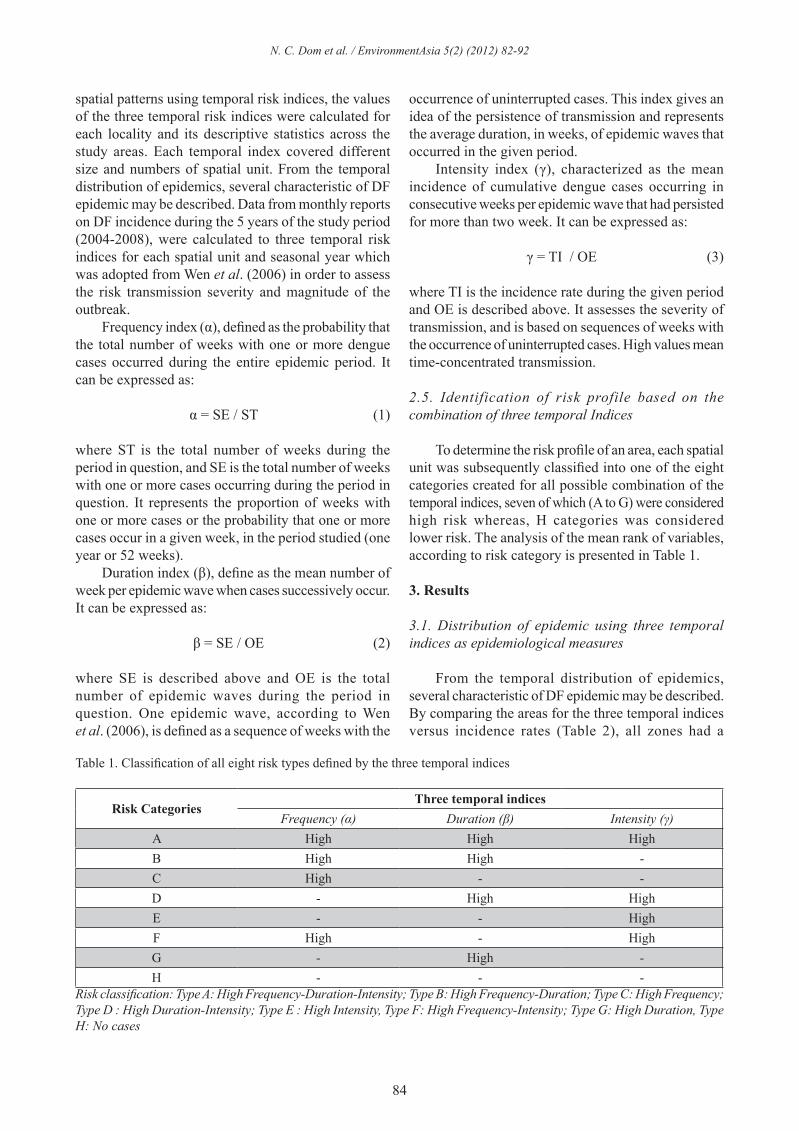
To determine the risk profile of an area, each spatial unit was subsequently classified into one of the eight categories created for all possible combination of the temporal indices, seven of which (A to G) were considered high risk whereas, H categories was considered lower risk. The analysis of the mean rank of variables, according to risk category is presented in Table 1.
3. Results
3.1. Distribution of epidemic using three temporal indices as epidemiological measures
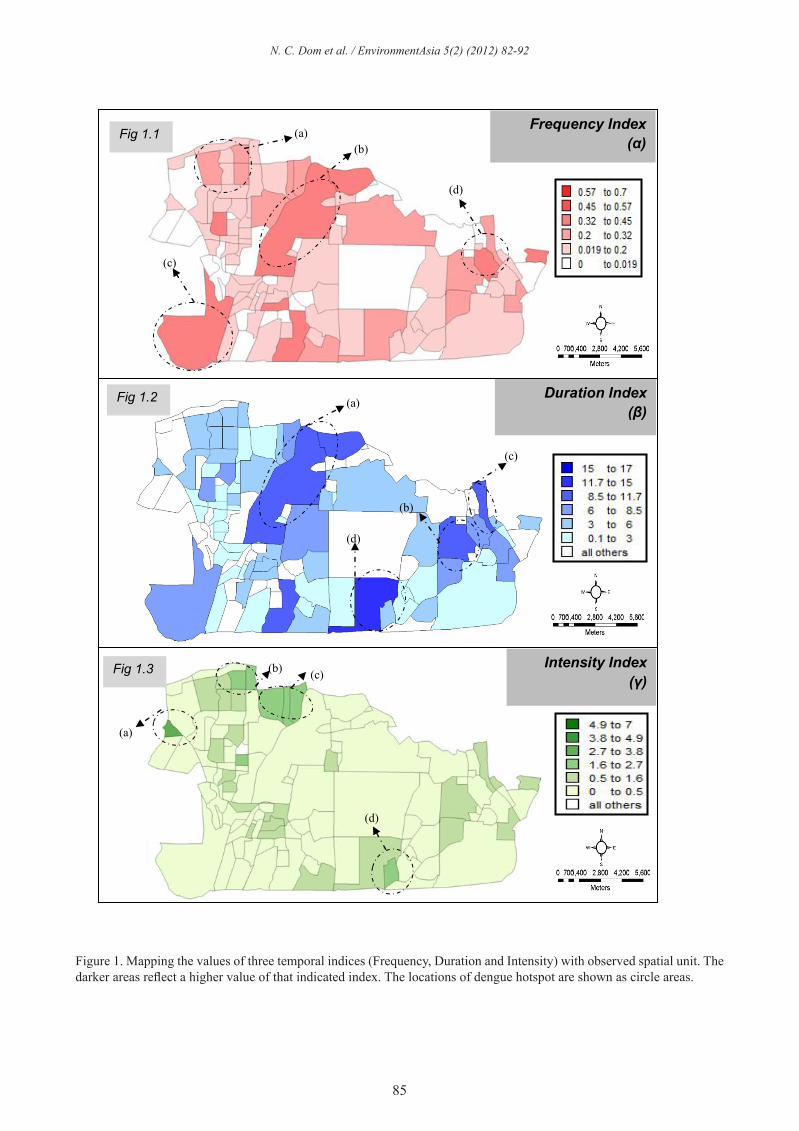
From the temporal distribution of epidemics, several characteristic of DF epidemic may be described. By comparing the areas for the three temporal indices versus incidence rates (Table 2), all zones had a
Table 1. Classification of all eight risk types defined by the three temporal indices
Risk CategoriesThree temporal indices
Frequency (α) Duration (β) Intensity (γ)A High High HighB High High -C High - -D - High HighE - - HighF High - HighG - High -H - - -
Risk classification: Type A: High Frequency-Duration-Intensity; Type B: High Frequency-Duration; Type C: High Frequency; Type D : High Duration-Intensity; Type E : High Intensity, Type F: High Frequency-Intensity; Type G: High Duration, Type H: No cases
N. C. Dom et al. / EnvironmentAsia 5(2) (2012) 82-92
85
Figure 1. Mapping the values of three temporal indices (Frequency, Duration and Intensity) with observed spatial unit. The darker areas reflect a higher value of that indicated index. The locations of dengue hotspot are shown as circle areas.
5
Figure 1. Mapping the values of three temporal indices (Frequency, Duration and Intensity) with observed spatial unit. The darker areas reflect a higher value of that indicated index. The locations of dengue hotspot are shown as circle areas.
Fig 1.3 Intensity Index (γ)
(a)
(b) (c)
(d)
Frequency Index (α)
(a) (b)
(c)
(d)
Fig 1.1
Fig 1.2 Duration Index (β)
(a)
(b)
(c)
(d)
N. C. Dom et al. / EnvironmentAsia 5(2) (2012) 82-92
86
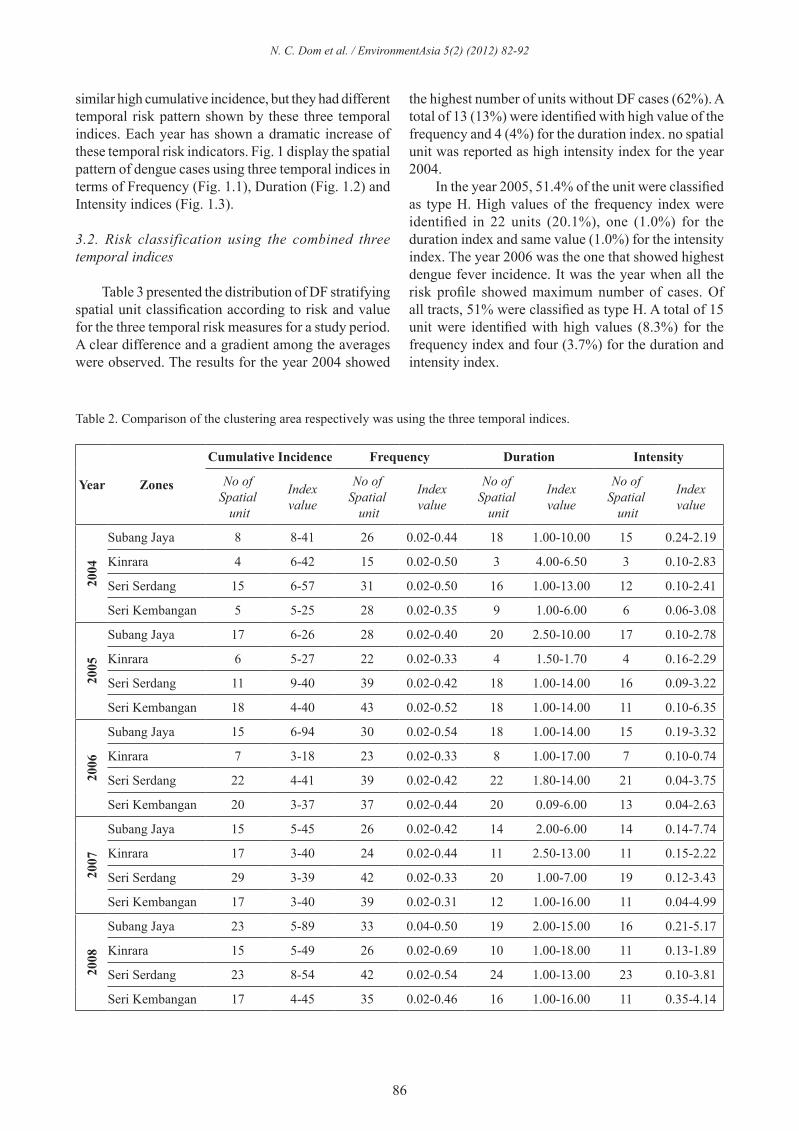
Table 2. Comparison of the clustering area respectively was using the three temporal indices.
Year Zones
Cumulative Incidence Frequency Duration Intensity
No of Spatial
unit
Indexvalue
No of Spatial
unit
Indexvalue
No of Spatial
unit
Indexvalue
No of Spatial
unit
Indexvalue
2004
Subang Jaya 8 8-41 26 0.02-0.44 18 1.00-10.00 15 0.24-2.19
Kinrara 4 6-42 15 0.02-0.50 3 4.00-6.50 3 0.10-2.83
Seri Serdang 15 6-57 31 0.02-0.50 16 1.00-13.00 12 0.10-2.41
Seri Kembangan 5 5-25 28 0.02-0.35 9 1.00-6.00 6 0.06-3.08
2005
Subang Jaya 17 6-26 28 0.02-0.40 20 2.50-10.00 17 0.10-2.78
Kinrara 6 5-27 22 0.02-0.33 4 1.50-1.70 4 0.16-2.29
Seri Serdang 11 9-40 39 0.02-0.42 18 1.00-14.00 16 0.09-3.22
Seri Kembangan 18 4-40 43 0.02-0.52 18 1.00-14.00 11 0.10-6.35
2006
Subang Jaya 15 6-94 30 0.02-0.54 18 1.00-14.00 15 0.19-3.32
Kinrara 7 3-18 23 0.02-0.33 8 1.00-17.00 7 0.10-0.74
Seri Serdang 22 4-41 39 0.02-0.42 22 1.80-14.00 21 0.04-3.75
Seri Kembangan 20 3-37 37 0.02-0.44 20 0.09-6.00 13 0.04-2.63
2007
Subang Jaya 15 5-45 26 0.02-0.42 14 2.00-6.00 14 0.14-7.74
Kinrara 17 3-40 24 0.02-0.44 11 2.50-13.00 11 0.15-2.22
Seri Serdang 29 3-39 42 0.02-0.33 20 1.00-7.00 19 0.12-3.43
Seri Kembangan 17 3-40 39 0.02-0.31 12 1.00-16.00 11 0.04-4.99
2008
Subang Jaya 23 5-89 33 0.04-0.50 19 2.00-15.00 16 0.21-5.17
Kinrara 15 5-49 26 0.02-0.69 10 1.00-18.00 11 0.13-1.89
Seri Serdang 23 8-54 42 0.02-0.54 24 1.00-13.00 23 0.10-3.81
Seri Kembangan 17 4-45 35 0.02-0.46 16 1.00-16.00 11 0.35-4.14
similar high cumulative incidence, but they had different temporal risk pattern shown by these three temporal indices. Each year has shown a dramatic increase of these temporal risk indicators. Fig. 1 display the spatial pattern of dengue cases using three temporal indices in terms of Frequency (Fig. 1.1), Duration (Fig. 1.2) and Intensity indices (Fig. 1.3).
3.2. Risk classification using the combined three temporal indices
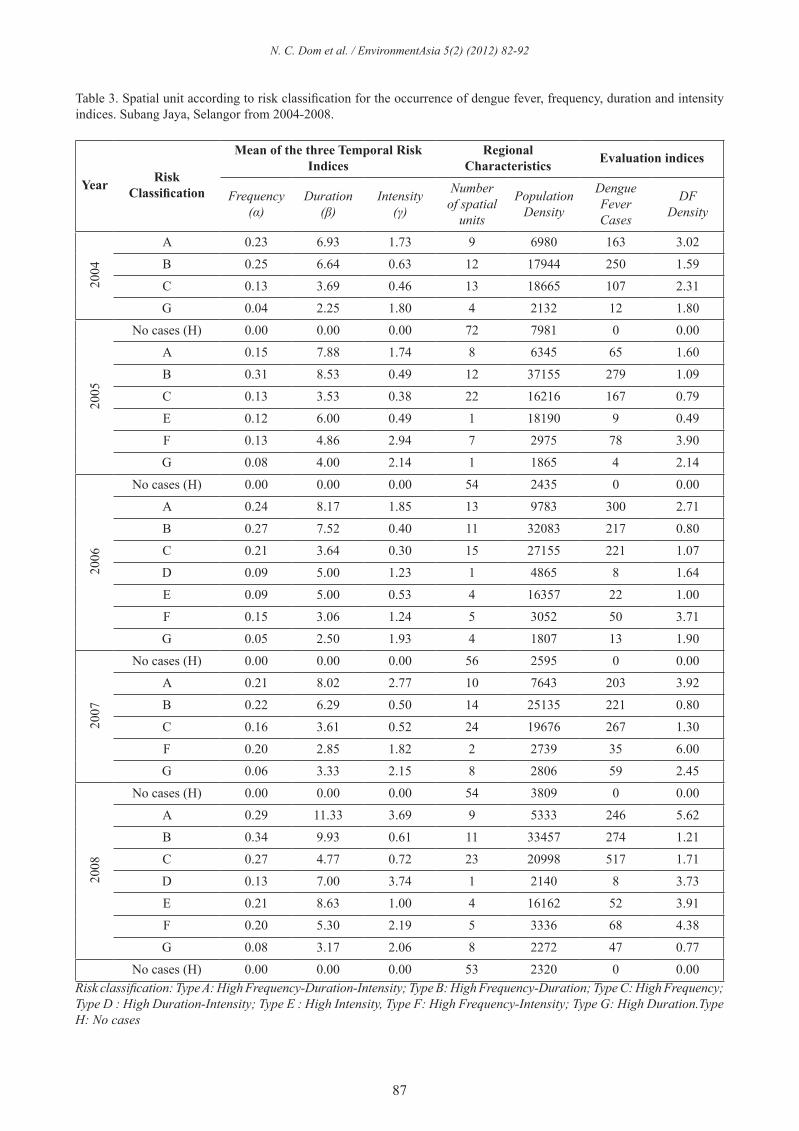
Table 3 presented the distribution of DF stratifying spatial unit classification according to risk and value for the three temporal risk measures for a study period. A clear difference and a gradient among the averages were observed. The results for the year 2004 showed
the highest number of units without DF cases (62%). A total of 13 (13%) were identified with high value of the frequency and 4 (4%) for the duration index. no spatial unit was reported as high intensity index for the year 2004. In the year 2005, 51.4% of the unit were classified as type H. High values of the frequency index were identified in 22 units (20.1%), one (1.0%) for the duration index and same value (1.0%) for the intensity index. The year 2006 was the one that showed highest dengue fever incidence. It was the year when all the risk profile showed maximum number of cases. Of all tracts, 51% were classified as type H. A total of 15 unit were identified with high values (8.3%) for the frequency index and four (3.7%) for the duration and intensity index.
N. C. Dom et al. / EnvironmentAsia 5(2) (2012) 82-92
87
Table 3. Spatial unit according to risk classification for the occurrence of dengue fever, frequency, duration and intensity indices. Subang Jaya, Selangor from 2004-2008.
Year Risk Classification
Mean of the three Temporal Risk Indices
Regional Characteristics Evaluation indices
Frequency(α)
Duration(β)
Intensity (γ)
Number of spatial
units
Population Density
Dengue FeverCases
DFDensity
2004
A 0.23 6.93 1.73 9 6980 163 3.02
B 0.25 6.64 0.63 12 17944 250 1.59
C 0.13 3.69 0.46 13 18665 107 2.31
G 0.04 2.25 1.80 4 2132 12 1.80
2005
No cases (H) 0.00 0.00 0.00 72 7981 0 0.00
A 0.15 7.88 1.74 8 6345 65 1.60
B 0.31 8.53 0.49 12 37155 279 1.09
C 0.13 3.53 0.38 22 16216 167 0.79
E 0.12 6.00 0.49 1 18190 9 0.49
F 0.13 4.86 2.94 7 2975 78 3.90
G 0.08 4.00 2.14 1 1865 4 2.14
2006
No cases (H) 0.00 0.00 0.00 54 2435 0 0.00
A 0.24 8.17 1.85 13 9783 300 2.71
B 0.27 7.52 0.40 11 32083 217 0.80
C 0.21 3.64 0.30 15 27155 221 1.07
D 0.09 5.00 1.23 1 4865 8 1.64
E 0.09 5.00 0.53 4 16357 22 1.00
F 0.15 3.06 1.24 5 3052 50 3.71
G 0.05 2.50 1.93 4 1807 13 1.90
2007
No cases (H) 0.00 0.00 0.00 56 2595 0 0.00
A 0.21 8.02 2.77 10 7643 203 3.92
B 0.22 6.29 0.50 14 25135 221 0.80
C 0.16 3.61 0.52 24 19676 267 1.30
F 0.20 2.85 1.82 2 2739 35 6.00
G 0.06 3.33 2.15 8 2806 59 2.45
2008
No cases (H) 0.00 0.00 0.00 54 3809 0 0.00
A 0.29 11.33 3.69 9 5333 246 5.62
B 0.34 9.93 0.61 11 33457 274 1.21
C 0.27 4.77 0.72 23 20998 517 1.71
D 0.13 7.00 3.74 1 2140 8 3.73
E 0.21 8.63 1.00 4 16162 52 3.91
F 0.20 5.30 2.19 5 3336 68 4.38
G 0.08 3.17 2.06 8 2272 47 0.77
No cases (H) 0.00 0.00 0.00 53 2320 0 0.00Risk classification: Type A: High Frequency-Duration-Intensity; Type B: High Frequency-Duration; Type C: High Frequency; Type D : High Duration-Intensity; Type E : High Intensity, Type F: High Frequency-Intensity; Type G: High Duration.Type H: No cases
N. C. Dom et al. / EnvironmentAsia 5(2) (2012) 82-92
88
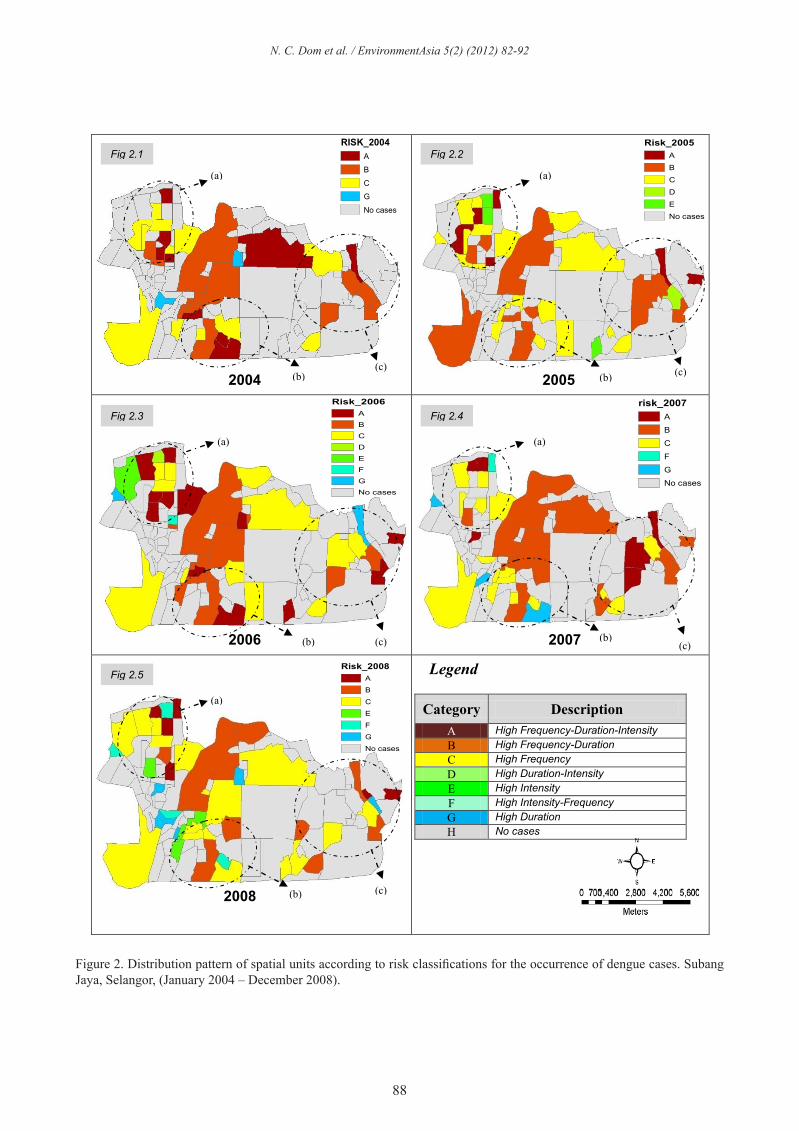
Figure 2. Distribution pattern of spatial units according to risk classifications for the occurrence of dengue cases. Subang Jaya, Selangor, (January 2004 – December 2008).
8
Legendpetaling
<all other values>
RISK_2004A
B
C
G
No cases
Legendpetaling
<all other values>
Risk_2005A
B
C
D
E
No cases
Legendpetaling
<all other values>
Risk_2006A
B
C
D
E
F
G
No cases
petaling<all other values>
Risk_2005A
B
C
D
E
No cases
Legendpetaling
<all other values>
risk_2007A
B
C
F
G
No cases
petaling<all other values>
Risk_2005A
B
C
D
E
No cases
Legendpetaling
<all other values>
Risk_2008A
B
C
E
F
G
No cases
petaling<all other values>
Risk_2005A
B
C
D
E
No cases
Figure 2. Distribution pattern of spatial units according to risk classifications for the occurrence of dengue cases. Subang Jaya, Selangor, (January 2004 – December 2008).
The analysis of the mean according to risk category for 2007 showed 48% of the unit were
classified as type H. High values of the frequency index were identified in 10 units (8.9%), eight (7.1%) for the duration index and none (0.0%) for the intensity index. The year of 2008 was the one
Fig 2.1
2004
Fig 2.2
2005
2006
Fig 2.3
(a)
(b) (c)
(a)
(b) (c)
(a)
(c)
Fig 2.4
2007 (b)
(a)
(b) (c)
2008
Fig 2.5
(a)
(b) (c)
Legend
Category Description A High Frequency-Duration-Intensity B High Frequency-Duration C High Frequency D High Duration-Intensity E High Intensity F High Intensity-Frequency G High Duration H No cases
N. C. Dom et al. / EnvironmentAsia 5(2) (2012) 82-92
89
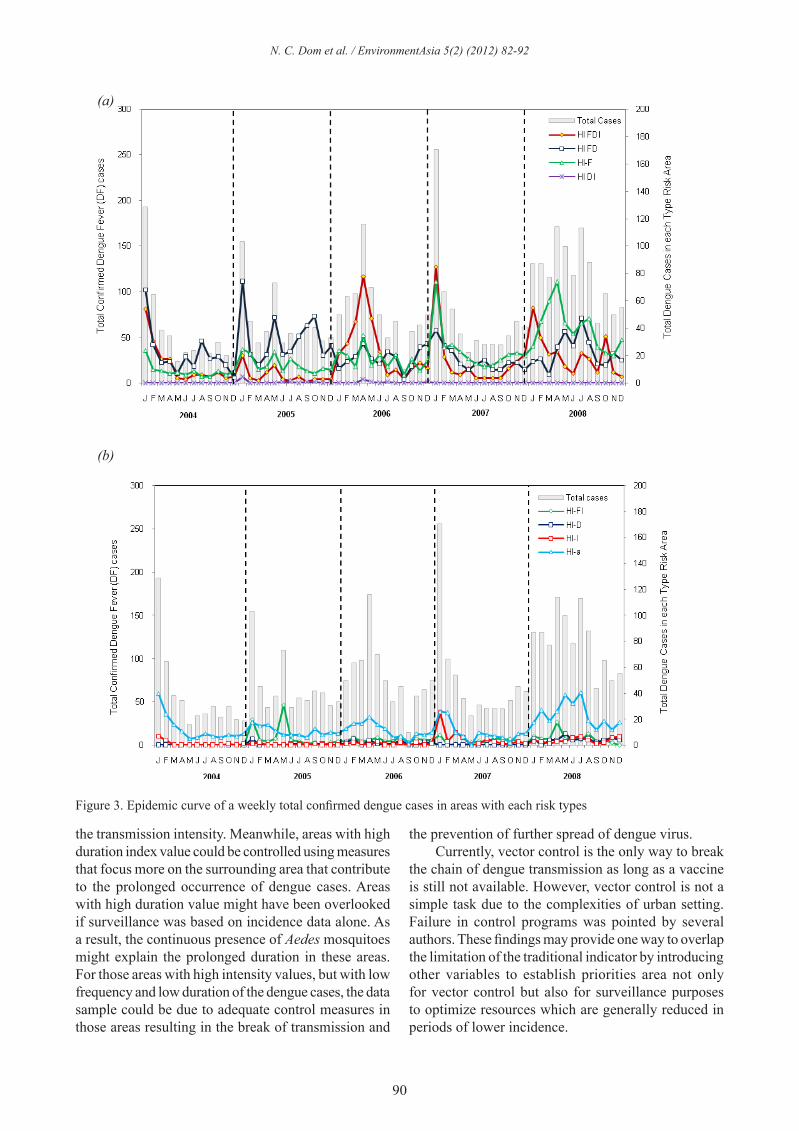
The analysis of the mean according to risk category for 2007 showed 48% of the unit were classified as type H. High values of the frequency index were identified in 10 units (8.9%), eight (7.1%) for the duration index and none (0.0%) for the intensity index. The year of 2008 was the one that showed highest dengue fever incidence. In addition, it was the year when all the risk profile showed maximum number of cases. Of all tracts, 46% were classified as type H. A total of 9 unit were identified with high values (7.9%) for the frequency index and eight (3.5%) for the duration and four (3.5%) for the intensity index. Fig. 2 displays the distribution of spatial unit according to risk categories, where a pattern with concentration of spatial unit into different temporal risk characteristics over the district is verified (2004-2008). By comparing the mean ranks of the incidence rates for each risk category in each wave (Fig. 3), a significance difference was observed among the three categories (Hi- FDI, Hi-FD, Hi-F) with an ascending gradient for all the wave.
3.3. Assessment of the magnitude and severity of the dengue (2004-2008) epidemic in Subang Jaya
The analysis of the epidemics, according to risk category is presented in Fig. 3. From 2004 to 2008, the trend of the average annual DF incidence in the whole Subang Jaya district was significantly increased. Two different patterns in the outbreak of epidemic period can be seen in Fig. 4. The dengue temporal distribution in the entire locality indicate Hi-FDI, Hi-FD and Hi-F risk types had the highest DF density, presented in similar trend every year. The worst incidence was reported in Jan 2007 with more than 250 cases.
4. Discussions
Combining the field of epidemiology and computational management of information is an important endeavour for surveillance and effective control of health problem (Valerie, 2000; Tripathi, 2009). This study classifies area of Subang Jaya according to the susceptibility to the transmission of dengue and characterizes them based on the three temporal risk measures. The utilization of the three temporal risk measures proposed by Wen et al. (2006) enable the identification of high risk area of DF occurence This information provides a helpful picture of the epidemic and thus a more detailed representation of the risk. From the spatial and temporal distribution of epidemic, several characteristics of DHF epidemics may be described. This study used the three temporal
indices to retrospectively map the spatial patterns of dengue cases and to identify possible risk areas visually for the 2004 to 2008 year. Due to the nature of epidemic which is a dynamic process, it is important to identify spatial risk areas through the use of different temporal risk characteristics. For example, some area might have longer epidemic duration while others might have stronger intensity even though the duration is short. The high value for each index was represented by the darkest area. Mapping of the three temporal risk indices produced spatial risk areas for each index. When visual analysis was done, 2008 proved to be the year with the most number of areas with high values of frequency indices. This pattern showed that, if not effectively controlled plus poor attitude of the people in seeking and destroying Aedes breeding habitats, there will be more areas with high frequency indices in the future. Distribution pattern of duration index showed that the high values are found at the same locality but their occurrance are erratic, appearing in one year, dis-appearing the next and reappearing again in the following year. This could be traced back to the environmental conditions of these areas; Taman Kinrara and Taman Serdang Raya. The two areas were undergoing construction interspersed with abandoned areas which could have contributed to the prolonged dengue outbreak (Triphati, 2005). The situation was made worse with the lack of public participation in seeking and destroying potential Aedes mosquitoes breeding areas. The distribution pattern for intensity index showed a consistent pattern. It tended to remain stable at the same localities. This could be due to the public health officials’ reliance on the traditional total number of dengue cases. Thus, they could not detect the temporal difference of each area and continuously apply methods that were not suitable to the temporal characteristics of dengue in those areas. Therefore, when dengue outbreak started occurring in those areas, it would suddenly rise to unexpected levels. The classification of the spatial unit according to the temporal risk indicator, establish after 5 years of epidemics, was enough to retrospectively discriminate these areas. This corroborates the hypothesis that factors inherent to these sites may facilitate or restrict the transmission and/or maintenance of the disease. Public health officials may apply the methods developed from this study to focus more on risk areas that have high duration index value and high intensity index value. Using the spatial patterns from the three temporal indices, more effective control measures can be implemented at the risk areas. For example, areas with longer duration of epidemic wave could be applied with control strategies that would minimize
N. C. Dom et al. / EnvironmentAsia 5(2) (2012) 82-92
90
the transmission intensity. Meanwhile, areas with high duration index value could be controlled using measures that focus more on the surrounding area that contribute to the prolonged occurrence of dengue cases. Areas with high duration value might have been overlooked if surveillance was based on incidence data alone. As a result, the continuous presence of Aedes mosquitoes might explain the prolonged duration in these areas. For those areas with high intensity values, but with low frequency and low duration of the dengue cases, the data sample could be due to adequate control measures in those areas resulting in the break of transmission and
the prevention of further spread of dengue virus. Currently, vector control is the only way to break the chain of dengue transmission as long as a vaccine is still not available. However, vector control is not a simple task due to the complexities of urban setting. Failure in control programs was pointed by several authors. These findings may provide one way to overlap the limitation of the traditional indicator by introducing other variables to establish priorities area not only for vector control but also for surveillance purposes to optimize resources which are generally reduced in periods of lower incidence.
Figure 3. Epidemic curve of a weekly total confirmed dengue cases in areas with each risk types
10
Figure 3. Epidemic curve of a weekly total confirmed dengue cases in areas with each risk types
The classification of the spatial unit according to the temporal risk indicator, establish after 5 years of epidemics, was enough to retrospectively discriminate these areas. This corroborates the hypothesis that factors inherent to these sites may facilitate or restrict the transmission and/or maintenance of the disease.
Public health officials may apply the methods developed from this study to focus more on risk areas that have high duration index value and high intensity index value. Using the spatial patterns from the three temporal indices, more effective control measures can be implemented at the risk areas. For example, areas with longer duration of epidemic wave could be applied with control strategies that
(a)
(b)
N. C. Dom et al. / EnvironmentAsia 5(2) (2012) 82-92
91
This study relies on surveillance data to enhance basic spatial modelling using temporally defined indices, rather than traditional approach which uses dengue incidence data. The use of incidence data cannot distinguish the spatial differences in risk areas from those of the neighbouring areas which are crucial to the effective control of vector-borne infectious diseases. This study uses basic surveillance data that is routinely collected in most countries, but with the addition of the three temporal risk indices, risk areas can be identified without using expensive technology. This will help in the allocation of resources to the most at-risk areas to prevent further cases occurring and spreading.
5. Conclusions
Spatial and temporal aspects are vital variables that can be used to characterize epidemics dynamics and risk distribution. Even though there are other methods available which apply either complicated statistical analysis or sophisticated surveillance systems, they are difficult to perform in developing countries. This study provides public health authorities with a tool to differentiate risk patterns of a dengue epidemic using three temporally-defined indices to comprehensively identify high risk areas early in the epidemic episode based on their integrated spatial-temporal profiles. Apart from relying on mapping of incidence rate or number of cases, this study proposed a new set of parameters which can characterize the dengue cases in a more comprehensive manner thus providing the public health authorities with an alternative option to predict and effectively manage dengue outbreak.
Acknowledgements
The authors sincerely thank Dr. Roslan Mohamed Hussin, Director of Health Department MPSJ, for providing ground data on dengue cases for this research work. The contribution of meteorological data from the Malaysian Meteorological Department and research funding from Universiti Teknologi MARA and Ministry of Higher Education (MOHE) Malaysia are also duly acknowledged.
References
Barbazan P. DHF in the Central Plain of Thailand.Remote Sensing and GIS to identify factors and indicators related to dengue transmission. The Chao Phraya Delta: Historical Development, Dynamics and Challenges of Thailand 2001; 1-12.Chiaravalloti-Neto AM. Spatial correlation of incidence of dengue with socioeconomic, demographic and environmental variables in a Brazilian city. Science of The Total Environment 2008; 393(2-3): 241-48.
Cringoli RT. Use of remote sensing and geographical information systems to identify environmental features that influence the distribution of paramphistomosis in sheep from the southern Italian Apennines. Veterinary Parasitology 2004; 122(1): 15-26.Gong P, Xu B, Liang S. Remote sensing and geographic information systems in the spatial temporal dynamics modeling of infectious diseases. Science in China Series C: Life Sciences 2006; 49(6): 573-82.Jirakajohnkool KN. Temporal and Spatial Autocorrelation Statistics of Dengue Fever. Dengue Bulletin 2006; 30: 177-83.Kanchana N, Tripathi NK. An information value based analysis of physical and climatic factors affecting dengue fever and dengue haemorrhagic fever incidence. International Journal of Health Geographics 2005; 4: 4-13.Krishna Prasad Bandari PR. Application Of GIS Modelling For Dengue Fever Prone Area Based On Socio-cultural and Environmental Factors-A Case Study Of Delhi City Zone. The International Archive of The Photogrammetry, Remote Sensing and Spatial Information Sciences 2008; 36: 165-70.Napier M. Application of GIS and Modeling of Dengue Risk Areas in the Hawaiian Islands. 30th International Symposium Remote Sensing Environment, Honolulu 2003.Nazri CD, Abu Hassan A, Zulkiflee AL, Rodziah I. Impact of climate and landuse variability based on dengue epidemic outbreak in Subang Jaya. IEEE Colloquium on Humanities, Science and Engineering Research (CHUSER) 2011; 907-12.Nitatpattana N, Singhasivanon P, Kiyoshi H, Andrianasolo H, Yoksan S, Gonzalez JP. Potential association of dengue hemorrhagic fever incidence and remote senses land surface temperature, Thailand, 1998. Southeast Asian Journal Tropical Medical Public Health 2007; 38: 427-33.Openshaw S. Geographical information systems and tropical diseases. Transactions Of The Royal Society Of Tropical Medicine And Hygiene 1996; 90: 337-39.Phaisan J, Nithin KT, Marc S. Spatio-Temporal Diffusion Pattern and Hotspot Detection of Dengue in Chachoengsao Province, Thailand. International Journal Environment Research of Public Health 2011; 8: 51-74.Ratana Sithiprasasna KJ. Use of GIS to Study The Epidemiology of Dengue Haemorrhagic Fever In Thailand. Dengue Bulletin 1997; 21: 68-73.Rudnick AT. Mosquito-borne haemorrhagic fever in Malaya. British Medical Journal 1965; 7: 1269-72.Schroder W. GIS, geostatistics, metadata banking, and tree-based models for data analysis and mapping in environmental monitoring and epidemiology. International Journal of Medical Microbiology 2006; 296: 23-36.Sharma K, Angel B, Singh H, Purohit A, Joshi V. Entomological studies for surveillance and prevention of dengue in arid and semi-arid districts of Rajasthan, India. Journal of Vector Borne Disease 2008; 45: 124-32.
N. C. Dom et al. / EnvironmentAsia 5(2) (2012) 82-92
92
Skae F. Dengue fever in Penang. British Medical Journal 1902; 2: 1581-82.Song GTl. The Use of GIS in Ovitrap Monitoring for Dengue Control in Singapore. Dengue Bulletin 2000; 24: 110-16. Valerie Crossa AF. Fuzzy objects for geographical information systems. Fuzzy Sets and Systems 2000; 113: 19-36.Vazquez-Prokopec GM, Kitron U, Montogomorey B, Horne P, Ritchie SA. Quantifying the Spatial Dimension of Dengue Virus Epidemic Spread within a Tropical Urban Environment. PLoS Neglected Tropical Disease 2010; 4: 90-104Wen TH, Lin NH, Lin CH, King CC, Su MD. Spatial mapping of temporal risk characteristics to improve environmental health risk identification: A case study of a dengue epidemic in Taiwan. Science of the Total Environment 2006; 367: 631-40.Wen TH, Lin NH, Chao DY, Hwang KP, Kan CC, Lin KC, Wu JT, Huang SY, Fan IC, King CC. Spatial-temporal patterns of dengue in areas at risk of dengue hemorrhagic fever in Kaohsiung, Taiwan, 2002. International Journal of Infectious Diseases 2010; 14: 334-43Wiwanitkit V. An observation on correlation between rainfall and the prevalence of clinical cases of dengue in Thailand. Journal of Vect Borne Disease 2006; 43: 73-76.Wu PC, Lay JG, Guo HR, Lin CY, Lung SC, Su HJ. Higher temperature and urbanization affect the spatial patterns of dengue fever transmission in subtropical Taiwan. Science of The Total Environment 2009; 407(7): 2224-33.
Received 15 March 2012Accepted 18 May 2012
Correspondence toDr. Zulkiflee Abd LatifCentre of Studies Surveying Science & Geomatics,Faculty of Architecture, Planning and Surveying,Universiti Teknologi MARA, Shah Alam, Selangor, MalaysiaE-mail: [email protected], [email protected]: +603-55444399Fax: + 603-55444545
N. C. Dom et al. / EnvironmentAsia 5(2) (2012) 82-92