Embed Size (px)
Citation preview
Esperienze di monitoraggio della biodiversità negli inventari forestali
a scala internazionale, nazionale e locale
Gherardo Chirici
Anna Barbati
Giornata di StudioMONITORAGGIO VEGETAZIONALE, FAUNISTICO E DI FUNZIONALITÀ ECOSISTEMICA E INVENTARIAZIONE FORESTALE
Venerdì 22 giugno 2012
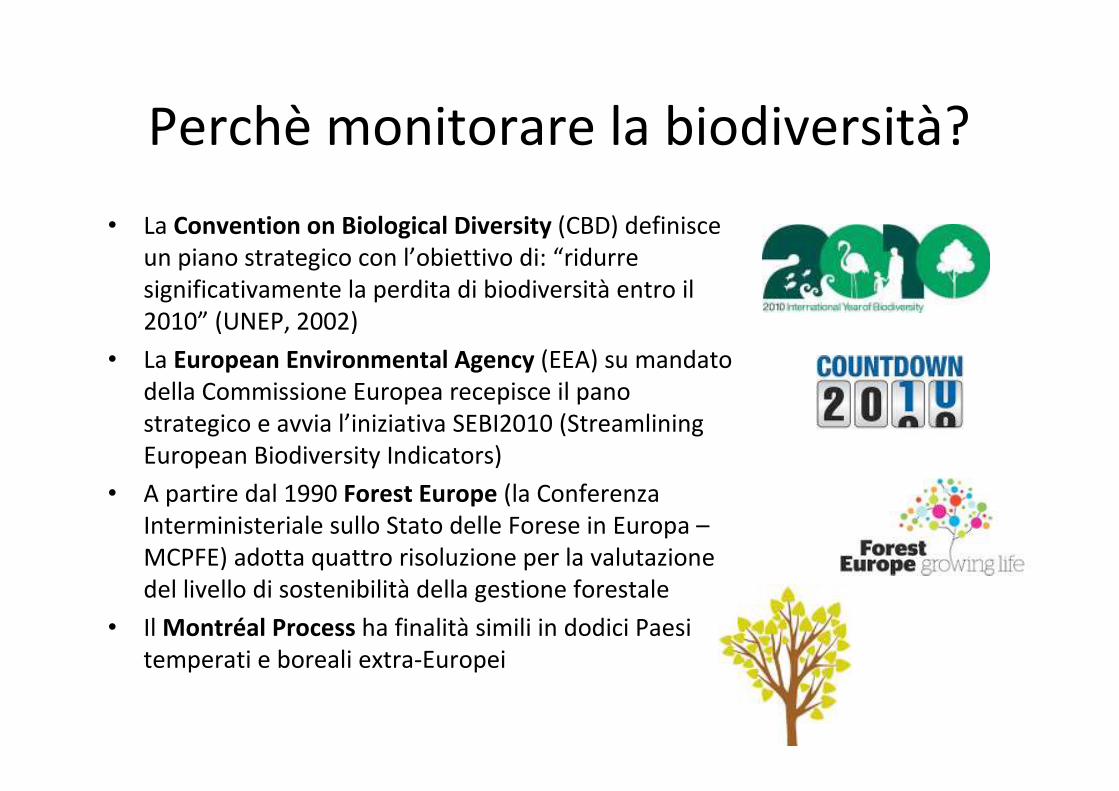
Perchè monitorare la biodiversità?
• La Convention on Biological Diversity (CBD) definisce un piano strategico con l’obiettivo di: “ridurre significativamente la perdita di biodiversità entro il 2010” (UNEP, 2002)
• La European Environmental Agency (EEA) su mandato della Commissione Europea recepisce il pano strategico e avvia l’iniziativa SEBI2010 (Streamlining European Biodiversity Indicators)
• A partire dal 1990 Forest Europe (la Conferenza Interministeriale sullo Stato delle Forese in Europa –MCPFE) adotta quattro risoluzione per la valutazione del livello di sostenibilità della gestione forestale
• Il Montréal Process ha finalità simili in dodici Paesi temperati e boreali extra-Europei
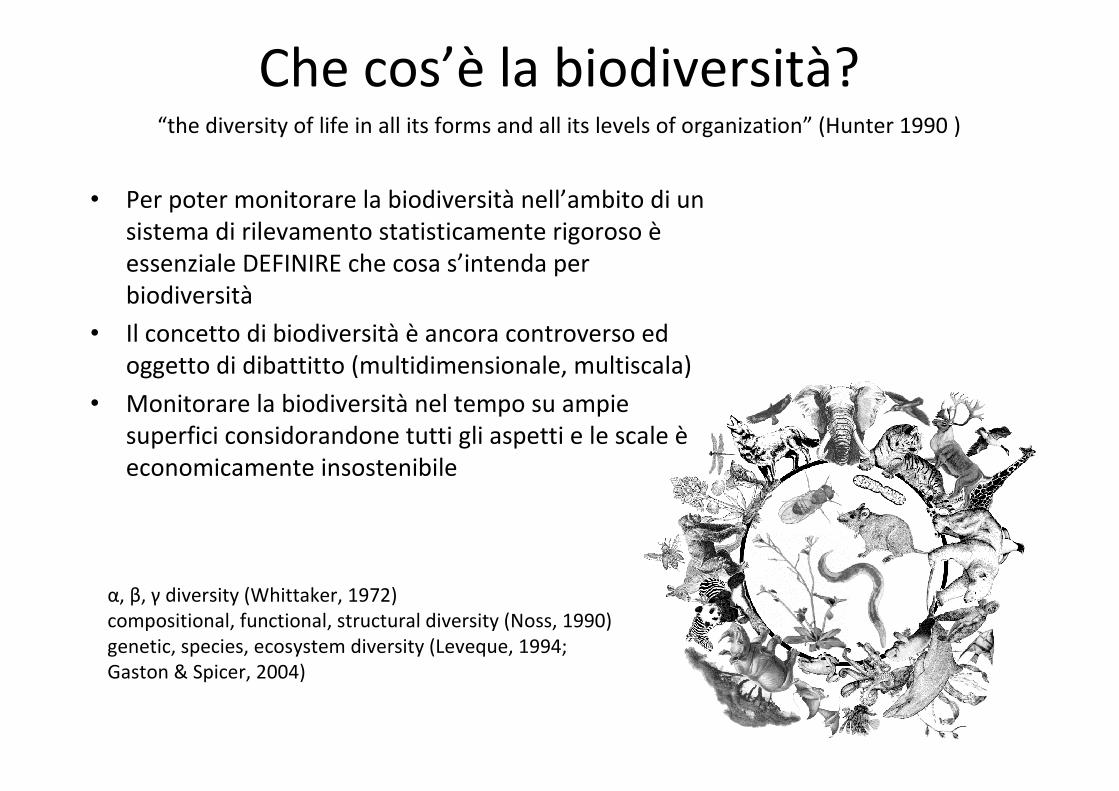
Che cos’è la biodiversità?
• Per poter monitorare la biodiversità nell’ambito di un sistema di rilevamento statisticamente rigoroso èessenziale DEFINIRE che cosa s’intenda per biodiversità
• Il concetto di biodiversità è ancora controverso ed oggetto di dibattitto (multidimensionale, multiscala)
• Monitorare la biodiversità nel tempo su ampie superfici considorandone tutti gli aspetti e le scale èeconomicamente insostenibile
α, β, γ diversity (Whittaker, 1972)compositional, functional, structural diversity (Noss, 1990)genetic, species, ecosystem diversity (Leveque, 1994; Gaston & Spicer, 2004)
“the diversity of life in all its forms and all its levels of organization” (Hunter 1990 )
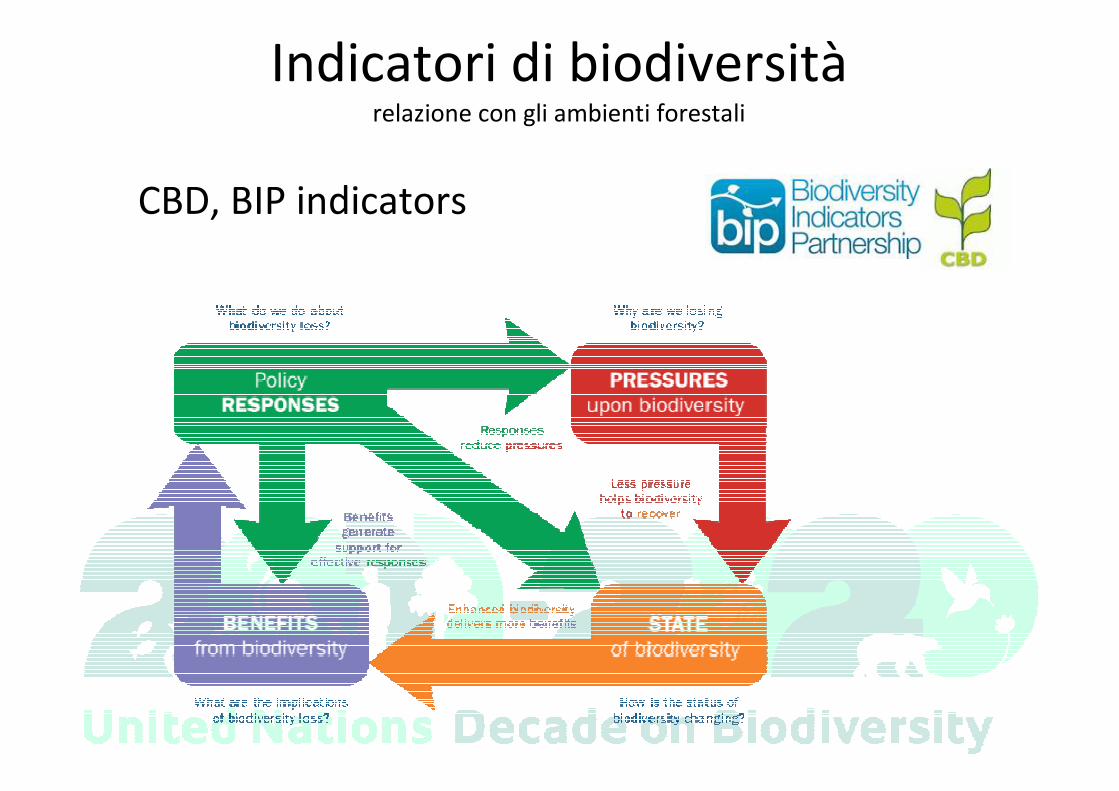
Indicatori di biodiversitàrelazione con gli ambienti forestali
CBD, BIP indicators
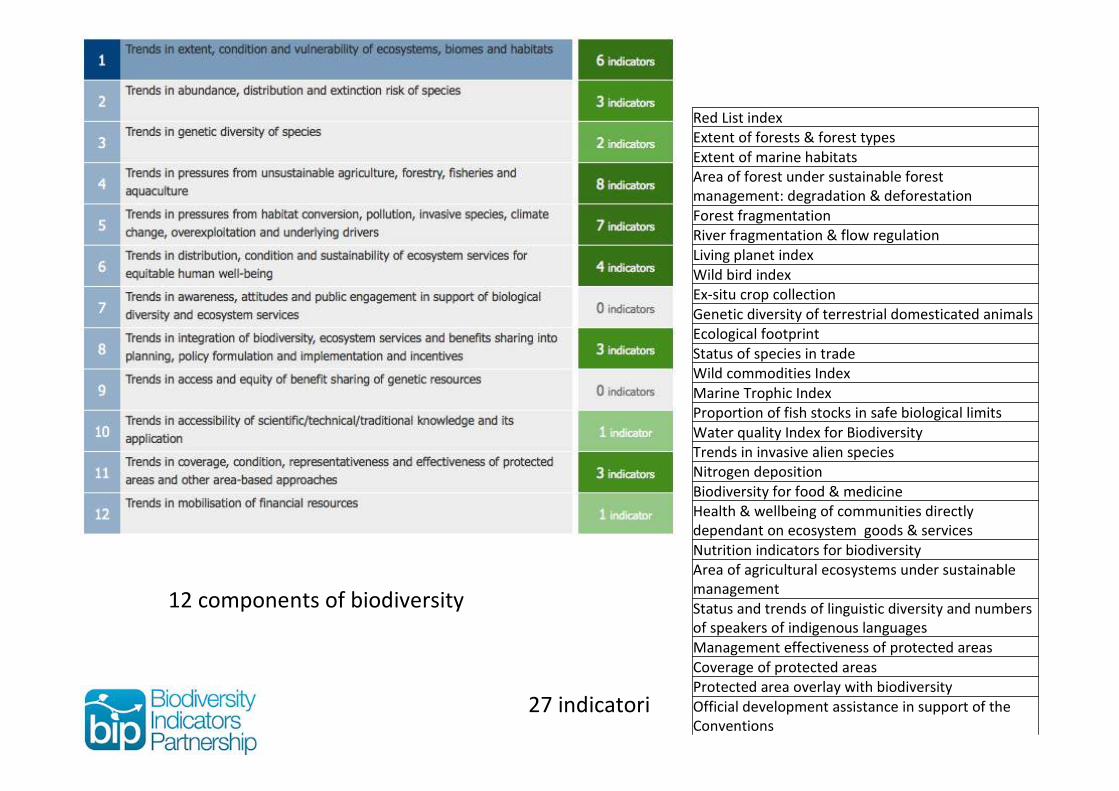
Red List indexExtent of forests & forest typesExtent of marine habitatsArea of forest under sustainable forest management: degradation & deforestationForest fragmentationRiver fragmentation & flow regulationLiving planet indexWild bird indexEx-situ crop collectionGenetic diversity of terrestrial domesticated animalsEcological footprintStatus of species in tradeWild commodities IndexMarine Trophic IndexProportion of fish stocks in safe biological limitsWater quality Index for BiodiversityTrends in invasive alien speciesNitrogen depositionBiodiversity for food & medicineHealth & wellbeing of communities directly dependant on ecosystem goods & servicesNutrition indicators for biodiversityArea of agricultural ecosystems under sustainable managementStatus and trends of linguistic diversity and numbers of speakers of indigenous languagesManagement effectiveness of protected areasCoverage of protected areasProtected area overlay with biodiversityOfficial development assistance in support of the Conventions
12 components of biodiversity
27 indicatori
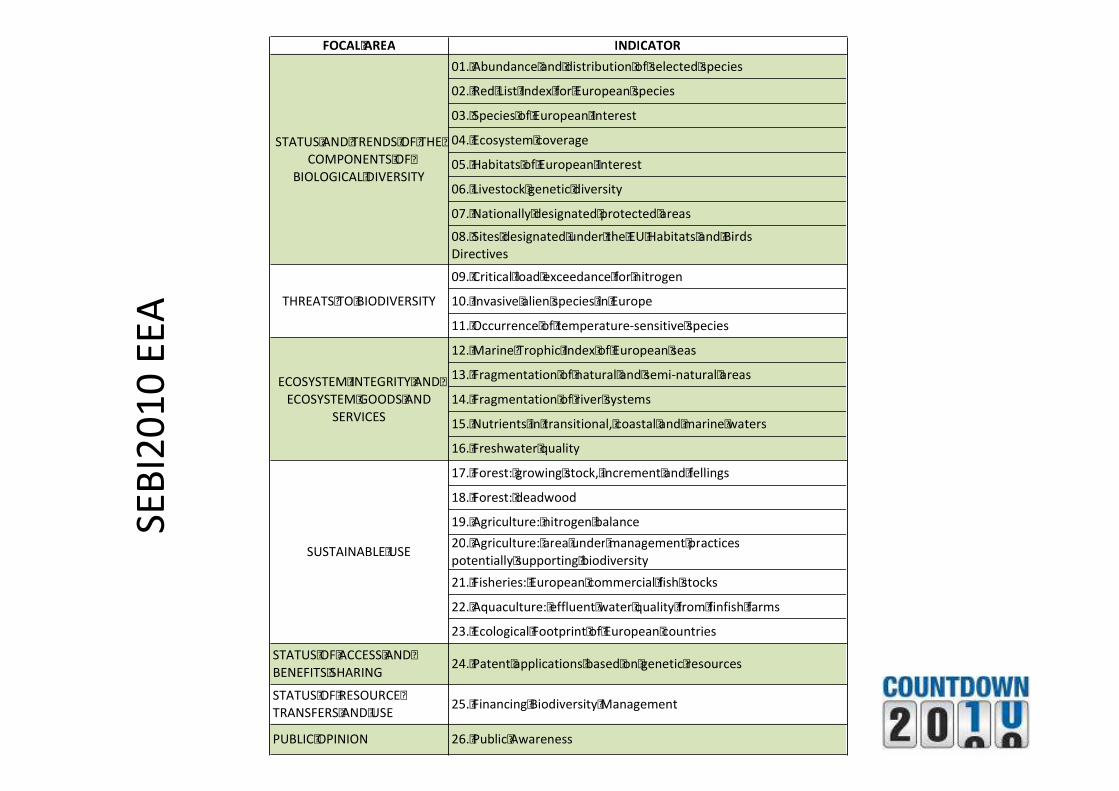
FOCALAREA INDICATOR
01.Abundanceanddistributionofselectedspecies
02.RedListIndexforEuropeanspecies
03.SpeciesofEuropeanInterest
04.Ecosystemcoverage
05.HabitatsofEuropeanInterest
06.Livestockgeneticdiversity
07.Nationallydesignatedprotectedareas
08.SitesdesignatedundertheEUHabitatsandBirdsDirectives
09.Criticalloadexceedancefornitrogen
10.InvasivealienspeciesinEurope
11.Occurrenceoftemperature-sensitivespecies
12.MarineTrophicIndexofEuropeanseas
13.Fragmentationofnaturalandsemi-naturalareas
14.Fragmentationofriversystems
15.Nutrientsintransitional,coastalandmarinewaters
16.Freshwaterquality
17.Forest:growingstock,incrementandfellings
18.Forest:deadwood
19.Agriculture:nitrogenbalance
20.Agriculture:areaundermanagementpracticespotentiallysupportingbiodiversity
21.Fisheries:Europeancommercialfishstocks
22.Aquaculture:effluentwaterqualityfromfinfishfarms
23.EcologicalFootprintofEuropeancountries
STATUSOFACCESSANDBENEFITSSHARING
24.Patentapplicationsbasedongeneticresources
STATUSOFRESOURCETRANSFERSANDUSE
25.FinancingBiodiversityManagement
PUBLICOPINION 26.PublicAwareness
STATUSANDTRENDSOFTHECOMPONENTSOF
BIOLOGICALDIVERSITY
THREATSTOBIODIVERSITY
ECOSYSTEMINTEGRITYANDECOSYSTEMGOODSAND
SERVICES
SUSTAINABLEUSE
SEB
I20
10
EEA
RedListindex
Extentofforests&foresttypes
Extentofmarinehabitats
Areaofforestundersustainableforestmanagement:degradation&deforestation
Forestfragmentation
Riverfragmentation&flowregulation
RedListindex
Livingplanetindex
Wildbirdindex
Ex-situcropcollection
Geneticdiversityofterrestrialdomesticatedanimals
Ecologicalfootprint
Statusofspeciesintrade
WildcommoditiesIndex
Redlistindex
Livingplanetindex
Wildbirdindex
MarineTrophicIndex
Proportionoffishstocksinsafebiologicallimits
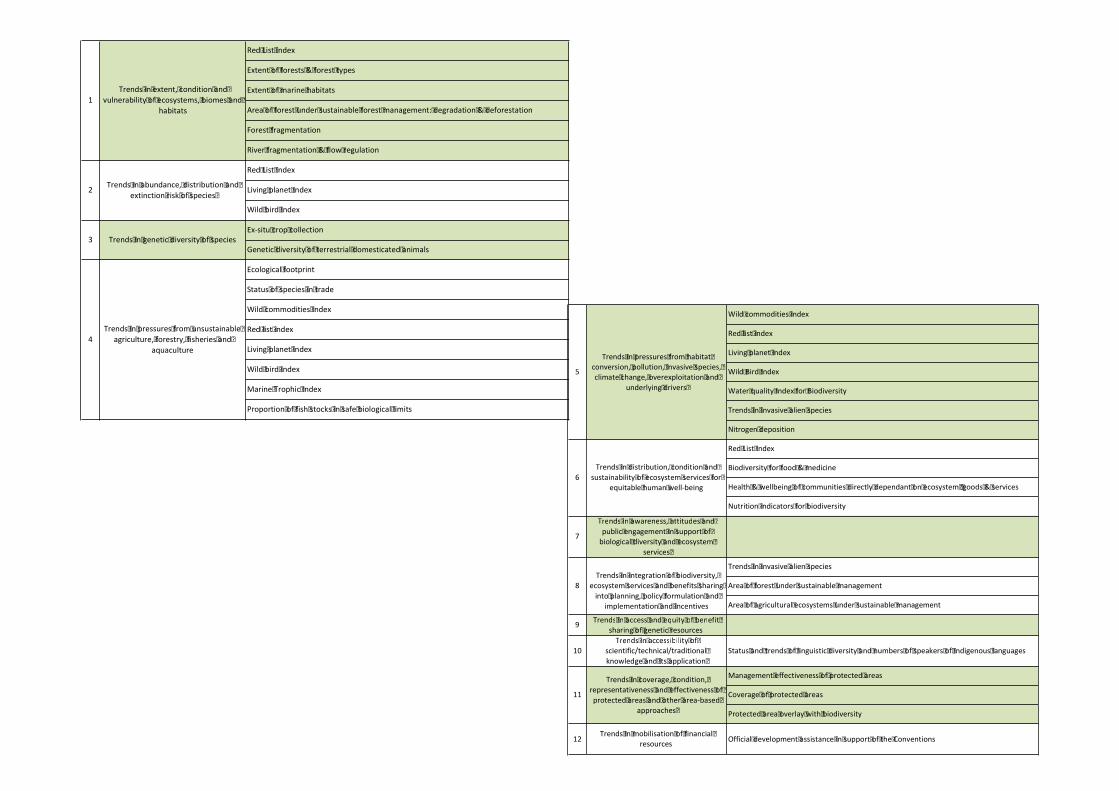
1
2
3
4
Trendsinextent,conditionandvulnerabilityofecosystems,biomesand
habitats
Trendsinabundance,distributionandextinctionriskofspecies
Trendsingeneticdiversityofspecies
Trendsinpressuresfromunsustainableagriculture,forestry,fisheriesand
aquaculture
Wildcommoditiesindex
Redlistindex
Livingplanetindex
WildBirdIndex
WaterqualityIndexforBiodiversity
Trendsininvasivealienspecies
Nitrogendeposition
RedListIndex
Biodiversityforfood&medicine
Health&wellbeingofcommunitiesdirectlydependantonecosystemgoods&services
Nutritionindicatorsforbiodiversity
7
Trendsinawareness,attitudesand
publicengagementinsupportofbiologicaldiversityandecosystem
services
Trendsininvasivealienspecies
Areaofforestundersustainablemanagement
Areaofagriculturalecosystemsundersustainablemanagement
9Trendsinaccessandequityofbenefit
sharingofgeneticresources
10Trendsinaccessibilityof
scientific/technical/traditional
knowledgeanditsapplication
Statusandtrendsoflinguisticdiversityandnumbersofspeakersofindigenouslanguages
Managementeffectivenessofprotectedareas
Coverageofprotectedareas
Protectedareaoverlaywithbiodiversity
8
11
12
Trendsinintegrationofbiodiversity,ecosystemservicesandbenefitssharing
intoplanning,policyformulationandimplementationandincentives
Trendsincoverage,condition,representativenessandeffectivenessof
protectedareasandotherarea-basedapproaches
Trendsinmobilisationoffinancialresources
OfficialdevelopmentassistanceinsupportoftheConventions
Trendsindistribution,conditionand
sustainabilityofecosystemservicesforequitablehumanwell-being
5
Trendsinpressuresfromhabitatconversion,pollution,invasivespecies,climatechange,overexploitationand
underlyingdrivers
6
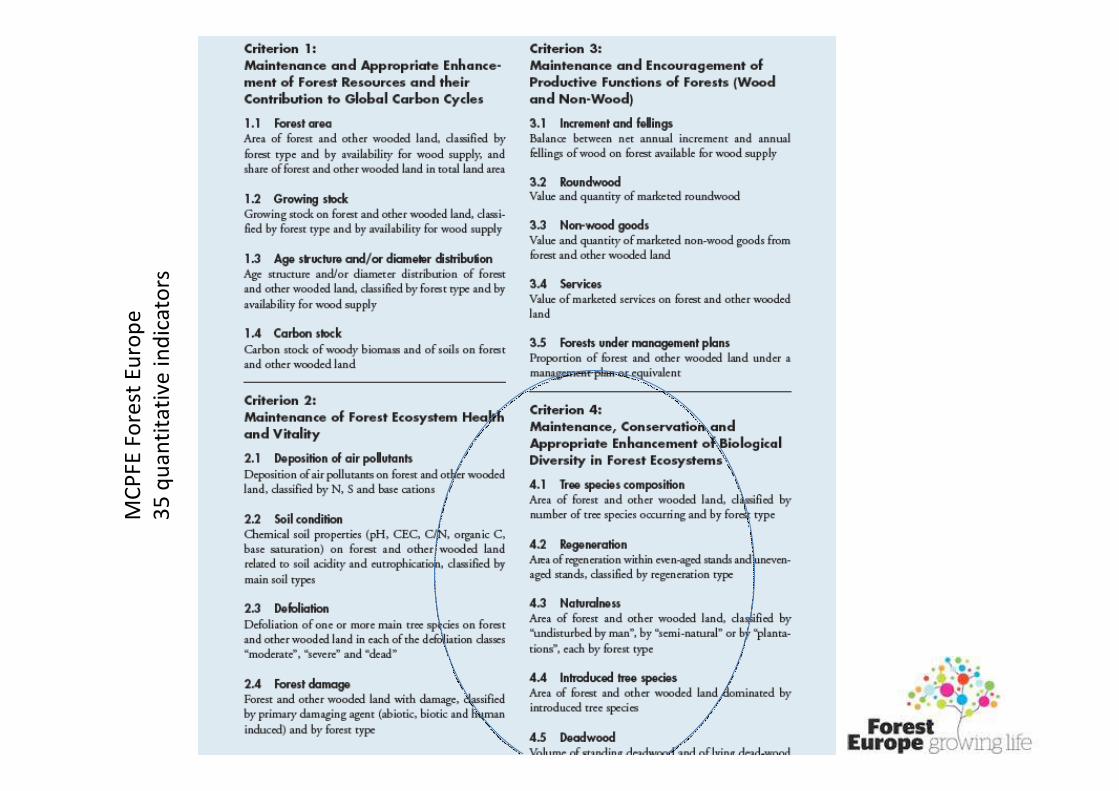
MC
PFE
Fo
rest
Eu
rop
e3
5 q
uan
tita
tive
ind
icat
ors
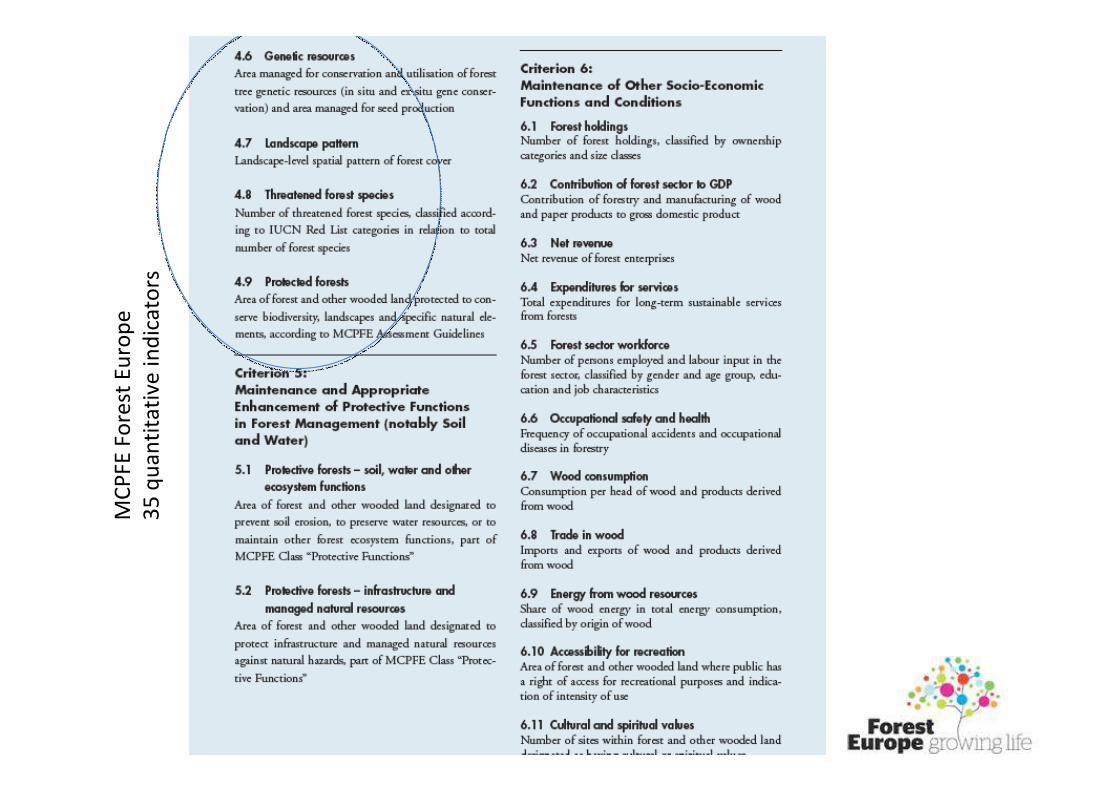
MC
PFE
Fo
rest
Eu
rop
e3
5 q
uan
tita
tive
ind
icat
ors
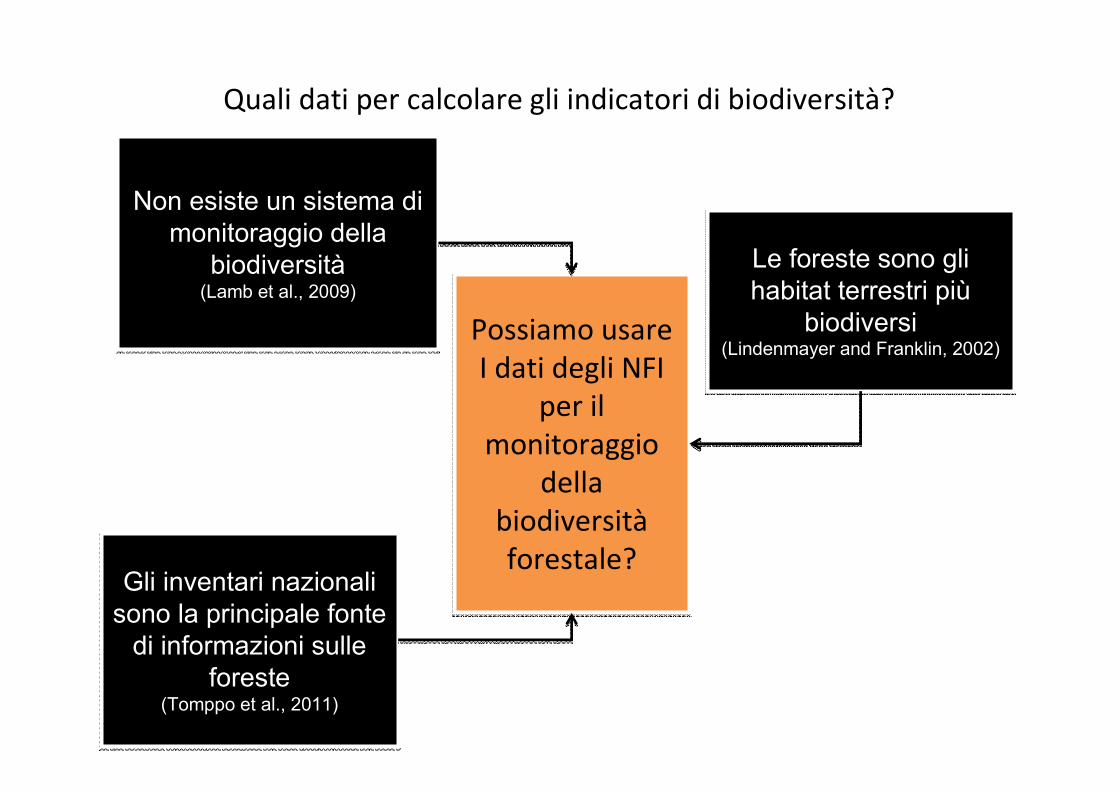
Quali dati per calcolare gli indicatori di biodiversità?
Non esiste un sistema di
monitoraggio della
biodiversità(Lamb et al., 2009)
Non esiste un sistema di
monitoraggio della
biodiversità(Lamb et al., 2009)
Le foreste sono gli
habitat terrestri più
biodiversi(Lindenmayer and Franklin, 2002)
Le foreste sono gli
habitat terrestri più
biodiversi(Lindenmayer and Franklin, 2002)
Gli inventari nazionali
sono la principale fonte
di informazioni sulle
foreste(Tomppo et al., 2011)
Gli inventari nazionali
sono la principale fonte
di informazioni sulle
foreste(Tomppo et al., 2011)
Possiamo usare I dati degli NFI
per il monitoraggio
della biodiversitàforestale?
Possiamo usare I dati degli NFI
per il monitoraggio
della biodiversitàforestale?
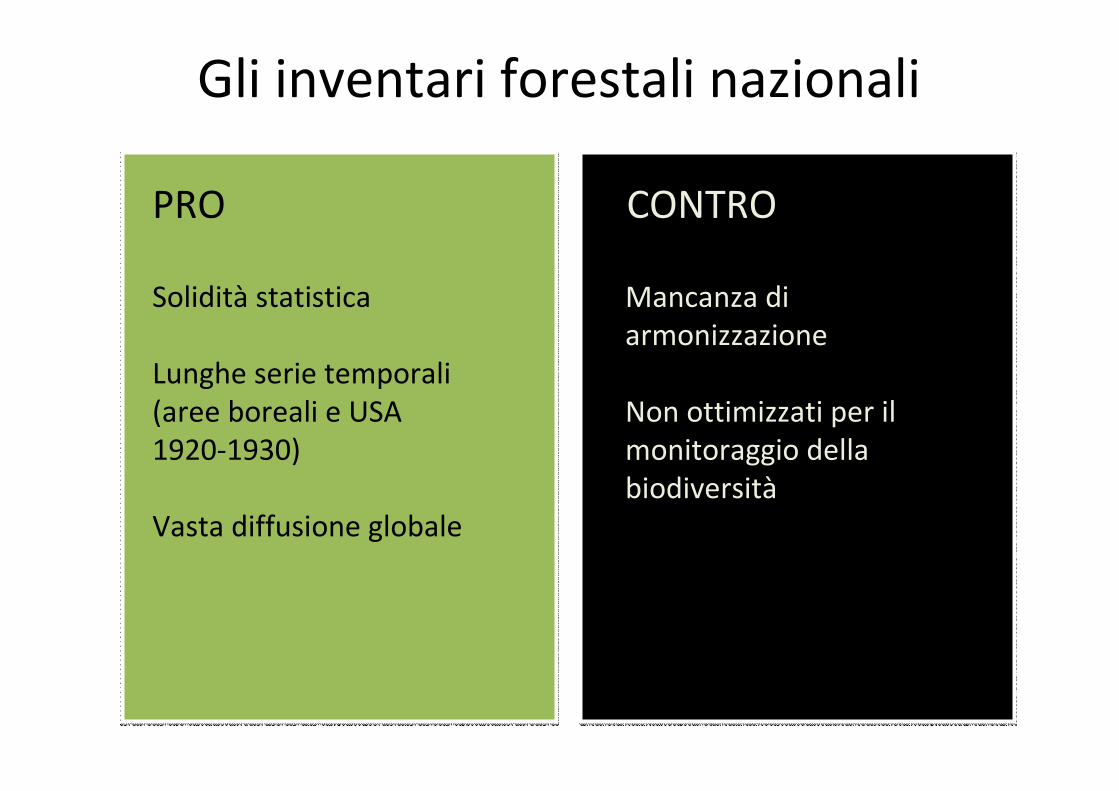
Gli inventari forestali nazionali
PRO
Solidità statistica
Lunghe serie temporali (aree boreali e USA 1920-1930)
Vasta diffusione globale
Mancanza di armonizzazione
Non ottimizzati per il monitoraggio della biodiversità
CONTRO
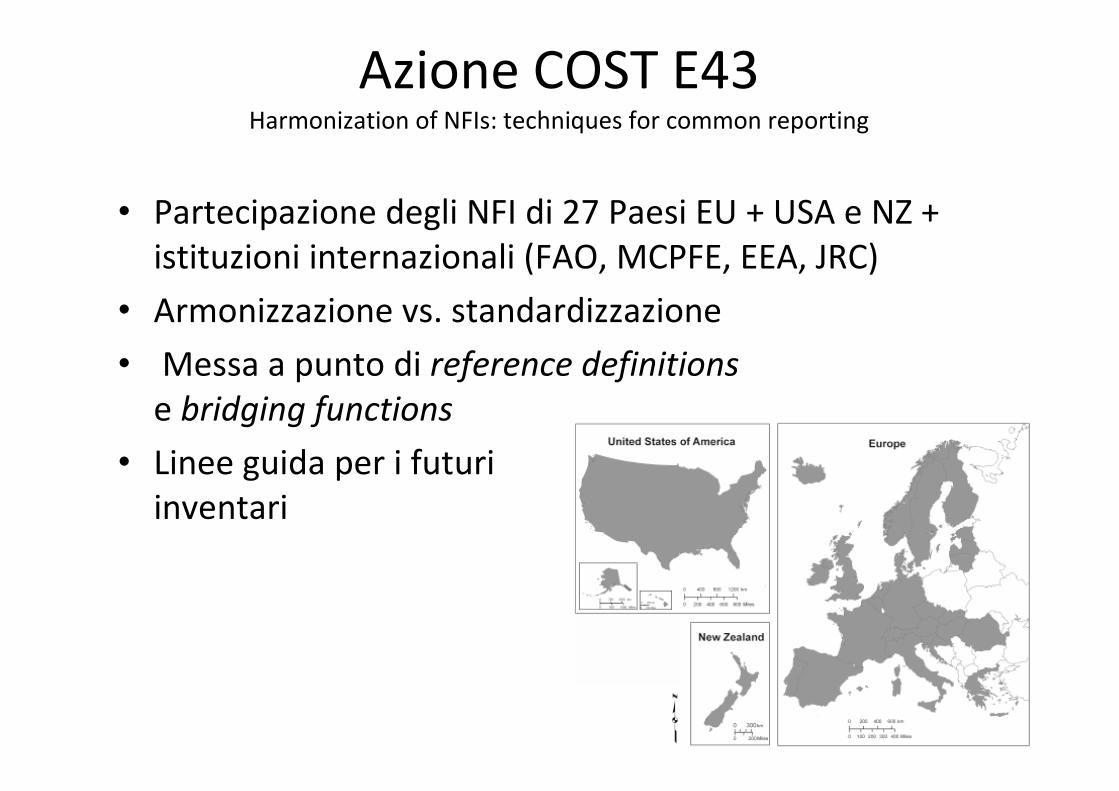
Azione COST E43Harmonization of NFIs: techniques for common reporting
• Partecipazione degli NFI di 27 Paesi EU + USA e NZ + istituzioni internazionali (FAO, MCPFE, EEA, JRC)
• Armonizzazione vs. standardizzazione
• Messa a punto di reference definitions
e bridging functions
• Linee guida per i futuriinventari
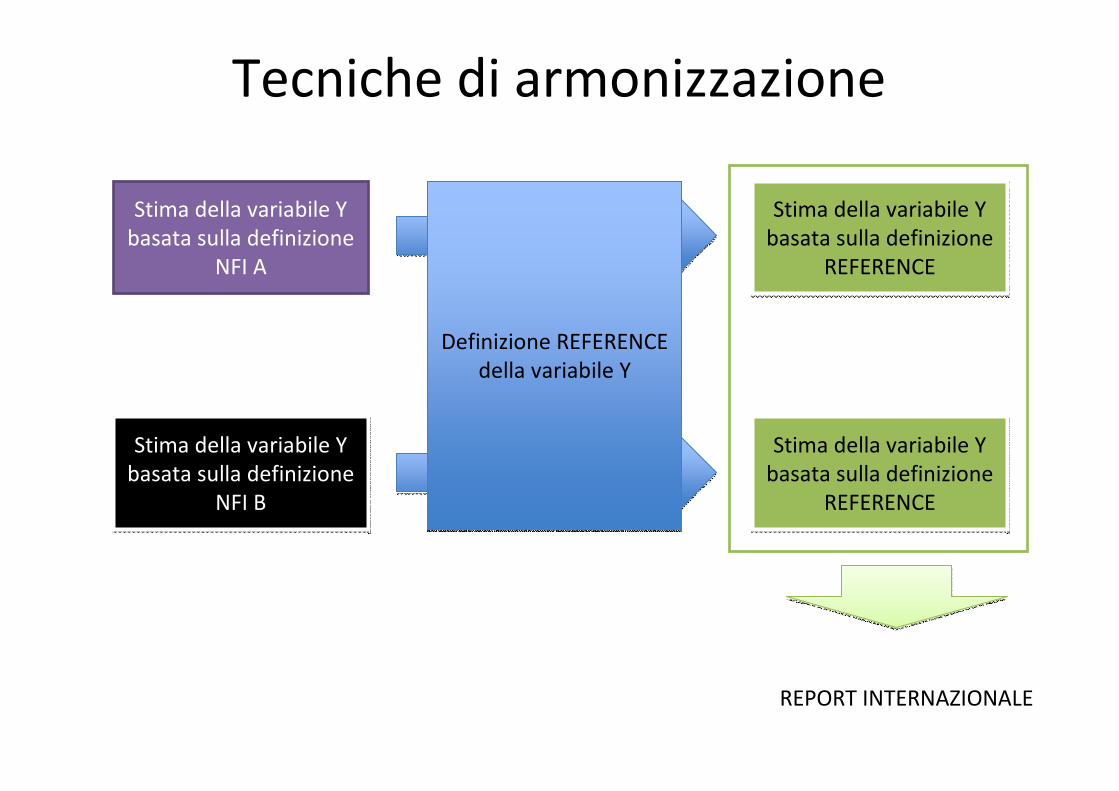
Tecniche di armonizzazione
Stima della variabile Y basata sulla definizione
NFI A
Stima della variabile Y basata sulla definizione
NFI B
Stima della variabile Y basata sulla definizione
NFI B
Stima della variabile Y basata sulla definizione
REFERENCE
Stima della variabile Y basata sulla definizione
REFERENCE
Stima della variabile Y basata sulla definizione
REFERENCE
Stima della variabile Y basata sulla definizione
REFERENCE
REPORT INTERNAZIONALE
Bridging functionBridging function
Bridging functionBridging function
Definizione REFERENCE della variabile Y
Definizione REFERENCE della variabile Y
Scientific
papers
Springer
books
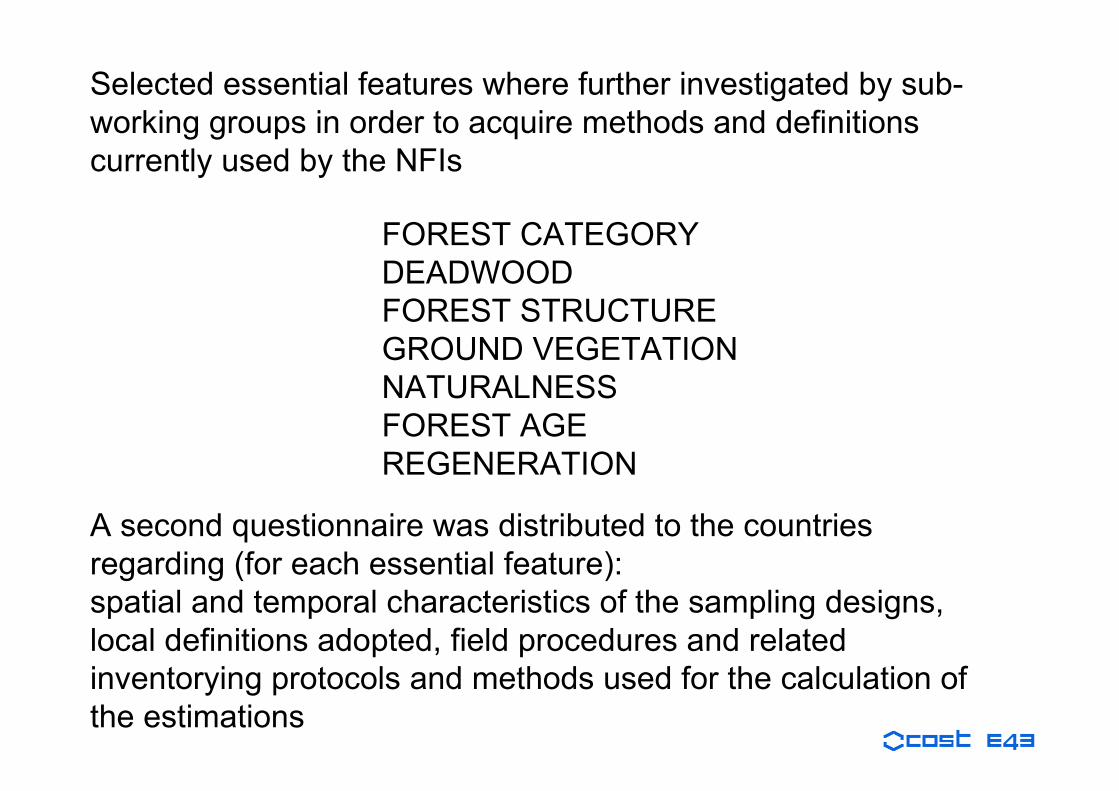
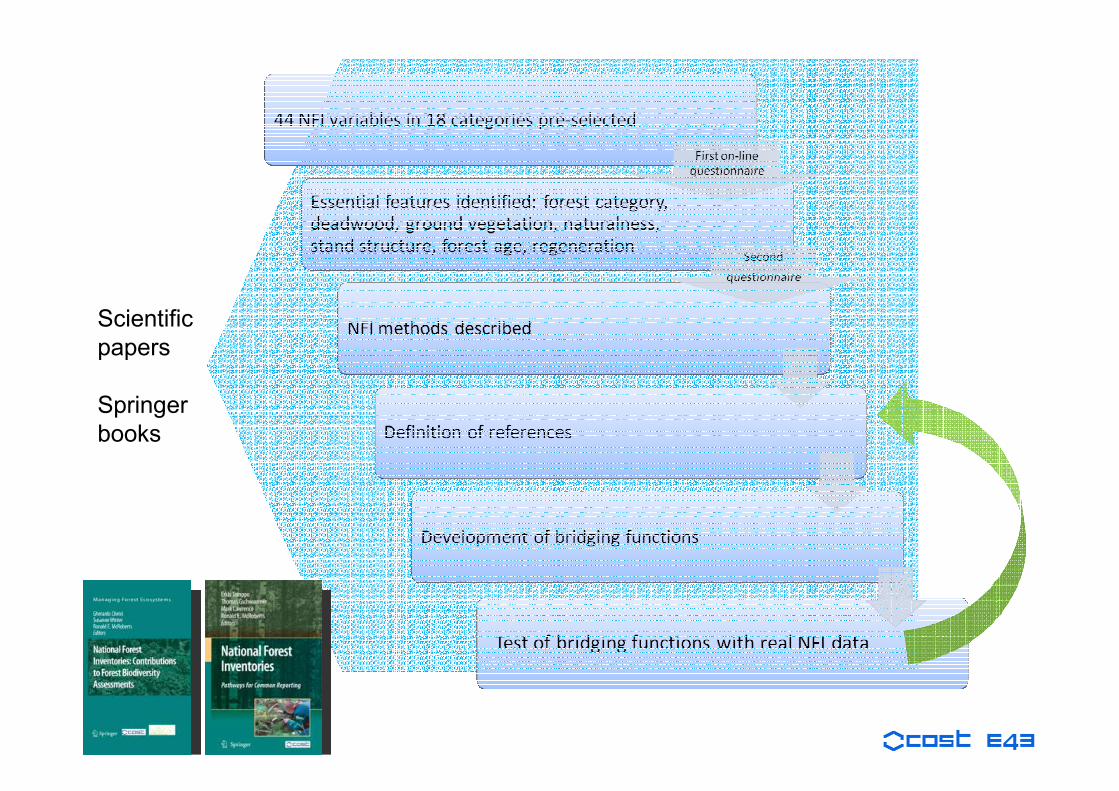
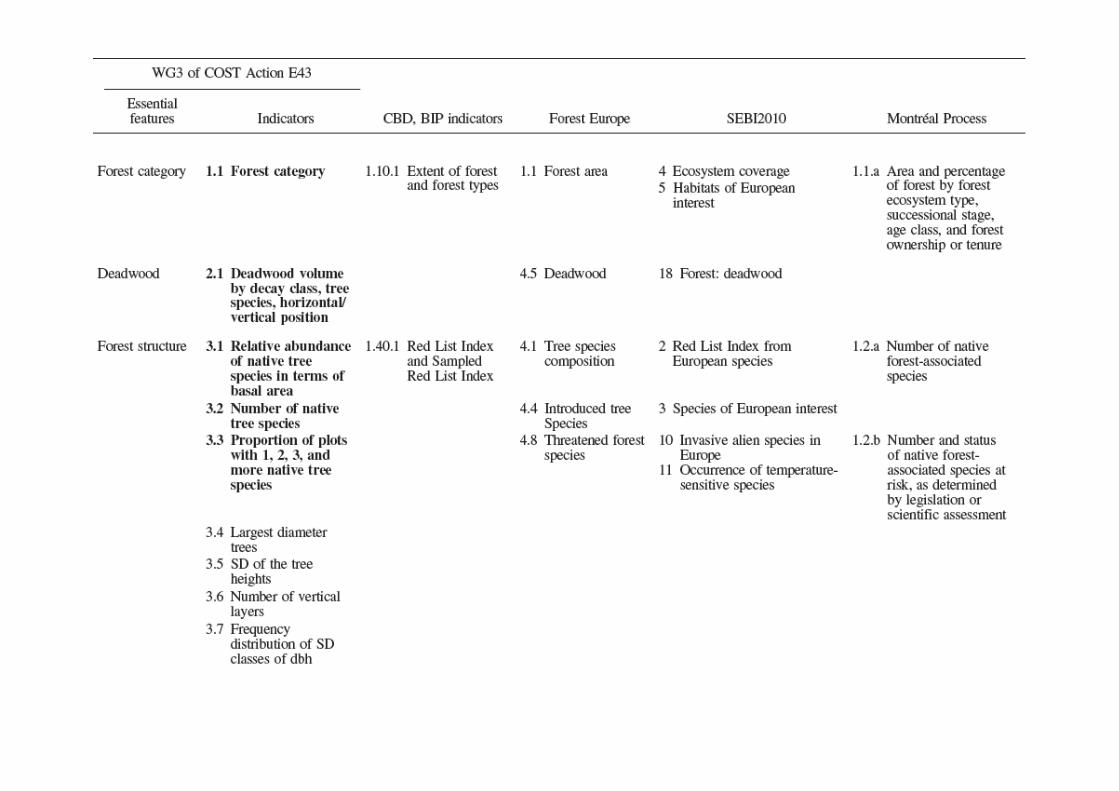
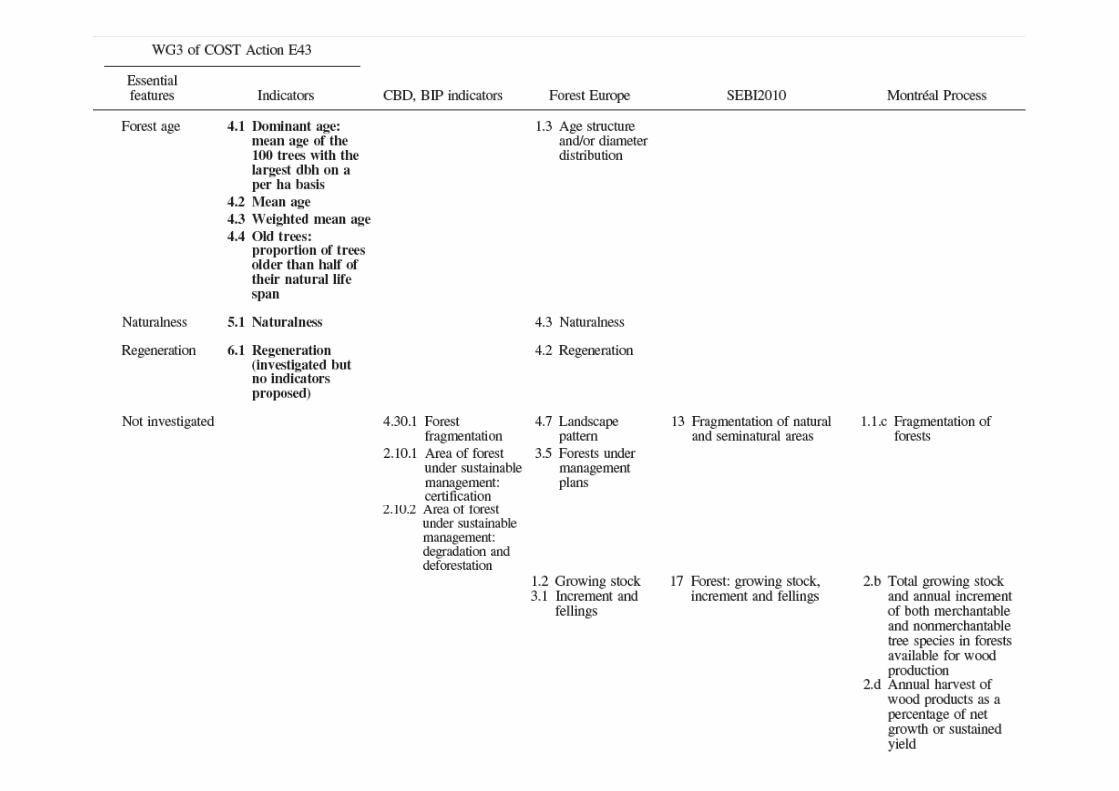
Selected essential features where further investigated by sub-
working groups in order to acquire methods and definitions
currently used by the NFIs
FOREST CATEGORY
DEADWOOD
FOREST STRUCTURE
GROUND VEGETATION
NATURALNESS
FOREST AGE
REGENERATION
A second questionnaire was distributed to the countries
regarding (for each essential feature):
spatial and temporal characteristics of the sampling designs,
local definitions adopted, field procedures and related
inventorying protocols and methods used for the calculation of
the estimations
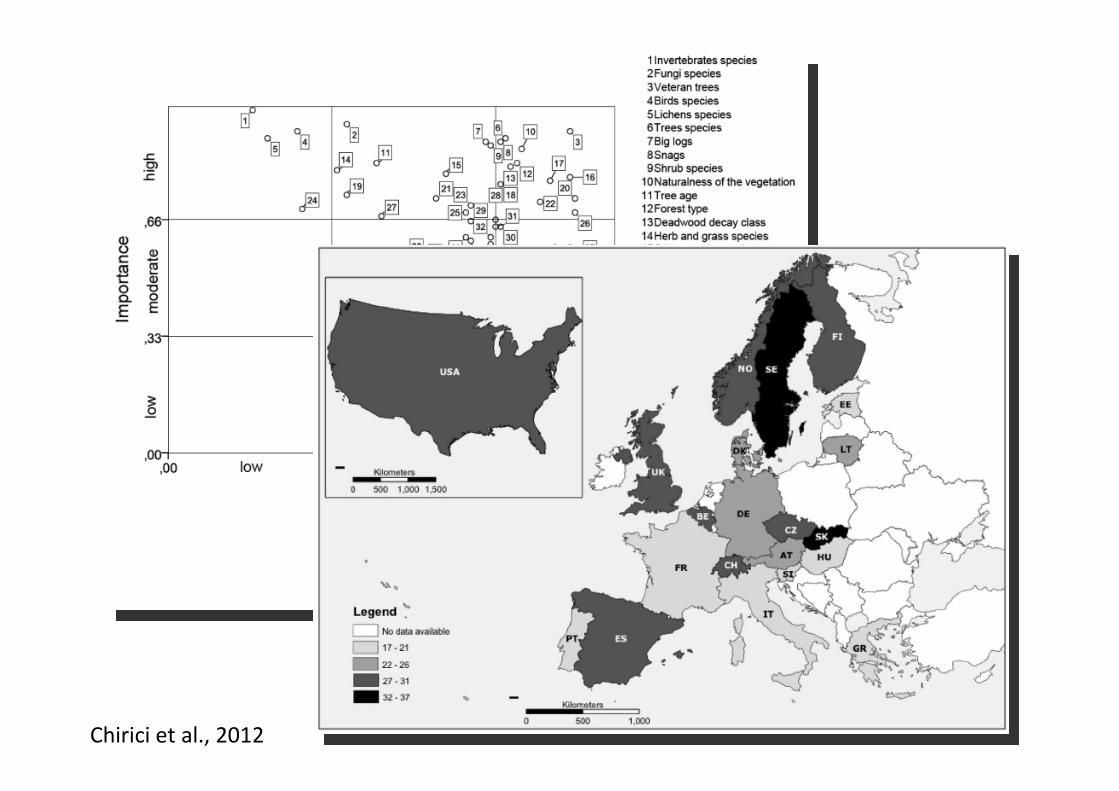
Chirici et al., 2012
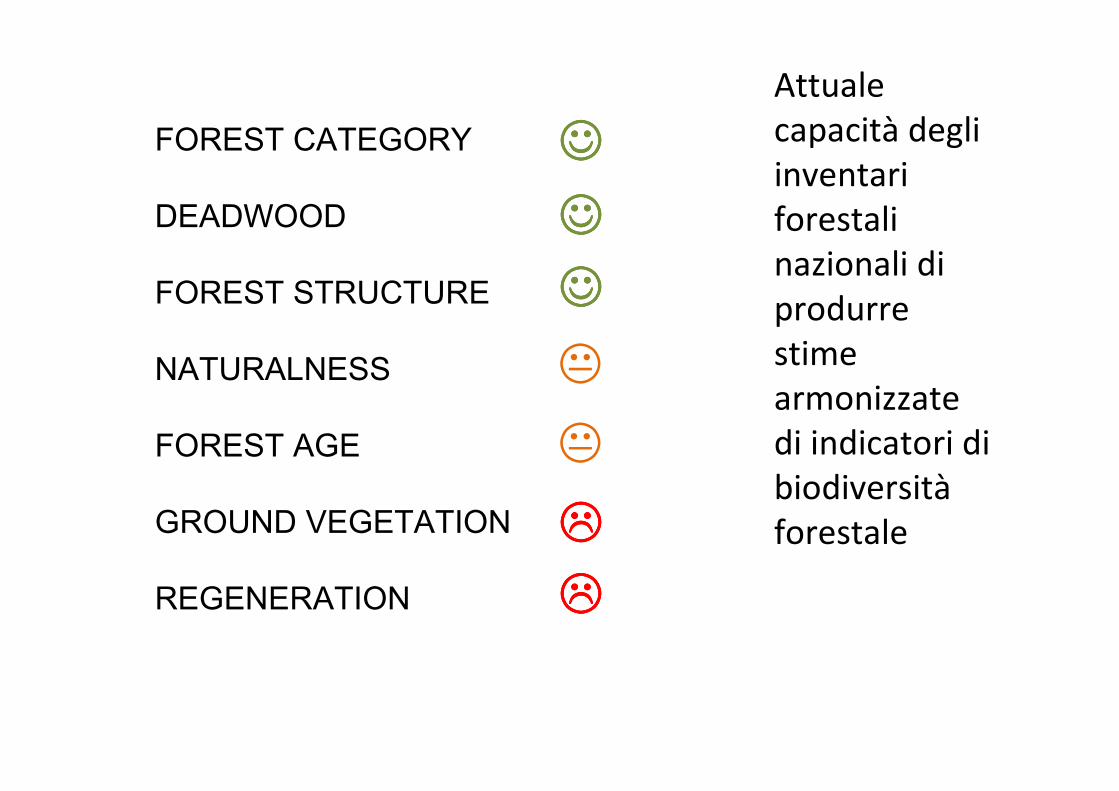
FOREST CATEGORY
DEADWOOD
FOREST STRUCTURE
NATURALNESS
FOREST AGE
GROUND VEGETATION
REGENERATION
☺☺☺☺
�
����
����
☺☺☺☺
☺☺☺☺
�
Attuale capacità degli inventari forestali nazionali di produrre stime armonizzate di indicatori di biodiversitàforestale