Embed Size (px)
Citation preview
1
Estimation of regional stress state and
Young’s Modulus of ground at Torigatayama
limestone mine in Japan
J. Kodama Hokkaido University, Sapporo, Japan
T. Sasaki Sapporo City hall, Sapporo, Japan
D. Fukuda Hokkaido University, Sapporo, Japan
K. Kaneko Horonobe research institute for the subsurface environment,
Horonobe, Japan
Y. Fujii Hokkaido University, Sapporo, Japan
R. Kudo Nittetsu Mining Co., Ltd., Tokyo, Japan

2
Limestone deposits in Japan
• More than 150 limestone mines in operation in 2013
Shikagoe
Hachi-nohe
Garo
Shiriya
Kitagami
Bukoh-zan, Okutama
Abukuma
Kochi Tsukumi
Kumamoto
Hiraodai, Tagawa
Akiyoshi Kuzuu
Atetsu, Taishaku
Akasaka, Ibuki,
Fujiwara
Ome, Tomi
Motobu
Geological age ◆ Mesozoic
● Paleozoic
■ Mesozoic - Paleozoic
Okinawa
Sapporo
Tokyo Kyoto
Fukuoka

3
Domestic production and export
• 150Mt between 1980 and 2013 (Exported to Australia)
• Continue for the next 100 years
1980 1985 1990 1995 2000 2005 20100
50
100
150
200
250
Production Export
Year
An
nu
al
pro
du
cti
on
an
d e
xp
ort
(M
illi
on
to
n)

4
Rock slopes at mine closure
• Height of some will exceed 400 m (Highest is more than 550 m)
• The stability assessment of rock slopes is one of important issues
0 100 200 300 400 500 6000
30
60
90
Slope height (m)
120 slopes in 60 mines
Av
era
ge s
lop
e a
ng
le (
deg
ree)

5
Bukoh mine

6
Concept of slope stability assessment
Slope failure must be prevented
Early detection of unstable state is important
for effective countermeasure
Rock slope is deformed elastically due to mining
Health checkup of a rock slope
Monitoring of slope behavior
Elastic deformation (behavior)
Monitoring
Stable
7
Estimation of elastic deformation
Elastic deformation strongly depends on Young’s modulus and Poisson’s ratio Regional stress
We have proposed a estimation method of them By a back analysis for displacement measurement
Reliability of the proposed method has not
sufficiently cleared.
8
Objectives
The proposed method is applied to Torigatayama limestone mine, Japan
Surface displacement measured with GPS was analyzed
Regional stress and Young’s modulus of the ground are estimated
Reliability of the estimation is discussed

9
Excavation
Mining induced deformation
Due to excavation
GPS station
GPS station

10
GPS station
GPS station
Dumping site
Mining induced deformation
Waste hauling

11
Due to dumping
Mining induced deformation
Dumping site
GPS station
GPS station

12
Mining induced deformation
GPS station
GPS station
Change in regional strain
Change in regional strain
Due to change in regional strain and rigid rotation
Due to excavation
Due to dumping
GPS measurement
Back analysis
Regional s stress state Young’s modulus

13
GPS measurement Estimated by
numerical analysis
Estimated by
numerical analysis
Estimated by
numerical analysis
Estimated by regional
displacement measurement
by GPS
),,;(),,;( 00000
00 EgtEgttE
E
G xuxu ⊿
),;(),;(
),;(),;(
),;(),;(
00
000
00
000
00
000
xyxy
xy
Gxy
yyyy
yy
Gyy
xxxx
xx
Gxx
ttt
ttt
ttt
XYXY
YY
XX
xuxu
xuxu
xuxu
⊿
⊿
⊿
)(xuDue to gravity
release
Due to horizontal
stress release
Unit value
最小二乗法
Estimation of Young’s modulus of ground and regional strain state
Due to excavation
Due to dumping
Due to change in regional strain state
Due to rigid rotation
Depend on
Young’s modulus Independent of
Young’s modulus
ω
⊿
⊿⊿
⊿⊿
⊿⊿
)~,~(
);(
);(
);(
0
0
0
xyt
ttt
ttt
ttt
G
xy
G
xy
G
yy
G
xx
XY
Y
X
,
,
,
xu
xu
x u
),',;(),',;( 000
00 EgtEgttE
E DD
G xuxu ⊿
Ground displacement at when
gravity is applied to a model for
after excavation state at
is unit Young’s modulus
tt ⊿0
g
0E
x
),,;(),,;( 000000 EgtEgtt xuxu ⊿
Displacement obtained from gravity field analysis
0t
Ground displacement at when
gravity is applied to a model for
before excavation state at
is unit Young’s modulus 0E
gx

14
Estimation of change in distance
• Change in distance (expansion or contraction) between two points of m and n
• Displacement due to rigid rotation can be canceled
)(mnr : Unit vector of the line m-n
)()(),( )()()()()( nmmnnm rxxs xuxu
m
n
r (mn)
u(x(m))
u(x(n))

15
Estimation of regional stress
G
xy
G
xy
G
yy
GG
xx
GG
yy
G
yy
GG
xx
GG
xx
c
c
c
2
1
1
])1([
])1[(
)21)(1(1 GG
GEc
)1(22 G
GEc

16
Torigatayama mine
• One of the largest limestone mine in Japan
• Annual production rate is approximately 10 million ton
3km
1km

17
Rock slope in Torigatayama mine
・1ベンチ高さ15m
・最終残壁予想高さ400m
鳥形山最終残壁予想図
400m
Slope height will reach in excess of 400 m for another 100 years
At present At mine closure
150m
18
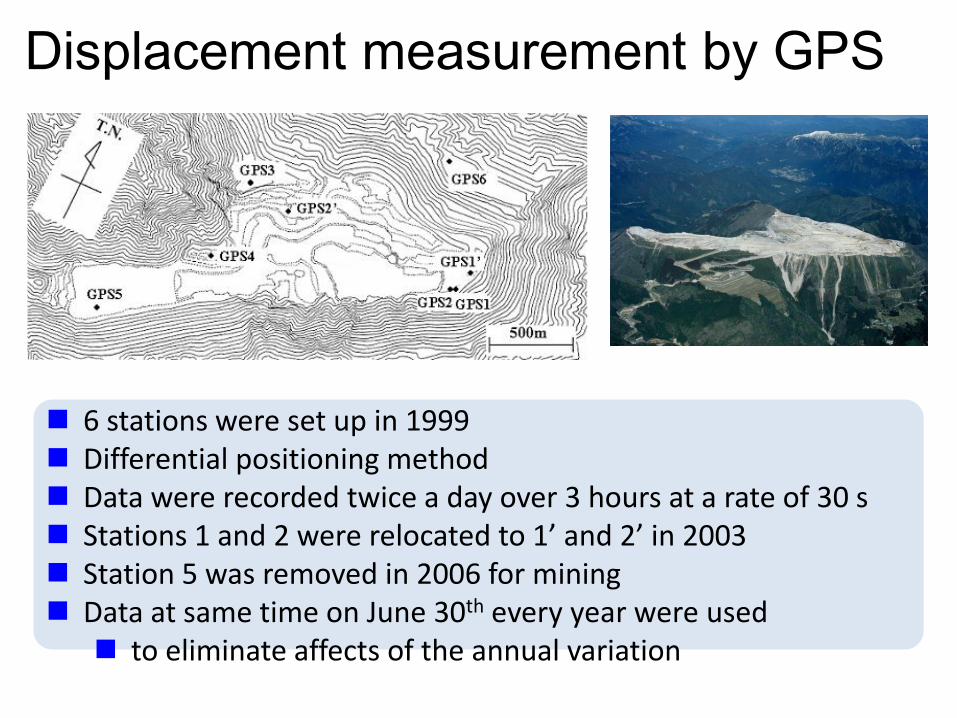
Displacement measurement by GPS
6 stations were set up in 1999 Differential positioning method Data were recorded twice a day over 3 hours at a rate of 30 s Stations 1 and 2 were relocated to 1’ and 2’ in 2003 Station 5 was removed in 2006 for mining Data at same time on June 30th every year were used
to eliminate affects of the annual variation

19
Relative displacements of GPS stations
• Reference point is GPS3
• Direction was nearly unchanged
x
y
TN
(c) GPS6
GPS5
-10 0 100
10
20
x (mm)
y (
mm
)
GPS5
1999
2001
2003
2006
GPS4
0 10 20 30 40 50
0
10
x (mm)
y (
mm
)
GPS4
19992001
20032006
2008
2011
0 10 20 30 40-30
-20
-10
0
x (mm)
y (
mm
)
GPS61999
2001
2003
2006
2008 2011
GPS6

20
The change in distance
Unit: mm
From 1999 to 2003
GPS1
GPS2
GPS3
GPS4
GPS5
GPS6
8.4
0.4 14.6
3.4
1.1
-2.9
-8.2
-10.9 -2.5 -0.4
-17.9
-16.4
-11.4 -12.9
-0.8
Unit: mm
From 2003 to 2006
GPS1’
GPS2’
GPS3
GPS4
GPS5
GPS6 11.6
-25.9
10.5
-4.8
-11.9 -14.6
-10.9 8.8
3.4 -16.6
-14.5
-8.5 -12.1
-3.9
-1.7
Unit: mm
From 2006 to 2011 GPS1’
GPS2’
GPS3
GPS4
GPS6
7.8
-9.6
-8.9 -3.5
10.0
1.7
-3.5 -2.5
-8.5
9.9

21
GPS measurement
),,;(),,;( 00000
00 EgtEgttE
E
G xuxu ⊿
),;(),;(
),;(),;(
),;(),;(
00
000
00
000
00
000
xyxy
xy
Gxy
yyyy
yy
Gyy
xxxx
xx
Gxx
ttt
ttt
ttt
XYXY
YY
XX
xuxu
xuxu
xuxu
⊿
⊿
⊿
)(xuDue to gravity
release
Due to horizontal
stress release
Unit value
Estimation of Young’s modulus of ground and regional strain state
Due to excavation
Due to dumping
Due to change in regional strain state
Due to rigid rotation
ω
⊿
⊿⊿
⊿⊿
⊿⊿
)~,~(
);(
);(
);(
0
0
0
xyt
ttt
ttt
ttt
G
xy
G
xy
G
yy
G
xx
XY
Y
X
,
,
,
xu
xu
x u
),',;(),',;( 000
00 EgtEgttE
E DD
G xuxu ⊿

22
Estimation of regional strain rate
• GPS data from the earth observation network system(GEONET) • Average strain rate between 1999-2011 was analyzed
-2.36×10⁻⁷
+0.30×10⁻⁷
48.9°
Region I
-3.37×10⁻⁷
+0.58×10⁻⁷
49.3°
Region II
8
7
7
19
1078.1
1063.1
1008.2
)(1010.2
xy
xy
yy
xx y
ω
γ
ε
ε
8
7
7
18
1071.7
1046.2
1094.2
)(1051.1
xy
xy
yy
xx y
ω
γ
ε
ε
Analytical region
RegionⅡ
RegionⅠ X
Y

23
GPS measurement
),,;(),,;( 00000
00 EgtEgttE
E
G xuxu ⊿
),;(),;(
),;(),;(
),;(),;(
00
000
00
000
00
000
xyxy
xy
Gxy
yyyy
yy
Gyy
xxxx
xx
Gxx
ttt
ttt
ttt
XYXY
YY
XX
xuxu
xuxu
xuxu
⊿
⊿
⊿
)(xuDue to gravity
release
Due to horizontal
stress release
Unit value
Estimation of Young’s modulus of ground and regional strain state
Due to excavation
Due to dumping
Due to change in regional strain state
Due to rigid rotation
ω
⊿
⊿⊿
⊿⊿
⊿⊿
)~,~(
);(
);(
);(
0
0
0
xyt
ttt
ttt
ttt
G
xy
G
xy
G
yy
G
xx
XY
Y
X
,
,
,
xu
xu
x u
),',;(),',;( 000
00 EgtEgttE
E DD
G xuxu ⊿

24
3-D finite element model
Magnified view of
the mining area
X
Z
Y
11.5 km
2.6 km
4.3 km
Homogeneous, isotropic and elastic Poisson’s ratio is varied between 0.00 and 0.35
Node:1,273,561
Element:1,580,955
Model for 1999

25
Models for mining area
(a) June 1999
(b) June 2003
(c) June 2006
(d) June 2011
L22
0
L190
L220
(b) June 30th,
2003 L330
X
Y
(b)
2003.6
.30
L2
35
L2
05
(a) June 30th,
1999
L330
L2
50
L265
L2
20 L2
50 X
Y
L22
0
L175 L250
L190
L330
L205
L265
(c) June
30th, 2006
2006.6.30
X
Y
L17
5
L19
0 L22
0
L25
0
X
Y
(d) June
30th, 2008
2006.6.30

26
Change in estimation
Little significant change was observed from 2008 Reliability of estimation increases as mining progresses
Contraction
Extension
2000 2004 2008 2012-20
-10
0
10
20
-10
0
10
20
30S
train
(x10
-4)
Year
EG
εGxx
εGyy
γGxy
Young's
modulu
s (G
Pa)ν = 0.10

27
Estimated Young’s modulus and regional strain
Poisson’s ratios less than 0.10 are reasonable Estimated Young’s modulus is between 5 and 10 GPa
Contraction
Extension
0 0.1 0.2 0.3 0.4-20
-10
0
10
0
5
10
15
Str
ain
(x
10
-4)
Poisson's ratio
EG
εGxx
εGyy
γG
xy
Yo
ung
's m
od
ulu
s (G
Pa)
1999 - 2011

28
Estimated regional stress
= 0.00
E = 6.1 GPa
ν=0.10
E = 2.6 GPa
= 0. 05
E = 4.6 GPa
-6.39
-2.30
16.9°
-5.24
-0.42
30.8°
-4.40
+0.62
33.2°
Unit: MPa

29
Estimation of regional strain rate
• GPS data from the earth observation network system(GEONET) • Average strain rate between 1999-2011 was analyzed
-2.36×10⁻⁷
+0.30×10⁻⁷
48.9°
Region I
-3.37×10⁻⁷
+0.58×10⁻⁷
49.3°
Region II
8
7
7
19
1078.1
1063.1
1008.2
)(1010.2
xy
xy
yy
xx y
ω
γ
ε
ε
8
7
7
18
1071.7
1046.2
1094.2
)(1051.1
xy
xy
yy
xx y
ω
γ
ε
ε
Analytical region
RegionⅡ
RegionⅠ X
Y

30
Discussion • Estimation by seismological
technique (Kochi Earthquake Observatory, Japan 1986).
• Maximum compressive direction in 23km depth was between E-W and ENE-WSW
Maximum compressive direction of strain rate was between NW-SE between 1999 and 2011.
N
S
E W
Maximum compressive direction by the proposed method is close to that by seismological technique.
Maximum compressive
direction

31
Discussion
• The proposed method tends to estimate not recent strain increment but total amount of regional strain stored in shallow crust.
N
S
E W

32
The regional strain and stress states and elastic
constants in the district surrounding the Torigatayama
mine in Japan were estimated by a back analysis for
GPS data.
Reliability of the estimation has been improved with an
increase in displacement due to mining progression.
The proposed method tends to estimate total amount of
regional strain stored in shallow crust.
The method can provide a useful basis for predicting
mining-induced deformation and clarifying the effect of
regional stress on rock slope stability.
Conclusions

33
Thank you for
your kind attention

34

35
-13.3×10⁻⁶
+0.85×10⁻⁶
8.0°

36
GPS
measurement
Estimated by gravity 重力場解析
により得られる
採掘変位
広域ひずみ場解析
により得られる
採掘変位
ずり堆積の解析
により得られる
変位
広域ひずみ場解析
により得られる
広域ひずみの変化に伴う変位
GPS座標値から求まる岩盤の回転変位 ω
⊿
⊿⊿
⊿⊿
⊿⊿
)~,~(
),;(
),;(
),;(
000
000
000
xyt
ttt
ttt
ttt
Gxy
xy
xy
Gxy
yy
yy
Gyy
xx
xx
Gxx
XY
Y
X
xu
xu
xu
),,;(),,;( 00000
00 EgtEgttE
E
G xuxu ⊿
),;(),;(
),;(),;(
),;(),;(
00
000
00
000
00
000
xyxy
xy
Gxy
yyyy
yy
Gyy
xxxx
xx
Gxx
ttt
ttt
ttt
XYXY
YY
XX
xuxu
xuxu
xuxu
⊿
⊿
⊿
),',;(),',;( 000
00 EgtEgttE
E DD
G xuxu ⊿
)(xu
逆解析
Displacement due to gravity release
広域ひずみに起因する岩盤変位
参照値
最小二乗法
地盤ヤング率・広域ひずみ・広域ひずみ速度を同定
採掘に伴う岩盤変位
ずり堆積
に伴う岩盤変位
広域ひずみ速度に起因する岩盤変位
回転速度に 起因する 岩盤変位
ヤング率に依存
広域ひずみに依存
ヤング率に依存しない
),,;(),,;( 000000 EgtEgtt xuxu ⊿
期間 において、
採掘後にあたる の解析
モデルに対して、ヤング率を とし、
単位体積重量 を作用させた時の
点 における岩盤変位
tt ⊿0
ttt ⊿~ 00
g
0E
x
期間 において、
採掘前にあたる の解析
モデルに対して、ヤング率を とし、
単位体積重量 を作用させた時の
点 における岩盤変位
0tttt ⊿~ 00
g
0E
x
重力場解析に得られる採掘変位

37
GPS measurement Estimated by
numerical analysis
Estimated by
numerical analysis
Estimated by
numerical analysis
Estimated by regional
displacement measurement
by GPS
),,;(),,;( 00000
00 EgtEgttE
E
G xuxu ⊿
),;(),;(
),;(),;(
),;(),;(
00
000
00
000
00
000
xyxy
xy
Gxy
yyyy
yy
Gyy
xxxx
xx
Gxx
ttt
ttt
ttt
XYXY
YY
XX
xuxu
xuxu
xuxu
⊿
⊿
⊿
)(xuDue to gravity
release
Due to horizontal
stress release
参照値
最小二乗法
Estimation of Young’s modulus of ground and regional strain state
Due to excavation
Due to dumping
Due to change in regional strain state
Due to rigid rotation
Depends on
Young’s modulus Independent of
Young’s modulus
ω
⊿
⊿⊿
⊿⊿
⊿⊿
)~,~(
),;(
),;(
),;(
000
000
000
xyt
ttt
ttt
ttt
Gxy
xy
xy
Gxy
yy
yy
Gyy
xx
xx
Gxx
XY
Y
X
xu
xu
xu
),',;(),',;( 000
00 EgtEgttE
E DD
G xuxu ⊿
Ground displacement at when
gravity is applied to a model for
after excavation state at
is unit Young’s modulus
tt ⊿0
g
0E
x
),,;(),,;( 000000 EgtEgtt xuxu ⊿
Displacement obtained from gravity field analysis
0t
Ground displacement at when
gravity is applied to a model for
before excavation state at
is unit Young’s modulus 0E
gx