Embed Size (px)
Citation preview

Funded by
EU GCC CLEAN ENERGY NETWORK IIJoin us: www.eugcc-cleanergy.net Contact us: [email protected]
Dra. Ana Rosa Lagunas
Director,
Photovoltaic Solar Energy department

Funded by
Agenda
• Context for 2016 Renewable Energies development
• World Energy Mix. Prospects and forecasts– An approach to Renewable Energies (Wind, Biomass, Solar, Other)
• GCC countries
– Opportunities
• Solar photovoltaic energy
– Markets
– Prices and the learning curve
– Components production

Funded by
EU GCC CLEAN ENERGY NETWORK IIJoin us: www.eugcc-cleanergy.net Contact us: [email protected]
Funded by
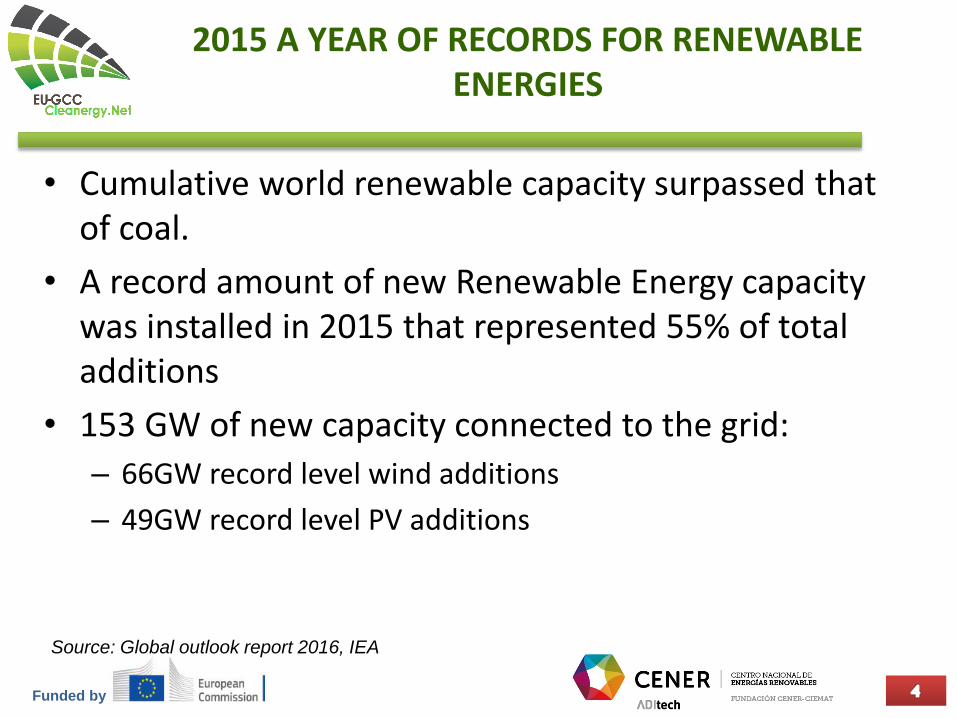
2015 A YEAR OF RECORDS FOR RENEWABLE ENERGIES
• Cumulative world renewable capacity surpassed that of coal.
• A record amount of new Renewable Energy capacity was installed in 2015 that represented 55% of total additions
• 153 GW of new capacity connected to the grid:
– 66GW record level wind additions
– 49GW record level PV additions
Source: Global outlook report 2016, IEA

Funded by
2015 A YEAR OF RECORDS FOR RENEWABLE ENERGIES
• COP21 Paris Agreement gives momentum to renewables
• Local air pollution & energy security are also key drivers
• Global Energy investment confirms transition to renewables
– 17% investment in renewables
– 12% investment in energy efficiency
• In order to continue that trend, policy makers need to provide investors more clarity & certainty

Funded by
New policies underpin a more bullish forecast for renewables
Electricity and renewable generation growth by country/region
Source: Total electricity generation from World Energy Outlook 2016
0
200
400
600
800
1 000
1 200
1 400
China India ASEAN Africa EU28 United States Japan
TWh
Electricity generation growth (2015-21) Renewable generation growth (2015-21)
Funded by
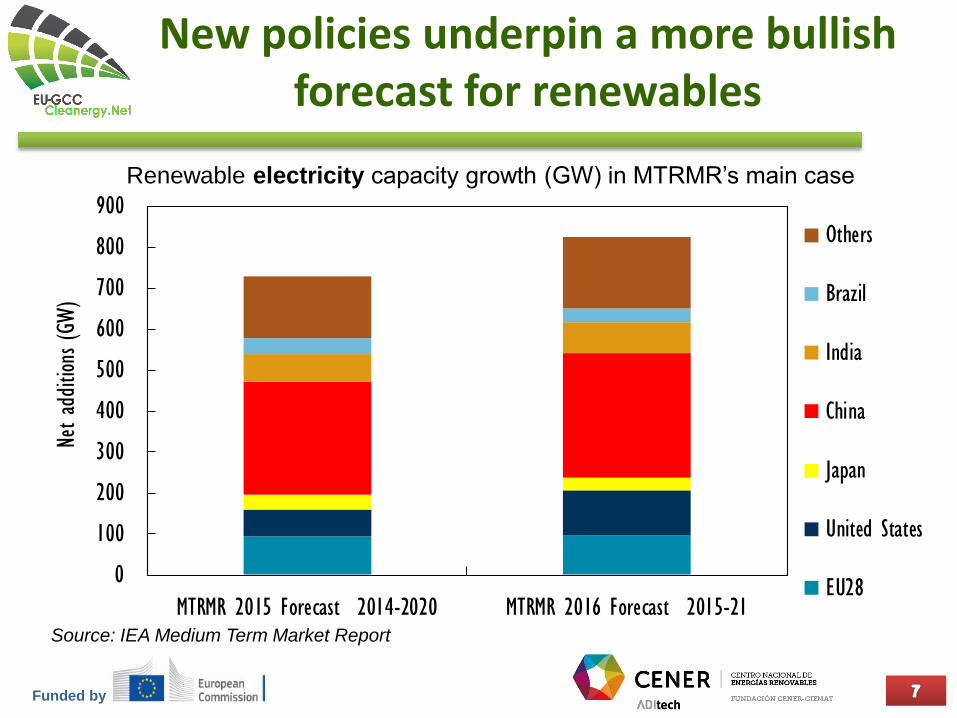
New policies underpin a more bullish forecast for renewables
0
100
200
300
400
500
600
700
800
900
MTRMR 2015 Forecast 2014-2020 MTRMR 2016 Forecast 2015-21
Net ad
ditio
ns (GW
)
Others
Brazil
India
China
Japan
United States
EU28
Renewable electricity capacity growth (GW) in MTRMR’s main case
Source: IEA Medium Term Market Report

Funded by
2015 A YEAR OF RECORDS FOR RENEWABLE ENERGIES
• Other areas of investment for development of Renewable Energies
– Strategies for system integration of variable renewables (wind and solar PV) must be developed and implemented
– Application of renewable energy to heat (industry and buildings)
– Biofuels also as an alternative for automotive industry

Funded by
2015 A YEAR OF RECORDS FOR RENEWABLE ENERGIES: SPECIFIC FOR PV
• More optimistic forecasts in some scenarios suggest that PV could reach 700GW in 2020 (Solar Power Europe, Global Market outlook 2016)
• A new global organization has been created:
Global solar power foundation
– Headquarters in China
– Secretariat in US

Funded by
EU GCC CLEAN ENERGY NETWORK IIJoin us: www.eugcc-cleanergy.net Contact us: [email protected]

Funded by
ESTIMATED RENEWABLE ENERGY SHARE OF GLOBAL FINAL ENERGY CONSUMPTION, 2014
IEA 2016 Key Renewable Trends
REN21 Global Status Report 2016
Funded by
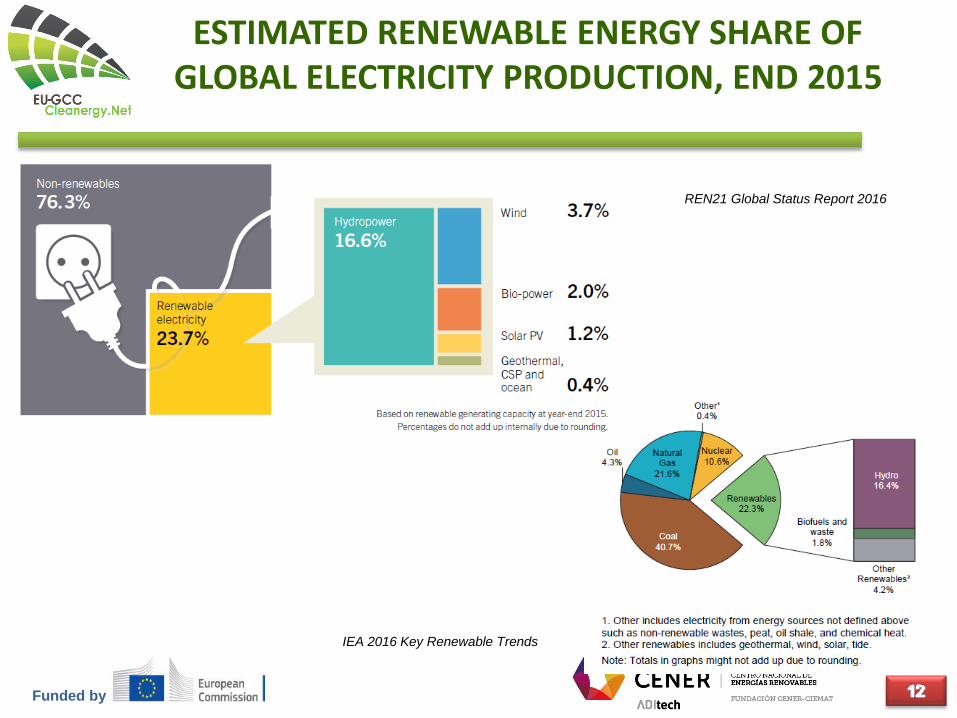
ESTIMATED RENEWABLE ENERGY SHARE OF GLOBAL ELECTRICITY PRODUCTION, END 2015
IEA 2016 Key Renewable Trends
REN21 Global Status Report 2016
Funded by
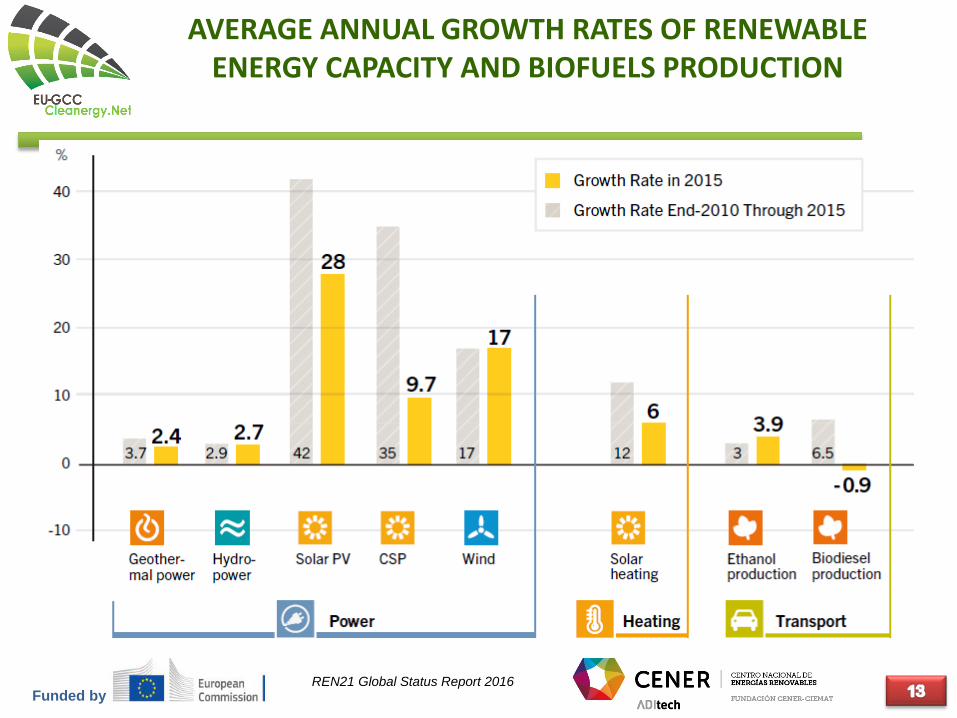
AVERAGE ANNUAL GROWTH RATES OF RENEWABLE ENERGY CAPACITY AND BIOFUELS PRODUCTION
REN21 Global Status Report 2016

Funded by
RENEWABLE POWER CAPACITIES IN WORLD, EU-28, BRICS AND TOP SEVEN COUNTRIES, END-2015
REN21 Global Status Report 2016

Funded by
HYDROPOWER
REN21 Global Status Report 2016

Funded by
WIND POWER
REN21 Global Status Report 2016

Funded by
BIOMASS: GLOBAL BIO-POWER GENERATION
REN21 Global Status Report 2016
Electricity (and heat) generation in Biomass plants

Funded by
BIFUELS GLOBAL PRODUCTION, SHARES BY TYPE AND BY COUNTRY/REGION, 2015
REN21 Global Status Report 2016

Funded by
BIOMASS: BIOFUELS CHARACTERISTICS
• Biofuels could technically substitute oil in all transport modes, with existing power train technologies and existing re-fuelling infrastructures. Use of biomass resources can also decarbonise synthetic fuels, methane and LPG.
– First generation biofuels are based on traditional crops, animal fats, used cooking oils. They include FAME biodiesel, bioethanol, and biomethane.
– Advanced and second generation biofuels are produced from ligno-cellulosic feedstock and wastes. They include bioethanol, HVO, higher alcohols, DME, BTL and biomethane.

Funded by
BIOMASS: REQUIREMENTS FOR ADVANCED BIOFUELS COMPLY (FEEDSTOCK)
From a feedstock and process point of view advanced biofuels should fulfill at least the following criteria:
• Focus on sustainability
• Feedstock production should not compete with food production
• Feedstock production should not harm the environment (e.g. cause deforestation, ground water pollution etc.)
• Feedstock production and fuel processing should be efficient from a GHG point of view.

Funded by
BIOMASS: REQUIREMENTS FOR ADVANCED BIOFUELS COMPLY (END-USE)
The criteria from an end-use point of view:
• At least equivalent end-use quality compared with traditional mineral oil based fuels
• Compatibility with existing refueling infrastructure
• Compatibility with existing vehicles
• Fuel components that do not only provide heating value but also a possibility for reduced harmful exhaust emissions.

Funded by
BIOMASS: BIOFUELS SUMMARY
• The production of biofuels from both food and energy crops (1st Gen) is limited by the availability of land, water, energy and co-product yields, and sustainability considerations, such as the life-time accountancy of CO2 emissions. Second generation biofuels from wastes and residues are also limited by the availability of these materials.
• The development of feedstock potential and of optimized production processes is of the highest priority.
• A supportive policy framework and harmonized standards for biofuels are key elements for the future uptake of sustainable biofuels.

Funded by
GEOTHERMAL ENERGY
• Depends on the type of resource available
– High temperature resources (>150ºC): produce hot water and vapor. Can be used for heating and for electricity (water is given back to the original place).
– Medium- low temperature (30ºC-150ºC): used mostly for district heating, spas, greenhouses… and in some cases for electricity
– Low temperature (<30ºC): for clymatization, usually through a heat pump
• 2,3% growth rate since 1990 until 2015 and stable

Funded by
GEOTHERMAL POWER CAPACITY AND ADDITIONS, TOP 10 COUNTRIES AND REST OF WORLD, 2015
REN21 Global Status Report 2016

Funded by
GEOTHERMAL ENERGY: MAIN USERS
Source: ERA-NET GEOTHERMAL (2015)
• Policy support and more R&D in order to find adequate applications are needed
• Increase of medium-low temperature usersSource: ERA-NET GEOTHERMAL (2015)

Funded by
GEOTHERMAL ENERGY
• There are concerns about environmental impacts
• On the technological side, there are six areas of interest:
– Exploration, measurement and logging
– Drilling technology
– Reservoir creation and enhancement
– Induced seismicity
– Surface technology (heat and electricity production, …)
• Policy support needed
• Effort on R&D

Funded by
ESTIMATED DIRECT AND INDIRECT JOBS IN RENEWABLE WORLDWIDE, BY INDUSTRY

Funded by
ESTIMATED DIRECT AND INDIRECT JOBS IN GCC REGION BY 2030
Source: Renewable Energy Market Analysis: the GCC region (IRENA-2016)
Achieving the GCC Renewable Energy targets could create 140.000 jobs per
year, and up to 210.000 in 2030, 85% Solar (PV and CSP)

Funded by
PPA PRICE OFFERS FOR SOLAR PV AND WIND ONSHORE POWER PLANTS IN DIFFERENT COUNTRIES
REN21 Global Status Report 2016
Source: Solar Power Europe – Global Market Outlook 2016 based on International Energy Agency data
Funded by
EU GCC CLEAN ENERGY NETWORK IIJoin us: www.eugcc-cleanergy.net Contact us: [email protected]

Funded by
EVOLUTION OF GLOBAL ANNUAL SOLAR PV INSTALLED CAPACITY 2000-2015
Solar Power 2016

Funded by
EVOLUTION OF GLOBAL TOTAL SOLAR PV INSTALLED CAPACITY 2000-2015
Solar Power 2016

Funded by
EVOLUTION OF GLOBAL TOTAL SOLAR PV INSTALLED CAPACITY: confidence in numbers?
• From 50 to 59 GW installed in 2015
• Who’s right, who’s wrong ?
• Counting apples, pears… and more ?
• Some rules
• Counting AC numbers is simply wrong
switch to DC or count both.
• What does « installed » means?
Commissioned?
• Production > shipments > installations …
…
Funded by
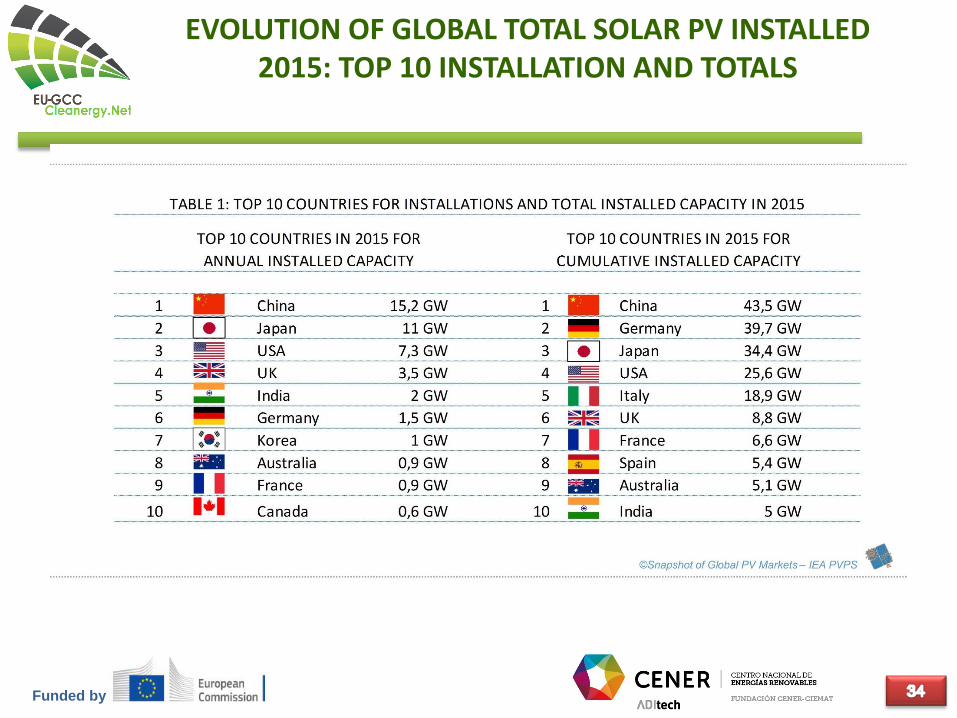
EVOLUTION OF GLOBAL TOTAL SOLAR PV INSTALLED 2015: TOP 10 INSTALLATION AND TOTALS

Funded by
EVOLUTION OF GLOBAL TOTAL SOLAR PV INSTALLED 2015: TOP 1 TO TOP 10
Funded by
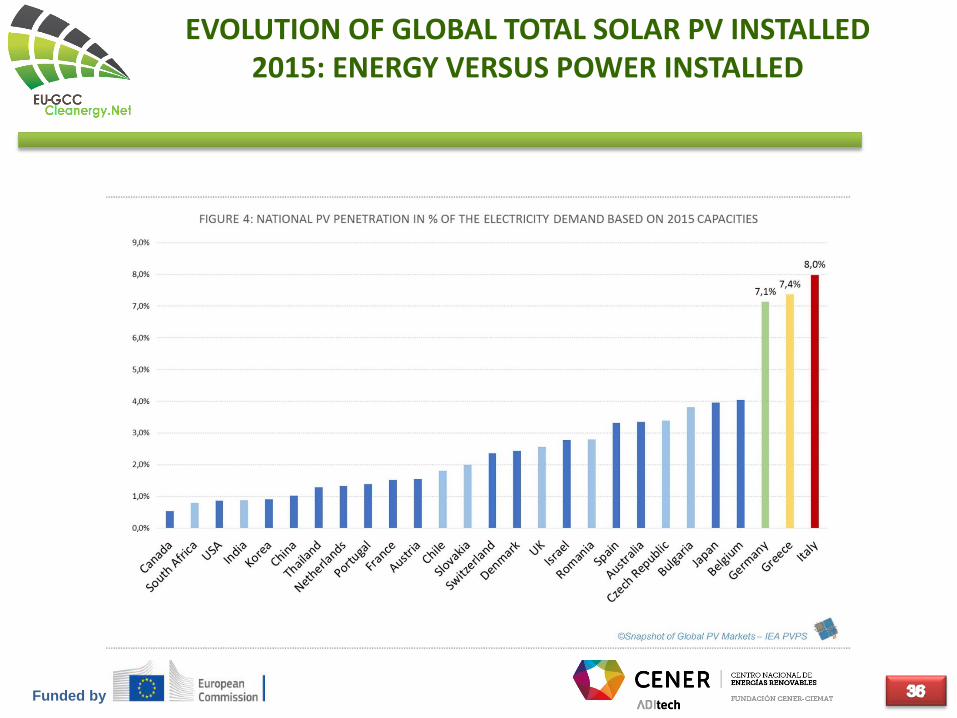
EVOLUTION OF GLOBAL TOTAL SOLAR PV INSTALLED 2015: ENERGY VERSUS POWER INSTALLED

Funded by
EVOLUTION OF GLOBAL TOTAL SOLAR PV INSTALLED: WHAT ABOUT 2016 until 2020?
Source: PV Market Alliance – Becquerel Institute 2016
Funded by
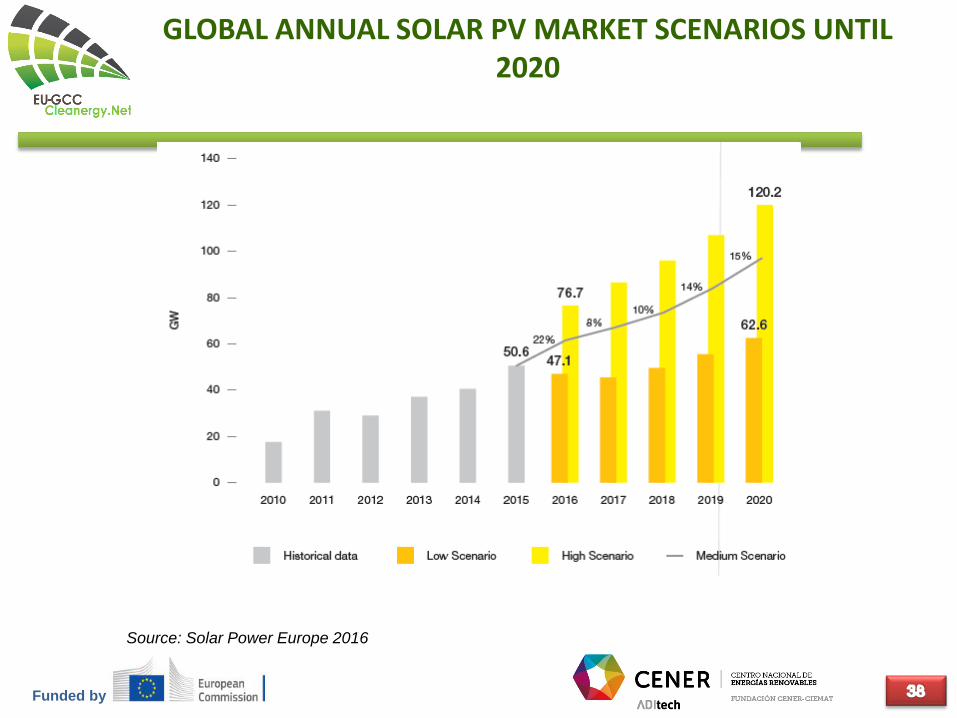
GLOBAL ANNUAL SOLAR PV MARKET SCENARIOS UNTIL 2020
Source: Solar Power Europe 2016
Funded by
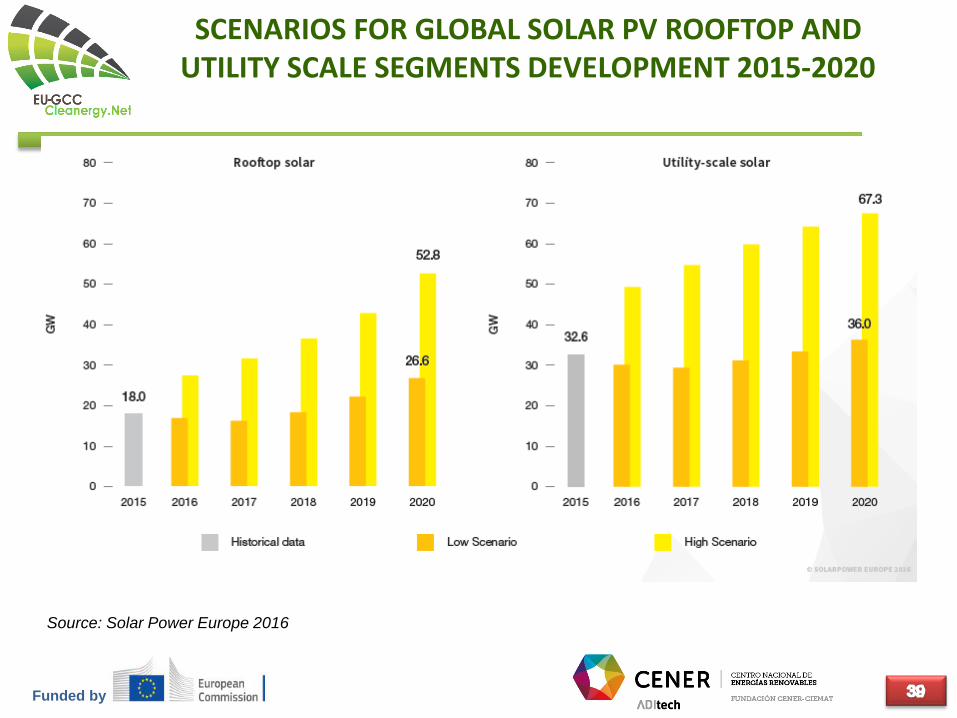
SCENARIOS FOR GLOBAL SOLAR PV ROOFTOP AND UTILITY SCALE SEGMENTS DEVELOPMENT 2015-2020
Source: Solar Power Europe 2016

Funded by
A tale of 2 markets
Distributed PV
Centralized PVProsumers
Producers
Grid injection, PPA,
competition with
utilities generation
business
Self-consumption,
energy effiency, grid
parity, competition
with utilities
distribution business
One technology

Funded by
SCENARIOS FOR GLOBAL SOLAR PV DEVELOPMENT 2015-2020: 2 MARKETS

Funded by
MAIN POLICY DRIVERS FOR SOLAR PV IN 2015
Solar Power 2016
Funded by
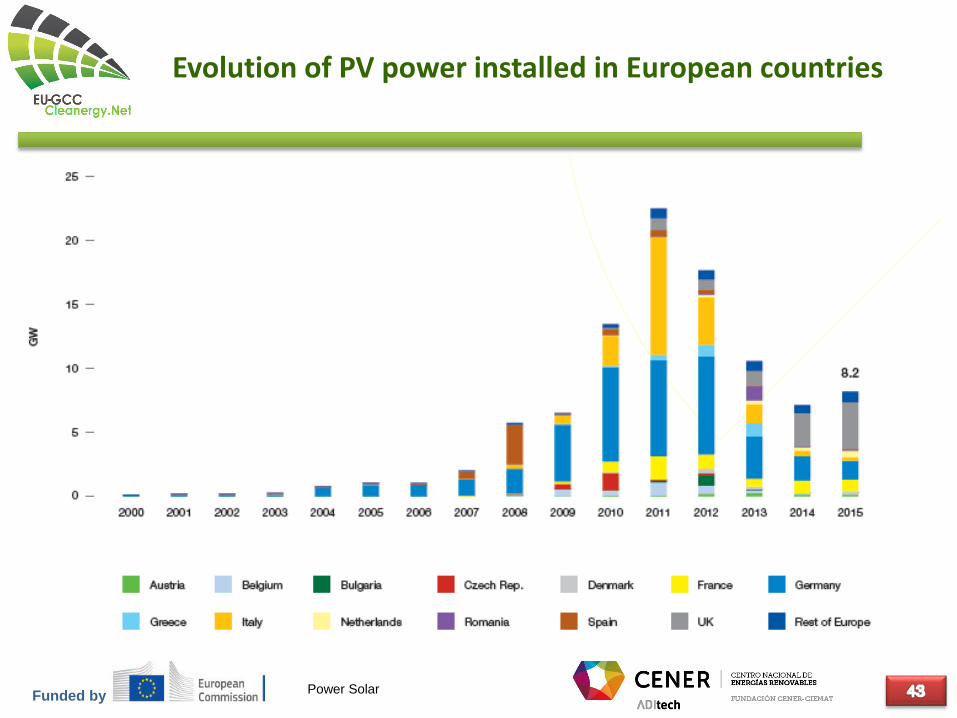
Evolution of PV power installed in European countries
Power Solar

Funded by
Installed PV power type in Europe by country to 2015
Solar Power

Funded by
EU GCC CLEAN ENERGY NETWORK IIJoin us: www.eugcc-cleanergy.net Contact us: [email protected]

Funded by
Production of photovoltaic cells and modules by region
Navigant Consulting and Paula Mints;
graphics PSE AG 2016

Funded by
Production share of cells and photovoltaic modules by region
Navigant Consulting and Paula Mints;
graphics PSE AG 2016

Funded by
Main photovoltaic cell and module companies in 2015
Eurobserver

Funded by
Evolution of the main companies producing cells / modules
IHS Research, CompareMySolar.co.uk r

Funded by
% Annual production: Evolution by technologies
PSE AG 2016
50,6GWp production at 2015
93% was c-Si wafer based, multi-Si, 69%,
7%
69%
24%
Funded by
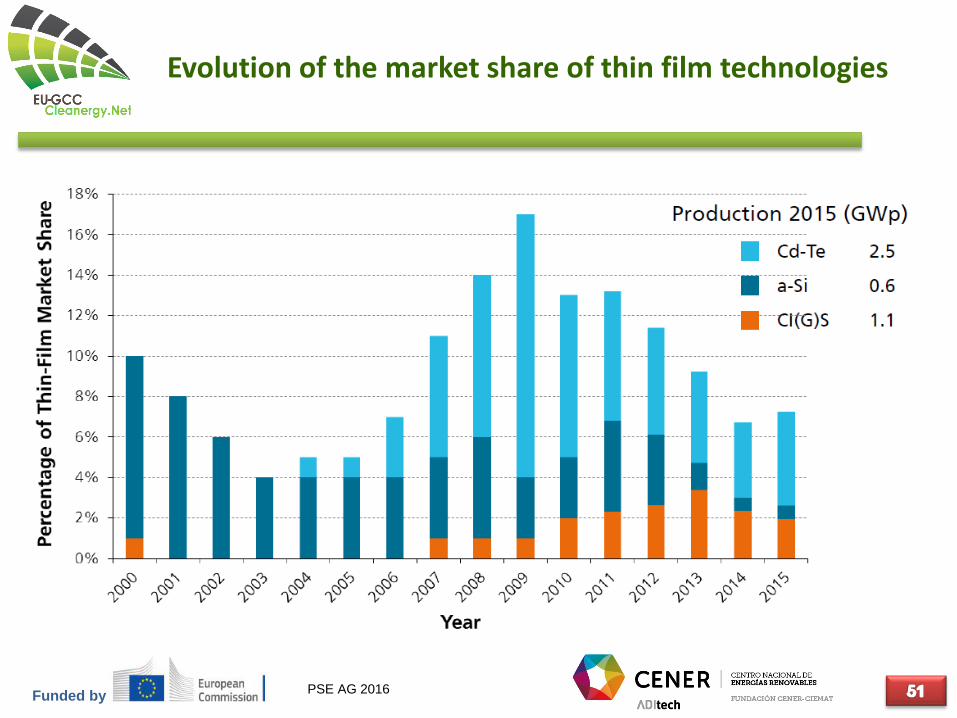
Evolution of the market share of thin film technologies
PSE AG 2016
Funded by
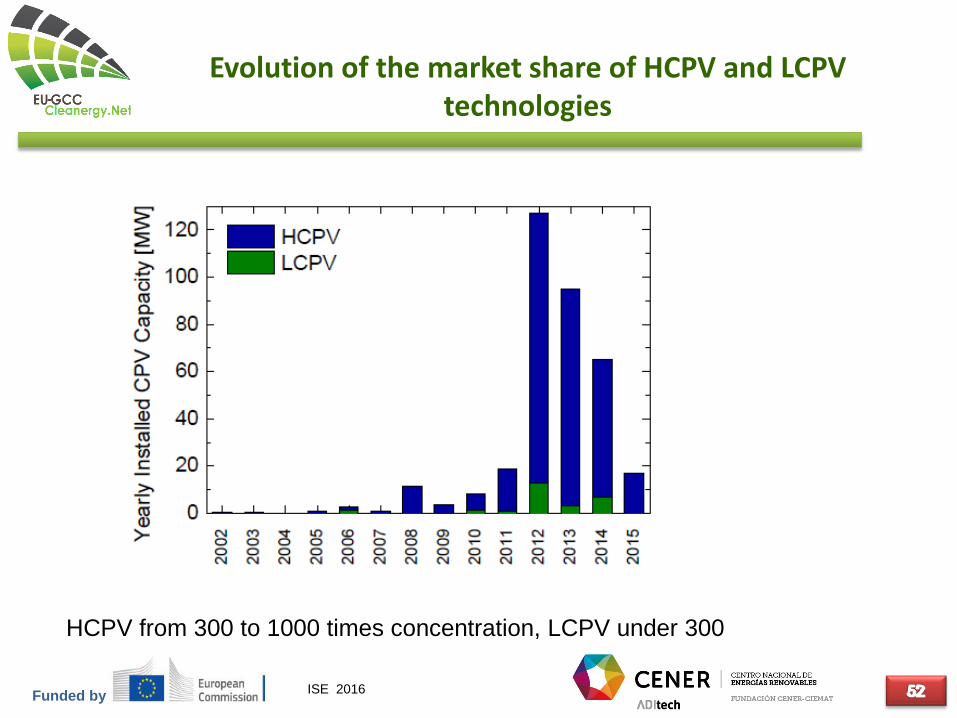
Evolution of the market share of HCPV and LCPV technologies
ISE 2016
HCPV from 300 to 1000 times concentration, LCPV under 300

Funded by
Energy Pay-Back Time for PV and CPV SystemsDifferent Technologies located in Catania, Sicily, Italy

Funded by
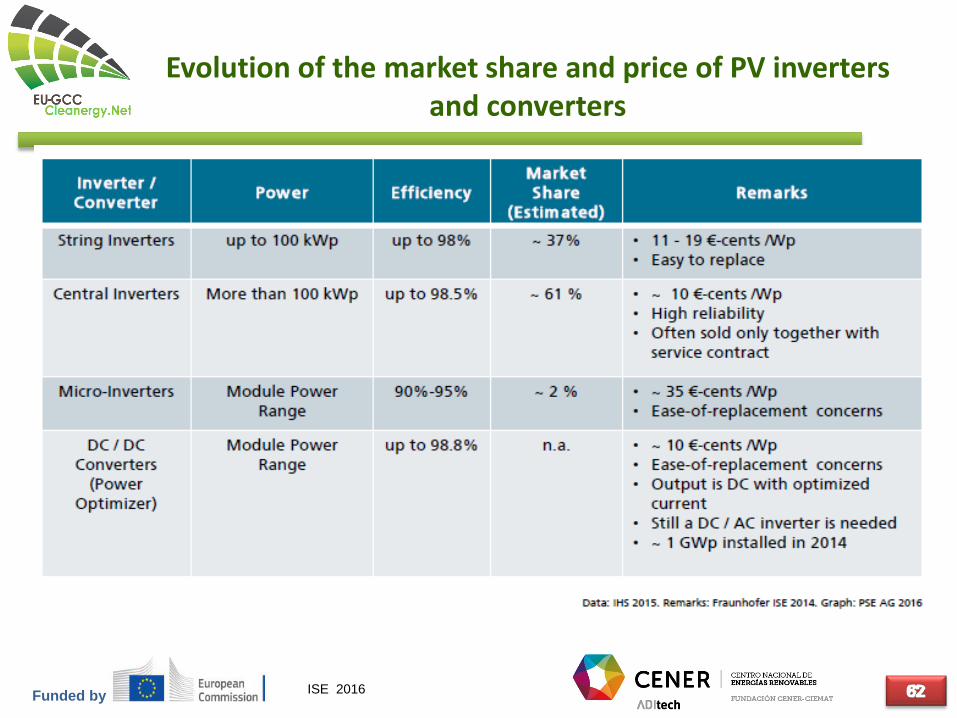
Evolution of the market share and price of PV inverters and converters
ISE 2016

Funded by
EU GCC CLEAN ENERGY NETWORK IIJoin us: www.eugcc-cleanergy.net Contact us: [email protected]

Funded by
Evolution of the average monthly price of modules sold in Europe by technology and country of origin
Manufacturing costs continue to be reduced, although there is a slight slowdown
PvXchange and GTM research

Funded by
EVOLUTION OF MODULES PRICE: THE LEARNING CURVE
PvXchange and GTM research
• The Learning curve concept is an empirical way of
looking at COSTS decrease (due to technology
improvements).
• Has been theorized for semi-conductors well before
PV (BCG)
• Prices vs Costs
• Automation, industrialization, different cost
paradigm in China (cheaper equipment…)…
• Range of costs and prices: LC is perfect for low
prices but what for emerging technologies?
• Modules or cells?

Funded byPVXchange and GTM research
EVOLUTION OF MODULES PRICE: THE LEARNING CURVE

Funded by
EVOLUTION OF MODULES PRICE: THE LEARNING CURVE

Funded byPvXchange and GTM research
MODULES PRICE: PUBLIC DATA AND FORECASTS
Cost reduction based on:
• Polisilicon reduction (thickness)
• Efficiency of PV cell
• Automation and manufacturing
Processes, cell and module
• 20% in 2 years
• In the case of thin film technology
reduction mostly due to efficiency
increase and manufacturing
improvement
Module (33%, 46%, 41%)

Funded byPvXchange and GTM research
MODULES PRICE: PUBLIC DATA AND FORECASTS
Funded by
Evolution of the market share and price of PV inverters and converters
ISE 2016

Funded by
THE COST OF PV ENERGY
PvXchange and GTM research
• We have been speaking about price of components,
however, is the cost of kWh obtained what will make PV
technology competitive
On the technical side:
• Good irradiation conditions (site)
• Optimum design
• Optimum components (modules & BOS)
• Adequate M&O
On the financial side:
• FIT or alternative support policy (or not)
• Banking conditions…

Funded by
PPA PRICE OFFERS FOR SOLAR PV AND WIND ONSHORE POWER PLANTS IN DIFFERENT COUNTRIES
REN21 Global Status Report 2016

Funded by
PPA PRICE OFFERS FOR SOLAR PV AND WIND ONSHORE POWER PLANTS IN DIFFERENT COUNTRIES
REN21 Global Status Report 2016
Source: Solar Power Europe – Global Market Outlook 2016 based on International Energy Agency data