Embed Size (px)
Citation preview

FACTBOOK
2016(Updated on August 4, 2016)

Copyright © ASAHI GROUP HOLDINGS. All rights reserved.1
Contents
Long-Term VisionMedium-Term Management Policy
Asahi’s Overseas Business ……………………………………
Global Beer Market ………………………………………………
Oceania Beverage Business ……………………………………
Oceania Beverage Market ……………………………………
Oceania Alcohol Beverages Business …………………
Malaysian Beverage Business ………………………………
Indonesian Beverage Business ………………………………
International Beer Business …………………………………
Chinese Beer Business …………………………………………
Chinese Beer Market ……………………………………………
Chinese Beverage Business ……………………………………
Chinese Beverage Market ………………………………………
Reference: Liquor Tax ……………………………………………
23
24
Corporate Data
Financial and Management Indices
Group Businesses
Alcohol Beverage Business
Soft Drinks Business
Corporate Philosophy / Corporate Brand Statement / Long-Term Vision ……………………………………………
Medium-Term Management Policy …………………
2
3
Company Overview ……………………………………………
Stock Information ………………………………………………
Main Associate Companies ………………………………
Corporate Governance Structure ………………………
List of Group Production Facilities ……………………
Company History ………………………………………………
4
5
6
7
8
9
Consolidated Financial Statements ……………………
Consolidated Three Months Financial Results ……
Asahi Group at a Glance ……………………………………… 13
Asahi Breweries, Ltd. …………………………………………
Sales Volume by Month in 2014 …………………………
Sales Volume by Month in 2015 …………………………
Japan’s Alcohol Beverages Market ……………………
Beer-Type Beverages: Sales by Container Type and Market Channel ……………………………………………………
14
15
16
17
18
Asahi Soft Drinks Co., Ltd. ……………………………………
LB Co., Ltd. …………………………………………………………
Domestic Soft Drinks Market Data ………………………
Sales by Asahi Soft Drinks ……………………………………
19
20
21
22
Food Business
Asahi Group Foods, Ltd. ………………………………………
Domestic Food Business Market Data …………………
Overseas Business
25
26
27
28
29
30
31
32
33
34
35
36
37
11
12

Copyright © ASAHI GROUP HOLDINGS. All rights reserved.22
Corporate Philosophy / Corporate Brand Statement / Long-Term Vision
The Asahi Group aims to satisfy its customers
with the highest levels of quality and integrity,
while contributing to the promotion of healthy living and
the enrichment of society worldwide.
Corporate Philosophy
Corporate Brand Statement
Long-Term Vision
Always creating new value moves people’s hearts and forms a strong bond. Always imagining a fresh tomorrow moves people’s hearts and helps them shine. Sharing these emotional experiences with as many people as possible—this is the mission of the Asahi Group.
* Kando is an emotion experienced in various ways. It can be an extreme satisfaction, an extraordinary feeling beyond one’s expectations, and/or a sensitively touching and moving sensation.
Vision for Stakeholders
CustomersContinue to create new value based on strengths nurtured in Japan and achieve the No. 1 ranking for customer satisfaction in Japan and each region of the world.
Business partners
Develop relationships with our business connections and alliance partners that enable mutual growth through new value creation.
SocietyContribute to the resolution of social problems through the Group’s businesses in areas such as development of a wholesome food culture.
EmployeesDevelop an environment in which employees experience both personal and corporate growth and can work vigorously.
ShareholdersEnhance corporate value (equity value) through sustained profit creation and shareholder returns.
Share the ‘‘Kando”*
◆ Seek “sustained corporate value enhancement” by pursuing satisfaction for all stakeholders.
As a comprehensive beverage and food business group whose core business is alcohol beverages, aim to be an industry leader in Japan with high value addition as a key area of focus and establish a unique position as a global player that leverages strengths originating in Japan.
◆ Striving to be a corporate group trusted around the world through the Kando of food (deliciousness, happiness and innovation)

Copyright © ASAHI GROUP HOLDINGS. All rights reserved.33
Medium-Term Management Policy
Medium-Term Management Policy
Aiming at Further Development of Management for Corporate Value Enhancement
Key Performance Indicator (KPI) Concept and Guidelines
2015 Result Guidelines for FY2016 to FY2018
Net Sales 1,857.4 Billion yenStable growth from main businesses – Business restructuring + New M&As
Operating Income
135.1 Billion yenExisting businesses (Average annual growth rate in the high single digits) + Impact of new M&As
EPS 166.3 yen Average annual growth of approx. 10%
ROE 8.8% Maintenance and increase to 10% or higher
Financial and Cash Flow Strategy
FY2016 to FY2018 Cumulative Guidelines
Cash Flow・ Generated cash flow: ¥470.0 billion or more (Operating cash flow +
Maximization measures + Assets review)・ Capital expenditures: ¥180.0 to ¥220.0 billion
Investment for Growth・ Active investment in M&As and alliances to acquire foundations for growth (Maximum D/E ratio of approx. 1.0 time acceptable if major capital demands arise)
Shareholder Returns
・ Stable dividend increases with the aim of a dividend payout ratio of 30% (IFRS basis) by FY2018
・ Flexible common stock buybacks taking into account an appropriate balance with investment for growth
*The above indicators take into account the impact of IFRS transition at the end of FY2016.*The calculation basis excludes special factors such as foreign exchange impact and one-off extraordinary items
◆ Strengthening of power of earnings generating by positioning the domestic profit base as the cornerstone of earnings and the overseas business as a growth engine
・ Promotion of innovation and demonstration of leadership in the industry with high value addition and differentiation as key areas of focus
・ Earning structure reforms and business model evolution through business integration and value chain sophistication
・ Acquisition of foundations for growth, mainly in overseas markets, leveraging strengths originating in Japan
◆ Asset and capital efficiency improvement that takes into consideration capital cost・ Capital efficiency improvement with an emphasis on equity spread (ROE - cost of shareholders'
equity)・ Business administration and business portfolio restructuring utilizing ROIC (rate of return on
invested capital) as a performance indicator
◆ Reinforcement of ESG (environmental, social, and governance) initiatives・ Upgrading of “hidden capital assets” such as nature, social and relationship capital, and
personnel and its development toward a CSV (creating shared value) strategy・ Implementation of “active corporate governance” that contributes to the practice of
management to enhance corporate value

Copyright © ASAHI GROUP HOLDINGS. All rights reserved.4
Bond ratings
Corporate Data (Company Overview)
Corporate profile (As of June 30, 2016)
Bond issuesFY2015 net sales by segment
Alcohol Beverages
52.4%
Soft Drinks26.4%
Food6.2%
Overseas13.4%
Others1.6%
Total
1,857.4
Billion yen
As of June 30, 2016
IssuedAmount
(\mn)
Coupon
rate
Date of
maturity
1st Corporate deventure bonds Oct. 21, 2011 30,000 0.52% Oct. 21, 2016
2nd Corporate deventure bonds Oct. 21, 2011 20,000 0.76% Oct. 19, 2018
3rd Corporate deventure bonds Jul. 13, 2012 18,000 0.33% Jul. 13, 2017
4th Corporate deventure bonds Jul. 13, 2012 10,000 0.55% Jul. 12, 2019
5th Corporate deventure bonds Jul. 15, 2014 25,000 0.23% Jul. 12, 2019
6th Corporate deventure bonds Jul. 15, 2014 10,000 0.37% Jul. 15, 2021
7th Corporate deventure bonds May 28, 2015 25,000 0.24% May 28, 2020
8th Corporate deventure bonds May 28, 2015 10,000 0.35% May 27, 2022
As of June 30, 2016
Rating Agency Rating
Rating and Investment Information,Inc A+
Japan Credit Rating Agency, Ltd. AA-
Trade Name :ASAHI GROUP HOLDINGS, LTD.
Head Office :1-23-1, Azumabashi Sumida-ku, Tokyo 130-8602, Japan
Date of Establishment : September 1. 1949
President and Representative Director, COO :Akiyoshi Koji
Number of group companies :A Number of consolidated subsidiaries:113
Non-consolidated subsidiaries subject to
application of the equity method:2
Number of companies sbject to
application of the equity method:123
Paid-In Capital :182,531million
Net sales :1,857,418million yen (Consolidated)
Number of Employees :21,897 (Consolidated)
Security code :2502
Stock Exchange Listings : Tokyo Stock Exchange, Osaka Securities Exchange
Number of Shares of Common Stock Issued :483,585,862
Unit amount of stocks :100 shares
Number of Shareholders :105,455
Transfer Agent and Registrar
Stock Transfer Agent: Sumitomo Mitsui Trust Bank, Limited
Fiscal Year-End Date :December 31, on an annual basis
Annual Meeting of Stockholders :March

Copyright © ASAHI GROUP HOLDINGS. All rights reserved.5
Note: Treasury stock is included in “Individuals, others.”
Share price chart
Major shareholdersShareholder composition
Corporate Data (Stock Information)
Share price range
(As of December 31, 2015)
Number of Shares
(in thousands)
Percentage of
voting Rights(%)
29,208.4 6.4%
20,579.2 4.5%
Asahi Kasei Corporation 18,785.3 4.1%
The Dai-ichi Life Insurance Company, Limited 16,920.0 3.7%
Fukoku Mutual Life Insurance Company 15,500.0 3.4%
Sumitomo Mitsui Banking Corporation 9,028.0 2.0%
Sumitomo Mitsui Trust Bank, Limited 8,126.0 1.8%
6,637.4 1.4%
6,381.8 1.4%
6,236.4 1.4%
Total 137,402.6 30.0%
*Treasury s tock of 25.68 mi i l ion shares i s excluded in preparing the l i s t of major
THE BANK OF NEW YORK MELON SA/NV 10
JPMorgan Securities Japan Co., Ltd.
The Master Trust Bank of Japan, Ltd.
(Trust Account)
Japan Trustee Services Bank, Ltd. (Trust Account)
Shareholder Name
STATE STREET BANK WEST CLIENT - TREATY 505234
37.7 37.0 36.5 38.7 38.4
26.5 28.0 30.1 28.8 28.7
16.5 15.8 14.7 14.2 14.9
16.2 16.7 16.3 15.6 15.1
3.2 2.5 2.5 2.7 2.9
0%
20%
40%
60%
80%
100%
'11/12 '12/12 '13/12 '14/12 '15/12
Financial institutions Foreign corporations Individuals, others
Other corporations Securities companies
'10/12 '11/12 '12/12 '13/12 '14/12 '15/12
Share price(yen、FY)
Year High 1,830 1,724 1,944 2,996 3,915 4,380
Year Low 1,427 1,314 1,625 1,797 2,537 3,524
Number of issued stock(1,000 shares) 4,835,858 4,835,858 4,835,858 4,835,858 4,835,858 4,835,858
Treasury stock (1,000 shares) 182,200 179,500 176,114 213,525 209,840 256,762
EPS(yen, consolidated) 114.1 118.4 122.8 135.7 148.9 166.3
Divedends per share(yen, non-cosolidated) 23.0 25.0 28.0 43.0 45.0 50.0
Number of shareholders 131,262 123,931 120,251 109,543 108,522 106,712
Source : Euroland

Copyright © ASAHI GROUP HOLDINGS. All rights reserved.6
Corporate Data (Main Associate Companies)
Asahi Beer (China) Investment Co., Ltd.
Beijing Beer Asahi Co., Ltd.
Yantai Beer Tsingtao Asahi Co., Ltd.
Shangdong Asahi Green Source Hi-Tech
Farm Co., Ltd.
Shangdong Asahi Green Source Milk
Products Co., Ltd.
Tsingtao Brewery Co., Ltd. ★
Shenzhen Tsingtao Beer Asahi Co., Ltd. ★
Tingyi-Asahi Beverages Holding Co. Ltd. ★
Asahi Holdings (Australia) Pty Ltd
Schweppes Australia Pty Limited
Independent Liquor (NZ) Limited
Asahi Premium Beverages Pty Ltd
The Better Drinks Co Limited
Mountain H2O Pty Ltd
Masuda Co., Ltd.
Asahi Food Create, Ltd.
NADAMAN CO., LTD.
ASAHI BEER FEED Co., Ltd.
Hokkaido Nikka Service Co., Ltd.
Sendai Nikka Service Co., Ltd.
Asahi Beer Communications, Ltd. ★
Asahi Beer U.S.A., Inc.
Lotte Asahi Co., Ltd.
The Nikka Whisky Distilling Co., Ltd.
Sainte Neige Wine Co., Ltd.
Satsumatsukasa Shuzo Co., Ltd.
Commissioned processing of malt
Alcoholic beverage sales (U.S. and South Korea)
Alco
ho
l Beverages
Soft D
rinks
Foo
dO
verseas
Oth
er
Asahi Breweries, Ltd.
Asahi Soft Drinks Co., Ltd.
Calpis Co., Ltd.
Asahi Calpis Beverage Co., Ltd.
Asahi Orion Calpis Inryo Co., Ltd.
Asah
i Gro
up
Ho
ldin
gs, Ltd. (p
ure
ho
ldin
g com
pan
y)
Asahi Group Holdings Southeast Asia Pte. Ltd.
Permanis Sdn. Bhd.
Etika Dairies Sdn. Bhd.
PT. Asahi Indofood Beverage Makmur
PT. Indofood Asahi Sukses Beverage ★
Asahi Loi Hein Co., Ltd
LB Co., Ltd.
Asahi Group Foods, Ltd.
Asahi Food & Healthcare Co., Ltd.
Wakodo Co., Ltd.
Amano Jitsugyo Co., Ltd.
Asahi Beer Malt, Ltd.
Asahi Logistics Co., Ltd. East Japan AB Cargo Co., Ltd.West Japan AB Cargo Co., Ltd.
Buckinghamshire Golf Co., Ltd.
Asahi Draft Marketing, Ltd.
ENOTECA CO., Ltd
Asahi Calpis Wellness Co., Ltd.
(Southeast Asia)
(Oceania)(China)
(United Kingdom)
Alcoholicbeveragesales
Guidance on draft beer maintenance services, etc. (outsourced)
Alcoholic and other beverage sales
Consignment production of low-alcohol beverages
Consignment production of beverages
Management of product transportation and distribution centers (outsourced)
Unmarked: Consolidated subsidiaries★: Equity-method affiliates
Note: In addition to the above, Asahi Professional Management Co., Ltd. (a consolidated subsidiary) manages some of the key head office functions of Asahi Group companies in areas such as finance and IT as a holdings function company. It also handles indirect business services that are common to Group companies such as payroll, benefits and accounting, concentrating these services in one place and raising efficiency. Asahi Business Solutions Co., Ltd. (an affiliate accounted for by the equity method) undertakes information processing on consignment for the entire Asahi Group. Asahi Group Engineering Co., Ltd. (an unconsolidated subsidiary accounted for by the equity method) designs and produces manufacturing equipment.
Schematic Diagram of the Asahi Group’s Main Companies and Businesses (As of June 30, 2016)

Copyright © ASAHI GROUP HOLDINGS. All rights reserved.77
Corporate Data (Corporate Governance Structure)
Directors 10 Outside directors: 3
Auditors 5 Outside auditors: 3
Corporate Officers
9 Five double as directors
Nomination Committee
4 Outside directors: 2
Compensation Committee
4 Outside directors: 2
Corporate governance structure (As of June 30, 2016)
Compensation for directors and auditors (FY2015)
(Millions of yen)
Bas ic amout Bonuses Total
Internal directors (3 directors) 220.3 84.4 304.7
Outs ide directores (3 directors) 31.2 14.4 45.6
Internal corporate auditors (3 auditors) 63.7 - 63.7
Outs ide corporate auditors (4 auditors) 32.4 - 32.4
Note: Based on the Integrated Report 2015

Copyright © ASAHI GROUP HOLDINGS. All rights reserved.8
Indonesia Soft Drink Business : 21 factories
MalaysiaSoft Drink Business : 4 factories
MyanmarSoft Drink Business : 2 factories
VietnamSoft Drink Business: 1 factory
Oceania Soft Drink Business : 10 factories
(Australia: 9, NZ: 1)Alcohol Beverage Business : 2 factories
(Australia: 1, NZ: 1)
U.S.Feed Business : 1 factory
ThailandSoft Drink Business : 1 factory
ChinaBeijing Beer Asahi Co., Ltd.: 1 breweryYantai Beer Tsingtao Asahi Co., Ltd.:
1 breweryShangdong Asahi Green Source Milk
Products Co, Ltd. : 1 factory
Overseas subsidiaries and number of production bases (As of June 30, 2016)
Corporate Data (List of Group Production Facilities)
Domestic subsidiaries and No. of production bases (As of June 30, 2016)
Main Products and Operations LocationStart of
Operations
Asahi Breweries, Ltd. (8 breweries)
1 Hokkaido Brewery Beer, happoshu, l iqueurs Sapporo, Hokkaido Pref. 1966
2 Fukushima Brewery Beer, happoshu, l iqueurs, beer-taste beverages Motomiya, Fukushima Pref. 1972
3 Ibaraki Brewery Beer, happoshu, l iqueurs, bottled water Moriya, Ibaraki Pref. 1991
4 Kanagawa Brewery Beer, happoshu, l iqueursMinami Ashigara, Kanagawa
Pref.2002
5 Nagoya Brewery Beer, happoshu, l iqueurs Nagoya, Aichi Pref. 1973
6 Suita Brewery Beer, happoshu, l iqueurs, beer-taste beverages Suita, Osaka Pref. 1891
7 Shikoku Brewery Beer, happoshu, l iqueurs Saijo, Ehime Pref. 1998
8 Hakata Brewery Beer, happoshu, l iqueurs Fukuoka, Fukuoka Pref. 1921
The Nikka Whisky Distil l ing Co., Ltd. (7 factories)
9 Hokkaido Factory Unblended whiskey Yoichi, Hokkaido Pref. 1934
10 Hirosaki Factory Cider, syrup Hirosaki, Aomori Pref. 1960
11 Sendai Factory Unblended whiskey, shochu Sendai, Miyagi Pref. 1969
12 Tochigi Factory Aging and blending of whiskey Sakura, Tochigi Pref. 1977
13 Kashiwa Factory Fil l ing of whiskey and shochu bottles, RTD low-alcohol beverages Kashiwa, Chiba Pref. 1967
14 Nishinomiya Factory Kegged “sour” products Nishinomiya, Hyogo Pref. 1959
15 Moji Factory Shochu, Fil l ing of undistil led shochu and whisky, umeshu plum liqueur Kitakyushu, Fukuoka Pref. 1914
Sainte Neige Wine Co., Ltd. (1 winery)
16 Sainte Neige Winery Wine, organic wine Yamanashi, Yamanashi Pref. -
Satsumatsukasa Shuzo Co., Ltd. (1 distil lery)
17 Satsuma Tsukasa Distil lery Singly distil led shochu Aira, Kagoshima Pref. -
Asahi Soft Drinks Co., Ltd. (5 factories)
18 Fujisan Factory Tea, mineral water Fujinomiya, Shizuoka Pref. 2001
19 Hokuriku Factory WONDA canned coffee, etc. Shimoniikawa, Toyama Pref. 1994
20 Akashi Factory Mitsuya Cider , WONDA , tea, RTD low-alcohol beverages, etc. Akashi, Hyogo Pref. 1990
21 Rokko Factory Mineral water Kobe, Hyogo Pref. 2010
22 Fujisan Sensui Factory Mineral water Fujiyoshida, Yamanashi Pref. 1990
Calpis Co., Ltd. (2 factories)
23 Okayama Factory Calpis , Calpis Water , Mitsuya Cider, etc. Soja, Okayama Pref. 1968
24 Gunma Factory Calpis , Calpis Water , RTD low-alcohol beverages, butter, etc. Tatebayashi, Gunma Pref. 1972
LB Co., Ltd. (2 factories)
25 Hasuda Factory Tea, soft drinks, and other chilled products Hasuda, Saitama Pref. -
26 Tokai Factory Black vinegar drinks and other products for home delivery Tokai, Aichi Pref. -
Asahi Food & Healthcare Co., Ltd. (4 factories)
27 Ibaraki Factory Dietary supplements, etc. Hitachiomiya, Ibaraki Pref. -
28 Osaka Factory EBIOS , etc. Suita, Osaka Pref. -
29 Tochigi Factory Yeast extract, etc. Shimotsuke, Tochigi Pref. -
30 Nippon Freeze Drying Co., Ltd. Freeze-dried foods Azumino, Nagano Pref. -
Wakodo Co., Ltd. (2 factories)
31 Tochigi Factory Infant formula, baby food, foods for vending machine, etc. Sakura, Tochigi Pref. -
32Wako Food Industry Co., Ltd.,
Nagano FactoryIndustrial-use powdered milk, etc. Nagano, Nagano Pref. -
Amano Jitsugyo Co., Ltd. (2 factories)
33 Okayama Factory No. 1 Plant Freeze-dried foods, granulated seasonings, etc. Asakuchi, Okayama Pref. -
34 Okayama Factory No. 2 Plant Same as above Asakuchi, Okayama Pref. -
Asahi Beer Malt, Ltd. (2 factories)
35 Yasu Factory Malt, powdered malt, barley tea, etc. Yasu, Shiga Pref. -
36 Koganei Factory Same as above Shimotsuke, Tochigi Pref. -
Factory name

Copyright © ASAHI GROUP HOLDINGS. All rights reserved.9
Corporate Data (Company History 1889–2004)
■M&A, Equity Participation, Business Alliance etc. ■New product launch
Year Month Main events
1889 Nov.Osaka Breweries, Ltd., the predecessor of Asahi Breweries, Ltd., is established. Japan Beer Brewery, Ltd. and Sapporo Beer Co. are also
established around this time.
1891 Oct. The Suita-mura Brewery, now Asahi Breweries’ Suita Brewery, is completed.
1892 May Asahi Beer is launched.
1897 July The first Asahi House beer hall opens for business.
1900 Asahi Beer wins the title of best beer at the Paris Expo.
1906 Mar. Dai Nippon Breweries, Co., Ltd. is jointly established by Osaka Breweries, Japan Beer Brewery, and Sapporo Beer Co.
1930 May EBIOS , a pure brewer’s yeast tablet, is introduced.
1944 Dai Nippon Breweries spins off i ts pharmaceutica l divis ion to form Dainippon Vitamin Co., Ltd. (now Asahi Food & Healthcare Co., Ltd.).
1949 Sept. Asahi Breweries, Ltd. is established, and Tamesaburo Yamamoto is appointed the company’s first president.
Dai Nippon Breweries Co., Ltd. is divided into Asahi Breweries, Ltd. and Nippon Breweries, Ltd. upon enactment of the Economic Decentralization Act.
1954 Aug. Asahi invests in Nikka Whisky Distil l ing Co., Ltd.
1972 Mar. Mitsuya Vending (now Asahi Soft Drinks Co., Ltd.) is established.
1980 Nov. Asahi acquires the trademark right to the Bireley’s brand.
1982 Nov. Asahi signs a collaborative business agreement with Löwenbräu AG of Germany.
1983 Jan. Asahi acquires the trademark right to the Wilkinson carbonated drink.
1985 Oct. Asahi announces the introduction of its corporate identity (CI) program.
1986 Feb. New Asahi Draft Beer ,distinguished by its rich and crisp taste, is launched.
Mar. Tsutomu Murai becomes chairman, and Hirotaro Higuchi takes office as president.
1987 Mar. Asahi Super Dry , Japan’s first dry draft beer, is launched. It is a megahit product that revolutionizes the beer industry.
1988 July Asahi Beer Winery (now Sainte Neige Wine Co., Ltd.) is established.
Oct. Asahi Beer Soft Drink Manufacturing Co., Ltd. (now Asahi Soft Drinks Co., Ltd.) is established.
1989 Jan. The company is renamed Asahi Breweries, Ltd.
1990 Sept. Asahi Beer Soft Drinks Co., Ltd. (now Asahi Soft Drinks Co., Ltd.) is established.
1992 Mar. Asahi Beer Food, Ltd. (now Asahi Food & Healthcare Co., Ltd.) is established.
Sept. Hirotaro Higuchi becomes chairman, and Yuzo Seto takes office as president.
1993 Mar. The pioneering blend tea Asahi Ocha Dozo Jurokucha is launched.
1994 Jan.Asahi acquires stakes in three Chinese beer companies and signs technical and licensing agreements with each of them. This marks its
full-scale entry into the Chinese market.
Mar. Asahi Beer Pharmaceutical Co., Ltd. (now Asahi Food & Healthcare Co., Ltd.) is established.
1995 Dec. Asahi and Itochu Corporation jointly acquire the management rights for Beijing Beer Asahi Co., Ltd. and Yantai Beer Asahi Co. Ltd.
1996 Apr. The Asahi Beer Oyamazaki Vil la Museum of Art is opened.
July Asahi Soft Drinks Co., Ltd. commences operations as a manufacturer and distributor of soft drinks.
1997 Sept. WONDA, a new-generation canned coffee, is launched.
Dec.Asahi, in cooperation with China’s Tsingtao Brewery Co., Ltd. and others, establishes Shenzhen Tsingtao Beer Asahi Co., Ltd. and starts
work on brewery construction.
1998 Apr. Asahi Beer U.S.A., Inc. is established.
May The Asahi Breweries, Ltd. Europe Branch is established.
Dec. Asahi claims the top market share in domestic beer sales.
1999 Jan. Yuzo Seto becomes chairman, and Shigeo Fukuchi takes office as president.
Aug. Asahi Soft Drinks Co., Ltd. is l isted on the Tokyo Stock Exchange, First Section.
Sept. The medium-term management plan “Asahi Innovation Program 2000” is announced.
2000 Feb. Asahi introduces an executive director system.
2001 Feb. With the launch of Asahi Honnama happoshu, Asahi enters the low-malt beer market.
Apr. The sales departments of Asahi and Nikka Whiskey Distil l ing Co., Ltd. are merged.
Dec. Asahi claims the top market share in domestic beer/happoshu sales.
2002 Jan. Shigeo Fukuchi becomes chairman, and Kouichi Ikeda takes office as president.
Feb. In cooperation with Boon Rawd Brewery, Asahi starts local production of Asahi Super Dry in Thailand.
July Asahi Beer Food, Ltd. and Asahi Beer Pharmaceutical Co., Ltd. are merged to form Asahi Food & Healthcare Co., Ltd.
Aug. Asahi enters a comprehensive business all iance with Orion Beer Co., Ltd.
Sept.Asahi acquires the alcoholic beverage businesses of Kyowa Hakko Kogyo Co., Ltd. and Asahi Kasei Corporation, and concludes a
contract for a strategic marketing all iance with Maxxium Japan K.K.
Oct. WONDA Morning Shot canned coffee is launched.
Dec. Smile Support, Ltd. (now Asahi Field Marketing, Ltd.) is established.
2003 Jan. Asahi Food & Healthcare Co., Ltd. acquires Pola Foods Inc.
2004 Feb. Asahi Group’s second medium-term management plan is announced.
Apr. Asahi establishes a joint venture in the beverage business with China’s Tingyi (Cayman Islands) Holding Corp.
July Haitai Beverage Co., Ltd. becomes a consolidated subsidiary.
Nov. Asahi invests in the alcohol beverage sales company of South Korea’s Lotte Group to establish Lotte Asahi Liquor Co., Ltd.
Copyright © ASAHI GROUP HOLDINGS. All rights reserved.10
Corporate Data (Company History 2005–2016)
■M&A, Equity Participation, Business Alliance etc. ■New product launch
Year Month Main events
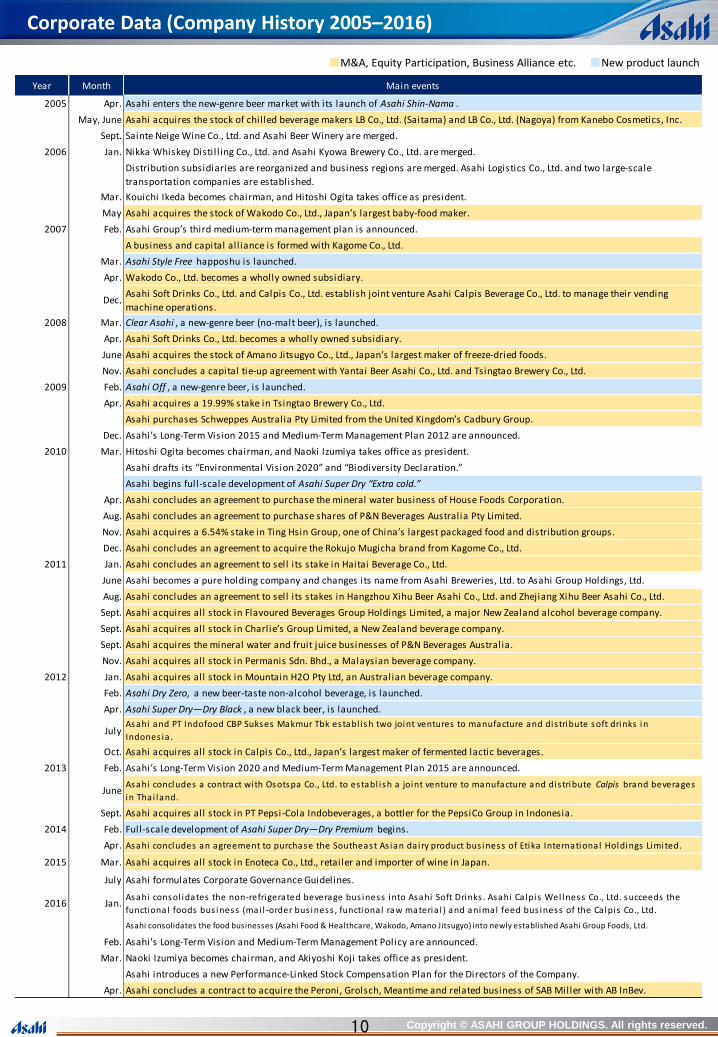
2005 Apr. Asahi enters the new-genre beer market with its launch of Asahi Shin-Nama .
May, June Asahi acquires the stock of chil led beverage makers LB Co., Ltd. (Saitama) and LB Co., Ltd. (Nagoya) from Kanebo Cosmetics, Inc.
Sept. Sainte Neige Wine Co., Ltd. and Asahi Beer Winery are merged.
2006 Jan. Nikka Whiskey Distil l ing Co., Ltd. and Asahi Kyowa Brewery Co., Ltd. are merged.
Distribution subsidiaries are reorganized and business regions are merged. Asahi Logistics Co., Ltd. and two large-scale
transportation companies are established.
Mar. Kouichi Ikeda becomes chairman, and Hitoshi Ogita takes office as president.
May Asahi acquires the stock of Wakodo Co., Ltd., Japan’s largest baby-food maker.
2007 Feb. Asahi Group’s third medium-term management plan is announced.
A business and capital all iance is formed with Kagome Co., Ltd.
Mar. Asahi Style Free happoshu is launched.
Apr. Wakodo Co., Ltd. becomes a wholly owned subsidiary.
Dec.Asahi Soft Drinks Co., Ltd. and Calpis Co., Ltd. establish joint venture Asahi Calpis Beverage Co., Ltd. to manage their vending
machine operations.
2008 Mar. Clear Asahi , a new-genre beer (no-malt beer), is launched.
Apr. Asahi Soft Drinks Co., Ltd. becomes a wholly owned subsidiary.
June Asahi acquires the stock of Amano Jitsugyo Co., Ltd., Japan’s largest maker of freeze-dried foods.
Nov. Asahi concludes a capital tie-up agreement with Yantai Beer Asahi Co., Ltd. and Tsingtao Brewery Co., Ltd.
2009 Feb. Asahi Off , a new-genre beer, is launched.
Apr. Asahi acquires a 19.99% stake in Tsingtao Brewery Co., Ltd.
Asahi purchases Schweppes Australia Pty Limited from the United Kingdom’s Cadbury Group.
Dec. Asahi’s Long-Term Vision 2015 and Medium-Term Management Plan 2012 are announced.
2010 Mar. Hitoshi Ogita becomes chairman, and Naoki Izumiya takes office as president.
Asahi drafts its “Environmental Vision 2020” and “Biodiversity Declaration.”
Asahi begins full-scale development of Asahi Super Dry “Extra cold.”
Apr. Asahi concludes an agreement to purchase the mineral water business of House Foods Corporation.
Aug. Asahi concludes an agreement to purchase shares of P&N Beverages Australia Pty Limited.
Nov. Asahi acquires a 6.54% stake in Ting Hsin Group, one of China’s largest packaged food and distribution groups.
Dec. Asahi concludes an agreement to acquire the Rokujo Mugicha brand from Kagome Co., Ltd.
2011 Jan. Asahi concludes an agreement to sell its stake in Haitai Beverage Co., Ltd.
June Asahi becomes a pure holding company and changes its name from Asahi Breweries, Ltd. to Asahi Group Holdings, Ltd.
Aug. Asahi concludes an agreement to sell its stakes in Hangzhou Xihu Beer Asahi Co., Ltd. and Zhejiang Xihu Beer Asahi Co., Ltd.
Sept. Asahi acquires all stock in Flavoured Beverages Group Holdings Limited, a major New Zealand alcohol beverage company.
Sept. Asahi acquires all stock in Charlie’s Group Limited, a New Zealand beverage company.
Sept. Asahi acquires the mineral water and fruit juice businesses of P&N Beverages Australia.
Nov. Asahi acquires all stock in Permanis Sdn. Bhd., a Malaysian beverage company.
2012 Jan. Asahi acquires all stock in Mountain H2O Pty Ltd, an Australian beverage company.
Feb. Asahi Dry Zero, a new beer-taste non-alcohol beverage, is launched.
Apr. Asahi Super Dry—Dry Black , a new black beer, is launched.
JulyAsahi and PT Indofood CBP Sukses Makmur Tbk establ ish two joint ventures to manufacture and dis tribute soft drinks in
Indones ia .
Oct. Asahi acquires all stock in Calpis Co., Ltd., Japan’s largest maker of fermented lactic beverages.
2013 Feb. Asahi’s Long-Term Vision 2020 and Medium-Term Management Plan 2015 are announced.
JuneAsahi concludes a contract with Osotspa Co., Ltd. to establ ish a joint venture to manufacture and dis tribute Calpis brand beverages
in Thai land.
Sept. Asahi acquires all stock in PT Pepsi-Cola Indobeverages, a bottler for the PepsiCo Group in Indonesia.
2014 Feb. Full-scale development of Asahi Super Dry—Dry Premium begins.
Apr. Asahi concludes an agreement to purchase the Southeast As ian dairy product bus iness of Etika International Holdings Limited.
2015 Mar. Asahi acquires all stock in Enoteca Co., Ltd., retailer and importer of wine in Japan.
July Asahi formulates Corporate Governance Guidelines.
2016 Jan.Asahi consol idates the non-refrigerated beverage bus iness into Asahi Soft Drinks . Asahi Ca lpis Wel lness Co., Ltd. succeeds the
functional foods bus iness (mai l -order bus iness , functional raw materia l ) and animal feed bus iness of the Calpis Co., Ltd.
Asahi consolidates the food businesses (Asahi Food & Healthcare, Wakodo, Amano Jitsugyo) into newly established Asahi Group Foods, Ltd.
Feb. Asahi's Long-Term Vision and Medium-Term Management Policy are announced.
Mar. Naoki Izumiya becomes chairman, and Akiyoshi Koji takes office as president.
Asahi introduces a new Performance-Linked Stock Compensation Plan for the Directors of the Company.
Apr. Asahi concludes a contract to acquire the Peroni, Grolsch, Meantime and related business of SAB Miller with AB InBev.

Copyright © ASAHI GROUP HOLDINGS. All rights reserved.11
Consolidated Financial Statements
2010 2011 2012 2013 2014 2015
Consolidated Statements of Income (Mill ions of Yen)
Net sales 1,489,460 1,462,736 1,579,077 1,714,237 1,785,478 1,857,418
Cost of sales 943,323 907,243 974,702 1,032,853 1,073,439 1,100,519
(Liquor tax) (433,820) (414,327) (421,953) (423,332) (426,453) (422,941)
Gross profit 546,137 555,493 604,375 681,383 712,039 756,899 Selling, general and administrative
expenses 450,787 448,303 495,937 563,916 583,733 621,779
(Goodwill amortization) (7,723) (8,905) (13,991) (18,449) (19,474) (16,271)
Operating income 95,349 107,190 108,437 117,467 128,305 135,119
Financial income -2,624 -2,198 -2,304 -1,605 -1,392 -919
Interest income 314 333 402 387 453 583
Dividend income 1,389 1,136 1,335 1,602 1,840 2,112
Interest expenses -4,328 -3,668 -4,043 -3,595 -3,686 -3,615
Equity in income of affi l iates 9,846 5,480 10,617 8,822 8,025 14,167
Ordinary income 101,142 110,909 114,822 123,612 133,168 145,946
Profit attributable to owners of the parent 53,080 55,094 57,183 61,749 69,118 76,427
EBITDA *1 157,675 166,833 170,982 183,696 192,308 197,994
Capital expenditures / Depreciation (Mill ions of Yen)
Capital expenditures 27,820 30,685 41,197 48,488 59,828 52,099
Depreciation 54,602 50,738 48,553 47,780 44,528 46,603
Consolidated Balance Sheets (Mill ions of Yen)
Total assets 1,405,358 1,529,908 1,732,188 1,791,556 1,936,610 1,901,554
Current assets 421,052 457,146 529,189 534,890 603,842 600,498
Receivables 274,379 279,596 317,008 317,106 353,704 362,241
Inventories - - - - - - Merchandise and finished goods,
Raw materials and supplies 95,358 102,631 113,519 118,302 124,549 132,315
Noncurrent assets 984,305 1,072,762 1,202,998 1,256,665 1,332,767 1,301,056
Tangible fixed assets 557,100 536,236 583,399 584,219 605,415 582,098
Current l iabilities 499,874 602,166 680,068 666,081 757,374 715,193
Noncurrent l iabilities 292,813 283,943 325,240 297,993 282,725 294,531
Financial obligation 311,423 390,092 456,234 403,723 434,726 414,930
Net assets 612,670 643,799 726,879 827,481 896,510 891,829
Equity 612,191 641,733 723,819 819,295 881,091 877,672
Consolidated Statements of Cash Flows (Mill ions of Yen)
Net cash provided by operating activities 125,608 108,513 109,292 157,252 146,783 112,765
Net cash used in investing activities -41,790 -171,235 -134,320 -65,705 -92,183 -75,583Net cash provided by (used in) financing
activities -90,828 67,090 43,002 -84,938 -35,842 -73,044
Cash and cash equivalents 10,813 16,137 34,320 41,117 62,235 43,290
Free cash flow *2 95,463 81,919 68,952 108,292 82,747 61,257
*1: EBITDA=Operating income (before goodwill) + Depreciation and amortization *2: Free cash flow = Operating cash flows ± Acquisition of tangible and intangible fixed assets
Management Index
ROE 9.0% 8.8% 8.4% 8.0% 8.1% 8.8%
ROA 7.1% 7.6% 7.0% 7.0% 7.1% 7.6%
EPS (yen) 114.1 118.4 122.8 135.7 148.9 166.3
BPS (yen) 1,315.5 1,378.2 1,553.4 1,772.5 1,904.6 1,916.7
Investment Index
Dividend payout ratio 20.2% 21.1% 22.8% 31.7% 30.2% 30.1%
Profitability Index
Gross profit margin 36.7% 38.0% 38.3% 39.7% 39.9% 40.8%
Operating margin 6.4% 7.3% 6.9% 6.9% 7.2% 7.3%
(Operating margin exclusive of l iquor tax) (9.0%) (10.2%) (9.4%) (9.1%) (9.4%) (9.4%)
Ordinary income margin 6.8% 7.6% 7.3% 7.2% 7.5% 7.9%
Profit attributable to owners of the parent margin 3.6% 3.8% 3.6% 3.6% 3.9% 4.1%
EBITDA ratio 10.6% 11.4% 10.8% 10.7% 10.8% 10.7%
Efficiency Index (Times)
Total asset turnover 1.05 1.00 0.97 0.97 0.96 0.97
Equity turnover 2.5 2.3 2.3 2.2 2.1 2.1
Fixed assets turnonver 2.6 2.7 2.8 2.9 3.0 3.1
Inventory turnover 15.5 14.8 14.6 14.8 14.7 14.5
Receivables turnover 5.4 5.3 5.3 5.4 5.3 5.2
Safety Index
Shareholders' equity ratio 43.6% 41.9% 41.8% 45.7% 45.5% 46.2%
Debt ratio 129.5% 138.1% 138.9% 117.7% 118.0% 115.0%
Liquidity ratio 84.2% 75.9% 77.8% 80.3% 79.7% 84.0%
Fixed assets ratio 160.8% 167.2% 166.2% 153.4% 151.3% 148.2%
Fixed assets/Liability ratio 108.8% 115.9% 114.7% 112.5% 114.5% 111.0%
Interest coverage ratio 30.7 32.4 25.6 40.9 39.9 30.9
Debt-to-equity ratio 0.51 0.61 0.63 0.49 0.49 0.47

Copyright © ASAHI GROUP HOLDINGS. All rights reserved.12
FY2015
Consolidated Three Months Financial Results
FY2016
Summary of Statements of Income (Bi l l ions of yen)
YoY YoY YoY YoY YoY YoY
Alcohol Beverages Business 185.8 -12.1 260.1 +29.2 445.9 +17.1 276.0 +11.4 277.9 +6.7 999.8 +35.2Soft Drinks Business 98.2 -0.0 137.8 +7.6 236.1 +7.6 140.3 +6.1 118.7 +4.9 495.1 +18.5Food Business 26.9 -0.6 28.7 +2.4 55.6 +1.9 28.4 +1.6 33.2 +1.7 117.2 +5.2Overseas Business 63.1 +12.2 58.7 +8.4 121.8 +20.7 60.1 +0.3 70.0 -3.7 251.9 +17.2Others 18.2 -0.2 23.1 +1.5 41.3 +1.3 23.0 +1.0 22.4 +0.6 86.6 +2.9Adjustmenet (corporate and elimination) -18.0 -0.2 -25.8 -2.7 -43.8 -3.0 -26.2 -2.5 -23.3 -1.6 -93.3 -7.1 (Liquor tax ※consolided total) 80.6 -8.0 108.6 +7.0 189.2 -1.0 115.1 -1.3 118.6 -1.2 422.9 -3.5
Sales 374.2 -0.9 482.6 +46.4 856.8 +45.6 501.7 +17.9 498.9 +8.5 1,857.4 +71.9Alcohol Beverages Business 14.4 -4.1 29.8 +5.3 44.2 +1.2 39.4 +0.9 35.9 +0.4 119.5 +2.5Soft Drinks Business 0.1 -1.0 9.9 +0.0 10.0 -1.0 9.5 -0.5 6.1 +0.7 25.6 -0.8Food Business 1.0 -0.4 2.1 +1.3 3.1 +0.9 2.3 +0.8 3.1 +0.3 8.4 +2.0Overseas Business 3.4 +0.9 2.9 +1.9 6.3 +2.7 2.9 +0.5 6.3 -0.5 15.5 +2.8Others -0.3 +0.0 0.7 +0.6 0.4 +0.6 0.6 +0.5 0.2 -0.0 1.3 +1.1Adjustmenet (corporate/elimination) -3.8 -0.3 -4.9 -1.2 -8.8 -1.5 -4.4 -1.0 -5.7 -1.4 -18.9 -3.9Amortization of goodwil and others -3.9 +0.3 -4.1 +0.3 -8.0 +0.6 -4.0 +0.7 -4.3 +1.9 -16.3 +3.2
Operating Income 10.8 -4.6 36.5 +8.2 47.3 +3.6 46.3 +1.9 41.5 +1.3 135.1 +6.8Equity in net income of equity method affi l iates 2.9 +7.2 2.5 -1.1 5.4 +6.1 4.6 -0.6 4.2 +0.6 14.2 +6.1
Ordinary Income 13.0 +2.8 38.7 +7.5 51.7 +10.3 49.8 +0.2 44.4 +2.3 145.9 +12.8 Profit attributable to owners of the parent 13.3 +10.7 26.2 +9.4 39.5 +20.1 29.5 -5.6 7.5 -7.3 76.4 +7.3 E B I T D A * 26.3 -4.1 52.2 +8.4 78.5 +4.3 62.2 +2.3 57.3 -0.8 198.0 +5.7*EBITDA: Operating income (before goodwill amortization) + Depreciation and amortization
Summary of Statements of Balance Sheet
1875.6 -61.0 - - 1918.6 43.0 1,859.6 -59.0 - - 1,901.6 +41.9
485.4 +50.7 - - 474.8 -10.6 447.4 -27.4 - - 414.9 -32.5Others
+2.9% -1.2% +7.6% +1.1% +5.5% +0.1% +9.2% +0.0% +8.3% +0.1% +7.3% +0.1% +3.7% -1.7% +9.8% +1.3% +7.1% +0.1% +12.0% -0.1% +10.9% +0.1% +9.4% -0.0%
11.5 -5.8 10.9 -1.0 22.3 -6.8 10.8 -0.7 19.0 -0.2 52.1 -7.7
11.6 +0.8 11.7 +0.5 23.2 1.3 11.9 +1.1 11.5 -0.3 46.6 +2.1Statements of Cash Flows
- - - - 15.3 -11.6 - - - - 112.8 -34.0
- - - - -45.9 +16.0 - - - - -75.6 +16.6
- - - - 1.1 -38.5 - - - - -73.0 -37.2
- - - - -11.2 -15.5 - - - - -18.9 -40.0
Net cash provided by investing activities
Net cash provided by financing activities
Cash and cash equivalents
1H Result 3Q 4Q1Q Total
Total assets
Interest-bearing debt
Operating margin
Operating margin excluding liquor tax
Capital expenditures
2Q
Depreciation
Net cash provided by operating activities
Summary of Statements of Income (Bi l l ions of yen)
YoY YoY YoY
Alcohol Beverages Business 195.3 +9.5 263.5 +3.4 458.8 +12.9Soft Drinks Business 96.7 -1.6 136.1 -1.7 232.8 -3.3Food Business 27.3 +0.4 31.9 +3.3 59.2 +3.7Overseas Business 58.4 -4.7 51.4 -7.3 109.8 -12.0Others 21.9 +3.7 26.8 +3.7 48.6 +7.4Adjustmenet (corporate and elimination) -19.3 -1.3 -26.3 -0.5 -45.6 -1.8 (Liquor tax ※consolided total) 80.9 +0.3 107.7 -0.9 188.7 -0.5
Sales 380.2 +6.0 483.5 +0.8 863.7 +6.9Alcohol Beverages Business 14.9 +0.6 31.2 +1.4 46.2 +2.0Soft Drinks Business 0.4 +0.3 11.9 +2.0 12.3 +2.3Food Business 1.7 +0.7 3.1 +1.0 4.8 +1.7Overseas Business 2.9 -0.4 2.6 -0.3 5.5 -0.7Others -0.5 -0.2 0.8 +0.0 0.3 -0.1Adjustmenet (corporate/elimination) -4.4 -0.5 -5.0 -0.1 -9.4 -0.6Amortization of goodwil and others -3.7 +0.2 -3.6 +0.5 -7.3 +0.7
Operating Income 11.5 +0.7 41.0 +4.5 52.5 +5.2Equity in net income of equity method affi l iates -7.1 -10.0 1.4 -1.1 -5.7 -11.1
Ordinary Income 2.4 -10.6 42.7 +4.0 45.1 -6.6 Profit attributable to owners of the parent 0.6 -12.7 27.9 +1.8 28.5 -10.9 E B I T D A * 26.8 +0.5 56.3 +4.0 83.1 +4.6*EBITDA: Operating income (before goodwill amortization) + Depreciation and amortization
Summary of Statements of Balance Sheet
1792.6 -109.0 - - 1797.7 5.1
455.9 +41.0 - - 397.6 -58.3Others
+3.0% +0.1% +8.5% +0.9% +6.1% +0.6% +3.8% +0.2% +10.9% +1.2% +7.8% +0.7%
10.4 -1.0 11.9 +1.1 22.4 0.1
11.7 +0.1 11.7 +0.0 23.4 0.1Statements of Cash Flows
- - - - 60.7 +45.4
- - - - -21.5 +24.5
- - - - -29.1 -30.2
- - - - 8.2 +19.4
Operating margin excluding liquor tax
Capital expenditures
Depreciation
Net cash provided by operating activities
Net cash provided by investing activities
Net cash provided by financing activities
Cash and cash equivalents
1Q 2Q 1H Result
Total assets
Interest-bearing debt
Operating margin

Copyright © ASAHI GROUP HOLDINGS. All rights reserved.13
Results by segment
Asahi Group at a Glance
◆Goodwill etc. by segment (As of December 31, 2015) (Biilions of yen)
Amortization
termRemaining years
Unamortized
balance of goodwillRemarks
Soft Drinks Business
Asahi Soft Drinks 190.1 100.0% - Goodwill 25.9 20 17 21.7 Calpis Acquisiton in Oct. 2012
Intangible assets 34.6 5-20 - 28.6
Foods Business
Asahi Group Foods 101.2 100.0% - 23.6 20 11 4.1 Wakodo Acquisition : 22.7billion yen in Apr. 2006 and
0.9billion yen in Mar. 2007
Overseas Business
Asahi Holdings (Australia) 268.4 100.0% Apr. 2009 Trademark right 19.3 20 13 12.8 Yen based financing
(Oceania business) (*1) (*2) Goodwill 123.5 20 13-15 73.6
Intangible assets 23.1 10-20 - 18.4
Southeast Asia business (*3) 150.8 100.0% Nov. 2011 Goodwill 37.4 5-19 2-15 29.2
Intangible assets 7.0 9 5 4.5
Tsingtao Brewery - 19.9% Oct. 2009 51.3 20 17 36.3 -
Tingy-Asahi Beverages - 30.4% Apr. 2004 29.7 20 12 7.7 -
(*1) Total assets of Asahi Holdings (Australia) Pty Ltd(Asahi Holdings Australia)
(*2) Date of consolidation of other companies: Asahi Beverages Australia (Sep. 2011), Charlie's Group (Sep. 2011), Independent Liquor Group (Sep. 2011), Mountain H2O (Jan. 2012)
(*3) Total assets of Southeast Asia business.
Overseas Business
(Equity-method affiliates)
Amount at the time of acquisition
% of voting
rightsCapital
Date of
consolidation
Goodwill
Amount in foreign currencyNote: The price changes according to the exchange
Amount in foreign currencyNote: The price changes according to the exchange
◆Net sales and Operating income by segment (Billions of yen) ◆CAPEX / Depreciation (FY2015) (Billions of yen)
Net sales Operating income Goodwill etc. Net sales Operating income Goodwill etc.
Alcohol Beverages Business
Asahi Breweries 965.9 118.4 -0.6 978.7 119.5 -0.8
Soft Drinks Business
Asahi Soft Drinks 457.2 24.1 -3.0 468.0 28.0 -3.0
LB 22.6 0.7 - 22.7 0.8 -
Food Business Note: Above figures are based on new segments.
Asahi Group Foods 117.0 8.5 -0.4 122.1 9.8 -0.4
Overseas Business ◆Exchange Rate (Yen)
Oceania 163.2 11.5 -8.2 145.7 10.3 -6.6
Southeast Asia 61.5 2.8 -3.6 56.6 3.0 -2.8
China 20.0 0.8 - 17.7 1.1 -
Note: Above figures are based on new segments.
◆Details of goolwill by segment (Billions of yen)
Ringgit Malaysia
Calpis Goodwill -1.3 Goodwill -1.3
Intangible assets -1.8 Intangible assets -1.8
Oceania Goodwill -5.5 Goodwill -4.3
Intangible assets -1.7 Intangible assets -1.4
Trademark right -1.0 Trademark right -1.0
Southeast Asia Goodwill -2.6 Goodwill -1.9
Intangible assets -1.0 Intangible assets -0.8
111.5
FY2015
(Average)
Indonesian Rupiah 0.0090 0.0091 0.0080
(Equithy in net income of unconsolidated subsidiaries)
(Equithy in net income of unconsolidated subsidiaries)
19.2
119.3
16.7
102.3
106.5
78.5
FY2014 FY2016(Announced
on Aug. 3)
15.7Overseas
Others
Total
Alcohol beverages
FY2015 Results FY2016Target (Announced on Aug. 3)
Food
Depreciation
23.9
9.1
3.2
CAPEX
52.1
9.0
1.4
46.6
18.0
12.3
5.4
US dollar
Australian dollar
Chinese Yuan
121.1
Soft Drinks
105.8
95.4
17.2
91.1
19.2
0.8
(Average)
32.3 FY2015 Results FY2016 Target (Announced on Aug. 3)
16.0
26.5 31.2
17.0
Rate in foreign currency (Australian dollar)
※The price changes according to the exchange rate.
Rate in foreign currency (Ringgit Malaysia)
※The price changes according to the exchange rate.

Copyright © ASAHI GROUP HOLDINGS. All rights reserved.14
Alcohol Beverage Business (Asahi Breweries, Ltd.)
Asahi Breweries, Ltd.
Business field Production and sales of beer and other alcohol beverages, and related operations
Established September 1949*
Paid-in capital ¥20 billion
Net sales ¥948.8 billion
Operating income ¥116.0 billion
Number of employees
5,666(consolidated)* With the establishment of a pure holding company in July 2011, Asahi Breweries was split off as a separate company.
Corporate profile, based on 2015 results
Operating income (right scale)Net sales (left scale)
Net sales and operating income (Billions of yen)
Sales composition by product category (2015 results, value basis)
Note: Retail prices are discretionary.
Main products
WineWhisky and spirits RTDShochu
Other alcoholic beverages
Asahi Dry ZeroThis non-alcohol beer-taste beverage has an enjoyably dry finish and creamy foam, aiming at real “beer taste”. It contains not only zero alcohol but also zero calories (according to nutrition labeling standards) or zero saccharides.
Non-alcohol beer-taste beverage
Clear AsahiClear taste and pure sharp finish with malt flavor. Appreciate the new genre beer suiting for meal.
Asahi Style FreeA happoshu with zero saccharides (according to nutrition labeling standards). It retains the flavor of malt and combines it with the fine aroma of hops and other ingredients to give a relaxing fragrance and fresh aftertaste. Enjoy this beautiful flavor.
Asahi The DreamThis new draft beer, created for beer connoisseurs, ushers in a new era of beer enjoyment. It is brewed with 20% more malt than ordinary beers, and an advanced fermentation control technology gives it maximum richness and sharpness. Furthermore, it contains 50% less carbohydrates*.*According to Standard Tables of Food Composition in Japan - 2015 (Seventh Revised Edition)
Beer
Asahi Super DryA dry beer with a refined, clear taste. The texture is light, but it has a distinct edge. The sharp finish is emphasized in this standard-setting dry beer.
99.3 111.5 112.5 114.4 116.0
919.6 920.8 927.8 941.0 948.8
2011 2012 2013 2014 2015
Beer62%
Happoshu7%
New Genre14%
Whiskey and spirits
6%
Shochu
3%
RTD
3%
Wine2%
Alcohol-taste soft drinks
3%

Copyright © ASAHI GROUP HOLDINGS. All rights reserved.15
Alcohol Beverage Business (Sales Volume by Month in 2015)
Asahi Breweries beer-type beverage sales by month (2015)
Sales volume of non-alcohol beer-taste beverages by top four companies (2015)
Taxable shipment volume of beer-type beverages by top five companies (2015)
Asahi Breweries non-alcohol beer-taste beverage sales by month (2015)
Source: Brewers Association of Japan, Society to Consider the Happoshu Tax System.
Taxable shipment volume (Millions of cases)
1H 2H Total
YoY Market share YoY Market share YoY Market share
Beer 48.00 -2.1% 50.4% 58.66 -1.2% 49.0% 106.65 -1.6% 49.6%
Happoshu 7.56 +3.5% 25.5% 8.39 -5.7% 26.3% 15.95 -1.6% 25.9%
New Genre 19.02 +2.2% 26.8% 20.58 +2.6% 26.5% 39.61 +2.4% 26.7%
74.58 -0.5% 38.1% 87.63 -0.8% 38.2% 162.21 -0.7% 38.2%
Sales
Jan. Feb. Mar. Apr. May June July Aug. Sep. Oct. Nov. Dec.
Beer -8.0% -5.0% -18.0% +18.0% +0.0% +0.0% -4.0% +0.0% +2.0% +0.0% -4.0% -1.0%
Happoshu +5.0% +0.0% -27.0% +41.0% +2.0% +9.0% +4.0% -5.0% -15.0% -7.0% -8.0% -6.0%
New Genre -14.0% +3.0% -18.0% +33.0% -10.0% +12.0% -9.0% +0.0% +2.0% +3.0% +4.0% +6.0%
-8.0% -3.0% -19.0% +24.0% -3.0% +4.0% -5.0% +0.0% +0.0% +0.0% -3.0% +0.0%
(Millions of cases)
No. of cases YoY No. of cases YoY No. of cases YoY
Beer 46.41 -2.8% 59.65 -1.5% 106.06 -2.0%
Happoshu 7.43 +3.4% 8.37 -6.1% 15.80 -1.8%
New Genre 18.31 -0.2% 20.67 +0.8% 38.99 +0.4%
72.15 -1.5% 88.69 -1.4% 160.85 -1.4%
Sales volume by brand (Millions of cases)
No. of cases YoY No. of cases YoY No. of cases YoY No. of cases YoY No. of cases YoY No. of cases YoY
Super Dry total 4.62 -7.4% 6.45 -5.7% 7.76 -19.7% 8.43 +19.1% 8.53 +0.2% 9.58 +0.1%
Super Dry 4.50 -9.1% 6.10 +5.2% 7.10 -23.7% 7.90 +15.3% 7.85 -3.7% 9.05 +0.6%
Dry Premium total 0.10 - 0.32 -67.3% 0.13 -55.2% 0.14 -22.2% 0.41 +36.7% 0.46 -8.0%
Style Free total 0.63 -6.0% 0.79 -9.2% 0.87 -28.1% 1.36 +65.9% 1.17 +8.3% 1.24 +13.8%
Clear Asahi total 1.30 -2.3% 1.99 +4.7% 2.65 -13.1% 2.74 +35.0% 2.88 +3.2% 3.43 +26.1%
No. of cases YoY No. of cases YoY No. of cases YoY No. of cases YoY No. of cases YoY No. of cases YoY
Super Dry total 11.09 -4.4% 10.37 +0.2% 7.68 +1.9% 8.10 -0.5% 7.66 -5.2% 13.51 -1.7%
Super Dry 10.50 -3.2% 10.15 +2.0% 7.05 -4.1% 7.85 +0.0% 7.25 -4.6% 12.80 +0.0%
Dry Premium total 0.51 -23.9% 0.18 -45.5% 0.21 +40.0% 0.14 -44.0% 0.32 -27.3% 0.66 -25.0%
Style Free total 1.29 +9.3% 1.20 +12.1% 1.18 +19.2% 1.17 +17.0% 1.03 +17.0% 1.37 +16.1%
Clear Asahi total 2.89 +6.3% 2.95 +23.9% 2.55 +15.4% 2.66 +11.8% 2.53 +9.1% 3.18 +13.2%
No. of cases YoY No. of cases YoY No. of cases YoY No. of cases YoY No. of cases YoY No. of cases YoY No. of cases YoY
Super Dry total 18.83 -12.4% 26.59 +5.7% 29.14 -1.2% 29.27 -2.3% 45.42 -2.6% 58.41 -1.8% 103.83 -2.1%
Super Dry 17.70 -11.7% 24.85 +3.5% 27.70 -1.6% 27.90 -1.2% 42.55 -3.4% 55.60 -1.4% 98.15 -2.3%
Dry Premium total 0.55 -56.7% 1.01 +3.1% 0.90 -21.7% 1.12 -28.7% 1.56 -30.7% 2.02 -25.7% 3.58 -28.0%
Style Free total 2.29 -16.7% 3.77 +26.1% 3.67 +13.3% 3.57 +16.7% 6.06 +5.6% 7.24 +14.9% 13.30 +10.5%
Clear Asahi total 5.94 -5.4% 9.05 +20.0% 8.39 +14.8% 8.37 +11.5% 14.99 +8.5% 16.76 +13.1% 31.75 +10.9%
Total
Total
1H 2H Total
Total
Jan. Feb. Mar. Apr.
July Aug. Sep. Oct. Nov. Dec.
May June
Jan. - Mar. Apr. - June July - Sep. Oct. - Dec. 1H 2H Total
(Millions of cases)
Jan. Feb. Mar. Apr. May June July Aug. Sep. Oct. Nov. Dec. 1H 2H Total
No. of cases 0.29 0.44 0.51 0.59 0.67 0.71 0.78 0.84 0.64 0.63 0.50 0.74 3.21 4.13 7.34
YoY +7.4% +41.9% +0.0% +40.5% +24.1% +9.2% +5.4% +20.0% +12.3% +16.7% +16.3% +19.4% +18.9% +14.4% +16.3%
(Miilions of cases)
Jan. - Mar. Apr. - June Jul. - Sep. Oct. - Dec.
YoY % of total YoY % of total YoY % of total YoY % of total
Beer 39.76 -8.7% 47.4% 55.45 +5.2% 49.6% 58.72 +0.3% 51.7% 60.97 +2.0% 52.7%
Happoshu 13.16 +0.4% 15.7% 16.44 +24.3% 14.7% 15.74 -12.4% 13.9% 16.12 -5.1% 13.9%
New Genre 30.93 -13.0% 36.9% 40.01 +3.4% 35.8% 39.11 -2.0% 34.4% 38.51 +4.1% 33.3%
83.85 -9.1% - 111.90 +7.0% - 113.57 -2.5% - 115.60 +1.6% -
1H 2H Total
YoY % of total YoY % of total YoY % of total
Beer 95.21 -1.1% 48.6% 119.68 +1.1% 52.2% 214.90 +0.1% 50.6%
Happoshu 29.59 +12.4% 15.1% 31.87 -8.9% 13.9% 61.46 +0.3% 14.5%
New Genre 70.95 -4.5% 36.2% 77.62 +0.9% 33.9% 148.56 -1.7% 35.0%
195.75 -0.6% - 229.17 -0.5% - 424.92 -0.5% -
Total
Total
(Millions of cases)
Jan. Feb. Mar. Apr. May June July Aug. Sep. Oct. Nov. Dec. 1H 2H Total
No. of cases 0.70 0.97 1.27 1.28 1.72 1.81 1.91 1.91 1.46 1.45 1.19 1.70 7.76 9.62 17.38
YoY -2.1% +10.6% -7.0% +3.8% +23.2% +12.1% +0.1% +9.7% +0.3% +2.8% +8.9% +5.1% +7.6% +4.3% +5.8%

Copyright © ASAHI GROUP HOLDINGS. All rights reserved.16
Asahi Breweries beer-type beverage sales by month (2016)
Sales volume of non-alcohol beer-taste beverages by top four companies (2016)
Alcohol Beverage Business (Sales Volume by Month in 2016)
Taxable shipment volume of beer-type beverages by top five companies (2016)
Asahi Breweries non-alcohol beer-taste beverage sales by month (2016)
Source: Brewers Association of Japan, Society to Consider the Happoshu Tax System.
(Miilions of cases)
Jan. - Mar. Apr. - June Jul. - Sep. Oct. - Dec.
YoY % of total YoY % of total YoY % of total YoY % of total
Beer 39.35 -1.1% 48.8% 56.23 +1.4% 50.2%
Happoshu 11.70 -11.1% 14.5% 15.31 -6.9% 13.7%
New Genre 29.64 -4.2% 36.7% 40.56 +1.4% 36.2%
80.68 -3.8% - 112.10 +0.2% -
1H 2H Total
YoY % of total YoY % of total YoY % of total
Beer 95.58 +0.4% 49.6%
Happoshu 27.00 -8.8% 14.0%
New Genre 70.20 -1.0% 36.4%
192.78 -1.5% -
Total
Total
(Millions of cases)
Jan. Feb. Mar. Apr. May June July Aug. Sep. Oct. Nov. Dec. 1H 2H Total
No. of cases 0.78 1.06 1.30 1.56 1.44 1.63 7.76
YoY +11.6% +8.8% +2.4% +22.0% -16.6% -10.0% +0.1%
Taxable shipment volume (Millions of cases)
1H 2H Total
YoY Market share YoY Market share YoY Market share
Beer 47.61 -0.8% 49.8%
Happoshu 7.32 -3.2% 27.1%
New Genre 20.58 +8.2% 29.3%
75.50 +1.2% 39.2%
Sales
Jan. Feb. Mar. Apr. May June July Aug. Sep. Oct. Nov. Dec.
Beer -2.0% -10.0% +6.0% +0.0% -6.0% +1.0%
Happoshu -3.0% +4.0% +8.0% -18.0% -2.0% -4.0%
New Genre +14.0% +19.0% +11.0% +16.0% +7.0% +0.0%
+2.0% -2.0% +7.0% +2.0% -3.0% +0.0%
(Millions of cases)
No. of cases YoY No. of cases YoY No. of cases YoY
Beer 45.62 -1.7%
Happoshu 7.15 -3.7%
New Genre 20.18 +10.2%
72.96 +1.1%
Sales volume by brand (Millions of cases)
No. of cases YoY No. of cases YoY No. of cases YoY No. of cases YoY No. of cases YoY No. of cases YoY
Super Dry total 4.52 -2.2% 5.84 -9.5% 7.50 -3.4% 8.35 -0.9% 7.94 -6.9% 9.61 +0.3%
Style Free total 0.70 +11.1% 0.97 +22.8% 1.05 +20.7% 1.12 -17.6% 1.16 -0.9% 1.20 -3.2%
Clear Asahi total 1.58 +21.5% 2.55 +28.1% 2.98 +12.5% 3.19 +16.4% 3.07 +6.6% 3.31 -3.5%
No. of cases YoY No. of cases YoY No. of cases YoY No. of cases YoY No. of cases YoY No. of cases YoY
Super Dry total
Style Free total
Clear Asahi total
No. of cases YoY No. of cases YoY No. of cases YoY No. of cases YoY No. of cases YoY No. of cases YoY No. of cases YoY
Super Dry total 17.86 -5.2% 25.90 -2.6% 43.76 -3.7%
Style Free total 2.72 +18.8% 3.48 -7.7% 6.20 +2.3%
Clear Asahi total 7.11 +19.7% 9.57 +5.7% 16.68 +11.3%
Total
Sep. Oct. Nov. Dec.
Jan. - Mar. Apr. - June July - Sep. Oct. - Dec. 1H 2H
July Aug.
Total
Jan. Feb. Mar. Apr. May June
Total
Total
1H 2H Total
(Millions of cases)
Jan. Feb. Mar. Apr. May June July Aug. Sep. Oct. Nov. Dec. 1H 2H Total
No. of cases 0.33 0.49 0.56 0.65 0.67 0.73 3.43
YoY +13.8% +11.4% +9.8% +10.2% +0.0% +2.8% +6.9%

Copyright © ASAHI GROUP HOLDINGS. All rights reserved.17
Wine
Whisky andSprits
Sake
Composition by category
97%
108%
104%
115%
98%
100%
100%
100%
98%
99%
RTD
Shochu
2015
Whisky and Spirits 33%
Wine 7%
RTD 12%
Shochu 6%
Total
Alcohol Beverage Business (Alcohol Beverage Market in Japan)
YoY(2015/2014)
Size of domestic beer market (taxable shipment volume; million cases)
Beer
Happoshu
New genre
Size of domestic market for other drinks (taxable shipment volume; 1,000 KL)
YoY(2015/2014)
Share of sales by product in 2015 (Source: Asahi Breweries, Ltd.)
YoY(2014/2013)
Taxable shipment volume in 2014 (Compiled from National Tax Agency reference materials)
Per capita beer consumption (liters/year)
Total
541 556 546572
542 546 534491
457 437386
344312 307 282 277 274 256 239 230 221 220 217 215 215
1
14 21 3377
107 124176
203
202185
139125 122
11295
7868 63 59 61 61
0 25
79 96 100114
139151
153 155 158 151 149
0
100
200
300
400
500
600
'91 '92 '93 '94 '95 '96 '97 '98 '99 '00 '01 '02 '03 '04 '05 '06 '07 '08 '09 '10 '11 '12 '13 '14 '15
1,016 977 956 950 930 911 886
657 725 751 768 806 871 939
258 274 298 351 363 380 394 89 103 103 105 112 124 142 698 645 637 637 611 597 557
0
500
1,000
1,500
2,000
2,500
3,000
3,500
2009 2010 2011 2012 2013 2014 2015
(▲0.7)
(±0)
(▲0.7)
(▲0.3)
(+0.2)
(+0.1)
(▲1.2)
(▲0.4)

Copyright © ASAHI GROUP HOLDINGS. All rights reserved.18
Alcohol Beverage Business (Beer-Type Beverages: Sales by Container Type and Market Channel)
Beer, Happoshu, and New Genre: Market share in Japan based on taxable shipment volume
Beer
Total
Sales composition by container type (FY2016 Jan. – Jun. results)
Asahi Breweries
Industry overall Sources: Brewers Association of Japan and Happoshu online website
Year-on-year sales, by container type (FY2016 Jan. – Jun. results)
Sales composition by marketing channel (FY2016 Jan. – Jun. results, Source: Asahi Breweries, Ltd.)
Total Beer Happoshu, New genre
2015
Bottle Can Keg Total
Total 93.7% 103.9% 97.4% 101.1%
Beer 93.7% 101.0% 97.3% 98.3%
Bottle Can Keg Total
Beer 94.2% 104.4% 98.8% 100.4%
Commercial-
useHome-use Total
Beer 98.1% 102.8% 100.4%

Copyright © ASAHI GROUP HOLDINGS. All rights reserved.1919
Soft Drinks Business (Asahi Soft Drinks Co., Ltd.)
Note: Business results include the effect of the transfer of the Calpisdomestic beverage business to Asahi Soft Drinks in September 2013.
Mitsuya Cider (500 ml PET bottle)The well-known fresh taste of this drink starts with water “polished” through repeated filtration, to which we add fragrances gathered from fruit and other sources. No heat is applied in the production process, and no preservatives are added. Ever since its debut in 1884, Mitsuya Cider has been a nationally famous carbonated beverage.Suggested retail price (tax not included): 500 ml ¥140
WONDA Morning Shot (Can, 185 mg)Made especially for morning consumption, this canned coffee goes down easily but has a bracing bitterness. It features a just-roasted, just-ground, just-poured taste suitable for starting your day. Suggested retail price (tax not included): 185 mg ¥115
Asahi Jurokucha (600 ml PET bottle) Made from 16 carefully selected ingredients. With no caffeine and an aromatic, clean taste, this tea can be gulped down easily. The blend is perfect for healthy hydration.Suggested retail price (tax not included): 600 ml ¥140
Wilkinson Tansan (500 ml PET bottle)The No. 1 sparkling water brand*. Consisting only of “polished” water that has been carbonated, it packs a refreshing punch. This genuine sparkling water has the kind of clear, clean taste preferred by adults.Enjoy it as either a mixer or straight.Suggested retail price (tax not included): 500 ml ¥95
Note: Prices are current as of February 2015.
Corporate profile, based on 2015 results
Business field Manufacture and sale of a range of beverages, operation of vending machines, and related operations
Established March 1972
Paid-in capital ¥11.1 billion
Net sales ¥446.1 billion
Operating income ¥21.3 billion
Number of employees
3,781 (consolidated)
Net sales and operating income
Main products
Asahi Soft Drinks Co., Ltd.
Calpis (470 ml “peace bottle”) This fermented lactic beverage, made from lactic acid bacteria and raw milk, has 95 years of history.We remove the butterfat from fresh, domestically produced milk, then slowly ferment the milk with our unique lactic acid bacteria.The invigorating taste of nature’s goodness can be enjoyed by everyone from children to the elderly.Suggested retail price (tax not included): 470 ml ¥460
Asahi Oishii Mizu Fujisan (600 ml PET
bottle)Note: In western Japan, Fujisan is replaced by Rokko. The delicious taste of nature, just as it was meant to be. This natural water from abundant nature is collected from deep underground. We use a sterile packaging method to safely bring you the taste of natural mineral water.Suggested retail price (tax not included): 600 ml ¥115
(Billions of yen)
Net sales (left scale) Operating income (right scale)
Sales composition of five major brands by volume
13.48.8
15.0
23.521.3
310.9333.6
365.7
431.2 446.1
2011 2012 2013 2014 2015
73.3%
71.5%
73.4%
77.8%77.2%
0.0
50.0
100.0
150.0
200.0
250.0
300.0
2011 2012 2013 2014 2015
Mitsuya Wonda Jurokucha Wilkinson
Oishii Muzu Calpis Composition
(Millions of cases)

Copyright © ASAHI GROUP HOLDINGS. All rights reserved.2020
Soft Drinks Business (LB Co., Ltd.)
Tea (1,000 ml and 500 ml) Carefully selected domestic tea leaves are steeped at a low temperature to produce tea with minimal astringency and a clear taste, allowing the drinker to enjoy a just-poured aroma. Then some tea leaves that were toasted using LB’s special method are added to make the aroma more mellow. The tea contains no sugar, coloring, or perfume.LB produces a range of chilled sugarless teas, including green, barley, oolong, roasted, brown rice, and jasmine.Suggested retail price (tax not included)1,000 ml: 120 yen 500 ml: 80 yen
Kurosu with no sugar added (125 ml)This delicious black vinegar drink can be enjoyed every day. Apple juice was added to 10 ml of Japanese brown rice black vinegar to create a beverage that is refreshing and easy to drink. A delicate balance of just the right sweetness and tartness gives this beverage its characteristic smooth drinkability. A single bottle supplies a full 132 mg of calcium and 272 mg of citric acid to support good health every day.Suggested retail price (tax not included): 125 ml 120 yen
Sawayaka Fruit Series (1,000 ml) These soft drinks provide the taste of fruit at a reasonable price. The series is rich in variety, with basic products such as Momo-sui, Nashi-sui, and Kyoho-sui.Suggested retail price (tax not included): 1,000 ml 120 yen
Ajiwai Calpis (1,000ml)A somewhat concentrated version of Calpiswith a full, rounded taste. It contains milk oligosaccharide, which helps to support health. Now on sale in more delicious, gentle sweetness, delivered with chilled quality.Suggested retail price (tax not included): 1,000 ml 141 yen
Note: Prices are current as of February 2015.
Sales composition by product category (2015)
Main products
LB Co., Ltd.
Net sales (left scale) Operating income (right scale)
Corporate profile, based on 2015 resultsBusiness field LB manufactures and sells
everyday chilled products such as tea, the Calpis brand (from January 2013), and other soft drinks, which it markets through sales routes centered on convenience stores; the LL brand products of Asahi Soft Drinks (from April 2007); and LLbrand products (mainly health drinks) for home delivery and mail-order sales.
Established December 1956
Paid-in capital ¥0.49 billion
Net sales ¥22.6 billion
Operating income ¥0.7 billion
Number of employees 217
Net sales and operating income (Billions of yen)
0.7
0.20.4 0.5
0.7
21.3 20.422.3 22.6 22.6
2011 2012 2013 2014 2015

Copyright © ASAHI GROUP HOLDINGS. All rights reserved.21
103%
98%
103%
101%
101%
103%
98%
95%100%101%
103%
100%
96%
101%
99%
103%
Share in 2015
YoY(2015/2014)
Total
Soft Drinks Business (Domestic Soft Drinks Market Data)
Sales by category (Millions of cases)
Share in 2015
Sales composition by marketing channel (Millions of cases)
YoY(2015/2014)
Total
Share in 2015
Sales by container type (Millions of cases)
YoY(2015/2014)
Total
494 498 504 494 509
386 392 389 386 383
245 264 280 277 277
193 214 216 202 19432
32 33 32 33
401411 437 440 454
2011 2012 2013 2014 2015
RTD Tea Coffee Carbonated drinks
Fruit juice Lactic acid drinks Others
1,749 1,810 1,858 1,830 1,849
103%
RTD Tea27.5%
Coffee20.7%
Carbonated
drinks15.0%
Fruit juice10.5%
Lactic acid drinks1.8%
Others24.6%
624 661 686 681 699
581 586 586 556 545
360 369 385 388 401
185194 203 205 204
2011 2012 2013 2014 2015
Supermarkets Vending machinesConvenience stores Others
1,749 1,8101,858 1,830 1,849
Supermarkets37.8%
Vending machines
29.5%
Convenience stores
21.7%
Others11.0%
1,032 1,092 1,167 1,154 1,186
565565
536 528 519
5858 58 55 559596 98 94 89
2011 2012 2013 2014 2015
PET bottle Can Glass bottle Others
1,749 1,810 1,858 1,830 1,849
PET bottle64.1%
Can28.1%
Glass bottle3.0%
Others4.8%

Copyright © ASAHI GROUP HOLDINGS. All rights reserved.22
Sales composition (2016)
Soft Drinks Business (Sales by Asahi Soft Drinks)
Sales by brand and category (Jan. – Jun. 2016 results, Millions of cases)
Sales composition (2016)
Sales composition by marketing channel (Jan. – Jun. 2016 results, Millions of cases)
Sales composition (2016)
Sales by container type (Jan. – Jun. 2016 results, Millions of cases)
Year-on-year sales growth by Asahi Soft Drinks (Jan.- Jun. 2016 results)
2016 2015 YoY
Carbonated drinks total 27.54 26.50 103.9%
Mitsuya 19.36 19.38 99.9%
Wilkinson 6.88 5.74 119.9%
Coffee total (Incl. WONDA) 21.62 19.65 110.0%
WONDA 20.76 19.11 108.6%
RTD Tea total 19.64 19.01 103.4%
Jurokucha 11.57 10.60 109.1%
Mineral water total 12.08 12.53 96.5%
Fruit juice total 7.21 7.79 92.6%
Health & functional drink total 3.88 4.75 81.7%
Other drink total 8.66 9.03 95.9%
Calpis total 15.93 16.08 99.0%
Goods purchased 3.00 2.33 128.7%
Total 119.57 117.66 101.6%
2016 2015 YoY
Vending machines 29.47 29.16 101.1%
Over-the-counter total 90.09 88.50 101.8%
Supermarkets 36.29 36.43 99.6%
Convenience stores 19.53 18.50 105.5%
Others 34.27 33.56 102.1%
Total 119.57 117.66 101.6%
2016 2015 YoY
Glass bottle 2.89 2.89 99.9%
PET bottle total 74.70 72.77 102.7%
Small size (up to 600ml) 40.26 38.14 105.5%
Large size (up to 2L) 34.45 34.62 99.5%
Can 37.89 36.84 102.8%
Paper container and others 3.92 5.16 75.9%
Total 119.57 117.66 101.6%
Jan. Feb. Mar. Apr. May June July Aug. Sep. Oct. Nov. Dec. 1H 2H Total
+0.4% +3.3% +2.9% +7.3% -2.6% -0.2% -100.0% -100.0% -100.0% -100.0% -100.0% -100.0% +1.6% -100.0% -51.5%
2016
YoY
Carbonated Drinks23.0%
Coffee18.1%
RTD Tea16.4%
Calpis13.3%
Mineral water10.1%
Fruit juice6.0%
Others13.0%

Copyright © ASAHI GROUP HOLDINGS. All rights reserved.23
Main products
アサヒフードアンドヘルスケア株式会社アサヒフードアンドヘルスケア株式会社Asahi Group Foods, Ltd.
Food Business (Asahi Group Foods, Ltd.)
Business field Asahi Group Foods, Ltd. offers lineup of highly original products produced by 3 major subsidiaries. Confectioneries, Pharmaceuticals, Supplements, Baby Products, Freeze-Dried Foods, Seasonings, Retort-Pouch Foods.
Established July 2015
Paid-in capital ¥5.0 billion
Net sales ¥117.0 billion
Operating income ¥8.5 billion
Number of employees 1,368(consolidated)
Corporate profile, based on 2015 results
Net sales and operating income (Billions of yen)
Net sales (left scale) Operating income (right scale)
4.5 4.0 5.3
6.5
8.5
100.1 103.5108.2 112.0
117.0
2011 2012 2013 2014 2015
Note: Business results are calculated based on the structure of Asahi Group Foods, Ltd., which has started the business on 1 January 2016.
Sales composition by product category (2015)
MINTIA Wild & CoolBrisk and refreshing! This standard mint tablet has a unique, exhilarating flavor and create an invigorating cooling sensation in the mouth.Suggested retail price (tax not included):50 tablets (7g) ¥100
Dear Natura GOLD Licorice GlavonoidThis product contains glabridin, a compound derived from the licorice plant. Licorice-derived glabridin has been reported to suppress body fat accumulation and is appropriate for people who are overweight or concerned about body fat.Suggested retail price (tax not included):120 tablets (for 60 days) ¥2,800
Lebense Milk HiHiThis infant formula was developed based on many years of research into mother's milk and state-of-the-art knowledge of infant nutrition. Since the ingredients and their balance closely approximate breast milk, it can be used with confidence and peace of mind when milk production is insufficient or breastfeeding isn't possible for some other reason.Suggested retail price (tax not included):850g price is discretionary
Goo Goo KitchenThis line of baby food was developed to relieve concerns about refusal to eat or swallowing without chewing, with careful attention paid to the size and firmness of ingredients and easy-to-eat texture depending on the age of months.Suggested retail price (tax not included):80g ¥165
Itsumono Miso soup EggplantThis freeze dried miso soup is made from mellow blended miso and bonito flake stock. It has a classic flavor and goes down smoothly, providing full enjoyment of the silky smooth texture of eggplant.Suggested retail price (tax not included):1 pack ¥100
Hatake no CurryTappuri Yasai to Toriniku no CurryThis freeze dried curry is made from a plenty of big and filling vegetables and chicken well simmered with vegetable smoothie, providing mellow taste with condensed natural flavours.Suggested retail price (tax not included):1 pack ¥270
Foods business29.5%
B to B bus iness
21.3%
Baby & Elderly bus iness
19.5%
Amano business
16.2%
Health care bus iness
11.9%
Others1.7%
Copyright © ASAHI GROUP HOLDINGS. All rights reserved.24
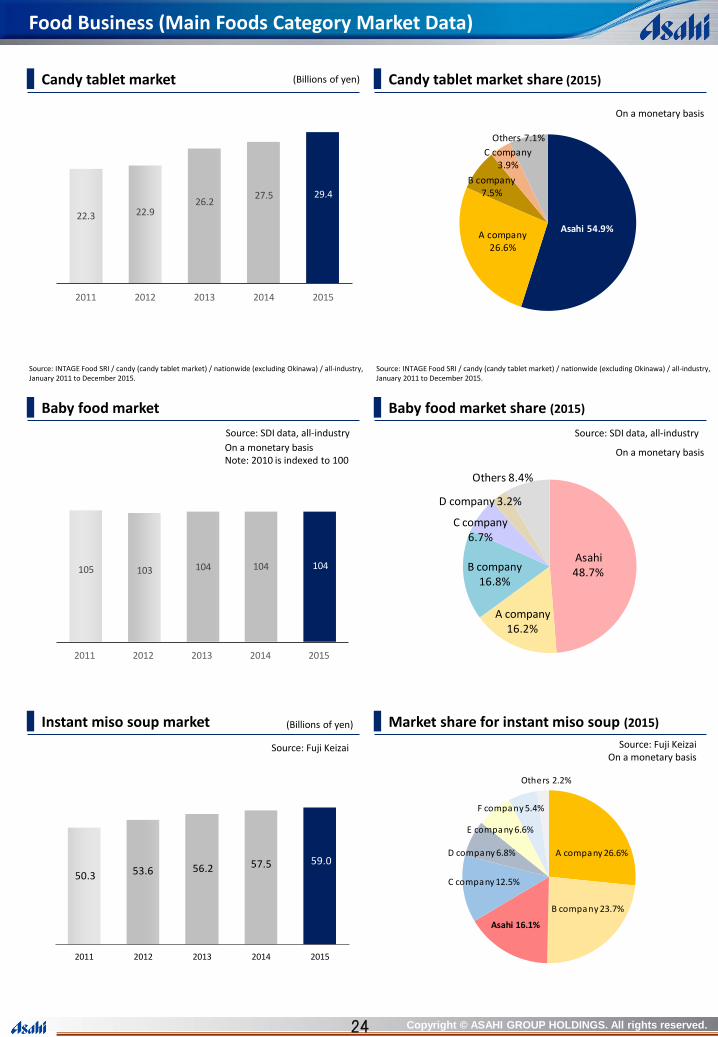
Baby food market Baby food market share (2015)
Food Business (Main Foods Category Market Data)
Instant miso soup market Market share for instant miso soup (2015)(Billions of yen)
Source: INTAGE Food SRI / candy (candy tablet market) / nationwide (excluding Okinawa) / all-industry, January 2011 to December 2015.
Candy tablet market Candy tablet market share (2015)(Billions of yen)
Source: INTAGE Food SRI / candy (candy tablet market) / nationwide (excluding Okinawa) / all-industry, January 2011 to December 2015.
Asahi 54.9%A company
26.6%
B company7.5%
C company3.9%
Others 7.1%
A company 26.6%
B company 23.7%
Asahi 16.1%
C company 12.5%
D company 6.8%
E company 6.6%
F company 5.4%
Others 2.2%
50.3 53.6 56.2 57.5 59.0
2011 2012 2013 2014 2015
105 103 104 104 104
2011 2012 2013 2014 2015
Asahi48.7%
A company16.2%
B company16.8%
C company6.7%
D company 3.2%
Others 8.4%
22.3 22.9 26.2
27.5 29.4
2011 2012 2013 2014 2015
On a monetary basis
Source: SDI data, all-industry
On a monetary basis
Source: SDI data, all-industry
On a monetary basisNote: 2010 is indexed to 100
Source: Fuji KeizaiOn a monetary basis
Source: Fuji Keizai

Copyright © ASAHI GROUP HOLDINGS. All rights reserved.25
(As of December 31, 2015)
Overseas Business (Asahi’s Overseas Business)
Overseas Business and Capital Alliances
Millions of cases (equivalent to 20×633ml bottles), YoY
Overseas Sales of Asahi Beer Brand
Sales volume
Sales composition by brand (2015)
Note: Growth rate in parenthesesSales composition by area (2015)
Investment in alcohol manufacturer
Investment in soft drink manufacturer
Production base
Investment ratio (subsidiaries)
Investment ratio (equity-method affiliates)
%
%
Shepherd Neam(U.K.)
Baltika Breweries(Russia)
Staropramen (Czech )
Boon Rawd Brewery (Thailand)
Molson Coors(Canada)
Permanis Sdn. Bhd. 100%
Asahi Indofood Beverage Makmur 51%
Etika Dairies Sdn Bhd. 100%
Malaysia
Indonesia
Calpis Osotspa Co., Ltd. 60%Thailand
Asahi Loi Hein Company 51%Myanmar
Creating integration synergies and improving business structure
Oceania
Schweppes Australia 100%
Mountain H2O 100%
The Better Drinks 100%
Independent Liquor (NZ) 100%
Asahi Premium Beverages 100%
Carlsberg (Malaysia)
Tsingtao Brewery 20%
Tingyi-Asahi Beverages Holding 30.4%
Beijing Beer Asahi 90%
Yantai Beer Tsingtao Asahi 40%
China Growth support for Chinese affiliates and expansion of Asahi brand
Southeast Asia
Network expansion in this growing market
4.44.9
5.56.3
6.87.5
8.6
81%
110%
113%
114%
108%111%
115%
2009 2010 2011 2012 2013 2014 2015
Asia 44.3%
Europe
14.3%
China14.9%
Oceania15.0%
North America11.4%
(+18%)
(-7%)
(+22%)
(+10%)
(+30%)
Super Dry94.6%
Others5.4%
(8.2 million cases)
(0.5 million cases)

Copyright © ASAHI GROUP HOLDINGS. All rights reserved.26
Overseas Business (Global Beer Market)
Source:Barth Report (Barth Haas Group)
(Million KL)
Top 15 Beer Producing Countries
Top 15 BreweriesSource:Barth Report (Barth Haas Group)
(Million KL)
Ranking Company CountryOutput 2014
(million KL)
World Share
(%)Output YoY
Output 2013
(million KL)
World Share
(%)
1 Anheuser-Busch InBev Belgium 40.99 21.2 2.7% 39.90 20.2
2 SABMiller United Kingdom 19.13 9.9 2.1% 18.74 9.5
3 Heineken Netherlands 18.83 9.7 5.6% 17.83 9.0
4 Carlsberg Denmark 12.03 6.2 0.5% 11.97 6.1
5 China Resources Snow Breweries China 11.74 6.1 0.3% 11.71 5.9
6 Tsingtao Brewery Group China 7.05 3.6 -10.0% 7.83 4.0
7 Molson Coors USA / Canada 5.81 3.0 -2.7% 5.97 3.0
8 Yanjing China 4.83 2.5 -15.4% 5.71 2.9
9 Kirin Japan 4.31 2.2 -12.6% 4.93 2.5
10 BGI / Groupe Castel France 2.98 1.5 4.9% 2.84 1.4
11 Petropolis Brazil 2.30 1.2 53.3% 1.50 0.8
12 Efes Group Turkey 2.07 1.1 -18.8% 2.55 1.3
13 Asahi Japan 2.05 1.1 -0.5% 2.06 1.0
14 Gold Star China 1.80 0.9 -7.7% 1.95 1.0
15 San Miguel Corporation Philippines 1.67 0.9 2.5% 1.63 0.8
15 comapanies total 137.59 71.2 0.3% 137.12 69.5
World Beer Production 193.29 -2.0% 197.30
Ranking Country 2007 2008 2009 2010 2011 2012 2013 2014 2015
1 China 39.31 41.03 42.36 44.83 48.99 49.02 50.65 49.67 47.16
2 USA 23.28 23.06 23.10 22.90 22.65 23.01 22.53 22.61 22.35
3 Brazil 9.60 10.63 10.70 12.87 13.30 13.28 13.47 14.14 13.86
4 Germany 10.40 10.29 9.81 9.57 9.55 9.46 9.44 9.53 9.56
5 Russia 11.50 11.40 10.85 10.29 9.81 9.76 8.93 8.22 7.82
6 Mexico 8.10 8.23 8.23 7.99 8.15 8.25 8.20 7.80 7.45
7 Japan 6.28 6.11 5.98 5.81 5.60 5.77 5.72 5.65 5.38
8 Vietnam 1.80 1.85 2.30 2.65 2.78 2.98 3.57 3.89 4.67
8 United Kingdom 5.13 4.96 4.51 4.50 4.57 4.30 4.20 4.43 4.41
9 Poland 3.55 3.56 3.22 3.60 3.60 3.93 3.96 3.95 3.98
11 Spain 3.44 3.34 3.38 3.34 3.36 3.30 3.27 3.35 3.48
12 South Africa 2.65 2.59 2.88 2.96 3.09 3.15 3.15 3.15 3.21
13 Nigeria 1.35 1.54 1.60 1.76 1.96 2.40 2.65 2.70 2.70
14 Netherlands 2.73 2.72 2.54 2.39 2.36 2.43 2.36 2.37 2.37
15 Thailand 2.17 2.07 2.14 1.95 2.06 2.37 2.31 2.21 2.36
15 countries total 131.29 133.39 133.60 137.40 141.83 143.40 144.40 143.67 140.75
World Beer Production 178.71 181.92 181.76 186.35 192.89 196.20 197.21 196.02 193.29

Copyright © ASAHI GROUP HOLDINGS. All rights reserved.
Schweppes sales composition by sales channel
27
In April 2009, Asahi purchased Schweppes Australia Pty Ltd, the second-largest beverage company in the stably growing Australian soft drink market, from the Cadbury Group.Schweppes Australia manufactures and markets own-
brand and licensed products in its mainstay category of carbonated beverages, as well as sports drinks and fruit juice.In 2011, Asahi purchased the juice and water businesses
of P&N Beverages Pty Ltd, Australia’s third-largest beverage company, and Charlie’s Group Limited (now The Better Drinks), a New Zealand-based company specializing in premium beverages. In 2012, it continued to strengthen and expand its business base in Oceania by purchasing bottled water specialist Mountain H2O.
(January to December 2015, cumulative)
On a monetary basis.
On a monetary basis.
Overseas Business (Oceania Beverage Business)
PepsiSchweppes Solo
Carbonated drinks Sports drink
Gatorade
Water
Schweppes sales composition by brand
(January to December 2015, cumulative) (January to December 2015, cumulative)
Oceania beverage business product lineup
On a monetary basis.
Schweppes sales composition by category
Oceania Beverage Business
FrantelleCool RidgeLightly Sparkling
Mountain H2OCool Ridge
Pepsi 24.1%
Schweppes18.3%
Gatorade6.5%Solo
6.6%
Cottee's4.6%Cool Ridge
4.7%
Sunkist 3.2%
Frantelle3.4%
Others28.4%
Cola CSDs24.9%
Non Cola CSDs22.2%
Water17.9%
Fruit Juice10.6%
Sports Drinks6.8%
Mixer7.2%
Cordial4.8%
Carbonated Mineral Water 2.9%
Energy 1.7% Tea 1.1%
Grocery
69.0%
Food services and QSR
8.5%
Reta il15.4%
P&C4.3%
Others2.8%
Cottee’s
Juice Tea
Real Iced Tea Co.
ConcentratedJuice
Extra JuicySpringValley
Charlie’sQuencher
Juicy LucyCharlie’sSmoothie
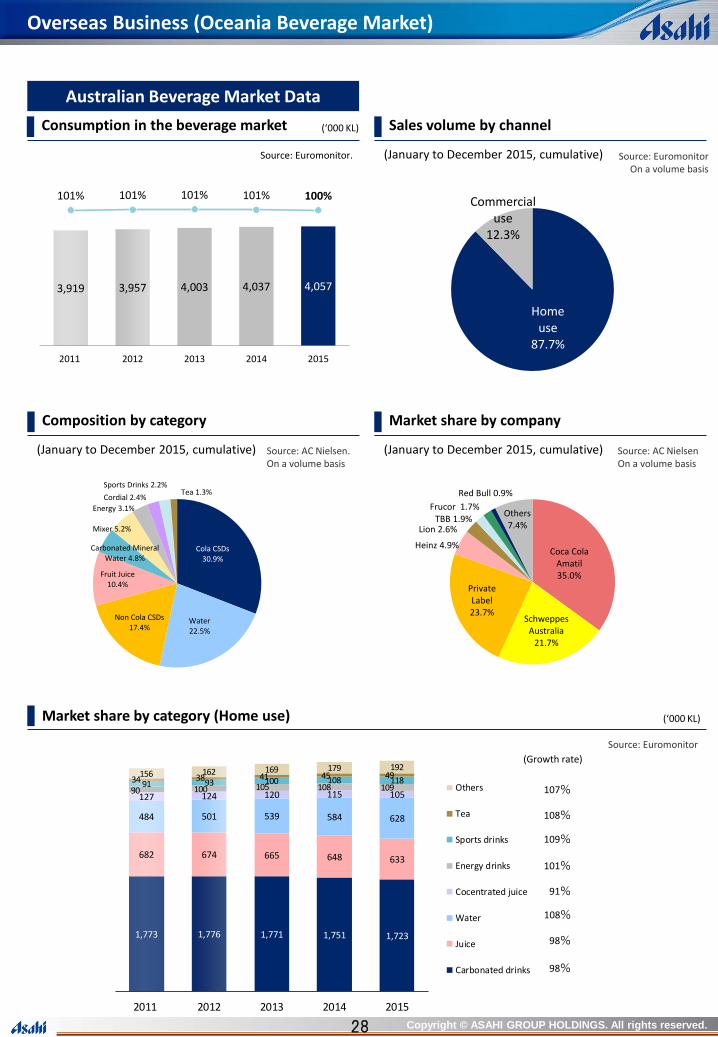
Copyright © ASAHI GROUP HOLDINGS. All rights reserved.28
98%
108%
91%
98%
101%
109%
(Growth rate)
108%
107%
Source: Euromonitor.
Source: Euromonitor
(January to December 2015, cumulative)
Consumption in the beverage market Sales volume by channel
Source: EuromonitorOn a volume basis
(January to December 2015, cumulative)
Market share by company
(January to December 2015, cumulative)
Composition by category
Source: AC Nielsen On a volume basis
Source: AC Nielsen.On a volume basis
Market share by category (Home use)
Australian Beverage Market Data
(‘000 KL)
(‘000 KL)
Overseas Business (Oceania Beverage Market)
1,773 1,776 1,771 1,751 1,723
682 674 665 648 633
484 501 539 584 628
127 124 120 115 105 90 100 105 108 109 91 93 100 108 118 34 38 41 45 49 156 162 169 179 192
2011 2012 2013 2014 2015
Others
Tea
Sports drinks
Energy drinks
Cocentrated juice
Water
Juice
Carbonated drinks
3,919 3,957 4,003 4,037 4,057
101% 101% 101% 101% 100%
2011 2012 2013 2014 2015
Cola CSDs30.9%
Water22.5%
Non Cola CSDs17.4%
Fruit Juice10.4%
Carbonated Mineral Water 4.8%
Mixer 5.2%
Energy 3.1%
Cordial 2.4%
Sports Drinks 2.2%Tea 1.3%
Coca Cola Amatil35.0%
Schweppes Australia
21.7%
Private Label23.7%
Heinz 4.9%
Lion 2.6%TBB 1.9%
Frucor 1.7%
Red Bull 0.9%
Others7.4%
Home use
87.7%
Commercial use
12.3%

Copyright © ASAHI GROUP HOLDINGS. All rights reserved.29
On a volume basis.
Source: Aztec & NielsenOn a volume basis.
Source: Aztec
On a monetary basis.
In September 2011, Asahi’s purchase of the Independent Liquor Group (henceforth, the IL Group) marked its full-fledged entry into the Oceania alcohol beverage market.Currently, a corporate group centered on Independent Liquor (NZ) Ltd. and Asahi Premium Beverages Pty Ltd manufactures and markets a multi-category lineup of alcohol drinks consisting mainly of RTD (low-alcohol) beverages, as well as spirits, wine, and beer, in New Zealand and Australia. As a beverage maker, Independent Liquor has built up a solid brand over the years.In April 2012, marketing responsibility for Asahi Super Dry
was transferred to Independent Distillers (NZ) Ltd., and in October of that year to Asahi Premium Beverages. In this way, we have strengthened and expanded our alcoholic beverage business in Oceania.
Oceania Alcohol Beverage Business
(January to December 2015, cumulative) (January to December 2015, cumulative)
Composition by category
On a monetary basis.
Main brands
Oceania RTD beverage market data
Independent Liquor (NZ)Asahi Premium Beverages (Australia)
(January to December 2015, cumulative)
New Zealand: Market share by company
(January to December 2015, cumulative)
Australia: Market share by company
Cider (apple)RTD
SomersbyVodka Cruiser
Cody’s
Light drinks(vodka-based)
Dark drinks(bourbon-based)
Woodstock Wild Side
Overseas Business (Oceania Alcohol Beverage Business)
Composition by category
RTD 33.6%
Cider 27.2%
Beer 20.5%
Exports8.5%
Consignment production 5.4%
Spirits 0.6%
Others 4.1%
RTD41.6%
Beer31.4%
Exports12.4%
Spirits6.0%
Consignment production4.3% Cider
3.5%
Wine 0.8%
Diageo28.9%
Beam 26.3%Brown
Forman17.0%
Asahi Premium Beverages
13.7%
Campari5.4%
Others8.8%
Independent Liquor51.4%Lion
30.9%
Beam10.1%
DB5.4%
Others 2.2%

Copyright © ASAHI GROUP HOLDINGS. All rights reserved.30
Overseas Business (Malaysian Beverage Business)
In November 2011, Asahi entered Malaysian soft drinks market through purchasing Permanis Sdn. Bhd., the second-largest beverage company in Malaysia.In 2014, Asahi purchased all of the issued shares in the
companies engaged in dairy business in Southeast Asia held by Etika International Holdings Limited and entered diary product business like condensed milk to strength the business foundation in Southeast soft drinks market.Now we launched Asahi brands like “WONDA” and “Calpis”
adjusted to the local taste in addition to “Pepsi” and “Tropicana” to enhance the business growth in Malaysian soft drinks market.
Malaysian Beverage Business
Main brands
Malaysian Beverages Market
Composition by categoryComposition by category
Composition by category Composition by business
Etika Dairies Sdn. BhdPermanis Sdn. Bhd.
On a monetary basis(January to December 2015, cumulative) (January to December 2015, cumulative) On a monetary basis
On a volume basis
Source: Euromonitor (January to December 2015, cumulative)(January to December 2015, cumulative)On a monetary basis
Source: Euromonitor
Carbonated drinks55.0%
Juice19.2%
Isotonic9.4%
RTD Tea5.8%
Others10.5%
Domestic Condensed
milk36.9%
Export Condensed
milk34.2%
Fresh milk9.8%
Vietnam10.5%
Indonesia 6.4%LL milk 1.7% Packaging 0.4%
Carbonated drinks32.5%
Bottled water12.0%
Sports drinks22.9%
Juice 13.3%
RTD Tea 5.7%
Asian Speciality dirnks 2.8%
Concentrates 4.0%
Energy drinks 4.0%RTD Coffee 2.7%
Carbonated drinks30.2%
Bottled water27.9%
Sports drinks18.9%
Juice10.5%
RTD Tea 5.5%
Asian Speciality dirnks 2.6%Concentrates 1.7%
Energy drinks 1.4%
RTD Coffee 1.3%
Pepsi Tropicana WONDA Revive Mountain Dew

Copyright © ASAHI GROUP HOLDINGS. All rights reserved.31
In September 2012, Asahi established a joint venture with PT Indofood CBP Sukses Makmur TBK, a subsidiary of Indonesia’s largest food company, PT Indofood Sukses Makmur TBK, to produce and market beverages in Indonesia.
In September 2013, Asahi purchased PT Pepsi-Cola Indobeverages, the country’s Pepsi bottler, and in November it concluded an agreement with PT Multi Bahagia to purchase assets related to Club, Indonesia’s No. 2 brand of mineral water. These transactions have expanded Asahi’s business base in Indonesia.Asahi began participating directly in the Indonesian beverage
market in December 2013 with the introduction of Ichi Ocha, its first own-brand drink in the Indonesian market.
Own brands Pepsi brands
Indonesian Beverage Business
Indonesian Beverage Market
Club brand
Main brands
Sales composition by product category (2015) Sales composition by product category (2015)
Indonesian Beverage Business Capital Arrangements
ICHI OCHA Cafela Pepsi Twister Club
Source: CanadeanSource: Canadean
Overseas Business (Indonesian Beverage Business)
Bulk/HOD Water
55.4%Packaged Water
29.4%
Iced/RTD Tea Drinks 5.7%
Carbonates 2.9%
Sports Drinks 1.6%
Energy Drinks1.0%
Others 3.9%
Bulk/HOD
Water…
Packaged Water35.8%
Iced/RTD Tea Drinks 21.0%
Carbonates
8.3%
Sports Drinks4.7%
Energy Drinks8.0%
Others
11.2%
100%
49%
PT Tirta Makmur Perkasa
(水販売会社 )
PT Tirta Sukses Perkasa
(水製造会社 )
51%
80%
PT Prima Cahaya Indobeverages(旧PT Pepsi-Cola Indobeverages)
80%
51%49%
PT Indofood Asahi Sukses Beverage
(販売会社)
20% 20%
PT Asahi Indofood Beverage Makmur
(製造会社)
アサヒグループ インドフードグループ
PT Multi Bahagia
100%
49%
PT Tirta Makmur Perkasa
(水販売会社 )
PT Tirta Sukses Perkasa
(水製造会社 )
51%
80%
PT Prima Cahaya Indobeverages(旧PT Pepsi-Cola Indobeverages)
80%
51%49%
PT Indofood Asahi Sukses Beverage
(販売会社)
20% 20%
PT Asahi Indofood Beverage Makmur
(製造会社)
アサヒグループ インドフードグループ
PT Multi Bahagia
Asahi Group
PT Asahi Indofood Beverage Makmur(manufacturing company)
PT Indofood Asahi Sukses Beverage(marketing company)
PT Tirta Sukses Perkasa
(water production company)PT Tirta Makmur Perkasa
(water marketing company)
PT Indofood Group
On a volume basis. On a monetary basis.
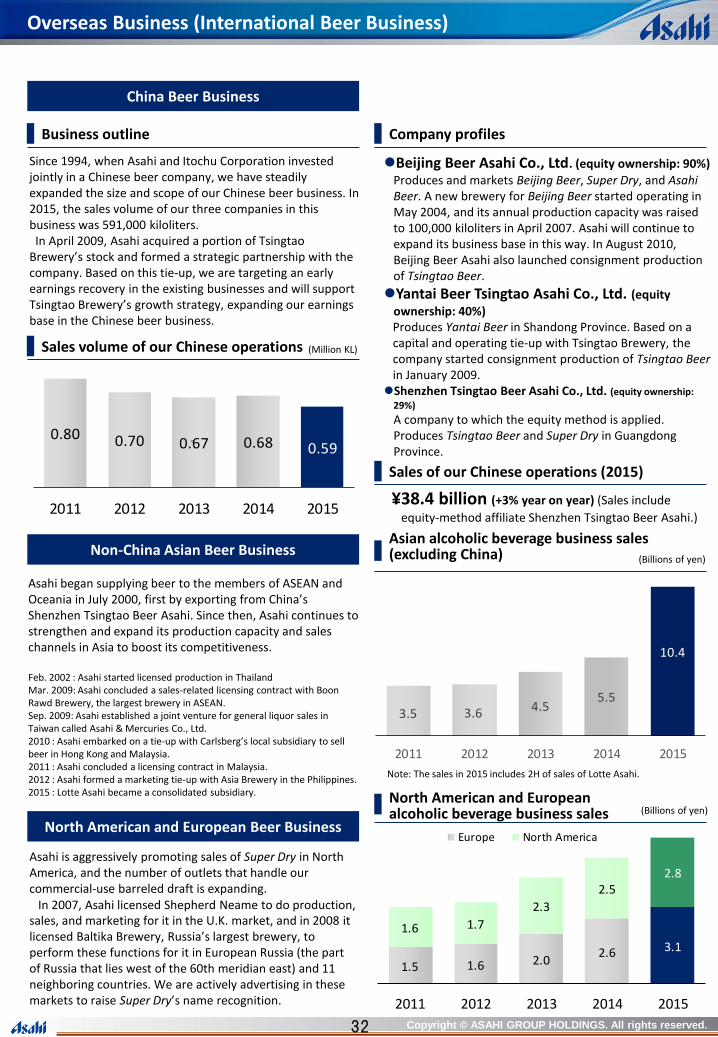
Copyright © ASAHI GROUP HOLDINGS. All rights reserved.32
Asahi began supplying beer to the members of ASEAN and Oceania in July 2000, first by exporting from China’s Shenzhen Tsingtao Beer Asahi. Since then, Asahi continues to strengthen and expand its production capacity and sales channels in Asia to boost its competitiveness.
Feb. 2002 : Asahi started licensed production in ThailandMar. 2009: Asahi concluded a sales-related licensing contract with Boon Rawd Brewery, the largest brewery in ASEAN.Sep. 2009: Asahi established a joint venture for general liquor sales in Taiwan called Asahi & Mercuries Co., Ltd.2010 : Asahi embarked on a tie-up with Carlsberg’s local subsidiary to sell beer in Hong Kong and Malaysia.2011 : Asahi concluded a licensing contract in Malaysia.2012 : Asahi formed a marketing tie-up with Asia Brewery in the Philippines.2015 : Lotte Asahi became a consolidated subsidiary.
Beijing Beer Asahi Co., Ltd. (equity ownership: 90%)
Produces and markets Beijing Beer, Super Dry, and Asahi Beer. A new brewery for Beijing Beer started operating in May 2004, and its annual production capacity was raised to 100,000 kiloliters in April 2007. Asahi will continue to expand its business base in this way. In August 2010, Beijing Beer Asahi also launched consignment production of Tsingtao Beer.
Yantai Beer Tsingtao Asahi Co., Ltd. (equity
ownership: 40%)Produces Yantai Beer in Shandong Province. Based on a capital and operating tie-up with Tsingtao Brewery, the company started consignment production of Tsingtao Beerin January 2009.
Shenzhen Tsingtao Beer Asahi Co., Ltd. (equity ownership:
29%)
A company to which the equity method is applied. Produces Tsingtao Beer and Super Dry in Guangdong Province.
Since 1994, when Asahi and Itochu Corporation invested jointly in a Chinese beer company, we have steadily expanded the size and scope of our Chinese beer business. In 2015, the sales volume of our three companies in this business was 591,000 kiloliters.In April 2009, Asahi acquired a portion of Tsingtao
Brewery’s stock and formed a strategic partnership with the company. Based on this tie-up, we are targeting an early earnings recovery in the existing businesses and will support Tsingtao Brewery’s growth strategy, expanding our earnings base in the Chinese beer business.
Asahi is aggressively promoting sales of Super Dry in North America, and the number of outlets that handle our commercial-use barreled draft is expanding.
In 2007, Asahi licensed Shepherd Neame to do production, sales, and marketing for it in the U.K. market, and in 2008 it licensed Baltika Brewery, Russia’s largest brewery, to perform these functions for it in European Russia (the part of Russia that lies west of the 60th meridian east) and 11 neighboring countries. We are actively advertising in these markets to raise Super Dry’s name recognition.
(Million KL)
Business outline Company profiles
¥38.4 billion (+3% year on year) (Sales include
equity-method affiliate Shenzhen Tsingtao Beer Asahi.)
Sales volume of our Chinese operations
North American and European alcoholic beverage business sales (Billions of yen)
Asian alcoholic beverage business sales (excluding China)
Sales of our Chinese operations (2015)
China Beer Business
Non-China Asian Beer Business
North American and European Beer Business
Overseas Business (International Beer Business)
0.80 0.70 0.67 0.68 0.59
2011 2012 2013 2014 2015
10
3.5 3.6 4.55.5
10.4
2011 2012 2013 2014 2015
Note: The sales in 2015 includes 2H of sales of Lotte Asahi.
1.5 1.6 2.02.6 3.1
1.6 1.7
2.3
2.52.8
2011 2012 2013 2014 2015
Europe North America
(Billions of yen)

Copyright © ASAHI GROUP HOLDINGS. All rights reserved.33
Unit: Million KL Volume YoY
Total 8.48 -7.4%
Of which: Tsingtao brand 4.16 -7.6%
This is a company to which the equity method is applied. Asahi Beer acquired a portion of Tsingtao Brewery’s stock in April 2009. It also formed a strategic partnership with Tsingtao to reinforce its business base in the Chinese beer market.Tsingtao Brewery was founded in 1903, and since assuming
its present corporate organization in 1993 it has become the No. 2 company in the Chinese beer market. It enjoys an overwhelming market share in Shandong Province, and its sales network for the flagship Tsingtao Beer brand and other products has expanded to all of China. The company now fosters the premium brand to improve their portfolio.
Sales in 2015 (January to December)
27,635 million yuan (-5% year on year)
Production bases
58 (in 20 provinces, cities, and autonomous regions)
Sales in 2015 (January to September) Sales volume
(Millions of yuan)Net sales and operating income
Brand composition(January to December 2015, cumulative)
Sales value by area(January to December 2015, cumulative)
On a volume basis. On a monetary basis.
Tsingtao Brewery
Net sales Operating income
Tsingtao Tsingtao Pure Draft
Beer
AugertaHans Pure Draft Beer
Shansui Laoshan Beer
Overseas Business (Chinese Beer Business)
(Million KL)

Copyright © ASAHI GROUP HOLDINGS. All rights reserved.34
Source: Euromonitor
Source: Each company’s Annual Report. Exchange rates are 1 yuan = ¥18.4 and 1 Hong Kong dollar = ¥15.5 (the latter applies only to Snow Beer).
(January to December 2015, cumulative)
(January to December 2015, cumulative)
(January to December 2014, cumulative)
+3% +1% -14% +3% +8% +1% -17%(Growth rate)
+9%
Sales results of China’s top beer companies (2015)
Chinese beer consumption Chinese sales volume by channel
Sales composition by price range Production volume by province
Chinese Beer Market Data
Source: EuromonitorOn a Volume basis
Source: EuromonitorOn a volume basis
(Million KL)
Source: China Alcoholic Drinks Industry Association.
(Million KL )
Overseas Business (Chinese Beer Market)
48 49 51 51 52
105% 103% 103% 100% 103%
2011 2012 2013 2014 2015
Total Growth rate
Home
use48.6%
Commercial
use51.4%
High-priced6.3%
Medium-
priced14.5%
Low-priced79.2%
7.4
4.3 4.0
2.7 2.7 2.21.6
0.6
Shandong Guangdong Henan Liaoning Zhejiang Hubei Beijiing Shanghai
Production
Volume
Million KLBill ions of
Yuan
Bill ions of
Yen
Bill ions of
Yuan
Bill ions of
Yen
Snow Beer 11.7 -1% 24.8% 34.8 539.7 0.8 12.9 SABMiller
Tsingtao Brewery 8.5 -7% 18.0% 27.6 508.5 1.7 31.5 Asahi
AB InBev Group 7.5 +4% 15.8% undisclosed undisclosesd undisclosed undisclosed
Yanjing Beer (Beijing) 4.8 -9% 10.2% 12.5 230.7 0.6 10.8
Zhujiang Brewery (Guangzhou) 1.2 -1% 2.5% 3.5 64.7 0.1 1.5
Total 47.2 -5% - - -
Foreign tie-upCompany Growth rate Share
Net Sales Net Income

Copyright © ASAHI GROUP HOLDINGS. All rights reserved.35
On a volume basis.Source: AC Nielsen.
This is a company to which the equity method is applied. In 2004, Asahi and Itochu Corporation established a joint-
venture soft drink company with Tingyi Holding Corporation, China’s largest food business group.In the Chinese soft drink market, which is expanding
quickly due to rapid economic development, Tingyi-Asahi Beverages has gained the top share in tea-type beverages and water category. In 2012, it acquired PepsiCo’s Chinese bottling business, giving it the No. 1 position in the entire soft drink market.
(Millions of USD)
US$5,244 million (–10% year on year)
Note: Tingyi-Asahi beverage business results.
100
Tingyi-Asahi beverage business sales
■Share by category in China beverage market (April 2015 to March 2016, cumulative)
Water category
RTD tea category
Juice-type beverage category
Milk tea category
Tingyi-Asahi Beverages Holding Co. Ltd. (China)
Net sales Business profit
Note: Includes traditional drinks
Overseas Business (Chinese Beverage Business)
Sales in 2015 (January to December)
Production bases

Copyright © ASAHI GROUP HOLDINGS. All rights reserved.36
(April 2015 to March 2016, cumulative) (April 2015 to Mach 2016, cumulative)
(January to December 2015, cumulative) Source: EuromonitorOn a volume basis
Source: AC Nielsen On a volume basis
Source: Euromonitor
Consumption in the beverage marketChinese sales volume composition by sales channel
Market share by company Composition by category
Chinese Beverage Market Data
Source: AC NielsenOn a volume basis
(Million KL)
Overseas (Chinese Beverage Market)
69 7483 89 89
109% 107%113%
107%99%
2011 2012 2013 2014 2015
Market Total Growth rate
Home use
90.7%
Commercial use
9.3%
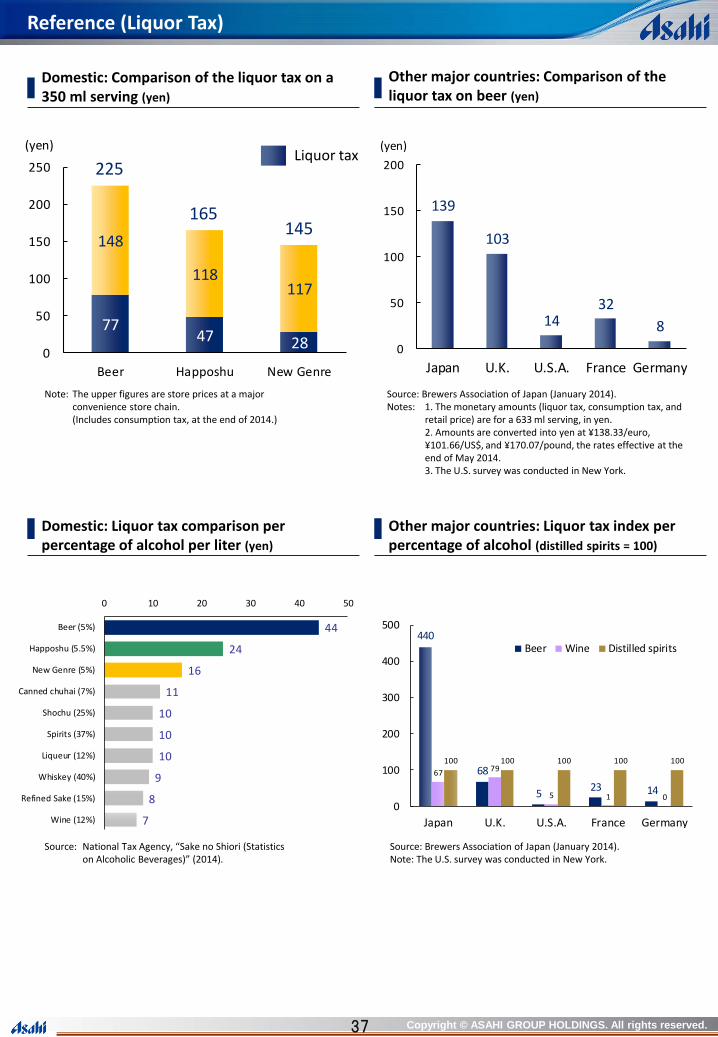
Copyright © ASAHI GROUP HOLDINGS. All rights reserved.37
Note: The upper figures are store prices at a major convenience store chain.(Includes consumption tax, at the end of 2014.)
Reference (Liquor Tax)
Domestic: Comparison of the liquor tax on a 350 ml serving (yen)
Source: Brewers Association of Japan (January 2014).Notes: 1. The monetary amounts (liquor tax, consumption tax, and
retail price) are for a 633 ml serving, in yen.2. Amounts are converted into yen at ¥138.33/euro, ¥101.66/US$, and ¥170.07/pound, the rates effective at the end of May 2014.3. The U.S. survey was conducted in New York.
Other major countries: Comparison of the liquor tax on beer (yen)
Source: National Tax Agency, “Sake no Shiori (Statistics on Alcoholic Beverages)” (2014).
Domestic: Liquor tax comparison per percentage of alcohol per liter (yen)
Source: Brewers Association of Japan (January 2014).Note: The U.S. survey was conducted in New York.
Other major countries: Liquor tax index per percentage of alcohol (distilled spirits = 100)
139
103
1432
8
0
50
100
150
200
Japan U.K. U.S.A. France Germany
(yen)
7747 28
148
118117
0
50
100
150
200
250
Beer Happoshu New Genre
(yen)
225
165145
Liquor tax
44
24
16
11
10
10
10
9
8
7
0 10 20 30 40 50
Beer (5%)
Happoshu (5.5%)
New Genre (5%)
Canned chuhai (7%)
Shochu (25%)
Spirits (37%)
Liqueur (12%)
Whiskey (40%)
Refined Sake (15%)
Wine (12%)
440
68
523 14
6779
5 1 0
100 100 100 100 100
0
100
200
300
400
500
Japan U.K. U.S.A. France Germany
Beer Wine Distilled spirits