Embed Size (px)
Citation preview

Costa et al. BMC Health Services Research 2014, 14:49http://www.biomedcentral.com/1472-6963/14/49
RESEARCH ARTICLE Open Access
Factors associated with quality of services formarginalized groups with mental healthproblems in 14 European countriesDiogo Costa1,2*, Aleksandra Matanov3, Reamonn Canavan4, Edina Gabor5, Tim Greacen6, Petra Vondráčková7,Ulrike Kluge8, Pablo Nicaise9, Jacek Moskalewicz10, José Manuel Díaz–Olalla11, Christa Straßmayr12, Martijn Kikkert13,Joaquim JF Soares14, Andrea Gaddini15, Henrique Barros1,2 and Stefan Priebe3
Abstract
Background: Different service characteristics are known to influence mental health care delivery. Much less isknown about the impact of contextual factors, such as the socioeconomic circumstances, on the provision of careto socially marginalized groups.The objectives of this work were to assess the organisational characteristics of services providing mental health carefor marginalized groups in 14 European capital cities and to explore the associations between organisationalquality, service features and country-level characteristics.
Methods: 617 services were assessed in two highly deprived areas in 14 European capital cities. A Quality Index ofService Organisation (QISO) was developed and applied across all sites. Service characteristics and country levelsocioeconomic indicators were tested and related with the Index using linear regressions and random interceptlinear models.
Results: The mean (standard deviation) of the QISO score (minimum = 0; maximum = 15) varied from 8.63 (2.23) inIreland to 12.40 (2.07) in Hungary. The number of different programmes provided was the only service characteristicsignificantly correlated with the QISO (p < 0.05). The national Gross Domestic Product (GDP) was inverselyassociated with the QISO. Nearly 15% of the variance of the QISO was attributed to country-level variables, withGDP explaining 12% of this variance.
Conclusions: Socioeconomic contextual factors, in particular the national GDP are likely to influence theorganisational quality of services providing mental health care for marginalized groups. Such factors should beconsidered in international comparative studies. Their significance for different types of services should be exploredin further research.
Keywords: Mental health services, Quality index of service organization, Socially marginalized groups,Multi-level analysis
* Correspondence: [email protected] of Clinical Epidemiology, Predictive Medicine and Public Health,University of Porto Medical School, Alameda Prof Hernani Monteiro,4200-319 Porto, Portugal2Institute of Public Health, University of Porto, Rua das Taipas,135, 4050-600 Porto, PortugalFull list of author information is available at the end of the article
© 2014 Costa et al.; licensee BioMed Central Ltd. This is an Open Access article distributed under the terms of the CreativeCommons Attribution License (http://creativecommons.org/licenses/by/2.0), which permits unrestricted use, distribution, andreproduction in any medium, provided the original work is properly credited.

Costa et al. BMC Health Services Research 2014, 14:49 Page 2 of 12http://www.biomedcentral.com/1472-6963/14/49
BackgroundRisk factors for poor mental health, including socialmarginalisation, are particularly common in large capitalcities [1,2] and these environments deserve more focusin comparative studies on the provision of care for mar-ginalized groups [3]. It has been suggested that compre-hensive services addressing a range of different needsmight be more efficient in delivering care to marginal-ized groups with high prevalence of mental disorders,such as the homeless, refugees and asylum seekers,Roma populations, sex workers and the long-term un-employed [4-9].However, variation in the provision of health services,
especially for vulnerable groups, can be attributed notonly to the type of clients the units serve but also to theenvironment or broader context in which service is pro-vided, as reflected in countries’ socioeconomic character-istics [10,11].The current paper aims to:
– describe an Index developed to measure services’organisation in the context of mental health careprovided to socially marginalized people in Europe –the Quality Index of Service Organisation (QISO);
– test how the characteristics of services areassociated with this created Index;
– test how country socioeconomic indicators impacton the Index when comparing European capitals.
MethodsGood practices in mental health care for socially margin-alized groups in Europe were identified through thePROMO project - Best Practice in Promoting MentalHealth in Socially Marginalized People in Europe [12].PROMO was designed to assess programmes and sys-tems of services in 14 European countries providingmental health care to socially marginalized groups. Ser-vices were assessed in terms of their organisational char-acteristics, type of clients, components of care andfunding arrangements, and how these services intercon-nect to form systems [12].The study focused on the following six social groups:
the long-term unemployed, the homeless, street sexworkers, asylum seekers and refugees, irregular migrantsand travelling communities. Data collection was con-ducted within highly deprived areas of the capital citiesof the following 14 European countries: Austria,Belgium, Czech Republic, France, Italy, Germany,Hungary, Ireland, Netherlands, Poland, Portugal, Spain,Sweden and United Kingdom.A total of 28 highly deprived geographical areas, two in
each participating capital city, were identified using local in-dices of public health and social deprivation. The popula-tion size of each area was intended to be between 80,000
and 150,000 inhabitants, with some flexibility to accom-modate different local contexts. If chosen areas were toosmall, they were combined to achieve the target size. Theselected areas were: Vienna: District 16 and District 20;Brussels: Schaerbeek & St Josse and Molenbeek; Prague:Prague 3 & 7 and Prague 8; Paris: Secteur Flandre inthe 19th arrondissement of Paris and La Courneuve &Aubervilliers in Seine-Saint-Denis; Berlin: Weddingand Kreuzberg; Budapest: District 8 and District 7 & 9;Rome: District 7 and District 15; Dublin: Dublin NorthCentral and Dublin West; Amsterdam: Bos en Lommer &De Baarsjes & Geuzenveld-Slotermeer and AmsterdamZuid Oost; Warsaw: Praga Polnoc and Wola; Lisbon:Marvila & Santa Maria dos Oliváis and a group of smallerareas (Anjos, Castelo, Encarnação, Graça, Madalena,Mercês, Pena, Penha de França, Santa Catarina, SantaEngrácia, Santa Justa, Santiago, Santo Estêvão, Santos-o-Velho, São Cristóvão e São Lourenço, São José, São Miguel,São Nicolau, São Paulo, São Vicente de Fora, Sé, Socorro);Madrid: Villaverde and Centro; Stockholm: Rinkeby-Kysta& Spånga-Tensta & Skarpnäk and Sodermalm; London:Hackney and Tower Hamlets [13].The aim was to assess all mental health, social care and
general health services that potentially serve marginalizedgroups with mental health problems. Their organisationalcharacteristics and components, including the type of pro-vider, funding, accessibility, routine data collection, charac-teristics of staff and programmes provided to people withmental disorders from the marginalized groups wereassessed using the PROMO Tool for Assessment of Services(available online) [14]. This structured questionnaire wasdeveloped through a Delphi process involving experts fromthe 14 countries. An online platform was developed to fa-cilitate exchange of information amongst participants in-volved in this process. The final version of the instrumentwas translated into the languages of participating countriesand three pilot interviews were conducted in each capitalto assess applicability and suitability.Data collection was focused on the two identified de-
prived areas, however, services located outside theseareas were also assessed if they were used by clientsfrom the target areas. Available directories and lists wereused to identify relevant services, as well as informationfrom local clinicians and experts. Service managers or amember of the staff with relevant knowledge were thencontacted via email, telephone or post, and invited toparticipate after a detailed explanation of the purpose ofthe study and its implications. They were assessedthrough face to face or telephone interviews.Ethical approval was not required for this study, as no
patient data were collected.The services were classified on the basis of their pri-
mary focus of care (mental health, general health or so-cial care services) and with regard to the population
Costa et al. BMC Health Services Research 2014, 14:49 Page 3 of 12http://www.biomedcentral.com/1472-6963/14/49
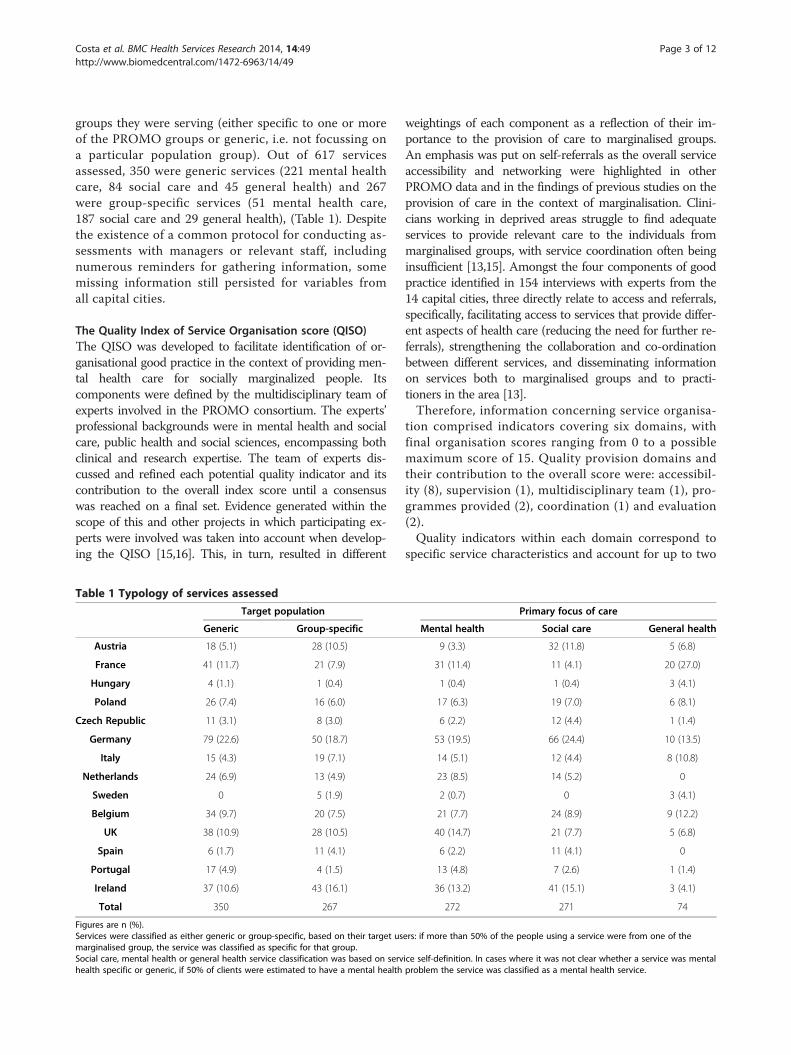
groups they were serving (either specific to one or moreof the PROMO groups or generic, i.e. not focussing ona particular population group). Out of 617 servicesassessed, 350 were generic services (221 mental healthcare, 84 social care and 45 general health) and 267were group-specific services (51 mental health care,187 social care and 29 general health), (Table 1). Despitethe existence of a common protocol for conducting as-sessments with managers or relevant staff, includingnumerous reminders for gathering information, somemissing information still persisted for variables fromall capital cities.
The Quality Index of Service Organisation score (QISO)The QISO was developed to facilitate identification of or-ganisational good practice in the context of providing men-tal health care for socially marginalized people. Itscomponents were defined by the multidisciplinary team ofexperts involved in the PROMO consortium. The experts’professional backgrounds were in mental health and socialcare, public health and social sciences, encompassing bothclinical and research expertise. The team of experts dis-cussed and refined each potential quality indicator and itscontribution to the overall index score until a consensuswas reached on a final set. Evidence generated within thescope of this and other projects in which participating ex-perts were involved was taken into account when develop-ing the QISO [15,16]. This, in turn, resulted in different
Table 1 Typology of services assessed
Target population
Generic Group-specific
Austria 18 (5.1) 28 (10.5)
France 41 (11.7) 21 (7.9)
Hungary 4 (1.1) 1 (0.4)
Poland 26 (7.4) 16 (6.0)
Czech Republic 11 (3.1) 8 (3.0)
Germany 79 (22.6) 50 (18.7)
Italy 15 (4.3) 19 (7.1)
Netherlands 24 (6.9) 13 (4.9)
Sweden 0 5 (1.9)
Belgium 34 (9.7) 20 (7.5)
UK 38 (10.9) 28 (10.5)
Spain 6 (1.7) 11 (4.1)
Portugal 17 (4.9) 4 (1.5)
Ireland 37 (10.6) 43 (16.1)
Total 350 267
Figures are n (%).Services were classified as either generic or group-specific, based on their target usmarginalised group, the service was classified as specific for that group.Social care, mental health or general health service classification was based on servhealth specific or generic, if 50% of clients were estimated to have a mental health
weightings of each component as a reflection of their im-portance to the provision of care to marginalised groups.An emphasis was put on self-referrals as the overall serviceaccessibility and networking were highlighted in otherPROMO data and in the findings of previous studies on theprovision of care in the context of marginalisation. Clini-cians working in deprived areas struggle to find adequateservices to provide relevant care to the individuals frommarginalised groups, with service coordination often beinginsufficient [13,15]. Amongst the four components of goodpractice identified in 154 interviews with experts from the14 capital cities, three directly relate to access and referrals,specifically, facilitating access to services that provide differ-ent aspects of health care (reducing the need for further re-ferrals), strengthening the collaboration and co-ordinationbetween different services, and disseminating informationon services both to marginalised groups and to practi-tioners in the area [13].Therefore, information concerning service organisa-
tion comprised indicators covering six domains, withfinal organisation scores ranging from 0 to a possiblemaximum score of 15. Quality provision domains andtheir contribution to the overall score were: accessibil-ity (8), supervision (1), multidisciplinary team (1), pro-grammes provided (2), coordination (1) and evaluation(2).Quality indicators within each domain correspond to
specific service characteristics and account for up to two
Primary focus of care
Mental health Social care General health
9 (3.3) 32 (11.8) 5 (6.8)
31 (11.4) 11 (4.1) 20 (27.0)
1 (0.4) 1 (0.4) 3 (4.1)
17 (6.3) 19 (7.0) 6 (8.1)
6 (2.2) 12 (4.4) 1 (1.4)
53 (19.5) 66 (24.4) 10 (13.5)
14 (5.1) 12 (4.4) 8 (10.8)
23 (8.5) 14 (5.2) 0
2 (0.7) 0 3 (4.1)
21 (7.7) 24 (8.9) 9 (12.2)
40 (14.7) 21 (7.7) 5 (6.8)
6 (2.2) 11 (4.1) 0
13 (4.8) 7 (2.6) 1 (1.4)
36 (13.2) 41 (15.1) 3 (4.1)
272 271 74
ers: if more than 50% of the people using a service were from one of the
ice self-definition. In cases where it was not clear whether a service was mentalproblem the service was classified as a mental health service.

Costa et al. BMC Health Services Research 2014, 14:49 Page 4 of 12http://www.biomedcentral.com/1472-6963/14/49
points of the score as detailed in Table 2. Accessibilityincludes indicators on service opening hours, the exist-ence of exclusion criteria for clients, and accepting self-referrals. Supervision refers to the provision of internalor external staff supervision of any type. Multidisciplin-ary team is defined as having staff with both mentalhealth and social care professional backgrounds. Pro-grammes provided refers to active outreach programmesand/or home visits to clients as well as case-finding. Co-ordination refers to services having routine meetingswith other services. Finally, Evaluation includes indica-tors on recording data on input and attendance, as wellas data on client satisfaction.
Service-level variablesIn addition to service characteristics, which correspond tothe indicators of quality of service organisation, a numberof other service features were recorded during the PROMOassessments. In the current analysis, the total number ofstaff (measured in whole time equivalents, with the numberof hours per week defined by each respondent according tohis/her national norm) and the number of care pro-grammes provided were used as service-level covariates,due to their importance to the quality of health provision,as asserted in the relevant literature [17], including mentalhealth care studies [18]. Programmes were defined as spe-cific health care or social interventions that each service po-tentially provides to their clients. Each service was assessed
Table 2 Quality Index of Service Organisation–domains, consto the overall score
Domain Indicator Definition
Accessibility Days open Open everyday Mon
Opening hours: a. Open outsidenormal office hours
Open anytime outsi
Opening hours: b. Open atweekend
Open at weekend (a
Exclusion criteria: a. Lack ofmotivation
No to ‘lack of motiv
Exclusion criteria: b. Command oflanguage
No to “command of
Exclusion criteria: c. Addictions No to “addictions”
Self-referrals Yes to self-referrals
Staff supervision Any supervision internal/external Yes to any supervisi
Multidisciplinaryteam
Presence of multidisciplinary team Yes to any combinamental health and o
Programmesprovided
Active outreach/home visits Yes to active outrea
Case finding Yes to case finding
Coordination Routine meetings with otherservices
Yes to routine meet
Evaluation Recording data on input,attendance and satisfaction
Yes to recording da
Yes to recording ou
using a specific list of programmes: active outreach, case-finding, home visits, counselling, individual psychotherapy,group psychotherapy, self-help groups, occupationaltherapy, medication, detoxification and acute withdrawaltreatment, drug addiction treatment, alcohol addictiontreatment, direct practical help in clients’ homes, befriend-ing, leisure activities support, mental health advocacy, socialwelfare support, housing/accommodation advice and sup-port, legal advice and support, job coaching/finding, mentalhealth promotion measures and any other programmesspecified by the service being assessed.
Country-level variablesThree Eurostat country-level socioeconomic indicatorswere included and tested: the country Gross DomesticProduct (GDP), the Material Deprivation rate and theGini coefficient. The GDP is a commonly used measurefor assessing a country’s wealth or socioeconomic status,while the Gini coefficient is a measure of income in-equality which has been correlated with the prevalenceof poor health outcomes and mental disorders [19]. TheMaterial deprivation rate was also chosen because of itsdirect relevance to the marginalized groups studied, andis considered as an ecological measure of country’s bur-den of social marginalization [20-22].The Gross Domestic Product per capita in Purchasing
Power Standards (PPS) (2008) has been defined byEurostat as the value of all goods and services produced
tituting indicators, definition of indicators and their value
Value
-Fri 1
de normal office hours (Mon-Fri) 1
nytime) 1
ation’ 1
language of the host country” 1
1
2
on (internal/external) 1
tion of mental health and social care professionals (at least onene social care professional)
1
ch or home visits 1
1
ings 1
ta on input and attendance 1
tcome data on satisfaction and experience 1
Costa et al. BMC Health Services Research 2014, 14:49 Page 5 of 12http://www.biomedcentral.com/1472-6963/14/49
less the value of any goods or services used in their cre-ation. The volume index of GDP per capita in Purchas-ing Power Standards is expressed in relation to theEuropean Union (EU-27) average set to equal 100. Acountry index higher than 100 corresponds to GDP percapita higher than the EU average. Basic figures areexpressed in PPS, a common currency that eliminatesdifferences in price levels between countries, thus allow-ing meaningful volume comparisons of GDP betweencountries. This index is intended for cross-country ra-ther than for temporal comparisons.The Gini coefficient (2008) as a measure of income in-
equality is conceptualised as the relationship of cumulativeshares of the population arranged according to the level ofequalized disposable income, to the cumulative share of theequalized total disposable income received by them. Thehigher the Gini coefficient, the more inequality exists.The Material Deprivation rate by poverty status (2008) is
the percentage of the population with an enforced lack ofat least three out of nine material deprivation items depict-ing material living conditions, such as housing conditions,possession of durables, and capacity to afford basic require-ments [23]. The term ‘enforced lack’ refers to people wish-ing to possess items, but not being able to afford them andthe items in question are part of a predefined ‘economicstrain and durables’ dimension. ‘Economic strain’ refers topeople not being able to afford to do things they would liketo do, such as taking a week’s annual holiday away fromhome, paying a mortgage, rent, utility bills or hire purchaseinstalments, having a meal with meat, chicken or fish everysecond day, keeping their home adequately warm, or beingable to face unexpected expenses. The durables dimensioncorresponds to enforced lack of items such as a colour TV,a telephone, a personal car or a washing machine [24].
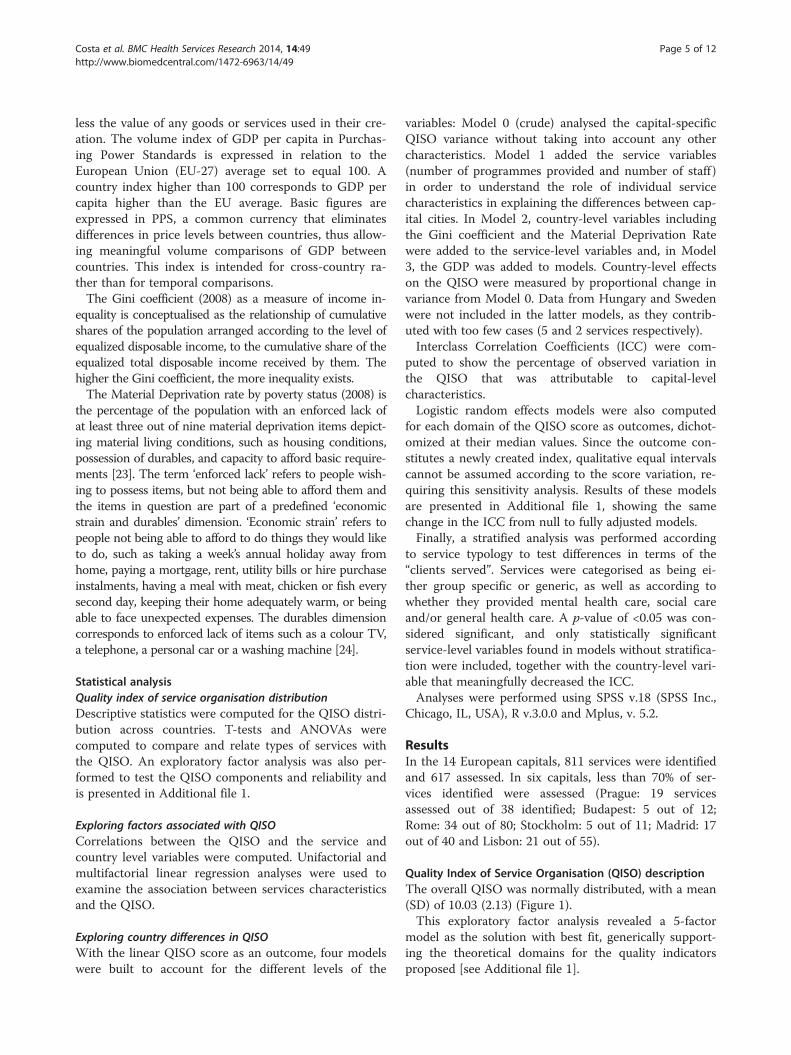
Statistical analysisQuality index of service organisation distributionDescriptive statistics were computed for the QISO distri-bution across countries. T-tests and ANOVAs werecomputed to compare and relate types of services withthe QISO. An exploratory factor analysis was also per-formed to test the QISO components and reliability andis presented in Additional file 1.
Exploring factors associated with QISOCorrelations between the QISO and the service andcountry level variables were computed. Unifactorial andmultifactorial linear regression analyses were used toexamine the association between services characteristicsand the QISO.
Exploring country differences in QISOWith the linear QISO score as an outcome, four modelswere built to account for the different levels of the
variables: Model 0 (crude) analysed the capital-specificQISO variance without taking into account any othercharacteristics. Model 1 added the service variables(number of programmes provided and number of staff )in order to understand the role of individual servicecharacteristics in explaining the differences between cap-ital cities. In Model 2, country-level variables includingthe Gini coefficient and the Material Deprivation Ratewere added to the service-level variables and, in Model3, the GDP was added to models. Country-level effectson the QISO were measured by proportional change invariance from Model 0. Data from Hungary and Swedenwere not included in the latter models, as they contrib-uted with too few cases (5 and 2 services respectively).Interclass Correlation Coefficients (ICC) were com-
puted to show the percentage of observed variation inthe QISO that was attributable to capital-levelcharacteristics.Logistic random effects models were also computed
for each domain of the QISO score as outcomes, dichot-omized at their median values. Since the outcome con-stitutes a newly created index, qualitative equal intervalscannot be assumed according to the score variation, re-quiring this sensitivity analysis. Results of these modelsare presented in Additional file 1, showing the samechange in the ICC from null to fully adjusted models.Finally, a stratified analysis was performed according
to service typology to test differences in terms of the“clients served”. Services were categorised as being ei-ther group specific or generic, as well as according towhether they provided mental health care, social careand/or general health care. A p-value of <0.05 was con-sidered significant, and only statistically significantservice-level variables found in models without stratifica-tion were included, together with the country-level vari-able that meaningfully decreased the ICC.Analyses were performed using SPSS v.18 (SPSS Inc.,
Chicago, IL, USA), R v.3.0.0 and Mplus, v. 5.2.
ResultsIn the 14 European capitals, 811 services were identifiedand 617 assessed. In six capitals, less than 70% of ser-vices identified were assessed (Prague: 19 servicesassessed out of 38 identified; Budapest: 5 out of 12;Rome: 34 out of 80; Stockholm: 5 out of 11; Madrid: 17out of 40 and Lisbon: 21 out of 55).
Quality Index of Service Organisation (QISO) descriptionThe overall QISO was normally distributed, with a mean(SD) of 10.03 (2.13) (Figure 1).This exploratory factor analysis revealed a 5-factor
model as the solution with best fit, generically support-ing the theoretical domains for the quality indicatorsproposed [see Additional file 1].
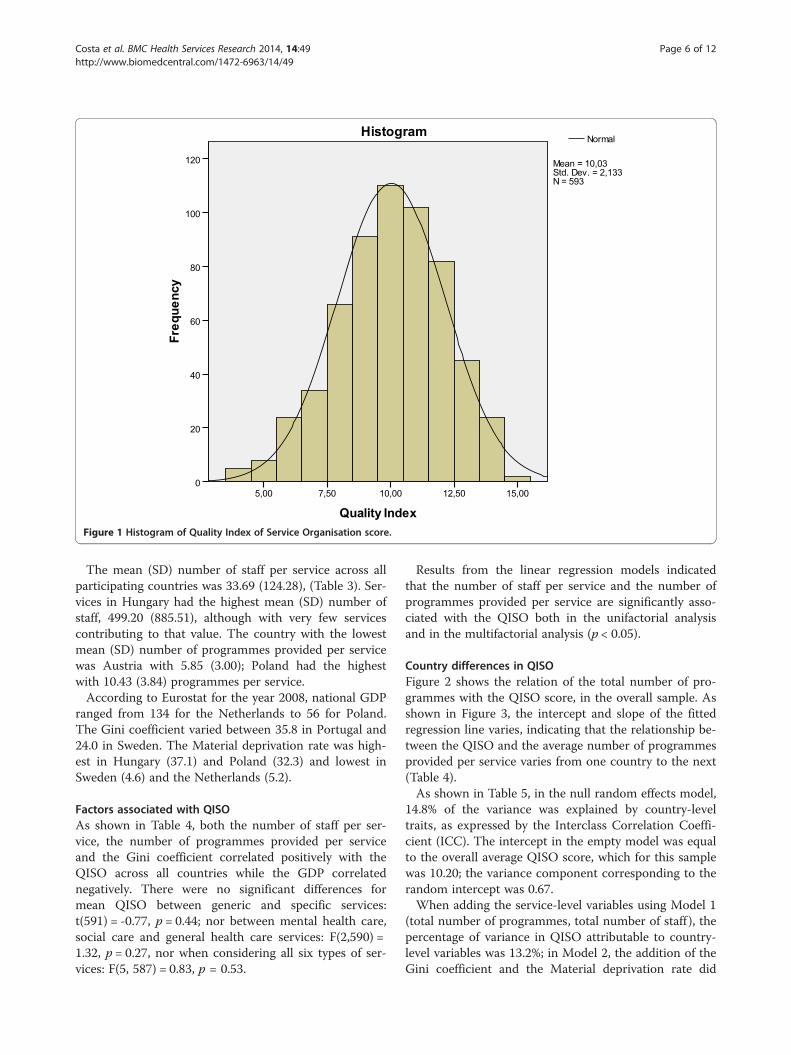
Figure 1 Histogram of Quality Index of Service Organisation score.
Costa et al. BMC Health Services Research 2014, 14:49 Page 6 of 12http://www.biomedcentral.com/1472-6963/14/49
The mean (SD) number of staff per service across allparticipating countries was 33.69 (124.28), (Table 3). Ser-vices in Hungary had the highest mean (SD) number ofstaff, 499.20 (885.51), although with very few servicescontributing to that value. The country with the lowestmean (SD) number of programmes provided per servicewas Austria with 5.85 (3.00); Poland had the highestwith 10.43 (3.84) programmes per service.According to Eurostat for the year 2008, national GDP
ranged from 134 for the Netherlands to 56 for Poland.The Gini coefficient varied between 35.8 in Portugal and24.0 in Sweden. The Material deprivation rate was high-est in Hungary (37.1) and Poland (32.3) and lowest inSweden (4.6) and the Netherlands (5.2).
Factors associated with QISOAs shown in Table 4, both the number of staff per ser-vice, the number of programmes provided per serviceand the Gini coefficient correlated positively with theQISO across all countries while the GDP correlatednegatively. There were no significant differences formean QISO between generic and specific services:t(591) = -0.77, p = 0.44; nor between mental health care,social care and general health care services: F(2,590) =1.32, p = 0.27, nor when considering all six types of ser-vices: F(5, 587) = 0.83, p = 0.53.
Results from the linear regression models indicatedthat the number of staff per service and the number ofprogrammes provided per service are significantly asso-ciated with the QISO both in the unifactorial analysisand in the multifactorial analysis (p < 0.05).
Country differences in QISOFigure 2 shows the relation of the total number of pro-grammes with the QISO score, in the overall sample. Asshown in Figure 3, the intercept and slope of the fittedregression line varies, indicating that the relationship be-tween the QISO and the average number of programmesprovided per service varies from one country to the next(Table 4).As shown in Table 5, in the null random effects model,
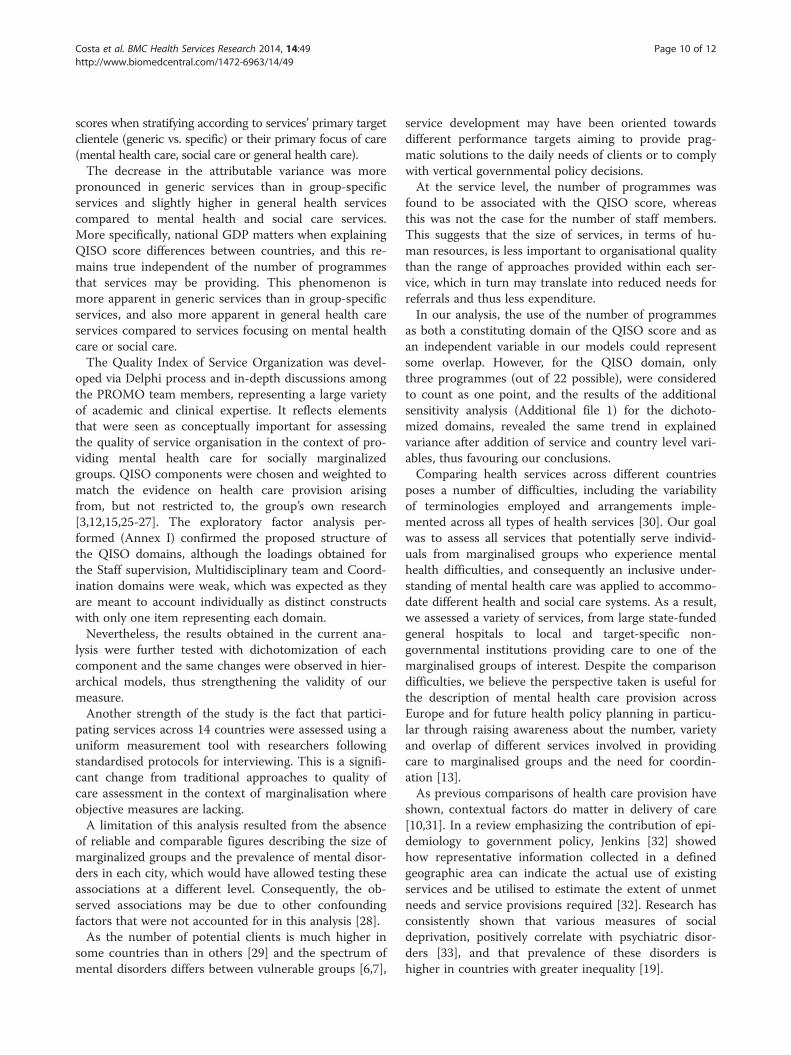
14.8% of the variance was explained by country-leveltraits, as expressed by the Interclass Correlation Coeffi-cient (ICC). The intercept in the empty model was equalto the overall average QISO score, which for this samplewas 10.20; the variance component corresponding to therandom intercept was 0.67.When adding the service-level variables using Model 1
(total number of programmes, total number of staff ), thepercentage of variance in QISO attributable to country-level variables was 13.2%; in Model 2, the addition of theGini coefficient and the Material deprivation rate did

Table 3 Quality Index of Service Organisation score (QISO) for each country, Number of staff (whole time equivalents),Total programmes provided, Gross Domestic Product (GDP), Gini coefficient and Material Deprivation rate
Country QISO Staff Totalprogrammes
Country GDP Gini coefficient Material deprivation rate
(Eurostat 2008) (Eurostat 2008) (Eurostat 2008)
n Mean (SD) n Mean (SD) n Mean (SD)
Austria 46 9.11 (1.93) 46 34.06 (77.77) 46 5.85 (3.00) 124 26.2 13.7
France 53 10.47 (1.86) 62 38.06 (122.44) 61 7.62 (4.86) 107 29.2 13.1
Hungary 5 12.40 (2.07) 5 499.20 (885.51) 5 9.20 (4.21) 64 25.2 37.1
Poland 38 10.82 (2.04) 39 41.78 (88.85) 42 10.43 (3.84) 56 32 32.3
Czech Republic 19 10.05 (2.27) 19 45.91 (155.13) 19 6.89 (3.71) 81 24.7 16.2
Germany 124 9.62 (2.03) 126 10.14 (17.85) 129 8.98 (3.87) 116 30.2 13
Italy 32 10.56 (1.63) 34 25.85 (48.93) 34 9.09 (4.00) 104 31 16.1
Netherlands 37 9.51 (1.95) 37 17.06 (17.40) 37 10.14 (3.71) 134 27.6 5.2
Sweden 2 13.00 (0) 5 10.80 (4.66) 5 9.40 (3.91) 122 24 4.6
Belgium 54 10.30 (1.78) 53 23.57 (57.73) 54 8.69 (4.44) 115 27.5 11.6
UK 66 11.14 (1.98) 65 20.95 (30.98) 66 9.73 (4.14) 115 33.9 11.3
Spain 17 11.35 (1.50) 17 55.76 (93.11) 17 7.06 (4.28) 103 31.3 8.7
Portugal 20 11.25 (1.52) 21 90.94 (150.36) 21 9.33 (3.38) 78 35.8 23
Ireland 80 8.63 (2.23) 80 11.27 (21.74) 80 7.90 (4.10) 133 29.9 13.6
Total 593 10.03 (2.13) 609 29.78 (109.93) 616 8.60 (4.16)
Costa et al. BMC Health Services Research 2014, 14:49 Page 7 of 12http://www.biomedcentral.com/1472-6963/14/49
not represent a marked difference in the ICC (12.3%);only in Model 3 with the addition of the GDP, did theICC drop to 2.7%, i.e. the country GDP played a role inexplaining differences in the QISO independently of thenumber of staff and programmes, the country Gini coef-ficient and the Material deprivation rate.Considering only statistically significant service-level
variables (total number of programmes) in the linear re-gression model, the same proportional decrease in thevariance attributable to country-level variables was ob-served (results not shown).As shown in Table 6, a decrease in the total variance
observed in QISO scores across countries due to country-level variables was observable for all groups of services,although this was more evident for generic services, with adecrease of nearly 8% with the addition of GDP per capita:the ICC dropped from 21.6% to 13.8%. This percentageremained above 20% in the final model for mental healthcare services and reached 28.0% for general health care ser-vices. Only 1.1% of the variance remained attributable to
Table 4 Correlations and linear regression between the Qualirelevant service-level and country-level variables
Total Staff Total Programme
Spearman’s rho 0.327* 0.350*
Standardized ß (crude model) 0.136* 0.352*
Standardized ß (adjusted model**) 0.118* 0.348*
*p < 0.05; Hungary and Sweden not included.**adjusted model includes both number of staff and number of programmes.
country-level features for social care services from the ini-tial 7.4% in the null model.In summary, country GDP is important for explaining
differences in QISO scores across all countries, inde-pendently of the number of programmes each servicewas providing. This remains true regardless of servicetypology, although the trend is more evident in genericservices, i.e. services not specifically focussing on anyparticular marginalised groups.
DiscussionA good model fit was obtained for a five-factor modelrepresenting the QISO score across countries. The numberof programmes provided per service was positively corre-lated with the QISO score. However, the change in thescore related to the increase in the number of programmesvaried across countries. Moreover, a decrease was observedin the percentage of QISO score variance attributable tocountry-level features, mainly with the addition of the GDPestimate. No significant differences were observed in QISO
ty Index of Services Organisation score (QISO) and
s Country GDP Gini coefficient Material Deprivation Rate
-0.329* 0.220* -0.066
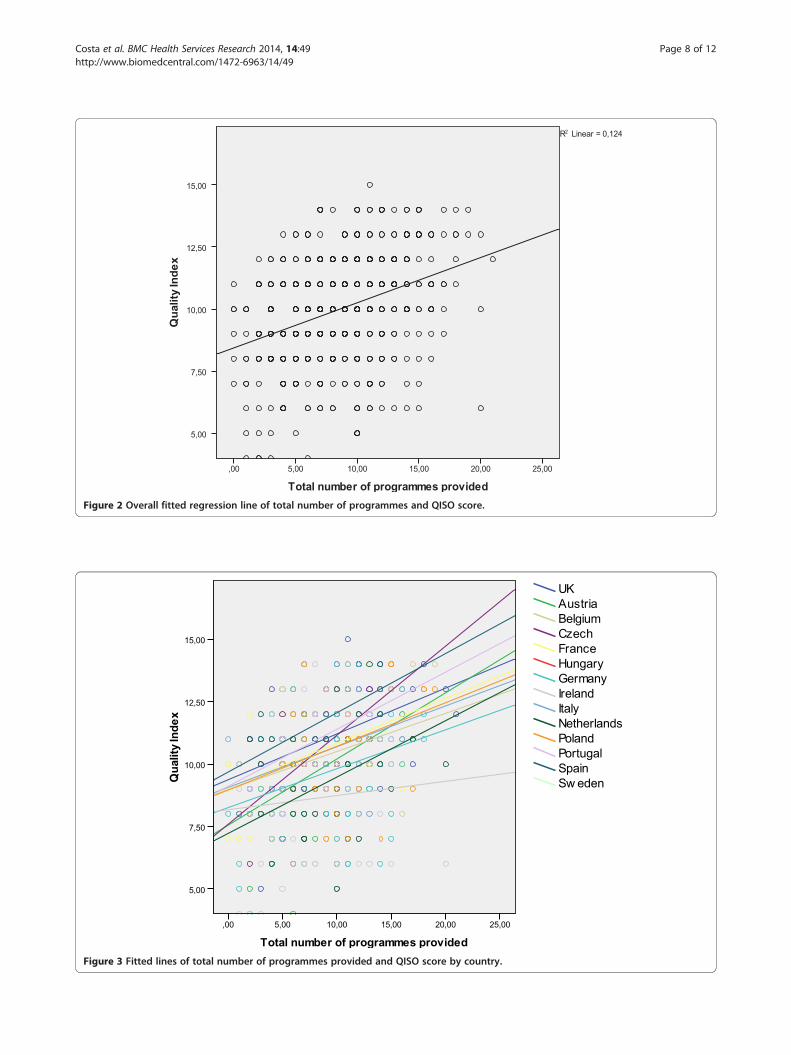
Figure 2 Overall fitted regression line of total number of programmes and QISO score.
Figure 3 Fitted lines of total number of programmes provided and QISO score by country.
Costa et al. BMC Health Services Research 2014, 14:49 Page 8 of 12http://www.biomedcentral.com/1472-6963/14/49
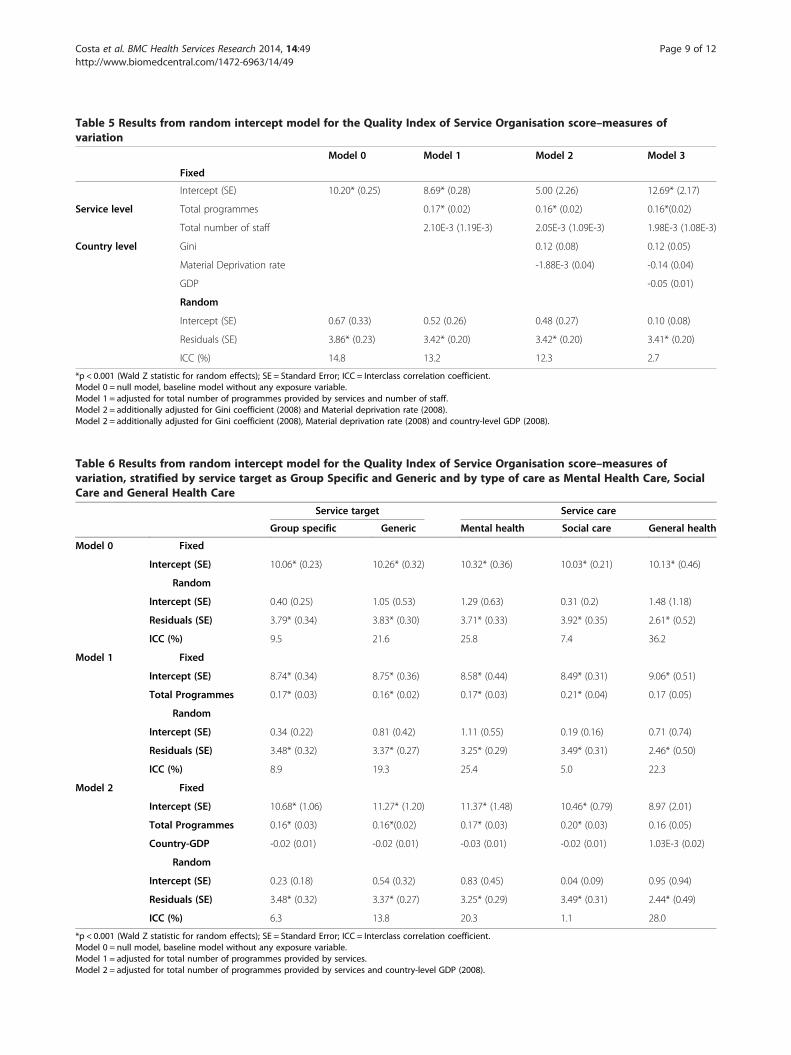
Table 5 Results from random intercept model for the Quality Index of Service Organisation score–measures ofvariation
Model 0 Model 1 Model 2 Model 3
Fixed
Intercept (SE) 10.20* (0.25) 8.69* (0.28) 5.00 (2.26) 12.69* (2.17)
Service level Total programmes 0.17* (0.02) 0.16* (0.02) 0.16*(0.02)
Total number of staff 2.10E-3 (1.19E-3) 2.05E-3 (1.09E-3) 1.98E-3 (1.08E-3)
Country level Gini 0.12 (0.08) 0.12 (0.05)
Material Deprivation rate -1.88E-3 (0.04) -0.14 (0.04)
GDP -0.05 (0.01)
Random
Intercept (SE) 0.67 (0.33) 0.52 (0.26) 0.48 (0.27) 0.10 (0.08)
Residuals (SE) 3.86* (0.23) 3.42* (0.20) 3.42* (0.20) 3.41* (0.20)
ICC (%) 14.8 13.2 12.3 2.7
*p < 0.001 (Wald Z statistic for random effects); SE = Standard Error; ICC = Interclass correlation coefficient.Model 0 = null model, baseline model without any exposure variable.Model 1 = adjusted for total number of programmes provided by services and number of staff.Model 2 = additionally adjusted for Gini coefficient (2008) and Material deprivation rate (2008).Model 2 = additionally adjusted for Gini coefficient (2008), Material deprivation rate (2008) and country-level GDP (2008).
Table 6 Results from random intercept model for the Quality Index of Service Organisation score–measures ofvariation, stratified by service target as Group Specific and Generic and by type of care as Mental Health Care, SocialCare and General Health Care
Service target Service care
Group specific Generic Mental health Social care General health
Model 0 Fixed
Intercept (SE) 10.06* (0.23) 10.26* (0.32) 10.32* (0.36) 10.03* (0.21) 10.13* (0.46)
Random
Intercept (SE) 0.40 (0.25) 1.05 (0.53) 1.29 (0.63) 0.31 (0.2) 1.48 (1.18)
Residuals (SE) 3.79* (0.34) 3.83* (0.30) 3.71* (0.33) 3.92* (0.35) 2.61* (0.52)
ICC (%) 9.5 21.6 25.8 7.4 36.2
Model 1 Fixed
Intercept (SE) 8.74* (0.34) 8.75* (0.36) 8.58* (0.44) 8.49* (0.31) 9.06* (0.51)
Total Programmes 0.17* (0.03) 0.16* (0.02) 0.17* (0.03) 0.21* (0.04) 0.17 (0.05)
Random
Intercept (SE) 0.34 (0.22) 0.81 (0.42) 1.11 (0.55) 0.19 (0.16) 0.71 (0.74)
Residuals (SE) 3.48* (0.32) 3.37* (0.27) 3.25* (0.29) 3.49* (0.31) 2.46* (0.50)
ICC (%) 8.9 19.3 25.4 5.0 22.3
Model 2 Fixed
Intercept (SE) 10.68* (1.06) 11.27* (1.20) 11.37* (1.48) 10.46* (0.79) 8.97 (2.01)
Total Programmes 0.16* (0.03) 0.16*(0.02) 0.17* (0.03) 0.20* (0.03) 0.16 (0.05)
Country-GDP -0.02 (0.01) -0.02 (0.01) -0.03 (0.01) -0.02 (0.01) 1.03E-3 (0.02)
Random
Intercept (SE) 0.23 (0.18) 0.54 (0.32) 0.83 (0.45) 0.04 (0.09) 0.95 (0.94)
Residuals (SE) 3.48* (0.32) 3.37* (0.27) 3.25* (0.29) 3.49* (0.31) 2.44* (0.49)
ICC (%) 6.3 13.8 20.3 1.1 28.0
*p < 0.001 (Wald Z statistic for random effects); SE = Standard Error; ICC = Interclass correlation coefficient.Model 0 = null model, baseline model without any exposure variable.Model 1 = adjusted for total number of programmes provided by services.Model 2 = adjusted for total number of programmes provided by services and country-level GDP (2008).
Costa et al. BMC Health Services Research 2014, 14:49 Page 9 of 12http://www.biomedcentral.com/1472-6963/14/49
Costa et al. BMC Health Services Research 2014, 14:49 Page 10 of 12http://www.biomedcentral.com/1472-6963/14/49
scores when stratifying according to services’ primary targetclientele (generic vs. specific) or their primary focus of care(mental health care, social care or general health care).The decrease in the attributable variance was more
pronounced in generic services than in group-specificservices and slightly higher in general health servicescompared to mental health and social care services.More specifically, national GDP matters when explainingQISO score differences between countries, and this re-mains true independent of the number of programmesthat services may be providing. This phenomenon ismore apparent in generic services than in group-specificservices, and also more apparent in general health careservices compared to services focusing on mental healthcare or social care.The Quality Index of Service Organization was devel-
oped via Delphi process and in-depth discussions amongthe PROMO team members, representing a large varietyof academic and clinical expertise. It reflects elementsthat were seen as conceptually important for assessingthe quality of service organisation in the context of pro-viding mental health care for socially marginalizedgroups. QISO components were chosen and weighted tomatch the evidence on health care provision arisingfrom, but not restricted to, the group’s own research[3,12,15,25-27]. The exploratory factor analysis per-formed (Annex I) confirmed the proposed structure ofthe QISO domains, although the loadings obtained forthe Staff supervision, Multidisciplinary team and Coord-ination domains were weak, which was expected as theyare meant to account individually as distinct constructswith only one item representing each domain.Nevertheless, the results obtained in the current ana-
lysis were further tested with dichotomization of eachcomponent and the same changes were observed in hier-archical models, thus strengthening the validity of ourmeasure.Another strength of the study is the fact that partici-
pating services across 14 countries were assessed using auniform measurement tool with researchers followingstandardised protocols for interviewing. This is a signifi-cant change from traditional approaches to quality ofcare assessment in the context of marginalisation whereobjective measures are lacking.A limitation of this analysis resulted from the absence
of reliable and comparable figures describing the size ofmarginalized groups and the prevalence of mental disor-ders in each city, which would have allowed testing theseassociations at a different level. Consequently, the ob-served associations may be due to other confoundingfactors that were not accounted for in this analysis [28].As the number of potential clients is much higher in
some countries than in others [29] and the spectrum ofmental disorders differs between vulnerable groups [6,7],
service development may have been oriented towardsdifferent performance targets aiming to provide prag-matic solutions to the daily needs of clients or to complywith vertical governmental policy decisions.At the service level, the number of programmes was
found to be associated with the QISO score, whereasthis was not the case for the number of staff members.This suggests that the size of services, in terms of hu-man resources, is less important to organisational qualitythan the range of approaches provided within each ser-vice, which in turn may translate into reduced needs forreferrals and thus less expenditure.In our analysis, the use of the number of programmes
as both a constituting domain of the QISO score and asan independent variable in our models could representsome overlap. However, for the QISO domain, onlythree programmes (out of 22 possible), were consideredto count as one point, and the results of the additionalsensitivity analysis (Additional file 1) for the dichoto-mized domains, revealed the same trend in explainedvariance after addition of service and country level vari-ables, thus favouring our conclusions.Comparing health services across different countries
poses a number of difficulties, including the variabilityof terminologies employed and arrangements imple-mented across all types of health services [30]. Our goalwas to assess all services that potentially serve individ-uals from marginalised groups who experience mentalhealth difficulties, and consequently an inclusive under-standing of mental health care was applied to accommo-date different health and social care systems. As a result,we assessed a variety of services, from large state-fundedgeneral hospitals to local and target-specific non-governmental institutions providing care to one of themarginalised groups of interest. Despite the comparisondifficulties, we believe the perspective taken is useful forthe description of mental health care provision acrossEurope and for future health policy planning in particu-lar through raising awareness about the number, varietyand overlap of different services involved in providingcare to marginalised groups and the need for coordin-ation [13].As previous comparisons of health care provision have
shown, contextual factors do matter in delivery of care[10,31]. In a review emphasizing the contribution of epi-demiology to government policy, Jenkins [32] showedhow representative information collected in a definedgeographic area can indicate the actual use of existingservices and be utilised to estimate the extent of unmetneeds and service provisions required [32]. Research hasconsistently shown that various measures of socialdeprivation, positively correlate with psychiatric disor-ders [33], and that prevalence of these disorders ishigher in countries with greater inequality [19].
Costa et al. BMC Health Services Research 2014, 14:49 Page 11 of 12http://www.biomedcentral.com/1472-6963/14/49
Given that we assessed services in two highly deprivedareas of each capital, homogenous within each city, butheterogeneous between capitals, various characteristicsmay have influenced the organisational quality of spe-cific services, independently of their nature and the tar-get groups they are serving. However, we observed thatsimple country-level socioeconomic factors, theoreticallyclose to a broad “deprivation” indicator, seem to influ-ence this relationship.Probably, the most interesting finding from our work is
that the measure of quality organisation in the provision ofcare is negatively associated with the country GDP. Al-though the Gini coefficient was not relevant for the countrydifferences, it correlated positively with the QISO score,with which it shows congruency, since “poorer” countriestend to have more inequalities. Mental health care and so-cial care services as well as services targeting specific mar-ginalized groups seemed to be less influenced by thisphenomenon compared to generic services and servicesproviding general health care. This suggests that nationalsocioeconomic factors may be more relevant to the qualityof care provided by these latter types of services to sociallymarginalized groups, although the number of programmesprovided should also be considered.The reason why “richer” countries perform less well
on the quality score remains unclear. A number of hy-potheses could be advanced to explain this phenomenonsuch as the need of the countries’ to invest in generichealth services for this type of population; the fact thathaving a higher GDP results in relatively smaller num-bers of marginalised individuals; or inherent differenttraditions and investment in social integration comparedto services of “poorer” countries where more efforts aremade to provide care to marginalized groups. Further-more, services in countries with higher GDPs may bemore efficiently organized, with specific services provid-ing specific programmes, compared to more “disorga-nized” systems being forced to provide a variety ofprogrammes despite insufficient resources. Finally, itcould be argued that richer countries might be providinga greater variety of services, which may result in a morefragmented system as reflected in the QISO.
ConclusionsIn summary, socioeconomic contextual factors, in particu-lar the national GDP, are likely to influence the organisa-tional quality of services providing mental health care formarginalized groups, and this is particularly the case forgeneral health services such as hospitals and primary healthcare centres, where “poorer” countries perform, on average,slightly “better”. Such factors should be taken into accountin international comparative studies of service careprovision and in political decision-making related to healthcare fragmentation and allocation of resources. Their
significance for different types of services should also be ex-plored in future research in order to bring further insightinto organisational features that might benefit marginalisedgroups in terms of accessing mental health care. The cre-ated QISO score could also be useful beyond the six so-cially marginalised groups analysed in the scope of thePROMO project, enabling further insight into differencesobserved between typologies of services (e.g. generic,group-specific), all of which are important for mental healthcare but often not coordinated, overlapping in their inter-ventions and struggling to overcome known barriers inaccessibility.
Additional file
Additional file 1: Results from the exploratory factor analysisperformed for the Quality Index of Service Organisation (QISO) andmodels fitted for QISO dichotomized domains.
Competing interestsThe authors declare that they have no competing interests.
Authors’ contributionsAll authors were involved in the research design and data collectionprocedures. DC performed the statistical analysis for this manuscript andwrote the first draft of the paper. AM, HB and SP, provided further input tothe conceptualisation and writing. RC, EG, TG, PV, UK, PN, JM, JMDO, CS, MK,JJFS and AG provided additional revisions to latest versions of themanuscript. All authors contributed to the work, read and agreed to the finalmanuscript.
AcknowledgementsThis research was financially supported by DG-Sanco (contract: 800197;2007-2010). The authors would like to thank all of the professionals andservices who participated in the PROMO assessment of services.A PhD grant from Fundação para a Ciência e Tecnologia–Portugal (SFRH/BD/66388/2009) to the first author is acknowledged.
Sources of supportThis work was supported by DG Sanco (contract: 800197).
Author details1Department of Clinical Epidemiology, Predictive Medicine and Public Health,University of Porto Medical School, Alameda Prof Hernani Monteiro,4200-319 Porto, Portugal. 2Institute of Public Health, University of Porto,Porto, Portugal. 3Unit for Social and Community Psychiatry, Queen MaryUniversity of London, London, United Kingdom. 4Health Promotion ResearchCentre, National University of Ireland Galway, Galway, Ireland. 5NationalInstitute for Health Development, Budapest, Hungary. 6Laboratoire derecherche, Etablissement public de santé Maison Blanche, Paris, France.7Department of Addictology, First Faculty of Medicine, Charles University inPrague and General University Hospital in Prague, Prague, Czech Republic.8Clinic for Psychiatry and Psychotherapy, Charite, University Medicine Berlin,CCM, Berlin, Germany. 9Institute of Health and Society (IRSS), UniversitéCatholique de Louvain, Bruxelles, Belgium. 10Institute of Psychiatry andNeurology, Warsaw, Poland. 11Madrid Salud, Madrid, Spain. 12LudwigBoltzmann Institute for Social Psychiatry, Vienna, Austria. 13Arkin Institute forMental Health Care, Amsterdam, The Netherlands. 14Department of PublicHealth Sciences, Mid Sweden University, Sundsvall, Sweden. 15LaziosanitàASP–Public Health Agency, Lazio Region, Rome, Italy.
Received: 28 June 2013 Accepted: 29 January 2014Published: 3 February 2014
Costa et al. BMC Health Services Research 2014, 14:49 Page 12 of 12http://www.biomedcentral.com/1472-6963/14/49
References1. Thornicroft G, Bisoffi G, De Salvia D, Tansella M: Urban-rural differences in
the associations between social deprivation and psychiatric serviceutilization in schizophrenia and all diagnoses: a case-register study inNorthern Italy. Psychol Med 1993, 23:487–496.
2. Conway AS, Melzer D, Hale AS: The outcome of targeting communitymental health services: evidence from the West Lambeth schizophreniacohort. BMJ 1994, 308:627–630.
3. Priebe S: Why compare mental health care in European capitals?Eur Psychiatry 2005, 20(Suppl 2):S265.
4. Tibaldi G, Munizza C, Pasian S, Johnson S, Salvador-Carulla L, Zucchi S,Cesano S, Testa C, Scala E, Pinciaroli L: Indicators predicting use of mentalhealth services in Piedmont, Italy. J Ment Health Policy Econ 2005,8:95–106.
5. Rössler W, Koch U, Lauber C, Hass A, Altwegg M, Ajdacic-Gross V, Landolt K:The mental health of female sex workers. Acta Psychiatr Scand 2010,122:143–152.
6. Fazel S, Khosla V, Doll H, Geddes J: The prevalence of mental disordersamong the homeless in western countries: systematic review andmeta-regression analysis. PLoS Med 2008, 5:e225.
7. Fazel S, Wheeler J, Danesh J: Prevalence of serious mental disorder in7000 refugees resettled in western countries: a systematic review.Lancet 2005, 365:1309–1314.
8. Hajioff S, McKee M: The health of Roma people: a review of publishedliterature. J Epidemiol Community Health 2000, 54:864–869.
9. Melzer D, Hale AS, Malik SJ, Hogman GA, Wood S: Community care forpatients with schizophrenia one year after hospital discharge. BMJ 1991,303:1023–1026.
10. Duncan C, Jones K, Moon G: Context, composition and heterogeneity:using multilevel models in health research. Soc Sci Med 1998, 46:97–117.
11. Glover G, Arts G, Wooff D: A needs index for mental health care inEngland based on updatable data. Soc Psychiatry Psychiatr Epidemiol 2004,39:730–738.
12. Priebe S, Matanov A, Schor R, Straßmayr C, Barros H, Barry MM, Diaz-OllalaJM, Gabor E, Greacen T, Holcnerová P, et al: Good practice in mental healthcare for socially marginalised groups in Europe: a qualitative study ofexpert views in 14 countries. BMC Public Health 2012, 12:248–259.
13. Priebe S, Matanov A, Barros H, Canavan R, Gabor E, Greacen T, Holcnerova P,Kluge U, Nicaise P, Moskalewicz J, et al: Mental health-care provision formarginalized groups across Europe: findings from the PROMO study.European J Public Health 2013, 23:97–103.
14. Good Practice In Mental Health Care For Socially Marginalized People InEurope: Report on Findings. http://promostudy.org/outcomes/index.html.
15. Strassmayr C, Matanov A, Priebe S, Barros H, Canavan R, Díaz-Olalla JM,Gabor E, Gaddini A, Greacen T, Holcnerová P, et al: Mental health care forirregular migrants in Europe: barriers and how they are overcome.BMC Public Health 2012, 12:367–378.
16. Canavan R, Barry MM, Matanov A, Barros H, Gabor E, Greacen T, HolcnerováP, Kluge U, Nicaise P, Moskalewicz J, et al: Service provision and barriers tocare for homeless people with mental health problems across 14European capital cities. BMC Health Serv Res 2012, 12:222–230.
17. Cooper RA: More is more and less is less: the case of Mississippi.Health Aff 2009, 28:w124.
18. Lawrence D, Kisely S: Inequalities in healthcare provision for people withsevere mental illness. J Psychopharmacol 2010, 24(Suppl 4):61–68.
19. Pickett KE, Wilkinson RG: Inequality: an underacknowledged source ofmental ilness and distress. Br J Psychiatry 2010, 197:426–428.
20. Walsh D, Bendel N, Jones R, Hanlon P: It’s not ‘just deprivation’: why doequally deprived UK cities experience different health outcomes?Public Health 2010, 124:487–495.
21. Hussel R, Hennell T: It’s not just deprivation. Public Health 2011,125:114–115.
22. Wilkinson JR: What we want to know is…. Public Health 2010,124:718–719.
23. Eurostat Statistics. http://epp.eurostat.ec.europa.eu/portal/page/portal/eurostat/home.
24. Eurostat: Comparative EU statistics on Income and Living Conditions:Issues and Challenges. In EU-SILC conference 2007 2006. Helsinki: Office forOificial Publications of the European Communities; 2006.
25. Priebe S, Sandhu S, Dias S, Gaddini A, Greacen T, Ioannidis E, Kluge U,Krasnik A, Lamkaddem M, Lorant V, et al: Good practice in health care for
migrants: views and experiences of care professionals in 16 Europeancountries. BMC Public Health 2011, 11:187–198.
26. Devillé W, Greacen T, Bogic M, Dauvrin M, Dias S, Gaddini A, Jensen NK,Karamanidou C, Kluge U, Mertaniemi R, et al: Health care for immigrants inEurope: is there still consensus among country experts about principlesof good practice? A Delphi study. BMC Public Health 2011, 11:699–708.
27. Dauvrin M, Lorant V, Sandhu S, Devillé W, Dia H, Dias S, Gaddini A, IoannidisE, Jensen NK, Kluge U, et al: Health care for irregular migrants:pragmatism across Europe: a qualitative study. BMC Research Notes 2012,5:99–107.
28. Skapinakis P, Lewis G, Araya R, Jones K, Williams G: Mental healthinequalities in Wales, UK: multi-level investigation of the effect of areadeprivation. Br J Psychiatry 2005, 186:417–422.
29. Croudace TJ, Kayne R, Jones PB, Harrison GL: Non-linear relationshipbetween an index of social deprivation, psychiatric admissionprevalence and the incidence of psychosis. Psychol Med 2000, 30:177–185.
30. Salvador-Carulla L, Alvarez-Galvez J, Romero C, Gutierrez-Colosia MR, WeberG, McDaid D, Dimitrov H, Sprah L, Kalseth B, Tibaldi G, et al: Evaluation ofan integrated system for classification, assessment and comparison ofservices for long-term care in Europe: the eDESDE-LTC study. BMC HealthServ Res 2013, 13:218.
31. Siponen U, Valimaki M, Kaivosoja M, Marttunen M, Kaltiala-Heino R: Acomparison of two hospital districts with low and high figures in thecompulsory care of minors: an ecological study. Soc Psychiatry PsychiatrEpidemiol 2011, 46:661–670.
32. Jenkins R: Making psychiatric epidemiology useful: the contribution ofepidemiology to government policy. Acta Psychiatr Scand 2001, 103:2–14.
33. Aoun S, Pennebaker D, Wood C: Assessing population need for mentalhealth care: a review of approaches and predictors. Ment Health Serv Res2004, 6:33–46.
doi:10.1186/1472-6963-14-49Cite this article as: Costa et al.: Factors associated with quality ofservices for marginalized groups with mental health problems in 14European countries. BMC Health Services Research 2014 14:49.
Submit your next manuscript to BioMed Centraland take full advantage of:
• Convenient online submission
• Thorough peer review
• No space constraints or color figure charges
• Immediate publication on acceptance
• Inclusion in PubMed, CAS, Scopus and Google Scholar
• Research which is freely available for redistribution
Submit your manuscript at www.biomedcentral.com/submit