Embed Size (px)
Citation preview


164
256
パチンコ産業は今や日本の基幹産業に。
パチンコは日本人に最も親しまれている、日本を代表するアミューズメントです。
パチンコ産業は、「衣・食・住」の次に求められる「アミューズメント」産業に属します。生活に関わる基礎的インフラが整備されている先進国では、アミューズメントに対するニーズが高く、人生の楽しさ、生き甲斐づくりに貢献できる産業として「アミューズメント」産業があります。パチンコ産業の市場規模は20兆円(当社推定値)と、国内の基幹産業のひとつであり、関連ビジネスも含めると、日本経済への影響力は想像以上に大きいといえます。
The pachinko business is part of the amusement industry. Amusement is what people seek next to food, clothing and shelter. In advanced countries, where the basic infrastructure for life is fully developed, the amusement business is in demand as people seek opportunities to play.We estimate the market scale of the pachinko business at 20,000 billion yen. As one of the key industries in Japan, the pachinko and related businesses have a far greater influence on the Japanese economy than one might imagine.
パチンコは、その親しみやすさとアミューズメント性の高さで日本人に最も親しまれているレジャーのひとつです。スポーツや観光、行楽、趣味、創作といった余暇活動の中でも、とくにファンが多いことで知られております。警察庁生活安全局保安課の調査では、2019年のパチンコ店舗数は、前年比で421店舗減少の9,639店舗となり引き続き減少傾向にありますが、遊技機設置台数は前年比約2.5%減少の約420万台となり、1店舗あたり435台と店舗の大型化傾向が続いております。日本を代表するアミューズメント産業として成長してきたパチンコ産業がこの先発展するには、これまでにない新しい楽しみを提供していく必要があります。アミューズメント性をさらに高め、パチンコ遊技機や設備環境へこれまでにない新しい楽しみを提供していくことができれば、さらなる拡大は十分に可能であると思われます。それには誰もが安心して参加できるような新しいレジャーの仕組みやシステムを作り上げていくことが不可欠です。ダイコク電機はパチンコ業界全体を発展させることが自社の成長につながるとの信念のもと、広範囲にファン層を掘り起こし、業界のさらなる発展をめざしております。
Pachinko business is now among the key industries of Japan
With easy accessibility and high amusement value, pachinko is a favorite pastime for the Japanese people and attracts more enthusiasts than other leisure activities such as sports, sightseeing, outdoor amusement activities and hobbies. According to a survey by the Safety Division of the National Police Agency, the number of stores in 2019 decreased by 421 compared to the previous year to 9,639 stores, continuing the trend of decline, and the number of installed amusement machines was down by 2.5% to approximately 4,200,000 units, which means 435 units per hall, highlighting the upscaling trend of pachinko halls.To ensure the continued growth of the pachinko business, which already has significant market scale in Japan’s amusement industry, new avenues for amusement must be provided by enhancing the quality of the amusement and providing innovations in pachinko game machines and facilities. At the same time, new systems or environments must be established to make pachinko accessible to more people. In the belief that the growth of the pachinko industry as a whole leads to its own growth, Daikoku Denki endeavors to expand the fan base for pachinko to ensure the industry’s further development.
Pachinko is one of the most familiar forms of amusement to the Japanese people.
■パチンコ ■パチスロ
■パチンコ ■パチスロ
2015ダイコク電機(株)「DK-SIS白書2020年版」よりSource:“DK-SIS White Paper 2020”Daikoku Denki
30兆円30 trillion yen
20兆円20 trillion yen
10兆円10 trillion yen
0円0 yen
2016
警察庁生活安全局保安課「令和元年における風俗環境の現状と風俗関係事犯の取締り状況等について」よりSource:2019 White Paper on Adult Entertainment Business and Moral Offense Control by the Community Safety Bureau of the National Police Agency
●店舗数Number of halls
●パチンコ店舗数と遊技機設置台数の推移Trends in the Numbers of Pachinko Halls and Installed Pachinko and Pachislo Game Machines
0万台
150万台
600万台
750万台
0店
3,000店
9,000店
15,000店
11,310 10,986
15,000 halls
9,000 halls
12,000店12,000 halls
3,000 halls
6,000店6,000 halls
0 halls
7.5 million machines
6 million machines
450万台4.5 million machines
1.5 million machines
300万台3 million machines
0 million machines2015
10.524.7
14.2
2016
10.222.7
12.5
458 452
2017
10,596
169
275
444
Pachinko Pachislo
Pachinko Pachislo
4兆円
■パチンコ ■パチスロ
2015
4 trillion yen
3兆円3 trillion yen
2兆円2 trillion yen
1兆円1 trillion yen
0円0 yen
1.553.81
2.26
2016
1.563.66
2.10
Pachinko Pachislo
Pachinko Industry’s Sales
Pachinko Industry’s Gross Profit●市場粗利規模
●市場売上規模
ダイコク電機(株)「DK-SIS白書2020年版」よりSource:“DK-SIS White Paper 2020”Daikoku Denki
166
292
169
283
2017
10.521.4
10.9
2017
1.613.52
1.91
2018
10,060
166
264
430
2018
10.320.7
10.4
2018
1.543.38
1.84
2019
1.523.24
1.72
2019
9,639
420
2019
10.220.0
9.8
事業領域/アミューズメント産業 Business Domain / Amusement Industry
1

Provides amusement informationto attract the interest of pachinko fans
Jackpot information/Text/Audio/Image
Network
Information services for fansInformation services for fans
Pachinko/Pachislo Game MachineManufacturers
Strategic information systemStrategic information system
Pachinko Fansパチンコファン
Hall Computerホールコンピュータ
Pachinko Hallsパチンコホール
Information DeviceInformation Device情報公開機器
ファンを引きつける楽しい情報の提供
Provides game-machine information
遊技機の情報提供Supplies content
コンテンツの提供
パチンコ・パチスロ遊技機メーカー
大当り情報文字、音声、画像
ネットワーク
Sends data on the hallホールデータ送信
Collects and analyzes data
データ集計・分析
ファン向け情報サービス
会員制情報提供サービス
ダイコク電機Daikoku Denki
ダイコク電機は「パチンコファン」、「パチンコホール」、「遊技機メーカー」の中間にポジショニングし、情報が流れる仕組みを構築してまいりました。ホールに対しては、業界随一であるホール向け会員制情報提供サービス「DK-SIS」とホールコンピュータを融合したトータルネットワークシステムを構築し、ファンが楽しめる機種の最適活用や、遊技機の入替時期の見極めをサポートしております。また、遊技機メーカーに対しては、「DK-SIS」で得られた各ホールでの遊技機稼動状況などを提供し、開発の指針としていただいております。ファンに対しては、PCや携帯サイト及び有料TVを使って、ホールや遊技機の情報発信をしております。ダイコク電機は『ファンに目を向けたものづくり』をポリシーに、ファンが求める情報を提供し、ファンの声を遊技機開発やホールの経営改善にフィードバックしていくことで、業界全体の健全な成長を支援してまいります。
Serving as the basis for an exchange of information, Daikoku Denki encourages the sound growth of the pachinko industry
情報の交流基点となることで業界の健全な成長を支援しております。
パチンコホールと遊技機メーカーの双方へ革新的な製品を提供し続ける市場創造型の企業です。ダイコク電機は、日本を代表するレジャーであるパチンコ業界に事業領域をフォーカスしております。1973年の設立以来、主力製品でありますパチンコホール用コンピュータをはじめとした情報システム機器の開発・製造・販売と、パチンコ遊技機用ソフトウェア開発やアッセンブリユニットの開発・製造・販売をおこなってまいりました。わたしたちは、パチンコファンの視点をビジネスの基本として捉え、ファンがホールに対して何を求めているのか、どうしたら楽しい演出や楽しい空間づくりができるのかを絶えず模索しております。ファンが喜ぶことを提案していくことがホールの経営向上につながり、遊技機メーカーの開発力アップに貢献していくと考えております。
Daikoku Denki offers a system to facilitate the effective flow of information among those involved in the pachinko business: pachinko fans, pachinko halls and game machine manufacturers.For pachinko hall operators, we offer a total network system by integrating the Daikoku Denki Strategic Information System (DK-SIS)—the industry-leading service for supplying information to Japan’s leading pachinko halls—with the hall computing system to optimize the use of game machines and replace them at the best possible timing. For game machine manufacturers, we supply information obtained through DK-SIS, such as the operation rate of the various game machines installed at the member halls, to help them set a policy for developing new machines. For pachinko enthusiasts, we provide information on pachinko halls and game machines through PC and cell-phone Web sites and pay TV channels.With the highest priority on the interests of pachinko fans, Daikoku Denki supplies the information they want, and feeds back their responses to hall operators and game machine manufacturers, thereby encouraging the continued sound growth of the pachinko industry as a whole.
As a specialist in the business of pachinko—a leisure activity representative of Japan—Daikoku Denki has engaged in the development, production and sales of computers and other information system equipment for pachinko halls, as well as software development and the development, production and sales of assembly units for pachinko game machines since it was founded in 1973.The basics of our business lie in the needs of pachinko fans. We make ceaseless efforts to upgrade our products and services from the perspective of pachinko enthusiasts: What do they expect from pachinko halls? What kind of performance or environment would provide the desired amusement? We continue to make proposals that meet pachinko fans’ expectations to improve the management of pachinko halls and the development capabilities of game-machine makers.
Daikoku Denki is a market-creating enterprise that continuesto offer innovative products for pachinko halls and game-machine manufacturers.
ダイコク電機について About Daikoku Denki
2

呼出ランプ「IL-X3」
情報公開端末Information Device
CRユニットCR Unit
情報公開端末Information Device景品顧客管理
データロボData Robo
ホールコンピュータHall Computer
Daikoku Denki has led the pachinko industry by developing proprietary products based on its consistent policy that enhancing data management and promoting the disclosure of information are keys to attracting customers. Many of the products developed by the Company have become the de facto standards for the pachinko industry, which serves to enhance the relationship of trust between pachinko halls and fans. Daikoku Denki now enjoys the industry’s top market share at approximately 35% for its hall computing system (according to its own survey), which it was the first in the industry to introduce as a key tool to enable the management technique for pachinko hall operation called “base” management—now the industry’s de facto standard.
Daikoku Denki supports pachinko hall operators by offering a hall computing system that consists of various information systems for the operationof a pachinko hall.
ダイコク電機は、ホールの集客のために「データ管理の重要性」と「情報公開の必要性」を提唱し続け、常に業界初となる「オンリーワン製品」を発表し、それをデファクトスタンダード(事実上の業界標準)として確立することで、ホールとファンとの信頼関係向上に貢献してまいりました。パチンコ業界でデファクトスタンダードとなっている「ベース管理」と呼ばれる管理手法を初めて実現し、ホール運営の要であるホールコンピュータの分野で、当社は約35%のシェアを持ち(当社調べ)、この分野で業界シェアナンバーワンの企業です。
パチンコホールの店舗運営に必要な管理機器「ホールコンピュータ」をはじめとする情報システム機器を提供し、企業経営・ホール運営を支援しております。
情報システム事業 Information System Segment
●情報システム事業売上高Sales of Information System Segment
(単位:百万円)(Millions of Yen)
0
8,000
24,000
32,000
40,000
16,000
2016/3
34,076
2017/3 2018/3
24,827
2019/3
24,474
27,260
売上比率Ratio of segment sales
to total sales
80.0%
2020/3
26,354
情報システム事業/パチンコホール向け製品 Information System Segment / Products for Pachinko Halls
エントランスEntrance
景品交換カウンターExchange Counter
事務所Office
ホールHall
台毎トップランプIndividual-machineTop Light
景品管理POSPrize Management POS
計数機レーザーカウンタLaser counter
3

情報システム事業/DK-SIS Information System Segment / The Daikoku Denki Strategic Information System
パチンコホール向け会員制情報提供システムDK-SIS Daikoku Denki Strategic Information System
約147万台の遊技台情報Information on around 1,470,000 game machines
年間売上約9.1兆円のデータ規模Data from halls with aggregate sales of around9.1 trillion yen a year
会員数3,504会員(2020年3月末日現在)Number of DK-SIS members:3,504 as of March 31, 2020
ホールの経営戦略に欠かせない、業界随一のパチンコホール向け会員制情報提供サービス「DK-SIS」を運営しております。
Known as DK-SIS, the Daikoku Denki Strategic Information Systemis the industry-leading service to help pachinko hall operatorsformulate effective management strategies.
ダイコク電機 DK-SIS管理センターDaikoku Denki DK-SIS Control Center
遊技機Game machines
ダイコク電機製ホールコンピュータDaikoku Denki hall computer
店舗データData on individual halls
全国データData from around the nation
DK-SIS is a strategic information service that collects data through hall computers manufactured by Daikoku Denki and feeds it back to DK-SIS member hall operators. Pachinko hall operators with DK-SIS become able to obtain only data from their own hall computers, but also objective standards such as national averages, calculated from the database covering more than a third of game machines nationwide. This information provides the operators an opportunity to objectively evaluate data from their own halls and examine their performance in detail to formulate future strategies. DK-SIS also provides information such as specifications of game machines and simulations for use of game machines. DK-SIS is indispensable for effective pachinko hall operations and the industry-leading service.
ホール/本部Pachinko Halls/Head Office
DK-SISDK-SIS
ホールPachinko Halls
インターネットInternet DK-SISサーバ
DK-SIS server
「DK-SIS」は当社製ホールコンピュータの情報を収集・集計し、会員様へフィードバックする会員制情報提供サービスです。「DK-SIS」導入店舗は、自店のホールコンピュータから得られる数値のみではなく、全国に設置されている1/3を超える遊技機のデータベースから算出される全国平均等の基準となる数値を知ることにより、自店データの客観的な評価や、今後の戦略を立案する上での詳細な分析が可能です。また、遊技機のスペックや遊技機活用シミュレーション等の情報提供を行っています。
「DK-SIS」はパチンコホールを経営するには無くてはならない、業界随一のサービスです。
4

ホールコンピュータメーカーとして長年培った遊技台データ分析のノウハウを活かし、人気機種の傾向分析に基づく仕様の提案や、人気キャラクターの版権獲得など、ユニット製造業者の枠を越え、コンテンツにまで関わる開発パートナーとして機能しております。
制御ユニットControl Unit
パチンコ遊技機(表)Pachinko Machine (Front)
表示ユニットVideo Processing Unit
制御システム事業 Control System Segment
パチンコ・パチスロ遊技機メーカー向けにソフトウェア開発やアッセンブリユニットの提供をしております。
(単位:百万円)(Millions of Yen)
●制御システム事業売上高Sales of Control System Segment
4,000
8,000
12,000
16,000
As a maker of pachinko hall computers, Daikoku Denki has accumulated expertise on the analysis of data from pachinko machines. Such expertise is used to advise game machine manufacturers on recommended machine specifications according to an analysis of popular machines. The Company’s involvement in developing game machines also includes the acquisition of copyrights for the popular characters featured in the machines, the supply of assembly units and even the development of content for these machines.
As a partner in developing pachinko and pachislo machines, Daikoku Denki offers a wide range of supportfor game machine manufacturers, including software development and the supply of assembly units.
パチンコ遊技機(裏)Pachinko Machine (Rear)
パチンコ遊技機演出部分Display for Visual Attraction
2016/3
12,986
2017/3
13,515
2018/3
9,322
2019/3
6,740
売上比率Ratio of segment sales
to total sales
20.0%
2020/3
6,598
0
制御システム事業/遊技機メーカー向け製品 Control System Segment / Products for Game Machine Manufacturers
5

SELECTED FINANCIAL DATA (Consolidated)
収益性 Profitability
経営指標(連結)
(百万円)(Millions of Yen) (百万円)(Millions of Yen) (百万円)(Millions of Yen) (百万円)(Millions of Yen)(%) (%)
6.0
4.5
4,000
3,000
6.0
(%) (%)
6.03,0004,000
■売上高 Net Sales
■経常利益 Ordinary Income●売上高経常利益率 Ordinary Income to Net Sales
■親会社株主に帰属する当期純利益 Profit Attributable to Owners of Parent●売上高当期純利益率 Net Income to Net Sales
■自己資本利益率 Return on Equity●総資産利益率 Return on Assets
■営業利益 Operating Income●売上高営業利益率 Operating Income to Net Sales
-6.0
4.0
0.0
-4.0
2.0
-2.0
-6.0
2.0
4.0
0.0
-4.0
0
60,000
50,000
40,000
30,000
20,000
10,000
1,000
2,000
0
-2,000
-1,000
3.0
1.5
0.0
-1.5
-3.0 -2,000
-1,000
3,000
2,000
1,000
0
-3,000
1,000
2,000
-2,000
-2.0-1,000
0
-1.5
-3.0
6.0
4.5
3.0
1.5
0.0
2017/3 2018/3 2017/3 2018/3 2019/3 2017/3 2018/3 2016/32016/3 2016/3 2020/3 2016/3 2017/3 2018/3 2016/3 2017/3 2018/32019/3 2019/3 2019/3 2019/32020/3 2020/3 2020/3 2020/3
1.7
△3.6
△5.5
△1,676
△1.9
47,004
40,714
△894
1,048
△1.6
△749
3.4
1,374
1.2
1.1
△3.6
50234,093
31,166
3.5
1,192
4.9
4.3
1,527
4.1
1,390
5.6
1,748
2.3
785
4.1
1,2632.7
1.7
4.3
2.9
2.6
1,43132,922
5.1
1,674
3.2
1,061
3.5
2.5
決算期 Fiscal Year 2016/3 2017/3 2018/3 2019/3 2020/3売上高(百万円) Net Sales (Millions of Yen) 47,004 40,714 34,093 31,166 32,922 営業利益又は営業損失(△)(百万円) Operating Income (Loss) (Millions of Yen) △894 1,048 1,192 1,527 1,431 売上高営業利益率(%) Operating Income to Net Sales (%) △1.9 2.6 3.5 4.9 4.3 経常利益又は経常損失(△)(百万円) Ordinary Income (Loss) (Millions of Yen) △749 1,374 1,390 1,748 1,674 売上高経常利益率(%) Ordinary Income to Net Sales (%) △1.6 3.4 4.1 5.6 5.1 親会社株主に帰属する当期純利益又は当期純損失(△)(百万円) Profit Attributable to Owners of Parent (Loss) (Millions of Yen) △1,676 502 785 1,263 1,061 売上高当期純利益率(%) Net Income to Net Sales (%) △3.6 1.2 2.3 4.1 3.2 総資産(百万円) Total Assets (Millions of Yen) 47,139 46,828 43,564 43,729 42,702 純資産(百万円) Net Assets (Millions of Yen) 29,291 29,151 29,251 29,898 30,406 自己資本利益率〈ROE〉(%) Return on Equity〈ROE〉(%) △5.5 1.7 2.7 4.3 3.5 総資産利益率〈ROA〉(%) Return on Assets〈ROA〉(%) △3.6 1.1 1.7 2.9 2.5
6

SELECTED FINANCIAL DATA (Consolidated)経営指標(連結)
■固定比率 Fixed Assets Ratio●固定長期適合率 Fixed Assets to Long-Term Capital Ratio
■有利子負債 Interest-Bearing Debt●D/Eレシオ Debt to Equity Ratio
■手元流動性比率 On-Hand Liquidity Ratio●インタレスト・カバレッジ・レシオ Interest Coverage Ratio
■他人資本コスト Cost of Debt●自己資本比率 Equity Ratio
■流動比率 Current Ratio●当座比率 Quick Ratio
0.0
90.0
75.0
0
24
60.0
45.0
20
30.0
12
16
15.0
8
4
0.0
240.0
160.0
120.0
80.0
40.0
200.0
0.0
1200.0
0.0
6.0
1000.05.0
800.0
600.0
4.0
400.0
3.0
200.0
2.0
1.0
0
9,000
6,000
7,500
4,500
3,000
1,500
0.0
30.0
75.0
90.0
60.0
45.0
15.0
(百万円)(Millions of Yen)(倍)(Times)(倍)(Times)(%) (百万円)(Millions of Yen)(%) (%)
2017/32017/3
2.4
4.1
4.9
299.6
4.9
161.2
2016/3
61.8
59.4
60.0
57.7
2016/3
18.8
11.3
2017/3 2016/3
112.8
174.1
129.7
177.8
152.3
201.2
163.4
213.9
10
2018/32017/32016/3 2018/3 2017/32016/3 2018/3 2018/3 2018/3
145,5005,500
3,3003,300
62.1 62.3
(%)
0.0
24.0
20.0
16.0
12.0
8.0
4.0
2019/3 2019/3
56.0
58.1
55.2
58.0
11.3
2019/3
3,3003,300
11.0
3,3003,300
2019/3
10
67.1
11
68.4
2019/3
189.0
235.4
2020/3 2020/3
52.1
54.1
2020/3
10.9
3,3003,300
5.6
423.0
2020/3
667.8
2020/3
11
71.2
安定性 Stability
決算期 Fiscal Year 2016/3 2017/3 2018/3 2019/3 2020/3流動比率 (%)※ Current Ratio (%)※ 174.1 177.8 201.2 213.9 235.4 当座比率 (%) Quick Ratio (%) 112.8 129.7 152.3 163.4 189.0 固定比率 (%)※ Fixed Assets Ratio (%)※ 61.8 60.0 58.1 58.0 54.1 固定長期適合率 (%)※ Fixed Assets to Long-Term Capital Ratio (%)※ 59.4 57.7 56.0 55.2 52.1 有利子負債 (百万円) Interest-Bearing Debt (Millions of Yen) 5,500 3,300 3,300 3,300 3,300 D/Eレシオ (%) Debt to Equity Ratio (%) 18.8 11.3 11.3 11.0 10.9 手元流動性比率(倍) On-Hand Liquidity Ratio (Times) 2.4 4.1 4.9 4.9 5.6 インタレスト・カバレッジ・レシオ(倍) Interest Coverage Ratio (Times) ― 667.8 299.6 161.2 423.0 他人資本コスト (百万円) Cost of Debt (Millions of Yen) 10 14 10 11 11 自己資本比率 (%) Equity Ratio (%) 62.1 62.3 67.1 68.4 71.2
2019年3月期における会計基準の変更により、過年度の数値(※)を一部組替えて表記しております。 Some figures for prior fiscal years(*) are reclassified in accordance with changes to accounting standards applied in the fiscal year ended March 31, 2019.
7
生産性・効率性 Productivity and Efficiency
4.4
4.9
△2.6
3.1
3.5
5.0
3.0
4.6
3.2
6.0
5.0
4.0
3.0
2.0
1.0
0.0 0.0
1.5
3.0
4.5
7.5
6.0
9.0
0.0
1.0
2.0
3.0
5.0
4.0
6.0
-3.0
-2.0
3.0
2.0
1.0
90
75
60
45
30
15
(回)(Times) (回)(Times) (回)(Times)(百万円)(Millions of Yen) (百万円)(Millions of Yen)
■たな卸資産回転率 Inventory Turnover
■従業員1人当たり売上高 Net Sales per Employee
■従業員1人当たり当期純利益 Net Income per Employee
■売上債権回転率 Receivables Turnover●買入債務回転率 Payables Turnover
■総資産回転率 Total Assets Turnover●有形固定資産回転率 Tangible Fixed Assets Turnover
2016/3 2017/3 2016/3
5.25.5
5.8
2017/3 2016/3 2017/3
0.8
1.0 0.9
4.6
4.1
0.8
3.5
0.7
3.25.0
73.3
2018/3 2018/3 2018/3 2016/3 2017/3 2018/3 2016/3 2017/3 2018/3
60.9
2019/3 2019/3 2019/3
53.7
49.1
2020/3
51.4
2019/3
1.2
2.0
2019/3
-1.0
0.8
3.6
2020/3
7.0
2020/3 2020/3
1.7
5.1
4.0
2020/30
0.0
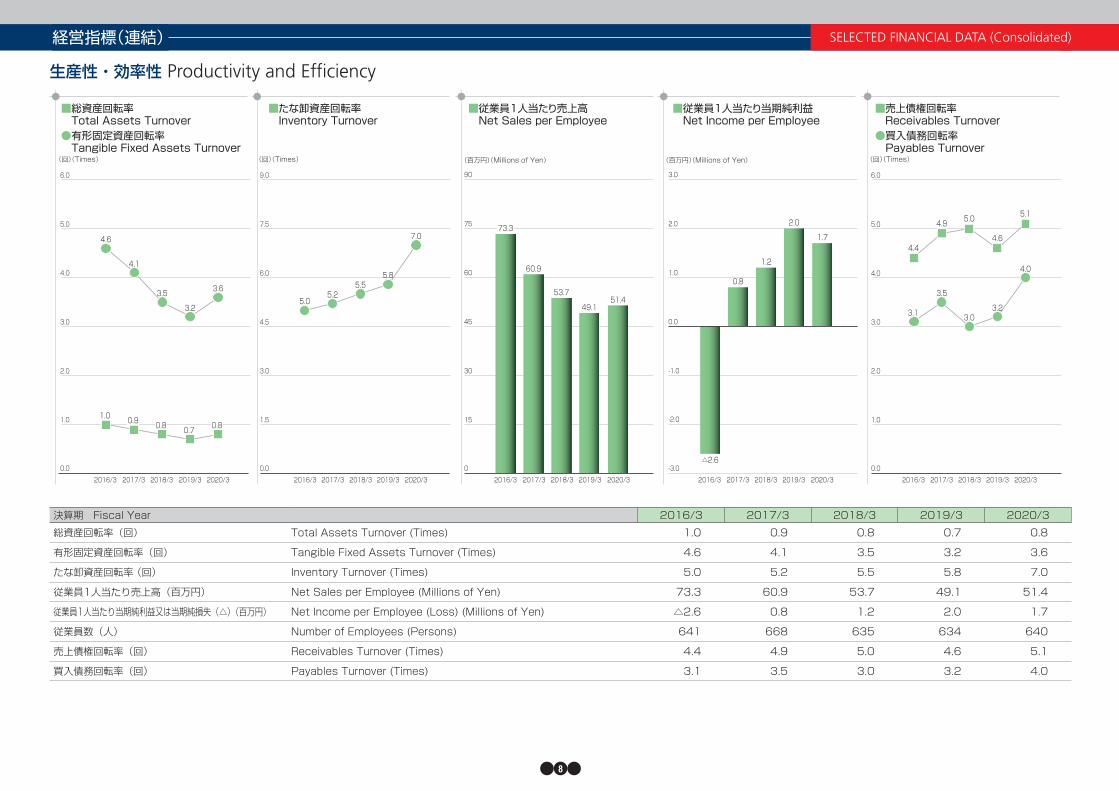
決算期 Fiscal Year 2016/3 2017/3 2018/3 2019/3 2020/3総資産回転率(回) Total Assets Turnover (Times) 1.0 0.9 0.8 0.7 0.8
有形固定資産回転率(回) Tangible Fixed Assets Turnover (Times) 4.6 4.1 3.5 3.2 3.6
たな卸資産回転率 (回) Inventory Turnover (Times) 5.0 5.2 5.5 5.8 7.0
従業員1人当たり売上高(百万円) Net Sales per Employee (Millions of Yen) 73.3 60.9 53.7 49.1 51.4
従業員1人当たり当期純利益又は当期純損失(△)(百万円) Net Income per Employee (Loss) (Millions of Yen) △2.6 0.8 1.2 2.0 1.7
従業員数(人) Number of Employees (Persons) 641 668 635 634 640
売上債権回転率(回) Receivables Turnover (Times) 4.4 4.9 5.0 4.6 5.1
買入債務回転率(回) Payables Turnover (Times) 3.1 3.5 3.0 3.2 4.0
SELECTED FINANCIAL DATA (Consolidated)経営指標(連結)
8

キャッシュ・フロー Cash Flows
2,451
2,616
1,950
2,283
1,553
11.3
7.51,914
1,579
2,085
1,742
4.63.9
2,212
3.6
15,000
10,000
5,000
0
-10,000
-5,000
20,000 12.0
10.0
8.0
9,000
7,500
6,000
6.04,500
4.03,000
2.01,500
3,000
2,500
2,000
1,500
1,000
500
3,000
-3,000
9,000
6,000
12,000
-6,000
(百万円)(Millions of Yen) (百万円)(Millions of Yen) (百万円)(Millions of Yen) (%)(百万円)(Millions of Yen)
■営業活動によるキャッシュ・フロー Cash Flows from Operating Activities■投資活動によるキャッシュ・フロー Cash Flows from Investing Activities■財務活動によるキャッシュ・フロー Cash Flows from Financing Activities
■現金及び現金同等物の期末残高 Cash and Cash Equivalents at End of Year●フリー・キャッシュ・フロー Free Cash Flow
■設備投資額 Capital Expenditures●減価償却費 Depreciation and Amortization
■研究開発費 Research and Development Cost●対売上高R&D比率 Ratio of R&D to Sales
2016/3 2016/3 2017/32016/3 2017/3
7,643
△7,221
2016/3 2017/3 2018/3
9,358
4,0655,330
2018/3
3,060
△2,511
△4,710
2018/3
△1,696
△2,938
9,339
2018/32017/3
14,062
510
2019/3
△2,411
△739
2,921
△2,364
△592
1,875
2019/3
13,832
△489
12,751
2019/3 2019/3
1,5781,206
2020/3
△1,688
△591
5,006
2020/3
3,318
15,478
2020/3 2020/3
1,170
0
0 0.00
SELECTED FINANCIAL DATA (Consolidated)経営指標(連結)
決算期 Fiscal Year 2016/3 2017/3 2018/3 2019/3 2020/3営業活動によるキャッシュ・フロー(百万円) Cash Flows from Operating Activities (Millions of Yen) △4,710 9,339 2,921 1,875 5,006
投資活動によるキャッシュ・フロー(百万円) Cash Flows from Investing Activities (Millions of Yen) △2,511 △1,696 △2,411 △2,364 △1,688
財務活動によるキャッシュ・フロー(百万円) Cash Flows from Financing Activities (Millions of Yen) 4,065 △2,938 △739 △592 △591
現金及び現金同等物の期末残高(百万円) Cash and Cash Equivalents at End of Year (Millions of Yen) 9,358 14,062 13,832 12,751 15,478
フリー・キャッシュ・フロー(百万円) Free Cash Flow (Millions of Yen) △7,221 7,643 510 △489 3,318
設備投資額(百万円) Capital Expenditures (Millions of Yen) 2,451 2,616 1,950 2,283 1,553
減価償却費(百万円) Depreciation and Amortization (Millions of Yen) 1,579 1,914 2,085 1,742 2,212
研究開発費(百万円) Research and Development Cost (Millions of Yen) 5,330 3,060 1,578 1,206 1,170
対売上高R&D比率(%) Ratio of R&D to Sales (%) 11.3 7.5 4.6 3.9 3.6
9

投資指標 Per Share Data and Others
50.0 50.0
40.0 40.0 40.0
147.0
75.3
46.8
55.7
250.0
100.0
200.0
150.0
50.0
0.0
0.0
10.0
20.0
30.0
50.0
40.0
60.0
0.0 0.0
150.0120.0
100.0
60.0
125.0
80.0 100.0
40.0
75.0
50.0
20.0 25.0
0.0
3,000
2,500
2,000
1,500
1,000
500
-150.0
-100.0
-50.0
50.0
100.0
0.0
150.0
(倍)(Times)(円)(Yen)(円)(Yen) (円)(Yen) (円)(Yen)(%)
■1株当たり当期純利益 Net Income per Share
■1株当たり配当金 Cash Dividends per Share●配当性向 Dividend Payout Ratio
■1株当たりキャッシュ・フロー Cash Flows per Share
■1株当たり純資産 Net Assets per Share
■株価収益率〈PER〉 Price-Earnings Ratio〈PER〉●株価純資産倍率〈PBR〉 Price-Book Value Ratio〈PBR〉
2016/32016/3 2017/3
34.0
0.90.8
48.9
2017/3
163.5
△113.4
2017/32016/3
△6.6
1,981.4
2018/3 2018/32018/3 2019/3 2016/3 2017/3 2018/3 2016/3 2017/3 2018/3
1,971.9
0.7-50.0
53.1
85.5
2019/3 2019/3
203.3
2019/3
1,978.7 2,022.4
2019/3
33.2
0.8
18.0
2020/3
0.6
17.1
194.1
71.8
2020/3 2020/3 2020/3
221.4
2020/3
2,056.8
1株当たり配当金と配当性向は単体の数値を掲載しています。 The cash dividend per share and the dividend payout ratio are stated on a non-consolidated basis.
SELECTED FINANCIAL DATA (Consolidated)経営指標(連結)
決算期 Fiscal Year 2016/3 2017/3 2018/3 2019/3 2020/31株当たり当期純利益又は当期純損失(△)〈EPS〉(円) Net Income per Share (Loss) 〈EPS〉 (Yen) △113.4 34.0 53.1 85.5 71.8
1株当たり配当金(円) Cash Dividends per Share (Yen) 50.0 50.0 40.0 40.0 40.0
配当性向(%) Dividend Payout Ratio (%) ― 147.0 75.3 46.8 55.7
1株当たりキャッシュ・フロー(円) Cash Flows per Share (Yen) △6.6 163.5 194.1 203.3 221.4
1株当たり純資産(円) Net Assets per Share (Yen) 1,981.4 1,971.9 1,978.7 2,022.4 2,056.8
株価収益率〈PER〉(倍) Price-Earnings Ratio〈PER〉 (Times) ― 48.9 33.2 18.0 17.1
株価純資産倍率〈PBR〉(倍) Price-Book Value Ratio〈PBR〉 (Times) 0.7 0.8 0.9 0.8 0.6
10
投資指標 Per Share Data and Others
SELECTED FINANCIAL DATA (Consolidated)経営指標(連結)
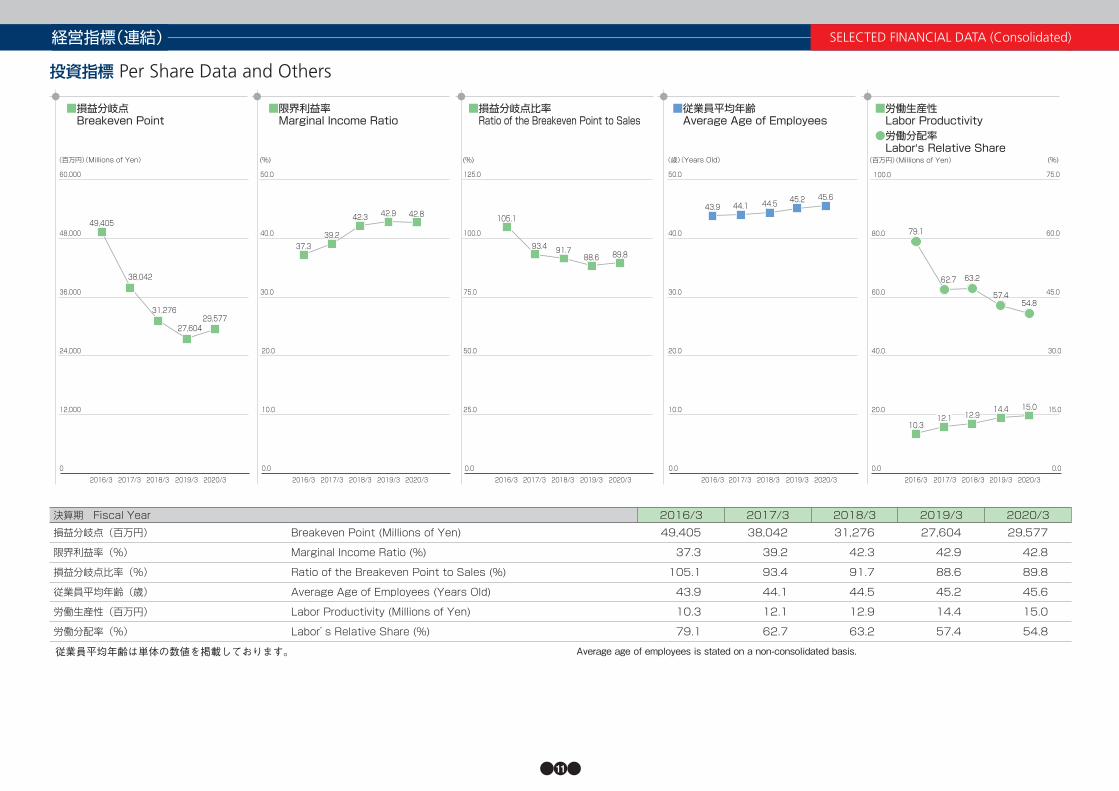
従業員平均年齢は単体の数値を掲載しております。 Average age of employees is stated on a non-consolidated basis.
決算期 Fiscal Year 2016/3 2017/3 2018/3 2019/3 2020/3損益分岐点(百万円) Breakeven Point (Millions of Yen) 49,405 38,042 31,276 27,604 29,577
限界利益率(%) Marginal Income Ratio (%) 37.3 39.2 42.3 42.9 42.8
損益分岐点比率(%) Ratio of the Breakeven Point to Sales (%) 105.1 93.4 91.7 88.6 89.8
従業員平均年齢(歳) Average Age of Employees (Years Old) 43.9 44.1 44.5 45.2 45.6
労働生産性(百万円) Labor Productivity (Millions of Yen) 10.3 12.1 12.9 14.4 15.0
労働分配率(%) Labor’s Relative Share (%) 79.1 62.7 63.2 57.4 54.8
■損益分岐点 Breakeven Point
■限界利益率 Marginal Income Ratio
■損益分岐点比率 Ratio of the Breakeven Point to Sales
■従業員平均年齢 Average Age of Employees
■労働生産性 Labor Productivity●労働分配率 Labor’s Relative Share
30.0
0
60,000
48,000
36,000
24,000
12,000
0.0 0.0
15.0
30.0
0.00.0
10.0
20.0
(百万円)(Millions of Yen)
50.0
40.0
30.0
(%)
125.0
100.0
75.0
50.0
25.0
(%)
50.0
40.0
20.0
10.0
(歳)(Years Old)
75.0
60.0
45.0
(%)
0.0
100.0
80.0
60.0
40.0
20.0
(百万円)(Millions of Yen)
2017/32018/32016/3 2017/3
49,405
38,042
2018/32016/3
37.339.2
2018/32016/3 2017/3
105.1
93.4
2018/32016/3 2017/3
43.9 44.1
2018/32016/3 2017/3
10.3
79.1
62.7
2019/3 2019/3
42.3 42.9
2019/3
91.788.6
2019/3
44.5 45.2
2019/3
63.2
14.4
57.4
31,276
27,604
2020/3
29,577
2020/3
42.8
2020/3
89.8
2020/3
45.6
2020/3
15.0
54.8
12.1 12.9
11
決算期 Fiscal Year 2016/3 2017/3 2018/3 2019/3 2020/3
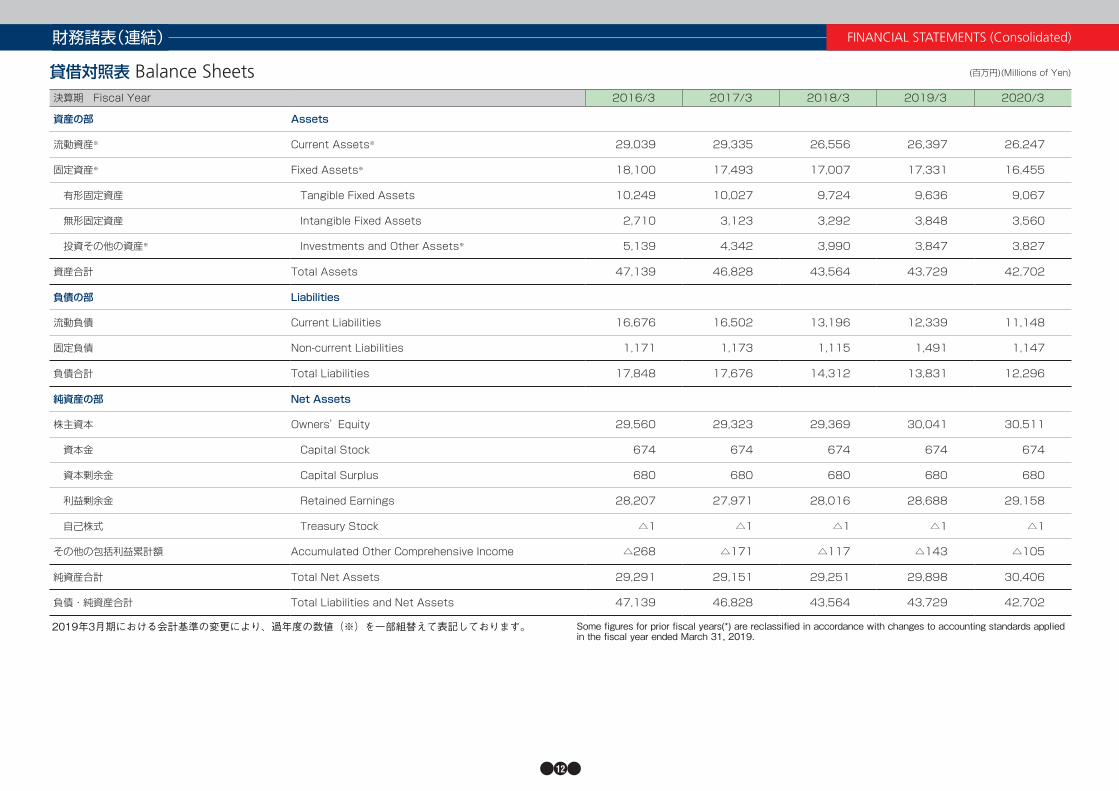
資産の部 Assets
流動資産※ Current Assets※ 29,039 29,335 26,556 26,397 26,247
固定資産※ Fixed Assets※ 18,100 17,493 17,007 17,331 16,455
有形固定資産 Tangible Fixed Assets 10,249 10,027 9,724 9,636 9,067
無形固定資産 Intangible Fixed Assets 2,710 3,123 3,292 3,848 3,560
投資その他の資産※ Investments and Other Assets※ 5,139 4,342 3,990 3,847 3,827
資産合計 Total Assets 47,139 46,828 43,564 43,729 42,702
負債の部 Liabilities
流動負債 Current Liabilities 16,676 16,502 13,196 12,339 11,148
固定負債 Non-current Liabilities 1,171 1,173 1,115 1,491 1,147
負債合計 Total Liabilities 17,848 17,676 14,312 13,831 12,296
純資産の部 Net Assets
株主資本 Owners’ Equity 29,560 29,323 29,369 30,041 30,511
資本金 Capital Stock 674 674 674 674 674
資本剰余金 Capital Surplus 680 680 680 680 680
利益剰余金 Retained Earnings 28,207 27,971 28,016 28,688 29,158
自己株式 Treasury Stock △1 △1 △1 △1 △1
その他の包括利益累計額 Accumulated Other Comprehensive Income △268 △171 △117 △143 △105
純資産合計 Total Net Assets 29,291 29,151 29,251 29,898 30,406
負債・純資産合計 Total Liabilities and Net Assets 47,139 46,828 43,564 43,729 42,702
貸借対照表 Balance Sheets (百万円)(Millions of Yen)
財務諸表(連結) FINANCIAL STATEMENTS (Consolidated)
2019年3月期における会計基準の変更により、過年度の数値(※)を一部組替えて表記しております。 Some figures for prior fiscal years(*) are reclassified in accordance with changes to accounting standards applied in the fiscal year ended March 31, 2019.
12

損益計算書 Statements of Income (百万円)(Millions of Yen)
決算期 Fiscal Year 2016/3 2017/3 2018/3 2019/3 2020/3
売上高 Net Sales 47,004 40,714 34,093 31,166 32,922
売上原価 Cost of Sales 32,734 26,760 22,255 19,492 20,811
売上総利益 Gross Profit 14,270 13,953 11,837 11,673 12,040
延払販売未実現利益戻入 Reversal Frow Deferred Profit on Installment Sales 9 ― ― ― ―
延払販売未実現利益控除 Transfer to Deferred Profit on Installment Sales ― ― ― ― ―
差引売上総利益 Gross Profit After Adjustment for Deferred Profit on Installment Sales 14,279 13,953 11,837 11,673 12,040
販売費及び一般管理費 Selling, General and Administrative Expenses 15,174 12,904 10,644 10,145 10,608
営業利益又は営業損失(△) Operating Income (Loss) △894 1,048 1,192 1,527 1,431
営業外収益 Non-operating Income 222 400 256 279 300
営業外費用 Non-operating Expenses 76 74 58 58 57
経常利益又は経常損失(△) Ordinary Income (Loss) △749 1,374 1,390 1,748 1,674
特別利益 Extraordinary Income 1 60 3 0 1
特別損失 Extraordinary Loss 420 362 111 66 105
税金等調整前当期純利益又は当期純損失(△) Income Before Income Taxes (Loss) △1,168 1,071 1,281 1,682 1,570
法人税、住民税及び事業税 Income Taxes-current 39 145 90 261 490
法人税等調整額 Income Taxes-deferred 468 422 406 157 18
親会社株主に帰属する当期純利益又は当期純損失(△) Profit Attributable to Owners of Parent (Loss) △1,676 502 785 1,263 1,061
FINANCIAL STATEMENTS (Consolidated)財務諸表(連結)
キャッシュ・フロー計算書 Statements of Cash Flows (百万円)(Millions of Yen)
決算期 Fiscal Year 2016/3 2017/3 2018/3 2019/3 2020/3
営業活動によるキャッシュ・フロー Net Cash Provided by Operating Activities △4,710 9,339 2,921 1,875 5,006
投資活動によるキャッシュ・フロー Net Cash Used in Investment Activities △2,511 △1,696 △2,411 △2,364 △1,688
財務活動によるキャッシュ・フロー Net Cash Used in Financing Activities 4,065 △2,938 △739 △592 △591
現金及び現金同等物の増加額(△減少額) Increase (Decrease) in Cash and Cash Equivalents 3,156 4,703 △229 △1,080 2,726
現金及び現金同等物の期首残高 Cash and Cash Equivalents at Beginning of Period 12,515 9,358 14,062 13,832 12,751
現金及び現金同等物の期末残高 Cash and Cash Equivalents at End of Period 9,358 14,062 13,832 12,751 15,478
13

●株価及び出来高の推移/Stock Price Range and Volume●大株主一覧/Major Shareholders (Top 10 Shareholders)
●所有者別分布状況/Composition of Shareholders by Category
2020年3月31日現在/ As of March 31, 2020
●発行済株式総数…………………………… 14,783,900株●上場証券取引所……………………………東京証券取引所市場第1部 名古屋証券取引所市場第1部●証券コード………………………………… 6430●単元株……………………………………… 100株
Number of Shares Outstanding … 14,783,900 SharesStock Listings ………………………… The First Section of the Tokyo Stock Exchange The First Section of the Nagoya Stock ExchangeTicker Code …………………………… 6430Stock Trading Unit …………………… 100 Shares
株主名/Name of Shareholder 持株数(株)Number of Shares Owned
持株比率(%)Contribution
栢森 健 Ken Kayamori 1,652,200 11.17栢森 雅勝 Masakatsu Kayamori 1,014,650 6.86栢森 美智子 Michiko Kayamori 926,000 6.26栢森 寿恵 Hisae Kayamori 813,100 5.50栢森 和代 Kazuyo Kayamori 773,000 5.22公益財団法人栢森情報科学振興財団 Kayamori Foundation of Informational Science Advancement 750,000 5.07日本マスタートラスト信託銀行株式会社(信託口) The Master Trust Bank of Japan, Ltd. (Trust Account) 455,100 3.07栢森 綾音 Ayane Kayamori 443,500 3.00栢森 新治 Shinji Kayamori 443,450 2.99日本トラスティ・サービス信託銀行株式会社(信託口) Japan Trustee Services Bank, Ltd. (Trust Account) 321,700 2.17
決算期 Fiscal Year 2020/3 2019/3区 分 Category 株式数(株)
Number ofShares
株主数(名)Number of
Shareholders
株式数(株)Number of
Shares
株主数(名)Number of
Shareholders個人・その他 Individuals & Others 7,572,049 11,437 7,566,841 10,570金融機関 Financial Institutions 1,574,100 19 1,485,600 20その他国内法人 Other Corporations 3,862,505 98 4,018,401 92外国人 Foreigners 1,494,370 91 1,521,788 88証券会社 Securities Companies 280,008 28 190,430 26自己名義株式 Treasury Stock 868 1 840 1合計 Total 14,783,900 11,674 14,783,900 10,797
Corporate Information会社概要
Stock Information株式情報
●社 名 ダイコク電機株式会社●創 業 1965(昭和40)年9月●設 立 1973(昭和48)年7月●資 本 金 6億7,400万円●従業員数 (連結)640名
(単独)439名●決 算 期 3月31日●事 業 所 3事業所、4支店、
13営業所
●連結子会社 元気株式会社DAXEL(ダクセル)株式会社ダイコク産業株式会社アロフト株式会社
●Name Daikoku Denki Co., Ltd.●Founded September 1965●Established July 1973●Paid-in capital 674 million yen●Employees 640(consolidated)
439(unconsolidated)●End of Fiscal Year March 31●Business
LocationsThree division offices,four branches,and thirteen sales offices
●ConsolidatedSubsidiary
Genki Co., Ltd.Daxel Co., Ltd.Daikoku Sangyo Co., Ltd.Aloft Co., Ltd.
●役員一覧(2020年6月25日現在)代 表 取 締 役 会 長 栢 森 雅 勝代 表 取 締 役 社 長 大 上 誠一郎代 表 取 締 役 専 務 栢 森 健常 務 取 締 役 大 成 俊 文取 締 役 栢 森 啓取 締 役 藤 巻 靖 裕取 締 役 松 原 真那武取 締 役 岡 本 篤 憲取 締 役 足 立 芳 寛取 締 役 武 田 邦 彦常 勤 監 査 役 吉 川 幸 治監 査 役 村 橋 泰 志監 査 役 田 島 和 憲監 査 役 知 念 良 博
Chairman and representative director Masakatsu KayamoriPresident and representative director Seiichiro OueExecutive director and representative director Ken KayamoriManaging director Toshifumi OonariDirector Akira KayamoriDirector Yasuhiro FujimakiDirector Manabu MatsubaraDirector Atsunori OkamotoDirector Yoshihiro AdachiDirector Kunihiko TakedaStanding statutory auditor Kouji YoshikawaAuditor Hiroshi MurahashiAuditor Kazunori TajimaAuditor Yoshihiro Chinen
●Officers(As of June 25, 2020)
(円)(Yen)
(千株)(Thousands of Shares)
1,000
2,000
3,000
0
2,500
2,000
1,500
1,000
500
0
2015 2016 2017 2018 2019 2020
14

本 社〒450-8640 名古屋市中村区那古野一丁目43番5号TEL(052)581-7111 FAX(052)581-7135
DAlKOKU DENKl CO., LTD.Head Of�ce43-5 Nagono 1-chome, Nakamura-ku, Nagoya 450-8640 JapanPhone +81-52-581-7111 Fax +81-52-581-7135https://www.daikoku.co.jp/