Embed Size (px)
Citation preview

Financial Highlights for FY2018
2019年3月期 決算概要
(For the 12 months from April 1, 2018 to March 31, 2019)
【Contents】 ・Financial Highlights for FY2018 決算ハイライト
P1 - 2 ・Summary of Account Settlement in FY2018: Overview決算概要 総括
P3 - 4 ・Summary of Profits損益の概要
P5 - 6 ・Consolidated Balance Sheets連結貸借対照表
P7 - 9 ・Business Segment Informationセグメント情報
P10 ・Breakdown of Investment Real Estates投資不動産の内訳
P11 ・Status of Investment Plan投資計画の進捗状況
・Consolidated Statements of Cash Flows連結キャッシュ・フローの状況
P12 - 15 ・Business Performance Forecasts for FY20192020年3月期 業績予想
P16 ・Capital Investments and Depreciation設備投資額・減価償却費
P17 - 18 ・Orders Received and Sales by Business Segment (Non-consolidated)事業別受注高・売上高(個別)
P19 ・Sale of Houses in Japan国内住宅販売戸数
・Average sales per unit / Average area per unit (Single-Family Houses and Rental Housing)1戸当たりの平均売上金額 / 1戸当たりの平均売上面積(住宅・賃貸住宅)
P20 ・Rental Housing Business賃貸住宅事業
・Condominiums Businessマンション事業
P21 ・Overseas Business海外事業
注:1.本資料の予想数値は、当資料の発表日までに入手可能な情報に基づき作成したもの
であり、実際の業績は、今後様々な要因によって異なる結果となる場合があります。
2.単位未満は切り捨てて表示しております。
Notes: 1. The business forecasts are based on assumptions in light of information available as of the date of announcement of this material, and the factors of uncertainty that may possibly
impact the future results of operations. The Company’s actual results may differ significantly from those presented herein as a consequence of numerous factors.2. Amounts less than one unit are omitted in this material.
(2019.05)
(After revision/訂正版)We have corrected P.15. Revised numbers are indicated in red.
P.15を修正しております。訂正箇所は、赤字で
記載しております

大和ハウスグループ 2019年3月期 決算概要
Daiwa House Group Financial Highlights for FY2018
■ Earnings Summary
■
(\ billion)Change
3,700.0 12.0%
280.0 32.9%
180.0 31.9%
【Reference】Transitions in earnings excluding amortization of actuarial differences from the employees' retirement benefits.
(\ billion)Results YOY Recal. YOY Results YOY Recal. YOY Forecasts YOY Recal. YOY
3,795.9 3,795.9 4,143.5 4,143.5 4,250.0 4,250.0
3,002.1 3,007.2 3,300.7 3,302.1 3,379.0 3,379.0
79.1% 79.2% 79.7% 79.7% 79.5% 79.5%
446.6 452.4 470.5 472.1 493.0 493.0
347.1 11.9% 336.2 14.5% 372.1 7.2% 369.1 9.8% 378.0 1.6% 378.0 2.4%
9.1% 8.9% 9.0% 8.9% 8.9% 8.9%
■
■
■
■
■ Investment and sales of development properties during the 5th Medium-Term Management Plan
■ Investment Results ■ Sale of development properties
Overseas
147.8 86.1
In addition, we announced the 6th Medium-Term Management Plan during the 3 years from FY2019 in the press release earlier.
Commercial Facilities
Rental Housing
(\ billion)
Excluding the impact of actuarial differences related to employees' retirement benefit obligations, FY2018 operating income was 369.1billion yen (YOY +9.8%) , an increase of 32.9 billion yen year-on-year. However, we have not incorporated any impact from theretirement benefits into our business performance forecasts for FY2019. [ P.3,12 ]
Rental
Housing
59.0 162.6
CommercialFacilities
With respect to the irregularities in the accounts of a Daiwa House affiliate in the People's Republic of China, to cover the anticipatedimpact on the allowance for doubtful accounts in question of the monetary amount of funds embezzled from the company that, as of thepresent moment, appear unlikely to be recovered and on the evaluation of the assets of the affiliate, we have included approximately12.5 billion yen under the category of a loss on affiliate equity within ordinary loss.
In addition, in relation to the issue of off-specification components in and remedial work on our Single-Family Houses and RentalHousing, we have included 1.5 billion yen as cost of sales within operating loss, to cover anticipated expenses involved in verification ofthe safety of the residential structures involved and in meeting the wishes of the owners of said homes.
We revise the annual dividend from the previously announced 110 yen to 114 yen (interim dividend (actual) of 50 yen, year-enddividend of 64 yen), resulting in a dividend payout ratio of 31.9%. Furthermore, we are planning on an annual dividend amount of 115yen per share (interim dividend of 55 yen, year-end dividend of 60 yen) for the upcoming fiscal year, resulting in a projected dividendpayout ratio of 30.3%. [ P.12 ]
17.2
CapitalInvestments
Real estate development 765.8
396.4
Logistics, Business & Corporate Facilities 66.3
Net sales
-1.4
Net sales
SG&A expenses -5.7 -1.6
0
0
010.8
Cost of sales -5.0
5th Medium-Term Management Plan
Operating income 372.1 7.2%
Net sales
YOY
Operating income
4,143.5
FY2018Amortizationof actuarialdifferences
Amortizationof actuarialdifferences
9.2%
0.5%
FY2019Amortizationof actuarialdifferences
Initial plan Results
237.4
372.1
4,143.5
Financial Highlights
Goss profit
30.6
OP margin
Cost-of-sales ratio
M&A
increased for the 3rd consecutive year
increased for the 10th consecutive year
increased for the 9th consecutive year
increased for the 9th consecutive year
Note
ROE 15.5%
FY2017
Ordinary income
The FY2018, the final year of the 5th Medium-Term Management Plan, net sales, operating income, ordinary income, and net incomewere all at record-high levels. As a result, we significantly outperformed the initial targets of the 5th Medium-Term Management Plan.
75.6
123.5
223.7
331.0
221.8
42.8
Total \1,075.7 billion Total
Logistics, Business & Corporate Facilities
3.0
359.4 4.3%
Net income attributableto owners of the parent 237.4
FY2018 Results

大和ハウスグループ 2019年3月期 決算概要
Daiwa House Group Financial Highlights for FY2018
■業績概要
■
(億円)対前年比
9.2% 9期連続増収
7.2% 9期連続増益
4.3% 10期連続増益
0.5% 3期連続増益
【ご参考】退職給付数理差異の影響を除いた業績推移
(億円)実績
対前年比 再計
対前年比 実績
対前年比 再計
対前年比 計画
対前年比 再計
対前年比
37,959 37,959 41,435 41,435 42,500 42,500
30,021 30,072 33,007 33,021 33,790 33,790
79.1% 79.2% 79.7% 79.7% 79.5% 79.5%
4,466 4,524 4,705 4,721 4,930 4,930
3,471 11.9% 3,362 14.5% 3,721 7.2% 3,691 9.8% 3,780 1.6% 3,780 2.4%
9.1% 8.9% 9.0% 8.9% 8.9% 8.9%
■
■
■
■
■第5次中期経営計画期間中における投資と回収実績
■ 投資実績 ■ 回収実績
(億円)
賃貸住宅
861 商業施設
事業施設
開発物件売却 合計
なお、2020年3月期を初年度とする3か年計画の第6次中期経営計画は、別途リリースにて公表しております。
172
2,218 756
合計 1兆757億円 3,310 1,235
428590 1,626 3,964 1,478 2,237
306
中華人民共和国の関連会社における不正行為に関しては、不正に流出した預金のうち現時点で回収が見込まれない金額に対して貸倒引当金を計上した影響、及び当該会社が保有する資産の評価の見直し等による影響として、125億円を持分法投資損失として経常損益に含めております。
戸建住宅・賃貸共同住宅における建築基準に関する不適合等に関しては、建物の安全性の確認及びお客さまのご要望に対応するための費用として、15億円を売上原価として営業損益に含めております。
年間配当金については、前回公表の110円から114円(中間配当実績50円、期末配当64円)に変更させていただき、
配当性向31.9%の予定です。また次期については、1株当たり115円(中間配当55円、期末配当60円)、配当性向
30.3%とさせていただく予定です。[ P.12 ]
不動産開発 7,658設備投資 M&A
売上高 売上総利益
賃貸住宅 商業施設 事業施設 海外 663
退職給付債務に係る数理差異の影響を除くと2019年3月期の営業利益は3,691億円となり、
2018年3月期より329億円の増益(対前年比 +9.8%)となりました。
なお、2020年3月期の業績予想には、退職給付数理差異の影響は織り込んでおりません。[ P.3,12 ]
売上原価 -50 -14 0
原価率
管理販売費 -57 -16 0
営業利益 108 30 0
営業利益率
数理差異の影響
数理差異の影響
数理差異の影響
売上高
31.9%
ROE 15.5%
2018年3月期 実績 2019年3月期 実績 2020年3月期 計画
2,374
経常利益 3,594
親会社株主に帰属する
当期純利益 2,374 1,800
売上高 41,435 37,000 41,435 12.0%
営業利益 3,721 2,800 3,721 32.9%
決算ハイライト
第5次中期経営計画の最終年度である2019年3月期は、売上高・営業利益・経常利益・当期純利益は過去最高を更新。
第5次中期経営計画の当初計画を大幅に上回る結果となりました。
第5次中期経営計画
2019年3月期
実績 備 考 当初計画 実績 対計画比

大和ハウスグループ 2019年3月期 決算概要
Daiwa House Group Financial Highlights for FY2018
Summary of Account Settlement in FY2018 : Overview 決算概要 総括
Amounts Ratio Amounts Ratio増減額 増減率 増減額 増減率
Net sales
売上高
Operating income
営業利益
Ordinary income
経常利益
Net income attributable toowners of the parent
親会社株主に帰属する
当期純利益
Earnings per share
1株当たり当期純利益
Return on equity
自己資本当期純利益率
Amounts Ratio Amounts Ratio増減額 増減率 増減額 増減率
Total assets
総資産
Net assets
純資産
Book-value per share
1株当たり純資産
■ Number of group companiesグループの概要
Mar. 31, 2018 Mar. 31, 2019 Change
2018 / 3末 2019 / 3末 増減
親会社(大和ハウス工業)
Consolidated subsidiaries Included: 71 ; Excluded: 12
連結子会社 増加 71社 ; 減少 12社(of which, overseas consolidated subsidiaries) (Included: 55 ; Excluded: 7)
(内、海外連結子会社) (増加 55社 ; 減少 7社)
Equity-method affiliates Included: 18; Excluded: 4
持分法適用関連会社 増加 18社; 減少 4社Unconsolidated subsidiaries Included: 1; Excluded: 2
増加 1社; 減少 2社Included: 1; Excluded: 3
持分法非適用関連会社 増加 1社; 減少 3社
Total
計
Notes
備考
Number of companies 企業数
非連結子会社
(\ 100 Million/億円)
(\ 100 Million/億円)
(157) (205) (48)
317 387 70
3 2 -1
4 2 -2
28 42 14
1 1 -
¥2,218.17 ¥2,404.32 ¥186.15 8.4%
281 340 59
1,455 5.4%
15,135 16,437 1,301 8.6% 11,746 12,538 791 6.7%
40,350 43,340 2,989 7.4% 27,110 28,566
Mar. 31,2018
2018 / 3末
Mar. 31,2019
2019 / 3末
ChangeMar. 31,
20182018 / 3末
Mar. 31,2019
2019 / 3末
Change前期末比 前期末比
17.0% 15.5%
Consolidated Non-consolidated
連結 個別
-156 -7.9%
¥355.87 ¥357.29 ¥1.42 0.4%
2,363 2,374 10 0.5% 1,982 1,825
3,445 3,594 148 4.3% 2,630 2,684 54 2.1%
3,471 3,721 250 7.2% 2,379 2,406
Affiliated companies not accounted for by equity method
Parent company (Daiwa House Industry)
Consolidated Non-consolidated
連結 個別
FY20172018 / 3月期
FY20182019 / 3月期
YOYFY2017
2018 / 3月期
FY20182019 / 3月期
YOY前年同期比 前年同期比
37,959 41,435 3,475 9.2% 18,142 19,255 1,112 6.1%
26 1.1%
1

大和ハウスグループ 2019年3月期 決算概要
Daiwa House Group Financial Highlights for FY2018
Summary of Account Settlement in FY2018 : Overview 決算概要 総括
■ Major factors for changes in net sales and operating income売上高、営業利益の増減要因
■ Net sales
売上高 (¥ 100 Million/億円)
商業施設事業の売上高増加 [ 大和ハウス +427 (開発物件売却 除く) ]
■ Operating income 営業利益 (¥ 100 Million/億円)
Sales increased売上高増加
Income from sale of development properties increased 開発物件売却利益の増加
SG&A expenses increased (excluding amortization of actuarial differences from the employees' retirement benefits)
管理販売費の増加 (退職給付数理差異の影響を除く)
Cost-of-sales ratio deteriorated 原価率の悪化
Amortization of actuarial differences from the employees' retirement benefits 退職給付数理差異の影響
-197
-139
-78
FY20182019 / 3月期
3,721
FY20182019 / 3月期
41,435
FY20172018 / 3月期
3,471
+581
+84
+145
Sales in Rental Housing business increased [Sales by Daiwa House: -119 (excl.sale of development properties) ; Sales by Daiwa Living: +397 ]
賃貸住宅事業の売上高増加[ 大和ハウス △119 (開発物件売却 除く)、大和リビング +397 ]
+163Other sales increased
その他、売上高増加
+553
Sales overseas in single-family houses increased[ Sales by Stanley-Martin. Communities, LLC: +222; Sales by inclusion of RawsonGroup Pty., Ltd. as a consolidated subsidiary increased: +331 ]
海外における戸建住宅事業の売上高増加[ スタンレーマーチン社 +222、ローソン社の新規連結子会社化による増加 +331 ]
+517
Sales increased in development properties [ Rental Housing: +159, Commercial Facilities: +107, Logistics, Business & Corporate Facilities business: +250 ]
開発物件の売上高増加 [ 賃貸住宅 +159、商業施設 +107、事業施設 +250 ]
+623
Sales in Commercial Facilities business increased [Sales by Daiwa House: +427 (excl. sale of development properties) ]
FY20172018 / 3月期
37,959
Sales in Logistics, Business & Corporate Facilities business increased(excl. sale of developmentproperties) [Sales by Daiwa House: +469 ; Sales by Fujita: +742 ]
+1,471 事業施設事業の売上高増加(開発物件売却 除く)[大和ハウス +469、フジタ +742 ]
+3,475
+250
2

大和ハウスグループ 2019年3月期 決算概要
Daiwa House Group Financial Highlights for FY2018
Summary of Profits (1) 損益の概要 (1)
Amounts Ratio
(\ 100 Million/億円)
Net sales
売上高
Cost of sales
売上原価
Gross profit
売上総利益
SG&A expenses
管理販売費
Operating income
営業利益
Non-operating income
営業外収益
Non-operating expenses
営業外費用
Ordinary income
経常利益
Extraordinary income
特別利益
Extraordinary losses
特別損失
Income before income taxes
税金等調整前当期純利益
Net income attributable to ownersof the parent
親会社株主に帰属する
当期純利益
■ Non-operating expenses includes 12.5 billion yen from losses related to irregularites in China.
営業外費用に中国での不正行為に関する損失として125億円が含まれております
122 -13 -10.1% 46
153 50 -103 -67.2% 46
136
1.7% 3,520
2,363 6.2% 2,374 5.7% 10 0.5% 2,400
3,463 3,522 59
67.5% 156
3,445 9.1% 3,594 8.7% 148 4.3% 3,520
171 287 115
3,540
146 160 14 9.7% 136
3,471 9.1% 3,721 9.0% 250 7.2%
8,290
4,466 4,705 238 5.3% 4,750
7,938 20.9% 8,427 20.3% 489 6.2%
9.2% 40,500
30,021 33,007 2,985 9.9% 32,210
37,959 100.0% 41,435 100.0% 3,475
FY20172018年3月期
YOY
FY20182019年3月期
前年同期比
実績 構成比 実績 構成比
Results Results
修正計画 計画対比増減額 増減率
Proportion ProportionRevised
ForecastsDifference
2.1%
-1.1%
2.3%
5.1%
【Reference/参考】 Results YOYAmortization of
actuarialdifferences
YOY Results YOYAmortization of
actuarialdifferences
Recal. YOY
実績 対前年比 数理差異の影響 対前年比 実績 対前年比 数理差異の影響 再計 対前年比
Net sales
売上高
Cost of sales
売上原価
Cost-of-sales ratio
原価率
SG&A expenses
管理販売費
Operating income
営業利益
OP margin
営業利益率9.1% 8.9% 9.0% 8.9%
3,362 3,721 30 3,691
4,466 -57 4,524 4,705 -16
3,471 10811.9% 14.5%
79.2%
30,021 -50 30,072
再計
37,959 37,959
FY2017
7.2%
Recal.
41,435
79.7%
33,007
79.1%
FY2018
9.8%
41,435
33,021
79.7%
-14
4,721
3

大和ハウスグループ 2019年3月期 決算概要
Daiwa House Group Financial Highlights for FY2018
Summary of Profits (2) 損益の概要 (2)
■ SG&A expenses (\ 100 Million/億円)
管理販売費 FY2017 FY2018 Change
2018 / 3月期 2019 / 3月期 増減額
人件費 (福利厚生費含む)
広告宣伝費・販売促進費
販売手数料
通信交通費
その他
Total
管理販売費 計
■ Extraordinary income (\ 100 Million/億円)
特別利益 FY2017 FY2018 Change
2018 / 3月期 2019 / 3月期 増減額
固定資産売却益
投資有価証券売却益
その他
Total
特別利益 計
■ Extraordinary losses (\ 100 Million/億円)
特別損失 FY2017 FY2018 Change
2018 / 3月期 2019 / 3月期 増減額
減損損失
固定資産除却損ほか
Total
特別損失 計
1,232 89
4,466 4,705 238
Personnel costs (incl. welfare expenses)2,517 2,636 119
Others1,142
Others1 12 10
Gain on sales of noncurrent assets18 12 -6
Gain on sales of investment securities132 26 -106
153 50 -103
136 122 -13
Impairment loss118 63 -54
Loss on retirement of noncurrent assets and others18 59 41
Correspondence & transportation expenses202 214 12
Advertising & promotion expenses411 424 13
Sales commission193 197 3
4

大和ハウスグループ 2019年3月期 決算概要
Daiwa House Group Financial Highlights for FY2018
Consolidated Balance Sheets (1) Assets 連結貸借対照表 (1) 資産の部
(\ 100 Million/億円)
Amounts Ratio
増減額 増減率
Current assets
流動資産
Noncurrent assets
固定資産
Property, plant and equipment
有形固定資産
Intangible assets
無形固定資産
Investments and other assets
投資その他の資産
Total assets
資産 合計
(\ 100 Million/億円) (\ 100 Million/億円)
■ Inventoriesたな卸資産
Amounts Ratio 有形固定資産 Amounts Ratio
増減額 増減率 増減額 増減率
Buildings & structures
建物・構築物
未成工事支出金 Land
Land for sale 土地
販売用土地 Others
for houses その他
内、戸建
for condominiums
内、マンション
内、事業用等
内、海外事業
Buildings for sale
販売用建物
for houses
内、戸建
for condominiums
内、マンション
内、事業用等
内、海外事業
Others
その他
Total Inventories
たな卸資産 合計
8,112 348 4.5%
40,350 43,340 2,989 7.4%
Change
前期末比 前期末比
5,817 354 6.5%
17,300 19,210 1,910 11.0%
23,050 24,129 1,079 4.7%
Mar. 31, 2018 Mar. 31, 2019Change
前期末比
2018 / 3末 2019 / 3末
6,997 6,798 -199 -2.9%
15,014 16,085 1,070 7.1%
1,037 1,246 208 20.1%
2018 / 3末 2019 / 3末 2018 / 3末 2019 / 3末
Mar. 31,2018
Mar. 31,2019
Change ■ Property, plant and equipment
Mar. 31,2018
Mar. 31,2019
Costs on uncompletedconstruction contracts 586 793 206 35.3%
5,463
7.1%1,712 2,127 415 24.3%
有形固定資産 合計
367 20.6%
986 1,017 30 3.1%Total property, plantand equipment 15,014 16,085 1,070
5,013 6,209
for others1,590 1,548 -42 -2.7%
for overseas business
1,195 23.8%
1,788
7,763
1,953 2,230 276 14.2%
238 209 -28 -12.0%
2,156
636 1,392 755 118.7%
741 959 218 29.4%
335 357 21 6.5%
7,842 9,556 1,714 21.9%
for others539 522 -17 -3.2%
288 323 34 12.0%
for overseas business
5

大和ハウスグループ 2019年3月期 決算概要
Daiwa House Group Financial Highlights for FY2018
Consolidated Balance Sheets (2) Liabilities and Net Assets 連結貸借対照表 (2) 負債・純資産の部
(\ 100 Million/億円)
2018 / 3末 2019 / 3末 Amounts Ratio
増減額 増減率
Liabilities
負債
Current liabilities
流動負債
Noncurrent liabilities
固定負債
Net assets
純資産
Shareholders’ equity
株主資本
Accumulated othercomprehensive income
その他の包括利益累計額
Subscription rights to shares
新株予約権
Non-controlling interests
非支配株主持分
(\ 100 Million/億円)
■ Interest-bearing liabilities 有利子負債
2018 / 3末 2019 / 3末 Amounts Ratio
増減額 増減率
13,231 12,884 -346 -2.6%
1 1 -0 -0.5%
11,983 14,018 2,035 17.0%
389 476 86 22.3%
Mar. 31, 2018 Mar. 31, 2019
Change
前期末比
25,214 26,903 1,688 6.7%
1,020 650 -369 -36.3%
15,135 16,437 1,301 8.6%
13,725 15,309 1,584 11.5%
43,340 2,989 7.4%負債・純資産 合計
Mar. 31, 2018 Mar. 31, 2019
Change
前期末比
Short-term loans payable938 976 37 4.0%
短期借入金
Total liabilities & net assets40,350
Current portion of bonds payable201 950 748 372.4%
1年内償還予定の社債
Bonds payable2,873 1,920 -953 -33.2%
社債
Current portion of long-term loans payable615 404 -211 -34.3%
1年内返済予定の長期借入金
-20 -0.3%有利子負債(リース債務除く)計
Long-term loans payable3,177 3,505 328 10.3%
長期借入金
Total (excl. lease obligations)7,805 7,785
Others- 29 29 -
その他
Net assets ratio36.5% 36.8% +0.3pt
自己資本比率
Debt-equity ratio 0.53 0.49 -0.04pt
D/Eレシオ
Net debt-equity ratio0.31 0.31 -
ネットD/Eレシオ
6

大和ハウスグループ 2019年3月期 決算概要
Daiwa House Group Financial Highlights for FY2018
Business Segment Information (1) セグメント情報 (1)
■ Sales 売上高
for overseas for overseas Amounts Ratio
(\ 100 Million/億円) 内、海外 内、海外 増減額 増減率
Single-Family Houses
戸建住宅
Rental Housing
賃貸住宅
Condominiums
マンション
Existing Homes Business
住宅ストック
Commercial Facilities
商業施設
Logistics, Business &Corporate Facilities
事業施設
Other Businesses
その他
Total
合計
営業利益
for overseas for overseas Amounts Ratio YOY Change
(\ 100 Million/億円) 内、海外 内、海外 増減額 増減率 増減
Single-Family Houses
戸建住宅
Rental Housing
賃貸住宅
Condominiums
マンション
Existing Homes Business
住宅ストック
Commercial Facilities
商業施設
Logistics, Business &Corporate Facilities
事業施設
Other Businesses
その他
Total
合計
Note: Sales and operating income by segment include intragroup transactions between segments. / 注:上記実績には、セグメント間の内部取引を含んでいます。
4.5%
9.6%
ResultsResults
Results Results
2
1,066
133
132
-0.4pt
9.7%
1
20.5%
-44
+0.1pt
+2.1pt
-16 -7.6%199
7,161 1,689
-1
-0
-
94
135
-4.1%1,022
-
100 11.3%
159
1,377
989
10
1
1.3%
20.6%
-0.7pt
19.8%
12.4%
10,223 862
OP margin営業利益率
■ Operating income
前年同期比
5.2%215 -1
実績
FY2018
2019 / 3月期
11.8%
24 2.1%
6,939
41,435
実績
2,310
1,182
15
940
1,145 -
28
1,721 20.3%
730
3,475 9.2%
790
FY2017
2018 / 3月期
FY2017
37,959
-
-
実績
3,853
10,308
2,850
1,121
0
171
6,208
8,502
6,371
235
325
-0.1pt
41.3%
2018 / 3月期
YOY
実績
3,838
10,613
2,805
前年同期比
2
200
-
-14 -0.4%
305 3.0%
-1.6%-45
1,141
889
230
3,471 3,721 129106
99 121
FY2018
2019 / 3月期
+1.4pt
-0.8pt
+0.9pt
2,785
-3
7
-
-
250 7.2%
4.8%
13.9%
9.0%
27
YOY
7

大和ハウスグループ 2019年3月期 決算概要
Daiwa House Group Financial Highlights for FY2018
Business Segment Information (2) セグメント情報 (2)
(\ 100 Million/億円)
FY20172018/ 3月期
FY20182019/ 3月期
Change増減額
FY20172018/ 3月期
FY20182019/ 3月期
Change増減額
FY20172018/ 3月期
FY20182019/ 3月期
Change増減額
Total/物件売却合計 881 1,398 517
(\ 100 Million/億円)
FY20172018/ 3月期
FY20182019/ 3月期
Change増減額
FY20172018/ 3月期
FY20182019/ 3月期
Change増減額
FY20172018/ 3月期
FY20182019/ 3月期
Change増減額
Total/物件売却合計 461 545 84
FY20172018/ 3月期
FY20182019/ 3月期
Change増減
FY20172018/ 3月期
FY20182019/ 3月期
Change増減
FY20172018/ 3月期
FY20182019/ 3月期
Change増減
■ Sales 売上高
-61
-14
事業施設
商業施設
マンション
Commercial Facilities2,285 216
917 65Condominiums
1,997
Single-Family Houses3,853 3,838 - -
Construction
請負・分譲
Rental management
賃貸・管理
228 107
- -
4,964 4,903賃貸住宅
Rental Housing5,130 5,337 207
4,017 4,424 407 1212,069
-戸建住宅
-
212 372 159
-1,887 -110 852
- -
■ Gross margin
売上総利益
150 127 -22
Logistics, Business &Corporate Facilities 7,323 8,720 1,397 631 705 74
459
- - -Single-Family Houses
771 760 -11 -
523 64
- -
賃貸住宅
戸建住宅
Rental Housing1,288 1,220 -67
Logistics, Business &Corporate Facilities 1,155 1,257 102事業施設
Condominiums337 347 10 113
商業施設
マンション
Commercial Facilities1,120 4221,293 173
■ Gross margin ratio
売上総利益率請負・分譲 賃貸・管理
9
144 157 12
547 797 250
22.4% -0.5pt 47.8% 39.6% -8.2pt
70.6% 34.2% -36.4pt
41.1% 44.8%
13.4% +0.1pt
9.8% +0.8pt
+3.7pt
-
開発物件売却
Logistics, Business &Corporate Facilities 15.8% 14.4% -1.4pt 22.9%
315 54
-
20.3% -0.1pt
- - -- -
13.3%
20.4%
事業施設
9.0%
- -Condominiums
16.9% 18.4%
261
+1.5pt
商業施設
マンション
Commercial Facilities27.9% 29.2% +1.3pt
賃貸住宅
戸建住宅
Rental Housing25.9% 24.9% -1.0pt
- - -122
Single-Family Houses20.0% 19.8% -0.2pt
Sale of development properties
開発物件売却
Construction Rental management Sale of development properties
請負・分譲 賃貸・管理 開発物件売却
Construction Rental management Sale of development properties
49 102 52463 41
8

大和ハウスグループ 2019年3月期 決算概要
Daiwa House Group Financial Highlights for FY2018
Business Segment Information (3) セグメント情報 (3)
■ Orders received FY2017
受注高 2018 / 3月期
Amounts Ratio
(\ 100 Million/億円) 増減額 増減率
Single-Family Houses
戸建住宅
Rental Housing
賃貸住宅
Condominiums
マンション
Existing Homes Business
住宅ストック
Commercial Facilities
商業施設
Logistics, Business & CorporateFacilities
事業施設
Other Businesses
その他
Total
合計
■ Order backlog FY2017
受注残高 2018 / 3月期
Amounts Ratio
(\ 100 Million/億円) 増減額 増減率
Single-Family Houses
戸建住宅
Rental Housing
賃貸住宅
Condominiums
マンション
Existing Homes Business
住宅ストック
Commercial Facilities
商業施設
Logistics, Business & CorporateFacilities
事業施設
Other Businesses
その他
Total
合計
3,782 3,956 174 4.6%
FY2018
2019 / 3月期
Results Results YOY
前年同期比
実績 実績
10,180 10,713 533 5.2%
2,877 2,897 20 0.7%
1,088 1,142 53 4.9%
6,166 7,015 849 13.8%
9,346 10,718 1,371 14.7%
5,514 5,996 481 8.7%
38,956 42,441 3,484 8.9%
Results
実績 実績
FY2018
2019 / 3月期
ResultsYOY
前年同期比
955 1,100 145 15.2%
153 192 39 25.5%
2,549 2,667 117 4.6%
350 449 98 28.1%
1,427 1,599 172 12.1%
7,335 7,897 561 7.7%
14,130 15,677 1,546 10.9%
1,359 1,770 411 30.3%
9
大和ハウスグループ 2019年3月期 決算概要
Daiwa House Group Financial Highlights for FY2018
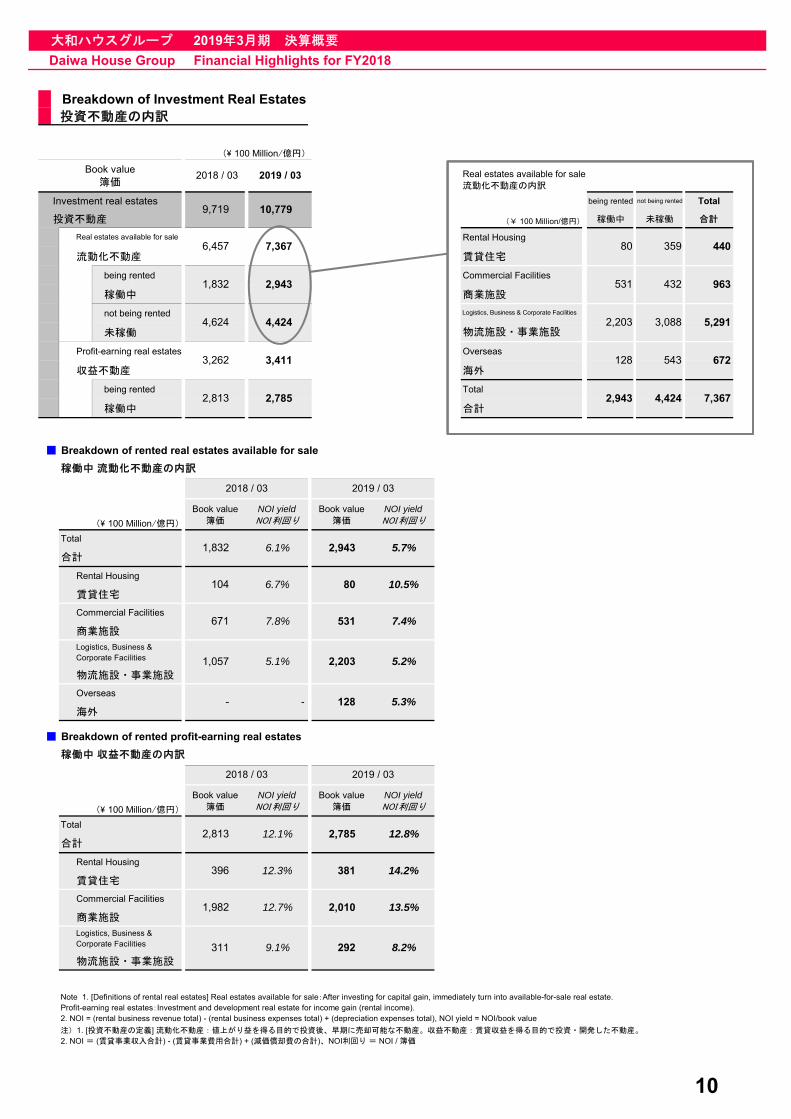
Breakdown of Investment Real Estates 投資不動産の内訳
(\ 100 Million/億円)
Investment real estates being rented not being rented Total
投資不動産 稼働中 未稼働 合計
Rental Housing
流動化不動産 賃貸住宅
being rented Commercial Facilities
稼働中 商業施設
not being rented
未稼働
Profit-earning real estates Overseas
収益不動産 海外
being rented Total
稼働中 合計
Breakdown of rented real estates available for sale
稼働中 流動化不動産の内訳
(\ 100 Million/億円)
Book value簿価
NOI yieldNOI利回り
Book value簿価
NOI yieldNOI利回り
Rental Housing
賃貸住宅
Commercial Facilities
商業施設
物流施設・事業施設
Overseas
海外
Breakdown of rented profit-earning real estates
(\ 100 Million/億円)
Book value簿価
NOI yieldNOI利回り
Book value簿価
NOI yieldNOI利回り
Rental Housing
賃貸住宅
Commercial Facilities
商業施設
物流施設・事業施設
Real estates available for sale流動化不動産の内訳
(¥ 100 Million/億円)
物流施設・事業施設
Logistics, Business & Corporate Facilities
440
963
5,291
35980
432
3,088
Total2,813 12.1% 2,785
合計
8.2%
Logistics, Business &Corporate Facilities 311 9.1% 292
1,982 12.7% 2,010 13.5%
396 12.3% 381
Logistics, Business &Corporate Facilities 5.2%
- -
7.4%
10.5%
■
2018 / 03 2019 / 03
稼働中 収益不動産の内訳
5.1%1,057
80
2,203
7.8%
5.3%128
2018 / 03 2019 / 03
3,262
Book value簿価
671
2,943
2,785
6,457
4,624 4,424
Real estates available for sale
531
104
Total
2018 / 03
3,411
2,813
■
1,832 2,943
6.1%合計
1,832
Note 1. [Definitions of rental real estates] Real estates available for sale:After investing for capital gain, immediately turn into available-for-sale real estate.Profit-earning real estates:Investment and development real estate for income gain (rental income).2. NOI = (rental business revenue total) - (rental business expenses total) + (depreciation expenses total), NOI yield = NOI/book value
注)1. [投資不動産の定義] 流動化不動産:値上がり益を得る目的で投資後、早期に売却可能な不動産。収益不動産:賃貸収益を得る目的で投資・開発した不動産。
2. NOI = (賃貸事業収入合計) - (賃貸事業費用合計) + (減価償却費の合計)、NOI利回り = NOI / 簿価
14.2%
6.7%
2019 / 03
5.7%
12.8%
9,719
7,367
672
7,3672,943
10,779
531
2,203
543128
4,424
10

大和ハウスグループ 2019年3月期 決算概要
Daiwa House Group Financial Highlights for FY2018
Status of Investment Plan 投資計画の進捗状況
FY2016Results
FY2017Results
FY2018Results
(\100 Million/億円)
2016年度実績
2017年度実績
2018年度実績
Cumulativeactual
累計実績
Revised plan
修正計画
Rental Housing 賃貸住宅 211 135 243 590 500 500
Commercial Facilities 商業施設 483 523 619 1,626 1,500 1,500
Logistics, Business &Corporate Facilities
事業施設 1,659 1,155 1,149 3,964 4,000 3,500
Overseas 海外 451 392 633 1,478 1,200 1,500
Real Estate Development 不動産開発 2,806 2,206 2,645 7,658 7,200 7,000
Capital Investments 設備投資(事務所・工場等) 771 730 734 2,237 2,000 2,500
M&A 12 352 496 861 800 1,000
Total 合計 3,590 3,290 3,876 10,757 10,000 10,500
Consolidated Statements of Cash Flows 連結キャッシュ・フローの状況
(\ 100 Million / 億円)
FY2017 FY2018 Change
2018/ 3月期 2019/ 3月期 増減
5th Medium-Term-Plan第5次中期経営計画
6th Medium-Term-Plan第6次中期
経営計画
(FY2019 -FY2021)
△ 267
68
Net cash provided by (used in) operating activities
営業活動によるキャッシュ・フロー
Depreciation and amortization
減価償却費
現金及び現金同等物の増減額(△は減少)
Cash and cash equivalents at beginning of period
現金及び現金同等物の期首残高
Cash and cash equivalents at the end of the period2,762
641
3,555
710
2,133
△ 3,136
418
1,128
3,823
3,261
△ 3,139
現金及び現金同等物の期末残高
Net cash provided by (used in) investing activities
投資活動によるキャッシュ・フロー
Net cash provided by (used in) financing activities
財務活動によるキャッシュ・フロー
Net increase (decrease) in cash and cash equivalents
△ 869
△ 498
3,261
△ 498
△ 3
△ 1,287
△ 1,626
1,128
11

大和ハウスグループ 2019年3月期 決算概要
Daiwa House Group Financial Highlights for FY2018
Business Performance Forecasts for FY2019 (1)2020年3月期 業績予想 (1)
(\ 100 Million/億円)Amounts増減額
Ratio増減率
Net sales
売上高
Cost of sales
売上原価
Gross profit
売上総利益
SG&A expenses
管理販売費
Operating income
営業利益
Non-operating income
営業外収益
Non-operating expenses
営業外費用
Ordinary income
経常利益
Extraordinary income
特別利益
Extraordinary losses
特別損失
Income before income taxes and non-controlling interests
税金等調整前当期純利益
Net income attributable toowners of the parent
親会社株主に帰属する
当期純利益
■ Shareholder return FY2018 FY2019
株主還元 2019/3月期 2020/3月期
Results Forecasts
実績 予想
Earnings per share
一株当たり当期純利益
Annual dividend per share
年間配当金
Interim dividend per share
中間配当
Year-end dividend per share
期末配当
Dividend payout ratio
配当性向
Return on equity15.5%
¥115
¥55
¥60¥64
31.9%
自己資本当期純利益率 (ROE)
¥357.29 ¥379.63
30.3%
¥50
¥114
-61 -50.5%
-49 -98.6%
177 5.0%
122 60
5.7% 2,520 5.9% 145 6.1%
3,522 3,700
2,374
58
-10
50 0
-118 -41.1%
3,594 8.7% 3,760 8.8% 165 4.6%
-6.8%
1.6%
169
149
4,705 4,930
160
287
33,007
41,435
33,790 782 2.4%
3,721 9.0% 3,780 8.9%
224 4.8%
8,710 20.5%8,427 20.3% 282 3.3%
100.0% 42,500 100.0% 2.6%
前年同期比
実績 計画
1,064
構成比 構成比
FY2018 FY20192019 / 3月期 2020 / 3月期
Results Proportion Forecasts ProportionYOY
【Reference/参考】 Results YOYAmortizationof actuarialdifferences
YOY Forecasts YOYAmortizationof actuarialdifferences
Recal. YOY
実績 対前年比数理差異の
影響対前年比 計画 対前年比
数理差異の影響
再計 対前年比
Net sales
売上高Cost of sales
売上原価 Cost-of-sales ratio
原価率SG&A expenses
管理販売費Operating income
営業利益 OP margin
営業利益率8.9% 8.9%9.0% 8.9%
4,930 0 4,930
3,721 30 3,691 3,780 0 3,780
4,705 -16 4,721
1.6%7.2%
79.5%79.5%
42,500
33,790 0 33,790
FY2018 FY2019
9.8% 2.4%
79.7% 79.7%
Recal.
再計
33,007 -14 33,021
41,435 41,435 42,500
12

大和ハウスグループ 2019年3月期 決算概要
Daiwa House Group Financial Highlights for FY2018
Business Performance Forecasts for FY2019 (2)2020年3月期 業績予想 (2)
We will reclassify the segments from the fiscal year ending March 31, 2020.
There are two main changes.
The first is that we have reclassified overseas business previously included in the other segment according to the business content.
The second is that we have changed the results of some subsidiaries to segments according to the content of their main business.
Accordingly, FY2018 results have been relisted under new segments.
1. その他セグメントに含まれていた海外事業について、事業内容に沿って各セグメントへの振り分けを実施。
なお、2019年3月期の実績も新セグメントに組替しております。
■ Sales
(New segment)
for overseas for overseas Amounts Ratio
(\ 100 Million/億円) 内、海外 内、海外 増減額 増減率
Single-Family Houses
戸建住宅
Rental Housing
賃貸住宅
Condominiums
マンション
Existing Homes Business
住宅ストック
Commercial Facilities
商業施設
Logistics, Business &Corporate Facilities
事業施設
Other Businesses
その他
Total
合計
Net sales売上高
Net sales売上高
Note: Sales by segment include intragroup transactions between segments. / 注:上記実績には、セグメント間の内部取引を含んでいます。
2020年3月期より、セグメントの組替を実施しております。
<主な変更点>
2. 一部の子会社の業績を主要事業の内容に沿ったセグメントに変更。
売上高(新セグメント)
10,900
5,035
Results
FY2018
1,181
342
2019 / 3月期
3,700
315
145
-
FY2019
2020 / 3月期
YOY
計画
4,900
前年同期比
1,250
3.3%
Forecasts
-135 -2.7%
1,450
264 7.7%
352
10.0%132
631
2,900
1,135
25
30
512
269
1,057
497
169 3.5%
2.6%1,06442,500 2,900
■ Regional Overview (Overseas)
エリア別 業績(海外)
990
Australia オーストラリア
USA アメリカ
Total 合計
(\ 100 Million/億円)
545
41,435 2,785
304,830
330
-
28
870
実績
3,435
1,317
10,547
7,305
10,263
507
2,785
Other その他
China 中国
ASEAN
362
403
5,000
136 1.3%
294 4.0%7,600
10,400
13

大和ハウスグループ 2019年3月期 決算概要
Daiwa House Group Financial Highlights for FY2018
Business Performance Forecasts for FY2019 (3)2020年3月期 業績予想 (3)
(New segment)
for overseas for overseas Amounts Ratio Change
(\ 100 Million/億円)内、海外 内、海外 増減額 増減率 増減
Single-Family Houses
戸建住宅
Rental Housing
賃貸住宅
Condominiums
マンション
Existing Homes Business
住宅ストック
Commercial Facilities
商業施設
Logistics, Business &Corporate Facilities
事業施設
Other Businesses
その他
Total
合計
Operatingincome
営業利益
Operatingincome
営業利益
Note: Operating income by segment include intragroup transactions between segments. / 注:上記実績には、セグメント間の内部取引を含んでいます。
OP margin営業利益率
営業利益(新セグメント)
■ OperatingIncome
YOY
前年同期比
238 28
実績 計画
OP margin
営業利益率
ForecastsResults
FY2018
2019 / 3月期
FY2019
2020 / 3月期
207 59 140 -12 -67
1.0pt
-0.1pt9.0%
3.9%
10.3%
3.8%
9.7%
18.9%
190 39 -48 -0.8pt
0.4pt
-2.2pt
-0.7pt
-0.6pt
0.0pt
-20.5%
1,046 37 1,120 44 73 7.0%9.9%
6.0%
4.7%
-32.4%
1.7% 9.8%
3.8%
9.8%
2.8%
1.0%
137 - 140 - 2 2.2%10.4%
19.5% 0 14
1,003 2 1,020 41 16
1,425 2 1,440
1.6% 8.9%
100
135 -1 190 -12 54 40.3%
58
25
■ Regional Overview (Overseas)
エリア別 業績(海外)
(\ 100 Million/億円)
Total 合計 129
3,721 129 3,780 100
ASEAN 15
China 中国 35
USA アメリカ 84
Australia オーストラリア 45
87
23
8
-5
Other その他 -4
14

大和ハウスグループ 2019年3月期 決算概要
Daiwa House Group Financial Highlights for FY2018
Business Performance Forecasts for FY2019 (4) 2020年3月期 業績予想 (4)
(\ 100 Million/億円)
FY20182019/ 3月期
FY20192020/ 3月期
Change増減額
FY20182019/ 3月期
FY20192020/ 3月期
Change増減額
FY20182019/ 3月期
FY20192020/ 3月期
Change増減額
Total/物件売却合計 1,519 1,031 -488
(\ 100 Million/億円)
FY20182019/ 3月期
FY20192020/ 3月期
Change増減額
FY20182019/ 3月期
FY20192020/ 3月期
Change増減額
FY20182019/ 3月期
FY20192020/ 3月期
Change増減額
Total/物件売却合計 572 352 -219
FY20182019/ 3月期
FY20192020/ 3月期
Change増減
FY20182019/ 3月期
FY20192020/ 3月期
Change増減
FY20182019/ 3月期
FY20192020/ 3月期
Change増減
■ Sales (New Segment) 売上高
(新セグメント)
Construction Rental management Sale of development properties
請負・分譲 賃貸・管理 開発物件売却
賃貸住宅
-戸建住宅
Rental Housing4,909 5,192 282 5,145 5,514
- - - - -Single-Family Houses
5,035 4,900 -135
2,216 2,832 615
368 492 193 -299
-17 168 153 -14商業施設
-マンション
Commercial Facilities4,882 5,210 327 2,254 2,236
1,218 867 -351 - -Condominiums
-32
-173事業施設
■ Gross margin (New Segment) 売上総利益 (新セグメント)
Construction Rental management Sale of development properties
請負・分譲 賃貸・管理 開発物件売却
714 886 172 858 684Logistics, Business &Corporate Facilities 8,690 8,828 138
28 154 90
-23 62 48
-63賃貸住宅
-戸建住宅
Rental Housing1,224 1,371 147 502 530
- - - - -Single-Family Houses
976 944
-13商業施設
-マンション
Commercial Facilities1,421 1,468 46 458 434
157 111 -46 - -Condominiums
432 441 8
-141事業施設
164 193 29 355 213Logistics, Business &Corporate Facilities 1,228 1,394 165
Construction Rental management Sale of development properties
請負・分譲 賃貸・管理 開発物件売却
-0.2pt 31.3% 46.9% +15.6pt賃貸住宅
-戸建住宅
Rental Housing24.9% 26.4% +1.5pt 9.8% 9.6%
- - - - -Single-Family Houses
19.4% 19.3% -0.1pt
-10.2pt事業施設
23.0% 21.9% -1.1pt 41.4% 31.2%Logistics, Business &Corporate Facilities 14.1% 15.8% +1.7pt
(After revision/訂正後)
-5.5pt商業施設
-マンション
Commercial Facilities29.1% 28.2%
■ Gross margin ratio
(New Segment) 売上総利益率
(新セグメント)
-0.9pt 20.3% 19.4%
12.9% 12.9% +0.0pt - -Condominiums
19.5% 15.6% -3.9pt
-0.9pt 37.1% 31.6%
15

大和ハウスグループ 2019年3月期 決算概要
Daiwa House Group Financial Highlights for FY2018
Capital Investments 設備投資額
FY2017 FY2018 FY2019 Forecasts
(\ 100 Million/億円) 2018 / 3月期 2019 / 3月期 2020 / 3月期 計画
Single-Family Houses
戸建住宅
賃貸住宅
Condominiums
マンション
Existing Homes Business
住宅ストック
Commercial Facilities
商業施設
事業施設
Other Businesses
その他
Adjustments
調整額
Total
合計
Depreciation 減価償却費
FY2017 FY2018 FY2019 Forecasts
(\ 100 Million/億円) 2018 / 3月期 2019 / 3月期 2020 / 3月期 計画
Single-Family Houses
戸建住宅
賃貸住宅
Condominiums
マンション
Existing Homes Business
住宅ストック
Commercial Facilities
商業施設
事業施設
Other Businesses
その他
Adjustments
調整額
Total
合計
145
641 710 770
11 12 -
160182 203
Logistics, Business & CorporateFacilities 110 139
1 1 2
193 210 286
17 19 24
2,931 3,400
34 35 58
0
Rental Housing
(1) (0) -
522 664 510
1
89 88 95
584 794 815
2,845
Notes: Only figures for the FY2019 forecasts are shown under new segments.注:2020/3月期の計画は、新セグメントで記載しています。
75 43 75
-
50 54 80
Rental Housing300 319 505
Logistics, Business & CorporateFacilities 1,311 1,062 1,415
16

大和ハウスグループ 2019年3月期 決算概要
Daiwa House Group Financial Highlights for FY2018
Orders Received & Sales Results by Business Segment (Non-consolidated)
事業別受注高・売上高 実績(個別)
■ Orders received事業別受注高
Amounts Ratio
(\ 100 Million/億円) 増減額 増減率
Custom-builthouses
戸建住宅
Houses in housing development projects
分譲住宅
住宅 Land (including residential
lots of housing development
projects)
土地
Sub-total
小 計
■ Sales事業別売上高
Amounts Ratio Change
(\ 100 Million/億円) 増減額 増減率 増減
Custom-builthouses
戸建住宅
Houses in housing development projects
分譲住宅
住宅 Land (including residential
lots of housing development
projects)
土地
Sub-total
小 計
48,410
11.7% 29.7%
Total51,641 18,142 -0.8pt
-
合計
事業施設
709 22.9% 24.2% -3.0pt3,812Logistics, Business &Corporate Facilities - 3,103 27.2%
25.1% 19,255 1,112 6.1% 24.3%
Notes: 1. The total amount includes the impact of completion basis; however, the number of houses is the complete figure. 2. In the Rental Housing, Condominiums, Commercial Facilities, and Logistics, Business & Corporate Facilities businesses, the figures in the charts include
land and buildings. The YOY ratio is calculated on a value basis. 3. Although Existing Home business, Leisure business, and Environment and Energy business have been omitted from the charts since they had no material impact on the total amount, the total has been calculated
including each value. / 注:1. 金額は進行基準による影響が含まれておりますが、戸数は完成ベースです。2. 集合住宅・マンション・商業施設・事業施設は、土地・建物を含みます。増減率は金額ベースで算出しています。3.「住宅ストック」「観光」「環境エネルギー」は合計金額に与える影響が軽
微の為、省略していますが、「合計」の欄には、各々の数値を含んで算出しています。
39 0.8% 25.5% -1.7pt
商業施設
マンション
Commercial Facilities- 4,042 29.9%
-150 -13.1% 18.7% +1.6pt
-0.2pt- 4,516 473
集合住宅
Condominiums (for sale)2,160 1,149 17.1% 1,789 999
Rental Housing40,254 5,272 27.2% 37,905 5,312
-17
+1.7pt
9,227 3,853 20.0% 8,716 3,836 -0.4% 19.9% -0.1pt
829 21 2.6% 7.5%- 808 5.8% -
Single-FamilyHouses 2,320 556 19.2% 2,192 532 -23 -4.3% 17.9% -1.3pt
-14 -0.6% 24.4% -0.4pt
戸数 金額 売上高総利益率
戸数 金額
6,907 2,487 24.8% 6,524 2,473
FY2017 FY2018
2018 / 3月期 2019 / 3月期
Units AmountsGross profit
ratio Units Amounts
YOY Gross profit ratio
前年同期比 売上高総利益率
Total50,408 18,676
418 11.7%
50,024 20,103 1,426 7.6%合計
Logistics, Business &Corporate Facilities - 3,577 - 3,996事業施設
- 4,762
Condominiums (for sale)
716 17.7%商業施設
Commercial Facilities- 4,046
-132 -11.0%マンション
2,326 1,204 1,843 1,071
5,430 279 5.4%
8,983 3,981 177 4.7%
Rental Housing39,210 5,150 39,198
集合住宅
8,872 3,804
Single-FamilyHouses 2,335 559 2,224 538
- 812 - 818
6,537 2,431 6,759 2,625
FY2018
2019 / 3月期
前年同期比
193 8.0%
YOY
5 0.7%
戸数 金額 戸数 金額
-21 -3.9%
FY2017
2018 / 3月期
Units Amounts Units Amounts
17

大和ハウスグループ 2019年3月期 決算概要
Daiwa House Group Financial Highlights for FY2018
Orders Received & Sales Forecasts by Business Segment (Non-consolidated)
事業別受注高・売上高 計画(個別)
■ Orders received forecasts
Amounts Ratio
(\ 100 Million/億円) 増減額 増減率
Custom-built houses
戸建住宅
Houses in housing development projects
分譲住宅
住宅 Land (including residential lots ofhousing development projects)
土地
Sub-total
小 計
■ Sales forecasts
Amounts Ratio Change
(\ 100 Million/億円) 増減額 増減率 増減
Custom-built houses
戸建住宅
Houses in housing development projects
分譲住宅
住宅 Land (including residential lots ofhousing development projects)
土地
Sub-total
小 計
(New segment)
(New segment)
事業別受注高 計画(新セグメント)
事業別売上高 計画(新セグメント)
Notes: 1. The total amount includes the impact of completion basis; however, the number of houses is the complete figure. 2. In the Rental Housing, Condominiums, Commercial Facilities, and Logistics, Business & Corporate Facilities businesses, the figures in the
charts include land and buildings. The YOY ratio is calculated on a value basis. 3. Although Existing Home business, Leisure business, and Environment and Energy business have been omitted from the charts since they had no material impact on the total amount,
the total has been calculated including each value. / 注:1. 金額は進行基準による影響が含まれておりますが、戸数は完成ベースです。2. 集合住宅・マンション・商業施設・事業施設は、土地・建物を含みます。増減率は金額ベースで算出しています。3.「住宅ストック」「観
光」「環境エネルギー」は合計金額に与える影響が軽微の為、省略していますが、「合計」の欄には、各々の数値を含んで算出しています。
2019 / 3月期
0.9% 23.2% -1.1pt
合計
Logistics, Business & Corporate Facilities- 3,814
54,600 20,200 96
2020 / 3月期
- 4,800 28 0.6%
2 0.1%
43,800
-0.7pt
-2.5pt
-3.4pt
-0.5pt
2.6% 24.2% -0.1ptTotal
48,410 19,255 24.3% 49,030
24.3% -事業施設
3,850 35
19,750 494
3.9% 29.6% -0.2pt
Condominiums (for sale)1,789 1,007 19.2% 2,500
Commercial Facilities- 4,525 29.8% -
商業施設4,700 174
マンション1,350 342 34.0% 15.8%
Rental Housing37,905 5,315 25.6% 38,210 5,400 84 1.6%
集合住宅26.9% +1.3pt
- 829 7.5% - 780 -49 -6.0%
8,716 3,854 20.2% 8,320 3,680
6.8%
-174 -4.5% 19.7%
2,000 500 -32 -6.2% 15.4%
Single-FamilyHouses 2,192 532 17.9%
6,524 2,491 24.9% -91 -3.7% 24.8% -0.1pt
戸数 金額 売上高総利益率
戸数 金額
Units Amounts
6,320 2,400
Gross profitratio Units Amounts
YOY
合計
2019 / 3月期 2020 / 3月期
Gross profit ratio
前年同期比 売上高総利益率
FY2018 FY2019
0.5%Total
50,024 20,103
8,983
5,600 166
Commercial Facilities- 4,771
商業施設
Logistics, Business & Corporate Facilities- 3,997 - 4,000
事業施設
-7.0%
-38 -4.7%- 780
1,300
3,999 8,500 3,720 -279
219 20.3%マンション
集合住宅
Condominiums (for sale)1,843 1,080 2,300
Rental Housing39,198 5,433 3.1%
金額
YOY
2,4406,759 6,430
500 -38 -7.1%
-202 -7.7%
- 818
FY2018 FY2019
Single-FamilyHouses 2,224 538 2,070
2,642
前年同期比Units Amounts Units Amounts
戸数 金額 戸数
18
大和ハウスグループ 2019年3月期 決算概要
Daiwa House Group Financial Highlights for FY2018
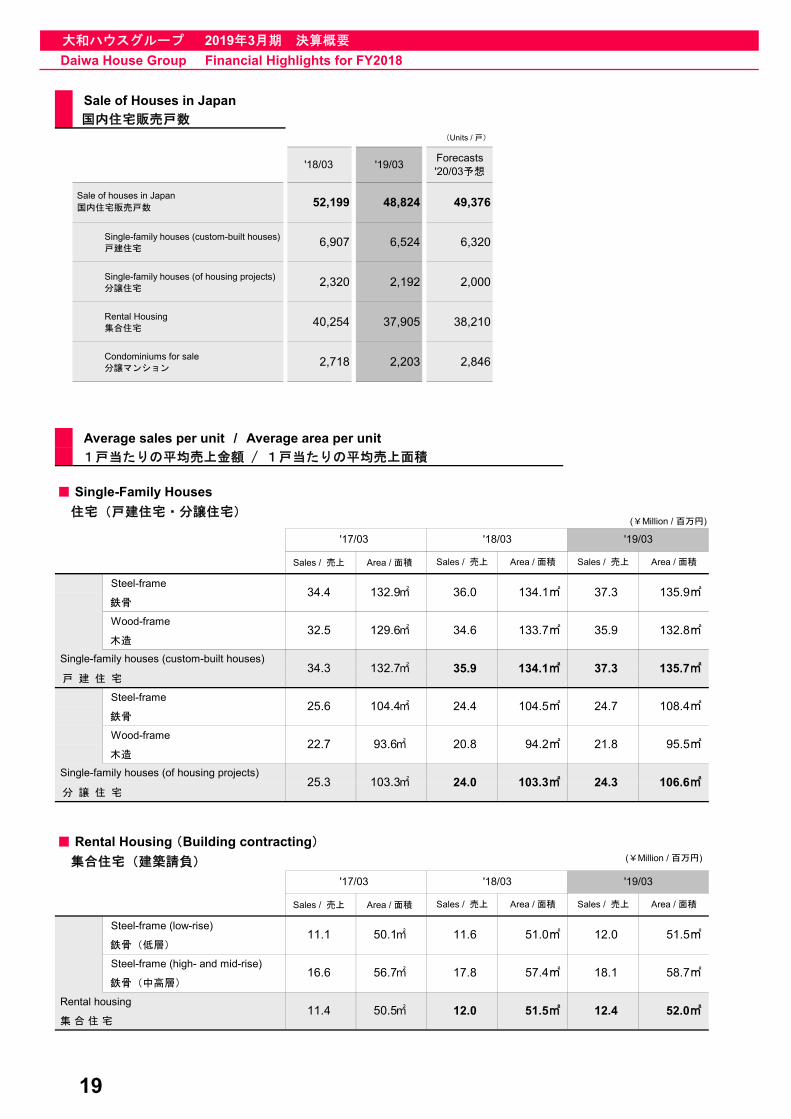
Sale of Houses in Japan
国内住宅販売戸数
(Units / 戸)
'18/03 '19/03Forecasts'20/03予想
52,199 48,824 49,376
Single-family houses (custom-built houses)戸建住宅
6,907 6,524 6,320
Single-family houses (of housing projects)分譲住宅
2,320 2,192 2,000
Rental Housing集合住宅
40,254 37,905 38,210
Condominiums for sale分譲マンション
2,718 2,203 2,846
Average sales per unit / Average area per unit
1戸当たりの平均売上金額 / 1戸当たりの平均売上面積
■ Single-Family Houses
住宅(戸建住宅・分譲住宅)
Sales / 売上 Area / 面積
Steel-frame
鉄骨
Wood-frame
木造
戸 建 住 宅
Steel-frame
鉄骨
Wood-frame
木造
分 譲 住 宅
■ Rental Housing (Building contracting)
集合住宅(建築請負)
Sales / 売上 Area / 面積
Steel-frame (low-rise)
鉄骨(低層)
Steel-frame (high- and mid-rise)
鉄骨(中高層)
Rental housing
集 合 住 宅52.0㎡
16.6 56.7㎡ 17.8 57.4㎡ 18.1 58.7㎡
11.4 50.5㎡ 12.0 51.5㎡ 12.4
103.3㎡
11.1 50.1㎡ 11.6
(¥Million / 百万円)
'18/03 '19/03
51.0㎡ 12.0 51.5㎡
Sales / 売上 Area / 面積 Sales / 売上 Area / 面積
'17/03
Single-family houses (of housing projects)25.3 103.3㎡ 24.0 24.3 106.6㎡
21.8 95.5㎡
25.6 104.4㎡ 24.4 104.5㎡ 24.7 108.4㎡
22.7 93.6㎡ 20.8 94.2㎡
132.8㎡
Single-family houses (custom-built houses)34.3 132.7㎡ 35.9 134.1㎡ 37.3 135.7㎡
32.5 129.6㎡ 34.6 133.7㎡ 35.9
37.3 135.9㎡
Sales / 売上 Area / 面積 Sales / 売上 Area / 面積
34.4 132.9㎡ 36.0 134.1㎡
(¥Million / 百万円)
'18/03 '19/03'17/03
Sale of houses in Japan 国内住宅販売戸数
19

大和ハウスグループ 2019年3月期 決算概要
Daiwa House Group Financial Highlights for FY2018
Rental Housing Business
賃貸住宅事業
■ Management of rental housing units and occupancy rates
賃貸住宅管理戸数と入居率
'17/03 '18/03 '19/03
490,145 522,118 550,214
97.2% 97.3% 96.9%
20,063 21,006 22,024
95.1% 95.8% 96.8%
Total510,208 543,124 572,238
合計471,845 505,313 531,356
97.1% 97.3% 96.9%
Condominiums Businessマンション事業
■ Stock of completed condominium (Non-consolidated) ( Including orders for units )
新築マンションの完成在庫の状況(個別)(受注済戸数を含む)
■ Number of condominium units managed分譲マンション管理戸数
'17/03 '18/03 '19/03
Daiwa LifeNext Co., Ltd.256,347 263,064 265,512
大和ライフネクスト4,153 4,236 4,256
Global Community Co., Ltd.85,358 89,962 95,107
グローバルコミュニティ2,018 2,096 2,210
Total341,705 353,026 360,619
合計6,171 6,332 6,466
Management of rental housing units賃貸住宅管理戸数
(Units / 戸数)
Nihon Jyutaku Ryutu Co., Ltd.
Management of rental housing units賃貸住宅管理戸数
日本住宅流通 Occupancy rates入居率
Daiwa Living Management Co., Ltd.
大和リビングマネジメントOccupancy rates入居率
Daiwa Living Co., Ltd.
大和リビング
Management of rental housing units賃貸住宅管理戸数
(Units / 戸数)
Occupancy rates入居率
Lump-sum contracted units (occupancy guarantee)
一括借上(入居保証)戸数
Number of managed buildings entrusted by HOAs管理組合からの受託棟数
Number of managed units管理戸数
Number of managed buildings entrusted by HOAs管理組合からの受託棟数
Number of managed units管理戸数
Number of managed buildings entrusted by HOAs管理組合からの受託棟数
Number of managed units管理戸数
Mar. 20182018 / 3末
Mar. 2019 ( Includes orders for 17 units )2019 / 3末 (うち、受注済 17戸)
474
807
20

大和ハウスグループ 2019年3月期 決算概要
Daiwa House Group Financial Highlights for FY2018
Overseas Business 海外事業
■ Cumulative overseas investment balance (As of end of Mar. 2019)
海外出資残高累計※(2019年3月末現在)
(\ 100 Million/億円)
China 中国
USA アメリカ
Australia オーストラリア
ASEAN
Other その他
Total 合計
※Non-Consolidated only. / 大和ハウス(個別)のみ集計しています。
■ Sales status of condominium for sale development分譲マンションの販売状況
■ China/中国 (Units / 戸数)
Project Nameプロジェクト名
Location地域
Total units for sale
販売総戸数Completion竣工時期
2018/12 2019/03
Units for sale
販売戸数2,120 2,118
Contract units
契約戸数2,107 2,113
Contract ratio
契約率99.4% 99.8%
Units for sale
販売戸数601 601
Contract units
契約戸数447 447
Contract ratio
契約率74.4% 74.4%
■ Australia/豪州 (Units / 戸数)
Project Nameプロジェクト名
Location地域
Total units for sale
販売総戸数Completion竣工時期
2018/12 2019/03
Units for sale
販売戸数229 229
Contract units
契約戸数194 200
Contract ratio
契約率84.7% 87.3%
Units for sale
販売戸数164 164
Contract units
契約戸数163 164
Contract ratio
契約率99.4% 100.0%
■ Vietnam/ベトナム (Units / 戸数)
Project Nameプロジェクト名
Location地域
Total units for sale
販売総戸数Completion竣工時期
2018/12 2019/03
Units for sale
販売戸数714 714
Contract units
契約戸数712 714
Contract ratio
契約率99.7% 100.0%
Units for sale
販売戸数619 619
Contract units
契約戸数617 617
Contract ratio
契約率99.7% 99.7%
Midtown Projectミッドタウン・プロジェクト
Phu My Hung Area,Ho Chi Minh City
ホーチミン『フーミーフン』エリア
714(Phase 1)
2019/06
619(Phase 2)
2020/6
Tempo (Drummoyne)
テンポ(ドゥルモイン)
Canada BayNew South Wales
ニュー・サウス・ウェールズ州カナダベイ市
164 2018/07
Flour Mill ofSummer Hillフラワー・ミル・
オブ・サマー・ヒル
Inner WestNew South Wales
ニュー・サウス・ウェールズ州インナーウェスト市
233(Stage Ⅲ・Ⅳ)
2019/02
60
2,577
Yihe Xinghaiイワ・セイカイ(頤和星海)
Dalian大連市
2,121(Phase 1)
2012/09
(Ref./参考)SA:1,654(Phase 2)
2020/6
2019/03
950
634
473
458
21


![Associations of obesity with modifiable risk factors for ... · 8/3/2008 · Rheumatoid arthritis (RA) associates with increased risk for cardiovascular disease (CVD) [1]. This is](https://img.pdfslide.tips/doc/110x75/6020afc37cf6ad74c34d593e/associations-of-obesity-with-modifiable-risk-factors-for-832008-rheumatoid.jpg)