Embed Size (px)
Citation preview

2018年11月16日
November 16, 2018
2018年度中間決算 データブック
Fiscal 2018 Interim Results Data Book
株式会社三菱UFJフィナンシャル・グループ
2
<本資料における計数の定義>
本資料には、株式会社三菱UFJフィナンシャル・グループ(以下「当社」という)およびそのグループ会社(以下「当グループ」という)に関連する予想、見通し、目標、
計画等の将来に関する記述が含まれています。これらは、当社が現在入手している情報に基づく、本資料の作成時点における予測等を基礎として記載されています。また、これらの記述のためには、一定の前提(仮定)を使用しています。これらの記述または前提(仮定)は主観的なものであり、将来において不正確であることが
判明したり、将来実現しない可能性があります。このような事態の原因となりうる不確実性やリスクは多数ありますが、これらに関する追加情報については、当社の
決算短信、有価証券報告書、統合報告書、ディスクロージャー誌、アニュアルレポートをご参照下さい。
なお、本資料における将来情報に関する記述は、上記のとおり本資料の日付(またはそこに別途明記された日付)時点のものであり、当社は、それらの情報を最新のものに随時更新するという義務も方針も有しておりません。また、本資料に記載されている当社ないし当グループ以外の企業等にかかわる情報は、公開情報等から引用したものであり、かかる情報の正確性・適切性等について当社は何らの検証も行っておらず、また、これを保証するものではありません。
なお、本資料における当グループに係る財務情報は、別途記載のない限り、日本会計基準ベースの数値(本邦の管理会計基準を含む)を使用しています。日本会計基準と、米国会計基準は重要な点で違いがあります。日本会計基準と米国会計基準、その他会計基準の違いおよび財務情報に与える影響については、専門家に
お問い合わせ下さい。また、本資料は、米国外で発行されるものであり、米国内に居住する個人の方を対象としたものではありません。
This document contains forward-looking statements in regard to forecasts, targets and plans of Mitsubishi UFJ Financial Group, Inc. (“MUFG”) and its group
companies (collectively, “the group”). These forward-looking statements are based on information currently available to the group and are stated here on the
basis of the outlook at the time that this document was produced. In addition, in producing these statements certain assumptions (premises) have been
utilized. These statements and assumptions (premises) are subjective and may prove to be incorrect and may not be realized in the future. Underlying such
circumstances are a large number of risks and uncertainties. Please see other disclosure and public filings made or will be made by MUFG and the other
companies comprising the group, including the latest kessantanshin, financial reports, Japanese securities reports, Integrated reports and annual reports, for
additional information regarding such risks and uncertainties. The group has no obligation or intent to update any forward-looking statements contained in
this document.
In addition, information on companies and other entities outside the group that is recorded in this document has been obtained from publicly available
information and other sources. The accuracy and appropriateness of that information has not been verified by the group and cannot be guaranteed.
The financial information used in this document was prepared in accordance with Japanese GAAP (which includes Japanese managerial accounting
standards), unless otherwise stated. Japanese GAAP and U.S. GAAP, differ in certain important respects. You should consult your own professional
advisers for a more complete understanding of the differences between U.S. GAAP and Japanese GAAP and the generally accepted accounting principles
of other jurisdictions and how those differences might affect the financial information contained in this document. This document is being released by MUFG
outside of the United States and is not targeted at persons located in the United States.
連 結: 三菱UFJフィナンシャル・グループ(連結)
2行合算: 三菱UFJ銀行(単体)と 三菱UFJ信託銀行(単体)の単純合算
銀行連結: 三菱UFJ銀行(連結)
銀行: 三菱UFJ銀行(単体)
信託連結: 三菱UFJ信託銀行(連結)
信託銀行: 三菱UFJ信託銀行(単体)
証券HD: 三菱UFJ証券ホールディングス
MUMSS: 三菱UFJモルガン・スタンレー証券
ニコス: 三菱UFJニコス
Consolidated: Mitsubishi UFJ Financial Group (consolidated)
Non-consolidated: Simple sum of MUFG Bank (non-consolidated)
and Mitsubishi UFJ Trust & Banking Corporation (non-consolidated)
the Bank (consolidated): MUFG Bank (consolidated)
the Bank (BK): MUFG Bank (non-consolidated)
the Trust Bank (consolidated): Mitsubishi UFJ Trust & Banking Corporation (consolidated)
the Trust Bank (TB): Mitsubishi UFJ Trust & Banking Corporation (non-consolidated)
The securities HD (SCHD): Mitsubishi UFJ Securities Holdings
MUMSS: Mitsubishi UFJ Morgan Stanley Securities
NICOS: Mitsubishi UFJ NICOS
Definitions of figures used in this document

3
主要子会社・関連会社の状況 Overview of Major Subsidiaries / Affiliated Companies
目次
Contents
MUFGの概要 MUFG Overview
5
2018年度中間決算の概要 Financial Results for Interim FY2018
15
・ グループストラクチャー 6
Group structure
・ 主要子会社・関連会社 7
Major Subsidiaries / affiliates
・ グループネットワーク 9
Group network
・ MUFGのランキング 10
MUFG’s ranking
・ グループ格付一覧 11
Ratings
・ 店舗網 12
Number of outlets
・ 株主構成 13
Shareholder structure
・ モルガン・スタンレーへの出資 14
Investment to Morgan Stanley
・ 資金利益 (1)(銀行) 16
Net interest income (1) (the Bank)
・ 運用・調達(1)(銀行) 17
Funding and investment (1) (the Bank)
・ 資金利益(2)(信託銀行) 18
Net interest income (2) (the Trust Bank)
・ 運用・調達(2)(信託銀行) 19
Funding and investment (2) (the Trust Bank)
・ 非資金利益(銀行・信託銀行) 20
Non-interest income (the Bank / the Trust Bank)
・ 連単差(連結) 21
Consolidated / Non-consolidated differences (Consolidated)
・ 営業費、臨時損益・特別損益(連結・2行合算) 23
General and administrative expenses, Non-recurring gains / losses,
extraordinary gains / losses (Consolidated / Non-consolidated)
・ 資産・負債(2行合算) 24
Assets and liabilities (Non-consolidated)
・ 繰延税金資産(連結・銀行・信託銀行) 25
Deferred tax assets (Consolidated / the Bank / the Trust Bank)
・ 退職給付(連結) 26
Retirement benefits (Consolidated)
・ 三菱UFJ証券ホールディングス 28
Mitsubishi UFJ Securities Holdings
・ 三菱UFJモルガン・スタンレー証券 29
Mitsubishi UFJ Morgan Stanley Securities
・ 三菱UFJモルガン・スタンレーPB証券、三菱UFJ国際投信 31
Mitsubishi UFJ Morgan Stanley PB Securities
Mitsubishi UFJ Kokusai Asset Management
・ 三菱UFJニコス 32
Mitsubishi UFJ NICOS
・ アコム 34
ACOM
・ 米州MUFGホールディングス(MUAH) 36
MUFG Americas Holdings Corporation (MUAH)
・ クルンシィ(アユタヤ銀行) 37
Krungsri (KS)
・ バンクダナモン 38
Bank Danamon
・ Security Bank, VietinBank 39
27

4
目次
Contents
事業本部別収益 Profits by Business Group
40
・ 与信関係費用・貸倒引当金の状況(連結) 48
Credit costs, allowance for credit losses (Consolidated)
・ 金融再生法開示債権(2行合算) 49
Non performing loans based on the FRL (Non-consolidated)
・ 貸倒引当金・保全(2行合算) 50
Allowance, collateral and guarantee (Non-consolidated)
・ 債務者区分別貸倒引当率(銀行・信託銀行) 51
Reserve ratios by borrower category (the Bank, the Trust Bank)
・ 海外事業法人向け与信(連結) 52
Overseas corporate credit exposure (Consolidated)
・ 国・地域別海外与信残高(銀行連結(MUAH、KSを除く)) 53
Exposure to overseas borrowers by country and region
(the Bank consolidated excl. MUAH, KS)
・ 国内業種別貸出状況(2行合算) 55
Domestic loans classified by type of industry (Non-consolidated)
・ 資源関連与信(連結) 56
Energy and mining portfolio (Consolidated)
アセットクオリティ Asset Quality
47
主な業量 Major Business Volume
42
・ 事業本部別収益(連結) 41
Profits by business group (Consolidated)
・ 運用商品 43
Investment products
・ 資産承継/コンシューマーファイナンス 44
Asset inheritance / Consumer finance
・ シンジケートローン/不動産 45
Syndicated loan / Real estate
・ 受託財産 46
AM / IS
5
MUFGの概要 MUFG Overview

グループストラクチャー
Group structure
*1 18年9月末時点の議決権保有割合 Portion of voting rights held as of end Sep 18
*2 持分法適用会社 Equity method affiliates
*3 MUFGの議決権保有割合 Portion of voting rights held by MUFG
注:パーセントは18年3月末時点の議決権保有割合 Note: All percentage figures stand for voting right held at end Mar 18
76.8%
6
三菱UFJフィナンシャル・グループ
Mitsubishi UFJ Financial Group
(MUFG)
アコム
ACOM
モルガン・スタンレー*2
Morgan Stanley*2
米州MUFG
ホールディングス
コーポレーション
MUFG Americas
Holdings Corporation
アユタヤ銀行
Bank of Ayudhya
(Krungsri, KS)
三菱UFJモルガン・ スタンレー証券
Mitsubishi UFJ
Morgan Stanley
Securities
モルガン・スタンレー
MUFG証券*2
Morgan Stanley
MUFG Securities*2
100.0% 100.0% 100.0%
40.1%
23.3%
60.0% 95.1%(100.0%*3)
24.3%*1
100.0%
三菱UFJ国際投信
Mitsubishi UFJ
Kokusai Asset
Management
戦略的提携
Strategic alliance
49.0%
100.0%
三菱UFJ銀行
MUFG Bank
三菱UFJ信託銀行
Mitsubishi UFJ
Trust and Banking
三菱UFJ証券
ホールディングス
Mitsubishi UFJ
Securities Holdings
三菱UFJニコス
Mitsubishi UFJ
NICOS
三菱UFJリース*2
Mitsubishi UFJ
Lease & Finance*2
日立キャピタル*2
Hitachi Capital
Corporation*2
23.0%
バンクダナモン*2
Bank Danamon*2
40.0%*1

7
主要子会社・関連会社(1) Major subsidiaries / affiliates (1)
主要な連結子会社 (18/9末)*1 Major consolidated subsidiaries (End Sep 18)*1
名称
Company name
資本金又は
出資金
(百万円)
議決権
所有割合(%)
子会社による間接保有割合
(%)
Capital
(¥mm)
Percentage
of voting
right held
(%)
Percentage of
voting right
indirectly held
through
subsidiaries (%)
㈱三菱UFJ銀行
MUFG Bank, Ltd. 1,711,958 100.0 -
三菱UFJ信託銀行㈱
Mitsubishi UFJ Trust and Banking Corporation 324,279 100.0 -
日本マスタートラスト信託銀行㈱
The Master Trust Bank of Japan, Ltd. 10,000 46.5 46.5
三菱UFJ証券ホールディングス㈱
Mitsubishi UFJ Securities Holdings Co., Ltd. 75,518 100.0 -
三菱UFJモルガン・スタンレー証券㈱
Mitsubishi UFJ Morgan Stanley Securities Co., Ltd. 40,500 60.0 60.0
三菱UFJモルガン・スタンレーPB証券㈱
Mitsubishi UFJ Morgan Stanley PB Securities Co., Ltd. 8,000 100.0 100.0
カブドットコム証券㈱
Kabu.com Securities Co., Ltd. 7,196 59.2 59.2
三菱UFJニコス㈱
Mitsubishi UFJ NICOS Co., Ltd. 109,312 100.0 -
アコム㈱
ACOM CO., LTD. 63,832 40.1 2.5
エム・ユー投資顧問㈱
MU Investments Co., Ltd. 2,526 100.0 100.0
三菱UFJ国際投信㈱
Mitsubishi UFJ Kokusai Asset Management Co., Ltd. 2,000 100.0 100.0
三菱UFJ不動産販売㈱
Mitsubishi UFJ Real Estate Services Co., Ltd. 300 100.0 100.0
Japan Digital Design㈱
Japan Digital Design, Inc. 1,500 100.0 -
名称
Company name
資本金又は 出資金
議決権所有
割合(%) 子会社による間接保有割合(%)
Capital Percentage
of voting right held (%)
Percentage of
voting right
indirectly held
through
subsidiaries (%)
MUFG Americas Holdings
Corporation 147
百万米ドル USD mm
100.0 95.1
Bank of Ayudhya Public
Company Limited 73,557
百万タイバーツ
THB mm 76.8 76.8
Mitsubishi UFJ Investor Services &
Banking (Luxembourg) S.A. 187
百万米ドル USD mm
100.0 100.0
MUFG Securities (Canada),
Limited 58
百万加ドル CAD mm
100.0 100.0
MUFG Securities EMEA plc 1,317 百万英ポンド GBP mm
100.0 100.0
Mitsubishi UFJ Trust International
Limited 40
百万英ポンド GBP mm
100.0 100.0
MUFG Securities Asia
(Singapore) Limited 35
百万シンガポールドル SGD mm
100.0 100.0
MUFG Securities Asia Limited 207 百万米ドル USD mm
100.0 100.0
MUFG Investor Services
Holdings Limited 43
百万ドル USD mm
100.0 100.0
Mitsubishi UFJ Asset
Management (UK) Ltd. 2,000
千英ポンド
GBP thd 100.0 100.0
Mitsubishi UFJ Baillie Gifford
Asset Management Limited 500
千英ポンド
GBP thd 51.0 51.0
MUFG Lux Management
Company S.A. 7,375
千ユーロ
GBP thd 100.0 100.0
*1 資本金又は出資金・議決権所有割合・子会社による間接保有割合は、18年3月末基準
Capital, percentage of voting right held and percentage of voting right indirectly held through subsidiaries are as of end Mar 18

8
主要子会社・関連会社(2) Major subsidiaries / affiliates (2)
名称
Company name
資本金又は
出資金
(百万円)
議決権
所有割合(%)
子会社による
間接保有割合
(%)
Capital
(¥mm)
Percentage
of voting
right held
(%)
Percentage of
voting right
indirectly held
through
subsidiaries (%)
㈱じぶん銀行
Jibun Bank Corporation 50,000 50.0 50.0
㈱中京銀行
The Chukyo Bank, Ltd. 31,844 39.7 39.7
モルガン・スタンレーMUFG証券㈱
Morgan Stanley MUFG Securities Co., Ltd. 62,149 49.0 49.0
㈱ジャックス
JACCS CO., LTD. 16,138 22.2 22.2
㈱ジャルカード
JALCARD, INC. 360 49.3 49.3
三菱UFJリース㈱
Mitsubishi UFJ Lease & Finance Company Limited 33,196 23.3 9.8
日立キャピタル㈱
Hitachi Capital Co., Ltd. 9,983 23.0 0.01
三菱総研DCS㈱
Mitsubishi Research Institute DCS Co., Ltd. 6,059 20.0 -
名称
Company name
資本金又は 出資金
議決権所有
割合(%) 子会社による間接保有割合(%)
Capital Percentage
of voting right held
(%)
Percentage of
voting right
indirectly held
through
subsidiaries (%)
Morgan Stanley 8,540 百万米ドル
USD mm 24.3*2 -
Dah Sing Financial Holdings
Limited 4,248
百万香港ドル
HKD mm 15.1 15.1
Security Bank Corporation 7,635 百万フィリピンペソ
PHP mm 20.0 20.0
Vietnam Joint Stock Commercial
Bank for Industry and Trade 37,234,045
百万ベトナムドン
VND mm 19.7 19.7
PT Bank Danamon Indonesia,
Tbk. 5,901,121*2
百万インドネシアルピア
IDR mm 40.0*2 40.0*2
AMP Capital Holdings Limited 50 百万豪ドル
AUD mm 15.0 15.0
主要な持分法適用関連会社 (18/9末)*1 Major equity-method affiliates (End Sep 18) *1
*1 資本金又は出資金・議決権所有割合・子会社による間接保有割合は、18年3月末基準
Capital, percentage of voting right held and percentage of voting right indirectly held through subsidiaries are as of end Mar 18
*2 18年9月末時点
As of end Sep 18

9
• 日本全国約650拠点の国内拠点網
• 世界50以上の国、約1,200拠点と邦銀随一の海外拠点網。内外で1,800以上のグローバルネットワーク
MUFGの拠点網(18/9末) MUFG’s group network (End Sep 18)
グループネットワーク
Group network
*1 ・複数の支店または支店・支社が同一箇所にある場合は、一拠点としてカウント
A facility that houses 1)several branches for retail client, 2) a branch for retail client and an office for corporate client, is counted as single location
・三菱UFJ銀行、三菱UFJ信託銀行、三菱UFJ証券ホールディングスの合計 Total of the Bank, the Trust Bank and the Securities HD
*2 PurePointフィナンシャルセンター21拠点を含む Including 21 locations of PurePoint
国内拠点*1
307
137 188
中部
Central Japan
(incl. Nagoya)
海外拠点
東日本
Eastern Japan
(incl. Tokyo)
407
米州*2
Americas*2
35
66 702
アユタヤ銀行
KS
アジア、
オセアニア
Asia & Oceania
欧州、中近東、アフリカ
Europe, Middle East
& Africa
西日本
Western Japan
(incl. Osaka)
• Domestic network with about 650 locations in Japan
• Most extensive overseas network among Japanese financial groups with around 1,200 locations. Global locations are over 1,800 in total in more than 50 countries
Domestic network*1 Overseas network

10
順位
Rank
金融機関名
Company name
兆円 ¥tn
#1 JPモルガン・チェース
JPMorgan Chase & Co. 43.11
#2 バンク・オブ・アメリカ
Bank of America 33.45
#3 中国工商銀行 Industrial and Commercial Bank of China
32.88
#4 ウェルズファーゴ
Wells Fargo 28.78
#5 中国建設銀行
China Construction Bank 24.98
#6 中国農業銀行
Agricultural Bank of China 22.21
#7 シティグループ
Citigroup 20.52
#8 HSBC 19.77
#9 中国銀行
Bank of China 17.16
#10 RBC
Royal Bank of Canada 13.14
#16 MUFG 9.80
順位
Rank
金融機関名
Company name
兆円
¥tn
#1 中国工商銀行 Industrial and Commercial Bank of China
243.3
#2 中国建設銀行
China Construction Bank 218.7
#3 中国銀行
Bank of China 186.4
#7 MUFG 107.5
順位 Rank
金融機関名 Company name
兆円 ¥tn
#1 中国工商銀行 Industrial and Commercial Bank of China
348.5
#2 中国建設銀行
China Construction Bank 290.5
#3 中国農業銀行
Agricultural Bank of China 283.5
#6 MUFG 175.6
(18/6末 End Jun 18)
預金残高 Deposit balance
貸出残高 Loan balance
時価総額 Market cap
MUFGのランキング
MUFG’s ranking
(18/6末 End Jun 18)
(18/9末 End Sep 18)
(出所) Bloomberg、各社決算資料より三菱UFJ銀行経済調査室作成
(Source) Compiled by MUFG Bank Economic Research Office based on Bloomberg and company disclosures

11
Moody’s S&P Fitch R&I JCR
長期
LT
短期
ST
長期
LT
短期
ST
長期
LT
短期
ST
長期
LT
短期
ST
長期
LT
短期
ST
三菱UFJフィナンシャル・グループ MUFG A1 P-1 A- - A F1 A+ - AA- -
シニア債 Senior Unsecured A1 - A- - A - - - - -
Tier2劣後債 Tier2 - - - - - - A+ - A+ -
その他Tier1証券 Additional Tier1 - - - - - - - - A- -
三菱UFJ銀行 the Bank A1 P-1 A A-1 A F1 AA- a-1+ AA -
三菱UFJ信託銀行 the Trust Bank A1 P-1 A A-1 A F1 AA- a-1+ AA J-1+
三菱UFJ証券ホールディングス the Securities HD A1 P-1 A- A-2 - - AA- a-1+ AA -
三菱UFJモルガン・スタンレー証券 MUMSS A1 P-1 A A-1 A F1 AA- a-1+ AA -
MUFG Americas Holdings MUAH A2 - A- A-2 A F1 - - - -
MUFGユニオンバンク the Bank(US) A2*1 P-1 A A-1 A F1 - - - -
アユタヤ銀行 Krungsri Baa1 P-2 BBB+ A-2 A- F2 - - - -
三菱UFJニコス NICOS - - - - - - AA- a-1+ AA- J-1+
アコム ACOM - - - - A- F2 BBB - A J-1
バンクダナモン Bank Danamon -*2 P-2 - - BBB F2 - - - -
三菱UFJリース Mitsubishi UFJ Lease & Finance A3 - A- - - - A+ a-1 AA- J-1+
グループ格付一覧
Ratings
(18年11月1日現在 as of Nov 1, 18)
「-」:格付取得せず “-” : no credit ratings
*1 長期預金格付はAa2 Aa2 for LT Bank Deposits
*2 長期預金格付はBaa2 Baa2 for LT Bank Deposits

12
<国内店舗>
Domestic network 銀行
BK
信託
TB
証券
SCHD
合計
Total
店舗数 Total 607 52 62 721
来店型店舗等*1 General branches and
Others*1 518 52 62 632
本・支店・出張所 Head office and branches 508 52 62 622
バーチャル店舗等 Virtual branches and
Others 89 0 0 89
<MUFGプラザ>
MUFG Plaza
MUFGプラザ MUFG Plaza 19
<ATM設置台数>
ATMs
ATM設置台数 Total 96,322
店舗内ATM設置台数 ATMs in branches 4,589
店舗外ATM設置台数 ATMs out of branches 3,616
コンビニエンスストア
ATM設置台数*2
ATMs in convenience
stores*2 88,117
<海外店舗>
Overseas network 銀行
BK
信託
TB
証券
SCHD
合計
Total
店舗数 Total 114 11 8 133
支店 Branches 31 4 - 35
現地法人 Subsidiaries 43 5 7 55
出張所 Sub-branches 32 - - 32
駐在員事務所 Representative offices 8 2 1 11
MUFGユニオンバンク
店舗数*3 MUFG Union Bank *3 - - - 375
アユタヤ銀行店舗数 Krungsri - - - 702
店舗網
Number of outlets
(18/9末 End Sep 18)
*1 複数の支店または支店・支社が同一箇所にある場合は、一拠点としてカウント
A facility that houses 1)several branches for retail client, 2) a branch for retail client and an office for corporate client, is now counted as single location
*2 銀行と信託の単純合算(重複は37,486台) Simple sum of the Bank and the Trust Bank (37,486 ATMs overlapping)
*3 PurePointフィナンシャルセンター21拠点を含む Including 21 locations of PurePoint

13
12.63 12.80 14.36 15.00 13.64 13.64 12.71 13.15
0.02 0.02 0.02 0.02 0.02 0.02 0.02 0.02
40.35 39.86 37.92 36.29 37.99 38.19 39.35 37.24
2.45 2.78 2.46 2.62 2.95 2.89 3.57 4.64
30.32 30.60 31.10 31.93 31.83 31.78 31.28 31.81
14.23 13.94 14.14 14.14 13.57 13.48 13.07 13.14
0%
50%
100%
15/3末 15/9末 16/3末 16/9末 17/3末 17/9末 18/3末 18/9末
政府・地方公共団体
(注)本表は単元株(100株)以上の普通株式のみを対象。但し、自己株式(以下)を除いた数値 (Note) Unit shares (100 shares) only
15/3末:148,872,200株 Excluding 148,872,200 shares of treasury stock as of end Mar 15
15/9末:256,358,800株 Excluding 256,358,800 shares of treasury stock as of end Sep 15
16/3末:378,088,933株 Excluding 378,088,933 shares of treasury stock as of end Mar 16
16/9末:564,369,100株 Excluding 564,369,100 shares of treasury stock as of end Sep 16
17/3末:706,561,900株 Excluding 706,561,900 shares of treasury stock as of end Mar 17
17/9末:706,560,000株 Excluding 706,560,000 shares of treasury stock as of end Sep 17
18/3末:706,588,000株 Excluding 706,588,000 shares of treasury stock as of end Mar 18
18/9末:708,073,500株 Excluding 708,073,500 shares of treasury stock as of end Sep 18
事業法人
金融機関
金融商品取引業者(証券会社)
外国法人等
個人・その他
株主構成
Shareholder structure
Corporations
Financial institutions
Securities companies
Foreign investors
Governments & local authorities
Individuals, etc.
End Mar 15 End Sep 15 End Mar 16 End Sep 16 End Mar 17 End Sep 17 End Mar 18 End Sep 18

14
モルガン・スタンレー
(MS)
モルガン・スタンレー・ ホールディングス(MSJHD)
三菱UFJ証券ホールディングス(SCHD*3)
約24%出資 Approx. 24% investment
60% 40%
MUFG連結子会社
MUFG subsidiary
MS連結子会社
MS subsidiary
<償還型永久優先株式 Perpetual Non-convertible Preferred Stock>
内容 Brief Summary
名称
Name
C種非累積永久優先無議決権株式
Series C Non-Cumulative Non-Voting Perpetual
Preferred Stock
優先株総数*1
Number of Shares*1 519,882 株 shares
総額*1
Total Amount*1 US$ 519.882 百万 mm
配当
Dividends
年間利回り10% 非累積型
支払日:毎年1月15日、4月15日、7月15日、10月15日
10% per annum. Non-cumulative
Dividend payment date; each year 15 Jan, 15 Apr,
15 Jul and 15 Oct
発行日
Issue Date 2008年10月13日 October 13, 2008
期間
Maturity 永久 Perpetual
任意償還
Redemption Terms
発行日より3年経過後以降、額面の110%で
償還する権利を発行体が有する
After three years from issue date, issuer has the
right to redeem the stock at 110% of its face value
優先順位
Priority of
Dividends
配当及び残余財産請求権について、普通株式に
優先し、発行体の他の優先株式と少なくとも同順位
Senior to the common stock and at least equally
with each other preferred stock with respect to the
payment of dividends and the distribution of assets
議決権
Voting Right なし No
<普通株式 Common Stock>
内容 Brief Summary
普通株総数*2
Number of Shares*2 419,367,932 株 shares
総額
Total Amount US$ 8,785 百万 mm
配当
Dividends US$ 0.30/四半期 per quarter
*1 当初償還型優先株総数:1,160,791株、当初総額: 1,160.791百万米ドル
保有株式 Common, Preferred Stock
日本における証券会社の出資関係 Securities Alliance Structure in Japan
モルガン・スタンレーへの出資
Investment to Morgan Stanley
Original number of shares: 1,160,791 shares
Original total amount: US$1,160.791 mm
三菱UFJフィナンシャル・グループ
(MUFG)
(18/9末 End Sep 18)
経済的出資 持分比率 Economic interests
モルガン・スタンレーMUFG証券
(MSMS)
SCHD 議決権比率 voting right: 49% MSJHD 議決権比率 voting right: 51%
三菱UFJモルガン・スタンレー証券
(MUMSS)
SCHD 議決権比率 voting right: 60% MSJHD 議決権比率 voting right: 40%
*2 2011年12月時点普通株総数(優先株の普通株転換後): 432,017,152株、総額: 9,049百米ドル Number of shares on 2011: 432,017,152 shares, Amount: US$9,049 mm
*3 Mitsubishi UFJ Securities Holdings Co., Ltd.

15
2018年度中間決算の概要 Financial Results for Interim FY2018
16
利金・配当(十億円) Coupon, dividend (¥bn)
利回り
Yield
平残(兆円) Avg bal. (¥tn)
17 外国証券 Foreign securities (12.2) (7bp) (0.7)
利金・配当(十億円) Coupon, dividend (¥bn)
利回り
Yield
平残(兆円) Avg bal. (¥tn)
16 国債 JGBs (12.3) (13bp) (0.1)
17 社債 Corporate bonds (0.1) (9bp) 0.4
18 株式 Equities 118.5
17年度上期
FY17H1
18年度上期
FY18H1
前年同期比
YoY
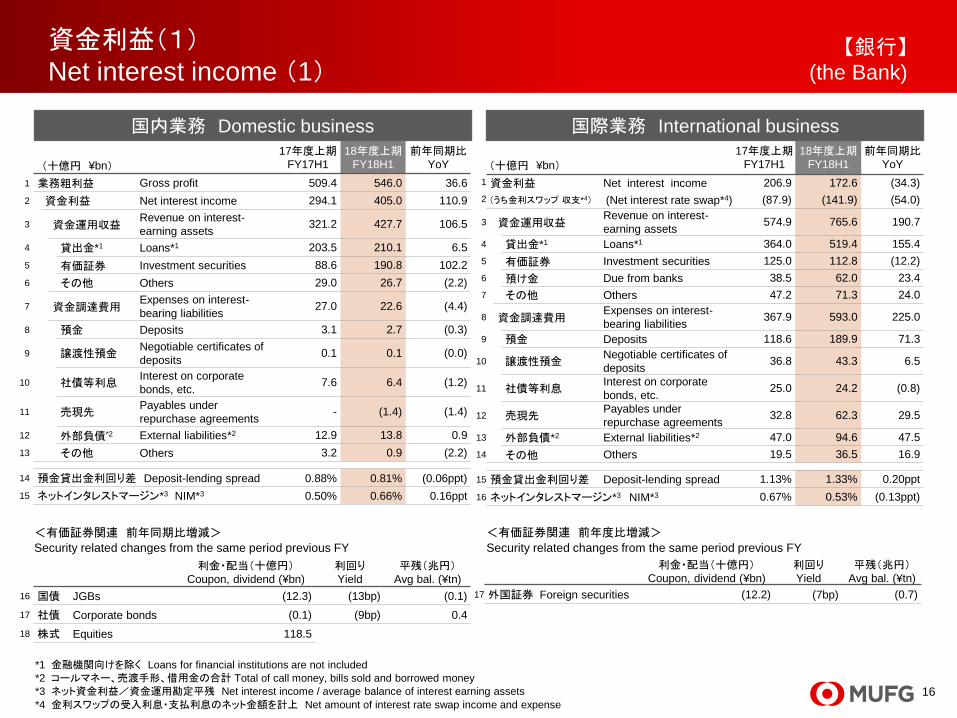
1 業務粗利益 Gross profit 509.4 546.0 36.6
2 資金利益 Net interest income 294.1 405.0 110.9
3 資金運用収益 Revenue on interest-
earning assets 321.2 427.7 106.5
4 貸出金*1 Loans*1 203.5 210.1 6.5
5 有価証券 Investment securities 88.6 190.8 102.2
6 その他 Others 29.0 26.7 (2.2)
7 資金調達費用 Expenses on interest-
bearing liabilities 27.0 22.6 (4.4)
8 預金 Deposits 3.1 2.7 (0.3)
9 譲渡性預金 Negotiable certificates of
deposits 0.1 0.1 (0.0)
10 社債等利息 Interest on corporate
bonds, etc. 7.6 6.4 (1.2)
11 売現先 Payables under
repurchase agreements - (1.4) (1.4)
12 外部負債*2 External liabilities*2 12.9 13.8 0.9
13 その他 Others 3.2 0.9 (2.2)
14 預金貸出金利回り差 Deposit-lending spread 0.88% 0.81% (0.06ppt)
15 ネットインタレストマージン*3 NIM*3 0.50% 0.66% 0.16ppt
17年度上期
FY17H1
18年度上期
FY18H1
前年同期比
YoY
1 資金利益 Net interest income 206.9 172.6 (34.3)
2 (うち金利スワップ 収支*4) (Net interest rate swap*4) (87.9) (141.9) (54.0)
3 資金運用収益 Revenue on interest-
earning assets 574.9 765.6 190.7
4 貸出金*1 Loans*1 364.0 519.4 155.4
5 有価証券 Investment securities 125.0 112.8 (12.2)
6 預け金 Due from banks 38.5 62.0 23.4
7 その他 Others 47.2 71.3 24.0
8 資金調達費用 Expenses on interest-
bearing liabilities 367.9 593.0 225.0
9 預金 Deposits 118.6 189.9 71.3
10 譲渡性預金 Negotiable certificates of
deposits 36.8 43.3 6.5
11 社債等利息 Interest on corporate
bonds, etc. 25.0 24.2 (0.8)
12 売現先 Payables under
repurchase agreements 32.8 62.3 29.5
13 外部負債*2 External liabilities*2 47.0 94.6 47.5
14 その他 Others 19.5 36.5 16.9
15 預金貸出金利回り差 Deposit-lending spread 1.13% 1.33% 0.20ppt
16 ネットインタレストマージン*3 NIM*3 0.67% 0.53% (0.13ppt)
<有価証券関連 前年同期比増減> <有価証券関連 前年度比増減>
資金利益(1) Net interest income (1)
【銀行】 (the Bank)
Security related changes from the same period previous FY Security related changes from the same period previous FY
(十億円 ¥bn) (十億円 ¥bn)
*1 金融機関向けを除く Loans for financial institutions are not included
*2 コールマネー、売渡手形、借用金の合計 Total of call money, bills sold and borrowed money
*3 ネット資金利益/資金運用勘定平残 Net interest income / average balance of interest earning assets
*4 金利スワップの受入利息・支払利息のネット金額を計上 Net amount of interest rate swap income and expense
国内業務 Domestic business 国際業務 International business

17
運用・調達(1) Funding and investment (1)
【銀行】 (the Bank)
平均残高
18年度上期
Average bal.
FY18H1
収入・費用
18年度上期
Income
expense
FY18H1
利回り(%) 18年度上期
Yield (%)
FY18H1 <国内業務部門 Domestic sector>
前年同期比
YoY
前年同期比
YoY
前年同期比
(%ポイント) YoY (% ppt)
1 資金運用勘定 Assets 121,966.2 4,849.0 427.7 106.5 0.699 0.152
2 貸出金 Loans and bills discounted 51,297.8 5,557.6 210.1 6.5 0.816 (0.070)
3 有価証券 Securities 26,547.9 1,941.7 190.8 102.2 1.434 0.715
4 コールローン Call loans 432.8 351.0 0.1 0.0 0.052 0.006
5 債券貸借取引支払保証金 Receivables under securities borrowing transactions 851.6 (3,527.3) 0.0 (0.1) 0.009 (0.000)
6 現金預け金 Cash and due from banks 24,066.0 (103.6) 12.0 (0.0) 0.099 0.000
7 資金調達勘定 Liabilities 144,040.9 8,983.3 22.6 (4.4) 0.031 (0.008)
8 預金 Deposits 123,765.3 7,810.6 2.7 (0.3) 0.004 (0.000)
9 譲渡性預金 Negotiable certificates of deposits 1,067.8 (67.9) 0.1 (0.0) 0.028 (0.000)
10 コールマネー Call money 0.0 0.0 - - 0.000 0.000
11 売現先勘定 Payables under repurchase agreements 2,558.5 2,488.5 (1.4) - (0.114) (0.114)
12 債券貸借取引受入担保金 Payables under securities lending transactions 1,960.1 (1,703.9) 0.0 (0.0) 0.009 0.000
13 借用金 Borrowed money 13,772.4 738.9 13.8 0.9 0.200 0.003
14 ネットインタレストマージン*1 Net interest margin*1 - - - - 0.662 0.161
<国際業務部門 International sector>
15 資金運用勘定 Assets 63,820.3 2,223.5 765.6 190.7 2.392 0.531
16 貸出金 Loans and bills discounted 36,831.4 2,129.1 519.4 155.4 2.813 0.720
17 有価証券 Investment securities 12,984.0 (788.2) 112.8 (12.2) 1.732 (0.078)
18 コールローン Call loans 267.4 (5.9) 2.5 0.8 1.867 0.651
19 現金預け金 Cash and due from banks 7,341.0 427.5 62.0 23.4 1.685 0.573
20 資金調達勘定 Liabilities 64,857.2 2,214.8 593.0 225.0 1.823 0.652
21 預金 Deposits 27,200.9 357.4 189.9 71.3 1.392 0.511
22 譲渡性預金 Negotiable certificates of deposits 4,360.5 (1,041.0) 43.3 6.5 1.983 0.624
23 コールマネー Call money 411.7 23.4 5.2 2.5 2.550 1.148
24 売現先勘定 Payables under repurchase agreements 6,082.7 664.5 62.3 29.5 2.045 0.836
25 借用金 Borrowed money 6,259.9 2,776.7 89.3 45.0 2.846 0.309
26 ネットインタレストマージン*1 Net interest margin*1 - - - - 0.539 (0.130)
*1 ネット資金利益/資金運用勘定平残 Net interest income / average balance of interest earning assets
(十億円 ¥bn)
18
利金・配当(十億円) Coupon, dividend(¥bn)
利回り
Yield
平残(兆円) Avg bal. (¥tn)
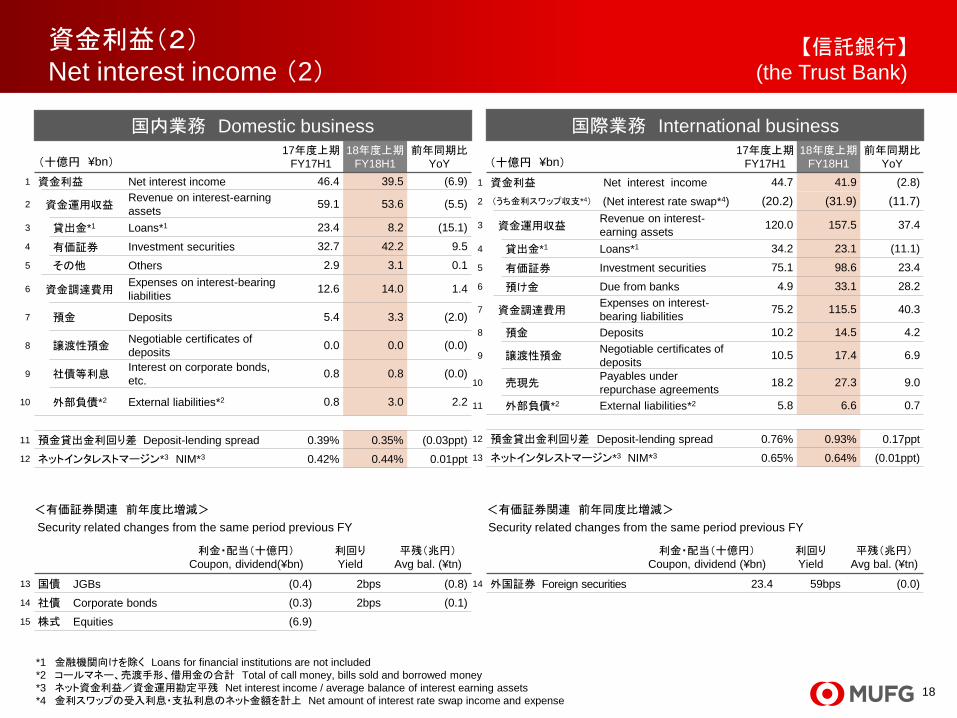
13 国債 JGBs (0.4) 2bps (0.8)
14 社債 Corporate bonds (0.3) 2bps (0.1)
15 株式 Equities (6.9)
17年度上期
FY17H1
18年度上期
FY18H1
前年同期比
YoY
1 資金利益 Net interest income 46.4 39.5 (6.9)
2 資金運用収益 Revenue on interest-earning
assets 59.1 53.6 (5.5)
3 貸出金*1 Loans*1 23.4 8.2 (15.1)
4 有価証券 Investment securities 32.7 42.2 9.5
5 その他 Others 2.9 3.1 0.1
6 資金調達費用 Expenses on interest-bearing
liabilities 12.6 14.0 1.4
7 預金 Deposits 5.4 3.3 (2.0)
8 譲渡性預金 Negotiable certificates of
deposits 0.0 0.0 (0.0)
9 社債等利息 Interest on corporate bonds,
etc. 0.8 0.8 (0.0)
10 外部負債*2 External liabilities*2 0.8 3.0 2.2
11 預金貸出金利回り差 Deposit-lending spread 0.39% 0.35% (0.03ppt)
12 ネットインタレストマージン*3 NIM*3 0.42% 0.44% 0.01ppt
17年度上期
FY17H1
18年度上期
FY18H1
前年同期比
YoY
1 資金利益 Net interest income 44.7 41.9 (2.8)
2 (うち金利スワップ収支*4) (Net interest rate swap*4) (20.2) (31.9) (11.7)
3 資金運用収益 Revenue on interest-
earning assets 120.0 157.5 37.4
4 貸出金*1 Loans*1 34.2 23.1 (11.1)
5 有価証券 Investment securities 75.1 98.6 23.4
6 預け金 Due from banks 4.9 33.1 28.2
7 資金調達費用 Expenses on interest-
bearing liabilities 75.2 115.5 40.3
8 預金 Deposits 10.2 14.5 4.2
9 譲渡性預金 Negotiable certificates of
deposits 10.5 17.4 6.9
10 売現先 Payables under
repurchase agreements 18.2 27.3 9.0
11 外部負債*2 External liabilities*2 5.8 6.6 0.7
12 預金貸出金利回り差 Deposit-lending spread 0.76% 0.93% 0.17ppt
13 ネットインタレストマージン*3 NIM*3 0.65% 0.64% (0.01ppt)
<有価証券関連 前年度比増減>
利金・配当(十億円) Coupon, dividend (¥bn)
利回り
Yield
平残(兆円) Avg bal. (¥tn)
14 外国証券 Foreign securities 23.4 59bps (0.0)
<有価証券関連 前年同度比増減>
資金利益(2) Net interest income (2)
【信託銀行】 (the Trust Bank)
Security related changes from the same period previous FY Security related changes from the same period previous FY
国内業務 Domestic business 国際業務 International business
(十億円 ¥bn) (十億円 ¥bn)
*1 金融機関向けを除く Loans for financial institutions are not included
*2 コールマネー、売渡手形、借用金の合計 Total of call money, bills sold and borrowed money
*3 ネット資金利益/資金運用勘定平残 Net interest income / average balance of interest earning assets
*4 金利スワップの受入利息・支払利息のネット金額を計上 Net amount of interest rate swap income and expense

19
運用・調達(2) Funding and investment (2)
【信託銀行】 (the Trust Bank)
平均残高
18年度上期
Average bal.
FY18H1
収入・費用
18年度上期
Income
expense
FY18H1
利回り(%) 18年上期
Yield (%)
FY18H1 <国内業務部門 Domestic sector>
前年同期比
YoY
前年同期比
YoY
前年同期比
(%ポイント) YoY (% ppt)
1 資金運用勘定 Assets 17,762.5 (3,854.7) 53.6 (5.5) 0.602 0.056
2 貸出金 Loans and bills discounted 4,123.9 (6,025.6) 8.2 (15.1) 0.400 (0.060)
3 有価証券 Securities 4,682.4 (780.3) 42.2 9.5 1.797 0.603
4 コールローン Call loans 0.0 (11.1) - - 0.000 0.000
5 債券貸借取引支払保証金 Receivables under securities borrowing transactions 2.1 1.4 - - 0.000 0.000
6 現金預け金 Cash and due from banks 5,857.2 1,909.0 1.9 0.0 0.066 (0.031)
7 資金調達勘定 Liabilities 22,266.7 (5,445.6) 14.0 1.4 0.126 0.034
8 預金 Deposits 12,357.4 (527.8) 3.3 (2.0) 0.054 (0.029)
9 譲渡性預金 Negotiable certificates of deposits 1,257.4 (1,322.4) 0.0 (0.0) 0.001 (0.002)
10 コールマネー Call money 802.7 (670.3) 0.0 0.3 (0.009) 0.049
11 債券貸借取引受入担保金 Payables under securities lending transactions 66.0 (1,428.7) 0.0 (0.0) 0.009 (0.000)
12 借用金 Borrowed money 971.1 (1,542.9) 3.1 1.8 0.639 0.539
13 ネットインタレストマージン*1 Net interest margin*1 - - - - 0.443 0.014
<国際業務部門 International sector>
14 資金運用勘定 Assets 13,056.9 (519.2) 157.5 37.4 2.406 0.642
15 貸出金 Loans and bills discounted 1,710.6 (2,368.4) 23.1 (11.1) 2.697 1.022
16 有価証券 Securities 8,014.2 (61.3) 98.6 23.4 2.454 0.598
17 コールローン Call loans 36.1 (40.6) 0.2 (0.2) 1.198 (0.123)
18 現金預け金 Cash and due from banks 3,033.9 1,930.3 33.1 28.2 2.180 1.293
19 資金調達勘定 Liabilities 13,085.4 (697.8) 115.5 40.3 1.761 0.672
20 預金 Deposits 1,687.6 (585.2) 14.5 4.2 1.716 0.817
21 譲渡性預金 Negotiable certificates of deposits 1,935.5 (330.1) 17.4 6.9 1.803 0.878
22 コールマネー Call money 62.1 36.7 0.6 0.4 1.938 0.565
23 売現先勘定 Payables under repurchase agreements 4,757.0 (804.5) 27.3 9.0 1.145 0.489
24 借用金 Borrowed money 480.9 (74.0) 6.0 0.3 2.506 0.456
25 ネットインタレストマージン*1 Net interest margin*1 - - - - 0.640 (0.017)
*1 ネット資金利益/資金運用勘定平残 Net interest income/average balance of interest earning assets
(十億円 ¥bn)

20
17年度上期
FY17H1
18年度上期
FY18H1
前年同期比
YoY
1 役務取引等利益 Net fees and
commissions 219.1 210.0 (9.0)
2 為替手数料 Fees on money
transfer 60.6 60.4 (0.1)
3 受入為替手数料 Fees received 77.2 77.1 (0.1)
4 支払為替手数料 Fees paid 16.6 16.6 0.0
5 その他手数料 Other rees and
commissions 158.5 149.5 (8.9)
6 その他受入手数料 Others received 226.6 221.5 (5.1)
7 その他支払手数料等 Others paid 68.1 71.9 3.7
8 特定取引利益 Net trading profits 33.3 10.6 (22.6)
9 商品有価証券利益 Trading securities and
derivatives 0.2 0.4 0.1
10 特定取引有価証券利益
Trading securities and
derivatives for
hedging
(0.5) (0.8) (0.2)
11 特定金融派生商品
利益
Derivatives other than
trading securities 33.4 10.7 (22.6)
12 その他の特定取引利益 Others 0.2 0.3 0.0
13 その他業務利益 Net other business
profits 152.3 45.3 (106.9)
14 外国為替売買益 Net gains (losses) on
foreign exchange 66.3 76.9 10.5
15 債券関係損益
(5勘定尻) Net gains (losses) on
debt securities 74.9 0.9 (74.0)
16 金融派生商品利益 Net gains (losses)
from derivatives 9.9 (33.6) (43.6)
17 債券費・社債費 Expenses on debt
securities (0.1) 0.0 0.1
18 その他 Others 1.2 1.2 0.0
非資金利益
Non-interest Income
【銀行・信託銀行】 (the Bank / the Trust Bank )
17年度上期
FY17H1
18年度上期
FY18H1
前年同期比
YoY
1 信託報酬*1 Trust fees*1 45.7 49.9 4.1
2 合同信託報酬*1 Jointly operated money
trust*1 6.2 7.0 0.7
3 財管信託報酬 Trust business-related
fees 39.5 42.9 3.3
4 年金 Pension trust 20.4 21.0 0.5
5 投信 Investment trust 11.2 13.3 2.1
6 その他 Others 7.8 8.5 0.6
7 役務取引等利益 Net fees and
commissions 53.2 41.4 (11.7)
8 証券代行 Stock transfer agency 16.7 16.5 (0.2)
9 不動産 Real estate 8.9 8.8 (0.1)
10 投資商品販売 Investment product sales 16.1 10.2 (5.8)
11 遺言・相続 Testamentary services 3.7 3.6 (0.1)
12 その他 Others 7.6 2.1 (5.4)
13 特定取引利益 Net trading profits 10.3 (0.7) (11.1)
14 その他業務利益 Net other business
incomes 3.0 (0.5) (3.5)
15 債券関係損益
(5勘定尻) Net gains (losses) on debt
securities 10.5 (1.7) (12.2)
16 金融派生商品利益 Net gains (losses) from
derivatives (7.9) (0.5) 7.3
17 その他 Others 0.4 1.7 1.3
*1 信託勘定償却前 Before trust account charge-offs
銀行 the Bank 信託銀行 the Trust Bank
(十億円 ¥bn) (十億円 ¥bn)

21
MUFG(連結) (Consoli-
dated)
単体合算
Sum of non-
consolidated
連単差*1
Difference*1 証券HD*1
The Securities
HD*1
MUAH*1 KS*1 三菱UFJ
ニコス*1
NICOS*1
アコム*1
ACOM*1
1 粗利益
(信託勘定償却前)
Gross profits
(before credit costs for trust
accounts)
1,882.5 1,015.3 867.2 137.6 295.5 174.6 144.9 118.3
2 資金利益 Net interest income 970.2 659.1 311.1 6.1 167.3 128.3 11.7 82.4
3 信託報酬、
役務取引等取引
Trust fees,
Net fees and commissions 696.7 301.4 395.3 44.0 111.1 35.5 133.3 34.8
4 業務純益*2 Net operating profits*2 568.1 353.3 214.8 20.8 69.3 81.8 14.3 76.3
5 親会社株主に帰属
する当期純利益
Profits attributable to
owners of parent 650.7 494.4 156.3 15.3 50.1 54.5 3.5 39.8
6 与信費用総額*3
(カッコは費用)
Total credit costs*3
(Negative figure means
costs)
117.9 173.4 (55.5) 0.0 (0.6) (16.9) (12.5) (28.5)
連単差(1) Consolidated / Non-consolidated differences (1)
【連結】 (Consolidated)
(十億円 ¥bn)
<18年度上期 FY18H1>
*1 連単差の各社計数は連結調整前概算値、純利益は持分比率勘案前
Figures of subsidiaries are approx. and before consolidation adjustments. The equity holding ratio of MUFG is not reflected in profits attributable to owners of parent
*2 業務純益(一般貸倒引当金繰入前、信託勘定償却前) Net operating profits before credit costs for trust accounts and provision for general allowances for credit costs
*3 償却債権取立益込み Figures included gains on loans written-off

22
18年度上期
FY18H1
MUFGバンク(中国) The Bank (China) 17.1
MUFGバンク(マレーシア) The Bank (Malaysia) 9.4
MUFGバンク(トルコ) The Bank (Turkey) 5.2
MUFGバンク(ヨーロッパ) The Bank (Europe) 4.2
MUFGバンク(メキシコ) The Bank (Mexico) 4.0
MUFGバンク(ブラジル) The Bank (Brazil) 3.9
18年度上期
FY18H1
合計 Total 163.7
モルガン・スタンレー Morgan Stanley 138.6
三菱UFJリース MU Lease& Finance 7.9
証券HD*3 The Securities HD*3 6.0
ヴィエティンバンク VietinBank 2.8
日立キャピタル Hitachi Capital 2.5
大新金融集団 Dah Sing Financial HD 1.1
<その他の連単差の主な内訳>
Other main factors in consolidated / non-consolidated differences
18年度上期
FY18H1
三菱UFJ国際投信 Mitsubishi UFJ Kokusai AM 16.3
三菱UFJ住宅ローン保証 MU Home Loan Credit 13.2
日本マスタートラスト信託銀行 The Master Trust Bank of Japan 11.2
MUFGインベスターサービス MUFG Investor Services 9.4
三菱UFJ不動産販売 MU Real Estate Services 8.9
三菱UFJファクター MU Factors 6.5
<持分法による投資損益内訳*2>
Investment gains / losses from equity method affiliates*2
連単差(2) Consolidated / Non-consolidated differences (2)
【連結】 (Consolidated)
(十億円 ¥bn)
*1 連結調整前概算値 Approx. figures before consolidation adjustments
*2 各社当期純利益の持分相当分に連結調整を加えたもの(各社決算計数とは異なる) Equivalent amount of net income based on equity holding ratio after consolidation adjustments (different from each company’s own accounting figures)
*3 証券HDの持分法適用会社に対する投資損益の合計
The sum of investment gains/losses from equity method affiliates of the Securities HD
信託報酬、役務取引等利益*1
Trust fees, Net fees and commissions*1
資金利益*1
Net interest income*1
(十億円 ¥bn)
(十億円 ¥bn)

23
17年度上期
FY17H1
18年度上期
FY18H1
前年同期比
YoY
1 連結経費 Consolidated
expenses 1,307.3 1,314.4 7.1
2 経費率*1 Expense ratio*1 65.1% 69.8% 4.7ppt
3 三菱UFJ銀行(単体) the Bank
(Non-consol.) 567.9 570.4 2.4
4 経費率*1 Expense ratio*1 62.6% 67.5% 4.9ppt
5 三菱UFJ信託銀行
(単体) the Trust Bank
(Non-consol.) 99.3 91.5 (7.7)
6 経費率*1 Expense ratio*1 48.7% 53.4% 4.6ppt
7 単体合算 Non-consolidated 667.2 661.9 (5.2)
8 経費率*1 Expense ratio*1 60.1% 65.2% 5.0ppt
9 人件費 Personnel
expenses 241.7 230.9 (10.8)
10 物件費 Non-personnel
expenses 390.0 389.0 (0.9)
11 減価償却費・リース Depreciation /
Lease 87.4 82.4 (5.0)
12 証券HD SCHD 115.6 116.7 1.1
13 MUAH 217.2 226.2 8.9
14 KS 84.2 92.7 8.5
15 MUFGバンク(中国) the Bank (China) 17.0 16.2 (0.8)
16 三菱UFJニコス NICOS 126.4 130.6 4.1
17 アコム ACOM 43.5 42.0 (1.5)
営業費、臨時損益・特別損益 General and administrative expenses Non-recurring gains / losses, extraordinary gains / losses
【連結・2行合算】 (Consolidated / Non-consolidated)
営業費
General and administrative expenses
17年度上期
FY17H1
18年度上期
FY18H1 前年同期比
YoY
1 臨時損益(カッコは費用) Net non-recurring gains
(losses) 91.2 230.1 138.9
2 与信関係費用 Credit costs (39.6) 4.9 44.6
3 貸出金償却 Losses on loan write-offs (13.6) (7.8) 5.7
4 個別貸倒引当金
繰入額
Provision for specific allowance
for credit losses - - -
5 その他の与信関係費用 Other credit costs (26.0) 12.8 38.8
6 貸倒引当金戻入益 Reversal of allowance for
Credit losses 90.7 105.1 14.4
7 偶発損失引当金戻入益
(与信関連)
Reversal of reserve for
contingent losses included in
credit costs
- 56.5 56.5
8 償却債権取立益 Gains on loans written-off 13.7 6.7 (6.9)
9 株式等関係損益 Net gains (losses) on equity
securities 50.6 81.3 30.7
10 株式等売却益 Gains on sales of equity
securities 61.7 91.5 29.8
11 株式等売却損 Losses on sales of equity
securities (10.6) (8.5) 2.0
12 株式等償却 Losses on write-down of
equity securities (0.4) (1.6) (1.2)
13 その他の臨時損益 Other non-recurring gains
(losses) (24.1) (24.6) (0.4)
14 退職給付費用 Retirement benefit costs (31.2) (15.5) 15.6
15 特別損益 Net extraordinary gains
(losses) 38.7 22.1 (16.6)
16 固定資産処分損益 Net Gains (losses) on
disposition of fixed assets (2.8) 5.4 8.3
17 減損損失 Losses on impairment of
fixed assets (11.1) (8.2) 2.9
18 関連会社株式交換益 Gains on exchange of
shares of affiliates 52.8 - (52.8)
19 子会社株式売却益 Gains on sales of equity
securities of subsidiaries - 15.4 15.4
*1 経費/業務粗利益(信託勘定償却前) Expenses / Gross profits before credit costs for trust accounts
(十億円 ¥bn) (十億円 ¥bn)
臨時損益・特別損益 (2行合算) Non-recurring gains / Losses, extraordinary gains / Losses (non-consolidated)

24
18/3末
End Mar 18
18/9末
End Sep 18
増減
Change
1 資産 Assets 254,882.2 256,238.6 1,356.3
2 貸出金 Loans 93,727.9 93,991.6 263.6
3 国内貸出 Domestic offices 66,463.9 66,559.8 95.8
4 中小企業等貸出 Loan to SMEs and proprietors 39,950.4 39,015.4 (935.0)
5 消費者ローン残高 Consumer loans 16,265.8 16,022.8 (242.9)
6 住宅ローン残高 Housing loans 15,446.7 15,218.7 (228.0)
7 海外店・オフショア Overseas offices and others 27,263.9 27,431.7 167.7
8 有価証券その他 Investment securities 57,040.6 56,826.2 (214.3)
9 株式 Equity securities 6,062.3 6,299.4 237.0
10 国債 JGBs 23,642.6 21,765.4 (1,877.1)
11 その他 Others 27,335.6 28,761.3 1,425.6
12 負債 Liabilities 242,114.6 243,185.3 1,070.7
13 預金 Deposits 160,799.7 162,578.3 1,778.5
14 国内店預金 Domestic deposits 138,437.2 139,447.2 1,009.9
15 個人預金 Individuals 75,302.5 76,087.0 784.4
16 法人預金その他 Corporations and others 63,134.6 63,360.1 225.5
17 海外店預金等 Overseas offices and others 22,362.5 23,131.1 768.6
(億円)商業銀行 信託銀行 商業銀行 信託銀行 商業銀行 信託銀行資産 1,598,573 1,406,138 192,434 1,597,965 1,396,613 201,351 ▲ 608 ▲ 9,525 8,917貸出金 780,854 681,949 98,904 801,766 703,978 97,788 20,912 22,028 ▲ 1,115国内貸出 679,544 583,584 95,959 680,174 585,325 94,848 630 1,741 ▲ 1,110中小企業等貸出 438,049 389,117 48,931 435,290 388,959 46,331 ▲ 2,758 ▲ 158 ▲ 2,600消費者ローン残高 182,362 171,633 10,729 182,544 171,919 10,624 182 286 ▲ 104住宅ローン残高 170,986 160,518 10,467 172,737 162,332 10,405 1,751 1,813 ▲ 62海外店・オフショア 101,310 98,364 2,945 121,592 118,652 2,940 20,282 20,287 ▲ 5有価証券 475,420 407,057 68,362 402,629 331,910 70,718 ▲ 72,790 ▲ 75,146 2,355株式 88,954 72,659 16,294 68,407 56,602 11,804 ▲ 20,546 ▲ 16,056 ▲ 4,490国債 225,151 197,434 27,717 173,985 143,043 30,942 ▲ 51,166 ▲ 54,390 3,224その他 161,314 136,963 24,350 160,236 132,264 27,971 ▲ 1,077 ▲ 4,698 3,621負債 1,511,480 1,335,919 175,560 1,523,596 1,335,614 187,981 12,116 ▲ 305 12,421預金 1,120,413 1,002,766 117,646 1,140,810 1,018,615 122,195 20,397 15,848 4,548国内店預金 1,016,985 907,612 109,373 1,023,170 910,070 113,100 6,184 2,457 3,727個人預金 608,583 526,617 81,966 625,947 540,933 85,014 17,363 14,315 3,048法人預金その他 408,402 380,995 27,406 397,223 369,137 28,086 ▲ 11,179 ▲ 11,858 679海外店預金等 103,427 95,153 8,273 117,640 108,545 9,094 14,212 13,391 821(注)信託銀行の資産・負債は銀行勘定のみ(信託勘定含まず)<別掲> (億円)預金 1,120,413 1,002,766 117,646 1,140,810 1,018,615 122,195 20,397 15,848 4,548国内業務部門 974,738 867,405 107,333 981,117 869,785 111,332 6,378 2,379 3,998流動性預金 注1 597,742 574,956 22,786 571,301 551,544 19,756 ▲ 26,441 ▲ 23,411 ▲ 3,029定期性預金 注2 369,919 285,801 84,118 394,402 303,660 90,742 24,482 17,859 6,623その他の預金 7,076 6,647 428 15,413 14,579 833 8,337 7,932 405国際業務部門 145,674 135,361 10,313 159,693 148,830 10,862 14,018 13,469 549流動性預金 注1 16,592 16,585 7 17,334 17,324 9 741 739 2定期性預金 注2 82,164 74,244 7,919 96,241 87,210 9,030 14,076 12,966 1,110その他の預金 46,917 44,531 2,386 46,117 44,295 1,822 ▲ 799 ▲ 236 ▲ 563注1 流動性預金=当座預金+普通預金+貯蓄預金+通知預金注2 定期性預金=定期預金+定期積金
07/3末 08/3末 増減
資産・負債
Assets and liabilities
【2行合算】
18 預金 Deposits 160,799.7 162,578.3 1,778.5
19 国内業務部門 Domestic sector 134,001.3 134,855.3 854.0
20 流動性預金*1 Liquid deposits*1 99,189.5 100,605.8 1,416.2
21 定期性預金*2 Time and savings deposits*2 33,675.5 33,327.5 (347.9)
22 その他の預金 Other deposits 1,136.2 921.9 (214.3)
23 国際業務部門 International sector 26,798.4 27,722.9 924.5
24 流動性預金*1 Liquid deposits*1 9,073.8 8,370.2 (703.6)
25 定期性預金*2 Time and savings deposits*2 12,638.0 13,866.2 1,228.1
26 その他の預金 Other deposits 5,086.5 5,486.5 400.0
(Non-consolidated)
(十億円 ¥bn)
*1 流動性預金=当座預金+普通預金+貯蓄預金+通知預金 Liquid deposits = Current deposits + Ordinary deposits + Saving deposits + Deposits at notice
*2 定期性預金=定期預金+定期積金 Time and savings deposit = Time deposits + Installment deposits
<別掲>
Additional note

25
17年度上期
FY17H1
18年度上期
FY18H1
1 実質業務純益 Net operating profits before provision for General allowance for credit losses
337.9 273.4
2 与信関係費用総額(カッコは費用) Total credit costs 58.9 171.4
3 税引前当期純利益 Income before Income taxes 401.5 510.3
4 有税増減額(カッコは無税化) Reconciliation to taxable income (108.4) (375.4)
5 課税所得 Taxable income 293.1 134.9
17年度上期
FY17H1
18年度上期
FY18H1
6 実質業務純益
Net operating profits before credit costs for Trust accounts and provision for general allowance for credit losses
104.3 79.9
7 与信関係費用総額(カッコは費用) Total credit costs 5.8 2.0
8 税引前当期純利益 Income before income taxes 170.7 95.2
9 有税増減額(カッコは無税化) Reconciliation to taxable income (39.6) (69.9)
10 課税所得 Taxable income 131.1 25.3
(注) 銀行、信託銀行ともに与信関係費用には償却債権取立益を含めて記載
(Note) Credit costs include gains on loans written off for both the Bank and the Trust Bank
<信託銀行 the Trust Bank Non-consolidated>
18/3末
End Mar 18
18/9末
End Sep 18
増減
Change
1 繰延税金資産合計 Deferred tax assets 504.5 470.5 (34.0)
2 貸倒引当金 Allowance for credit losses 195.0 160.1 (34.9)
3 有価証券有税償却 Write-down on investment securities 96.1 93.8 (2.2)
4 その他有証評価差額金 Unrealized losses on available-for-
sale securities 5.7 4.8 (0.9)
5 退職給付引当金 Reserve for retirement benefits 96.4 96.0 (0.3)
6 偶発損失引当金 Reserve for contingent losses 45.2 26.7 (18.5)
7 その他 Other 181.3 199.2 17.8
8 評価性引当額 Valuation allowance (115.3) (110.3) 4.9
9 繰延税金負債合計 Deferred tax liabilities 946.6 948.1 1.5
10 その他有証評価差額金 Unrealized gains on available-for-sale
securities 770.3 793.7 23.3
11 繰延ヘッジ損益 Net deferred gains on hedges 31.8 - (31.8)
12 合併時有価証券時価引継 Revaluation gains on securities upon
merger 60.7 60.2 (0.4)
13 退職給付信託設定益 Gains on securities contributed to
employees’ retirement benefits trust 46.9 46.9 -
14 その他 Other 36.5 47.1 10.5
15 繰延税金資産の純額 Net deferred tax assets (442.0) (477.6) (35.5)
18/3末
End Mar 18
18/9末
End Sep 18
増減
Change
16 繰延税金資産合計 Deferred tax assets 55.3 37.3 (18.0)
17 退職給付信託運用益 Gains on securities related to
employees’ retirement benefits trust 28.2 27.5 (0.7)
18 貸倒引当金 Allowance for credit losses 11.4 0.6 (10.7)
19 有価証券有税償却 Write-down on investment securities 8.8 9.0 0.2
20 その他 Other 41.8 37.3 (4.4)
21 評価性引当額 Valuation allowance (35.0) (37.3) (2.2)
22 繰延税金負債合計 Deferred tax liabilities 296.1 297.4 1.2
23 その他有証評価差額金 Unrealized gains on available-for-sale
securities 220.2 211.9 (8.2)
24 退職給付引当金 Reserve for retirement benefits 56.4 65.9 9.4
25 繰延ヘッジ損益 Deferred gains on hedging instruments 6.6 9.4 2.8
26 その他 Other 12.7 10.0 (2.7)
27 繰延税金資産の純額 Net deferred tax assets (240.8) (260.1) (19.3)
<銀行 the Bank Non-consolidated>
<信託銀行 the Trust Bank Non-consolidated>
繰延税金資産
Deferred tax assets
【連結・銀行・信託銀行】
(Consolidated / the Bank / the Trust Bank)
<銀行 the Bank Non-consolidated> (十億円 ¥bn)
(十億円 ¥bn)
繰延税金資産の発生要因別残高 Tax effects of the items comprising net deferred tax assets
実質業務純益と課税所得 Net business profits before credit costs and taxable income
(十億円 ¥bn)
(十億円 ¥bn)
17/3末
End Mar 17 17/9末
End Sep 17 18/3末
End Mar 18 18/9末
End Sep 18
1 繰延税金資産残高 Net deferred
Tax Assets (618.8) (773.5) (778.7) (844.0)
(十億円 ¥bn)
繰延税金資産残高 (連結・純額) Balance of net deferred tax assets (consolidated)

26
退職給付
Retirement benefits
17/3末
End Mar 17
18/3末
End Mar 18 増減
Change
1 退職給付債務残高 Projected benefit obligation 2,331.7 2,383.7 51.9
2 積立型制度 Reserve type 2,281.0 2,329.3 48.2
3 非積立型制度 Non-reserve type 50.6 54.3 3.6
17年度上期
FY17H1
18年度上期
FY18H1 前年同期比
YoY
4 退職給付費用 Net periodic cost of retirement benefits
27.0 8.6 (18.3)
5 勤務費用 Service cost 29.4 30.8 1.4
6 利息費用 Interest cost 15.5 14.8 (0.7)
7 期待運用収益 Expected return on plan assets (51.4) (55.3) (3.8)
8 過去勤務費用の費用処理額 Amortization of unrecognized prior
service cost (2.6) (3.0) (0.4)
9 数理計算上の差異の費用処理額 Amortization of unrecognized net
actuarial loss 31.9 16.8 (15.1)
10 その他 Others 4.2 4.4 0.2
【連結】 (Consolidated)
(十億円 ¥bn)
退職給付債務残高 Benefit obligation
退職給付費用 Net periodic cost
(十億円 ¥bn)

27
主要子会社・関係会社の状況
Overview of Major Subsidiaries / Affiliated Companies

28
17年度上期
FY17H1
18年度上期
FY18H1
前年同期比
YoY
【ご参考*1 】(Reference*1)
18年度上期 FY18H1
1 純営業収益*2 Net Operating revenue*2 175.7 165.5 (10.2) 195.6
2 受入手数料 Commission received 76.5 73.3 (3.1)
3 委託手数料 Equity brokerage 19.5 17.1 (2.3)
4 引受け・売出し手数料 Underwriting
and secondary distribution 11.5 12.5 1.0
5 募集・売出し取扱手数料
Sales of investment trusts 17.0 11.3 (5.7)
6 その他の受入手数料
Other fees received 28.3 32.2 3.9
7 トレーディング損益 Net trading income 79.3 68.9 (10.4)
8 株券等 Stocks 17.0 (1.4) (18.4)
9 債券等・その他 Bonds and other 62.3 70.3 8.0
10 販売費・一般管理費 SG&A expenses 149.1 144.5 (4.6) 170.1
11 取引関係費 Transaction expenses 46.2 40.6 (5.6)
12 営業利益 Operating income 26.5 20.9 (5.5)
13 営業外損益 Non-operating income 8.6 7.8 (0.7)
14 持分法による投資利益
Equity in earnings of affiliates 6.1 6.0 (0.0)
15 経常利益 Ordinary income 35.1 28.8 (6.3) 33.0
16 親会社株主に帰属する純利益
Profits attributable to owners of parent 17.7 15.3 (2.3) 18.5
(十億円 ¥bn)
17年度上期
FY17H1
18年度上期
FY18H1
前年同期比
YoY
1 純営業収益*2
Net operating revenue*2 136.6 132.4 (4.2)
2 販売費・一般管理費
SG&A expenses 120.1 115.5 (4.6)
3 営業利益
Operating income 16.4 16.9 0.4
4 経常利益
Ordinary income 17.1 17.8 0.6
5 親会社株主に帰属する純利益
Profits attributable to owners of parent 11.0 11.5 0.5
(十億円 ¥bn)
順位
Rank
証券会社名
Security firm(s)
金額
Amount
#1 野村證券 Nomura Securities 261.8
#2 MUMSS*3 (MUMSPB含む) + MSMS + カブコム
MUMSS *3 (incl. MUMSPB) + MSMS + kabu.com 187.2*4
#3 SMBC日興証券 SMBC Nikko Securities 166.3
#4 大和証券 Daiwa Securities 151.9
#5 みずほ証券 Mizuho Securities 144.1
(出所)各社資料 (Source) Company disclosure
MUMSS*3の業績 Results of MUMSS*3
(十億円 ¥bn)
国内証券会社の18年度上期純営業収益 Net operating revenue of domestic securities firms (FY18H1)
三菱UFJ証券ホールディングス
Mitsubishi UFJ Securities Holdings
*1 16年度下期から連結除外となったMUFGセキュリティーズアメリカとの単純合算ベース Figures represent the simple aggregation with MUFG Securities Americas’ result
*2 営業収益から金融費用を控除 Operating revenue minus financial expenses
*3 三菱UFJモルガン・スタンレー証券(MUMSS)と三菱UFJモルガン・スタンレーPB証券(MUMSPB)との連結
Mitsubishi UFJ Morgan Stanley Securities Co., Ltd. (MUMSS) with Mitsubishi UFJ Morgan Stanley PB Securities Co., Ltd. (MUMSPB) consolidated
*4 MUMSS、モルガン・スタンレーMUFG証券(MSMS)、カブドットコム証券(カブコム)の単純合算。MSMSは日本におけるモルガン・スタンレーとの証券ジョイントベンチャーの
一つで、証券HDの持分法適用関連会社 Simple total of MUMSS, Morgan Stanley MUFG Securities Co., Ltd. (MSMS) and kabu.com Securities Co., Ltd. (kabu.com) MSMS is one of the securities joint ventures between MUFG and Morgan Stanley in Japan and is an associated company of the Securities HD accounted for by
using the equity-method
証券HDの業績 Results of SCHD

29
(十億円 ¥bn)
17年度1Q
FY17Q1
17年度2Q
FY17Q2
17年度3Q
FY17Q3
17年度4Q
FY17Q4
18年度1Q
FY18Q1
18年度2Q
FY18Q2
17年度上期 FY17H1
17年度下期 FY17H2
18年度上期 FY18H1
1 国内営業部門預り資産 Domestic customer assets 29,985.1 30,621.0 32,227.3 31,449.5 31,979.1 32,780.2 30,621.0 31,449.5 32,780.2
2 株式 Equities 15,218.9 15,569.0 16,927.4 16,204.2 16,372.6 16,981.8 15,569.0 16,204.2 16,981.8
3 債券 Bonds 10,440.4 10,745.7 10,720.4 10,843.3 11,182.2 11,442.2 10,745.7 10,843.3 11,442.2
4 投信 Investment trusts 4,165.9 4,122.5 4,392.9 4,209.8 4,244.8 4,177.1 4,122.5 4,209.8 4,177.1
≪参考 Reference≫(十億円 ¥bn)
5 証券仲介業内訳 Securities intermediary business 3,258.8 3,383.3 3,323.8 3,226.3 3,249.0 3,270.5 3,383.3 3,226.3 3,270.5
(千口座 thd)
6 有残口座数 Number of accounts with account balance 1,310 1,303 1,291 1,288 1,290 1,282 1,303 1,288 1,282
≪参考 Reference≫(千口座 thd)
7 証券仲介業内訳 Securities intermediary business 326 331 327 328 326 324 331 328 324
(千口座 thd)
8 新規開設口座数 Number of newly opened accounts 13 17 14 12 20 13 30 26 33
9 証券プロパー Securities proper 7 8 11 9 17 10 15 19 27
10 証券仲介 Securities intermediary 5 9 4 3 3 3 14 6 6
(十億円 ¥bn)*1
11 株式投信販売額推移 Equity investment trust sales 358.3 371.4 490.3 479.9 331.6 270.7 729.7 970.1 602.3
12 証券プロパー Securities proper 273.6 289.9 389.3 370.0 290.1 230.9 563.5 759.3 521.0
13 証券仲介 Securities intermediary 84.7 81.5 100.9 109.9 41.4 39.8 166.2 210.9 81.3
(十億円 ¥bn)
14 個人向け国債販売額推移 Sales of JGBs for individual investors 54.6 48.4 27.7 46.0 58.3 68.6 103.0 73.7 126.9
15 証券プロパー Securities proper 48.5 41.9 22.5 37.9 54.4 64.1 90.4 60.4 118.5
16 証券仲介 Securities intermediary 6.1 6.5 5.2 8.1 3.9 4.5 12.6 13.3 8.3
(十億円 ¥bn)
17 リテール外債販売額推移 Foreign retail bond sales 341.5 405.3 604.9 492.7 257.6 313.1 746.8 1,097.5 570.7
18 公募債 Publicly-offered 41.7 27.8 20.4 0.0 23.1 28.0 69.5 20.4 51.2
19 仕組債 Structured 259.2 337.0 561.4 453.3 189.5 246.7 596.2 1,014.7 436.1
20 既発債 Secondary 40.7 40.4 23.0 39.4 45.0 38.4 81.1 62.4 83.4
≪参考 Reference≫(十億円 ¥bn)
21 証券仲介業内訳 Securities intermediary business 190.9 212.9 397.8 269.2 95.4 139.3 403.8 666.9 234.7
三菱UFJモルガン・スタンレー証券(1) Mitsubishi UFJ Morgan Stanley Securities (1)
(注)残高等は各期末の数値 (Note) Balances, etc. at period-end
*1 株式投信販売額は国内営業部門 Domestic sales
営業実績 Business results
30
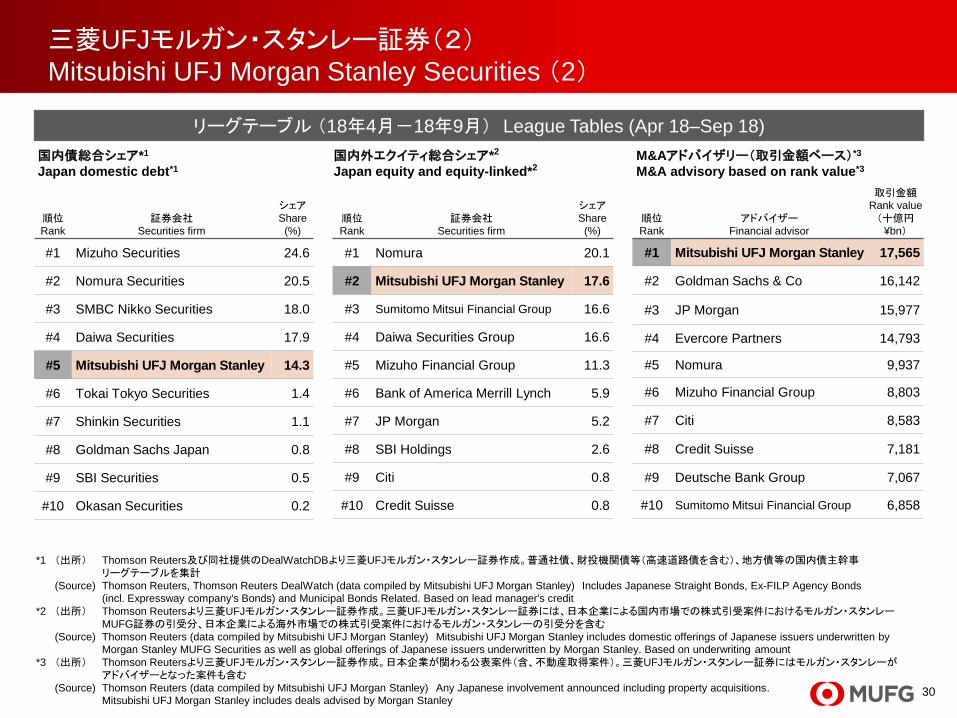
M&Aアドバイザリー(取引金額ベース)*3
M&A advisory based on rank value*3
順位
Rank
アドバイザー
Financial advisor
取引金額
Rank value
(十億円
¥bn)
#1 Mitsubishi UFJ Morgan Stanley 17,565
#2 Goldman Sachs & Co 16,142
#3 JP Morgan 15,977
#4 Evercore Partners 14,793
#5 Nomura 9,937
#6 Mizuho Financial Group 8,803
#7 Citi 8,583
#8 Credit Suisse 7,181
#9 Deutsche Bank Group 7,067
#10 Sumitomo Mitsui Financial Group 6,858
国内債総合シェア*1
Japan domestic debt*1
順位
Rank
証券会社
Securities firm
シェア
Share
(%)
#1 Mizuho Securities 24.6
#2 Nomura Securities 20.5
#3 SMBC Nikko Securities 18.0
#4 Daiwa Securities 17.9
#5 Mitsubishi UFJ Morgan Stanley 14.3
#6 Tokai Tokyo Securities 1.4
#7 Shinkin Securities 1.1
#8 Goldman Sachs Japan 0.8
#9 SBI Securities 0.5
#10 Okasan Securities 0.2
国内外エクイティ総合シェア*2
Japan equity and equity-linked*2
順位
Rank
証券会社
Securities firm
シェア
Share
(%)
#1 Nomura 20.1
#2 Mitsubishi UFJ Morgan Stanley 17.6
#3 Sumitomo Mitsui Financial Group 16.6
#4 Daiwa Securities Group 16.6
#5 Mizuho Financial Group 11.3
#6 Bank of America Merrill Lynch 5.9
#7 JP Morgan 5.2
#8 SBI Holdings 2.6
#9 Citi 0.8
#10 Credit Suisse 0.8
三菱UFJモルガン・スタンレー証券(2) Mitsubishi UFJ Morgan Stanley Securities (2)
リーグテーブル (18年4月-18年9月) League Tables (Apr 18–Sep 18)
*1 (出所) Thomson Reuters及び同社提供のDealWatchDBより三菱UFJモルガン・スタンレー証券作成。普通社債、財投機関債等(高速道路債を含む)、地方債等の国内債主幹事
リーグテーブルを集計
(Source) Thomson Reuters, Thomson Reuters DealWatch (data compiled by Mitsubishi UFJ Morgan Stanley) Includes Japanese Straight Bonds, Ex-FILP Agency Bonds
(incl. Expressway company's Bonds) and Municipal Bonds Related. Based on lead manager's credit
*2 (出所) Thomson Reutersより三菱UFJモルガン・スタンレー証券作成。三菱UFJモルガン・スタンレー証券には、日本企業による国内市場での株式引受案件におけるモルガン・スタンレー
MUFG証券の引受分、日本企業による海外市場での株式引受案件におけるモルガン・スタンレーの引受分を含む
(Source) Thomson Reuters (data compiled by Mitsubishi UFJ Morgan Stanley) Mitsubishi UFJ Morgan Stanley includes domestic offerings of Japanese issuers underwritten by
Morgan Stanley MUFG Securities as well as global offerings of Japanese issuers underwritten by Morgan Stanley. Based on underwriting amount
*3 (出所) Thomson Reutersより三菱UFJモルガン・スタンレー証券作成。日本企業が関わる公表案件(含、不動産取得案件)。三菱UFJモルガン・スタンレー証券にはモルガン・スタンレーが
アドバイザーとなった案件も含む
(Source) Thomson Reuters (data compiled by Mitsubishi UFJ Morgan Stanley) Any Japanese involvement announced including property acquisitions.
Mitsubishi UFJ Morgan Stanley includes deals advised by Morgan Stanley

31
17年度上期
FY17H1
18年度上期
FY18H1
前年同期比
YoY
1 純営業収益 Net operating revenue 19.9 15.9 (4.0)
2 販管費 G&A expenses 13.3 11.8 (1.5)
3 銀行への 仲介手数料
Referral fee to the Bank 4.5 3.4 (1.0)
4 営業利益 Operating income 6.6 4.1 (2.4)
5 経常利益 Ordinary income 6.6 4.1 (2.4)
6 親会社株主に 帰属する純利益
Profits attributable to
owners of parent 4.5 2.8 (1.6)
三菱UFJモルガン・スタンレーPB証券 Mitsubishi UFJ Morgan Stanley PB Securities
三菱UFJ国際投信 Mitsubishi UFJ Kokusai Asset Management
(十億円 ¥bn)
*1 ETF除き excluding ETF
17年度上期
FY17H1
18年度上期
FY18H1
前年同期比
YoY
1 営業収益 Operating revenue 39.5 37.4 (2.0)
2 営業費用 Operating expenses 31.4 30.2 (1.1)
3 営業利益 Operating income 8.1 7.2 (0.9)
4 純利益 Net income 5.8 5.2 (0.5)
順位
Rank
投信会社名
Company Name
18/9末
End Sep 18
18/3末比
Change from End Mar 18
#1 野村アセットマネジメント
Nomura AM 14.3% (0.7ppt)
#2 大和証券投資信託委託
Daiwa AM 11.7% (0.3ppt)
#3 アセットマネジメントOne
Asset Management One 10.5% 0.3ppt
#4 三菱UFJ国際投信
Mitsubishi UFJ Kokusai AM 9.4% (0.2ppt)
#5 日興アセットマネジメント
Nikko AM 7.7% 0.1ppt
17/3末
End Mar 17 17/9末
End Sep 17 18/3末
End Mar 18 18/9末
End Sep 18
1 預り資産(プロパー事業分) Own business AuM
1,208.3 1,246.6 1,246.2 1,255.0
2 預り資産(銀行提携分) The Bank referral AuM
1,882.6 2,035.9 2,041.1 2,143.4
3 口座数
Number of Accounts 33,164 33,930 35,028 35,219
(十億円・件数 ¥bn/#)
三菱UFJモルガン・スタンレーPB証券
Mitsubishi UFJ Morgan Stanley PB Securities
三菱UFJ国際投信
Mitsubishi UFJ Kokusai AM
(十億円 ¥bn)
公募株式投信運用残高シェア*1
Market share of publicly-offered equity ITM balance *1
預り資産および口座数 Customer assets and number of accounts

32
17年度
上期
FY17H1
18年度
上期
FY18H1
前年
同期比
YoY
1
クレジットカード収益 Credit card revenue 108.8 111.9 3.0
2 カードショッピング Card shopping 97.4 101.4 3.9
3 カードキャッシング Card cashing 11.4 10.5 (0.9)
4 ファイナンス収益 Loan revenue 2.3 1.9 (0.3)
5 信用保証収益 Guarantee revenue 5.0 5.6 0.6
6 その他の収益 Other revenue 24.1 26.4 2.3
7 金融収益 Finance revenue 0.7 0.7 0.0
8 営業収益 計 Total operating revenue 141.1 146.7 5.6
9
人件費 Personnel cost 18.6 18.5 (0.0)
10 一般経費 General expenses 107.8 112.0 4.2
11 利息返還費用 Provision for loss on
interest repayment 0.0 0.0 0.0
12 貸倒関連費用 Credit related costs 11.4 12.7 1.2
13 販管費 計 Total G&A expenses 137.9 143.4 5.4
14 金融費用 Financial expenses 1.8 1.5 (0.2)
15 営業費用 計 Total operating expenses 139.7 144.9 5.2
16 営業利益 Operating income 1.4 1.8 0.3
17 営業外損益 Non-operating gains
(losses) 0.0 0.0 0.0
18 経常利益 Ordinary income 1.3 1.8 0.4
19 特別損益 Extraordinary gains (losses) (2.3) 1.1 3.5
20 法人税等 Corporate rax (23.9) (0.5) 23.4
21 親会社株主に
帰属する純利益
Profits attributable to
owners of parent 22.9 3.5 (19.4)
18/3末
End
Mar 18
18/9末
End
Sep 18
増減Change
1 現預金 Cash and deposits 129.0 47.1 (81.8)
2 会員未収金 Accounts receivable from
cardholders 997.0 1,009.7 12.6
3 営業貸付金 Commercial loans 233.1 221.3 (11.7)
4 信用保証債務見返 Guarantee contracts
receivable 594.6 618.2 23.6
5 貸倒引当金
(固定化含) Allowance for doubtful
accounts (Including Fixed) (58.9) (59.0) 0.0
6 有形固定資産 Tangible fixed assets 30.7 28.3 (2.4)
7 その他資産 Other assets 460.0 524.9 64.9
8 資産合計 Total assets 2,385.6 2,390.8 5.1
9 加盟店未払金・ 支払手形
Notes and accounts payable
to affiliated stores 378.6 361.9 (16.7)
10 信用保証債務 Credit guarantee obligation
advances 594.6 618.2 23.6
11 有利子負債*1 Interest-bearing debt *1 846.4 860.9 14.5
12 利息返還
損失引当金
Allowance for losses from
interest repayments 23.6 17.6 (6.0)
13 その他負債 Other liabilities 364.3 349.7 (14.6)
14 負債合計 Total liabilities 2,207.7 2,208.5 0.8
15 純資産合計 Total net assets 177.8 182.2 4.3
16 負債・純資産合計 Total liabilities and net assets 2,385.6 2,390.8 5.1
三菱UFJニコス(1) Mitsubishi UFJ NICOS (1)
(十億円 ¥bn) (十億円 ¥bn)
連結貸借対照表 Consolidated balance sheet 連結損益計算書 Consolidated income statement
*1 有利子負債=長短借入金+社債+コマーシャル・ペーパー+リース債務
Interest-bearing debt = Short- and Long-term debt + Bonds payable + Commercial papers + Lease obligations

33
取扱高 Volume
*1 カードキャッシング残高 + ローンカード残高 (管理会計基準) Card cashing + Card loan (managerial accounting basis)
*2 対営業貸付金および会員未収金 For accounts receivable from cardholders and commercial loans
三菱UFJニコス(2) Mitsubishi UFJ NICOS (2)
(十億円) (¥bn) (兆円 ¥tn) 15年度
FY15 16年度
FY16 17年度
FY17 18年度上期
FY18H1
1 イシュイング Issuing 5.3 5.4 5.7 2.9
2 アクワイアリング Acquiring 7.0 7.3 8.1 4.3
3 プロセッシング Processing 2.0 2.3 2.7 1.4
(十億円 ¥bn) 17/3末
End Mar 17 17/9末
End Sep 17
18/3末
End Mar 18 18/9末
End Sep 18
4 SPリボ分割 Revolving credit 332.1 342.5 351.0 354.3
5 ファイナンス残高 Loans 169.4 160.9 152.5 144.6
6 合計 Total 501.5 503.4 503.4 498.9
利息返還金(目的使用額) Interest repayment
(十億円 ¥bn) 17/3末
End Mar 17
17/9末
End Sep 17
18/3末
End Mar 18
18/9末
End Sep 18
7 利息返還金(目的使用額) Interest repayment 8.6 8.5 7.1 6.0
リスク管理債権*2 Risk-monitored loans*2
(十億円 ¥bn) 17/3末
End Mar 17
17/9末
End Sep 17
18/3末
End Mar 18
18/9末
End Sep 18
8 破綻先債権 Loans to bankrupt borrowers 2.3 2.4 2.5 2.6
9 延滞債権 Non-accrual delinquent loans 71.9 71.7 77.8 80.2
10 貸出条件緩和債権 Restructured loans 47.2 44.3 39.9 37.0
11 合計 Total 121.5 118.5 120.3 120.0
SPリボ分割・ファイナンス*1 残高 Balance of loans*1 and revolving credit

34
アコム(1) ACOM (1)
営業収益推移 Operating revenue
(十億円 ¥bn) 15年度
FY15 16年度
FY16 17年度
FY17 18年度上期
FY18H1
1 ローン事業・クレジットカード事業 Loan and credit card business 133.1 135.9 139.8 72.2
2 信用保証事業 Guarantee business 48.8 56.4 65.1 34.3
3 海外金融事業 Overseas financial business 48.2 45.6 51.8 27.8
4 その他 Other 7.5 7.2 6.7 3.0
5 合計 Total 237.6 245.1 263.4 137.3
信用保証残高 Guaranteed receivables
(十億円 ¥bn) 17/3末
End Mar 17 17/9末
End Sep 17 18/3末
End Mar 18 18/9末
End Sep 18
6 信用保証残高 Guaranteed receivables 1,129.7 1,183.8 1,199.6 1,207.3
消費者向け無担保ローン残高 (単体) Unsecured consumer loans (Non-consolidated)
(十億円 ¥bn) 17/3末
End Mar 17
17/9末
End Sep 17
18/3末
End Mar 18
18/9末
End Sep 18
7 消費者向け無担保ローン残高 Unsecured consumer loans 777.5 788.6 797.2 808.0
新規顧客数(単体) New loan customers (Non-consolidated)
(千人 # thd) 17/3末
End Mar 17
17/9末
End Sep 17
18/3末
End Mar 18
18/9末
End Sep 18
8 新規顧客数 New loan customers 116.4 120.1 121.9 125.1

35
アコム(2) ACOM (2)
(十億円 ¥bn) 17/3末
End Mar 17
17/9末
End Sep 17
18/3末
End Mar 18
18/9末
End Sep 18
1 利息返還金 Interest repayment 28.6 28.3 24.7 19.2
(十億円 ¥bn) 17/3末
End Mar 17
17/9末
End Sep 17
18/3末
End Mar 18
18/9末
End Sep 18
2 不良債権残高 Balance of NPLs 56.0 56.8 56.9 58.1
3 対貸出残高比 NPLs / Total loans 7.13% 7.14% 7.08% 7.14%
金利別残高構成*2 ・総量規制該当率*3 (単体) Loans by interest*2 / Corresponding ratio*3 (Non-consolidated)
(十億円 ¥bn) 17/3末
End Mar 17
17/9末
End Sep 17
18/3末
End Mar 18
18/9末
End Sep 18
4 貸出金利18%超 Over 18% 12.5 10.9 9.2 8.3
5 貸出金利18%以下 18% or less 765.0 777.7 788.1 799.8
6 総量規制該当率 Corresponding ratio 18.8% 18.4% 17.9% 17.8%
*1 キャッシュアウトベース Cash out basis
*2 消費者向け無担保ローン残高における金利別構成 Unsecured loans for customers
*3 件数ベース Ratio of customers in breach of the total volume regulation. Population = all customer accounts
『利息返還金(キャシュアウト)』から拾う
残高: ACOM databookより
該当率: ヒアリング要
利息返還金*1 (単体) Interest repayment*1 (Non-consolidated)
開示不良債権(単体) Non-performing loans (Non-consolidated)

36
17/12末
End
Dec 17
18/6末
End
Jun 18
増減
Change
1 資産の部合計 Total assets 154,550 160,373 5,823
2 貸出金 Loans held for
investment 80,014 82,236 2,222
3 貸倒引当金 Allowance for loan
losses (476) (445) 31
4 有価証券 Securities 27,448 27,014 (434)
5 負債の部合計 Total liabilities 136,195 141,826 5,631
6 預金 Total deposits 84,787 85,516 729
7 長期借入・社債 Long-term debt 12,162 14,192 2,030
8 純資産の部合計 Total equity 18,355 18,547 192
9 不良債権比率 NPL ratio 0.58% 0.49% (0.09ppt)
10 引当率(対不良債権) Allowance /
Nonaccrual loans 102.37% 110.23% 7.86ppt
17年度上期
FY17H1
18年度上期
FY18H1
前年同期比
YoY
1 金利収益 Net interest income 1,589 1,650 61
2 金利収入 Total interest income 2,010 2,420 410
3 金利費用 Total interest expense 421 770 349
4 非金利収益 Noninterest income 977 978 1
5 預金手数料 Service charges on
deposit accounts 95 90 (5)
6 信託・資産
運用手数料
Trust and investment
management fees 59 59 0
7 トレーディング Trading account activities (7) (8) (1)
8 有価証券売却損益 Securities gains, net 9 3 (6)
9 クレジットファシリティ Credit facility fees 49 46 (3)
10 証券業務 Brokerage commissions
and fees 36 37 1
11 カード関連 Card processing fees, net 24 25 1
12 投資銀行収益等 Investment banking and
syndication fees 182 177 (5)
13 コミッション*1 Fees from affiliates*1 430 575 145
14 粗利益 Total revenue 2,566 2,628 62
15 営業費 Noninterest expense 1,963 2,167 204
16 人件費*2 Salaries and employee
benefits*2 1,260 1,348 88
17 営業利益 Pre-tax, pre-provision
income 603 461 (142)
18 与信費用 Provision for credit losses (52) (21) 31
19 純利益 Net income Including con
controlling Interests 509 496 (13)
20 親会社株主に帰属
する純利益
Net Income attributable to
MUAH 524 510 (14)
21 純金利収益率 Net interest margin 2.36% 2.30% (0.06ppt)
米州MUFGホールディングス(MUAH) (18年度上期/米国会計基準) MUFG Americas Holdings Corporation (MUAH) (FY18H1 / US GAAP)
(百万米ドル $mm) (百万米ドル $mm)
<連結P/L Consolidated P/L> <連結B/S Consolidated B/S>
*1 18年度上期は一過性の再生可能エネルギー投資の会計処理影響(▲164百万ドル)を含む
Figures for FY18H1 include the losses on certain renewable energy investments of
$164 mm as a result of Tax Cuts and Jobs Act of 2017
*2 米州業務統合に基づくコミッションの受け入れ
Represents income resulting from the business integration of MUFG Bank & MUFG
Union Bank
*3 銀行の米国支店業務にサービス提供する従業員の人件費を含む
Includes expense associated with employees providing support services to MUFG
Bank

37
17/12末
End
Dec 17
18/6末
End
Jun 18
増減
Change
1 総資産合計 Total assets 2,088,772 2,100,941 12,169
2 貸出金 Loans to customers 1,619,358 1,719,576 100,218
3 貸倒引当金 Allowance for doubtful
accounts (54,173) (58,658) (4,485)
4 有価証券 Investments, net 83,934 109,033 25,099
5 負債の部合計 Total liabilities 1,862,785 1,866,378 3,593
6 預金 Deposits 1,319,229 1,367,531 48,302
7 社債及び借入金 Debt issued and
borrowings 142,866 165,329 22,463
8 純資産合計 Total shareholders’
equity 225,987 234,563 8,576
9 不良債権比率 NPL ratio 2.05% 2.02% (0.03ppt)
10 引当率(対不良債権) Coverage ratio 148.4% 161.7% 13.3ppt
クルンシィ(アユタヤ銀行)(18年度上期/タイ会計基準) Krungsri (KS) (FY18H1 / Thai Accounting Standards)
17年度上期
FY17H1
18年度上期
FY18H1
前年同期比
YoY
1 金利収益 Net interest income 33,421 36,510 3,089
2 金利収入 Interest income 46,186 51,890 5,704
3 金利費用 Interest expense 12,765 15,380 2,615
4 役務取引等収益 Net fees and service
income 9,307 10,506 1,199
5 役務収入 Fees and service income 12,552 14,251 1,699
6 役務費用 Fees and service expense 3,245 3,745 500
7 非金利・非役務等
収益
Non interest and non fees
income 5,791 6,787 996
8 営業費用 Other operating expenses 23,287 24,977 1,690
9 人件費 Employee’s expenses 12,054 12,995 941
10 営業利益 Pre-provision operating
profit 25,232 28,826 3,594
11 与信費用 Impairment loss of loan
and debt securities 10,682 13,087 2,405
12 純利益 Net profit 11,686 12,672 986
13 親会社株主に
帰属する純利益
Net profit attributable to
owners of the bank 11,516 12,488 972
14 純金利収益率 Net interest margin 3.82% 3.75% (0.07ppt)
(百万タイバーツ THB mm)
<連結P/L Consolidated P/L>
(百万タイバーツ THB mm)
<連結B/S Consolidated B/S>

38
バンクダナモン(18年度上期/インドネシア会計基準) Bank Danamon (FY18H1 / Indonesian Accounting Standards)
17年度上期
FY17H1
18年度上期
FY18H1
前年同期比
YoY
1 金利収益 Net interest income 7,154 7,300 145
2 金利収入 Interest income 10,014 10,050 35
3 金利費用 Interest expense 2,860 2,749 (110)
4 保険収益 Net underwriting income 320 374 54
5 非金利収益 Operating income other than
interest 1,890 1,883 (6)
6 非金利費用 Operating expenses other
than interest 6,473 6,718 244
7 人件費 Salaries and employee
benefits 2,432 2,525 93
8 与信費用 Cost of credit 1,691 1,686 (5)
9 営業利益 Operating profit 2,891 2,840 (51)
10 その他損益 Non operating profit 28 13 (14)
11 税前利益 Profit before income tax
payment 2,919 2,853 (65)
12 親会社株主に
帰属する純利益
Profit attributable to equity
holders of the parent entity 2,039 2,011 (28)
13 純金利収益率 Net interest margin 9.3% 9.2% (0.1ppt)
17/12末
End
Dec 17
18/6末
End
Jun 18
増減
Change
1 総資産合計 Total assets 178,257 182,415 4,158
2 貸出金 Loans & trade finance 129,724 133,902 4,178
3 貸倒引当金 Allowance for doubtful
accounts 4,312 4,680 367
4 有価証券 Government bonds 10,911 11,821 910
5 負債の部合計 Total liabilities 139,084 142,737 3,652
6 預金 Deposits 104,645 105,382 737
7 社債及び借入金 Borrowings and long
term funding 21,057 20,153 (904)
8 純資産合計 Total shareholders’
equity 38,660 39,155 495
9 不良債権比率 NPL ratio 2.8% 3.2% 0.4ppt
10 引当率(対不良債権) Loan loss coverage
ratio 119.2% 124.1% 4.9ppt
(十億インドネシアルピア IDR bn)
<連結P/L Consolidated P/L>
(十億インドネシアルピア IDR bn)
<連結B/S Consolidated B/S>

39
<P/L>
17年度上期FY17H1
18年度上期
FY18H1 前年同期比
YoY
1 金利収益 Net interest income 9,299 10,026 726
2 資金収入 Interest income 13,771 15,587 1,816
3 資金費用 Interest expense 4,471 5,561 1,089
4 非金利収益 Non-interest income 2,875 2,255 (620)
5 粗利益 Total operating income 12,174 12,281 106
6 営業費用 Total operating expenses
6,164 6,798 633
7 与信費用 Provision for credit losses
242 89 (152)
8 税引前利益 Income before income tax
6,009 5,483 (526)
9 親会社株主に
帰属する純利益
Net profit attribute to owners of the bank
5,243 4,292 (951)
10 純金利収益率 Net interest margin 3.17% 3.21% 0.04ppt
11 ROE 10.53% 8.07% (2.46ppt)
<B/S> 17/12末
End
Dec17
18/6末
End
Jun 18
増減
Change
12 貸出金 Loans and receivables 370,189 382,740 12,551
13 預金 Deposit liabilities 413,103 442,815 29,711
14 純資産 Total equity 105,078 107,316 2,237
15 総資産 Total asset 694,026 722,374 28,348
16 不良債権比率 NPL ratio 0.02% 0.32% 0.30ppt
17 引当率(対不良債権) NPL coverage ratio 239.37% 261.12% 21.75ppt
Security Bank (18年度上期/フィリピン会計基準) (FY18H1 / Philippine Accounting Standards)
VietinBank(18年度上期/ベトナム会計基準) (FY18H1 / Vietnamese Accounting Standards)
<P/L>
17年度上期FY17H1
18年度上期 FY18H1
前年同期比
YoY
1 金利収益 Net interest and similar income
13,484 14,440 955
2 資金収入 Interest and similar income 31,554 36,124 4,569
3 資金費用 Interest and similar expenses
18,069 21,683 3,614
4 役務取引等収益 Net fee and commission Income
908 1,199 290
5 その他収益 Other income 1,937 1,696 (240)
6 営業費用 Total operating expenses 6,674 7,118 444
7 営業利益 Net profit before provision for credit losses
9,657 10,217 560
8 与信費用 Provision expense for credit losses
4,843 4,952 108
9 親会社株主に
帰属する純利益 Owners’ net profit 3,904 4,236 332
10 純金利収益率 Net interest margin 2.75% 2.60% (0.15ppt)
11 ROE 13.00% 12.90% (0.10ppt)
<B/S>
17/12末
End Dec17
18/6末 End
Jun 18
増減
Change
12 貸出金 Loans to customers 790,688 867,566 76,878
13 預金 Customer deposits 752,935 852,448 99,513
14 純資産 Total owners’ equity 63,765 68,042 4,277
15 総資産 Total assets 1,095,060 1,140,081 45,020
16 不良債権比率 NPL ratio 1.13% 1.29% 0.16ppt
17 引当率(対不良債権) NPL coverage ratio 92.2% 111.2% 19.0ppt
Security Bankの業績 Results of Security Bank VietinBankの業績 Results of VietinBank
(百万フィリピンペソ PHP mm)
(百万フィリピンペソ PHP mm)
(十億ベトナムドン VND bn)
(十億ベトナムドン VND bn)

40
事業本部別収益 Profits by Business Group
41
17年度上期 FY17H1 18年度上期 FY18H1 前年同期比 YoY
(構成比*8)
(% of Total*8)
(構成比*8)
(% of Total*8)
(増減率)
(% Change)
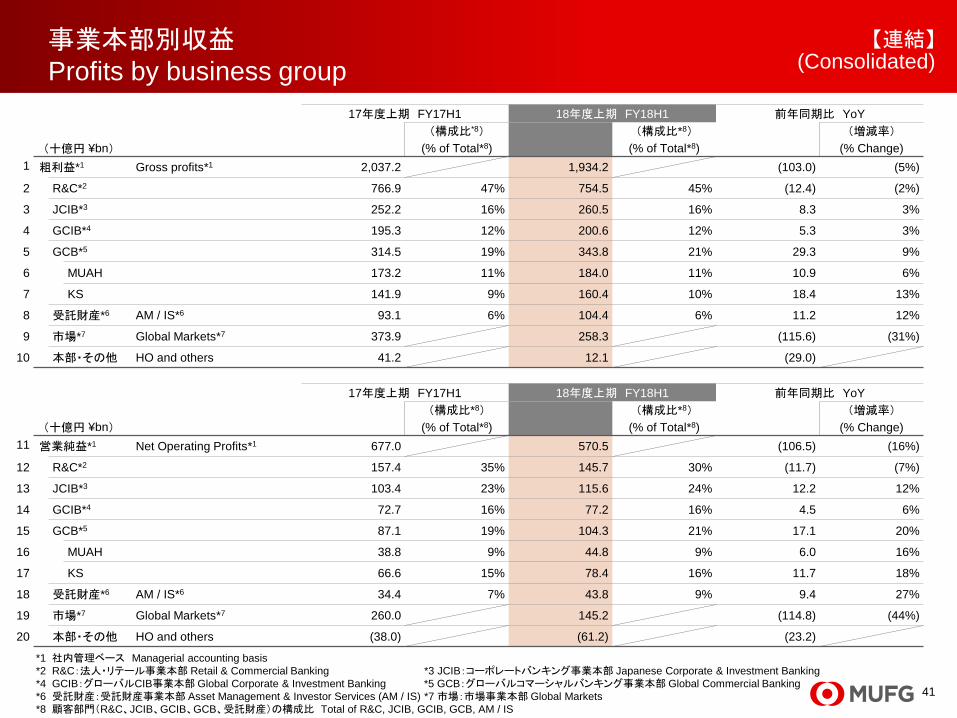
1 粗利益*1 Gross profits*1 2,037.2 1,934.2 (103.0) (5%)
2 R&C*2 766.9 47% 754.5 45% (12.4) (2%)
3 JCIB*3 252.2 16% 260.5 16% 8.3 3%
4 GCIB*4 195.3 12% 200.6 12% 5.3 3%
5 GCB*5 314.5 19% 343.8 21% 29.3 9%
6 MUAH 173.2 11% 184.0 11% 10.9 6%
7 KS 141.9 9% 160.4 10% 18.4 13%
8 受託財産*6 AM / IS*6 93.1 6% 104.4 6% 11.2 12%
9 市場*7 Global Markets*7 373.9 258.3 (115.6) (31%)
10 本部・その他 HO and others 41.2 12.1 (29.0)
事業本部別収益
Profits by business group
(十億円 ¥bn)
17年度上期 FY17H1 18年度上期 FY18H1 前年同期比 YoY
(構成比*8)
(% of Total*8)
(構成比*8)
(% of Total*8)
(増減率)
(% Change)
11 営業純益*1 Net Operating Profits*1 677.0 570.5 (106.5) (16%)
12 R&C*2 157.4 35% 145.7 30% (11.7) (7%)
13 JCIB*3 103.4 23% 115.6 24% 12.2 12%
14 GCIB*4 72.7 16% 77.2 16% 4.5 6%
15 GCB*5 87.1 19% 104.3 21% 17.1 20%
16 MUAH 38.8 9% 44.8 9% 6.0 16%
17 KS 66.6 15% 78.4 16% 11.7 18%
18 受託財産*6 AM / IS*6 34.4 7% 43.8 9% 9.4 27%
19 市場*7 Global Markets*7 260.0 145.2 (114.8) (44%)
20 本部・その他 HO and others (38.0) (61.2) (23.2)
(十億円 ¥bn)
【連結】 (Consolidated)
*1 社内管理ベース Managerial accounting basis
*2 R&C:法人・リテール事業本部 Retail & Commercial Banking *3 JCIB:コーポレートバンキング事業本部 Japanese Corporate & Investment Banking
*4 GCIB:グローバルCIB事業本部 Global Corporate & Investment Banking *5 GCB:グローバルコマーシャルバンキング事業本部 Global Commercial Banking
*6 受託財産:受託財産事業本部 Asset Management & Investor Services (AM / IS) *7 市場:市場事業本部 Global Markets
*8 顧客部門(R&C、JCIB、GCIB、GCB、受託財産)の構成比 Total of R&C, JCIB, GCIB, GCB, AM / IS
42
主な業量 Major business volume
43
(十億円 ¥bn) 16年度下期
FY16H2
17年度上期
FY17H1
17年度下期
FY17H2
18年度上期
FY18H1
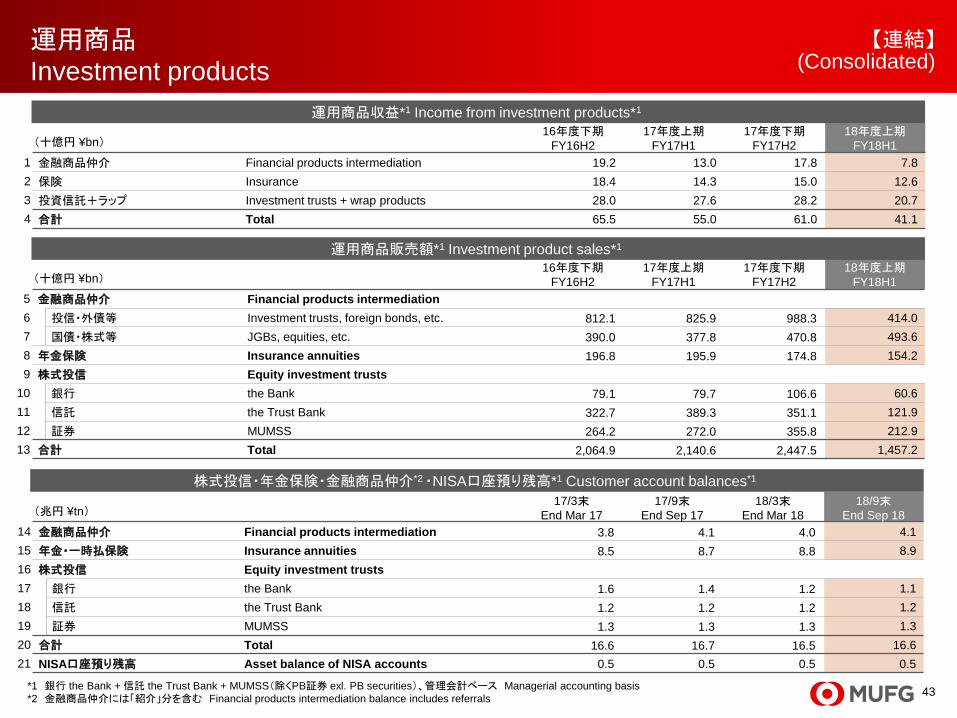
1 金融商品仲介 Financial products intermediation 19.2 13.0 17.8 7.8
2 保険 Insurance 18.4 14.3 15.0 12.6
3 投資信託+ラップ Investment trusts + wrap products 28.0 27.6 28.2 20.7
4 合計 Total 65.5 55.0 61.0 41.1
(十億円 ¥bn) 16年度下期
FY16H2
17年度上期
FY17H1
17年度下期
FY17H2
18年度上期
FY18H1
5 金融商品仲介 Financial products intermediation
6 投信・外債等 Investment trusts, foreign bonds, etc. 812.1 825.9 988.3 414.0
7 国債・株式等 JGBs, equities, etc. 390.0 377.8 470.8 493.6
8 年金保険 Insurance annuities 196.8 195.9 174.8 154.2
9 株式投信 Equity investment trusts
10 銀行 the Bank 79.1 79.7 106.6 60.6
11 信託 the Trust Bank 322.7 389.3 351.1 121.9
12 証券 MUMSS 264.2 272.0 355.8 212.9
13 合計 Total 2,064.9 2,140.6 2,447.5 1,457.2
運用商品
Investment products
*1 銀行 the Bank + 信託 the Trust Bank + MUMSS(除くPB証券 exl. PB securities)、管理会計ベース Managerial accounting basis
*2 金融商品仲介には「紹介」分を含む Financial products intermediation balance includes referrals
【連結】 (Consolidated)
(兆円 ¥tn) 17/3末
End Mar 17 17/9末
End Sep 17 18/3末
End Mar 18 18/9末
End Sep 18
14 金融商品仲介 Financial products intermediation 3.8 4.1 4.0 4.1
15 年金・一時払保険 Insurance annuities 8.5 8.7 8.8 8.9
16 株式投信 Equity investment trusts
17 銀行 the Bank 1.6 1.4 1.2 1.1
18 信託 the Trust Bank 1.2 1.2 1.2 1.2
19 証券 MUMSS 1.3 1.3 1.3 1.3
20 合計 Total 16.6 16.7 16.5 16.6
21 NISA口座預り残高 Asset balance of NISA accounts 0.5 0.5 0.5 0.5
運用商品販売額*1 Investment product sales*1
運用商品収益*1 Income from investment products*1
株式投信・年金保険・金融商品仲介*2 ・NISA口座預り残高*1 Customer account balances*1
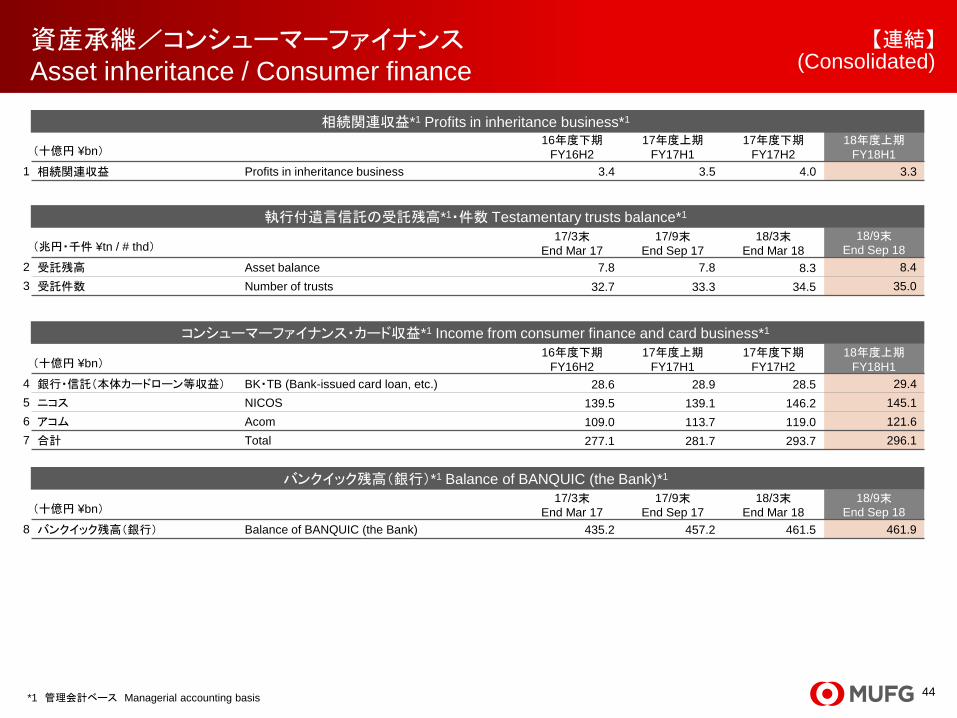
44
資産承継/コンシューマーファイナンス
Asset inheritance / Consumer finance
【連結】 (Consolidated)
*1 管理会計ベース Managerial accounting basis
(十億円 ¥bn) 16年度下期
FY16H2
17年度上期
FY17H1
17年度下期
FY17H2
18年度上期
FY18H1
1 相続関連収益 Profits in inheritance business 3.4 3.5 4.0 3.3
(兆円・千件 ¥tn / # thd) 17/3末
End Mar 17 17/9末
End Sep 17 18/3末
End Mar 18
18/9末
End Sep 18
2 受託残高 Asset balance 7.8 7.8 8.3 8.4
3 受託件数 Number of trusts 32.7 33.3 34.5 35.0
(十億円 ¥bn) 16年度下期
FY16H2
17年度上期
FY17H1
17年度下期
FY17H2
18年度上期
FY18H1
4 銀行・信託(本体カードローン等収益) BK・TB (Bank-issued card loan, etc.) 28.6 28.9 28.5 29.4
5 ニコス NICOS 139.5 139.1 146.2 145.1
6 アコム Acom 109.0 113.7 119.0 121.6
7 合計 Total 277.1 281.7 293.7 296.1
(十億円 ¥bn) 17/3末
End Mar 17 17/9末
End Sep 17 18/3末
End Mar 18 18/9末
End Sep 18
8 バンクイック残高(銀行) Balance of BANQUIC (the Bank) 435.2 457.2 461.5 461.9
相続関連収益*1 Profits in inheritance business*1
執行付遺言信託の受託残高*1・件数 Testamentary trusts balance*1
コンシューマーファイナンス・カード収益*1 Income from consumer finance and card business*1
バンクイック残高(銀行)*1 Balance of BANQUIC (the Bank)*1

45
シンジケートローン/不動産
Syndicated loans / Real estate
【連結】
(兆円 ・件 ¥tn / #) 16年度下期
FY16H2
17年度上期
FY17H1
17年度下期
FY17H2
18年度上期
FY18H1
1 金額 Amount 4.0 2.5 5.1 5.2
2 件数 Number 422 311 472 302
(Consolidated)
(十億円・兆円 ¥bn / ¥tn) 17/3末
End Mar 17 17/9末
End Sep 17 18/3末
End Mar 18 18/9末
End Sep 18
3 取扱高 Transaction 522.3 296.9 324.7 367.9
4 受託残高(期末) Custody (as of term end) 13.0 13.4 14.0 14.4
(兆円 ¥tn) 17/3末
End Mar 17 17/9末
End Sep 17 18/3末
End Mar 18 18/9末
End Sep 18
5 不動産ノンリコースローン残高 Real estate non-recourse loan balance 2.74 2.66 2.72 2.72
*1 不動産管理処分信託の受託残高。個人の取扱高を除く Outstanding amount of property trust. Excluding transactions of retail customers
国内シンジケートローン・アレンジ実績 Arrangement of domestic syndicated loans
不動産取扱高、受託残高*1 Real estate transaction and custody*1
不動産ノンリコースローン残高 Real estate non-recourse loan balance

46
【連結】
*1 HF・PE・投信(40Act等)アドミニストレーションの合計残高 Sum of HF / PE / Investment funds (40Act etc) administration
年金受託残高 Pension balance
(兆円 ¥tn) 17/3末
End Mar 17 17/9末
End Sep 17 18/3末
End Mar 18 18/9末
End Sep 18
1 年金信託 Pension trust 12.9 12.4 12.4 12.3
2 年金特金 Specified money trust for pension 8.6 10.4 10.5 10.7
DC年金運用商品・資産管理残高 DC pension product and admin asset balance
(兆円 ¥tn) 17/3末
End Mar 17 17/9末
End Sep 17 18/3末
End Mar 18 18/9末
End Sep 18
3 DC年金運用商品 DC pension product 2.3 2.5 2.5 2.7
4 DC年金資産管理 DC pension admin 3.7 3.8 4.0 4.2
国内投信運用・管理残高 Domestic investment trust management / admin balance
(兆円 ¥tn) 17/3末
End Mar 17 17/9末
End Sep 17 18/3末
End Mar 18 18/9末
End Sep 18
5 投信運用 Investment trust management 12.6 12.9 13.3 14.0
6 投信管理 Investment trust admin 63.1 67.8 74.5 79.7
Global IS残高*1 Global IS balance*1
(十億米ドル $bn) 17/3末
End Mar 17 17/9末
End Sep 17 18/3末
End Mar 18 18/9末
End Sep 18
7 Global IS Global IS 497.9 515.5 538.5 537.5
(Consolidated) 受託財産
AM / IS

47
アセットクオリティ Asset Quality

48
与信関係費用・貸倒引当金の状況
Credit costs, allowance for credit losses
(百万円 ¥mm) 17年度上期
FY17H1
18年度上期
FY18H1
前年同期比
YoY
1 一般貸倒引当金繰入額 Provision for general allowance for credit losses - - -
2 貸出金償却 Losses on loan write-offs (62,965) (59,883) 3,082
3 個別貸倒引当金繰入額 Provision for specific allowance for
credit losses - - -
4 その他の与信関係費用 Other credit costs (25,791) 12,887 38,679
5 与信関係費用 計 Credit costs (88,757) (46,995) 41,761
6 貸倒引当金戻入益 Reversal of allowance for
credit losses 53,575 77,602 24,026
7 偶発損失引当金戻入益(与信関連) Reversal of reserve for contingent
losses included in credit costs - 56,412 56,412
8 償却債権取立益 Gains on loans written-off 38,291 30,949 (7,341)
9 与信関係費用総額 Total credit costs 3,109 117,968 114,858
(百万円 ¥mm) 18/3末
End Mar 18
18/9末
End Sep 18
増減
Change
10 一般貸倒引当金 General allowance for credit losses 596,523 439,513 (157,010)
11 個別貸倒引当金 Specific allowance for credit losses 210,058 249,773 39,715
12 特定海外債権引当勘定 Allowance for credit to specific
foreign borrowers 556 611 55
13 貸倒引当金 計
[リスク管理債権に対する引当率] Allowance for credit losses
[% to total risk monitored loans]
807,139
[63.46%]
689,898
[70.99%]
(117,240)
[7.52ppt]
【連結】 (Consolidated)

49
(十億円 ¥bn)
17/9末
End Sep 17
(A)
18/3末
End Mar 18
(B)
18/9末
End Sep 18
(C)
増減
Change
(C)–(A)
増減
Change
(C)–(B)
1 破産更生債権及びこれらに準ずる債権
Bankrupt or De facto bankrupt 171.6 118.8 98.9 (72.7) (19.8)
2 危険債権
Doubtful 353.6 344.1 353.3 (0.2) 9.1
3 要管理債権
Special attention 517.4 462.7 197.6 (319.8) (265.1)
4 金融再生法開示債権小計
Non performing loans based on the FRL*1 1,042.7 925.7 649.8 (392.8) (275.8)
5 うち 要管理先非開示債権
Loans to special attention borrowers, not subject to FRL*1 174.0 51.1 48.7 (125.2) (2.4)
6 うち その他要注意先債権
Loans to other borrowers of requiring caution 2,149.4 1,931.3 1,784.9 (364.5) (146.4)
7 正常債権
Normal 104,262.9 103,740.0 103,718.3 (544.6) (21.7)
8 合計 Total (4+7) 105,305.6 104,665.7 104,368.2 (937.4) (297.5)
金融再生法開示債権
Non performing loans based on the FRL*1
【2行合算】 (Non-consolidated)
*1 Financial Reconstruction Law
<銀行勘定・信託勘定合算>
Sum of bank accounts and trust accounts

50
(18/9末 End Sep 18)(十億円 ¥bn、%)
債権区分
Category
開示残高
(a)
Loan
amount
(a)
うち担保・ 保証等による
保全額 (b)
Covered by
collateral
and / or
guarantees (b)
貸倒引当金
(c)
Allowance for
credit losses
(c)
カバー額
(d)=(b)+(c)
Covered
amount
(d) = (b) + (c)
裸与信
(e)=(a)-(b)
Unsecured
amount
(e) = (a) – (b)
保全率
(b)/(a)
Secured
ratio
(b) / (a)
引当率
(c)/(a)
Allowance
ratio
(c) / (a)
カバー率
(d)/(a)
Coverage
ratio
(d) / (a)
非保全率
(e)/(a)
Unsecured
ratio
(e) / (a)
1
破産更生債権及び
これらに準ずる債権
Bankrupt or
De facto bankrupt
98.9 93.2 94.31% 5.6 5.68% 98.9 100.00% 5.6 5.68%
2 危険債権 Doubtful 353.3 156.3 44.24% 136.0 38.49% 292.3 82.73% 196.9 55.75%
3 要管理債権
Special attention 197.6 93.7 47.44% 55.6 28.17% 149.4 75.62% 103.8 52.55%
4 合計 Total 649.8 343.3 52.84% 197.3 30.36% 540.7 83.20% 306.4 47.15%
貸倒引当金・保全
Allowance, collateral and guarantee
【2行合算】 (Non-consolidated)
金融再生開示区分毎の引当及び保全状況(銀行勘定・信託勘定合算) Status of coverage of non performing loans based on the FRL (Sum of bank and trust accounts)
(18/3末 End Mar 18)(十億円 ¥bn、%)
債権区分
Category
開示残高
(a)
Loan
amount
(a)
うち担保・ 保証等による
保全額 (b)
Covered by
collateral
and / or
guarantees (b)
貸倒引当金
(c)
Allowance for
credit losses
(c)
カバー額
(d)=(b)+(c)
Covered
amount
(d) = (b) + (c)
裸与信
(e)=(a)-(b)
Unsecured
amount
(e) = (a) – (b)
保全率
(b)/(a)
Secured
ratio
(b) / (a)
引当率
(c)/(a)
Allowance
ratio
(c) / (a)
カバー率
(d)/(a)
Coverage
ratio
(d) / (a)
非保全率
(e)/(a)
Unsecured
ratio
(e) / (a)
5
破産更生債権及び
これらに準ずる債権
Bankrupt or
De facto bankrupt
118.8 110.8 93.30% 7.9 6.69% 118.8 100.00% 7.9 6.69%
6 危険債権 Doubtful 344.1 173.8 50.51% 95.6 27.78% 269.4 78.29% 170.3 49.48%
7 要管理債権
Special attention 462.7 184.7 39.91% 176.9 38.23% 361.6 78.15% 278.0 60.08%
8 合計 Total 925.7 469.4 50.71% 280.5 30.30% 749.9 81.01% 456.2 49.28%

51
債務者区分
Borrower category
17/9末
End
Sep 17
(A)
18/3末
End
Mar 18
(B)
18/9末
End
Sep 18
(C)
増減
Change
(C)-(A)
(% ppt)
増減
Change
(C)-(B)
(% ppt)
1 正常先 Normal 0.05% 0.05% 0.04% (0.01) (0.01)
2 要注意先
Requiring caution 10.41% 10.20% 6.13% (4.28) (4.07)
3 非保全部分
Unsecured portion 25.24% 26.26% 15.82% (9.42) (10.43)
4 その他要注意先
Other 2.29% 2.89% 2.89% 0.59 (0.00)
5 非保全部分
Unsecured portion 6.44% 8.65% 7.86% 1.42 (0.78)
6 要管理先
Special attention 37.23% 37.64% 29.81% (7.42) (7.83)
7 非保全部分
Unsecured portion 62.05% 63.54% 55.74% (6.31) (7.80)
8
破綻懸念先 非保全部分
Unsecured portion of
potentially bankrupt
52.32% 56.20% 69.08% 16.75 12.87
(注1) 自己査定債務者区分毎の引当率であるが、対象科目は金融再生法ベース(貸出金、外国為替、支払承諾見返、貸付有価証券、与信に関わる仮払金、未収利息、保証付私募債) (Note1) Reserve ratios by self-assessed debtor category are calculated based on accounts under FRL (loans and bills discounted, foreign exchanges, customers' liabilities for
acceptances and guarantees, securities lent, credit related suspense payments, accrued interest, guaranteed private placement bonds)
(注2) 保証会社保証付ローン等、一部対象外資産あり
(Note2) A portion of loans guaranteed by guarantee companies, etc. are excluded
(注3) 「正常先」は債権額に対する引当率
(Note3) Reserve ratio for “Normal” is applied to the proportion of the reserve to the claim
(注4) 「要注意先」、「その他要注意先」、「要管理先」は債権額に対する引当率及び担保・保証等を控除した非保全部分に対する引当率
(Note4) Reserve ratios for “Requiring caution”, “Other” and “Special attention” are applied to the proportion of the reserve the claims. Those for unsecured portions
of each category are applied to the proportion of the reserve to the claims excluding the portion secured by collateral and guarantees, etc.
(注5) 「破綻懸念先」は担保・保証等を控除した非保全部分に対する引当率
(Note5) Reserve ratio for “Unsecured portion of potentially bankrupt” is applied to the proportion of the reserve to the claims excluding the portion
secured by collateral and guarantees, etc.
債務者区分別貸倒引当率
Reserve ratios by borrower category
【銀行・信託銀行】 (the Bank, the Trust Bank)
自己査定債務者区分毎の引当率の推移 Reserve ratios by borrower category
【銀行 the Bank】
債務者区分
Borrower category
17/9末
End
Sep 17
(A)
18/3末
End
Mar 18
(B)
18/9末
End
Sep 18
(C)
増減
Change
(C)-(A)
(% ppt)
増減
Change
(C)-(B)
(% ppt)
1 正常先 Normal 0.04% 0.04% 0.02% (0.01) (0.01)
2 要注意先
Requiring caution 21.26% 17.19% 1.58% (19.68) (15.60)
3 非保全部分
Unsecured portion 41.50% 39.40% 19.57% (21.93) (19.83)
4 その他要注意先
Other 2.89% 9.23% 0.32% (2.57) (8.91)
5 非保全部分
Unsecured portion 6.49% 23.27% 8.55% 2.05 (14.71)
6 要管理先
Special attention 45.67% 46.56% 4.31% (41.36) (42.24)
7 非保全部分
Unsecured portion 75.93% 80.10% 24.72% (51.20) (55.37)
8
破綻懸念先 非保全部分
Unsecured portion of
potentially bankrupt
72.37% 38.70% 23.50% (48.86) (15.19)
【信託銀行 the Trust Bank】

52
*1 与信残高は借入人所在国ベース。コミットメントライン空枠、プロジェクトファイナンス等を含む、市場性与信、インターバンク取引や政府系機関および中央銀行宛与信は除く。US$=113.57円にて換算
Based on borrower’s location. Including undrawn commitment, exposure in project finance etc. Excluding market risk exposure, inter-bank transactions and exposures to government
agencies and central banks. Exchange rate applied is ¥ 113.57/US$
*2 米州はMUAH(コーポレート)、アジア・オセアニアはKrungsri(コーポレート)を含む Americas and Asia/Oceania include MUAH’s exposure and KS’s exposure as of end Sep 18 respectively
*3 EMEAその他は各国与信残高2.5%未満の約60カ国 Others in EMEA are comprised of approximately 60 countries to which MUFG held less than 2.5% exposure
(注)数値は全て管理計数 (Note) All figures are on managerial accounting basis
【連結】
(Consolidated)
30.6
16.7
11.9
7.3
0
30
60
18/9末
End Sep 18
(兆円 ¥tn)
東アジア
East Asia
アジア・オセアニア*2
Asia / Oceania
EMEA
米州*2
Americas
66.6
香港
Hong Kong 54%
中国
China 25%
韓国
Korea 12%
台湾
Taiwan 9%
その他
Others 0%
米国
US 88%
カナダ
Canada 6%
ブラジル
Brazil 2%
メキシコ
Mexico 2%
その他
Others 2%
東アジア
East Asia
米州*2
Americas
英国
UK 25%
フランス
France 10%
オランダ
Netherland 10%
ドイツ
Germany 8%
スイス
Switzerland 5%
サウジ
アラビア
Saudi Arabia
5%
イタリア
Italy 4%
UAE 3%
タイ
Thailand 26%
インドネシア
Indonesia 10%
インド
India 10%
マレーシア
Malaysia 8%
その他
Others 9%
アジア・オセアニア*2
Asia/Oceania
EMEA
オーストラリア
Australia
19%
シンガポールSingapore
19%
その他*3
Others
30%
海外事業法人向け与信残高*1の地域別内訳 Credit exposure*1 to overseas corporate by region
海外事業法人向け与信
Overseas corporate credit exposure

53
(十億円 ¥bn)
与信残高*1
18/3末
Balance*1
End Mar 18
与信残高*1
18/9末
Balance*1
End Sep 18
非日系
与信比率
Non-Japanese
要管理先以下*2
Close observation
or under*2
非日系
与信比率
Non-Japanese
要管理先以下*2
Close observation
or under*2
1 米国 US 17,604 79.1% 0.8% 20,301 78.2% 0.1%
2 カナダ Canada 1,603 82.6% 0.0% 1,936 79.4% 0.0%
3 ブラジル Brazil 708 89.3% 5.4% 687 85.9% 2.7%
4 メキシコ Mexico 615 73.7% 0.0% 675 68.8% 0.0%
米州 Americas
(十億円 ¥bn)
与信残高*1
18/3末
Balance*1
End Mar 18
与信残高*1
18/9末
Balance*1
End Sep 18
非日系
与信比率
Non-Japanese
要管理先以下*2
Close observation
or under*2
非日系
与信比率
Non-Japanese
要管理先以下*2
Close observation
or under*2
5 香港 Hong Kong 3,942 90.8% 0.0% 4,010 89.4% 0.0%
6 シンガポール Singapore 2,085 67.8% 0.0% 2,287 65.5% 0.0%
7 オーストラリア Australia 2,144 75.4% 0.1% 2,260 74.8% 0.1%
8 中国 China 1,873 58.3% 0.0% 1,857 59.0% 0.0%
9 インドネシア Indonesia 1,087 55.8% 0.3% 1,267 55.8% 0.2%
10 インド India 1,211 93.2% 0.2% 1,229 93.0% 0.8%
11 韓国 Korea 977 85.0% 0.0% 1,014 84.3% 0.0%
12 マレーシア Malaysia 857 59.4% 0.0% 980 62.7% 0.0%
13 台湾 Taiwan 655 87.6% 0.0% 647 86.5% 0.0%
14 ニュージーランド New Zealand 400 82.8% 0.0% 481 78.4% 0.0%
15 ベトナム Vietnam 238 64.8% 1.5% 285 54.5% 1.6%
国・地域別海外与信残高 (1) Exposures to overseas borrowers by country and region (1)
【銀行連結(除くMUAH、KS)】 (the Bank consolidated excl. MUAH, KS)
*1 与信残高は借入人所在国ベース。コミットメントライン空枠、市場性与信、プロジェクトファイナンス等を含む。インターバンク取引や政府系機関および中央銀行宛与信は除く。
18/3はUS$=106.24円、18/9はUS$=113.57円にて換算
Based on borrower’s location. Including undrawn commitment, market risk exposure, project finance and etc. Excluding inter-bank transactions and exposures to government
agencies and central banks. Exchange rate applied is ¥106.24/US$ for End Mar 18, ¥113.57/US$ for End Sep 18
*2 自己査定債務者区分による Based on debtor category of self-assessment
(注) 数値は全て管理計数 (Note) All figures are on managerial accounting basis
アジア・オセアニア Asia / Oceania

54
EMEA
(十億円 ¥bn)
与信残高*1
18/3末
Balance*1
End Mar 18
与信残高*1
18/9末
Balance*1
End Sep 18
非日系
与信比率
Non-Japanese
要管理先以下*2
Close observation
or under*2
非日系
与信比率
Non-Japanese
要管理先以下*2
Close observation
or under*2
1 英国 UK 4,349 75.2% 0.5% 4,718 73.7% 0.5%
2 オランダ Netherlands 2,018 70.6% 0.0% 1,922 66.7% 0.0%
3 フランス France 1,913 94.6% 0.0% 1,868 94.6% 0.0%
4 ドイツ Germany 1,562 78.2% 1.1% 1,466 72.0% 1.3%
5 スイス Switzerland 703 93.1% 0.0% 928 92.8% 0.0%
6 サウジアラビア Saudi Arabia 708 86.4% 0.0% 752 86.5% 0.0%
7 イタリア Italy 691 75.4% 0.0% 712 73.4% 0.0%
8 UAE UAE 456 96.5% 0.0% 454 94.0% 0.0%
9 ルクセンブルグ Luxemburg 377 96.2% 0.0% 450 96.8% 0.0%
10 ベルギー Belgium 391 68.2% 0.0% 424 56.0% 0.0%
11 トルコ Turkey 376 67.2% 0.0% 379 68.4% 0.0%
12 スペイン Spain 390 88.9% 2.4% 362 88.0% 1.3%
13 アイルランド Ireland 331 100.0% 0.0% 348 98.7% 1.7%
14 カタール Qatar 276 88.3% 0.0% 307 86.6% 0.0%
15 デンマーク Denmark 216 94.8% 0.0% 241 88.2% 0.0%
16 南アフリカ South Africa 253 57.1% 0.0% 233 62.7% 0.0%
17 ポーランド Poland 215 64.9% 0.0% 210 65.1% 0.0%
国・地域別海外与信残高 (2) Exposures to overseas borrowers by country and region (2)
【銀行連結(除くMUAH、KS)】 (the Bank consolidated excl. MUAH, KS)
*1 与信残高は借入人所在国ベース。コミットメントライン空枠、市場性与信、プロジェクトファイナンス等を含む。インターバンク取引や政府系機関および中央銀行宛与信は除く。
18/3はUS$=106.24円、18/9はUS$=113.57円にて換算
Based on borrower’s location. Including undrawn commitment, market risk exposure, project finance and etc. Excluding inter-bank transactions and exposures to government
agencies and central banks. Exchange rate applied is ¥106.24/US$ for End Mar 18, ¥113.57/US$ for End Sep 18
*2 自己査定債務者区分による Based on debtor category of self-assessment
(注) 数値は全て管理計数 (Note) All figures are on managerial accounting basis
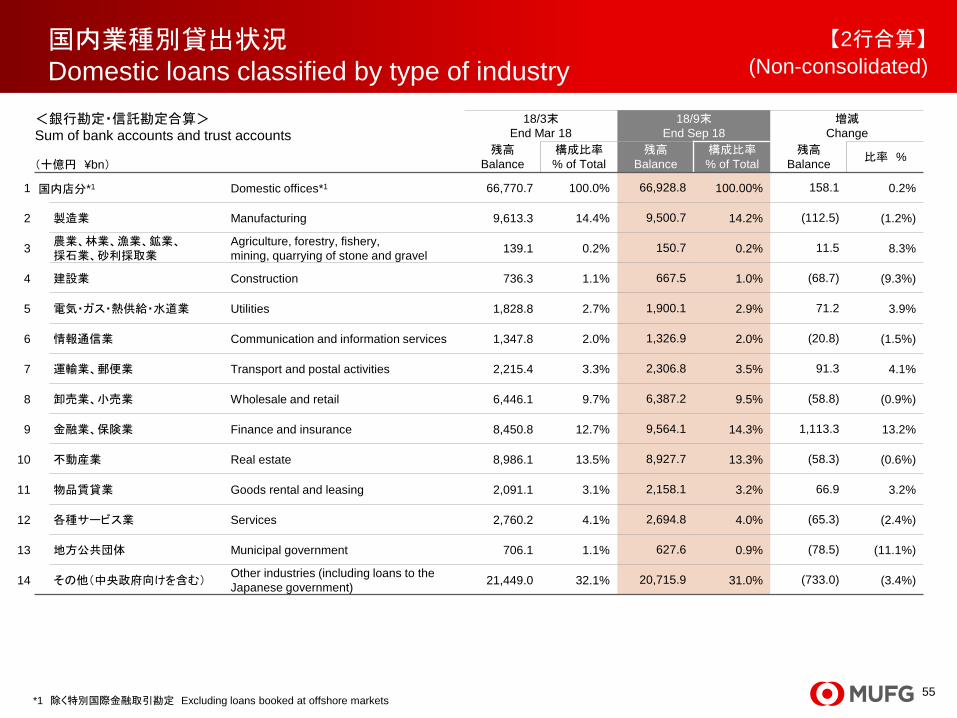
55
(十億円 ¥bn)
18/3末
End Mar 18
18/9末
End Sep 18
増減
Change
残高
Balance
構成比率
% of Total
残高
Balance
構成比率
% of Total
残高
Balance 比率 %
1 国内店分*1 Domestic offices*1 66,770.7 100.0% 66,928.8 100.00% 158.1 0.2%
2 製造業 Manufacturing 9,613.3 14.4% 9,500.7 14.2% (112.5) (1.2%)
3 農業、林業、漁業、鉱業、
採石業、砂利採取業
Agriculture, forestry, fishery,
mining, quarrying of stone and gravel 139.1 0.2% 150.7 0.2% 11.5 8.3%
4 建設業 Construction 736.3 1.1% 667.5 1.0% (68.7) (9.3%)
5 電気・ガス・熱供給・水道業 Utilities 1,828.8 2.7% 1,900.1 2.9% 71.2 3.9%
6 情報通信業 Communication and information services 1,347.8 2.0% 1,326.9 2.0% (20.8) (1.5%)
7 運輸業、郵便業 Transport and postal activities 2,215.4 3.3% 2,306.8 3.5% 91.3 4.1%
8 卸売業、小売業 Wholesale and retail 6,446.1 9.7% 6,387.2 9.5% (58.8) (0.9%)
9 金融業、保険業 Finance and insurance 8,450.8 12.7% 9,564.1 14.3% 1,113.3 13.2%
10 不動産業 Real estate 8,986.1 13.5% 8,927.7 13.3% (58.3) (0.6%)
11 物品賃貸業 Goods rental and leasing 2,091.1 3.1% 2,158.1 3.2% 66.9 3.2%
12 各種サービス業 Services 2,760.2 4.1% 2,694.8 4.0% (65.3) (2.4%)
13 地方公共団体 Municipal government 706.1 1.1% 627.6 0.9% (78.5) (11.1%)
14 その他(中央政府向けを含む) Other industries (including loans to the
Japanese government) 21,449.0 32.1% 20,715.9 31.0% (733.0) (3.4%)
国内業種別貸出状況
Domestic loans classified by type of industry
*1 除く特別国際金融取引勘定 Excluding loans booked at offshore markets
【2行合算】
(Non-consolidated)
<銀行勘定・信託勘定合算>
Sum of bank accounts and trust accounts

56
0
5
10
15
16/3末
End Mar 16
17/3末
End Mar 17
18/3末
End Mar 18
18/9末
End Sep 18
与信総額
Credit exposure
8.7
0
5
10
15
16/3末
End Mar 16
17/3末
End Mar 17
18/3末
End Mar 18
18/9末
End Sep 18
コミットメントライン
空枠
Undrawn
commitment
3.4
*1 コミットメントライン空枠を含む、市場性与信を除く Including undrawn commitment and excluding market exposure
*2 銀行法に基づくリスク管理債権、但し、海外子会社については当該子会社の不良債権計上基準による
NPLs are based on the relevant rules for risk-monitored loans under Japanese Banking Act, except for NPLs in overseas subsidiaries which are based on each subsidiary’s internal criteria
*3 上流・中下流事業の一貫統合 Integrated business from upstream to downstream *4 石油・ガスの炭鉱・開発・生産等 Exploration, development and production of oil and gas
*5 備蓄・輸送・精製・販売 Storage, transportation, refinement, retail *6 石油・ガスの炭鉱・開発・生産に関する機材販売等のサービス Sales of mining machine to companies among upstream industry
*7 石油・ガス以外の鉱物関連 *8 プロジェクトファイナンス及びトレードファイナンス Project finance and trade finance
(注) 数値は全て管理計数 Note: All figures are on managerial accounting basis, aggregating internal management figures of each subsidiary
担保・保証控除後Net exposure
5.8
うち担保・保証
Collateralized
or guaranteed
2.9
実残
Drawn balance
5.3
US$/¥
=112.19
US$/¥
=106.24
与信総額
Credit exposure
8.7
【連結】 (Consolidated)
資源関連与信*1
Energy and mining portfolio*1
与信残高・担保・保証 Credit exposure, collateral and guarantee
与信残高・コミットメントライン空枠 Credit exposure, and undrawn commitment
不良債権の状況 NPLs, collateral and allowance
(兆円) (¥tn)
(兆円) (¥tn)
サブセクター別与信残高 Breakdown by sector
形態別与信残高 Breakdown by structure
コーポレート地域別与信残高 Breakdown by region (corporate)
(兆円) (¥tn)
(兆円) (¥tn)
(兆円) (¥tn)
US$/¥
=113.57
統合*3
Integrated*3 1.4
上流*4
Upstream*4 2.5
3.6
関連産業*6
Related industry*6
0.4
マイニング*7
Mining 0.8
2.4
1.6
1.1
1.5
アジア・オセアニア
Asia/Oceania
日本
Japan 米州
Americas
欧州EMEA
6.6
2.1
ストラクチャード
ファイナンス*8
Structured
finance*8
コーポレート
Corporate
中下流*5
Mid / downstream*5
(十億円)
(¥bn)
18年9月末
End Sep 18
不良債権残高*2
NPLs*2 78.1
担保・保証額
Collateralized or
guaranteed 46.5
引当金
Allowance 18.9
非保全・未引当額
NPLs*2 (net) 12.7
US$/¥
=112.68


![2012 interim results-eng [只读]...Hainan Provinces Consolidated its leading position in the industry Laid a solid foundation for the next round of development Results Highlights](https://img.pdfslide.tips/doc/110x75/607e4a7f6b0743686f6ff261/2012-interim-results-eng-e-hainan-provinces-consolidated-its-leading.jpg)