Embed Size (px)
Citation preview
Fletcher Building Ltd
Residential Investor Day
2 December 2015
For
per
sona
l use
onl
y
Fletcher Building Residential Investor Presentation | © December 20152
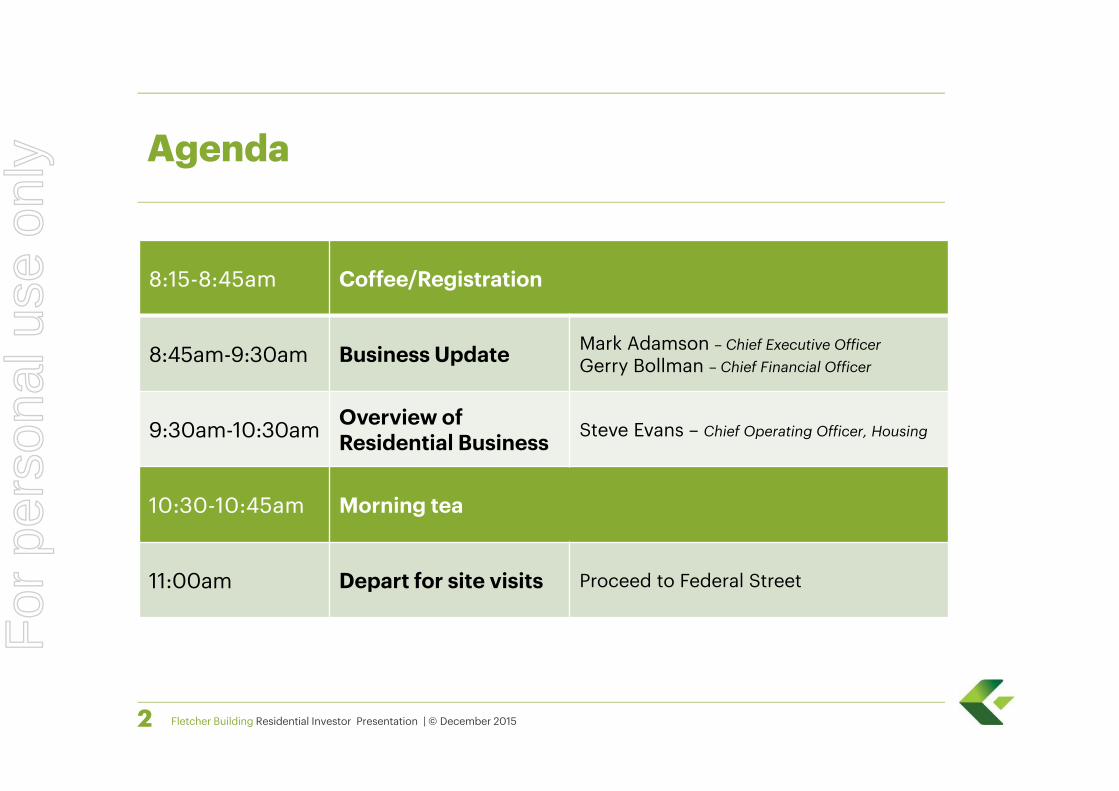
Agenda
8:15-8:45am Coffee/Registration
8:45am-9:30am Business Update Mark Adamson – Chief Executive OfficerGerry Bollman – Chief Financial Officer
9:30am-10:30am Overview of Residential Business Steve Evans – Chief Operating Officer, Housing
10:30-10:45am Morning tea
11:00am Depart for site visits Proceed to Federal Street
For
per
sona
l use
onl
y
Fletcher Building Residential Investor Presentation | © December 2015
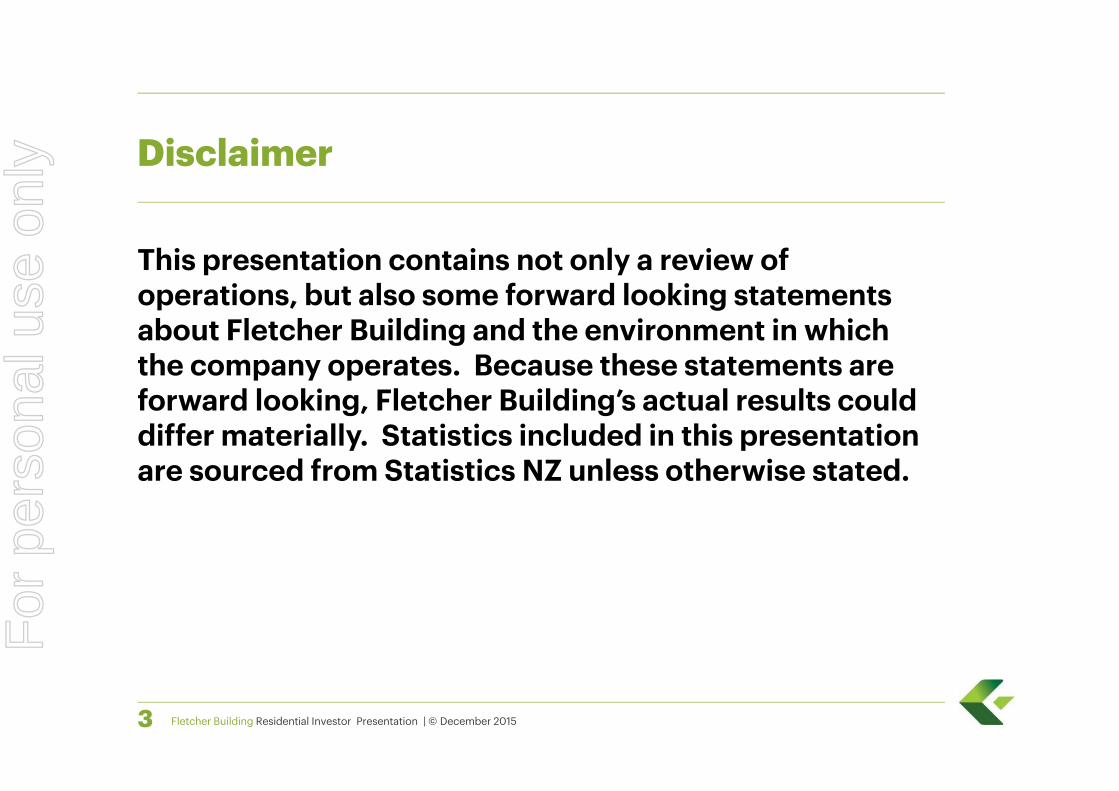
This presentation contains not only a review of operations, but also some forward looking statements about Fletcher Building and the environment in which the company operates. Because these statements are forward looking, Fletcher Building’s actual results could differ materially. Statistics included in this presentation are sourced from Statistics NZ unless otherwise stated.
3
Disclaimer
For
per
sona
l use
onl
y
Business Update
Mark Adamson – Chief Executive OfficerGerry Bollman – Chief Financial Officer
Fletcher Building Residential Investor Presentation | © December 2015
For
per
sona
l use
onl
y
Fletcher Building Residential Investor Presentation | © December 2015
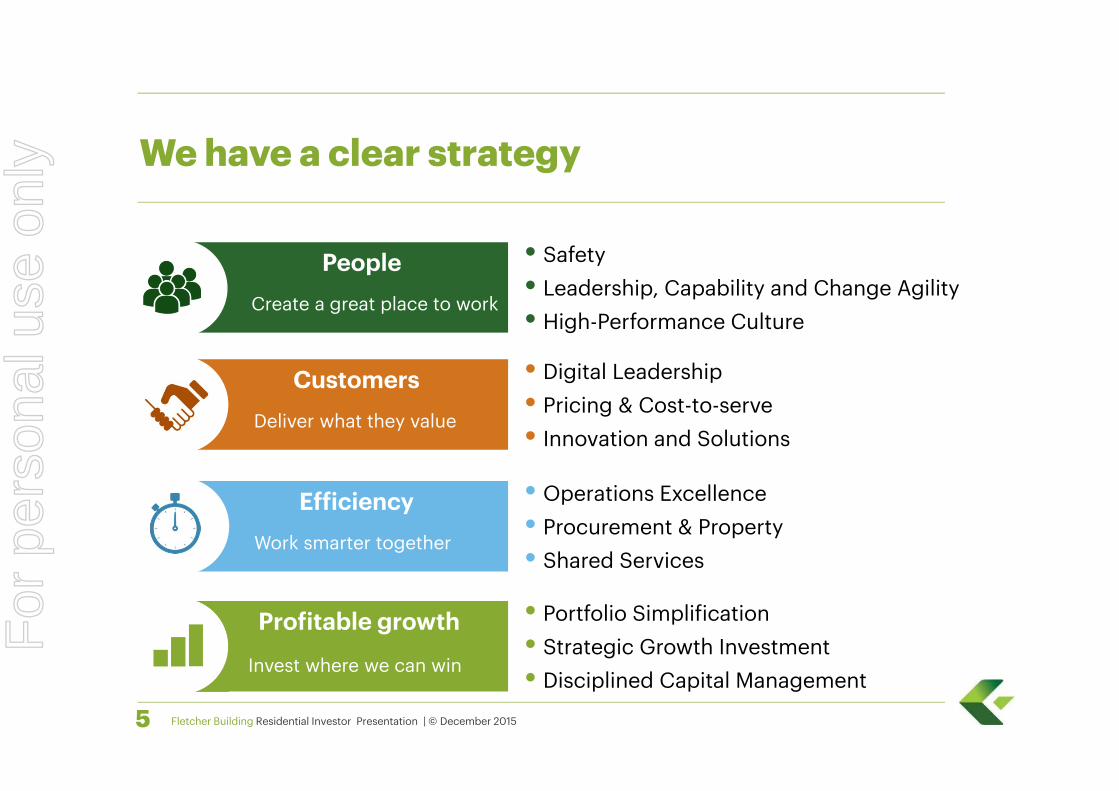
PeopleCreate a great place to work
5
We have a clear strategy
CustomersDeliver what they value
EfficiencyWork smarter together
Profitable growth
Invest where we can win
• Safety• Leadership, Capability and Change Agility• High-Performance Culture
• Digital Leadership• Pricing & Cost-to-serve• Innovation and Solutions
• Operations Excellence• Procurement & Property• Shared Services
• Portfolio Simplification• Strategic Growth Investment • Disciplined Capital Management
For
per
sona
l use
onl
y
Fletcher Building Residential Investor Presentation | © December 20156
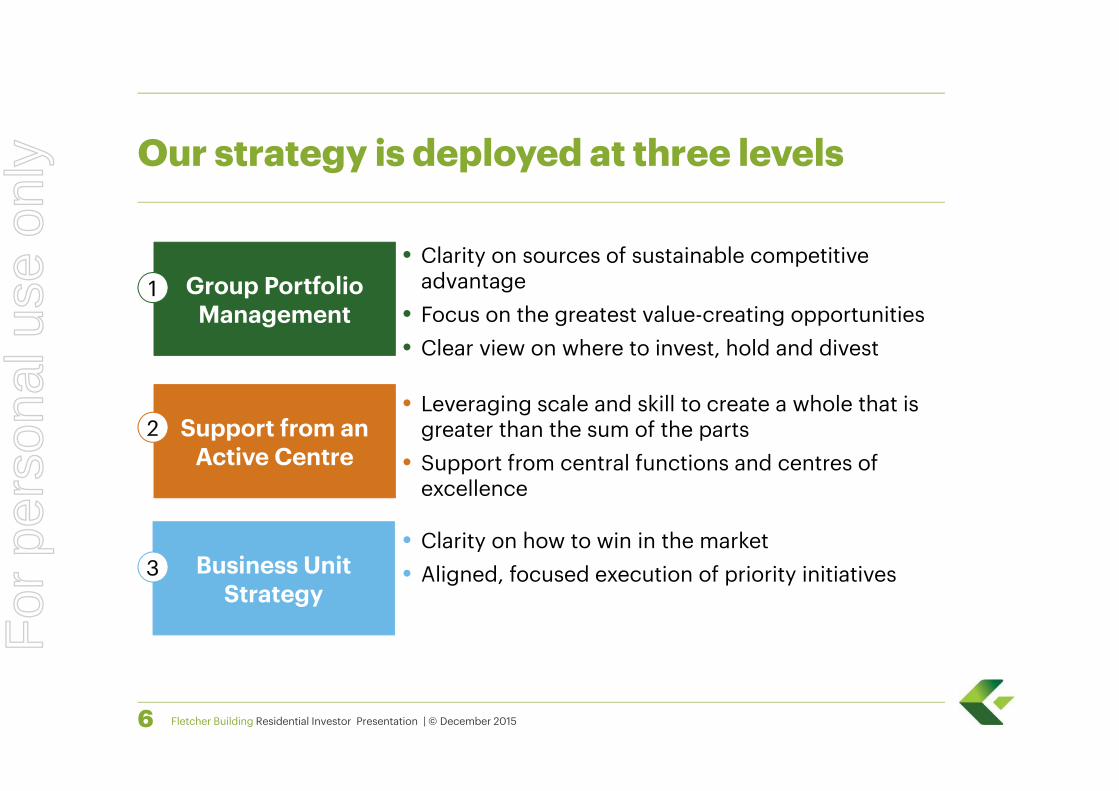
Our strategy is deployed at three levels
• Leveraging scale and skill to create a whole that is greater than the sum of the parts
• Support from central functions and centres of excellence
• Clarity on how to win in the market• Aligned, focused execution of priority initiatives
Support from an Active Centre
2
Group Portfolio Management
1
Business UnitStrategy
3
• Clarity on sources of sustainable competitive advantage
• Focus on the greatest value-creating opportunities • Clear view on where to invest, hold and divest
For
per
sona
l use
onl
y
Fletcher Building Residential Investor Presentation | © December 20157
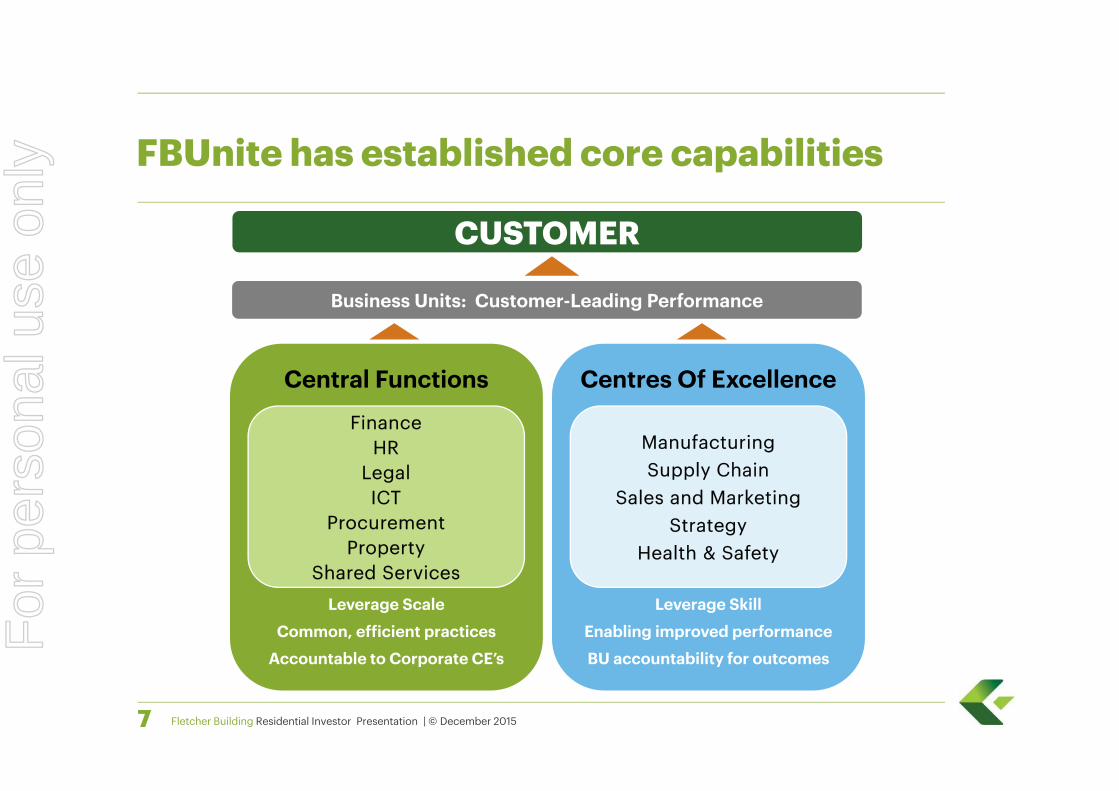
FBUnite has established core capabilities
Central Functions
Leverage Scale
Common, efficient practices
Accountable to Corporate CE’s
Centres Of Excellence
Leverage Skill
Enabling improved performance
BU accountability for outcomes
FinanceHR
LegalICT
ProcurementProperty
Shared Services
ManufacturingSupply Chain
Sales and MarketingStrategy
Health & Safety
Business Units: Customer-Leading Performance
CUSTOMER
For
per
sona
l use
onl
y
Fletcher Building Residential Investor Presentation | © December 2015
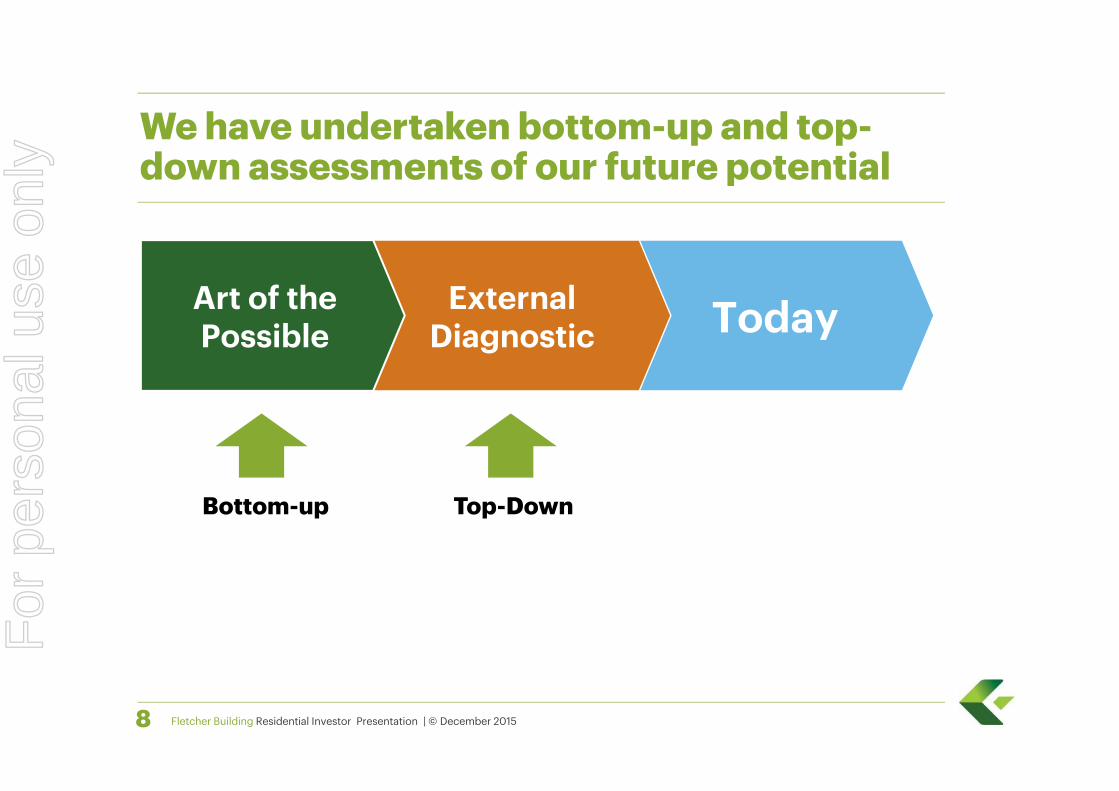
TodayExternal Diagnostic
8
We have undertaken bottom-up and top-down assessments of our future potential
Art of the Possible
Bottom-up Top-Down
For
per
sona
l use
onl
y
Fletcher Building Residential Investor Presentation | © December 2015
• We see further opportunity to improve our performance
• Most business’ see the potential to grow beyond historical peak earnings
• We have confidence that we can deliver this improvement and growth
• Growth to be driven by market share gain, market growth and margin
• Savings to come mainly from operations excellence (covering cost inflation in manufacturing and supply chain)
9
What did we learn from Art of the Possible?
For
per
sona
l use
onl
y
Outside-in view:
What did the diagnostic say we could achieve?
Fletcher Building Residential Investor Presentation | © December 2015
Mark Adamson – Chief Executive OfficerGerry Bollman – Chief Financial Officer
For
per
sona
l use
onl
y
Fletcher Building Residential Investor Presentation | © December 201511
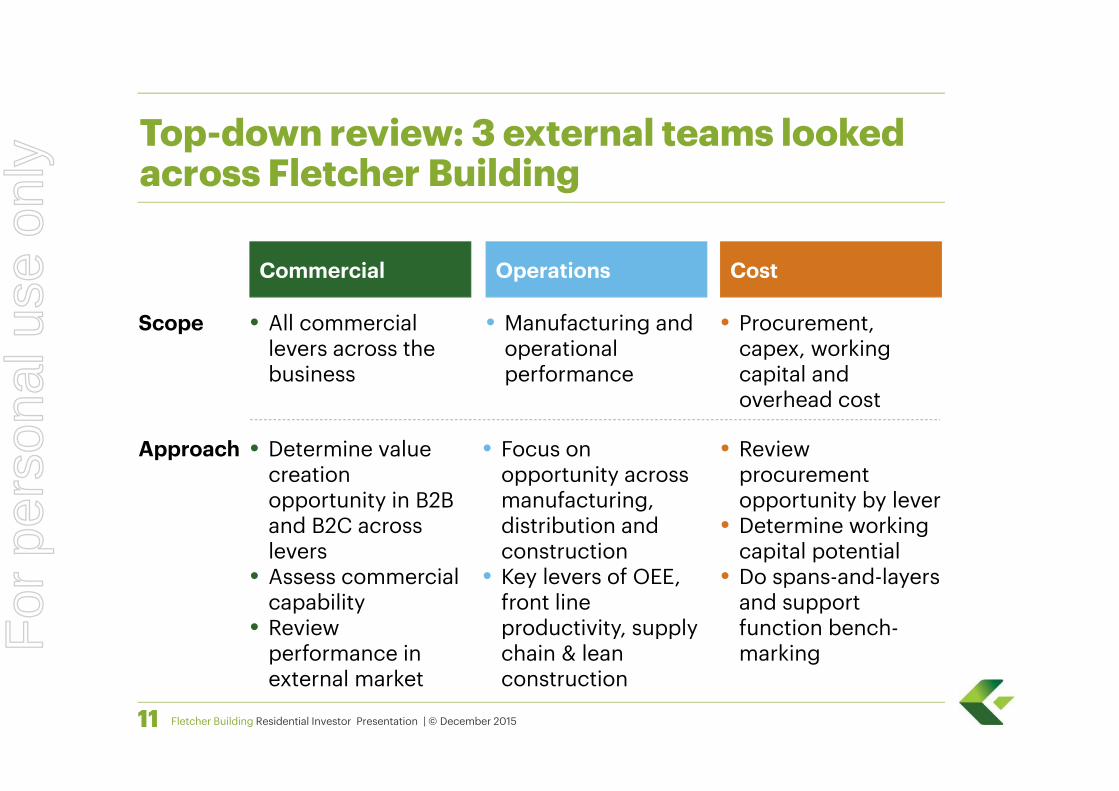
Top-down review: 3 external teams looked across Fletcher Building
Cost
Scope • Procurement, capex, working capital and overhead cost
Approach
Operations
• Manufacturing and operational performance
• Focus on opportunity across manufacturing, distribution and construction
• Key levers of OEE, front line productivity, supply chain & lean construction
Commercial
• All commercial levers across the business
• Determine value creation opportunity in B2B and B2C across levers
• Assess commercial capability
• Review performance in external market
• Review procurement opportunity by lever
• Determine working capital potential
• Do spans-and-layers and support function bench-markingF
or p
erso
nal u
se o
nly
Fletcher Building Residential Investor Presentation | © December 201512
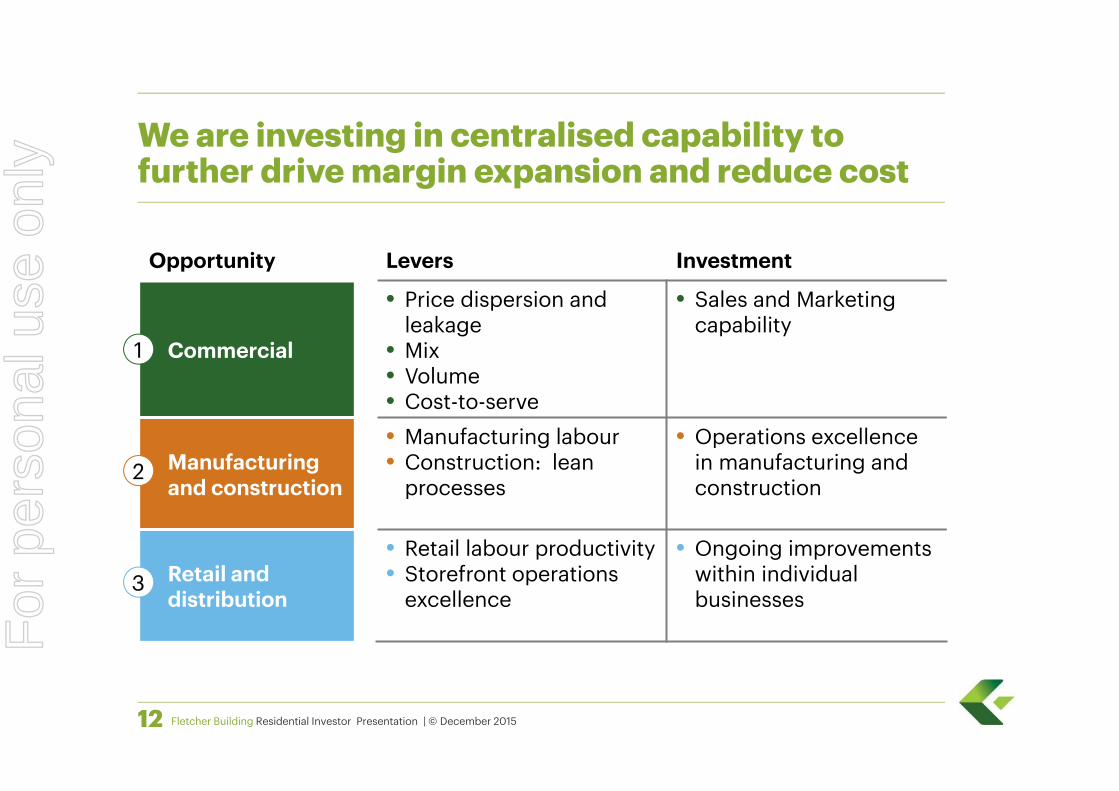
We are investing in centralised capability to further drive margin expansion and reduce cost
Opportunity Levers Investment
Commercial
• Price dispersion and leakage
• Mix• Volume• Cost-to-serve
• Sales and Marketing capability
Manufacturingand construction
• Manufacturing labour• Construction: lean
processes
• Operations excellence in manufacturing and construction
Retail and distribution
• Retail labour productivity• Storefront operations
excellence
• Ongoing improvements within individual businesses
2
1
3
For
per
sona
l use
onl
y
Fletcher Building Residential Investor Presentation | © December 201513
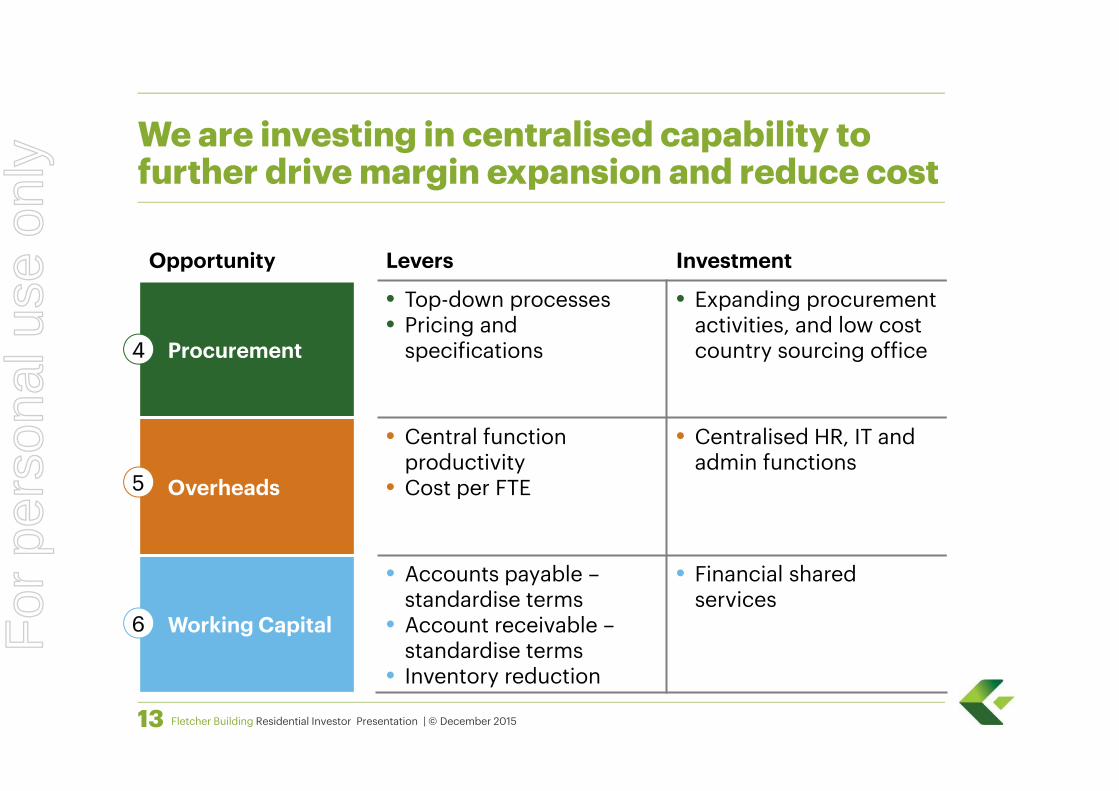
We are investing in centralised capability to further drive margin expansion and reduce cost
Opportunity Levers Investment
Procurement
• Top-down processes• Pricing and
specifications
• Expanding procurement activities, and low cost country sourcing office
Overheads
• Central function productivity
• Cost per FTE
• Centralised HR, IT and admin functions
Working Capital
• Accounts payable –standardise terms
• Account receivable –standardise terms
• Inventory reduction
• Financial shared services
5
4
6For
per
sona
l use
onl
y
Fletcher Building Residential Investor Presentation | © December 2015
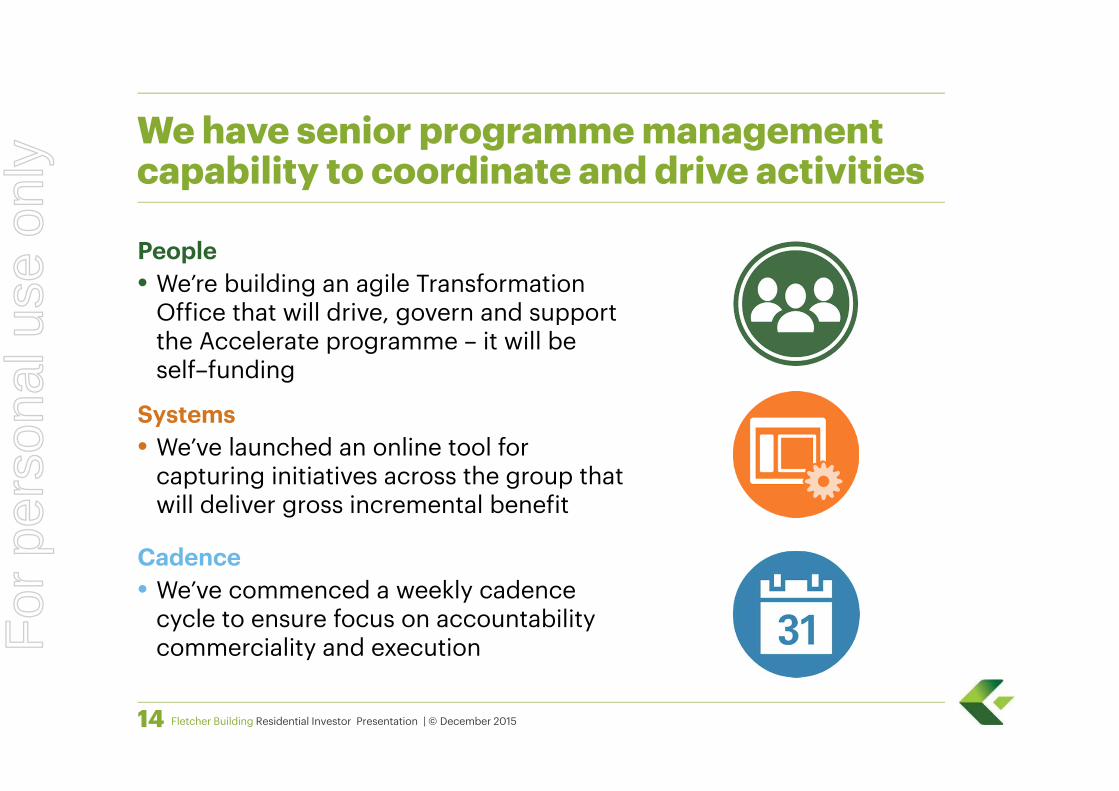
People• We’re building an agile Transformation
Office that will drive, govern and support the Accelerate programme – it will be self–funding
Systems• We’ve launched an online tool for
capturing initiatives across the group that will deliver gross incremental benefit
Cadence• We’ve commenced a weekly cadence
cycle to ensure focus on accountability commerciality and execution
14
We have senior programme management capability to coordinate and drive activities
For
per
sona
l use
onl
y
Overview of Residential Business
Fletcher Building Residential Investor Presentation | © December 2015
Steve Evans – Chief Operating Officer, HousingFor
per
sona
l use
onl
y

Fletcher Building Residential Investor Presentation | © December 201516
Group Strategy: Our growth investment is focused on construction and distribution
• New Zealand construction - leverage capability in the core
• Australasian distribution - growth through omni-channel
• Large underperforming businesses - return to sustainable profitability, then assess long-term position
• Non-core and disadvantaged manufacturing businesses -position for divestment, especially where business is worth more to another
• L&P - unlock earnings potential of leading global business
• Integrated concrete NZ - develop supply chain and successor resource
• Advantaged manufacturing businesses - protect position, leverage channels & customers, develop product & service innovation, drive efficiency
AttractiveHold
Invest for Growth
Prove or Position for DivestmentFor
per
sona
l use
onl
y
Fletcher Building Residential Investor Presentation | © December 201517
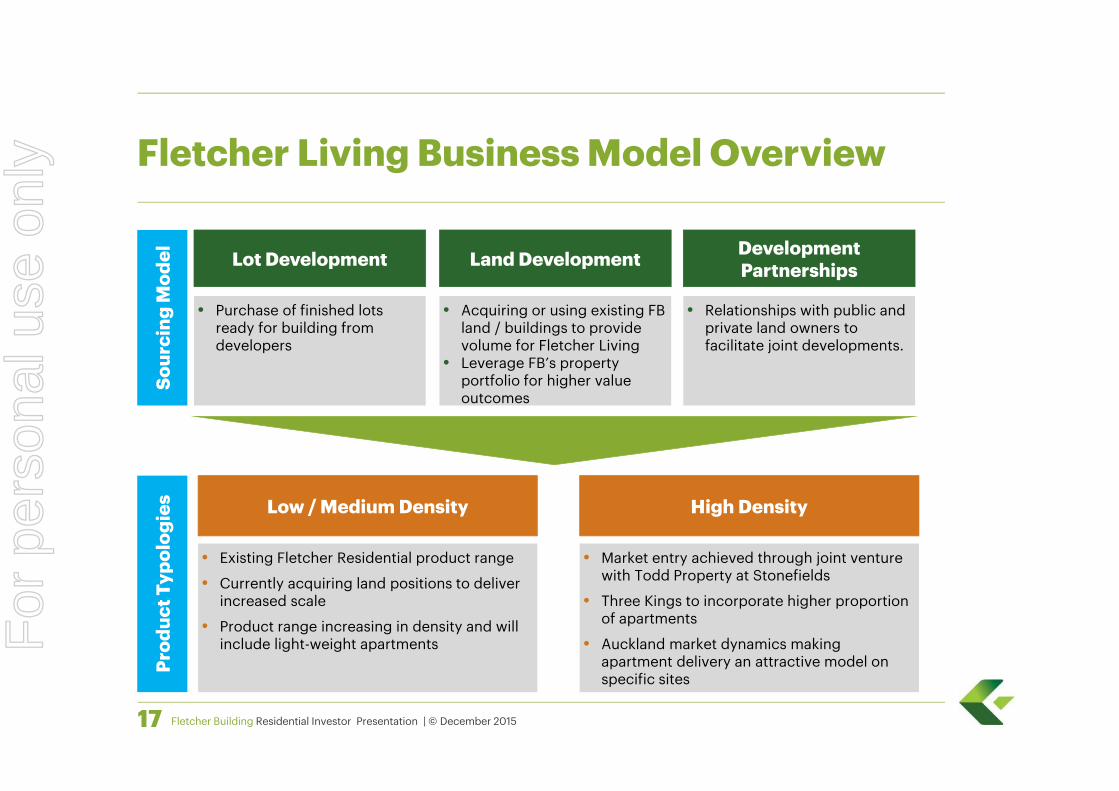
Fletcher Living Business Model Overview
Low / Medium Density High Density
• Existing Fletcher Residential product range
• Currently acquiring land positions to deliver increased scale
• Product range increasing in density and will include light-weight apartments
• Market entry achieved through joint venture with Todd Property at Stonefields
• Three Kings to incorporate higher proportion of apartments
• Auckland market dynamics making apartment delivery an attractive model on specific sites
Development PartnershipsLand DevelopmentLot Development
• Relationships with public and private land owners to facilitate joint developments.
• Acquiring or using existing FB land / buildings to provide volume for Fletcher Living
• Leverage FB’s property portfolio for higher value outcomes
• Purchase of finished lots ready for building from developers
Prod
uct T
ypol
ogie
sSo
urci
ng M
odel
For
per
sona
l use
onl
y
Fletcher Building Residential Investor Presentation | © December 201518
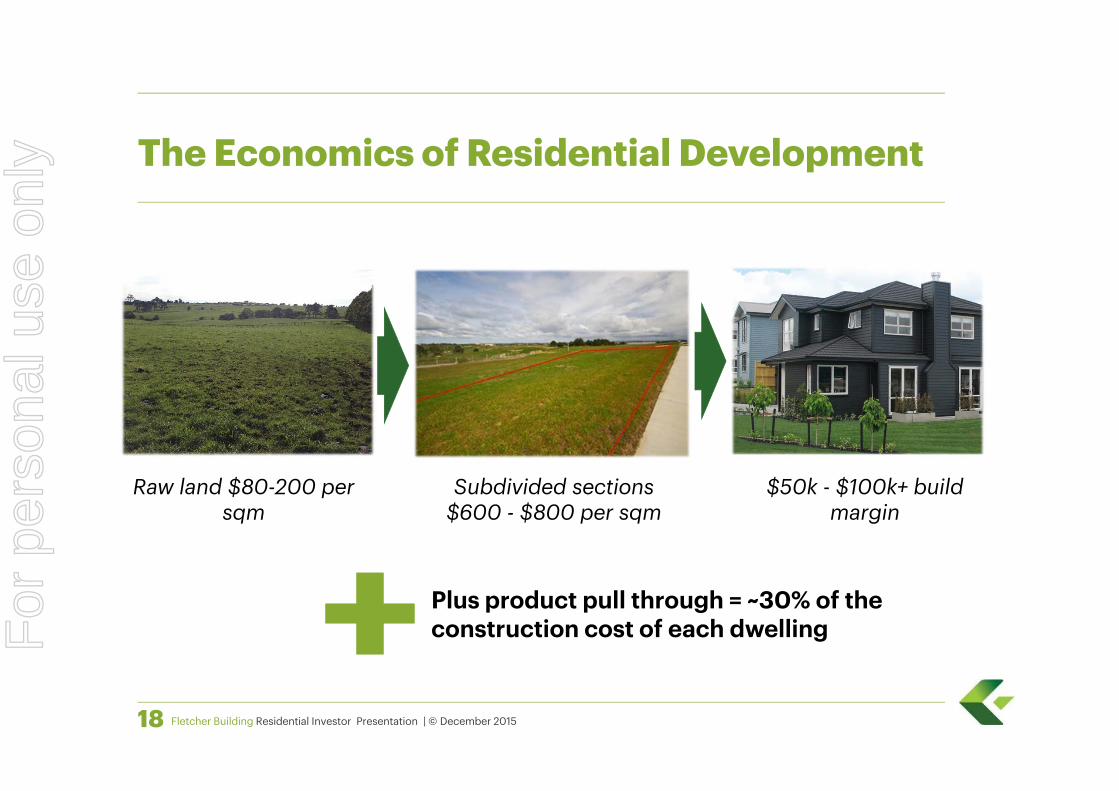
The Economics of Residential Development
Raw land $80-200 per sqm
Subdivided sections $600 - $800 per sqm
Plus product pull through = ~30% of the construction cost of each dwelling
$50k - $100k+ build margin
For
per
sona
l use
onl
y
Fletcher Building Residential Investor Presentation | © December 201519
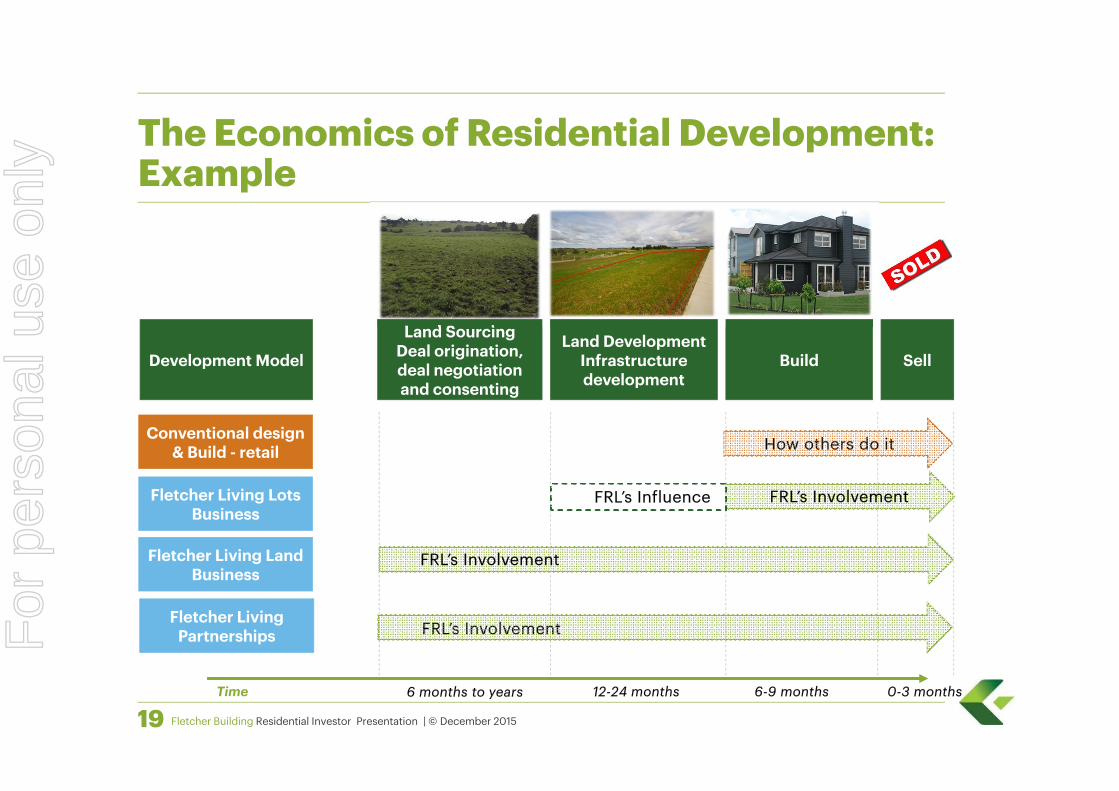
The Economics of Residential Development:Example
Conventional design & Build - retail
Fletcher Living Partnerships
Development Model
Land SourcingDeal origination, deal negotiation and consenting
Land DevelopmentInfrastructure development
Build Sell
FRL’s Involvement
FRL’s InfluenceFletcher Living Lots Business
Fletcher Living Land Business
FRL’s Involvement
How others do it
FRL’s Involvement
Time 6 months to years 12-24 months 6-9 months 0-3 months
For
per
sona
l use
onl
y
Fletcher Building Residential Investor Presentation | © December 201520
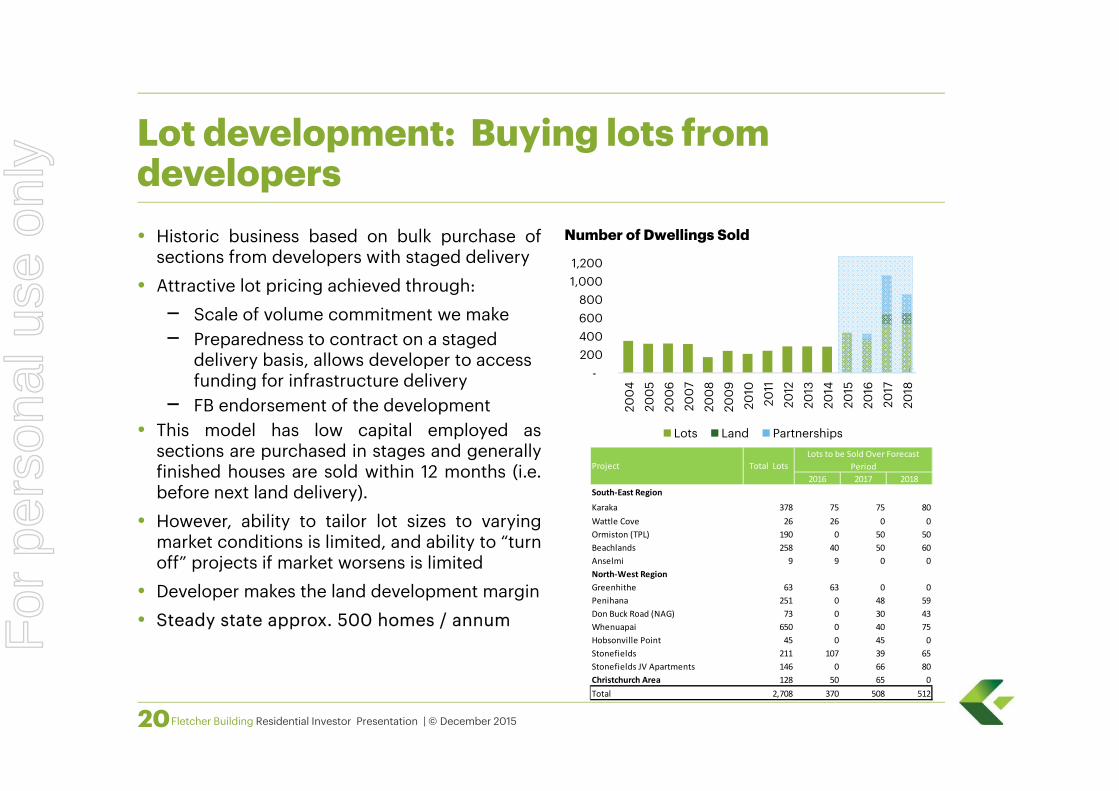
Lot development: Buying lots from developers
2016 2017 2018South‐East Region
Karaka 378 75 75 80Wattle Cove 26 26 0 0Ormiston (TPL) 190 0 50 50Beachlands 258 40 50 60Anselmi 9 9 0 0North‐West RegionGreenhithe 63 63 0 0Penihana 251 0 48 59Don Buck Road (NAG) 73 0 30 43Whenuapai 650 0 40 75Hobsonville Point 45 0 45 0Stonefields 211 107 39 65Stonefields JV Apartments 146 0 66 80Christchurch Area 128 50 65 0Total 2,708 370 508 512
Total Lots ProjectLots to be Sold Over Forecast
Period
• Historic business based on bulk purchase ofsections from developers with staged delivery
• Attractive lot pricing achieved through:– Scale of volume commitment we make– Preparedness to contract on a staged
delivery basis, allows developer to access funding for infrastructure delivery
– FB endorsement of the development• This model has low capital employed as
sections are purchased in stages and generallyfinished houses are sold within 12 months (i.e.before next land delivery).
• However, ability to tailor lot sizes to varyingmarket conditions is limited, and ability to “turnoff” projects if market worsens is limited
• Developer makes the land development margin• Steady state approx. 500 homes / annum
- 200 400 600 800
1,000 1,200
200
420
05
200
620
07
200
820
09
2010
2011
2012
2013
2014
2015
2016
2017
2018
Number of Dwellings Sold
Lots Land Partnerships
For
per
sona
l use
onl
y
Fletcher Building Residential Investor Presentation | © December 201521
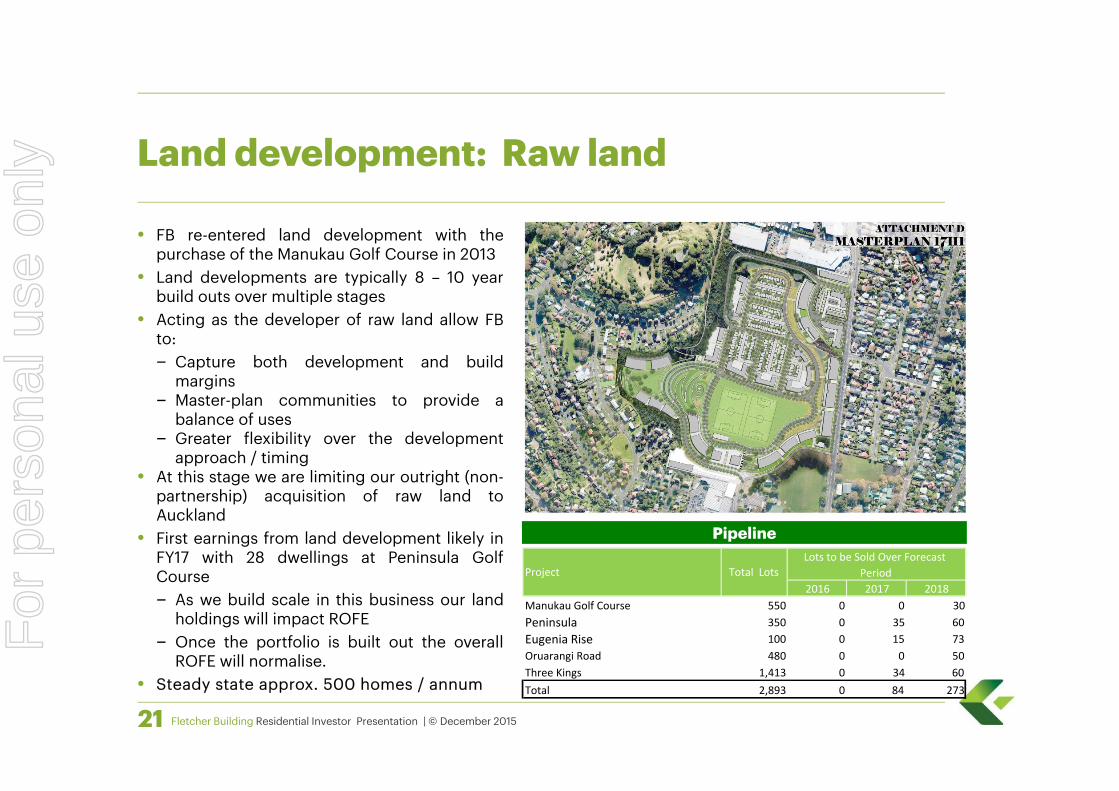
Land development: Raw land
Pipeline
• FB re-entered land development with thepurchase of the Manukau Golf Course in 2013
• Land developments are typically 8 – 10 yearbuild outs over multiple stages
• Acting as the developer of raw land allow FBto:– Capture both development and build
margins– Master-plan communities to provide a
balance of uses– Greater flexibility over the development
approach / timing• At this stage we are limiting our outright (non-
partnership) acquisition of raw land toAuckland
• First earnings from land development likely inFY17 with 28 dwellings at Peninsula GolfCourse– As we build scale in this business our land
holdings will impact ROFE– Once the portfolio is built out the overall
ROFE will normalise.• Steady state approx. 500 homes / annum
2016 2017 2018Manukau Golf Course 550 0 0 30Peninsula 350 0 35 60Eugenia Rise 100 0 15 73Oruarangi Road 480 0 0 50Three Kings 1,413 0 34 60Total 2,893 0 84 273
Total Lots ProjectLots to be Sold Over Forecast
Period
For
per
sona
l use
onl
y
Fletcher Building Residential Investor Presentation | © December 201522
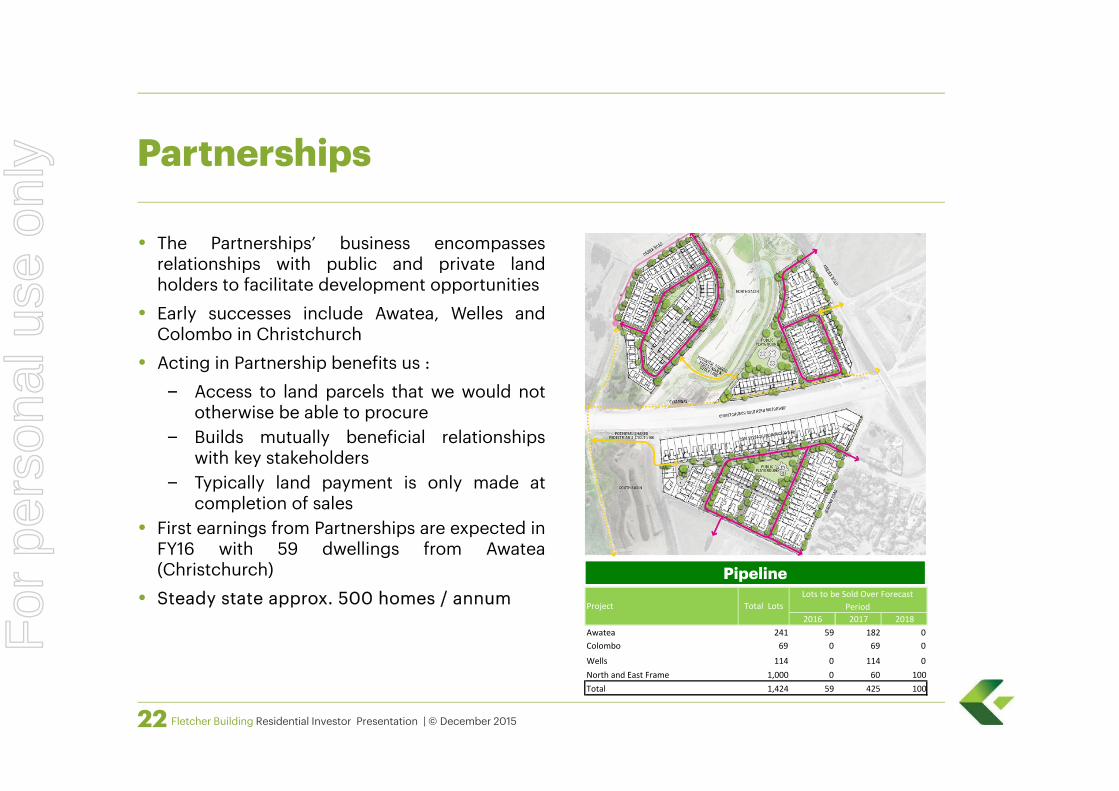
Partnerships
• The Partnerships’ business encompassesrelationships with public and private landholders to facilitate development opportunities
• Early successes include Awatea, Welles andColombo in Christchurch
• Acting in Partnership benefits us :– Access to land parcels that we would not
otherwise be able to procure– Builds mutually beneficial relationships
with key stakeholders– Typically land payment is only made at
completion of sales• First earnings from Partnerships are expected in
FY16 with 59 dwellings from Awatea(Christchurch)
• Steady state approx. 500 homes / annumPipeline
2016 2017 2018Awatea 241 59 182 0Colombo 69 0 69 0
Wells 114 0 114 0North and East Frame 1,000 0 60 100Total 1,424 59 425 100
Total Lots ProjectLots to be Sold Over Forecast
Period
For
per
sona
l use
onl
y
Fletcher Building Residential Investor Presentation | © December 201523
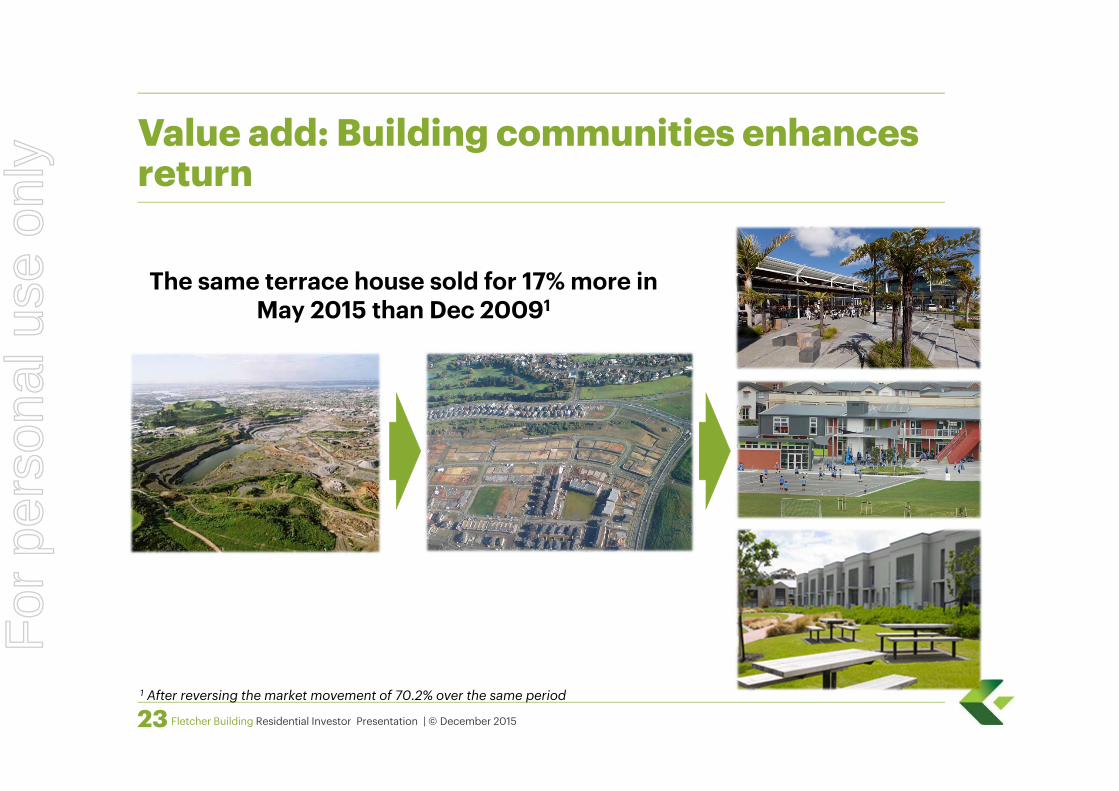
Value add: Building communities enhances return
The same terrace house sold for 17% more in May 2015 than Dec 20091
1 After reversing the market movement of 70.2% over the same period
For
per
sona
l use
onl
y
Fletcher Building Residential Investor Presentation | © December 201524
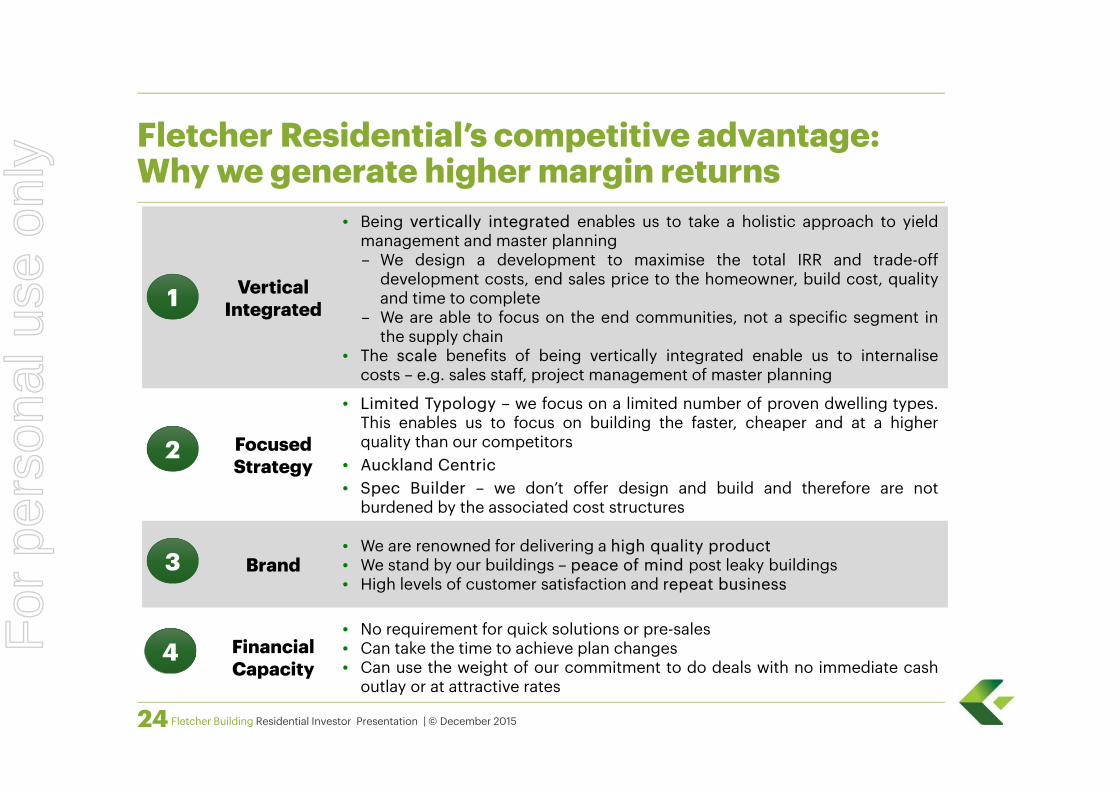
Fletcher Residential’s competitive advantage: Why we generate higher margin returns
VerticalIntegrated
• Being vertically integrated enables us to take a holistic approach to yieldmanagement and master planning– We design a development to maximise the total IRR and trade-off
development costs, end sales price to the homeowner, build cost, qualityand time to complete
– We are able to focus on the end communities, not a specific segment inthe supply chain
• The scale benefits of being vertically integrated enable us to internalisecosts – e.g. sales staff, project management of master planning
Focused Strategy
• Limited Typology – we focus on a limited number of proven dwelling types.This enables us to focus on building the faster, cheaper and at a higherquality than our competitors
• Auckland Centric• Spec Builder – we don’t offer design and build and therefore are not
burdened by the associated cost structures
Brand• We are renowned for delivering a high quality product• We stand by our buildings – peace of mind post leaky buildings• High levels of customer satisfaction and repeat business
FinancialCapacity
• No requirement for quick solutions or pre-sales• Can take the time to achieve plan changes• Can use the weight of our commitment to do deals with no immediate cash
outlay or at attractive rates
1
2
3
4For
per
sona
l use
onl
y
Fletcher Building Residential Investor Presentation | © December 201525
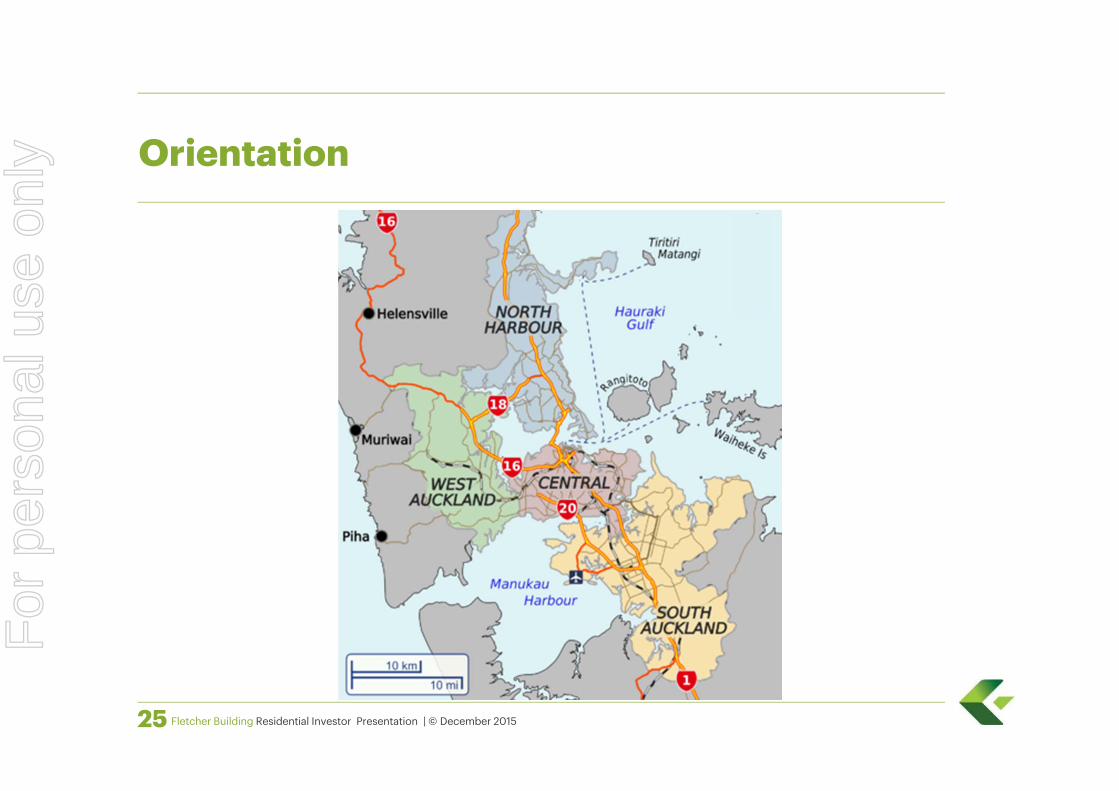
Orientation
For
per
sona
l use
onl
y
Fletcher Building Residential Investor Presentation | © December 201526
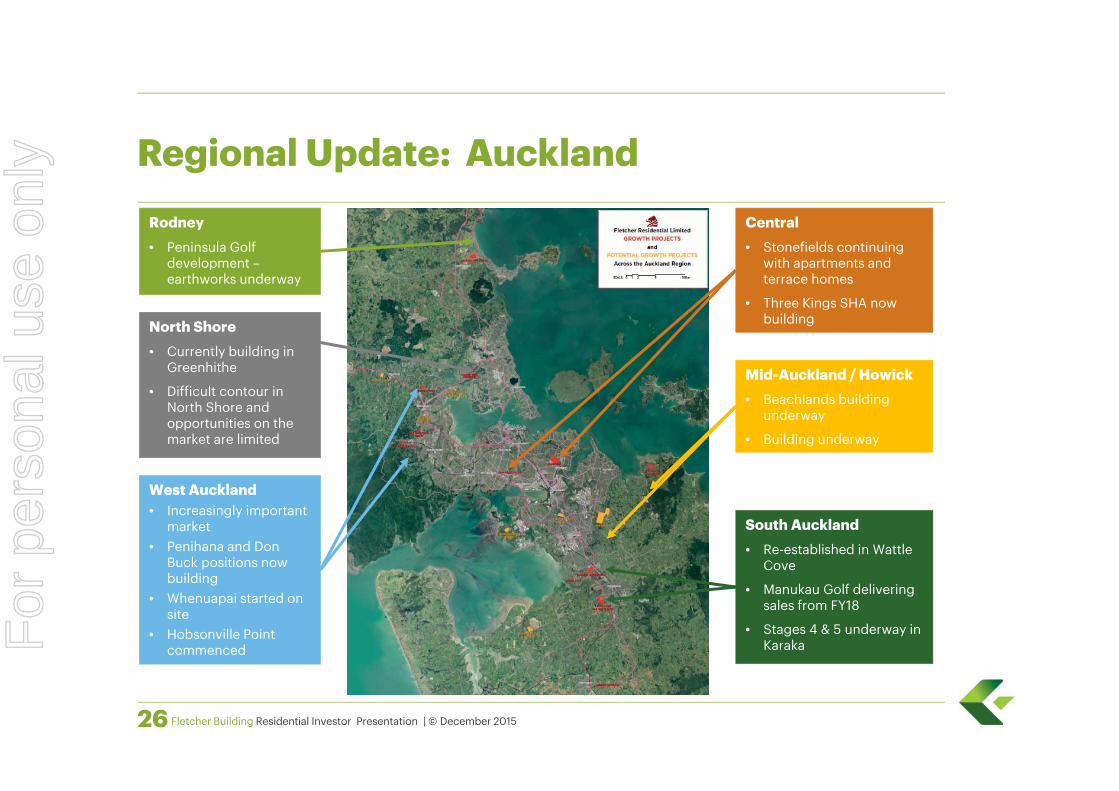
Regional Update: AucklandRodney• Peninsula Golf
development –earthworks underway
North Shore• Currently building in
Greenhithe
• Difficult contour in North Shore and opportunities on the market are limited
West Auckland• Increasingly important
market• Penihana and Don
Buck positions now building
• Whenuapai started on site
• Hobsonville Point commenced
Central• Stonefields continuing
with apartments and terrace homes
• Three Kings SHA now building
South Auckland• Re-established in Wattle
Cove
• Manukau Golf delivering sales from FY18
• Stages 4 & 5 underway in Karaka
Mid-Auckland / Howick• Beachlands building
underway
• Building underway
For
per
sona
l use
onl
y
Fletcher Building Residential Investor Presentation | © December 201527
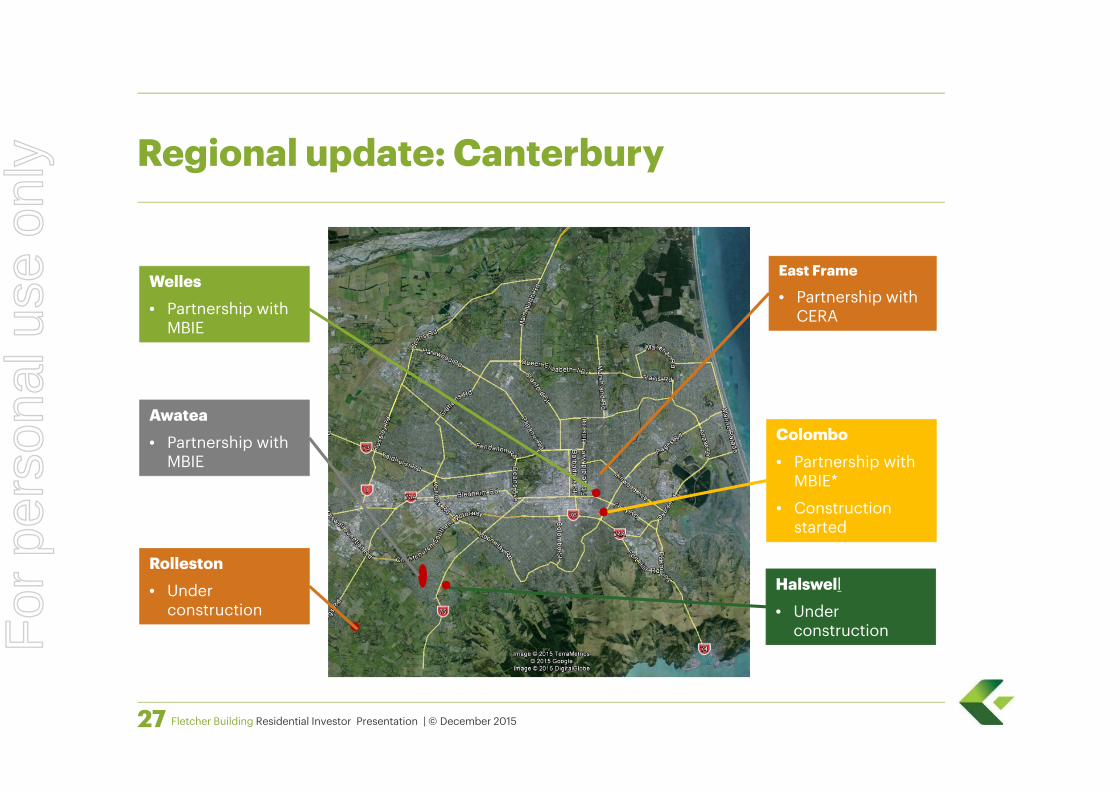
Regional update: Canterbury
Welles• Partnership with
MBIE
Awatea• Partnership with
MBIE
Colombo• Partnership with
MBIE*
• Construction started
Halswell• Under
construction
Rolleston• Under
construction
East Frame
• Partnership with CERA
For
per
sona
l use
onl
y
Fletcher Building Residential Investor Presentation | © December 201528
Some of our current developments
For
per
sona
l use
onl
y
Fletcher Building Residential Investor Presentation | © December 201529
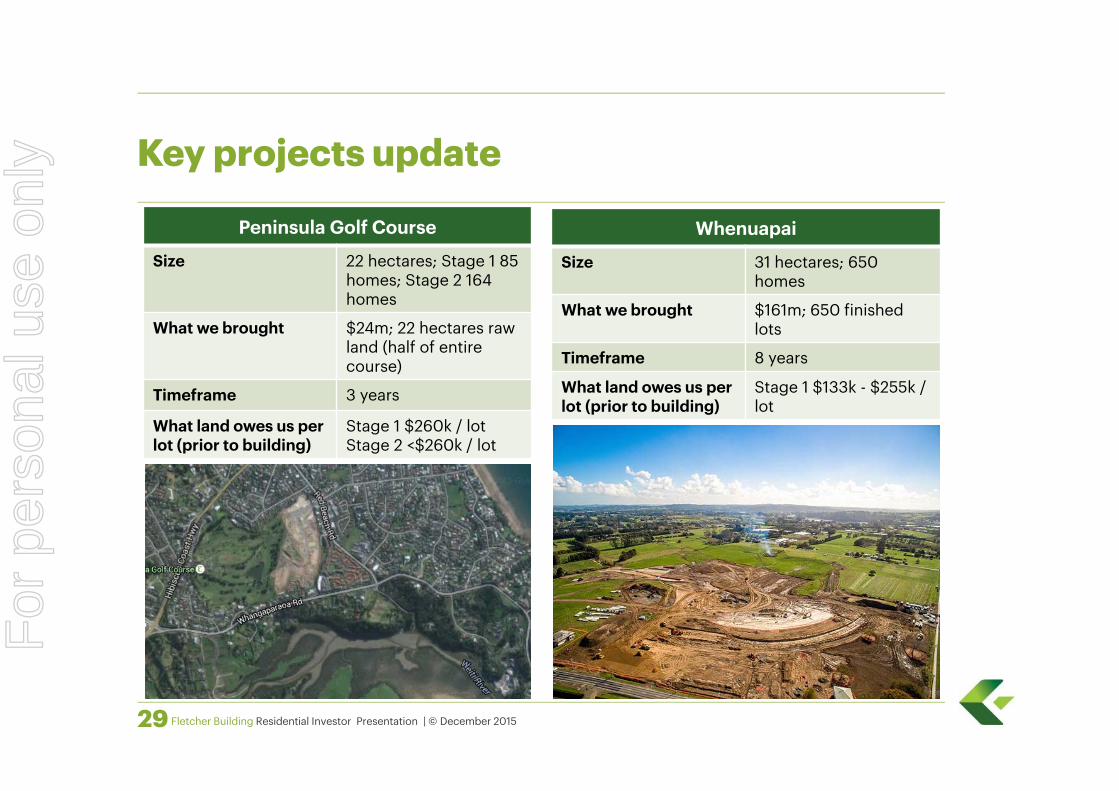
Key projects update
Peninsula Golf Course
Size 22 hectares; Stage 1 85 homes; Stage 2 164 homes
What we brought $24m; 22 hectares raw land (half of entire course)
Timeframe 3 years
What land owes us per lot (prior to building)
Stage 1 $260k / lot Stage 2 <$260k / lot
Whenuapai
Size 31 hectares; 650 homes
What we brought $161m; 650 finished lots
Timeframe 8 years
What land owes us per lot (prior to building)
Stage 1 $133k - $255k / lot
For
per
sona
l use
onl
y
Fletcher Building Residential Investor Presentation | © December 201530
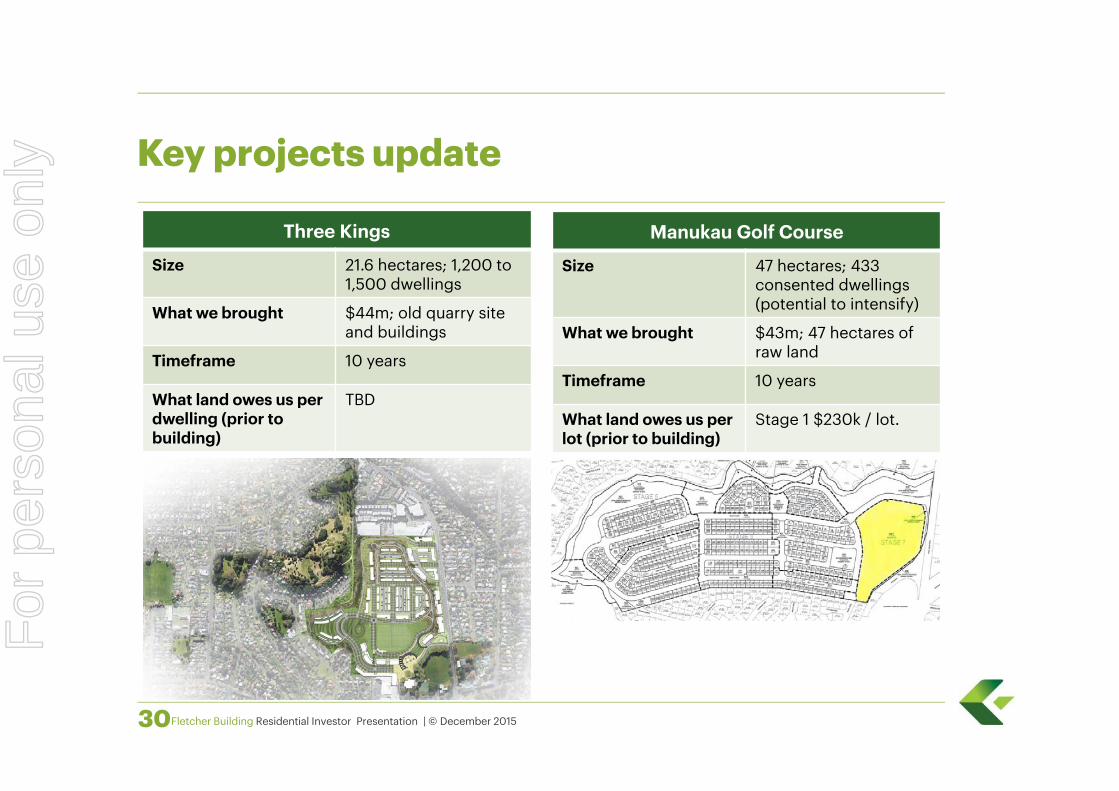
Key projects update
Manukau Golf Course
Size 47 hectares; 433 consented dwellings (potential to intensify)
What we brought $43m; 47 hectares of raw land
Timeframe 10 years
What land owes us per lot (prior to building)
Stage 1 $230k / lot.
Three Kings
Size 21.6 hectares; 1,200 to 1,500 dwellings
What we brought $44m; old quarry site and buildings
Timeframe 10 years
What land owes us per dwelling (prior to building)
TBD
For
per
sona
l use
onl
y

Fletcher Building Residential Investor Presentation | © December 201531
Key projects update
East FrameSize Area, Number of Homes
What we brought $, undeveloped land
Timeframe 10 years
Risk Management • Land settlementcontemporaneous with sale
• No requirement to start subsequent lot until previous lot sold
For
per
sona
l use
onl
y
Fletcher Building Residential Investor Presentation | © December 201532
For
per
sona
l use
onl
y

Fletcher Building Residential Investor Presentation | © December 201533
The wider benefits for the group
For
per
sona
l use
onl
y
Fletcher Building Residential Investor Presentation | © December 201534
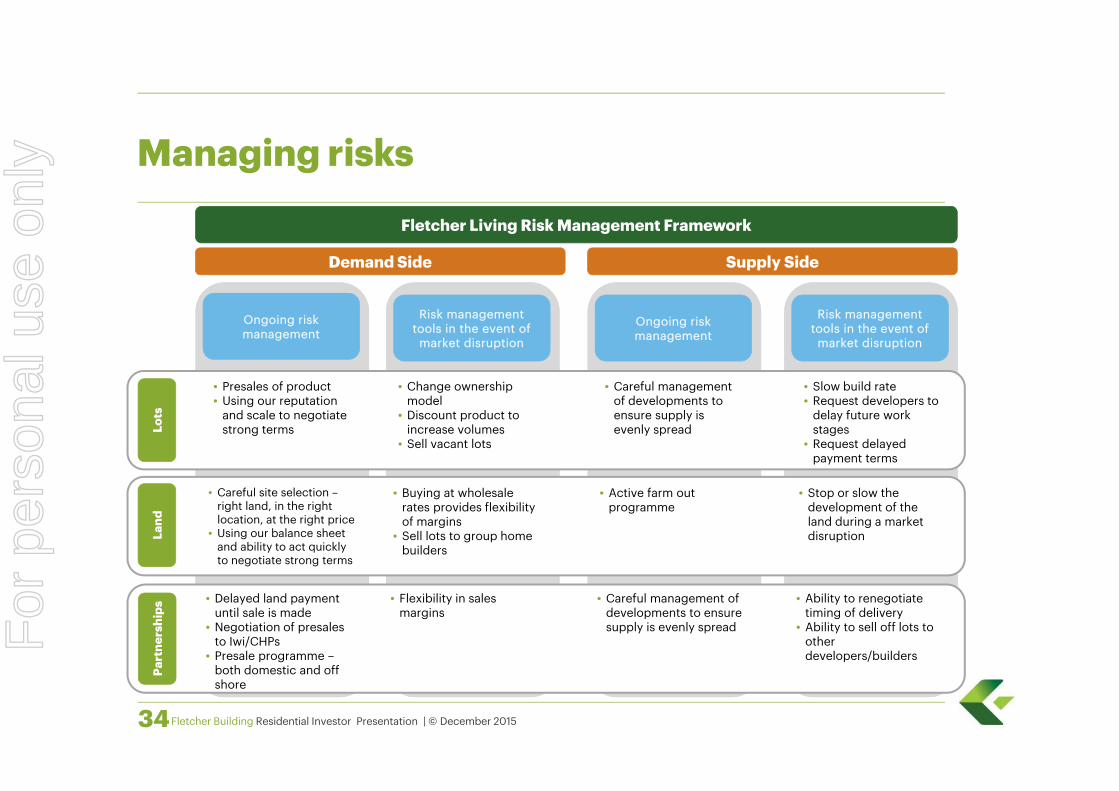
Managing risks
Risk management tools in the event of
market disruption
Fletcher Living Risk Management Framework
Demand Side Supply Side
Ongoing risk management
Risk management tools in the event of
market disruption
Ongoing risk management
Lots
Land
Part
ners
hips
• Presales of product • Using our reputation
and scale to negotiate strong terms
• Change ownership model
• Discount product to increase volumes
• Sell vacant lots
• Careful management of developments to ensure supply is evenly spread
• Slow build rate• Request developers to
delay future work stages
• Request delayed payment terms
• Careful site selection –right land, in the right location, at the right price
• Using our balance sheet and ability to act quickly to negotiate strong terms
• Buying at wholesale rates provides flexibility of margins
• Sell lots to group home builders
• Active farm out programme
• Stop or slow the development of the land during a market disruption
• Delayed land payment until sale is made
• Negotiation of presales to Iwi/CHPs
• Presale programme –both domestic and off shore
• Flexibility in sales margins
• Careful management of developments to ensure supply is evenly spread
• Ability to renegotiate timing of delivery
• Ability to sell off lots to other developers/builders
For
per
sona
l use
onl
y
Fletcher Building Residential Investor Presentation | © December 2015
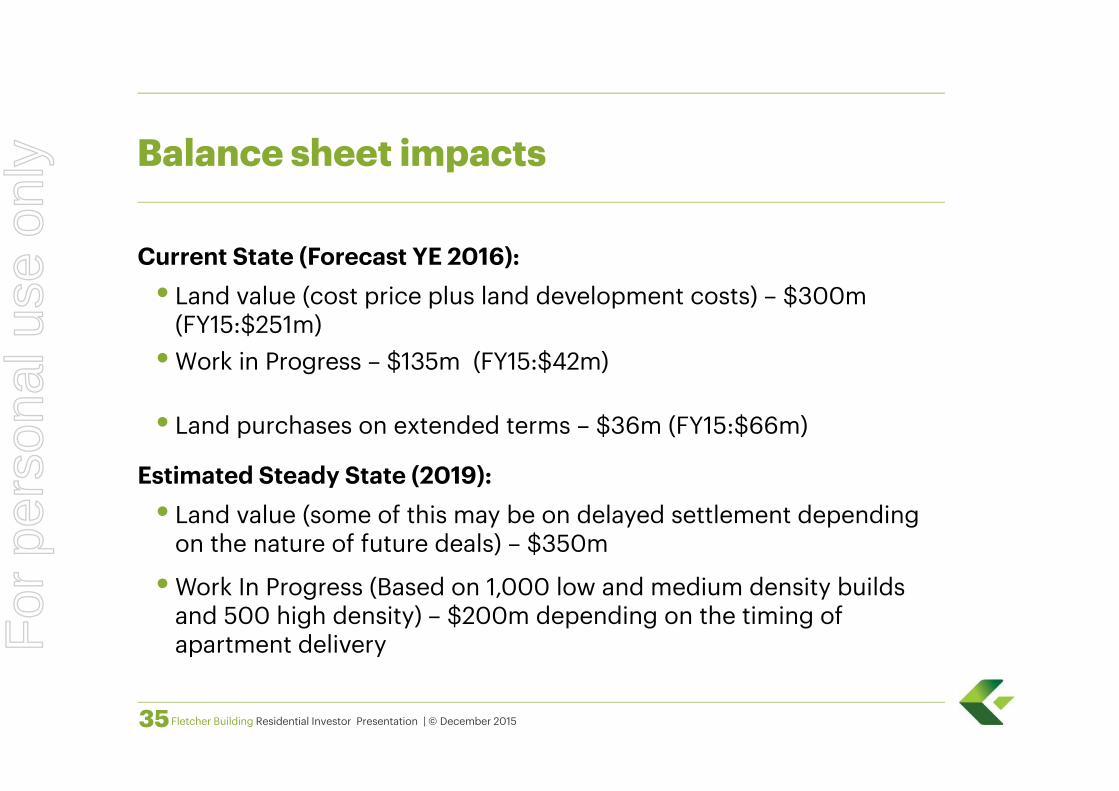
Current State (Forecast YE 2016):• Land value (cost price plus land development costs) – $300m
(FY15:$251m)• Work in Progress – $135m (FY15:$42m)
• Land purchases on extended terms – $36m (FY15:$66m)
Estimated Steady State (2019):• Land value (some of this may be on delayed settlement depending
on the nature of future deals) – $350m
• Work In Progress (Based on 1,000 low and medium density buildsand 500 high density) – $200m depending on the timing ofapartment delivery
35
Balance sheet impacts
For
per
sona
l use
onl
y

Appendix: Market Overview
Fletcher Building Residential Investor Presentation | © December 2015
For
per
sona
l use
onl
y

Fletcher Building Residential Investor Presentation | © December 201537
Market Overview: Auckland
(5,000)
0
5,000
10,000
15,000
20,000
25,000
30,000
35,000
1,000
1,100
1,200
1,300
1,400
1,500
1,600
2000 2002 2004 2006 2008 2010 2012 2014
Dw
ellin
gs
Popu
latio
n (,0
00
)
Dwellings needed to keep pace with population growth Estimated dwellings builtCumulative shortage of dwellings Estimated Auckland Population
On current estimates this will take 10-30 years to reverse
There is a structural shortage of housing in Auckland…
For
per
sona
l use
onl
y
Fletcher Building Residential Investor Presentation | © December 201538
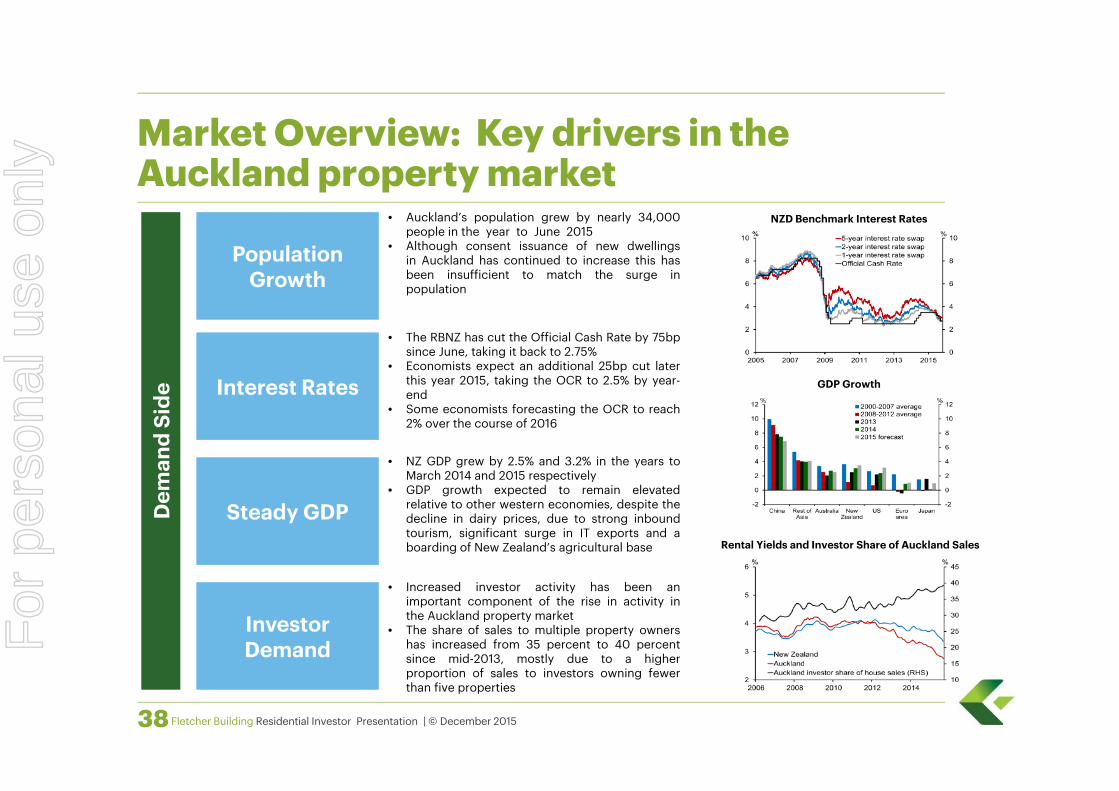
Market Overview: Key drivers in the Auckland property market
Dem
and
Side
Population Growth
Interest Rates
Steady GDP
Investor Demand
Rental Yields and Investor Share of Auckland Sales
GDP Growth
NZD Benchmark Interest Rates• Auckland’s population grew by nearly 34,000people in the year to June 2015
• Although consent issuance of new dwellingsin Auckland has continued to increase this hasbeen insufficient to match the surge inpopulation
• The RBNZ has cut the Official Cash Rate by 75bpsince June, taking it back to 2.75%
• Economists expect an additional 25bp cut laterthis year 2015, taking the OCR to 2.5% by year-end
• Some economists forecasting the OCR to reach2% over the course of 2016
• NZ GDP grew by 2.5% and 3.2% in the years toMarch 2014 and 2015 respectively
• GDP growth expected to remain elevatedrelative to other western economies, despite thedecline in dairy prices, due to strong inboundtourism, significant surge in IT exports and aboarding of New Zealand’s agricultural base
• Increased investor activity has been animportant component of the rise in activity inthe Auckland property market
• The share of sales to multiple property ownershas increased from 35 percent to 40 percentsince mid-2013, mostly due to a higherproportion of sales to investors owning fewerthan five properties
For
per
sona
l use
onl
y

Fletcher Building Residential Investor Presentation | © December 201539
Market Overview: Key drivers in the Auckland property market
Building Consents
Land Availability
Policy Responses
Supp
ly S
ide
Auckland Migration & Consent Issuance
• In late 2013, the Reserve Bank introduced a 10% speed limit on all mortgage lending with aloan-to-value ratio (LVR) of greater than 80%. The share of mortgage debt with an LVR of morethan 80% has declined from 21% to 14%
• Additional changes to the LVR speed limit came into effect on 1 November, and include newrestrictions on Auckland investor lending. Under the new policy, no more than 5% of Aucklandinvestor lending by registered banks can be at an LVR exceeding 70%
• In October the Government introduced a bright line test for the taxing of capital gains onresidential property which is sold within two years. They also introduced requirements forforeign buyers to provide an IRD number when purchasing properties
• The Auckland Housing Accord was signed on 3 October 2013 by Housing Minister Dr NickSmith and Auckland Mayor Len Brown. The Accord is a three year agreement to urgentlyincrease the supply and affordability of housing in Auckland. The Accord sets a target of 9,000additional residential houses being consented for in the first year, 13,000 in the second year,and 17,000 in the third year
• Nine months into the second year of the Auckland Housing Accord the net number of newdwellings and sections (8,861) is 68% of the target of 13,000 and with just 3 months of the yearto go, the target may not be met
• A programme of work is also being conducted by MBIE to identify Crown-owned land inAuckland that is suitable and available for housing development, and to facilitate theconstruction of dwellings to increase housing supply. MBIE is currently running a procurementprocess for development partners – Fletcher Living is participating in this process
• Dwelling consents are above the historical average inboth Auckland and Canterbury but remain below thelevel required to meet demand
• Since the Auckland Housing Accord took effect inOctober 2013, the annual increase in consenteddwellings to the same month in the previous year inAuckland, has averaged 28.5%, peaking in April 2014when dwelling consents in the year to April 2014exceeded dwelling consents in the year to April 2013 byalmost 41%
For
per
sona
l use
onl
y
Fletcher Building Residential Investor Presentation | © December 201540
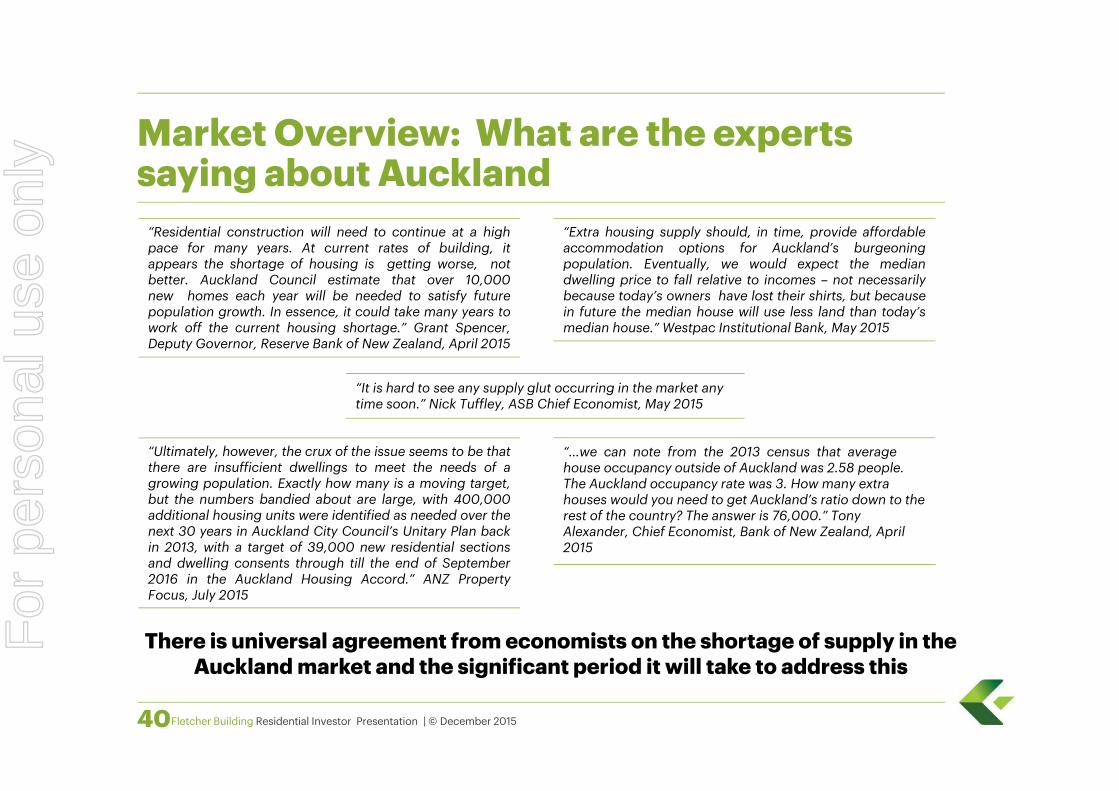
Market Overview: What are the experts saying about Auckland
“Residential construction will need to continue at a highpace for many years. At current rates of building, itappears the shortage of housing is getting worse, notbetter. Auckland Council estimate that over 10,000new homes each year will be needed to satisfy futurepopulation growth. In essence, it could take many years towork off the current housing shortage.” Grant Spencer,Deputy Governor, Reserve Bank of New Zealand, April 2015
“Extra housing supply should, in time, provide affordableaccommodation options for Auckland’s burgeoningpopulation. Eventually, we would expect the mediandwelling price to fall relative to incomes – not necessarilybecause today’s owners have lost their shirts, but becausein future the median house will use less land than today’smedian house.” Westpac Institutional Bank, May 2015
“Ultimately, however, the crux of the issue seems to be thatthere are insufficient dwellings to meet the needs of agrowing population. Exactly how many is a moving target,but the numbers bandied about are large, with 400,000additional housing units were identified as needed over thenext 30 years in Auckland City Council’s Unitary Plan backin 2013, with a target of 39,000 new residential sectionsand dwelling consents through till the end of September2016 in the Auckland Housing Accord.” ANZ PropertyFocus, July 2015
“It is hard to see any supply glut occurring in the market any time soon.” Nick Tuffley, ASB Chief Economist, May 2015
There is universal agreement from economists on the shortage of supply in the Auckland market and the significant period it will take to address this
“…we can note from the 2013 census that average house occupancy outside of Auckland was 2.58 people. The Auckland occupancy rate was 3. How many extra houses would you need to get Auckland’s ratio down to the rest of the country? The answer is 76,000.” Tony Alexander, Chief Economist, Bank of New Zealand, April 2015
For
per
sona
l use
onl
y