Embed Size (px)
Citation preview
The Florida Legislature
Office of Economic and
Demographic Research
850.487.1402
http://edr.state.fl.us
Presented by:
Florida:Long-Range Financial Outlook
December 15, 2016
Contains updated information indicated in “Red.”
Economy Recovering
Florida growth rates are generally returning to more typical levels and continue
to show progress. The drags—particularly construction—are more persistent
than past events, but the strength in tourism is largely compensating for this.
Overall, it will take another year to climb completely out of the hole left by the
recession. In the various forecasts, normalcy has been largely achieved by the
end of FY 2016-17. Overall...
The recovery in the national economy is near completion on all fronts. While most
areas of commercial and consumer credit have significantly strengthened – residential
credit for home purchases still remains somewhat difficult for consumers to access
with a weighted average credit score of 731 and a LTV of 78 percent on all closed
loans in September. Student loans and recently undertaken auto debts appear to be
affecting the ability to qualify for residential credit.
By the close of the 2015-16 fiscal year, most measures of the Florida economy had
returned to or surpassed their prior peaks.
All personal income metrics, about half of the employment sectors and all of the tourism counts
had exceeded their prior peaks.
Still other measures were posting solid year-over-year improvements, even if they were not yet
back to peak performance levels.
In the current forecast, none of the key construction metrics show a return to peak levels until
2020-21.1

Upside Risks...Construction...
The “shadow inventory” of homes that are in foreclosure or carry
delinquent or defaulted mortgages may contain a significant number of
“ghost” homes that are distressed beyond realistic use, in that they
have not been physically maintained or are located in distressed
pockets that will not come back in a reasonable timeframe. This means
that the supply has become two-tiered – viable homes and seriously
distressed homes.
To the extent that the number of viable homes is limited, new
construction may come back quicker than expected.
More Buyers...
In 2015, the first wave of homeowners affected by foreclosures and
short sales went past the seven-year window generally needed to
repair credit.
While there is no evidence yet, atypical household formation will
ultimately unwind—driving up the demand for housing.
2
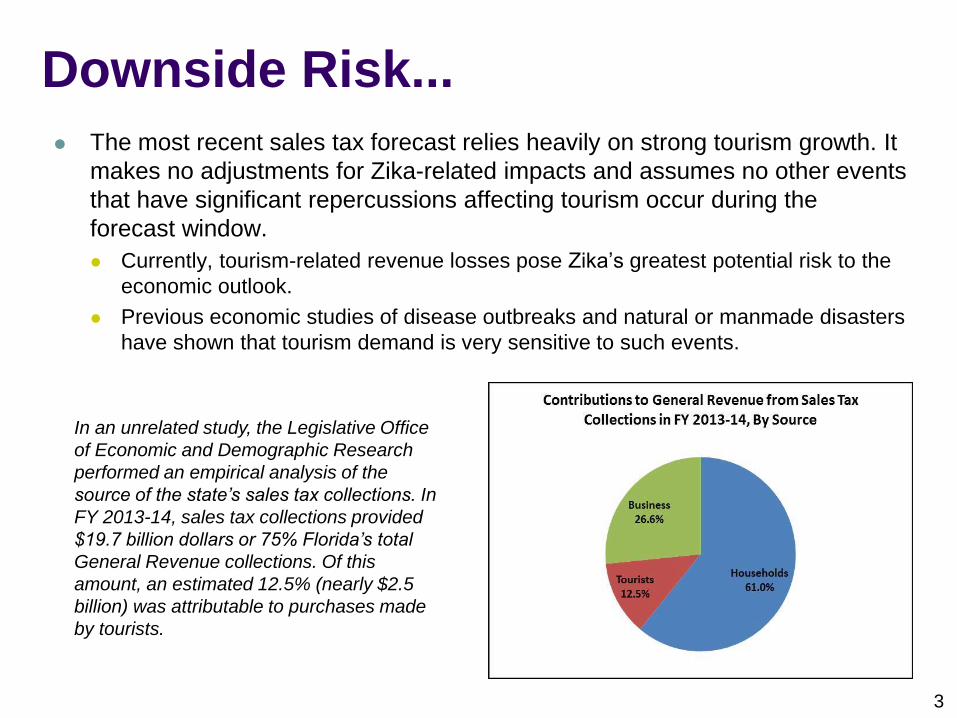
Downside Risk...
The most recent sales tax forecast relies heavily on strong tourism growth. It
makes no adjustments for Zika-related impacts and assumes no other events
that have significant repercussions affecting tourism occur during the
forecast window.
Currently, tourism-related revenue losses pose Zika’s greatest potential risk to the
economic outlook.
Previous economic studies of disease outbreaks and natural or manmade disasters
have shown that tourism demand is very sensitive to such events.
In an unrelated study, the Legislative Office
of Economic and Demographic Research
performed an empirical analysis of the
source of the state’s sales tax collections. In
FY 2013-14, sales tax collections provided
$19.7 billion dollars or 75% Florida’s total
General Revenue collections. Of this
amount, an estimated 12.5% (nearly $2.5
billion) was attributable to purchases made
by tourists.
3

New General Revenue ForecastIn FY 2014-15, General
Revenue collections
surpassed the prior peak in
2005-06 for the first time since
then. After slowing in FY
2015-16, growth is expected
to pick up during the 2016-17
through 2019-20 time period
as the construction industry
recovers, slowly shifting down
to long-run growth of 3.5%.
4
Fiscal Year
Aug 2016
Forecast
Dec 2016
Forecast Difference
Incremental
Growth Growth
2005-06 27074.8 27074.8 0 8.4%
2006-07 26404.1 26404.1 0 -670.7 -2.5%
2007-08 24112.1 24112.1 0 -2292.0 -8.7%
2008-09 21025.6 21025.6 0.0 -3086.5 -12.8%
2009-10 21523.1 21523.1 0.0 497.5 2.4%
2010-11 22551.6 22551.6 0.0 1028.5 4.8%
2011-12 23618.8 23618.8 0.0 1067.2 4.7%
2012-13 25314.6 25314.6 0.0 1695.8 7.2%
2013-14 26198.0 26198.0 0.0 883.4 3.5%
2014-15 27681.1 27485.9 (195.2) 1287.9 5.7%
2015-16 28325.4 28325.4 0.0 644.3 2.3%
2016-17 29,332.8 29,452.1 119.3 1126.7 4.0%
2017-18 30,686.9 30,709.5 22.6 1257.4 4.3%
2018-19 31,948.2 31,978.9 30.7 1269.4 4.1%
2019-20 33,223.9 33,253.0 29.1 1274.1 4.0%
2020-21 34,395.1 34,465.3 70.2 1212.3 3.6%
2021-22 35,614.9 35,680.8 65.9 1215.5 3.5%
8.4%
-2.5%
-8.7%
-12.8%
2.4%
4.8% 4.7%
7.2%
3.5%
5.7%
2.3%
4.0% 4.3% 4.1% 4.0% 3.6% 3.5%
-15.0%
-10.0%
-5.0%
0.0%
5.0%
10.0%
2005-06 2006-07 2007-08 2008-09 2009-10 2010-11 2011-12 2012-13 2013-14 2014-15 2015-16 2016-17 2017-18 2018-19 2019-20 2020-21 2021-22
General Revenue Growth Rates
LR Growth:
Averages 6%
The added dollar amounts
through FY 2019-20 (totaling
$201.7 million in the column
labeled “Difference”) are
additive to the Long-Range
Financial Outlook. Because
the added money from the new
forecast is largely front-loaded,
the recurring benefit is much
smaller. It starts with FY 2017-
18 ($22.6 million); the $119.3
million in FY 2016-17 will be
treated as nonrecurring.

Total State Reserves Are Strong...
• Unallocated General Revenue, the Budget Stabilization Fund, and the Lawton Chiles Endowment
Fund are generally considered to comprise the state’s reserves.
• At the time of adoption for each of the previous five Outlooks, total state reserves have ranged from
10.7% up to 12.9% of the General Revenue estimate. For the current year, total state reserves were
projected to be $3,436.1 million or 11.6% of the General Revenue estimate for FY 2016-17.
Including the new forecast and other adjustments, the percentage has now edged up to 11.8%.
• When the Long-Range Financial Outlook was adopted in September, a projected remaining General
Revenue balance of $1.41 billion in nonrecurring dollars was assumed to be available for use in FY
2017-18.
After taking account of the new revenue forecast and adjustments for budget amendments, this
amount has increased by $70.4 million—the net benefit of adding $24.6 million from the final
closeout of FY 2015-16; adding $119.3 million from the new forecast for 2016-17; and,
subtracting $73.5 million for budget amendments.5
*Reflects the General Revenue forecast adopted by the Revenue Estimating Conference in the summer preceding the adoption of each Long-Range Financial Outlook. The Fiscal
Year 2016-17 amount includes the $400 million payment associated with the BP Settlement Agreement.
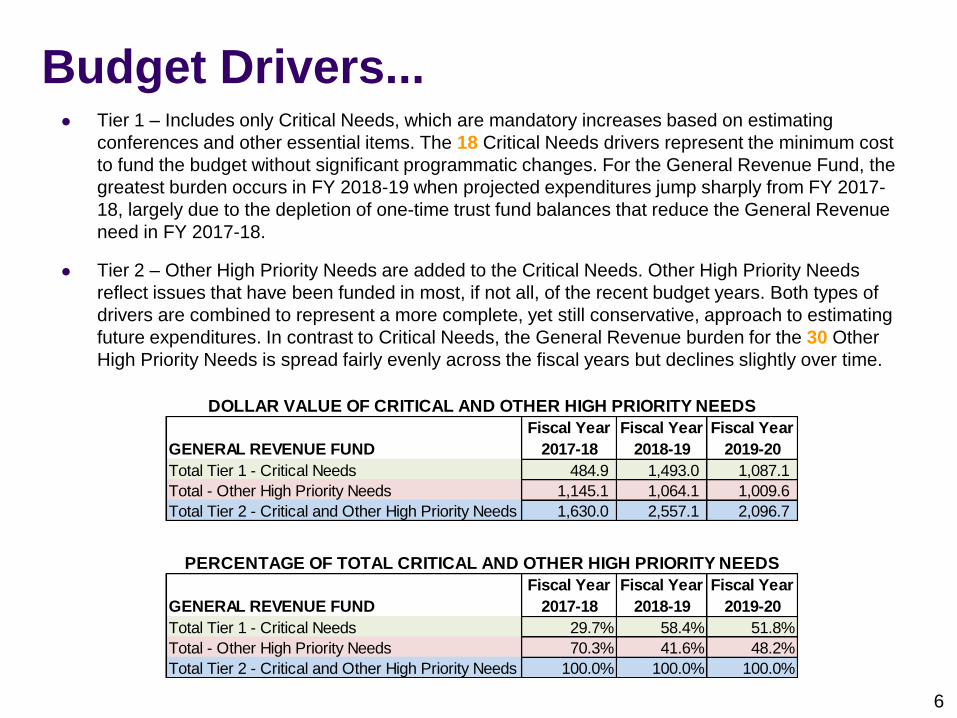
Budget Drivers... Tier 1 – Includes only Critical Needs, which are mandatory increases based on estimating
conferences and other essential items. The 18 Critical Needs drivers represent the minimum cost
to fund the budget without significant programmatic changes. For the General Revenue Fund, the
greatest burden occurs in FY 2018-19 when projected expenditures jump sharply from FY 2017-
18, largely due to the depletion of one-time trust fund balances that reduce the General Revenue
need in FY 2017-18.
Tier 2 – Other High Priority Needs are added to the Critical Needs. Other High Priority Needs
reflect issues that have been funded in most, if not all, of the recent budget years. Both types of
drivers are combined to represent a more complete, yet still conservative, approach to estimating
future expenditures. In contrast to Critical Needs, the General Revenue burden for the 30 Other
High Priority Needs is spread fairly evenly across the fiscal years but declines slightly over time.
6
GENERAL REVENUE FUND
Fiscal Year
2017-18
Fiscal Year
2018-19
Fiscal Year
2019-20
Total Tier 1 - Critical Needs 484.9 1,493.0 1,087.1
Total - Other High Priority Needs 1,145.1 1,064.1 1,009.6
Total Tier 2 - Critical and Other High Priority Needs 1,630.0 2,557.1 2,096.7
DOLLAR VALUE OF CRITICAL AND OTHER HIGH PRIORITY NEEDS
GENERAL REVENUE FUND
Fiscal Year
2017-18
Fiscal Year
2018-19
Fiscal Year
2019-20
Total Tier 1 - Critical Needs 29.7% 58.4% 51.8%
Total - Other High Priority Needs 70.3% 41.6% 48.2%
Total Tier 2 - Critical and Other High Priority Needs 100.0% 100.0% 100.0%
PERCENTAGE OF TOTAL CRITICAL AND OTHER HIGH PRIORITY NEEDS

GR Drivers by Policy Area...
About ½ of the policy areas, in particular
Administered Funds / Statewide Issues
and Natural Resources, have the largest
needs in the 1st year with a detectable
drop off in the subsequent years. Human
Services and Education have a different
pattern with greater needs in the 2nd year
of the Outlook, prior to stabilizing in the
3rd year. These two areas are most
affected by the depletion of available
trust fund balances in FY 2017-18.
7
POLICY AREAS
Fiscal Year
2017-18
Fiscal Year
2018-19
Fiscal Year
2019-20
Pre K-12 Education 362.7 393.1 328.9
Higher Education 121.1 347.5 252.9
Human Services 412.6 1,235.6 1,000.9
Criminal Justice 19.1 19.5 24.1
Judicial Branch 5.0 4.7 5.0
Transportation & Economic Development 100.1 91.4 85.0
Natural Resources 297.0 229.8 191.8
General Government 70.1 66.4 53.7
Administered Funds - Statewide Issues 242.3 169.1 154.4
Total New Issues 1,630.0 2,557.1 2,096.7

Total GR Expenditures - $10.5 Billion
Over the entire Outlook period, the combined recurring and nonrecurring drivers result in
nearly $10.5 billion of actual General Revenue expenditures on Critical and Other High
Priority Needs. Of the $10.5 billion total, nearly $1.5 billion will be spent on nonrecurring
issues, or approximately 14% of the total. The remaining $9.0 billion results from a
16.3% increase in recurring expenditures from the starting point in FY 2017-18 to the
end of the three-year period.
8

Medicaid Driver Dominates...
Although the Critical Needs driver
for the Medicaid Program is the
second largest driver in the 1st year
of the Outlook, it is the largest
driver in subsequent years,
representing 69.9% of the total
Critical Needs in FY 2018-19 and
66.1% in FY 2019-20. When
including all Critical Needs and
Other High Priority Needs, the
Medicaid program driver represents
16.5%, 40.8%, and 34.3%,
respectively, of total needs for each
year of the Outlook.
Over the three-year period covered
by the Outlook, the additional
Medicaid need each year
consumes an average of 53.0% of
the expected General Revenue
growth for that year.
9
37.1%16.5%
40.8%
34.3%
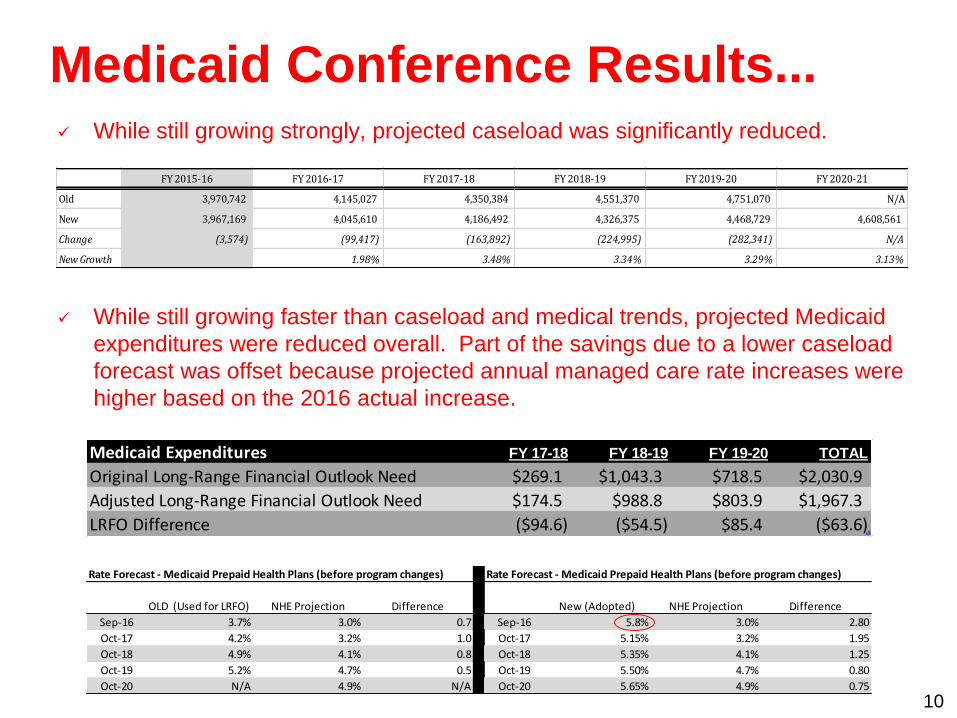
Medicaid Conference Results... While still growing strongly, projected caseload was significantly reduced.
While still growing faster than caseload and medical trends, projected Medicaid
expenditures were reduced overall. Part of the savings due to a lower caseload
forecast was offset because projected annual managed care rate increases were
higher based on the 2016 actual increase.
10
FY 2015-16 FY 2016-17 FY 2017-18 FY 2018-19 FY 2019-20 FY 2020-21
Old 3,970,742 4,145,027 4,350,384 4,551,370 4,751,070 N/A
New 3,967,169 4,045,610 4,186,492 4,326,375 4,468,729 4,608,561
Change (3,574) (99,417) (163,892) (224,995) (282,341) N/A
New Growth 1.98% 3.48% 3.34% 3.29% 3.13%
Medicaid Expenditures FY 17-18 FY 18-19 FY 19-20 TOTAL
Original Long-Range Financial Outlook Need $269.1 $1,043.3 $718.5 $2,030.9
Adjusted Long-Range Financial Outlook Need $174.5 $988.8 $803.9 $1,967.3
LRFO Difference ($94.6) ($54.5) $85.4 ($63.6)
Rate Forecast - Medicaid Prepaid Health Plans (before program changes) Rate Forecast - Medicaid Prepaid Health Plans (before program changes)
OLD (Used for LRFO) NHE Projection Difference New (Adopted) NHE Projection Difference
Sep-16 3.7% 3.0% 0.7 Sep-16 5.8% 3.0% 2.80
Oct-17 4.2% 3.2% 1.0 Oct-17 5.15% 3.2% 1.95
Oct-18 4.9% 4.1% 0.8 Oct-18 5.35% 4.1% 1.25
Oct-19 5.2% 4.7% 0.5 Oct-19 5.50% 4.7% 0.80
Oct-20 N/A 4.9% N/A Oct-20 5.65% 4.9% 0.75

PreK-12 Conference Results...
FTEs...While still growing
strongly, the number of
projected FTEs was reduced
by approximately one-half of
one percent per year.
11
Ad Valorem...Taxable value increased; however, the impact is unknown. During the 2016
Session, the Legislature made the policy decision to hold Required Local Effort (RLE) to the FY
2015-16 level. The LRFO convention is to assume that the current year’s certified millage rate
is the starting point for projected expenditures in all subsequent years. In this regard, the
statewide average millage rate was 4.638 on July 15, 2016, for Fiscal Year 2016-17. This was
used in the LRFO, allowing projected taxable value increases to feed through the plan. The
Legislature may not agree, and may instead choose to hold the level flat again. To hold the
level flat would require an additional GR infusion.
July 2016
Forecast
December 2016
Forecast LRFO Difference
2015-16 4th vs Final Calc 2,780,132.90 2,778,914.83
2016-17 Appropriated vs 3rd Calc Adj 2,807,961.85 2,801,408.03
2017-18 2,838,889.12 2,828,202.04 -10,687.08
2018-19 2,861,814.75 2,850,053.34 -11,761.41
2019-20 2,886,657.54 2,872,224.90 -14,432.64
2020-21 2,915,914.29 2,901,655.53
2021-22 2,946,955.11 2,931,889.40
July 2016 and December 2016 Forecasts
Summer Impact
Add'l GR Need
August 2016
Forecast
Growth
Rates
December 2016
Forecast
Growth
Rates
2017-18 427.60 1,876,030 5.88% 1,887,990 6.56%
2018-19 438.27 1,981,646 5.63% 1,995,651 5.70%
2019-20 446.71 2,089,006 5.42% 2,102,065 5.33%
Original Cost to Hold RLE Level Taxable Value Increased

Other Conference Results...
12
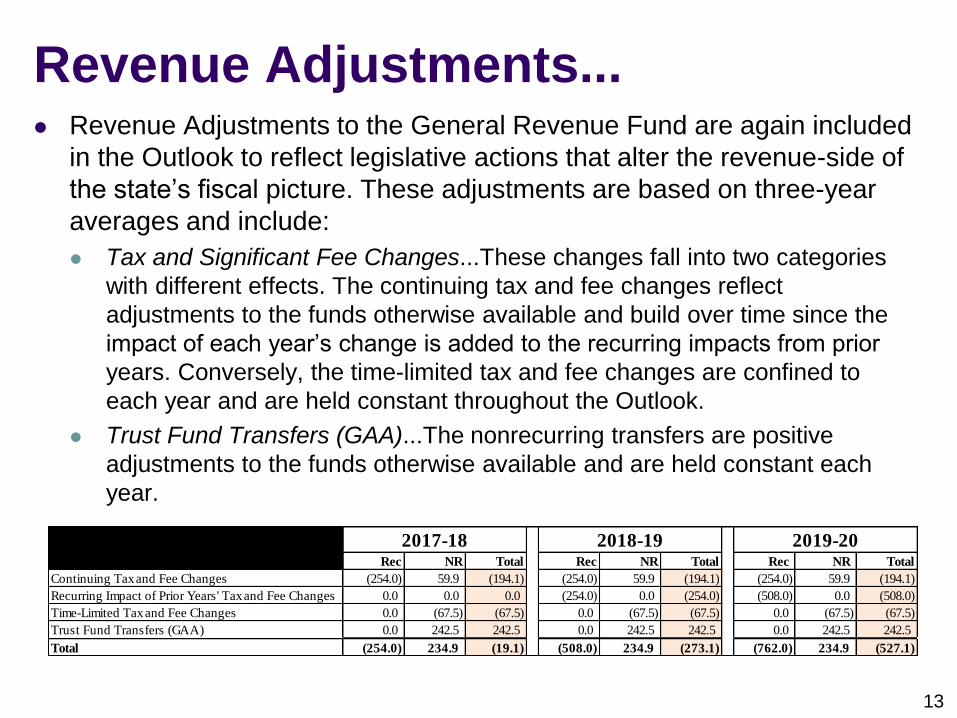
Revenue Adjustments... Revenue Adjustments to the General Revenue Fund are again included
in the Outlook to reflect legislative actions that alter the revenue-side of
the state’s fiscal picture. These adjustments are based on three-year
averages and include:
Tax and Significant Fee Changes...These changes fall into two categories
with different effects. The continuing tax and fee changes reflect
adjustments to the funds otherwise available and build over time since the
impact of each year’s change is added to the recurring impacts from prior
years. Conversely, the time-limited tax and fee changes are confined to
each year and are held constant throughout the Outlook.
Trust Fund Transfers (GAA)...The nonrecurring transfers are positive
adjustments to the funds otherwise available and are held constant each
year.
13
Rec NR Total Rec NR Total Rec NR Total
Continuing Tax and Fee Changes (254.0) 59.9 (194.1) (254.0) 59.9 (194.1) (254.0) 59.9 (194.1)
Recurring Impact of Prior Years' Tax and Fee Changes 0.0 0.0 0.0 (254.0) 0.0 (254.0) (508.0) 0.0 (508.0)
Time-Limited Tax and Fee Changes 0.0 (67.5) (67.5) 0.0 (67.5) (67.5) 0.0 (67.5) (67.5)
Trust Fund Transfers (GAA) 0.0 242.5 242.5 0.0 242.5 242.5 0.0 242.5 242.5
Total (254.0) 234.9 (19.1) (508.0) 234.9 (273.1) (762.0) 234.9 (527.1)
2017-18 2018-19 2019-20

Reported Results from LRFO...
• Combined, recurring and nonrecurring General Revenue program needs before the Fall Conference
season—including a minimum reserve of $1 billion—are less than the available General Revenue
dollars, meaning there is no budget gap for FY 2017-18. Anticipated expenditures, potential revenue
adjustments, and the reserve can be fully funded and the budget will be in balance as constitutionally
required.
• Although there is no budget gap in the first year, there is essentially no remaining General Revenue
for discretionary issues—the projected surplus of $7.5 million equates to just 0.02% of the General
Revenue estimate for FY 2017-18.
• Further, the projected recurring expenditures and revenue adjustments, in combination, outstrip the
available recurring resources by $24.4 million. 14
RECURRING
NON
RECURRING TOTAL
AVAILABLE GENERAL REVENUE $30,808.0 $1,387.7 $32,195.7
Base Budget $29,507.2 $0.0 $29,507.2
Transfer to Budget Stabilization Fund $0.0 $31.9 $31.9
Critical Needs $439.9 $45.0 $484.9
Other High Priority Needs $631.3 $513.8 $1,145.1
Reserve $0.0 $1,000.0 $1,000.0
TOTAL EXPENDITURES $30,578.4 $1,590.7 $32,169.1
Revenue Adjustments ($254.0) $234.9 ($19.1)
ENDING BALANCE ($24.4) $31.9 $7.5
OUTLOOK PROJECTION – FISCAL YEAR 2017-18 (in millions)
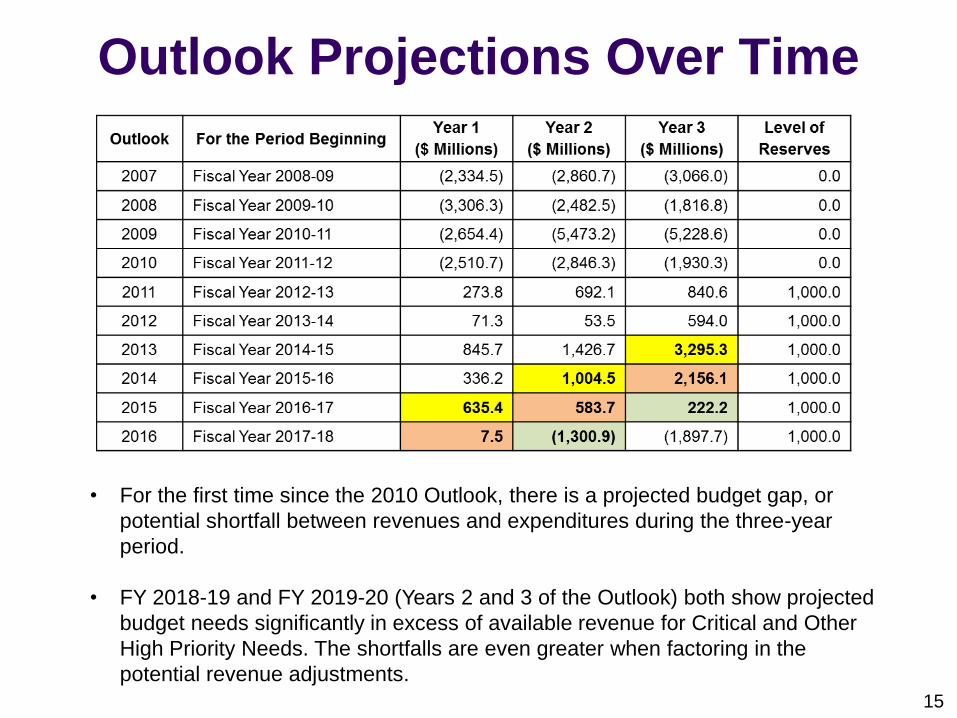
Outlook Projections Over Time
• For the first time since the 2010 Outlook, there is a projected budget gap, or
potential shortfall between revenues and expenditures during the three-year
period.
• FY 2018-19 and FY 2019-20 (Years 2 and 3 of the Outlook) both show projected
budget needs significantly in excess of available revenue for Critical and Other
High Priority Needs. The shortfalls are even greater when factoring in the
potential revenue adjustments.
15

The Bottom Line...
While revenues are sufficient to cover the Critical Needs in Tier 1 for all three years of the
Outlook, the large negative ending balances for FY 2018-19 and FY 2019-20 in both Tiers 2 and
3 indicate a looming problem—notwithstanding the small positive ending balances projected in
both scenarios for FY 2017-18.
Particularly problematic is the fact that the recurring General Revenue demands exceed the
amount of recurring General Revenue available in two of the three years for Tier 2 and in all
three years for Tier 3. This indicates that a structural imbalance is occurring between
expenditures and revenues.
Since the increase in projected recurring expenditures (and negative revenue adjustments in Tier
3) in FY 2017-18 clearly contributes to and worsens the problems in FY 2018-19 and FY 2019-
20, Fiscal Strategies are advisable for all three years of the Outlook in order to manage the
problems in the out-years.16
Year 1 Year 2 Year 3
($ Millions) ($ Millions) ($ Millions)
Tier 1 Critical Needs $1,171.7 $1,831.8 $2,706.2 $1,000.0
Tier 2Critical Needs & Other High Priority
Needs$26.6 ($1,008.7) ($1,370.6) $1,000.0
Tier 3Critical Needs, Other High Priority
Needs & Revenue Adjustments$7.5 ($1,300.9) ($1,897.7) $1,000.0
2016 OutlookFor the Period Beginning
Fiscal Year 2017-18
Level of
Reserves

Net Impact... The Outlook is a tool that provides an opportunity to both avoid future budget problems
and maintain financial stability between state fiscal years. It does not purport to predict
the overall funding levels of future state budgets or the final amount of funds to be
allocated to the respective budget areas.
This is because very few assumptions are made regarding future legislative policy
decisions on discretionary spending, making this document simply a reasonable
baseline. Particularly in regard to Other High Priorities, the specifics will begin to
change as the Legislature moves through its decision-making process.
The changes coming out of the Fall Conference season indicate a modest reduction in
the overall pressure, but do not change the original conclusions. The greatest impact of
the Fall changes is on the first two years (FY 2017-18 and FY 2018-19).
Some significant policy decisions with spending implications have yet to be made:
o Section 288.8013, Florida Statutes, establishes Triumph Gulf Coast, Inc., and the Recovery Fund for the benefit
of disproportionately affected counties by the Deepwater Horizon Disaster. If the Legislature places 75% of the
funds recovered in FY 2016-17 (.75 x $400 million) into the fund, that $300 million would be a reduction in the
funds otherwise assumed to be available in the plan. This would offset most of the more significant gains
coming out of the Fall Conference season.
o A decision to hold the RLE flat would have an even greater effect (~ $400 million).
o A decision to ratify a new Indian Gaming Compact, depending on the provisions of the implementing legislation,
would likely add revenue.
17

Timing of Corrective Action... When budget gaps between revenues and expenditures occurred in the past,
each of the three years of the Outlook was affected, and they displayed
negatives of similar magnitude.
This had the practical effect of limiting the number of potential strategies because
any strategy deployed to cure the problem in the first year had ripple effects
throughout the remaining years of the plan.
In those instances, the strategies were discretely identified and laid out.
In this year’s Outlook, only the two outer years reveal actual shortfalls.
This necessitates a different treatment because the number of possible
permutations is too great to allow specific identification of each one. Among the
many variables that should be considered is the timing of the corrective action.
While a fiscal strategy is required no later than FY 2018-19 to address the
projected gap between revenues and expenditures, less disruptive courses of
action would argue for at least some level of deployment beginning in FY 2017-
18. Otherwise, there is the potential to increase funding for programs in Year 1
that would not survive Year 2. Further, 61.2% of the recurring growth comes from
Tier 1—Critical Needs, which are the most difficult for the Legislature to tackle
without significant redesign and substantive legislation.18

Fiscal Strategies... Conceptually, there are five options to eliminate a proposed budget gap in any
given year of the Outlook.
Budget Reductions and Reduced Program Growth
Reduction or Elimination of Revenue Adjustments Affecting Taxes and Fees in
Tier 3
Revenue Enhancements and Redirections
Trust Fund Transfers or Sweeps
Reserve Reductions
With the exception of trust fund transfers or sweeps and reserve reductions,
these options can be deployed on either a recurring or nonrecurring basis.
When they are used to bring about a recurring change, they also have an
impact on the following fiscal years.
The magnitude of the recurring shortfall cannot be fixed by nonrecurring
solutions alone. A simple reduction in the level of reserves or added trust fund
transfers or sweeps (in excess of those included in Tier 3) will close the gap in
a particular year; however, these strategies do not solve the recurring
problem.
The other three options will become the basis of more meaningful strategies.
19
![Bradford County Telegraph. (Starke, Florida) 1895-04-05 [p ]. · lunarie-aHyliim Trousseaus Legislature jJcnnings congratulate driving tlyciei-JAfiir miasmatic Sale applications 3V-Jvniiiugs](https://img.pdfslide.tips/doc/110x75/5f900fe585486a124512f8f1/bradford-county-telegraph-starke-florida-1895-04-05-p-lunarie-ahyliim-trousseaus.jpg)