Embed Size (px)
Citation preview

ANNUAL REPORT 2016
OB
JECTIVE AN
NUA
L REPO
RT 2016
For
per
sona
l use
onl
y
Achievements & Performance 2
Financial Results 3
Delivering Results for Customers 4
Business Line Report 8
CEO’s Review 10
Directors’ Report 12
Financial Statements 17
Notes to the Financial Statements 22
Directors’ Declaration 39
Independent Auditor’s Report 40
Auditor’s Independence Declaration 42
Shareholder Information 43
Corporate Directory 44
CONTENTS
OBJECTIVE CORPORATION LIMITED AND ITS CONTROLLED ENTITIES
For
per
sona
l use
onl
y
ANNUAL REPORT 2016 | 1
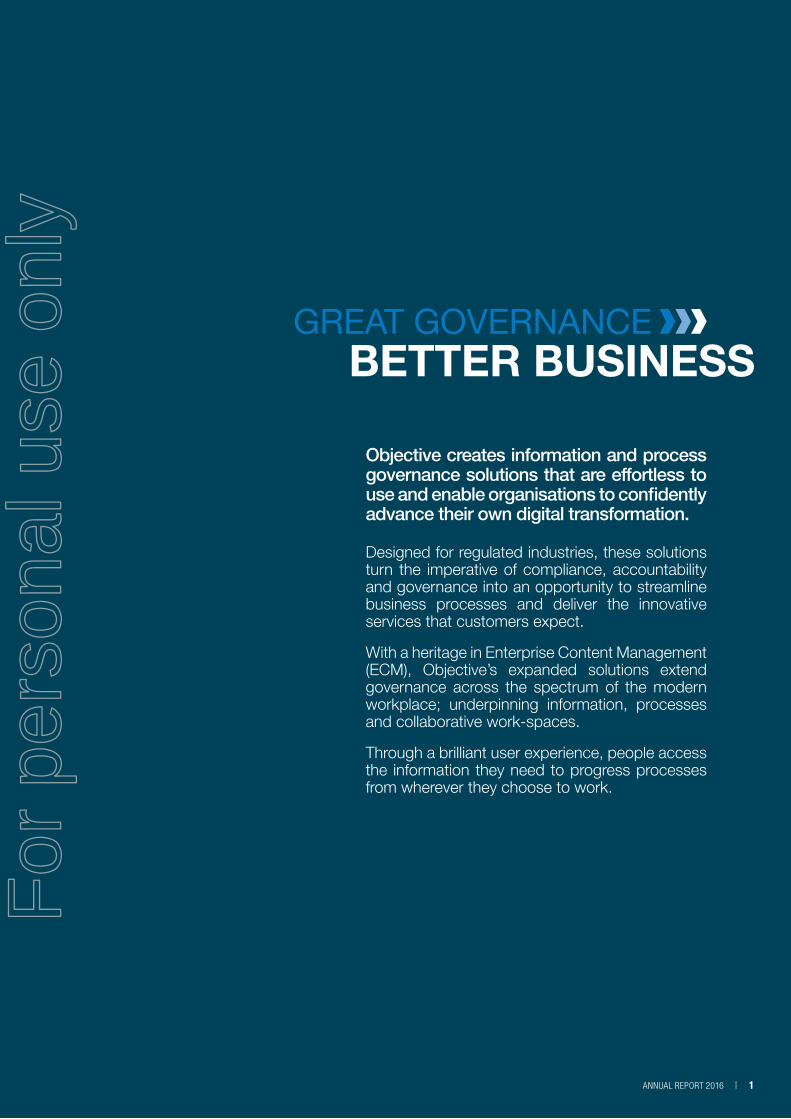
Objective creates information and process governance solutions that are effortless to use and enable organisations to confidently advance their own digital transformation.
Designed for regulated industries, these solutions turn the imperative of compliance, accountability and governance into an opportunity to streamline business processes and deliver the innovative services that customers expect.
With a heritage in Enterprise Content Management (ECM), Objective’s expanded solutions extend governance across the spectrum of the modern workplace; underpinning information, processes and collaborative work-spaces.
Through a brilliant user experience, people access the information they need to progress processes from wherever they choose to work.
For
per
sona
l use
onl
y
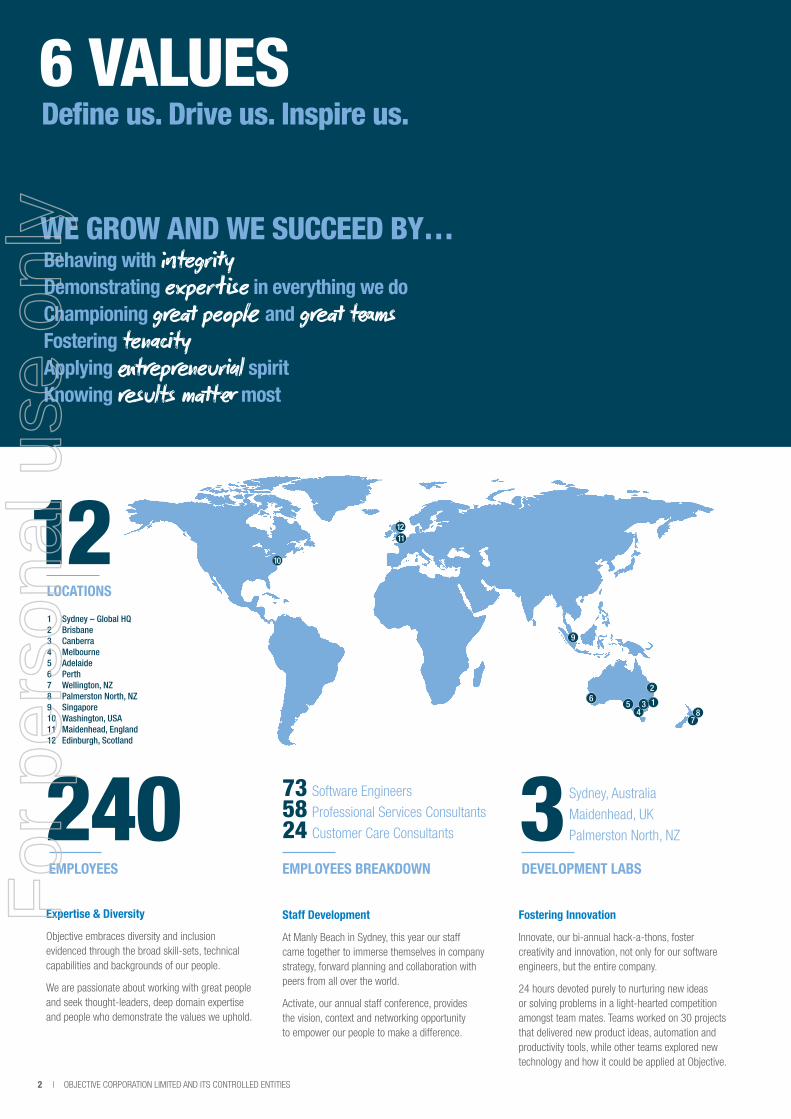
WE GROW AND WE SUCCEED BY…Behaving with integrityDemonstrating expertise in everything we doChampioning great people and great teamsFostering tenacityApplying entrepreneurial spiritKnowing results matter most
6 VALUES Define us. Drive us. Inspire us.
Expertise & Diversity
Objective embraces diversity and inclusion evidenced through the broad skill-sets, technical capabilities and backgrounds of our people.
We are passionate about working with great people and seek thought-leaders, deep domain expertise and people who demonstrate the values we uphold.
Staff Development
At Manly Beach in Sydney, this year our staff came together to immerse themselves in company strategy, forward planning and collaboration with peers from all over the world.
Activate, our annual staff conference, provides the vision, context and networking opportunity to empower our people to make a difference.
Fostering Innovation
Innovate, our bi-annual hack-a-thons, foster creativity and innovation, not only for our software engineers, but the entire company.
24 hours devoted purely to nurturing new ideas or solving problems in a light-hearted competition amongst team mates. Teams worked on 30 projects that delivered new product ideas, automation and productivity tools, while other teams explored new technology and how it could be applied at Objective.
EMPLOYEES EMPLOYEES BREAKDOWN
73 Software Engineers
58 Professional Services Consultants
24 Customer Care Consultants240DEVELOPMENT LABS
3 Sydney, Australia
Maidenhead, UK
Palmerston North, NZ
1 Sydney – Global HQ2 Brisbane3 Canberra4 Melbourne5 Adelaide6 Perth7 Wellington, NZ8 Palmerston North, NZ9 Singapore10 Washington, USA11 Maidenhead, England12 Edinburgh, Scotland
435
6
78
9
2
10
1112
1
LOCATIONS
12
2 | OBJECTIVE CORPORATION LIMITED AND ITS CONTROLLED ENTITIES
For
per
sona
l use
onl
y
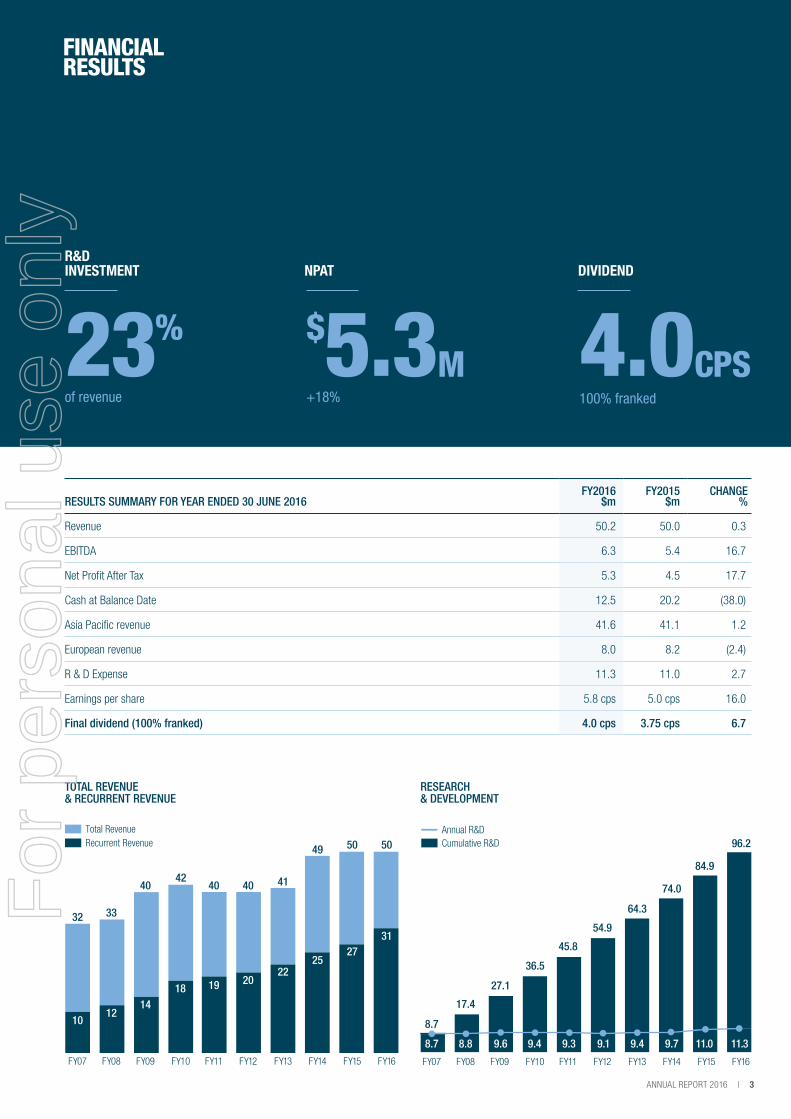
23%
of revenue
R&D INVESTMENT
$5.3M+18%
NPAT
4.0CPS100% franked
DIVIDEND
FINANCIAL RESULTS
TOTAL REVENUE & RECURRENT REVENUE
RESEARCH & DEVELOPMENT
ANNUAL REPORT 2016 | 3
RESULTS SUMMARY FOR YEAR ENDED 30 JUNE 2016FY2016
$mFY2015
$mCHANGE
%
Revenue 50.2 50.0 0.3
EBITDA 6.3 5.4 16.7
Net Profit After Tax 5.3 4.5 17.7
Cash at Balance Date 12.5 20.2 (38.0)
Asia Pacific revenue 41.6 41.1 1.2
European revenue 8.0 8.2 (2.4)
R & D Expense 11.3 11.0 2.7
Earnings per share 5.8 cps 5.0 cps 16.0
Final dividend (100% franked) 4.0 cps 3.75 cps 6.7
Recurrent RevenueTotal Revenue
FY11
19
4042
FY12
20
40
FY13
22
41
FY14
25
49
FY15
27
50
FY16
31
50
FY07
10
32
FY08
12
33
FY09 FY10
1418
40
Cumulative R&DAnnual R&D
FY11
9.3
45.8
36.5
FY12
9.1
54.9
FY13
9.4
64.3
FY14
9.7
74.0
FY15
11.0
84.9
FY16
11.3
96.2
FY07
8.7
8.7
FY08
8.8
17.4
FY09 FY10
9.6 9.4
27.1
For
per
sona
l use
onl
y

4 | OBJECTIVE CORPORATION LIMITED AND ITS CONTROLLED ENTITIES
DELIVERING RESULTS FOR CUSTOMERS
National Blood Authority implements secure collaboration
Working across nine state and territory governments; and with more than 400 hospitals, secure collaboration is critical to the National Blood Authority (NBA) being able to ensure a safe blood supply to all Australians.
But with sensitive health information being shared, the NBA must ensure strict information governance. NBA searched for a collaborative platform that was able to extend the strict information governance it had in place internally, to the information it shared with external parties.
Thanks to its deep integration with HP TRIM, Objective Connect is now used across the NBA whenever they work with anyone outside their organisation. Committee papers, tender evaluations, benchmarking data and expert panel reviews are all securely shared using Objective Connect.
Beyond extending its information governance, the NBA saved more than $40,000 p.a. in postage and courier costs, it has significantly reduced printing and saved more than $100,000 in staff hours. The organisation is also now more flexible in its working arrangements, enabling consultants to work effectively, wherever they’re located around Australia.
There was no other option. We wanted something that would integrate into HP TRIM. Objective Connect was the only product that hit the mark.
Peter O’Halloran, Executive Director and Chief Information Officer, National Blood Authority.
For
per
sona
l use
onl
y
ANNUAL REPORT 2016 | 5
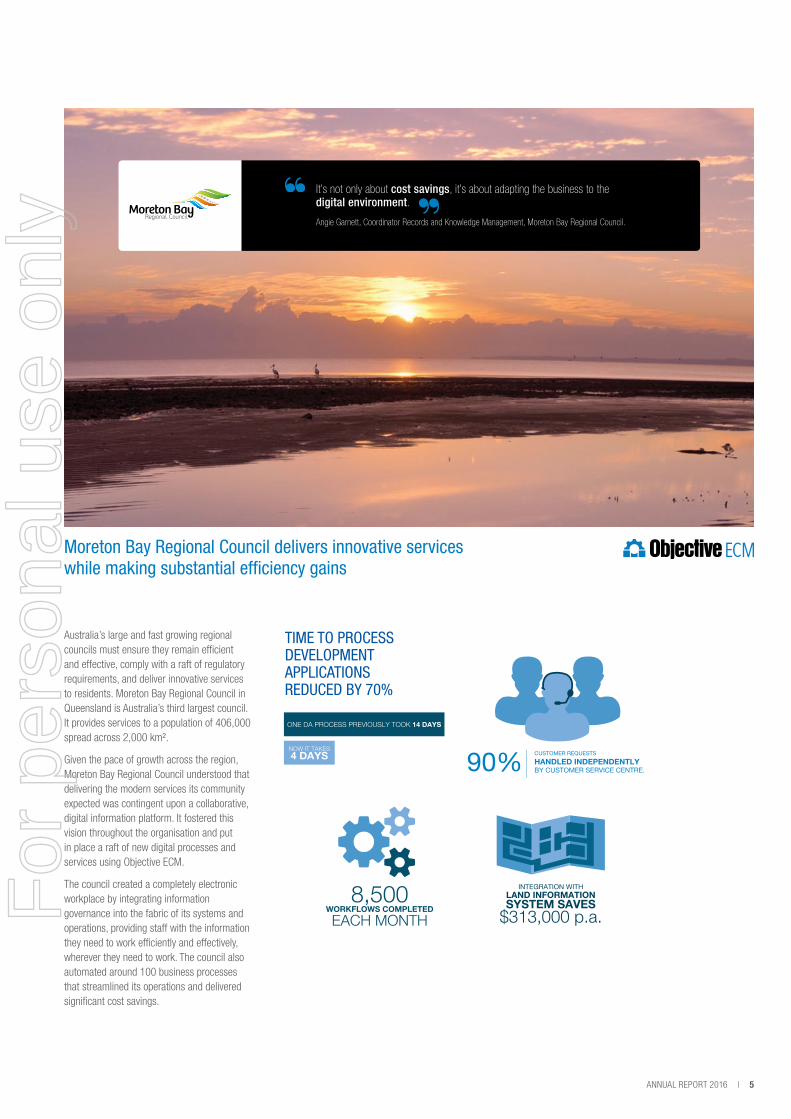
Moreton Bay Regional Council delivers innovative services while making substantial efficiency gains
Australia’s large and fast growing regional councils must ensure they remain efficient and effective, comply with a raft of regulatory requirements, and deliver innovative services to residents. Moreton Bay Regional Council in Queensland is Australia’s third largest council. It provides services to a population of 406,000 spread across 2,000 km².
Given the pace of growth across the region, Moreton Bay Regional Council understood that delivering the modern services its community expected was contingent upon a collaborative, digital information platform. It fostered this vision throughout the organisation and put in place a raft of new digital processes and services using Objective ECM.
The council created a completely electronic workplace by integrating information governance into the fabric of its systems and operations, providing staff with the information they need to work efficiently and effectively, wherever they need to work. The council also automated around 100 business processes that streamlined its operations and delivered significant cost savings.
It’s not only about cost savings, it’s about adapting the business to the digital environment.
Angie Garnett, Coordinator Records and Knowledge Management, Moreton Bay Regional Council.
TIME TO PROCESS DEVELOPMENT APPLICATIONS REDUCED BY 70%
For
per
sona
l use
onl
y
6 | OBJECTIVE CORPORATION LIMITED AND ITS CONTROLLED ENTITIES
DELIVERING RESULTS FOR CUSTOMERS
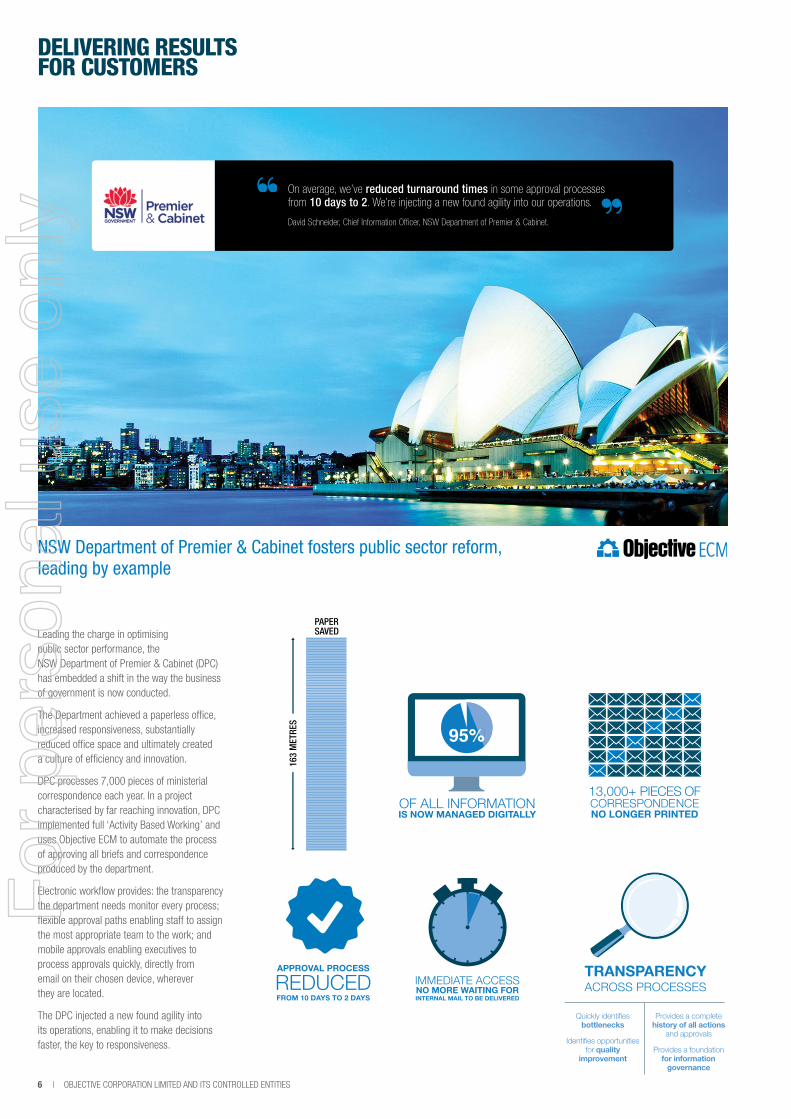
NSW Department of Premier & Cabinet fosters public sector reform, leading by example
Leading the charge in optimising public sector performance, the NSW Department of Premier & Cabinet (DPC) has embedded a shift in the way the business of government is now conducted.
The Department achieved a paperless office, increased responsiveness, substantially reduced office space and ultimately created a culture of efficiency and innovation.
DPC processes 7,000 pieces of ministerial correspondence each year. In a project characterised by far reaching innovation, DPC implemented full ‘Activity Based Working’ and uses Objective ECM to automate the process of approving all briefs and correspondence produced by the department.
Electronic workflow provides: the transparency the department needs monitor every process; flexible approval paths enabling staff to assign the most appropriate team to the work; and mobile approvals enabling executives to process approvals quickly, directly from email on their chosen device, wherever they are located.
The DPC injected a new found agility into its operations, enabling it to make decisions faster, the key to responsiveness.
On average, we’ve reduced turnaround times in some approval processes from 10 days to 2. We’re injecting a new found agility into our operations.
David Schneider, Chief Information Officer, NSW Department of Premier & Cabinet.
%
For
per
sona
l use
onl
y
ANNUAL REPORT 2016 | 7
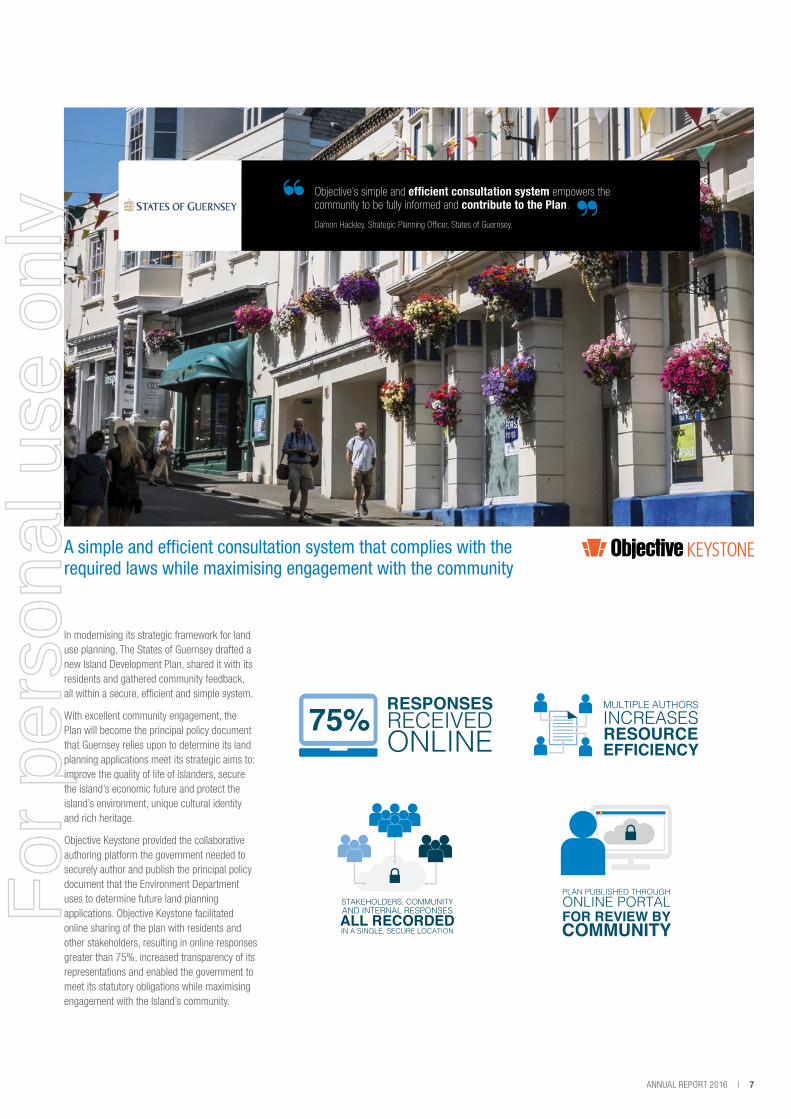
A simple and efficient consultation system that complies with the required laws while maximising engagement with the community
In modernising its strategic framework for land use planning, The States of Guernsey drafted a new Island Development Plan, shared it with its residents and gathered community feedback, all within a secure, efficient and simple system.
With excellent community engagement, the Plan will become the principal policy document that Guernsey relies upon to determine its land planning applications meet its strategic aims to: improve the quality of life of islanders, secure the island’s economic future and protect the island’s environment, unique cultural identity and rich heritage.
Objective Keystone provided the collaborative authoring platform the government needed to securely author and publish the principal policy document that the Environment Department uses to determine future land planning applications. Objective Keystone facilitated online sharing of the plan with residents and other stakeholders, resulting in online responses greater than 75%, increased transparency of its representations and enabled the government to meet its statutory obligations while maximising engagement with the Island’s community.
Objective’s simple and efficient consultation system empowers the community to be fully informed and contribute to the Plan.
Damon Hackley, Strategic Planning Officer, States of Guernsey.
For
per
sona
l use
onl
y
8 | OBJECTIVE CORPORATION LIMITED AND ITS CONTROLLED ENTITIES
BUSINESS LINE REPORT
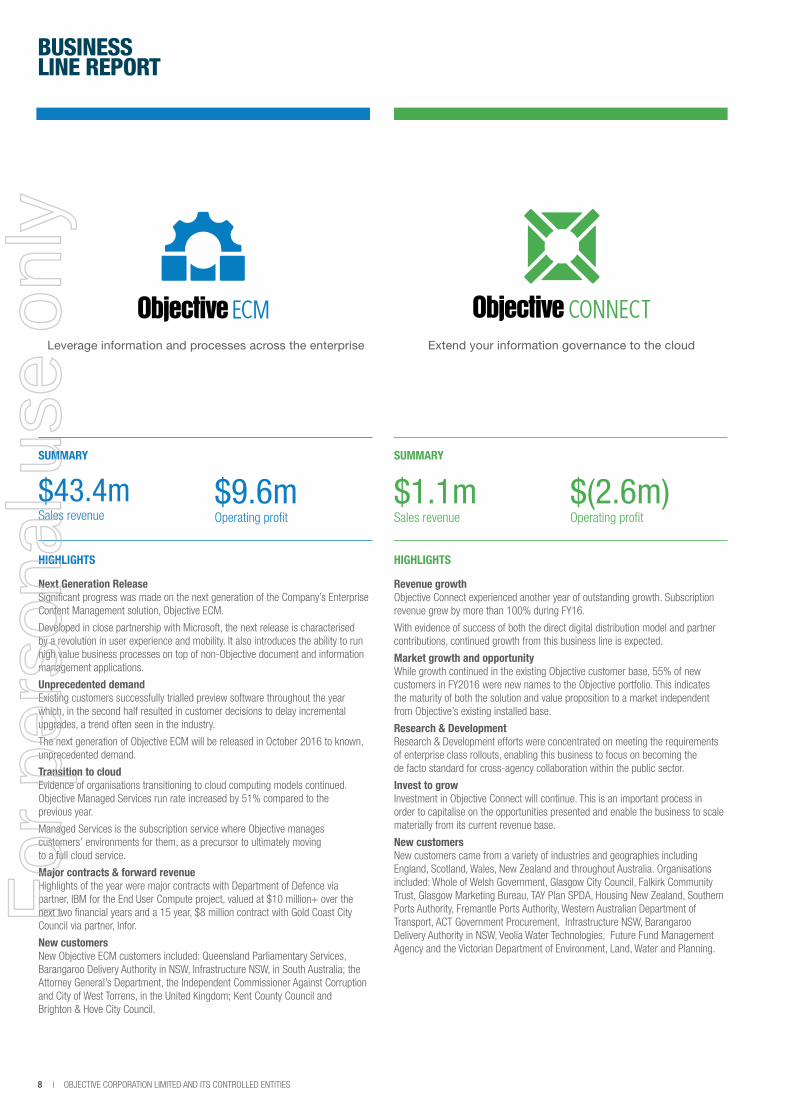
Revenue growth Objective Connect experienced another year of outstanding growth. Subscription revenue grew by more than 100% during FY16.
With evidence of success of both the direct digital distribution model and partner contributions, continued growth from this business line is expected.
Market growth and opportunity While growth continued in the existing Objective customer base, 55% of new customers in FY2016 were new names to the Objective portfolio. This indicates the maturity of both the solution and value proposition to a market independent from Objective’s existing installed base.
Research & Development Research & Development efforts were concentrated on meeting the requirements of enterprise class rollouts, enabling this business to focus on becoming the de facto standard for cross-agency collaboration within the public sector.
Invest to grow Investment in Objective Connect will continue. This is an important process in order to capitalise on the opportunities presented and enable the business to scale materially from its current revenue base.
New customers New customers came from a variety of industries and geographies including England, Scotland, Wales, New Zealand and throughout Australia. Organisations included: Whole of Welsh Government, Glasgow City Council, Falkirk Community Trust, Glasgow Marketing Bureau, TAY Plan SPDA, Housing New Zealand, Southern Ports Authority, Fremantle Ports Authority, Western Australian Department of Transport, ACT Government Procurement, Infrastructure NSW, Barangaroo Delivery Authority in NSW, Veolia Water Technologies, Future Fund Management Agency and the Victorian Department of Environment, Land, Water and Planning.
Next Generation Release Significant progress was made on the next generation of the Company’s Enterprise Content Management solution, Objective ECM.
Developed in close partnership with Microsoft, the next release is characterised by a revolution in user experience and mobility. It also introduces the ability to run high value business processes on top of non-Objective document and information management applications.
Unprecedented demand Existing customers successfully trialled preview software throughout the year which, in the second half resulted in customer decisions to delay incremental upgrades, a trend often seen in the industry.
The next generation of Objective ECM will be released in October 2016 to known, unprecedented demand.
Transition to cloud Evidence of organisations transitioning to cloud computing models continued. Objective Managed Services run rate increased by 51% compared to the previous year.
Managed Services is the subscription service where Objective manages customers’ environments for them, as a precursor to ultimately moving to a full cloud service.
Major contracts & forward revenue Highlights of the year were major contracts with Department of Defence via partner, IBM for the End User Compute project, valued at $10 million+ over the next two financial years and a 15 year, $8 million contract with Gold Coast City Council via partner, Infor.
New customers New Objective ECM customers included: Queensland Parliamentary Services, Barangaroo Delivery Authority in NSW, Infrastructure NSW, in South Australia; the Attorney General’s Department, the Independent Commissioner Against Corruption and City of West Torrens, in the United Kingdom; Kent County Council and Brighton & Hove City Council.
$1.1mSales revenue
$(2.6m)Operating profit
$43.4mSales revenue
$9.6mOperating profit
Extend your information governance to the cloud Leverage information and processes across the enterprise
HIGHLIGHTSHIGHLIGHTS
SUMMARYSUMMARY
For
per
sona
l use
onl
y
ANNUAL REPORT 2016 | 9
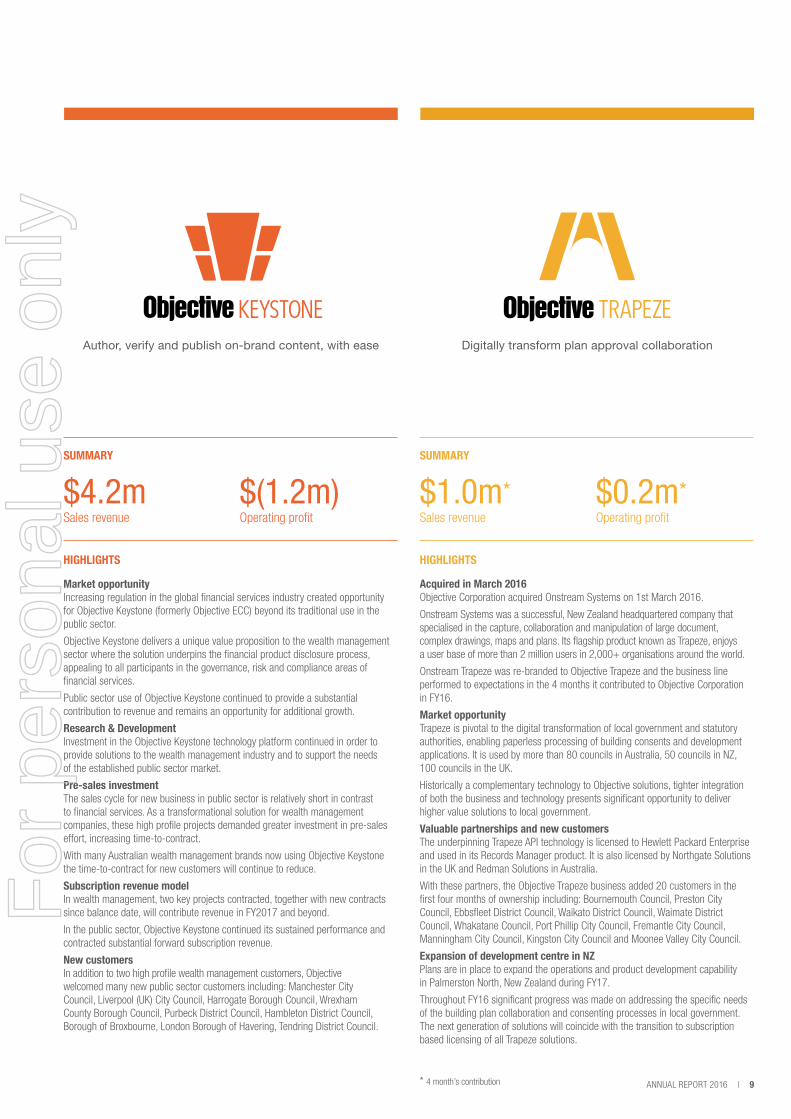
Market opportunity Increasing regulation in the global financial services industry created opportunity for Objective Keystone (formerly Objective ECC) beyond its traditional use in the public sector.
Objective Keystone delivers a unique value proposition to the wealth management sector where the solution underpins the financial product disclosure process, appealing to all participants in the governance, risk and compliance areas of financial services.
Public sector use of Objective Keystone continued to provide a substantial contribution to revenue and remains an opportunity for additional growth.
Research & Development Investment in the Objective Keystone technology platform continued in order to provide solutions to the wealth management industry and to support the needs of the established public sector market.
Pre-sales investment The sales cycle for new business in public sector is relatively short in contrast to financial services. As a transformational solution for wealth management companies, these high profile projects demanded greater investment in pre-sales effort, increasing time-to-contract.
With many Australian wealth management brands now using Objective Keystone the time-to-contract for new customers will continue to reduce.
Subscription revenue model In wealth management, two key projects contracted, together with new contracts since balance date, will contribute revenue in FY2017 and beyond.
In the public sector, Objective Keystone continued its sustained performance and contracted substantial forward subscription revenue.
New customers In addition to two high profile wealth management customers, Objective welcomed many new public sector customers including: Manchester City Council, Liverpool (UK) City Council, Harrogate Borough Council, Wrexham County Borough Council, Purbeck District Council, Hambleton District Council, Borough of Broxbourne, London Borough of Havering, Tendring District Council.
Acquired in March 2016 Objective Corporation acquired Onstream Systems on 1st March 2016.
Onstream Systems was a successful, New Zealand headquartered company that specialised in the capture, collaboration and manipulation of large document, complex drawings, maps and plans. Its flagship product known as Trapeze, enjoys a user base of more than 2 million users in 2,000+ organisations around the world.
Onstream Trapeze was re-branded to Objective Trapeze and the business line performed to expectations in the 4 months it contributed to Objective Corporation in FY16.
Market opportunity Trapeze is pivotal to the digital transformation of local government and statutory authorities, enabling paperless processing of building consents and development applications. It is used by more than 80 councils in Australia, 50 councils in NZ, 100 councils in the UK.
Historically a complementary technology to Objective solutions, tighter integration of both the business and technology presents significant opportunity to deliver higher value solutions to local government.
Valuable partnerships and new customers The underpinning Trapeze API technology is licensed to Hewlett Packard Enterprise and used in its Records Manager product. It is also licensed by Northgate Solutions in the UK and Redman Solutions in Australia.
With these partners, the Objective Trapeze business added 20 customers in the first four months of ownership including: Bournemouth Council, Preston City Council, Ebbsfleet District Council, Waikato District Council, Waimate District Council, Whakatane Council, Port Phillip City Council, Fremantle City Council, Manningham City Council, Kingston City Council and Moonee Valley City Council.
Expansion of development centre in NZ Plans are in place to expand the operations and product development capability in Palmerston North, New Zealand during FY17.
Throughout FY16 significant progress was made on addressing the specific needs of the building plan collaboration and consenting processes in local government. The next generation of solutions will coincide with the transition to subscription based licensing of all Trapeze solutions.
$4.2mSales revenue
$(1.2m)Operating profit
$1.0m*Sales revenue
$0.2m*Operating profit
Author, verify and publish on-brand content, with ease Digitally transform plan approval collaboration
* 4 month’s contribution
HIGHLIGHTS HIGHLIGHTS
SUMMARY SUMMARY
For
per
sona
l use
onl
y
10 | OBJECTIVE CORPORATION LIMITED AND ITS CONTROLLED ENTITIES
Dear fellow shareholders,We present Objective Corporation’s annual report for the financial year ending 30 June 2016 (FY2016).
Revenue increased from the previous year to $50.2 million (FY2015: $50.0 million).
We continued to grow our recurrent revenue and maintained cost discipline throughout the year, reporting an increase in net profit after tax of 18% to $5.3 million (FY2015: $4.5 million).
The Company contracted an unprecedented $20 million+ of forward revenue, which contributed less than $1 million to the FY2016 results. We expect a significant contribution from these contracts during the 2017 financial year (FY2017).
These types of contracts are illustrative of Objective embracing the new shape of business where government procurement practices are transitioning to subscription based contracting and demand for cloud based computing models is growing.
Further evidence of this shift was seen in the company’s 13% lift in recurrent revenue to $31.0 million (FY2015: $27.1 million).
The company invested $11.3 million in Research & Development, fully expensed, representing 23% of revenues.
This investment is approximately twice the industry average.
Investing in our future solutions remains critical to our business strategy and ability to retain and grow market share.
Since paying for the acquisition of Onstream Systems in full in March 2016, the Company’s cash balance remained healthy; $12.5 million at balance date and $22.3 million at reporting date of 26 August, with no external borrowings.
Highlights by Solution LineObjective ECM Highlights of the year for Objective ECM were two major contracts; a $10 million+ contract at the Australian Department of Defence and an $8 million contract at the Gold Coast City Council.
Both of these new contracts are heavily weighted to future periods, with less than $1 million in revenue recognised in FY2016.
Throughout the year we made significant progress on developing the next generation of our Enterprise Content Management (ECM) solution, to be formally launched in October 2016. While we experienced a short-term delay in incremental upgrades, successful preview trials with existing customers has generated unprecedented demand for the next generation release of Objective ECM.
With known, existing demand together with contracts already in hand, we expect a material growth in our ECM revenue and profitability in the year ahead.
Objective Connect I am pleased to report more than 100% growth in revenue on FY2015 from Objective Connect.
This growth is a result of the customer base for Objective Connect extending well beyond the traditional Objective ECM customer base. Objective Connect is now recognised as a true value-add for all major information management systems as its target market comprehends the necessity to extend information governance to the cloud. We expect this trend to continue.
Objective Connect has become a trusted, enterprise-grade solution. With evidence of the success of both the digital distribution and our trusted go-to-market partners, we remain confident that it will again experience very high growth in FY2017.
Our investment will continue to exceed revenues in the near term in order to capitalise on opportunities and enable this business to grow materially from its current revenue base.
Objective Keystone Investment in developing the technology platform throughout FY2016 continued. In addition to supporting the needs of the historic public sector market, effort was channeled into delivering product to meet specific demand from the wealth management industry.
We continued to grow our recurrent revenue and maintained cost discipline throughout the year, reporting an increase in net profit after tax of 18% to $5.3 million.
62%Recurrent Revenue
18%Increase in NPAT
CEO’S REVIEWF
or p
erso
nal u
se o
nly
ANNUAL REPORT 2016 | 11
We rebranded the solution from Objective Enterprise Content Creation (Objective ECC) to Objective Keystone, for broader appeal to industries beyond the public sector.
The wealth management sector became an active target market, however time-to-contract with new customers was longer than expected. The investment in pre-sales was rewarded at the end of the year by winning two of the “big four” banks as customers, and a third post balance date.
Success in the public sector continued, where our reputation and value proposition, particularly in the UK and New Zealand, are market-leading.
In addition to maintaining our position in the public sector, we anticipate adding more major wealth management groups to the Objective Keystone platform during 2017 as we expand our Australian successes and target new global markets.
At an absolute minimum we expect this business to break even before the end of FY2017.
Objective Trapeze It was with great pleasure and anticipation that we welcomed Onstream Systems to the Objective family in March 2016, transitioning Onstream Trapeze to Objective Trapeze.
The business performed to expectations, contributing earnings in this financial year.
In conjunction with Redman Solutions in Australia and Northgate Solutions in the UK, we added 20 new Trapeze customers in the first four months of ownership.
Based in Palmerston North, New Zealand we are investing in growing operations and product development capability to transform Trapeze’s key target markets of building plan collaboration, assessment and consent processes in local government and statutory authorities.
The broad and well established customer base for Objective Trapeze presents significant opportunity to extend the footprint of our other solutions.
We anticipate growth in both revenue and earnings during the year ahead.
Outlook We made significant progress during FY2016, which can best be described as a transitional year.
In spite of the 18% lift in NPAT and the strong portfolio of forward contracts, we expect a far more robust FY2017.
As we continue to transition to subscription licensing across all solution lines, revenue and earnings will become more predictable. The results of this can already be seen in the 13% growth in recurrent revenue.
We have laid the foundation for innovation in our technology, business solutions and the services we deliver to customers: we are progressing with deeper vertical market focus delivering industry specific solutions, we have developed process governance solutions that run on top of non-Objective document and information management platforms, and we are further extending cloud deployment opportunities across all solution lines.
We expect the Company to deliver a meaningful step up during the first half of FY2017.
We remain committed to growing all of our business lines, we are confident in our competitive position in the markets in which we operate and we are well positioned to capitalise on the many opportunities these markets present.
As always, the Board and management of Objective Corporation expresses deep gratitude to our customers, staff and shareholders, whose loyalty and contribution to our company are highly valued.
Tony Walls Chief Executive Officer
For
per
sona
l use
onl
y

12 | OBJECTIVE CORPORATION LIMITED AND ITS CONTROLLED ENTITIES12 | OBJECTIVE CORPORATION LIMITED AND ITS CONTROLLED ENTITIES
DIRECTORS’ REPORTFOR THE YEAR ENDED 30 JUNE 2016
Your directors present their report on the consolidated entity (referred to hereafter as the Group) consisting of Objective Corporation Limited (ABN 16 050 539 350) and the entities it controlled at the end of, or during, the year ended 30 June 2016.
DIRECTORSThe Directors in office at any time during the financial year up to the date of this report were as follows:
Mr Tony Walls
Mr Gary Fisher
Mr Leigh Warren
Mr Nick Kingsbury
INFORMATION ON DIRECTORS
MR TONY WALLS Chairman and Chief Executive OfficerTony founded the business in 1987 and has extensive experience in the IT industry. Tony has a B.Math (Computing Science), a Grad.Dip in Applied Finance (SIA) and is a Fellow of the Australian Institute of Company Directors.
MR LEIGH WARREN Independent Non Executive DirectorLeigh was appointed as a Non-Executive Director in August 2007 and is Chairman of the Audit Committee. Leigh has over 20 years’ experience in the IT Industry and has held Executive roles for several multinational companies, including SAP where he was Chief Operating Officer for North Asia, Oracle where he was the Managing Director for Australia and New Zealand, Ventyx where he was President for the EMEA region and Bluecoat Systems where he was Vice President Asia Pacific Field Operations. Leigh also serves on the Board of ASX/NZX listed Gentrack and Hong Kong based Solution Access.
MR MARK KATZCompany Secretary Mark was appointed Company Secretary in August 2015. Mark has over 20 years’ experience in financial roles within the Financial Services and Travel sectors in Australia and South Africa, most recently with American Express. Mark is a member of the Institute of Chartered Accountants, Australia & New Zealand.
MR GARY FISHERNon Executive DirectorGary was appointed a Director of Objective Corporation Limited in March 1991. In October 2007 Gary became a Non Executive director. Gary has an extensive background in Finance, IT Management and global product software sales. Gary has a B.Economics and further tertiary education in Law and Business Administration.
MR NICK KINGSBURYIndependent Non Executive DirectorNick was appointed as a Non Executive Director in July 2008 and is a member of the Audit Committee. Nick is an experienced international software entrepreneur, strategist and venture capitalist. Nick founded, led and then sold a leading UK Business Process Management company. Nick then spent 7 years with the international venture capital company 3i, where he headed up the software sector. Until recently he chaired a UK listed cyber security company Accumuli, plc, which was sold to NCC Group in April 2015. As well as his role with Objective, he sits on the boards of the UK operation of Growthpoint Technology Partners, a US investment bank, and three early stage businesses Pushfor Limited, Loot Financial Services Limited and Tailored Media Ventures (UK) Limited.
MR ROB PATERSONCompany Secretary Rob was appointed Company Secretary in May 2013. Rob has over 15 years’ experience in financial roles within software, technology and consulting businesses both in Australia and the UK. Rob is a fellow member of the Association of Chartered Certified Accountants. Rob resigned as Company Secretary in August 2015.
For
per
sona
l use
onl
y
ANNUAL REPORT 2016 | 13ANNUAL REPORT 2016 | 13
PRINCIPAL ACTIVITIESThe principal activity of the Group during the year was the supply of information technology software and services. There was no significant change in the nature of the Group’s activities during the year.
DIVIDENDS An ordinary final fully franked dividend of $3,405,000 was paid on 9 September 2015.
Since the end of the financial year, the Directors have declared a final fully franked dividend of 4.00 cents per ordinary share (2015: fully franked dividend of 3.75 cent per ordinary share). The aggregate amount of the dividends expected to be paid by 14 September 2016 is $3,647,000 (2015: $3,405,000). There is no conduit foreign income attributed to the final dividend declared.
REVIEW OF OPERATIONS
Operating resultThe consolidated operating profit attributable to members increased by 17.7 per cent to $5,263,000 (2015: $4,470,000).
The Group continued to invest significantly in Research and Development (“R&D”) with expenditure of $11,259,000 (2015: $10,959,000). This investment in R&D was fully expensed during the year.
RevenueConsolidated revenue from sales and services increased by 0.4 per cent from the prior financial year to $49,651,000 (2015: $49,435,000). Total consolidated revenue has also increased by 0.3 per cent from the last financial year to $50,150,000 (2015: $50,007,000). Asia Pacific revenues increased by 1.0 per cent to $41,560,000 (2015: $41,140,000). European revenues decreased by 2.2 per cent to $8,048,000 (2015: $8,232,000).
See Note 25 for more details of the financial performance of the group’s key geographic segments. The group is a key participant in its market, with a diverse customer base; the group does not have any dependencies on key customers.
Financial positionObjective’s statement of financial position remains strong. At 30 June 2016, cash and cash equivalents is $12.5 million and there continues to be no external borrowings.
The Group’s receivables and cash flow management also continue to support overall strength in working capital. With a diverse customer base, the group continues to focus on receivables management.
SIGNIFICANT CHANGES IN STATE OF AFFAIRS There were no significant changes in the state of affairs of the Group during the financial year.
SHARE CAPITAL As at 30 June 2016 the Company had 91,165,169 (2015: 90,797,277) fully paid ordinary shares on issue.
Voting rights are detailed in Note 14 to the financial statements.
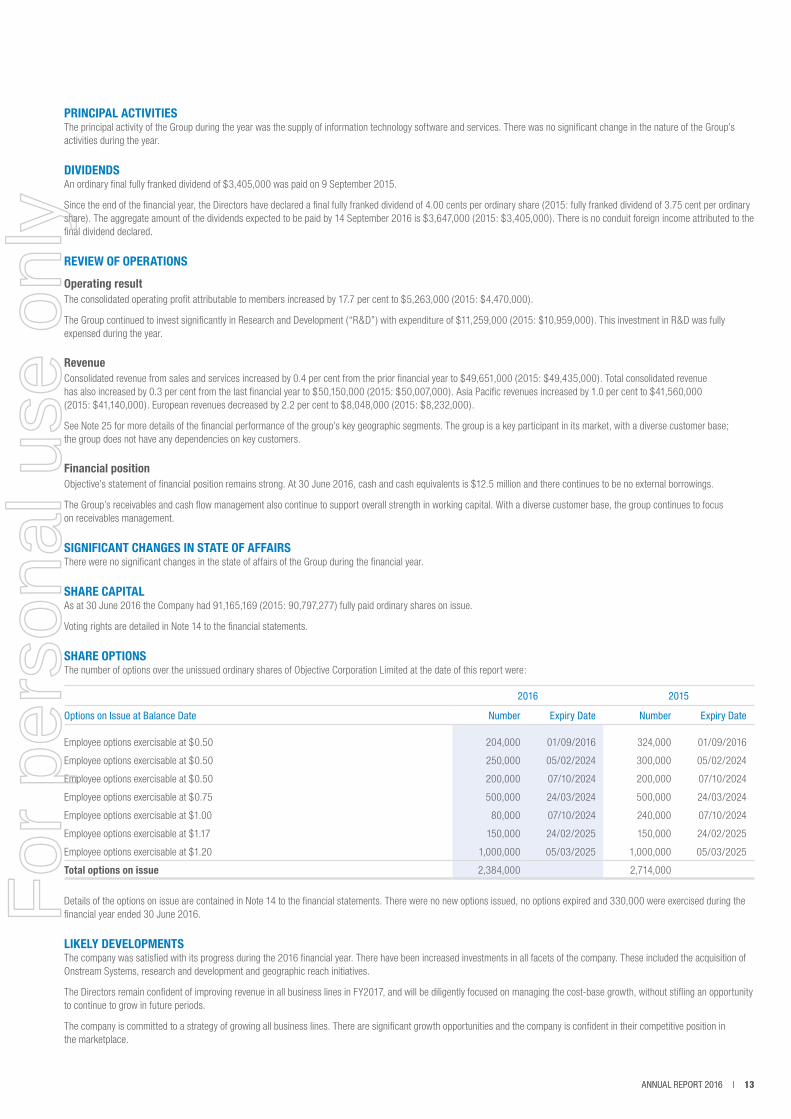
SHARE OPTIONS The number of options over the unissued ordinary shares of Objective Corporation Limited at the date of this report were:
2016 2015
Options on Issue at Balance Date Number Expiry Date Number Expiry Date
Employee options exercisable at $0.50 204,000 01/09/2016 324,000 01/09/2016
Employee options exercisable at $0.50 250,000 05/02/2024 300,000 05/02/2024
Employee options exercisable at $0.50 200,000 07/10/2024 200,000 07/10/2024
Employee options exercisable at $0.75 500,000 24/03/2024 500,000 24/03/2024
Employee options exercisable at $1.00 80,000 07/10/2024 240,000 07/10/2024
Employee options exercisable at $1.17 150,000 24/02/2025 150,000 24/02/2025
Employee options exercisable at $1.20 1,000,000 05/03/2025 1,000,000 05/03/2025
Total options on issue 2,384,000 2,714,000
Details of the options on issue are contained in Note 14 to the financial statements. There were no new options issued, no options expired and 330,000 were exercised during the financial year ended 30 June 2016.
LIKELY DEVELOPMENTSThe company was satisfied with its progress during the 2016 financial year. There have been increased investments in all facets of the company. These included the acquisition of Onstream Systems, research and development and geographic reach initiatives.
The Directors remain confident of improving revenue in all business lines in FY2017, and will be diligently focused on managing the cost-base growth, without stifling an opportunity to continue to grow in future periods.
The company is committed to a strategy of growing all business lines. There are significant growth opportunities and the company is confident in their competitive position in the marketplace.
For
per
sona
l use
onl
y
14 | OBJECTIVE CORPORATION LIMITED AND ITS CONTROLLED ENTITIES14 | OBJECTIVE CORPORATION LIMITED AND ITS CONTROLLED ENTITIES
DIRECTORS’ REPORT CONTINUED
EVENTS SUBSEQUENT TO BALANCE DATE The Directors have not become aware of any matter or circumstance not otherwise dealt with in the report or in the financial statements that has significantly or may significantly affect the operations of the Group, the results of those operations or the state of affairs of the Group in subsequent financial years.
INDEMNIFYING OFFICERS OR AUDITOR During the financial year the Company has paid an insurance premium for a Directors’ and Officers’ insurance policy. The liabilities insured are legal costs that may be incurred in defending civil or criminal proceedings that may be brought against the Directors or Company Secretary as a result of the work performed in their capacity as officers of entities in the Group to the extent permitted by law. The Directors have not disclosed the amount of the premium as such disclosure is prohibited under the terms of the contract.
The Company has not otherwise, during or since the financial year, indemnified or agreed to indemnify an officer or auditor of the Company or any related body corporate against a liability incurred.
CORPORATE GOVERNANCE STATEMENT The Company’s directors and management are committed to conducting the Group’s business in an ethical manner and in accordance with the highest standards of corporate governance. The Company has adopted and substantially complies with the ASX Corporate Governance Principles and Recommendations (3rd Edition) (‘Recommendations’) to the extent appropriate to the size and nature of the Group’s operations.
The Company has prepared a Corporate Governance Statement which sets out the corporate governance practices that were in operation throughout the financial year for the Company, identifies any Recommendations that have not been followed, and provides reasons for not following such Recommendations. The Company’s Corporate Governance Statement and policies will be approved at the same time as the Annual Report and will be found on its website: http://www.objective.com/corporate-governance
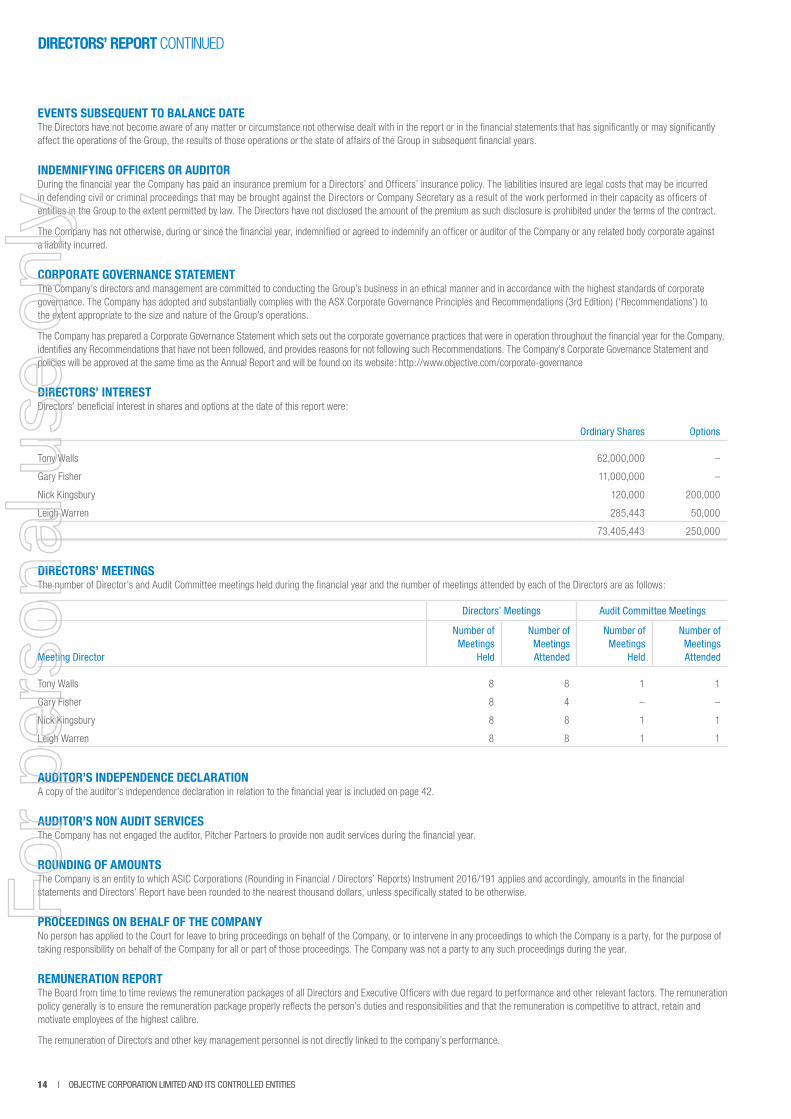
DIRECTORS’ INTEREST Directors’ beneficial interest in shares and options at the date of this report were:
Ordinary Shares Options
Tony Walls 62,000,000 –
Gary Fisher 11,000,000 –
Nick Kingsbury 120,000 200,000
Leigh Warren 285,443 50,000
73,405,443 250,000
DIRECTORS’ MEETINGS The number of Director’s and Audit Committee meetings held during the financial year and the number of meetings attended by each of the Directors are as follows:
Directors’ Meetings Audit Committee Meetings
Meeting Director
Number of Meetings
Held
Number ofMeetings Attended
Number ofMeetings
Held
Number ofMeetings Attended
Tony Walls 8 8 1 1
Gary Fisher 8 4 – –
Nick Kingsbury 8 8 1 1
Leigh Warren 8 8 1 1
AUDITOR’S INDEPENDENCE DECLARATIONA copy of the auditor’s independence declaration in relation to the financial year is included on page 42.
AUDITOR’S NON AUDIT SERVICESThe Company has not engaged the auditor, Pitcher Partners to provide non audit services during the financial year.
ROUNDING OF AMOUNTSThe Company is an entity to which ASIC Corporations (Rounding in Financial / Directors’ Reports) Instrument 2016/191 applies and accordingly, amounts in the financial statements and Directors’ Report have been rounded to the nearest thousand dollars, unless specifically stated to be otherwise.
PROCEEDINGS ON BEHALF OF THE COMPANYNo person has applied to the Court for leave to bring proceedings on behalf of the Company, or to intervene in any proceedings to which the Company is a party, for the purpose of taking responsibility on behalf of the Company for all or part of those proceedings. The Company was not a party to any such proceedings during the year.
REMUNERATION REPORT The Board from time to time reviews the remuneration packages of all Directors and Executive Officers with due regard to performance and other relevant factors. The remuneration policy generally is to ensure the remuneration package properly reflects the person’s duties and responsibilities and that the remuneration is competitive to attract, retain and motivate employees of the highest calibre.
The remuneration of Directors and other key management personnel is not directly linked to the company’s performance.
For
per
sona
l use
onl
y
ANNUAL REPORT 2016 | 15ANNUAL REPORT 2016 | 15
The remuneration of Directors and the other key management personnel is fixed annually with some of the specified Executives being entitled to a performance bonus based on achievement of targets based on individual Key Performance Indicators (“KPIs”). The KPIs generally include measures relating to the relevant segment, covering financial, sales, and development measures. Ultimately, bonuses and discretionary payments to key management personnel are at the discretion of the Board.
Non Executive Directors’ retirement payments are limited to compulsory employer superannuation. There are no retirement and termination benefits for Executive Directors or Executives apart from those that accrue from the relevant laws such as unpaid annual leave, superannuation, long service leave and notice of termination. The Group may consider payments on termination even though legally not required, to protect its rights if it is commercially beneficial to its interests.
The key management personnel of the Group for the year ended 30 June 2016 were:
Directors
Tony Walls Chairman and Chief Executive Officer
Gary Fisher Non-Executive Director
Nick Kingsbury Independent Non Executive Director
Leigh Warren Independent Non Executive Director
Executives
Stephen Bool Chief Operating Officer – resigned 28 August 2015
Frank Volckmar Chief Operating Officer – appointed 10 August 2015
Jeremy Goddard Global Vice President, Enterprise Solutions
Adrian Rudman Global Vice President, Keystone Solutions
Scott McIntyre Managing Director EMEA
Robert Mills Global Vice President, Connect Solutions
Remuneration and other terms of employment of the Executive Director and the other key management personnel are formalised in employment agreements. These agreements may be terminated by either party with between one and three months’ notice. In the event of termination of Mr Walls’ services, Mr Walls is entitled to be paid six months’ salary.
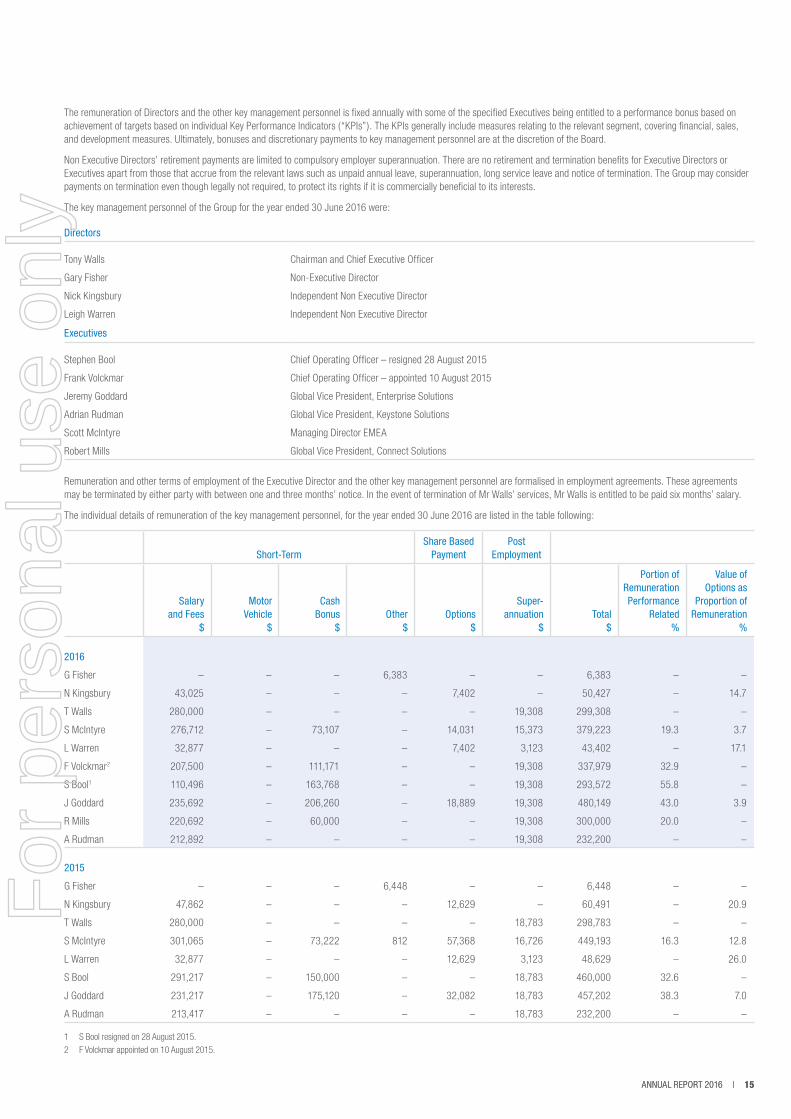
The individual details of remuneration of the key management personnel, for the year ended 30 June 2016 are listed in the table following:
Short-TermShare Based
PaymentPost
Employment
Salary and Fees
$
Motor Vehicle
$
Cash Bonus
$Other
$Options
$
Super-annuation
$Total
$
Portion of Remuneration Performance
Related%
Value of Options as
Proportion of Remuneration
%
2016
G Fisher – – – 6,383 – – 6,383 – –
N Kingsbury 43,025 – – – 7,402 – 50,427 – 14.7
T Walls 280,000 – – – – 19,308 299,308 – –
S McIntyre 276,712 – 73,107 – 14,031 15,373 379,223 19.3 3.7
L Warren 32,877 – – – 7,402 3,123 43,402 – 17.1
F Volckmar2 207,500 – 111,171 – – 19,308 337,979 32.9 –
S Bool1 110,496 – 163,768 – – 19,308 293,572 55.8 –
J Goddard 235,692 – 206,260 – 18,889 19,308 480,149 43.0 3.9
R Mills 220,692 – 60,000 – – 19,308 300,000 20.0 –
A Rudman 212,892 – – – – 19,308 232,200 – –
2015
G Fisher – – – 6,448 – – 6,448 – –
N Kingsbury 47,862 – – – 12,629 – 60,491 – 20.9
T Walls 280,000 – – – – 18,783 298,783 – –
S McIntyre 301,065 – 73,222 812 57,368 16,726 449,193 16.3 12.8
L Warren 32,877 – – – 12,629 3,123 48,629 – 26.0
S Bool 291,217 – 150,000 – – 18,783 460,000 32.6 –
J Goddard 231,217 – 175,120 – 32,082 18,783 457,202 38.3 7.0
A Rudman 213,417 – – – – 18,783 232,200 – –
1 S Bool resigned on 28 August 2015. 2 F Volckmar appointed on 10 August 2015.
For
per
sona
l use
onl
y
16 | OBJECTIVE CORPORATION LIMITED AND ITS CONTROLLED ENTITIES16 | OBJECTIVE CORPORATION LIMITED AND ITS CONTROLLED ENTITIES
DIRECTORS’ REPORT CONTINUED
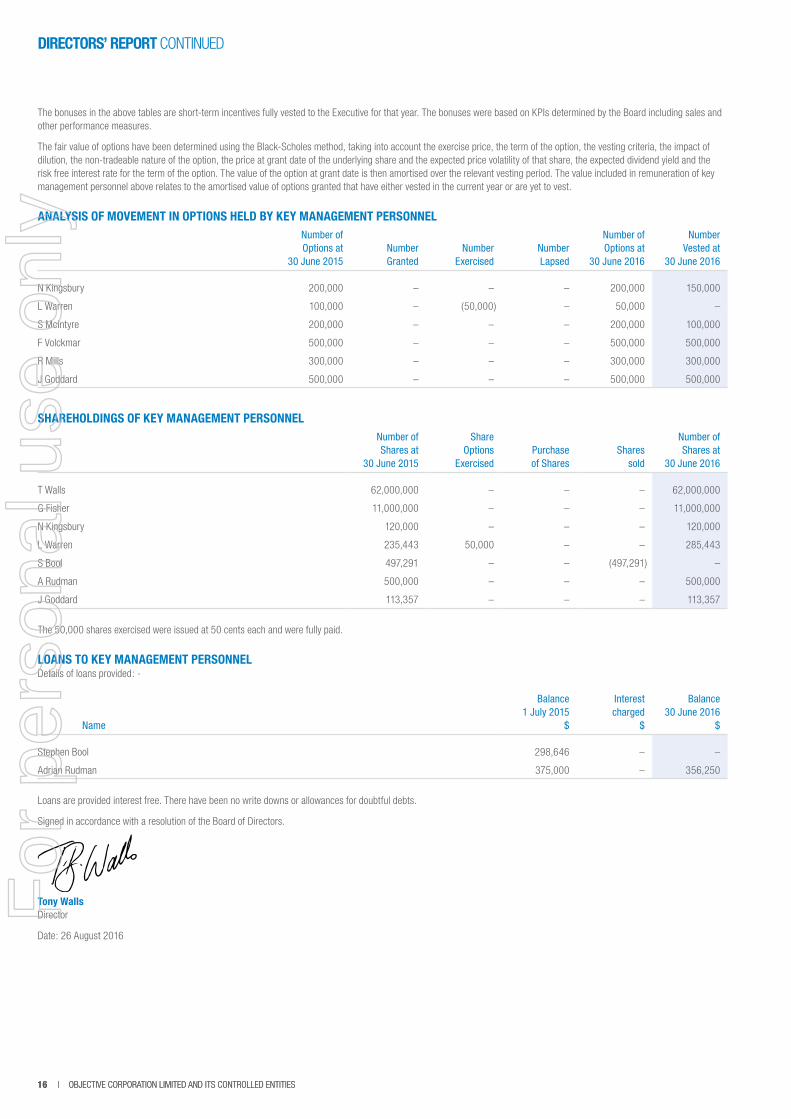
The bonuses in the above tables are short-term incentives fully vested to the Executive for that year. The bonuses were based on KPIs determined by the Board including sales and other performance measures.
The fair value of options have been determined using the Black-Scholes method, taking into account the exercise price, the term of the option, the vesting criteria, the impact of dilution, the non-tradeable nature of the option, the price at grant date of the underlying share and the expected price volatility of that share, the expected dividend yield and the risk free interest rate for the term of the option. The value of the option at grant date is then amortised over the relevant vesting period. The value included in remuneration of key management personnel above relates to the amortised value of options granted that have either vested in the current year or are yet to vest.
ANALYSIS OF MOVEMENT IN OPTIONS HELD BY KEY MANAGEMENT PERSONNELNumber of Options at
30 June 2015 Number Granted
Number Exercised
Number Lapsed
Number of Options at
30 June 2016
Number Vested at
30 June 2016
N Kingsbury 200,000 – – – 200,000 150,000
L Warren 100,000 – (50,000) – 50,000 –
S McIntyre 200,000 – – – 200,000 100,000
F Volckmar 500,000 – – – 500,000 500,000
R Mills 300,000 – – – 300,000 300,000
J Goddard 500,000 – – – 500,000 500,000
SHAREHOLDINGS OF KEY MANAGEMENT PERSONNELNumber of Shares at
30 June 2015
Share Options
ExercisedPurchase of Shares
Shares sold
Number of Shares at
30 June 2016
T Walls 62,000,000 – – – 62,000,000
G Fisher 11,000,000 – – – 11,000,000
N Kingsbury 120,000 – – – 120,000
L Warren 235,443 50,000 – – 285,443
S Bool 497,291 – – (497,291) –
A Rudman 500,000 – – – 500,000
J Goddard 113,357 – – – 113,357
The 50,000 shares exercised were issued at 50 cents each and were fully paid.
LOANS TO KEY MANAGEMENT PERSONNELDetails of loans provided: -
Name
Balance 1 July 2015
$
Interest charged
$
Balance 30 June 2016
$
Stephen Bool 298,646 – –
Adrian Rudman 375,000 – 356,250
Loans are provided interest free. There have been no write downs or allowances for doubtful debts.
Signed in accordance with a resolution of the Board of Directors.
Tony WallsDirector
Date: 26 August 2016
For
per
sona
l use
onl
y
ANNUAL REPORT 2016 | 17ANNUAL REPORT 2016 | 17
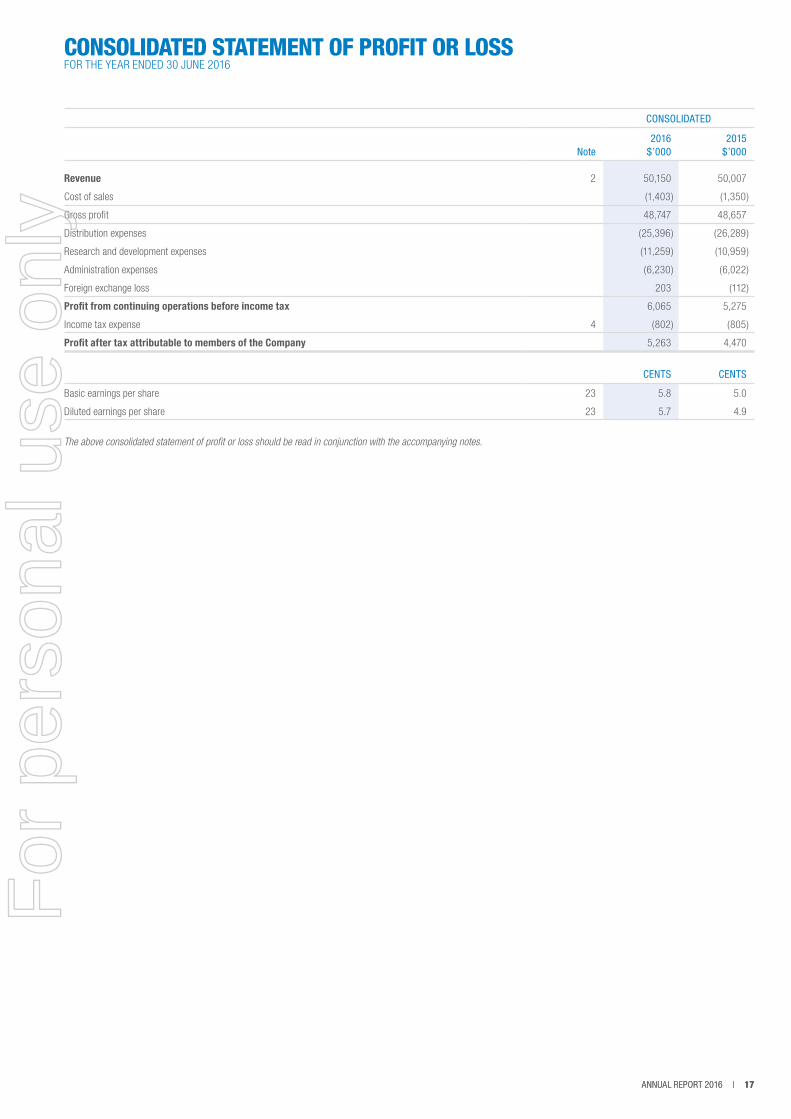
CONSOLIDATED STATEMENT OF PROFIT OR LOSSFOR THE YEAR ENDED 30 JUNE 2016
CONSOLIDATED
Note2016
$’0002015
$’000
Revenue 2 50,150 50,007
Cost of sales (1,403) (1,350)
Gross profit 48,747 48,657
Distribution expenses (25,396) (26,289)
Research and development expenses (11,259) (10,959)
Administration expenses (6,230) (6,022)
Foreign exchange loss 203 (112)
Profit from continuing operations before income tax 6,065 5,275
Income tax expense 4 (802) (805)
Profit after tax attributable to members of the Company 5,263 4,470
CENTS CENTS
Basic earnings per share 23 5.8 5.0
Diluted earnings per share 23 5.7 4.9
The above consolidated statement of profit or loss should be read in conjunction with the accompanying notes.
For
per
sona
l use
onl
y

18 | OBJECTIVE CORPORATION LIMITED AND ITS CONTROLLED ENTITIES18 | OBJECTIVE CORPORATION LIMITED AND ITS CONTROLLED ENTITIES
CONSOLIDATED STATEMENT OF COMPREHENSIVE INCOMEFOR THE YEAR ENDED 30 JUNE 2016
CONSOLIDATED
2016$’000
2015$’000
Profit for the year 5,263 4,470
Other comprehensive income
Items that may be reclassified subsequently to profit and loss
Foreign currency translation differences for foreign operations 122 690
Total comprehensive income for the year 5,385 5,160
Attributable to members of the Company 5,385 5,160
The above consolidated statement of comprehensive income should be read in conjunction with the accompanying notes.
For
per
sona
l use
onl
y
ANNUAL REPORT 2016 | 19ANNUAL REPORT 2016 | 19
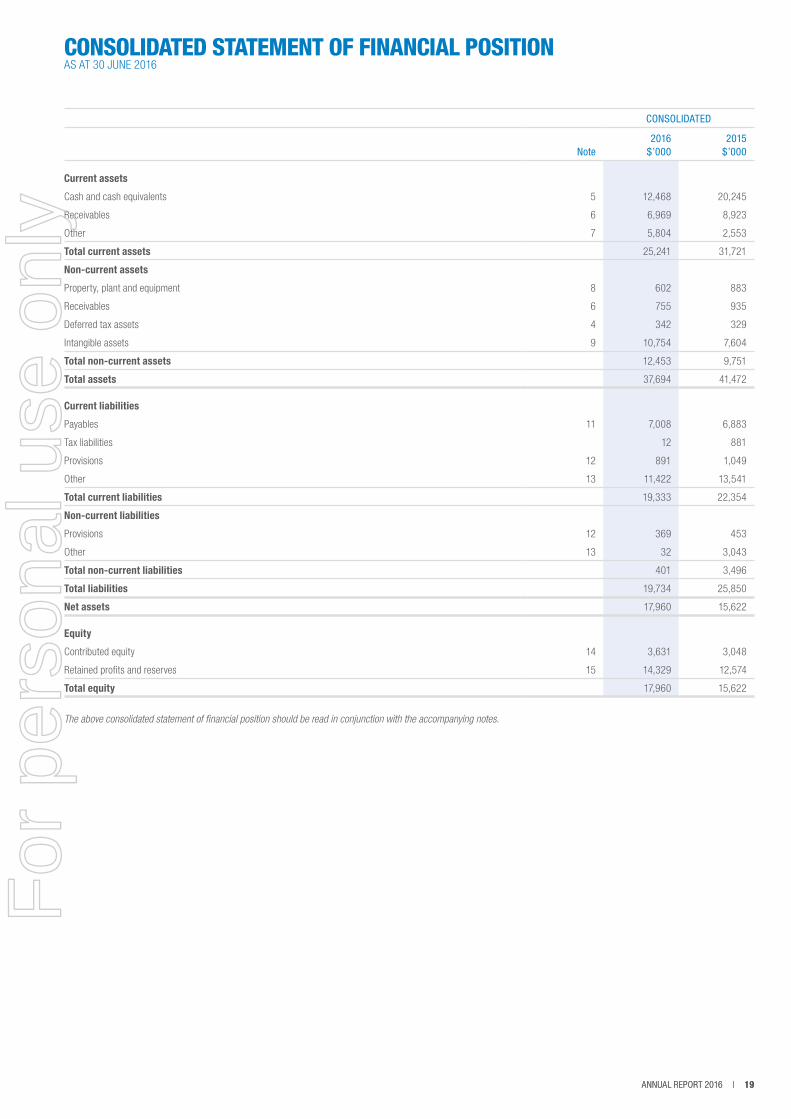
CONSOLIDATED STATEMENT OF FINANCIAL POSITIONAS AT 30 JUNE 2016
CONSOLIDATED
Note2016
$’0002015
$’000
Current assets
Cash and cash equivalents 5 12,468 20,245
Receivables 6 6,969 8,923
Other 7 5,804 2,553
Total current assets 25,241 31,721
Non-current assets
Property, plant and equipment 8 602 883
Receivables 6 755 935
Deferred tax assets 4 342 329
Intangible assets 9 10,754 7,604
Total non-current assets 12,453 9,751
Total assets 37,694 41,472
Current liabilities
Payables 11 7,008 6,883
Tax liabilities 12 881
Provisions 12 891 1,049
Other 13 11,422 13,541
Total current liabilities 19,333 22,354
Non-current liabilities
Provisions 12 369 453
Other 13 32 3,043
Total non-current liabilities 401 3,496
Total liabilities 19,734 25,850
Net assets 17,960 15,622
Equity
Contributed equity 14 3,631 3,048
Retained profits and reserves 15 14,329 12,574
Total equity 17,960 15,622
The above consolidated statement of financial position should be read in conjunction with the accompanying notes.
For
per
sona
l use
onl
y
20 | OBJECTIVE CORPORATION LIMITED AND ITS CONTROLLED ENTITIES20 | OBJECTIVE CORPORATION LIMITED AND ITS CONTROLLED ENTITIES
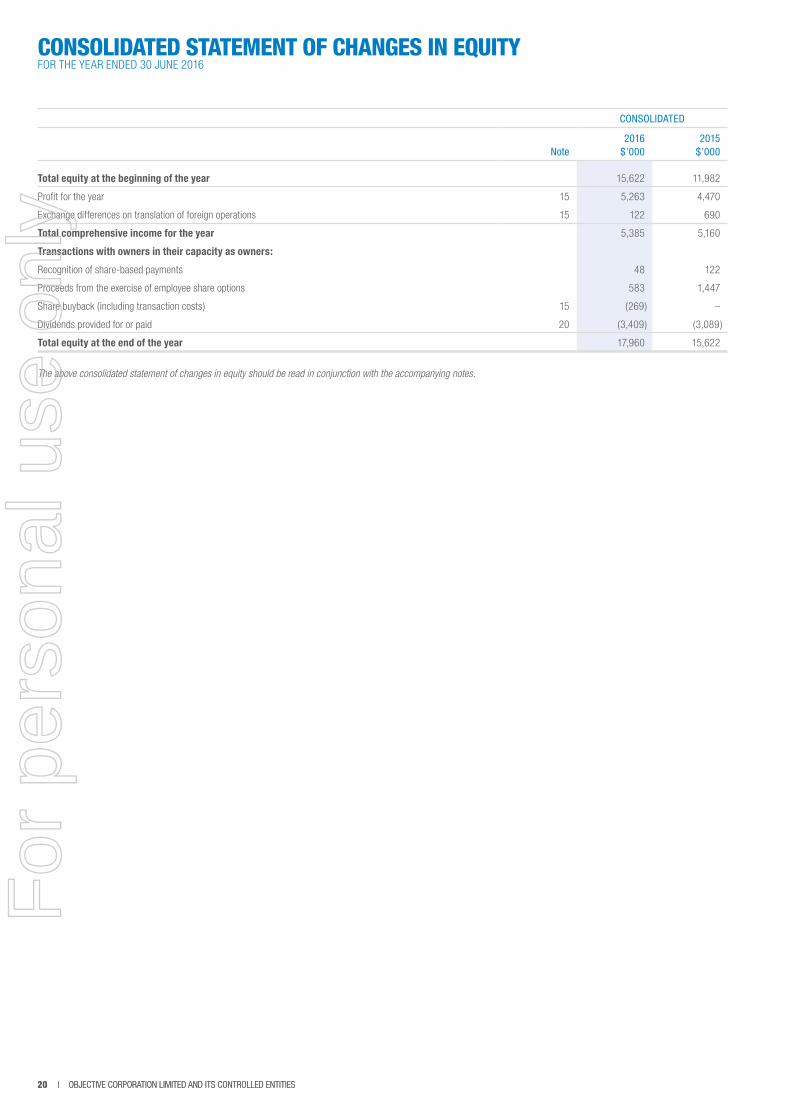
CONSOLIDATED STATEMENT OF CHANGES IN EQUITYFOR THE YEAR ENDED 30 JUNE 2016
CONSOLIDATED
Note2016
$’0002015
$’000
Total equity at the beginning of the year 15,622 11,982
Profit for the year 15 5,263 4,470
Exchange differences on translation of foreign operations 15 122 690
Total comprehensive income for the year 5,385 5,160
Transactions with owners in their capacity as owners:
Recognition of share-based payments 48 122
Proceeds from the exercise of employee share options 583 1,447
Share buyback (including transaction costs) 15 (269) –
Dividends provided for or paid 20 (3,409) (3,089)
Total equity at the end of the year 17,960 15,622
The above consolidated statement of changes in equity should be read in conjunction with the accompanying notes.
For
per
sona
l use
onl
y
ANNUAL REPORT 2016 | 21ANNUAL REPORT 2016 | 21
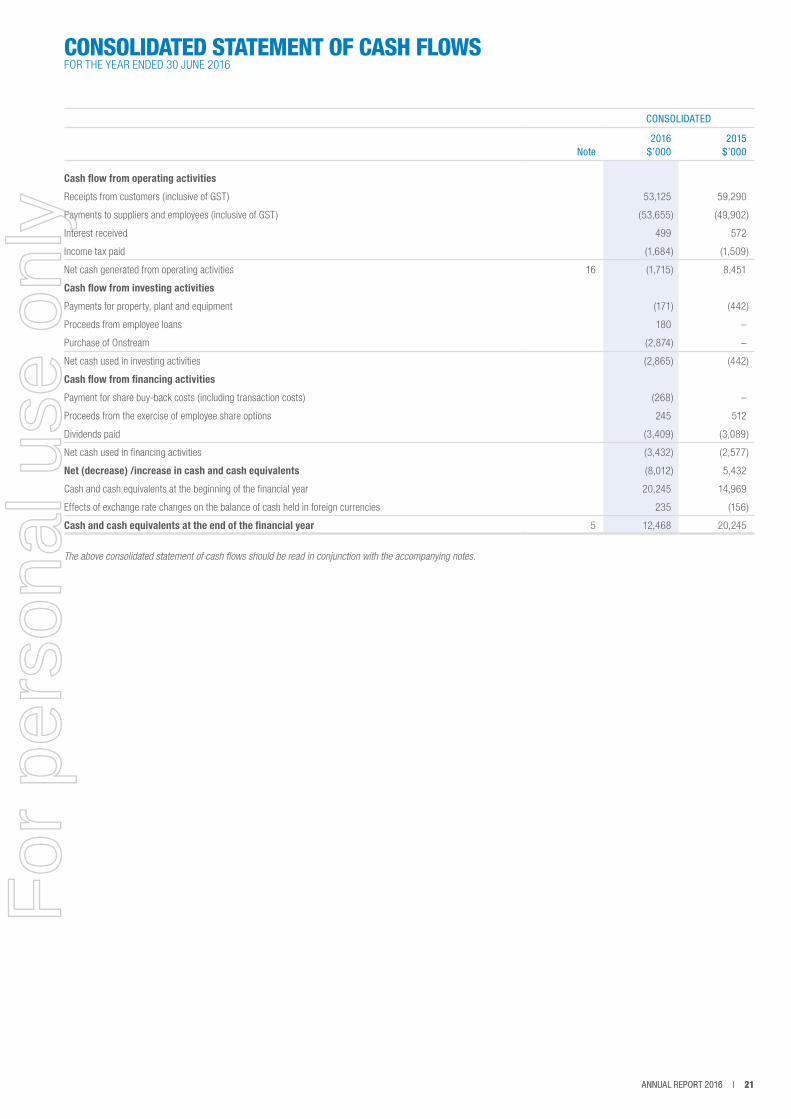
CONSOLIDATED STATEMENT OF CASH FLOWSFOR THE YEAR ENDED 30 JUNE 2016
CONSOLIDATED
Note2016
$’0002015
$’000
Cash flow from operating activities
Receipts from customers (inclusive of GST) 53,125 59,290
Payments to suppliers and employees (inclusive of GST) (53,655) (49,902)
Interest received 499 572
Income tax paid (1,684) (1,509)
Net cash generated from operating activities 16 (1,715) 8,451
Cash flow from investing activities
Payments for property, plant and equipment (171) (442)
Proceeds from employee loans 180 –
Purchase of Onstream (2,874) –
Net cash used in investing activities (2,865) (442)
Cash flow from financing activities
Payment for share buy-back costs (including transaction costs) (268) –
Proceeds from the exercise of employee share options 245 512
Dividends paid (3,409) (3,089)
Net cash used in financing activities (3,432) (2,577)
Net (decrease) /increase in cash and cash equivalents (8,012) 5,432
Cash and cash equivalents at the beginning of the financial year 20,245 14,969
Effects of exchange rate changes on the balance of cash held in foreign currencies 235 (156)
Cash and cash equivalents at the end of the financial year 5 12,468 20,245
The above consolidated statement of cash flows should be read in conjunction with the accompanying notes.
For
per
sona
l use
onl
y
22 | OBJECTIVE CORPORATION LIMITED AND ITS CONTROLLED ENTITIES22 | OBJECTIVE CORPORATION LIMITED AND ITS CONTROLLED ENTITIES
NOTES TO THE FINANCIAL STATEMENTS FOR THE YEAR ENDED 30 JUNE 2016
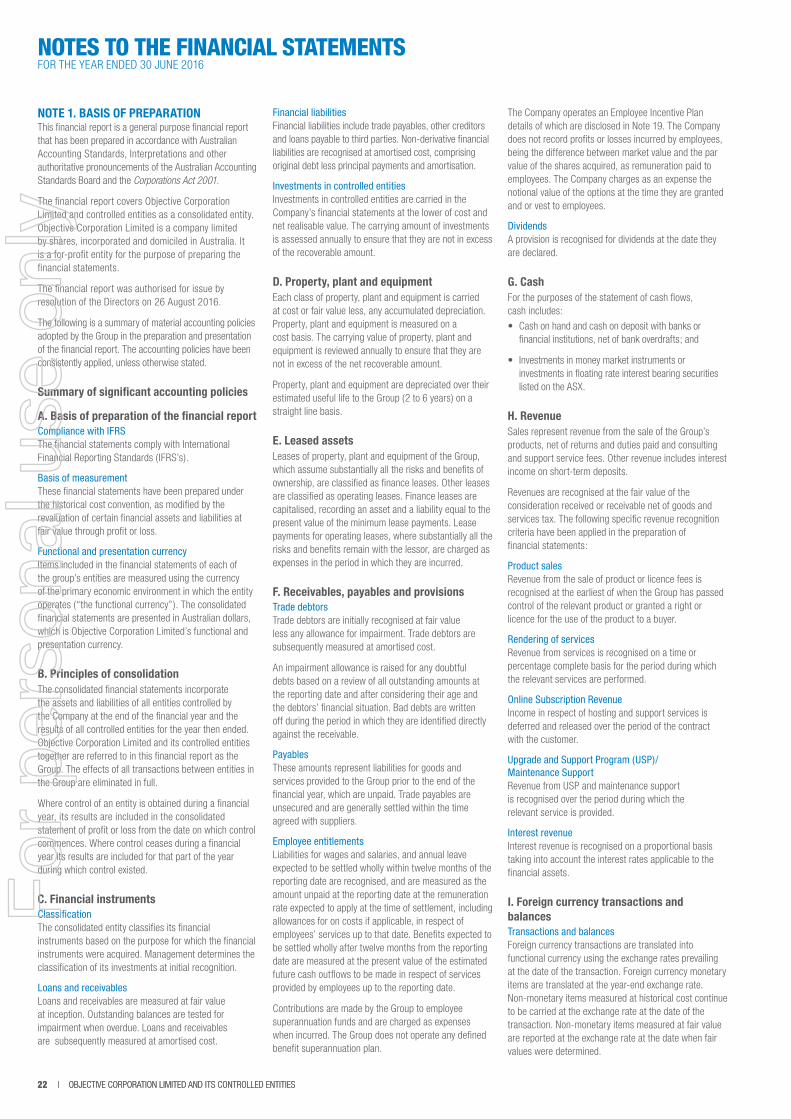
NOTE 1. BASIS OF PREPARATIONThis financial report is a general purpose financial report that has been prepared in accordance with Australian Accounting Standards, Interpretations and other authoritative pronouncements of the Australian Accounting Standards Board and the Corporations Act 2001.
The financial report covers Objective Corporation Limited and controlled entities as a consolidated entity. Objective Corporation Limited is a company limited by shares, incorporated and domiciled in Australia. It is a for-profit entity for the purpose of preparing the financial statements.
The financial report was authorised for issue by resolution of the Directors on 26 August 2016.
The following is a summary of material accounting policies adopted by the Group in the preparation and presentation of the financial report. The accounting policies have been consistently applied, unless otherwise stated.
Summary of significant accounting policies
A. Basis of preparation of the financial reportCompliance with IFRSThe financial statements comply with International Financial Reporting Standards (IFRS’s).
Basis of measurementThese financial statements have been prepared under the historical cost convention, as modified by the revaluation of certain financial assets and liabilities at fair value through profit or loss.
Functional and presentation currencyItems included in the financial statements of each of the group’s entities are measured using the currency of the primary economic environment in which the entity operates (“the functional currency”). The consolidated financial statements are presented in Australian dollars, which is Objective Corporation Limited’s functional and presentation currency.
B. Principles of consolidationThe consolidated financial statements incorporate the assets and liabilities of all entities controlled by the Company at the end of the financial year and the results of all controlled entities for the year then ended. Objective Corporation Limited and its controlled entities together are referred to in this financial report as the Group. The effects of all transactions between entities in the Group are eliminated in full.
Where control of an entity is obtained during a financial year, its results are included in the consolidated statement of profit or loss from the date on which control commences. Where control ceases during a financial year its results are included for that part of the year during which control existed.
C. Financial instrumentsClassificationThe consolidated entity classifies its financial instruments based on the purpose for which the financial instruments were acquired. Management determines the classification of its investments at initial recognition.
Loans and receivablesLoans and receivables are measured at fair value at inception. Outstanding balances are tested for impairment when overdue. Loans and receivables are subsequently measured at amortised cost.
Financial liabilitiesFinancial liabilities include trade payables, other creditors and loans payable to third parties. Non-derivative financial liabilities are recognised at amortised cost, comprising original debt less principal payments and amortisation.
Investments in controlled entitiesInvestments in controlled entities are carried in the Company’s financial statements at the lower of cost and net realisable value. The carrying amount of investments is assessed annually to ensure that they are not in excess of the recoverable amount.
D. Property, plant and equipmentEach class of property, plant and equipment is carried at cost or fair value less, any accumulated depreciation. Property, plant and equipment is measured on a cost basis. The carrying value of property, plant and equipment is reviewed annually to ensure that they are not in excess of the net recoverable amount.
Property, plant and equipment are depreciated over their estimated useful life to the Group (2 to 6 years) on a straight line basis.
E. Leased assetsLeases of property, plant and equipment of the Group, which assume substantially all the risks and benefits of ownership, are classified as finance leases. Other leases are classified as operating leases. Finance leases are capitalised, recording an asset and a liability equal to the present value of the minimum lease payments. Lease payments for operating leases, where substantially all the risks and benefits remain with the lessor, are charged as expenses in the period in which they are incurred.
F. Receivables, payables and provisionsTrade debtorsTrade debtors are initially recognised at fair value less any allowance for impairment. Trade debtors are subsequently measured at amortised cost.
An impairment allowance is raised for any doubtful debts based on a review of all outstanding amounts at the reporting date and after considering their age and the debtors’ financial situation. Bad debts are written off during the period in which they are identified directly against the receivable.
PayablesThese amounts represent liabilities for goods and services provided to the Group prior to the end of the financial year, which are unpaid. Trade payables are unsecured and are generally settled within the time agreed with suppliers.
Employee entitlementsLiabilities for wages and salaries, and annual leave expected to be settled wholly within twelve months of the reporting date are recognised, and are measured as the amount unpaid at the reporting date at the remuneration rate expected to apply at the time of settlement, including allowances for on costs if applicable, in respect of employees’ services up to that date. Benefits expected to be settled wholly after twelve months from the reporting date are measured at the present value of the estimated future cash outflows to be made in respect of services provided by employees up to the reporting date.
Contributions are made by the Group to employee superannuation funds and are charged as expenses when incurred. The Group does not operate any defined benefit superannuation plan.
The Company operates an Employee Incentive Plan details of which are disclosed in Note 19. The Company does not record profits or losses incurred by employees, being the difference between market value and the par value of the shares acquired, as remuneration paid to employees. The Company charges as an expense the notional value of the options at the time they are granted and or vest to employees.
Dividends A provision is recognised for dividends at the date they are declared.
G. CashFor the purposes of the statement of cash flows, cash includes:
• Cash on hand and cash on deposit with banks or financial institutions, net of bank overdrafts; and
• Investments in money market instruments or investments in floating rate interest bearing securities listed on the ASX.
H. RevenueSales represent revenue from the sale of the Group’s products, net of returns and duties paid and consulting and support service fees. Other revenue includes interest income on short-term deposits.
Revenues are recognised at the fair value of the consideration received or receivable net of goods and services tax. The following specific revenue recognition criteria have been applied in the preparation of financial statements:
Product sales Revenue from the sale of product or licence fees is recognised at the earliest of when the Group has passed control of the relevant product or granted a right or licence for the use of the product to a buyer.
Rendering of services Revenue from services is recognised on a time or percentage complete basis for the period during which the relevant services are performed.
Online Subscription RevenueIncome in respect of hosting and support services is deferred and released over the period of the contract with the customer.
Upgrade and Support Program (USP)/Maintenance SupportRevenue from USP and maintenance support is recognised over the period during which the relevant service is provided.
Interest revenueInterest revenue is recognised on a proportional basis taking into account the interest rates applicable to the financial assets.
I. Foreign currency transactions and balances Transactions and balancesForeign currency transactions are translated into functional currency using the exchange rates prevailing at the date of the transaction. Foreign currency monetary items are translated at the year-end exchange rate. Non-monetary items measured at historical cost continue to be carried at the exchange rate at the date of the transaction. Non-monetary items measured at fair value are reported at the exchange rate at the date when fair values were determined.
For
per
sona
l use
onl
y
ANNUAL REPORT 2016 | 23ANNUAL REPORT 2016 | 23
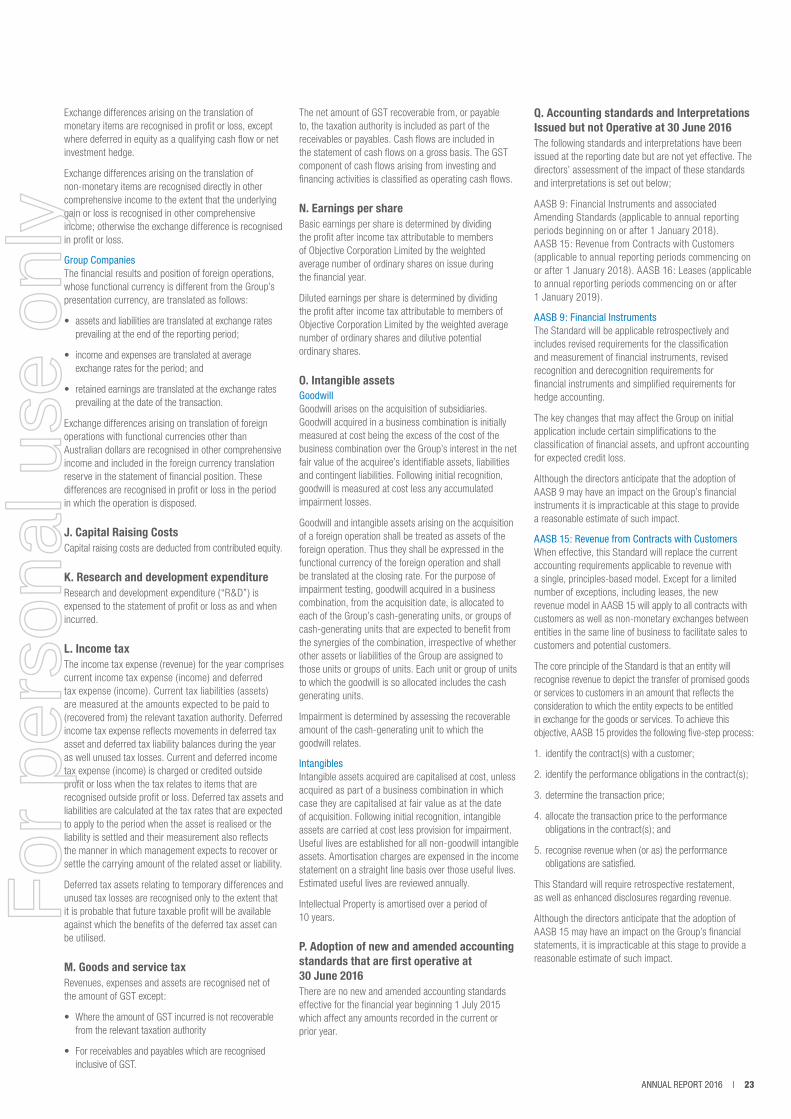
Exchange differences arising on the translation of monetary items are recognised in profit or loss, except where deferred in equity as a qualifying cash flow or net investment hedge.
Exchange differences arising on the translation of non-monetary items are recognised directly in other comprehensive income to the extent that the underlying gain or loss is recognised in other comprehensive income; otherwise the exchange difference is recognised in profit or loss.
Group CompaniesThe financial results and position of foreign operations, whose functional currency is different from the Group’s presentation currency, are translated as follows:
• assets and liabilities are translated at exchange rates prevailing at the end of the reporting period;
• income and expenses are translated at average exchange rates for the period; and
• retained earnings are translated at the exchange rates prevailing at the date of the transaction.
Exchange differences arising on translation of foreign operations with functional currencies other than Australian dollars are recognised in other comprehensive income and included in the foreign currency translation reserve in the statement of financial position. These differences are recognised in profit or loss in the period in which the operation is disposed.
J. Capital Raising CostsCapital raising costs are deducted from contributed equity.
K. Research and development expenditure Research and development expenditure (“R&D”) is expensed to the statement of profit or loss as and when incurred.
L. Income taxThe income tax expense (revenue) for the year comprises current income tax expense (income) and deferred tax expense (income). Current tax liabilities (assets) are measured at the amounts expected to be paid to (recovered from) the relevant taxation authority. Deferred income tax expense reflects movements in deferred tax asset and deferred tax liability balances during the year as well unused tax losses. Current and deferred income tax expense (income) is charged or credited outside profit or loss when the tax relates to items that are recognised outside profit or loss. Deferred tax assets and liabilities are calculated at the tax rates that are expected to apply to the period when the asset is realised or the liability is settled and their measurement also reflects the manner in which management expects to recover or settle the carrying amount of the related asset or liability.
Deferred tax assets relating to temporary differences and unused tax losses are recognised only to the extent that it is probable that future taxable profit will be available against which the benefits of the deferred tax asset can be utilised.
M. Goods and service tax Revenues, expenses and assets are recognised net of the amount of GST except:
• Where the amount of GST incurred is not recoverable from the relevant taxation authority
• For receivables and payables which are recognised inclusive of GST.
The net amount of GST recoverable from, or payable to, the taxation authority is included as part of the receivables or payables. Cash flows are included in the statement of cash flows on a gross basis. The GST component of cash flows arising from investing and financing activities is classified as operating cash flows.
N. Earnings per share Basic earnings per share is determined by dividing the profit after income tax attributable to members of Objective Corporation Limited by the weighted average number of ordinary shares on issue during the financial year.
Diluted earnings per share is determined by dividing the profit after income tax attributable to members of Objective Corporation Limited by the weighted average number of ordinary shares and dilutive potential ordinary shares.
O. Intangible assetsGoodwillGoodwill arises on the acquisition of subsidiaries. Goodwill acquired in a business combination is initially measured at cost being the excess of the cost of the business combination over the Group’s interest in the net fair value of the acquiree’s identifiable assets, liabilities and contingent liabilities. Following initial recognition, goodwill is measured at cost less any accumulated impairment losses.
Goodwill and intangible assets arising on the acquisition of a foreign operation shall be treated as assets of the foreign operation. Thus they shall be expressed in the functional currency of the foreign operation and shall be translated at the closing rate. For the purpose of impairment testing, goodwill acquired in a business combination, from the acquisition date, is allocated to each of the Group’s cash-generating units, or groups of cash-generating units that are expected to benefit from the synergies of the combination, irrespective of whether other assets or liabilities of the Group are assigned to those units or groups of units. Each unit or group of units to which the goodwill is so allocated includes the cash generating units.
Impairment is determined by assessing the recoverable amount of the cash-generating unit to which the goodwill relates.
IntangiblesIntangible assets acquired are capitalised at cost, unless acquired as part of a business combination in which case they are capitalised at fair value as at the date of acquisition. Following initial recognition, intangible assets are carried at cost less provision for impairment. Useful lives are established for all non-goodwill intangible assets. Amortisation charges are expensed in the income statement on a straight line basis over those useful lives. Estimated useful lives are reviewed annually.
Intellectual Property is amortised over a period of 10 years.
P. Adoption of new and amended accounting standards that are first operative at 30 June 2016There are no new and amended accounting standards effective for the financial year beginning 1 July 2015 which affect any amounts recorded in the current or prior year.
Q. Accounting standards and Interpretations Issued but not Operative at 30 June 2016The following standards and interpretations have been issued at the reporting date but are not yet effective. The directors’ assessment of the impact of these standards and interpretations is set out below;
AASB 9: Financial Instruments and associated Amending Standards (applicable to annual reporting periods beginning on or after 1 January 2018). AASB 15: Revenue from Contracts with Customers (applicable to annual reporting periods commencing on or after 1 January 2018). AASB 16: Leases (applicable to annual reporting periods commencing on or after 1 January 2019).
AASB 9: Financial Instruments The Standard will be applicable retrospectively and includes revised requirements for the classification and measurement of financial instruments, revised recognition and derecognition requirements for financial instruments and simplified requirements for hedge accounting.
The key changes that may affect the Group on initial application include certain simplifications to the classification of financial assets, and upfront accounting for expected credit loss.
Although the directors anticipate that the adoption of AASB 9 may have an impact on the Group’s financial instruments it is impracticable at this stage to provide a reasonable estimate of such impact.
AASB 15: Revenue from Contracts with CustomersWhen effective, this Standard will replace the current accounting requirements applicable to revenue with a single, principles-based model. Except for a limited number of exceptions, including leases, the new revenue model in AASB 15 will apply to all contracts with customers as well as non-monetary exchanges between entities in the same line of business to facilitate sales to customers and potential customers.
The core principle of the Standard is that an entity will recognise revenue to depict the transfer of promised goods or services to customers in an amount that reflects the consideration to which the entity expects to be entitled in exchange for the goods or services. To achieve this objective, AASB 15 provides the following five-step process:
1. identify the contract(s) with a customer;
2. identify the performance obligations in the contract(s);
3. determine the transaction price;
4. allocate the transaction price to the performance obligations in the contract(s); and
5. recognise revenue when (or as) the performance obligations are satisfied.
This Standard will require retrospective restatement, as well as enhanced disclosures regarding revenue.
Although the directors anticipate that the adoption of AASB 15 may have an impact on the Group’s financial statements, it is impracticable at this stage to provide a reasonable estimate of such impact.
For
per
sona
l use
onl
y
24 | OBJECTIVE CORPORATION LIMITED AND ITS CONTROLLED ENTITIES24 | OBJECTIVE CORPORATION LIMITED AND ITS CONTROLLED ENTITIES
NOTES TO THE FINANCIAL STATEMENTS CONTINUED
NOTE 1. BASIS OF PREPARATION CONTINUED
Q. Accounting standards and Interpretations Issued but not Operative at 30 June 2016 continued
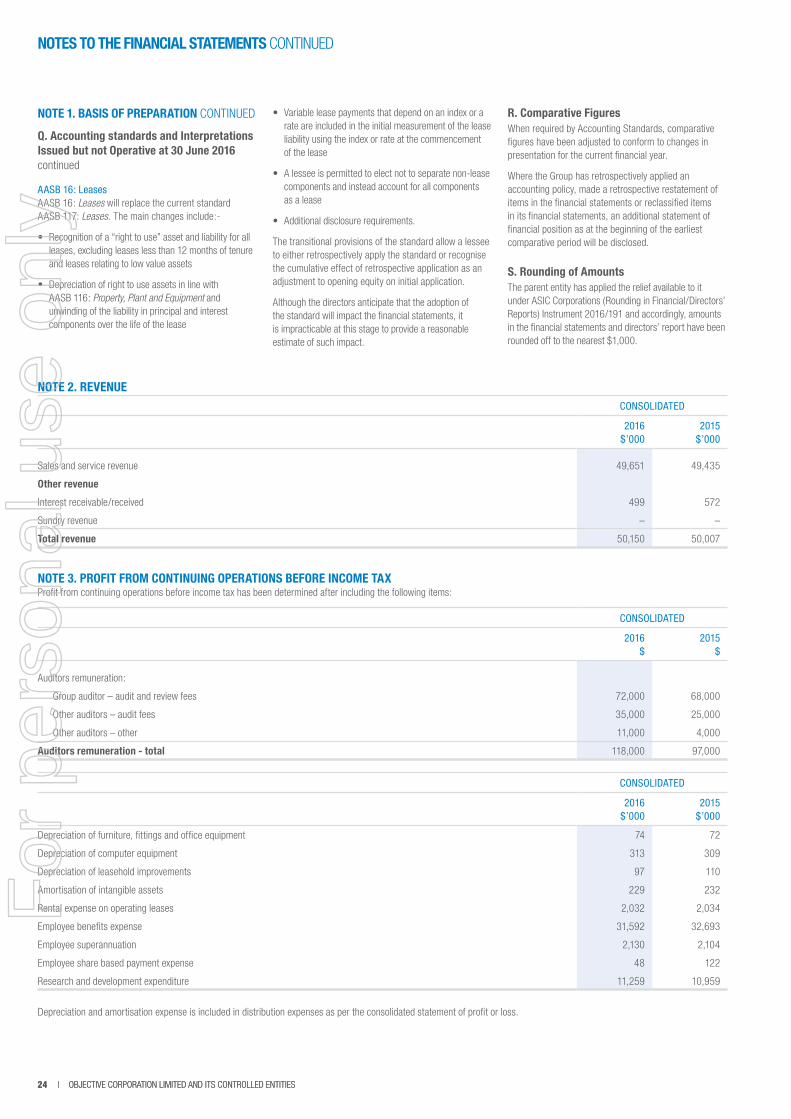
AASB 16: Leases AASB 16: Leases will replace the current standard AASB 117: Leases. The main changes include:-
• Recognition of a “right to use” asset and liability for all leases, excluding leases less than 12 months of tenure and leases relating to low value assets
• Depreciation of right to use assets in line with AASB 116: Property, Plant and Equipment and unwinding of the liability in principal and interest components over the life of the lease
• Variable lease payments that depend on an index or a rate are included in the initial measurement of the lease liability using the index or rate at the commencement of the lease
• A lessee is permitted to elect not to separate non-lease components and instead account for all components as a lease
• Additional disclosure requirements.
The transitional provisions of the standard allow a lessee to either retrospectively apply the standard or recognise the cumulative effect of retrospective application as an adjustment to opening equity on initial application.
Although the directors anticipate that the adoption of the standard will impact the financial statements, it is impracticable at this stage to provide a reasonable estimate of such impact.
R. Comparative FiguresWhen required by Accounting Standards, comparative figures have been adjusted to conform to changes in presentation for the current financial year.
Where the Group has retrospectively applied an accounting policy, made a retrospective restatement of items in the financial statements or reclassified items in its financial statements, an additional statement of financial position as at the beginning of the earliest comparative period will be disclosed.
S. Rounding of AmountsThe parent entity has applied the relief available to it under ASIC Corporations (Rounding in Financial/Directors’ Reports) Instrument 2016/191 and accordingly, amounts in the financial statements and directors’ report have been rounded off to the nearest $1,000.
NOTE 2. REVENUECONSOLIDATED
2016$’000
2015$’000
Sales and service revenue 49,651 49,435
Other revenue
Interest receivable/received 499 572
Sundry revenue – –
Total revenue 50,150 50,007
NOTE 3. PROFIT FROM CONTINUING OPERATIONS BEFORE INCOME TAXProfit from continuing operations before income tax has been determined after including the following items:
CONSOLIDATED
2016$
2015$
Auditors remuneration:
Group auditor – audit and review fees 72,000 68,000
Other auditors – audit fees 35,000 25,000
Other auditors – other 11,000 4,000
Auditors remuneration - total 118,000 97,000
CONSOLIDATED
2016$’000
2015$’000
Depreciation of furniture, fittings and office equipment 74 72
Depreciation of computer equipment 313 309
Depreciation of leasehold improvements 97 110
Amortisation of intangible assets 229 232
Rental expense on operating leases 2,032 2,034
Employee benefits expense 31,592 32,693
Employee superannuation 2,130 2,104
Employee share based payment expense 48 122
Research and development expenditure 11,259 10,959
Depreciation and amortisation expense is included in distribution expenses as per the consolidated statement of profit or loss.
For
per
sona
l use
onl
y
ANNUAL REPORT 2016 | 25ANNUAL REPORT 2016 | 25
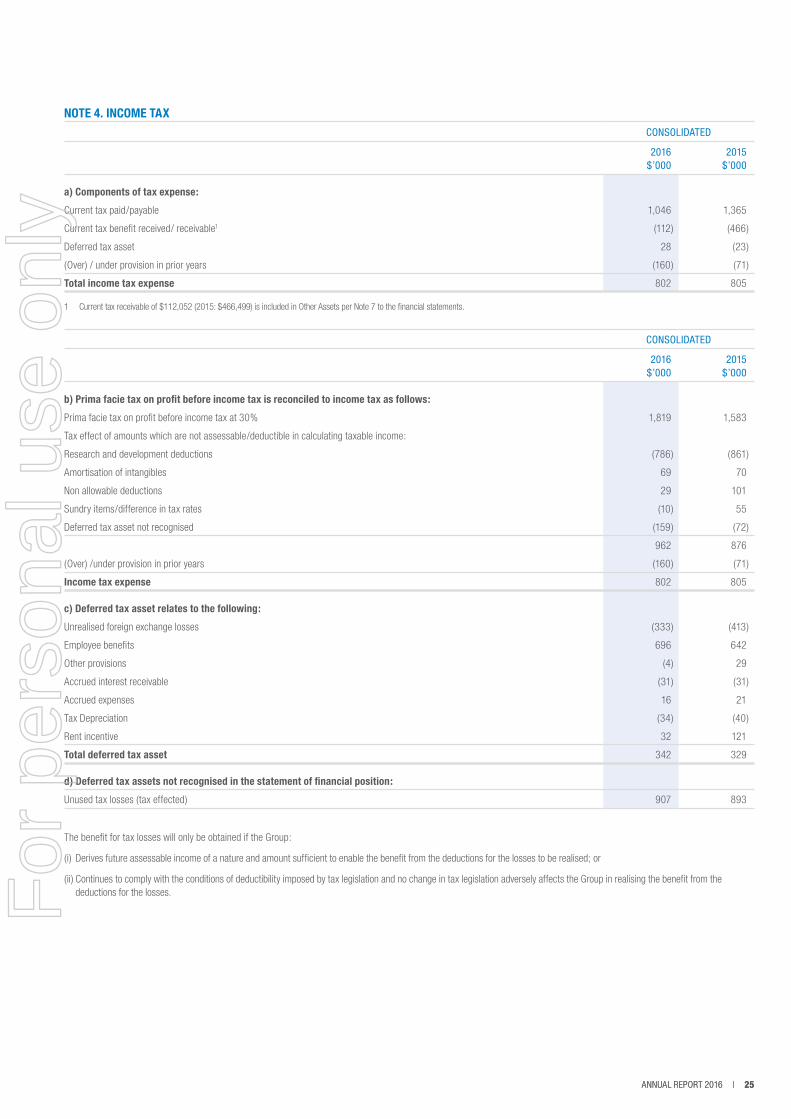
NOTE 4. INCOME TAXCONSOLIDATED
2016$’000
2015$’000
a) Components of tax expense:
Current tax paid/payable 1,046 1,365
Current tax benefit received/ receivable1 (112) (466)
Deferred tax asset 28 (23)
(Over) / under provision in prior years (160) (71)
Total income tax expense 802 805
1 Current tax receivable of $112,052 (2015: $466,499) is included in Other Assets per Note 7 to the financial statements.
CONSOLIDATED
2016$’000
2015$’000
b) Prima facie tax on profit before income tax is reconciled to income tax as follows:
Prima facie tax on profit before income tax at 30% 1,819 1,583
Tax effect of amounts which are not assessable/deductible in calculating taxable income:
Research and development deductions (786) (861)
Amortisation of intangibles 69 70
Non allowable deductions 29 101
Sundry items/difference in tax rates (10) 55
Deferred tax asset not recognised (159) (72)
962 876
(Over) /under provision in prior years (160) (71)
Income tax expense 802 805
c) Deferred tax asset relates to the following:
Unrealised foreign exchange losses (333) (413)
Employee benefits 696 642
Other provisions (4) 29
Accrued interest receivable (31) (31)
Accrued expenses 16 21
Tax Depreciation (34) (40)
Rent incentive 32 121
Total deferred tax asset 342 329
d) Deferred tax assets not recognised in the statement of financial position:
Unused tax losses (tax effected) 907 893
The benefit for tax losses will only be obtained if the Group:
(i) Derives future assessable income of a nature and amount sufficient to enable the benefit from the deductions for the losses to be realised; or
(ii) Continues to comply with the conditions of deductibility imposed by tax legislation and no change in tax legislation adversely affects the Group in realising the benefit from the deductions for the losses.F
or p
erso
nal u
se o
nly
26 | OBJECTIVE CORPORATION LIMITED AND ITS CONTROLLED ENTITIES26 | OBJECTIVE CORPORATION LIMITED AND ITS CONTROLLED ENTITIES
NOTES TO THE FINANCIAL STATEMENTS CONTINUED
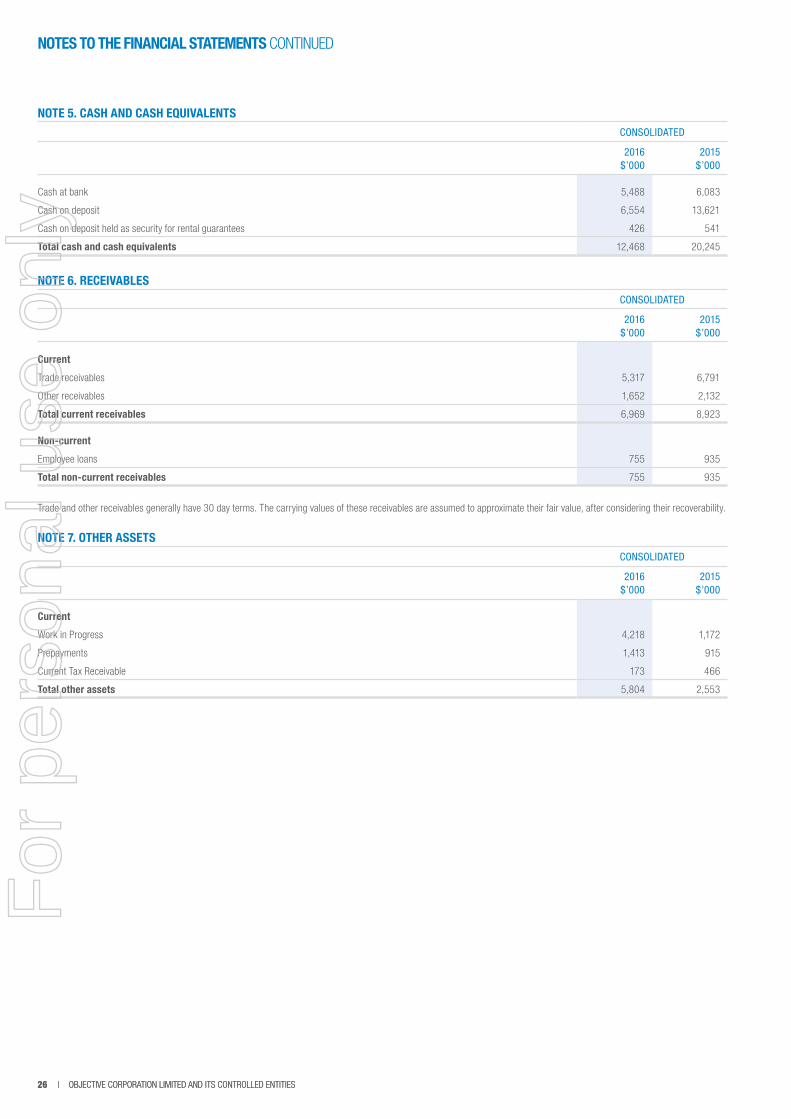
NOTE 5. CASH AND CASH EQUIVALENTSCONSOLIDATED
2016$’000
2015$’000
Cash at bank 5,488 6,083
Cash on deposit 6,554 13,621
Cash on deposit held as security for rental guarantees 426 541
Total cash and cash equivalents 12,468 20,245
NOTE 6. RECEIVABLESCONSOLIDATED
2016$’000
2015$’000
Current
Trade receivables 5,317 6,791
Other receivables 1,652 2,132
Total current receivables 6,969 8,923
Non-current
Employee loans 755 935
Total non-current receivables 755 935
Trade and other receivables generally have 30 day terms. The carrying values of these receivables are assumed to approximate their fair value, after considering their recoverability.
NOTE 7. OTHER ASSETS CONSOLIDATED
2016$’000
2015$’000
Current
Work in Progress 4,218 1,172
Prepayments 1,413 915
Current Tax Receivable 173 466
Total other assets 5,804 2,553
For
per
sona
l use
onl
y
ANNUAL REPORT 2016 | 27ANNUAL REPORT 2016 | 27
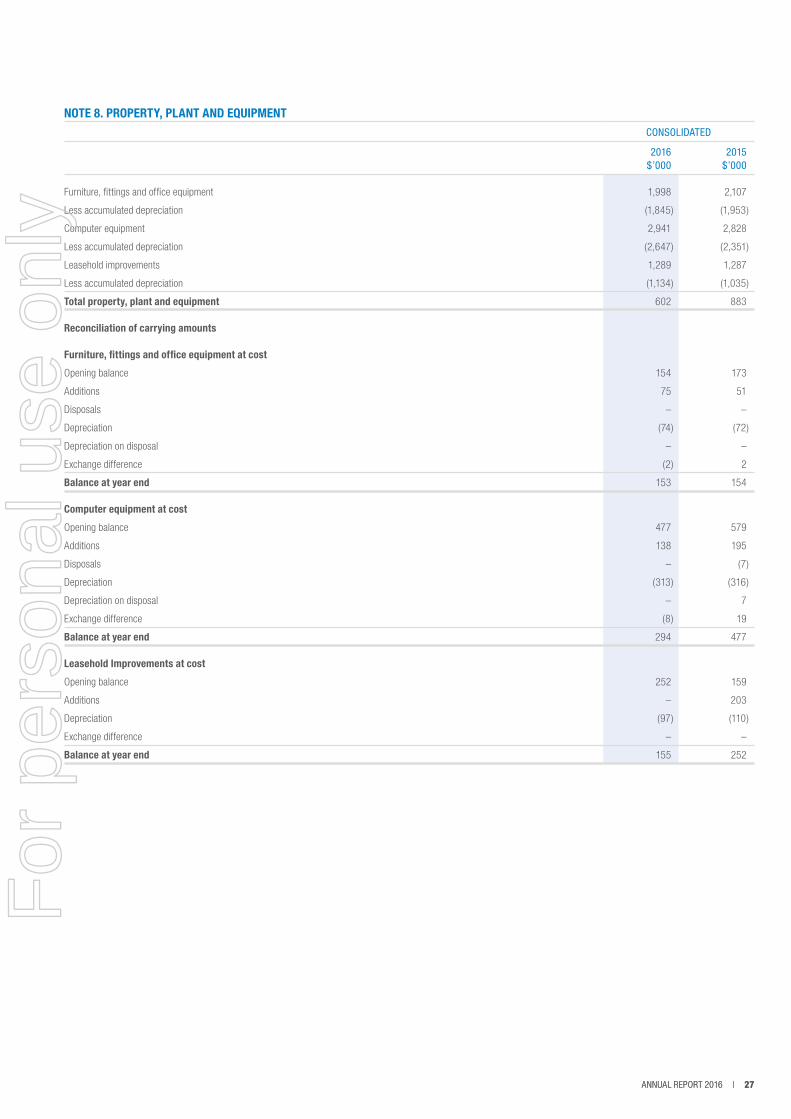
NOTE 8. PROPERTY, PLANT AND EQUIPMENTCONSOLIDATED
2016$’000
2015$’000
Furniture, fittings and office equipment 1,998 2,107
Less accumulated depreciation (1,845) (1,953)
Computer equipment 2,941 2,828
Less accumulated depreciation (2,647) (2,351)
Leasehold improvements 1,289 1,287
Less accumulated depreciation (1,134) (1,035)
Total property, plant and equipment 602 883
Reconciliation of carrying amounts
Furniture, fittings and office equipment at cost
Opening balance 154 173
Additions 75 51
Disposals – –
Depreciation (74) (72)
Depreciation on disposal – –
Exchange difference (2) 2
Balance at year end 153 154
Computer equipment at cost
Opening balance 477 579
Additions 138 195
Disposals – (7)
Depreciation (313) (316)
Depreciation on disposal – 7
Exchange difference (8) 19
Balance at year end 294 477
Leasehold Improvements at cost
Opening balance 252 159
Additions – 203
Depreciation (97) (110)
Exchange difference – –
Balance at year end 155 252
For
per
sona
l use
onl
y
28 | OBJECTIVE CORPORATION LIMITED AND ITS CONTROLLED ENTITIES28 | OBJECTIVE CORPORATION LIMITED AND ITS CONTROLLED ENTITIES
NOTES TO THE FINANCIAL STATEMENTS CONTINUED
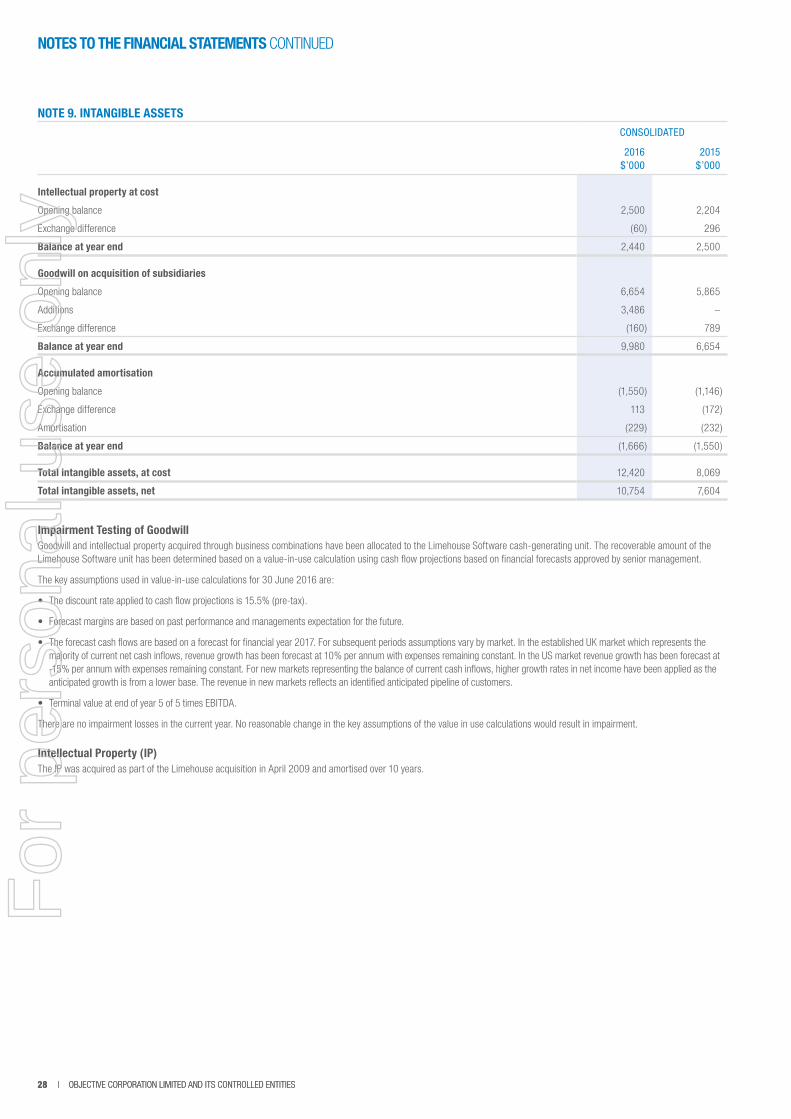
NOTE 9. INTANGIBLE ASSETSCONSOLIDATED
2016$’000
2015$’000
Intellectual property at cost
Opening balance 2,500 2,204
Exchange difference (60) 296
Balance at year end 2,440 2,500
Goodwill on acquisition of subsidiaries
Opening balance 6,654 5,865
Additions 3,486 –
Exchange difference (160) 789
Balance at year end 9,980 6,654
Accumulated amortisation
Opening balance (1,550) (1,146)
Exchange difference 113 (172)
Amortisation (229) (232)
Balance at year end (1,666) (1,550)
Total intangible assets, at cost 12,420 8,069
Total intangible assets, net 10,754 7,604
Impairment Testing of GoodwillGoodwill and intellectual property acquired through business combinations have been allocated to the Limehouse Software cash-generating unit. The recoverable amount of the Limehouse Software unit has been determined based on a value-in-use calculation using cash flow projections based on financial forecasts approved by senior management.
The key assumptions used in value-in-use calculations for 30 June 2016 are:
• The discount rate applied to cash flow projections is 15.5% (pre-tax).
• Forecast margins are based on past performance and managements expectation for the future.
• The forecast cash flows are based on a forecast for financial year 2017. For subsequent periods assumptions vary by market. In the established UK market which represents the majority of current net cash inflows, revenue growth has been forecast at 10% per annum with expenses remaining constant. In the US market revenue growth has been forecast at -15% per annum with expenses remaining constant. For new markets representing the balance of current cash inflows, higher growth rates in net income have been applied as the anticipated growth is from a lower base. The revenue in new markets reflects an identified anticipated pipeline of customers.
• Terminal value at end of year 5 of 5 times EBITDA.
There are no impairment losses in the current year. No reasonable change in the key assumptions of the value in use calculations would result in impairment.
Intellectual Property (IP)The IP was acquired as part of the Limehouse acquisition in April 2009 and amortised over 10 years.
For
per
sona
l use
onl
y
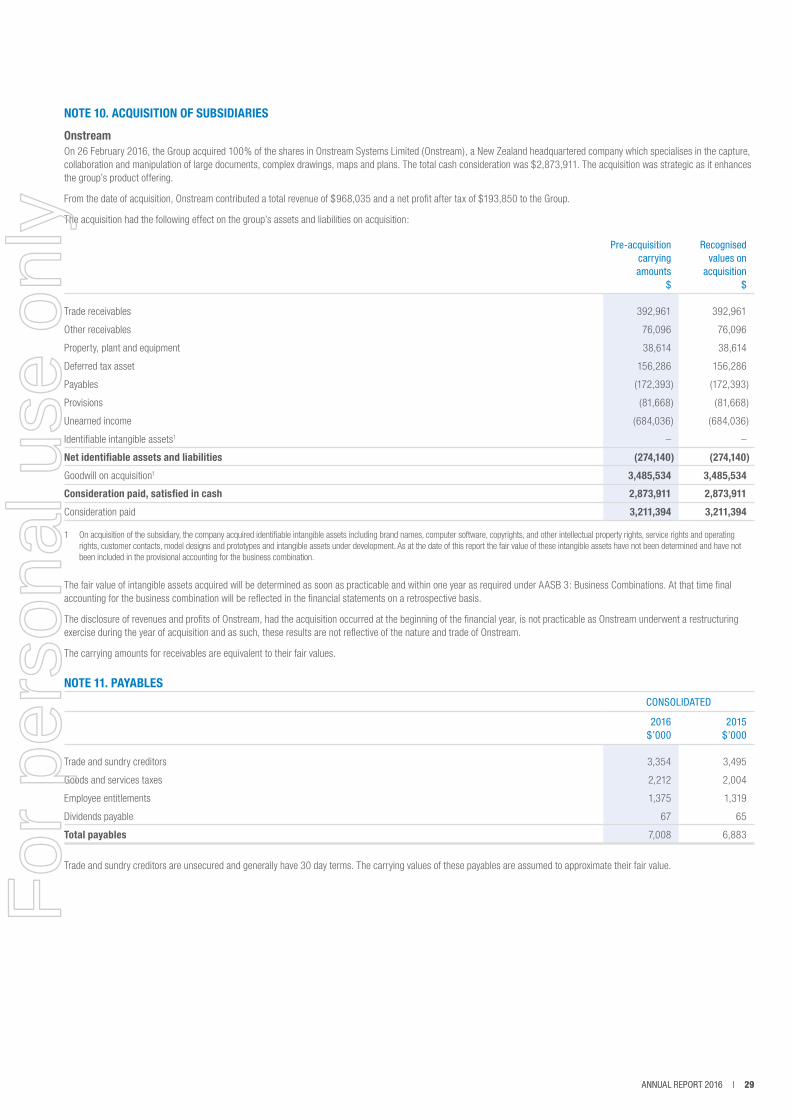
ANNUAL REPORT 2016 | 29ANNUAL REPORT 2016 | 29
NOTE 10. ACQUISITION OF SUBSIDIARIES
OnstreamOn 26 February 2016, the Group acquired 100% of the shares in Onstream Systems Limited (Onstream), a New Zealand headquartered company which specialises in the capture, collaboration and manipulation of large documents, complex drawings, maps and plans. The total cash consideration was $2,873,911. The acquisition was strategic as it enhances the group’s product offering.
From the date of acquisition, Onstream contributed a total revenue of $968,035 and a net profit after tax of $193,850 to the Group.
The acquisition had the following effect on the group’s assets and liabilities on acquisition:
Pre-acquisition carrying amounts
$
Recognised values on
acquisition$
Trade receivables 392,961 392,961
Other receivables 76,096 76,096
Property, plant and equipment 38,614 38,614
Deferred tax asset 156,286 156,286
Payables (172,393) (172,393)
Provisions (81,668) (81,668)
Unearned income (684,036) (684,036)
Identifiable intangible assets1 – –
Net identifiable assets and liabilities (274,140) (274,140)
Goodwill on acquisition1 3,485,534 3,485,534
Consideration paid, satisfied in cash 2,873,911 2,873,911
Consideration paid 3,211,394 3,211,394
1 On acquisition of the subsidiary, the company acquired identifiable intangible assets including brand names, computer software, copyrights, and other intellectual property rights, service rights and operating rights, customer contacts, model designs and prototypes and intangible assets under development. As at the date of this report the fair value of these intangible assets have not been determined and have not been included in the provisional accounting for the business combination.
The fair value of intangible assets acquired will be determined as soon as practicable and within one year as required under AASB 3: Business Combinations. At that time final accounting for the business combination will be reflected in the financial statements on a retrospective basis.
The disclosure of revenues and profits of Onstream, had the acquisition occurred at the beginning of the financial year, is not practicable as Onstream underwent a restructuring exercise during the year of acquisition and as such, these results are not reflective of the nature and trade of Onstream.
The carrying amounts for receivables are equivalent to their fair values.
NOTE 11. PAYABLESCONSOLIDATED
2016$’000
2015$’000
Trade and sundry creditors 3,354 3,495
Goods and services taxes 2,212 2,004
Employee entitlements 1,375 1,319
Dividends payable 67 65
Total payables 7,008 6,883
Trade and sundry creditors are unsecured and generally have 30 day terms. The carrying values of these payables are assumed to approximate their fair value.
For
per
sona
l use
onl
y
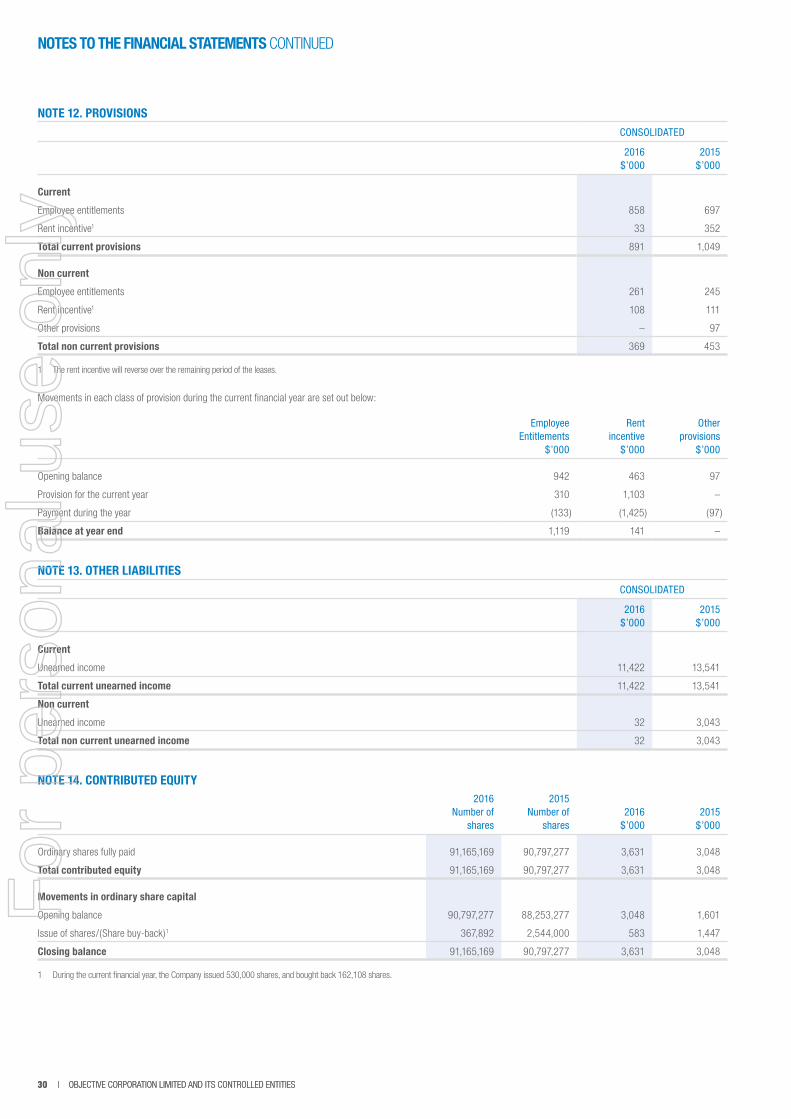
30 | OBJECTIVE CORPORATION LIMITED AND ITS CONTROLLED ENTITIES30 | OBJECTIVE CORPORATION LIMITED AND ITS CONTROLLED ENTITIES
NOTES TO THE FINANCIAL STATEMENTS CONTINUED
NOTE 12. PROVISIONSCONSOLIDATED
2016$’000
2015$’000
Current
Employee entitlements 858 697
Rent incentive1 33 352
Total current provisions 891 1,049
Non current
Employee entitlements 261 245
Rent incentive1 108 111
Other provisions – 97
Total non current provisions 369 453
1 The rent incentive will reverse over the remaining period of the leases.
Movements in each class of provision during the current financial year are set out below:
EmployeeEntitlements
$’000
Rentincentive
$’000
Otherprovisions
$’000
Opening balance 942 463 97
Provision for the current year 310 1,103 –
Payment during the year (133) (1,425) (97)
Balance at year end 1,119 141 –
NOTE 13. OTHER LIABILITIESCONSOLIDATED
2016$’000
2015$’000
Current
Unearned income 11,422 13,541
Total current unearned income 11,422 13,541
Non current
Unearned income 32 3,043
Total non current unearned income 32 3,043
NOTE 14. CONTRIBUTED EQUITY2016
Number ofshares
2015Number of
shares2016
$’0002015
$’000
Ordinary shares fully paid 91,165,169 90,797,277 3,631 3,048
Total contributed equity 91,165,169 90,797,277 3,631 3,048
Movements in ordinary share capital
Opening balance 90,797,277 88,253,277 3,048 1,601
Issue of shares/(Share buy-back)1 367,892 2,544,000 583 1,447
Closing balance 91,165,169 90,797,277 3,631 3,048
1 During the current financial year, the Company issued 530,000 shares, and bought back 162,108 shares.
For
per
sona
l use
onl
y
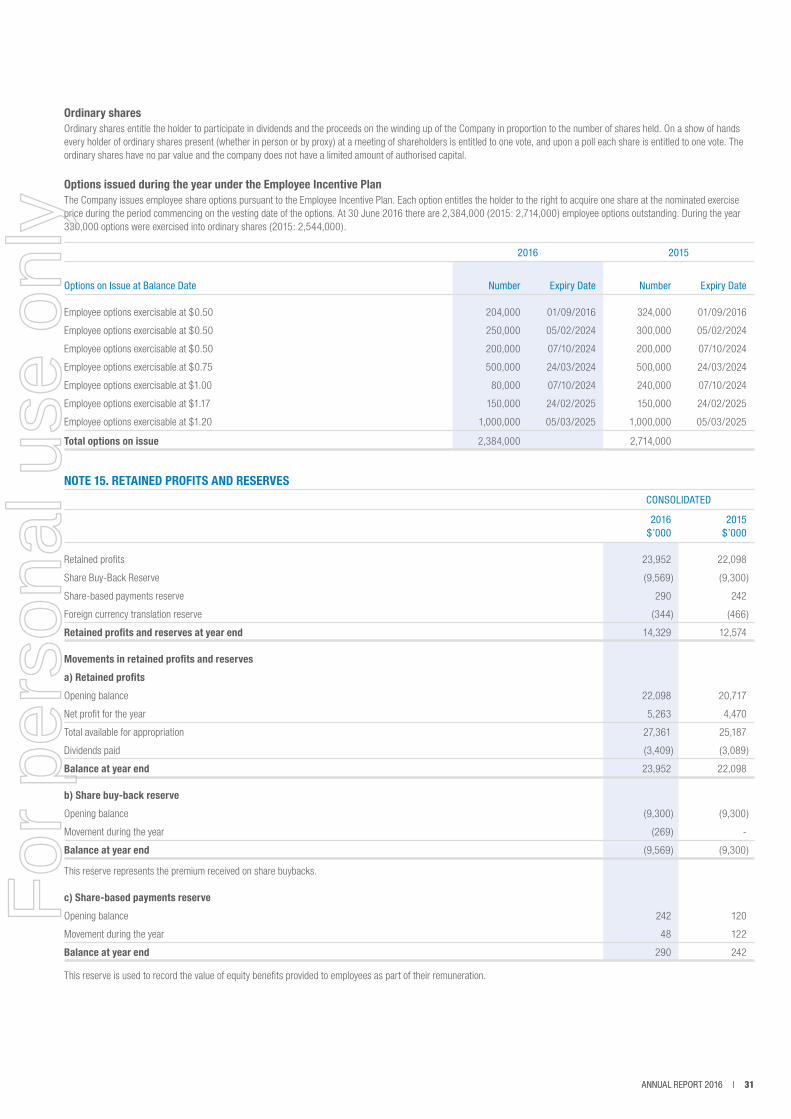
ANNUAL REPORT 2016 | 31ANNUAL REPORT 2016 | 31
Ordinary sharesOrdinary shares entitle the holder to participate in dividends and the proceeds on the winding up of the Company in proportion to the number of shares held. On a show of hands every holder of ordinary shares present (whether in person or by proxy) at a meeting of shareholders is entitled to one vote, and upon a poll each share is entitled to one vote. The ordinary shares have no par value and the company does not have a limited amount of authorised capital.
Options issued during the year under the Employee Incentive PlanThe Company issues employee share options pursuant to the Employee Incentive Plan. Each option entitles the holder to the right to acquire one share at the nominated exercise price during the period commencing on the vesting date of the options. At 30 June 2016 there are 2,384,000 (2015: 2,714,000) employee options outstanding. During the year 330,000 options were exercised into ordinary shares (2015: 2,544,000).
2016 2015
Options on Issue at Balance Date Number
Expiry Date Number Expiry Date
Employee options exercisable at $0.50 204,000 01/09/2016 324,000 01/09/2016
Employee options exercisable at $0.50 250,000 05/02/2024 300,000 05/02/2024
Employee options exercisable at $0.50 200,000 07/10/2024 200,000 07/10/2024
Employee options exercisable at $0.75 500,000 24/03/2024 500,000 24/03/2024
Employee options exercisable at $1.00 80,000 07/10/2024 240,000 07/10/2024
Employee options exercisable at $1.17 150,000 24/02/2025 150,000 24/02/2025
Employee options exercisable at $1.20 1,000,000 05/03/2025 1,000,000 05/03/2025
Total options on issue 2,384,000 2,714,000
NOTE 15. RETAINED PROFITS AND RESERVESCONSOLIDATED
2016$’000
2015$’000
Retained profits 23,952 22,098
Share Buy-Back Reserve (9,569) (9,300)
Share-based payments reserve 290 242
Foreign currency translation reserve (344) (466)
Retained profits and reserves at year end 14,329 12,574
Movements in retained profits and reserves
a) Retained profits
Opening balance 22,098 20,717
Net profit for the year 5,263 4,470
Total available for appropriation 27,361 25,187
Dividends paid (3,409) (3,089)
Balance at year end 23,952 22,098
b) Share buy-back reserve
Opening balance (9,300) (9,300)
Movement during the year (269) -
Balance at year end (9,569) (9,300)
This reserve represents the premium received on share buybacks.
c) Share-based payments reserve
Opening balance 242 120
Movement during the year 48 122
Balance at year end 290 242
This reserve is used to record the value of equity benefits provided to employees as part of their remuneration.
For
per
sona
l use
onl
y
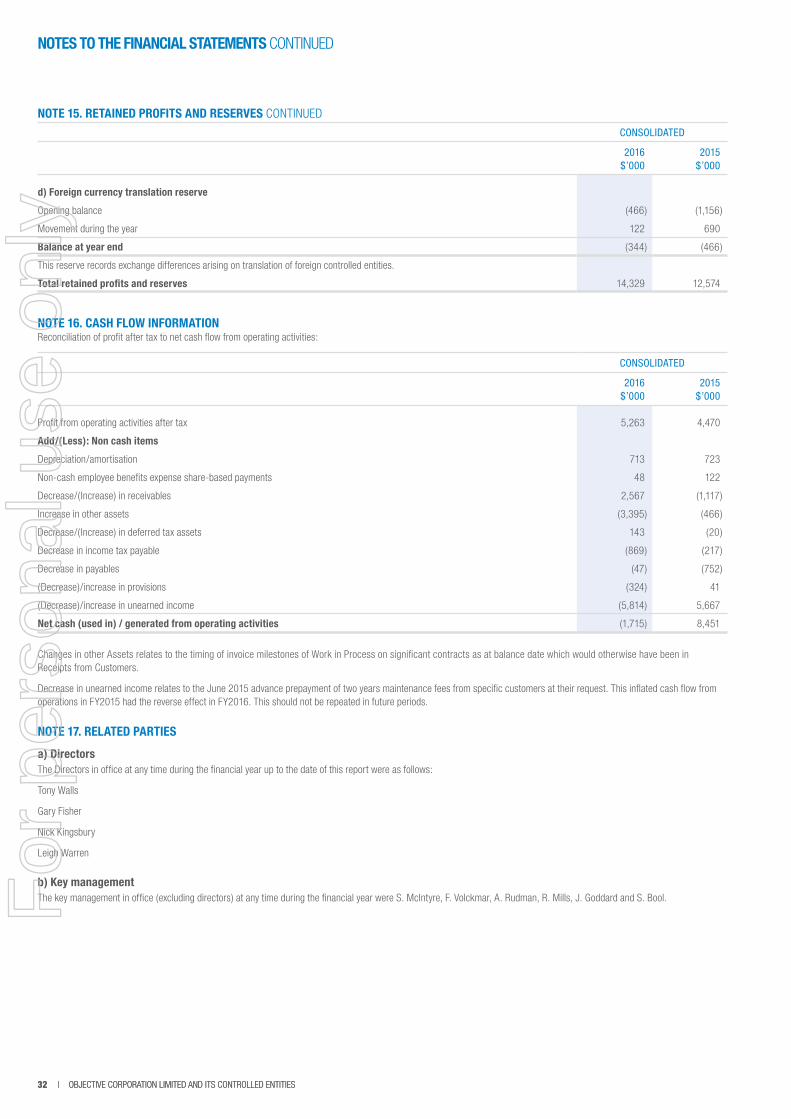
32 | OBJECTIVE CORPORATION LIMITED AND ITS CONTROLLED ENTITIES32 | OBJECTIVE CORPORATION LIMITED AND ITS CONTROLLED ENTITIES
NOTES TO THE FINANCIAL STATEMENTS CONTINUED
NOTE 15. RETAINED PROFITS AND RESERVES CONTINUED
CONSOLIDATED
2016$’000
2015$’000
d) Foreign currency translation reserve
Opening balance (466) (1,156)
Movement during the year 122 690
Balance at year end (344) (466)
This reserve records exchange differences arising on translation of foreign controlled entities.
Total retained profits and reserves 14,329 12,574
NOTE 16. CASH FLOW INFORMATIONReconciliation of profit after tax to net cash flow from operating activities:
CONSOLIDATED
2016$’000
2015$’000
Profit from operating activities after tax 5,263 4,470
Add/(Less): Non cash items
Depreciation/amortisation 713 723
Non-cash employee benefits expense share-based payments 48 122
Decrease/(Increase) in receivables 2,567 (1,117)
Increase in other assets (3,395) (466)
Decrease/(Increase) in deferred tax assets 143 (20)
Decrease in income tax payable (869) (217)
Decrease in payables (47) (752)
(Decrease)/increase in provisions (324) 41
(Decrease)/increase in unearned income (5,814) 5,667
Net cash (used in) / generated from operating activities (1,715) 8,451
Changes in other Assets relates to the timing of invoice milestones of Work in Process on significant contracts as at balance date which would otherwise have been in Receipts from Customers.
Decrease in unearned income relates to the June 2015 advance prepayment of two years maintenance fees from specific customers at their request. This inflated cash flow from operations in FY2015 had the reverse effect in FY2016. This should not be repeated in future periods.
NOTE 17. RELATED PARTIES
a) DirectorsThe Directors in office at any time during the financial year up to the date of this report were as follows:
Tony Walls
Gary Fisher
Nick Kingsbury
Leigh Warren
b) Key managementThe key management in office (excluding directors) at any time during the financial year were S. McIntyre, F. Volckmar, A. Rudman, R. Mills, J. Goddard and S. Bool.F
or p
erso
nal u
se o
nly
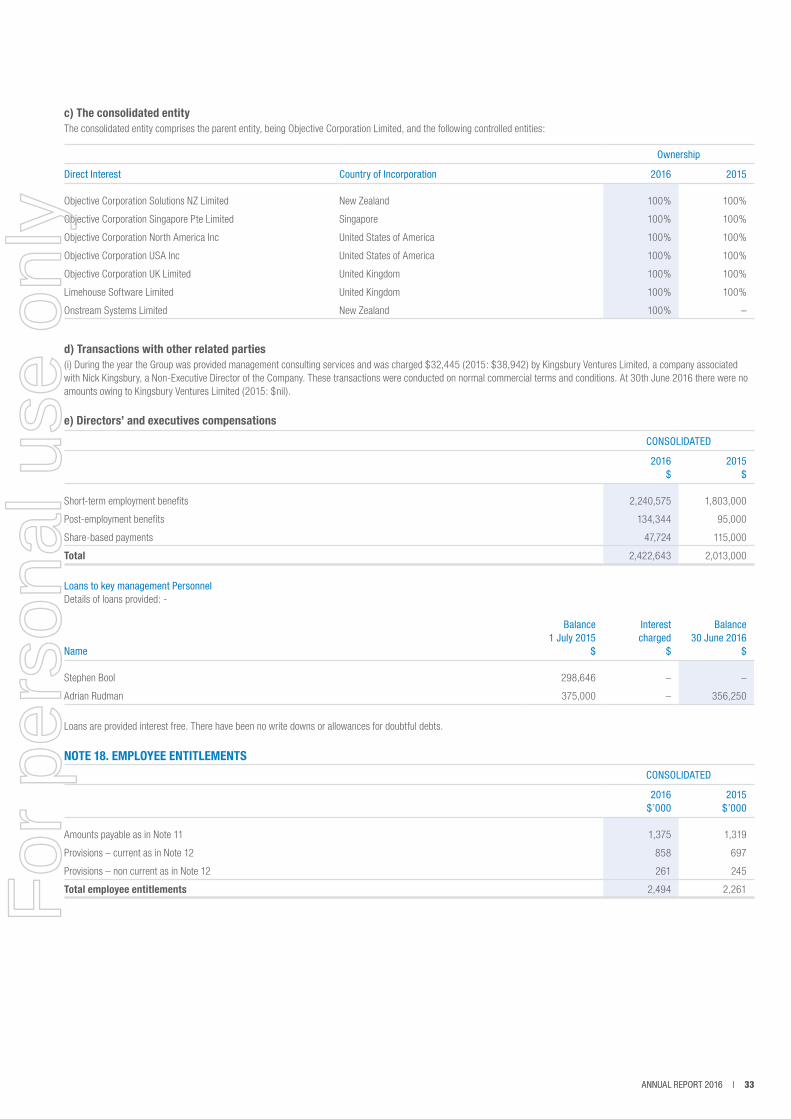
ANNUAL REPORT 2016 | 33ANNUAL REPORT 2016 | 33
c) The consolidated entityThe consolidated entity comprises the parent entity, being Objective Corporation Limited, and the following controlled entities:
Ownership
Direct Interest Country of Incorporation 2016 2015
Objective Corporation Solutions NZ Limited New Zealand 100% 100%
Objective Corporation Singapore Pte Limited Singapore 100% 100%
Objective Corporation North America Inc United States of America 100% 100%
Objective Corporation USA Inc United States of America 100% 100%
Objective Corporation UK Limited United Kingdom 100% 100%
Limehouse Software Limited United Kingdom 100% 100%
Onstream Systems Limited New Zealand 100% –
d) Transactions with other related parties(i) During the year the Group was provided management consulting services and was charged $32,445 (2015: $38,942) by Kingsbury Ventures Limited, a company associated with Nick Kingsbury, a Non-Executive Director of the Company. These transactions were conducted on normal commercial terms and conditions. At 30th June 2016 there were no amounts owing to Kingsbury Ventures Limited (2015: $nil).
e) Directors’ and executives compensations
CONSOLIDATED
2016$
2015$
Short-term employment benefits 2,240,575 1,803,000
Post-employment benefits 134,344 95,000
Share-based payments 47,724 115,000
Total 2,422,643 2,013,000
Loans to key management PersonnelDetails of loans provided: -
Name
Balance1 July 2015
$
Interest charged
$
Balance30 June 2016
$
Stephen Bool 298,646 – –
Adrian Rudman 375,000 – 356,250
Loans are provided interest free. There have been no write downs or allowances for doubtful debts.
NOTE 18. EMPLOYEE ENTITLEMENTS CONSOLIDATED
2016$’000
2015$’000
Amounts payable as in Note 11 1,375 1,319
Provisions – current as in Note 12 858 697
Provisions – non current as in Note 12 261 245
Total employee entitlements 2,494 2,261For
per
sona
l use
onl
y
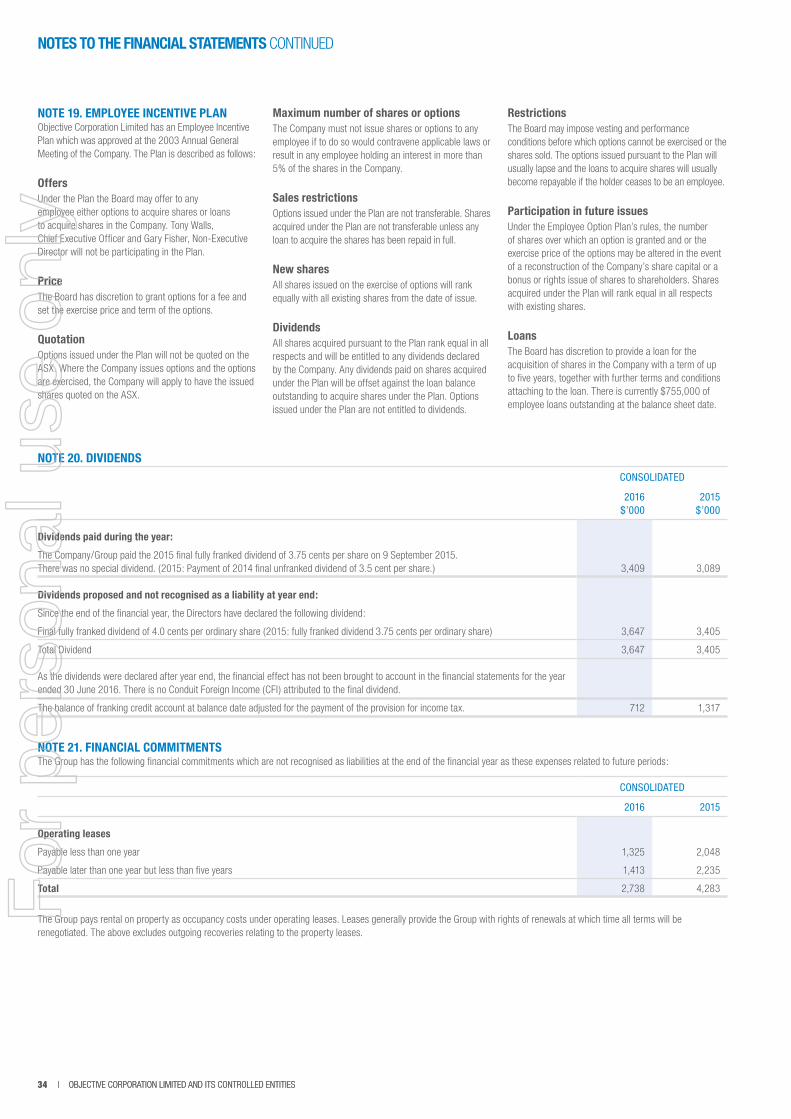
34 | OBJECTIVE CORPORATION LIMITED AND ITS CONTROLLED ENTITIES34 | OBJECTIVE CORPORATION LIMITED AND ITS CONTROLLED ENTITIES
NOTES TO THE FINANCIAL STATEMENTS CONTINUED
NOTE 19. EMPLOYEE INCENTIVE PLANObjective Corporation Limited has an Employee Incentive Plan which was approved at the 2003 Annual General Meeting of the Company. The Plan is described as follows:
OffersUnder the Plan the Board may offer to any employee either options to acquire shares or loans to acquire shares in the Company. Tony Walls, Chief Executive Officer and Gary Fisher, Non-Executive Director will not be participating in the Plan.
PriceThe Board has discretion to grant options for a fee and set the exercise price and term of the options.
QuotationOptions issued under the Plan will not be quoted on the ASX. Where the Company issues options and the options are exercised, the Company will apply to have the issued shares quoted on the ASX.
Maximum number of shares or optionsThe Company must not issue shares or options to any employee if to do so would contravene applicable laws or result in any employee holding an interest in more than 5% of the shares in the Company.
Sales restrictionsOptions issued under the Plan are not transferable. Shares acquired under the Plan are not transferable unless any loan to acquire the shares has been repaid in full.
New sharesAll shares issued on the exercise of options will rank equally with all existing shares from the date of issue.
DividendsAll shares acquired pursuant to the Plan rank equal in all respects and will be entitled to any dividends declared by the Company. Any dividends paid on shares acquired under the Plan will be offset against the loan balance outstanding to acquire shares under the Plan. Options issued under the Plan are not entitled to dividends.
RestrictionsThe Board may impose vesting and performance conditions before which options cannot be exercised or the shares sold. The options issued pursuant to the Plan will usually lapse and the loans to acquire shares will usually become repayable if the holder ceases to be an employee.
Participation in future issuesUnder the Employee Option Plan’s rules, the number of shares over which an option is granted and or the exercise price of the options may be altered in the event of a reconstruction of the Company’s share capital or a bonus or rights issue of shares to shareholders. Shares acquired under the Plan will rank equal in all respects with existing shares.
LoansThe Board has discretion to provide a loan for the acquisition of shares in the Company with a term of up to five years, together with further terms and conditions attaching to the loan. There is currently $755,000 of employee loans outstanding at the balance sheet date.
NOTE 20. DIVIDENDSCONSOLIDATED
2016$’000
2015$’000
Dividends paid during the year:
The Company/Group paid the 2015 final fully franked dividend of 3.75 cents per share on 9 September 2015. There was no special dividend. (2015: Payment of 2014 final unfranked dividend of 3.5 cent per share.) 3,409 3,089
Dividends proposed and not recognised as a liability at year end:
Since the end of the financial year, the Directors have declared the following dividend:
Final fully franked dividend of 4.0 cents per ordinary share (2015: fully franked dividend 3.75 cents per ordinary share) 3,647 3,405
Total Dividend 3,647 3,405
As the dividends were declared after year end, the financial effect has not been brought to account in the financial statements for the year ended 30 June 2016. There is no Conduit Foreign Income (CFI) attributed to the final dividend.
The balance of franking credit account at balance date adjusted for the payment of the provision for income tax. 712 1,317
NOTE 21. FINANCIAL COMMITMENTS The Group has the following financial commitments which are not recognised as liabilities at the end of the financial year as these expenses related to future periods:
CONSOLIDATED
2016 2015
Operating leases
Payable less than one year 1,325 2,048
Payable later than one year but less than five years 1,413 2,235
Total 2,738 4,283
The Group pays rental on property as occupancy costs under operating leases. Leases generally provide the Group with rights of renewals at which time all terms will be renegotiated. The above excludes outgoing recoveries relating to the property leases.
For
per
sona
l use
onl
y
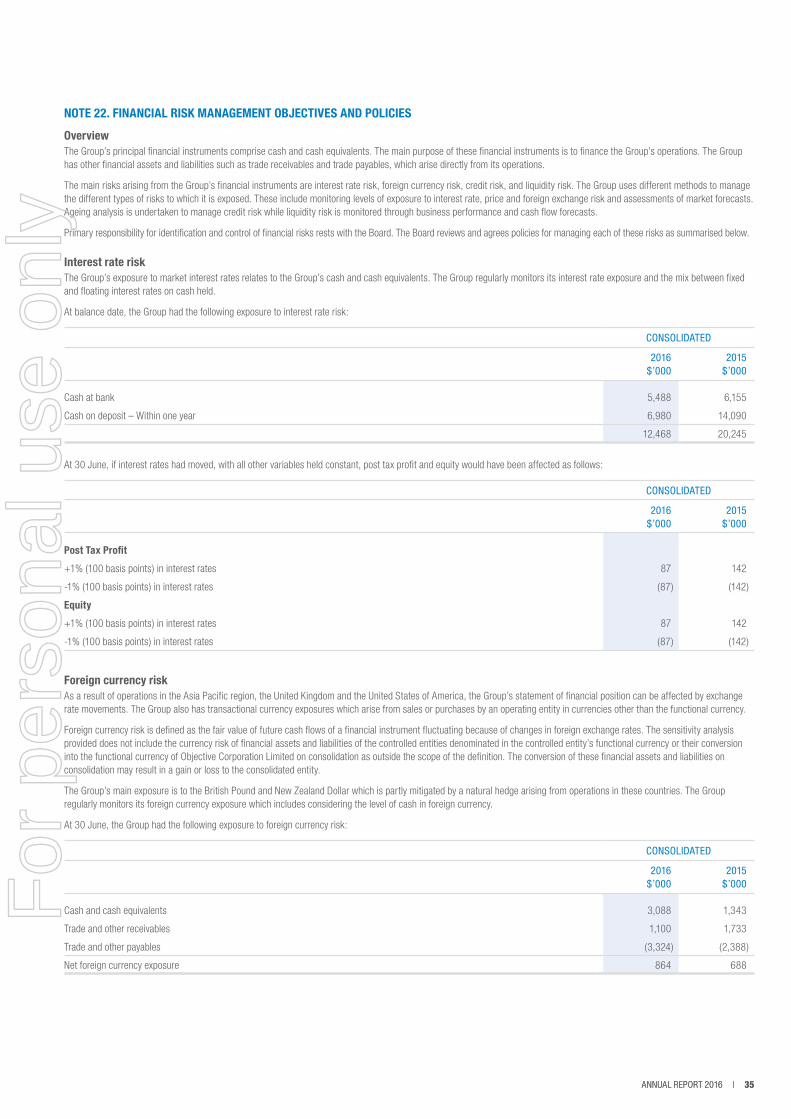
ANNUAL REPORT 2016 | 35ANNUAL REPORT 2016 | 35
NOTE 22. FINANCIAL RISK MANAGEMENT OBJECTIVES AND POLICIES
OverviewThe Group’s principal financial instruments comprise cash and cash equivalents. The main purpose of these financial instruments is to finance the Group’s operations. The Group has other financial assets and liabilities such as trade receivables and trade payables, which arise directly from its operations.
The main risks arising from the Group’s financial instruments are interest rate risk, foreign currency risk, credit risk, and liquidity risk. The Group uses different methods to manage the different types of risks to which it is exposed. These include monitoring levels of exposure to interest rate, price and foreign exchange risk and assessments of market forecasts. Ageing analysis is undertaken to manage credit risk while liquidity risk is monitored through business performance and cash flow forecasts.
Primary responsibility for identification and control of financial risks rests with the Board. The Board reviews and agrees policies for managing each of these risks as summarised below.
Interest rate riskThe Group’s exposure to market interest rates relates to the Group’s cash and cash equivalents. The Group regularly monitors its interest rate exposure and the mix between fixed and floating interest rates on cash held.
At balance date, the Group had the following exposure to interest rate risk:
CONSOLIDATED
2016$’000
2015$’000
Cash at bank 5,488 6,155
Cash on deposit – Within one year 6,980 14,090
12,468 20,245
At 30 June, if interest rates had moved, with all other variables held constant, post tax profit and equity would have been affected as follows:
CONSOLIDATED
2016$’000
2015$’000
Post Tax Profit
+1% (100 basis points) in interest rates 87 142
-1% (100 basis points) in interest rates (87) (142)
Equity
+1% (100 basis points) in interest rates 87 142
-1% (100 basis points) in interest rates (87) (142)
Foreign currency riskAs a result of operations in the Asia Pacific region, the United Kingdom and the United States of America, the Group’s statement of financial position can be affected by exchange rate movements. The Group also has transactional currency exposures which arise from sales or purchases by an operating entity in currencies other than the functional currency.
Foreign currency risk is defined as the fair value of future cash flows of a financial instrument fluctuating because of changes in foreign exchange rates. The sensitivity analysis provided does not include the currency risk of financial assets and liabilities of the controlled entities denominated in the controlled entity’s functional currency or their conversion into the functional currency of Objective Corporation Limited on consolidation as outside the scope of the definition. The conversion of these financial assets and liabilities on consolidation may result in a gain or loss to the consolidated entity.
The Group’s main exposure is to the British Pound and New Zealand Dollar which is partly mitigated by a natural hedge arising from operations in these countries. The Group regularly monitors its foreign currency exposure which includes considering the level of cash in foreign currency.
At 30 June, the Group had the following exposure to foreign currency risk:
CONSOLIDATED
2016$’000
2015$’000
Cash and cash equivalents 3,088 1,343
Trade and other receivables 1,100 1,733
Trade and other payables (3,324) (2,388)
Net foreign currency exposure 864 688
For
per
sona
l use
onl
y
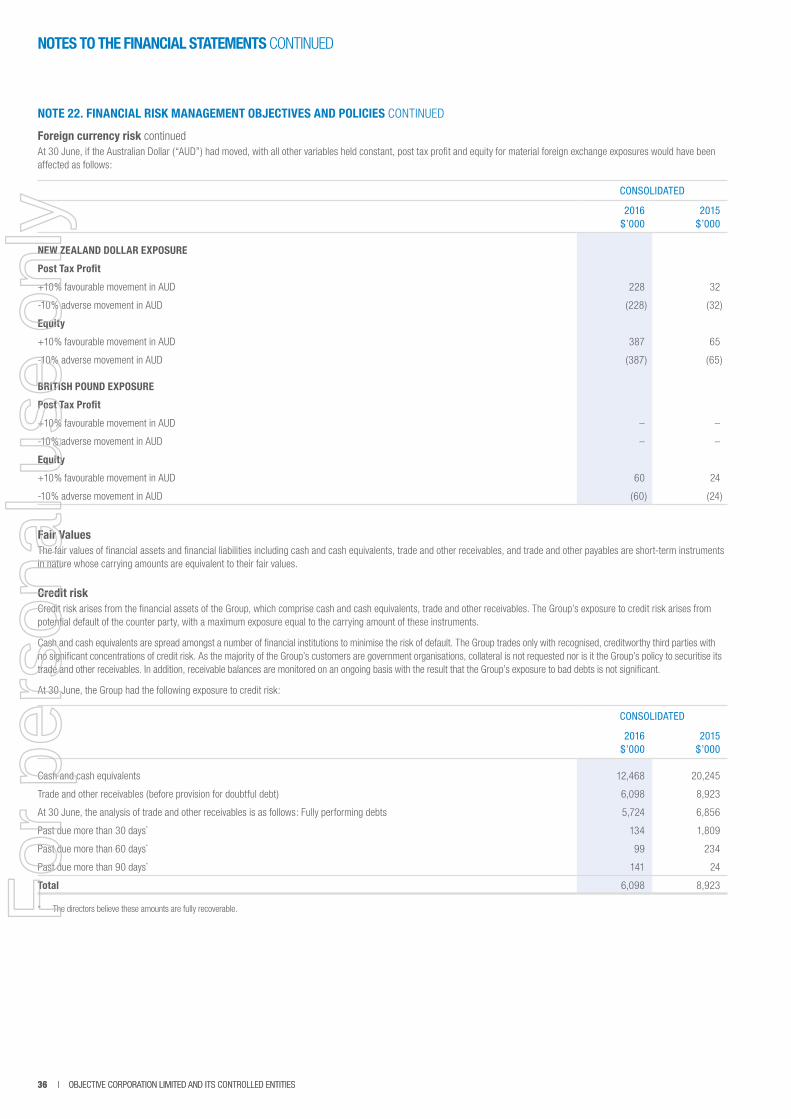
36 | OBJECTIVE CORPORATION LIMITED AND ITS CONTROLLED ENTITIES36 | OBJECTIVE CORPORATION LIMITED AND ITS CONTROLLED ENTITIES
NOTES TO THE FINANCIAL STATEMENTS CONTINUED
NOTE 22. FINANCIAL RISK MANAGEMENT OBJECTIVES AND POLICIES CONTINUED
Foreign currency risk continuedAt 30 June, if the Australian Dollar (“AUD”) had moved, with all other variables held constant, post tax profit and equity for material foreign exchange exposures would have been affected as follows:
CONSOLIDATED
2016$’000
2015$’000
NEW ZEALAND DOLLAR EXPOSURE
Post Tax Profit
+10% favourable movement in AUD 228 32
-10% adverse movement in AUD (228) (32)
Equity
+10% favourable movement in AUD 387 65
-10% adverse movement in AUD (387) (65)
BRITISH POUND EXPOSURE
Post Tax Profit
+10% favourable movement in AUD – –
-10% adverse movement in AUD – –
Equity
+10% favourable movement in AUD 60 24
-10% adverse movement in AUD (60) (24)
Fair ValuesThe fair values of financial assets and financial liabilities including cash and cash equivalents, trade and other receivables, and trade and other payables are short-term instruments in nature whose carrying amounts are equivalent to their fair values.
Credit riskCredit risk arises from the financial assets of the Group, which comprise cash and cash equivalents, trade and other receivables. The Group’s exposure to credit risk arises from potential default of the counter party, with a maximum exposure equal to the carrying amount of these instruments.
Cash and cash equivalents are spread amongst a number of financial institutions to minimise the risk of default. The Group trades only with recognised, creditworthy third parties with no significant concentrations of credit risk. As the majority of the Group’s customers are government organisations, collateral is not requested nor is it the Group’s policy to securitise its trade and other receivables. In addition, receivable balances are monitored on an ongoing basis with the result that the Group’s exposure to bad debts is not significant.
At 30 June, the Group had the following exposure to credit risk:
CONSOLIDATED
2016$’000
2015$’000
Cash and cash equivalents 12,468 20,245
Trade and other receivables (before provision for doubtful debt) 6,098 8,923
At 30 June, the analysis of trade and other receivables is as follows: Fully performing debts 5,724 6,856
Past due more than 30 days* 134 1,809
Past due more than 60 days* 99 234
Past due more than 90 days* 141 24
Total 6,098 8,923
* The directors believe these amounts are fully recoverable.For
per
sona
l use
onl
y
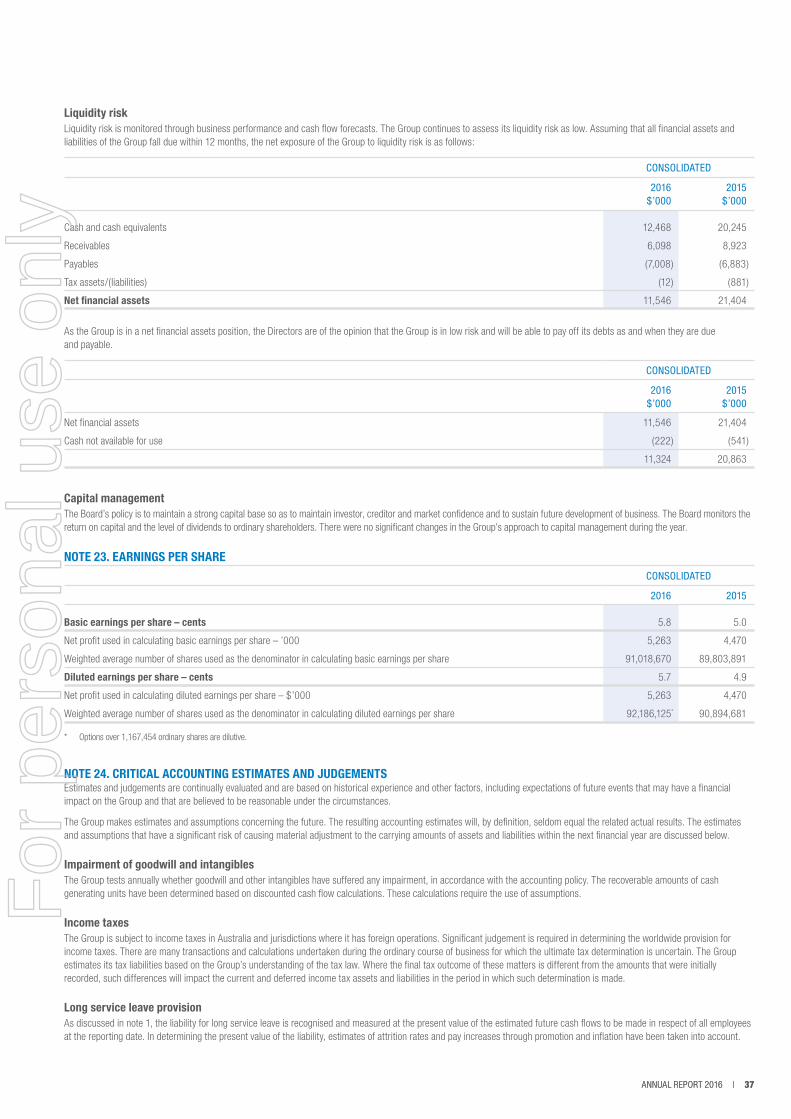
ANNUAL REPORT 2016 | 37ANNUAL REPORT 2016 | 37
Liquidity riskLiquidity risk is monitored through business performance and cash flow forecasts. The Group continues to assess its liquidity risk as low. Assuming that all financial assets and liabilities of the Group fall due within 12 months, the net exposure of the Group to liquidity risk is as follows:
CONSOLIDATED
2016$’000
2015$’000
Cash and cash equivalents 12,468 20,245
Receivables 6,098 8,923
Payables (7,008) (6,883)
Tax assets/(liabilities) (12) (881)
Net financial assets 11,546 21,404
As the Group is in a net financial assets position, the Directors are of the opinion that the Group is in low risk and will be able to pay off its debts as and when they are due and payable.
CONSOLIDATED
2016$’000
2015$’000
Net financial assets 11,546 21,404
Cash not available for use (222) (541)
11,324 20,863
Capital managementThe Board’s policy is to maintain a strong capital base so as to maintain investor, creditor and market confidence and to sustain future development of business. The Board monitors the return on capital and the level of dividends to ordinary shareholders. There were no significant changes in the Group’s approach to capital management during the year.
NOTE 23. EARNINGS PER SHARECONSOLIDATED
2016 2015
Basic earnings per share – cents 5.8 5.0
Net profit used in calculating basic earnings per share – ’000 5,263 4,470
Weighted average number of shares used as the denominator in calculating basic earnings per share 91,018,670 89,803,891
Diluted earnings per share – cents 5.7 4.9
Net profit used in calculating diluted earnings per share – $’000 5,263 4,470
Weighted average number of shares used as the denominator in calculating diluted earnings per share 92,186,125* 90,894,681
* Options over 1,167,454 ordinary shares are dilutive.
NOTE 24. CRITICAL ACCOUNTING ESTIMATES AND JUDGEMENTSEstimates and judgements are continually evaluated and are based on historical experience and other factors, including expectations of future events that may have a financial impact on the Group and that are believed to be reasonable under the circumstances.
The Group makes estimates and assumptions concerning the future. The resulting accounting estimates will, by definition, seldom equal the related actual results. The estimates and assumptions that have a significant risk of causing material adjustment to the carrying amounts of assets and liabilities within the next financial year are discussed below.
Impairment of goodwill and intangibles The Group tests annually whether goodwill and other intangibles have suffered any impairment, in accordance with the accounting policy. The recoverable amounts of cash generating units have been determined based on discounted cash flow calculations. These calculations require the use of assumptions.
Income taxesThe Group is subject to income taxes in Australia and jurisdictions where it has foreign operations. Significant judgement is required in determining the worldwide provision for income taxes. There are many transactions and calculations undertaken during the ordinary course of business for which the ultimate tax determination is uncertain. The Group estimates its tax liabilities based on the Group’s understanding of the tax law. Where the final tax outcome of these matters is different from the amounts that were initially recorded, such differences will impact the current and deferred income tax assets and liabilities in the period in which such determination is made.
Long service leave provisionAs discussed in note 1, the liability for long service leave is recognised and measured at the present value of the estimated future cash flows to be made in respect of all employees at the reporting date. In determining the present value of the liability, estimates of attrition rates and pay increases through promotion and inflation have been taken into account.
For
per
sona
l use
onl
y
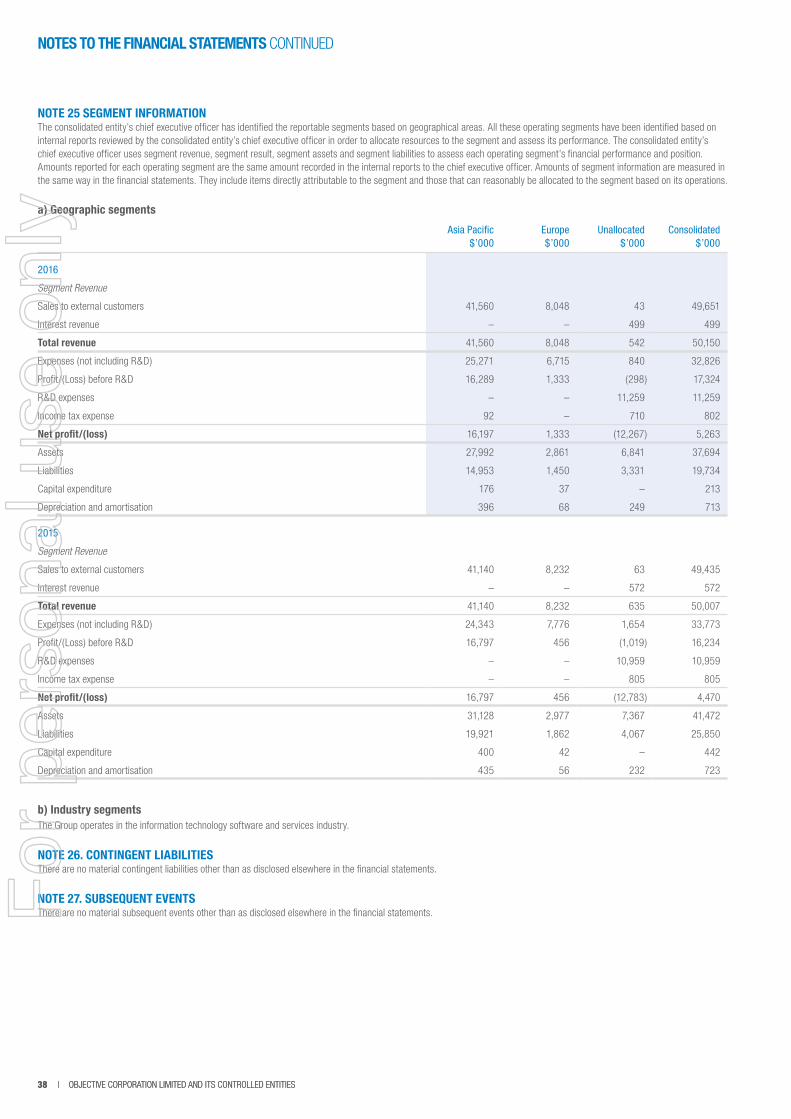
38 | OBJECTIVE CORPORATION LIMITED AND ITS CONTROLLED ENTITIES38 | OBJECTIVE CORPORATION LIMITED AND ITS CONTROLLED ENTITIES
NOTES TO THE FINANCIAL STATEMENTS CONTINUED
NOTE 25 SEGMENT INFORMATIONThe consolidated entity’s chief executive officer has identified the reportable segments based on geographical areas. All these operating segments have been identified based on internal reports reviewed by the consolidated entity’s chief executive officer in order to allocate resources to the segment and assess its performance. The consolidated entity’s chief executive officer uses segment revenue, segment result, segment assets and segment liabilities to assess each operating segment’s financial performance and position. Amounts reported for each operating segment are the same amount recorded in the internal reports to the chief executive officer. Amounts of segment information are measured in the same way in the financial statements. They include items directly attributable to the segment and those that can reasonably be allocated to the segment based on its operations.
a) Geographic segments
Asia Pacific$’000
Europe$’000
Unallocated$’000
Consolidated$’000
2016
Segment Revenue
Sales to external customers 41,560 8,048 43 49,651
Interest revenue – – 499 499
Total revenue 41,560 8,048 542 50,150
Expenses (not including R&D) 25,271 6,715 840 32,826
Profit/(Loss) before R&D 16,289 1,333 (298) 17,324
R&D expenses – – 11,259 11,259
Income tax expense 92 – 710 802
Net profit/(loss) 16,197 1,333 (12,267) 5,263
Assets 27,992 2,861 6,841 37,694
Liabilities 14,953 1,450 3,331 19,734
Capital expenditure 176 37 – 213
Depreciation and amortisation 396 68 249 713
2015
Segment Revenue
Sales to external customers 41,140 8,232 63 49,435
Interest revenue – – 572 572
Total revenue 41,140 8,232 635 50,007
Expenses (not including R&D) 24,343 7,776 1,654 33,773
Profit/(Loss) before R&D 16,797 456 (1,019) 16,234
R&D expenses – – 10,959 10,959
Income tax expense – – 805 805
Net profit/(loss) 16,797 456 (12,783) 4,470
Assets 31,128 2,977 7,367 41,472
Liabilities 19,921 1,862 4,067 25,850
Capital expenditure 400 42 – 442
Depreciation and amortisation 435 56 232 723
b) Industry segmentsThe Group operates in the information technology software and services industry.
NOTE 26. CONTINGENT LIABILITIESThere are no material contingent liabilities other than as disclosed elsewhere in the financial statements.
NOTE 27. SUBSEQUENT EVENTSThere are no material subsequent events other than as disclosed elsewhere in the financial statements.F
or p
erso
nal u
se o
nly
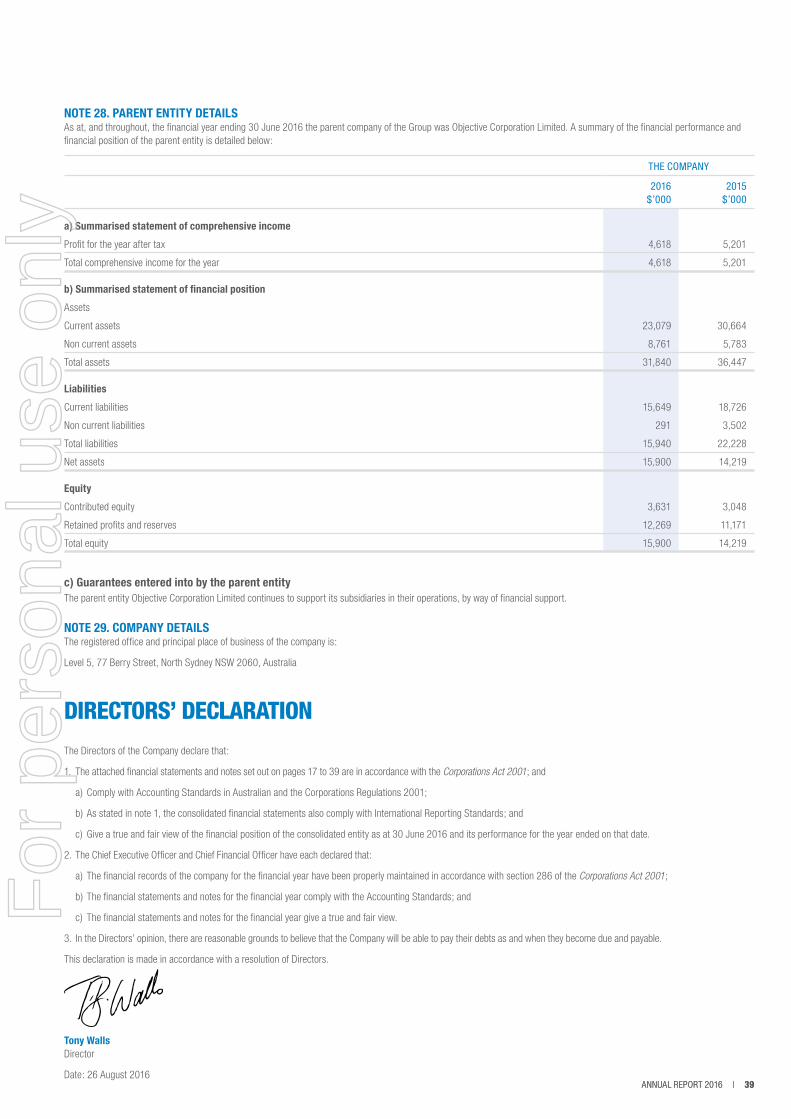
ANNUAL REPORT 2016 | 39ANNUAL REPORT 2016 | 39
NOTE 28. PARENT ENTITY DETAILSAs at, and throughout, the financial year ending 30 June 2016 the parent company of the Group was Objective Corporation Limited. A summary of the financial performance and financial position of the parent entity is detailed below:
THE COMPANY
2016$’000
2015$’000
a) Summarised statement of comprehensive income
Profit for the year after tax 4,618 5,201
Total comprehensive income for the year 4,618 5,201
b) Summarised statement of financial position
Assets
Current assets 23,079 30,664
Non current assets 8,761 5,783
Total assets 31,840 36,447
Liabilities
Current liabilities 15,649 18,726
Non current liabilities 291 3,502
Total liabilities 15,940 22,228
Net assets 15,900 14,219
Equity
Contributed equity 3,631 3,048
Retained profits and reserves 12,269 11,171
Total equity 15,900 14,219
c) Guarantees entered into by the parent entityThe parent entity Objective Corporation Limited continues to support its subsidiaries in their operations, by way of financial support.
NOTE 29. COMPANY DETAILSThe registered office and principal place of business of the company is:
Level 5, 77 Berry Street, North Sydney NSW 2060, Australia
DIRECTORS’ DECLARATIONThe Directors of the Company declare that:
1. The attached financial statements and notes set out on pages 17 to 39 are in accordance with the Corporations Act 2001; and
a) Comply with Accounting Standards in Australian and the Corporations Regulations 2001;
b) As stated in note 1, the consolidated financial statements also comply with International Reporting Standards; and
c) Give a true and fair view of the financial position of the consolidated entity as at 30 June 2016 and its performance for the year ended on that date.
2. The Chief Executive Officer and Chief Financial Officer have each declared that:
a) The financial records of the company for the financial year have been properly maintained in accordance with section 286 of the Corporations Act 2001;
b) The financial statements and notes for the financial year comply with the Accounting Standards; and
c) The financial statements and notes for the financial year give a true and fair view.
3. In the Directors’ opinion, there are reasonable grounds to believe that the Company will be able to pay their debts as and when they become due and payable.
This declaration is made in accordance with a resolution of Directors.
Tony WallsDirector
Date: 26 August 2016
For
per
sona
l use
onl
y
40 | OBJECTIVE CORPORATION LIMITED AND ITS CONTROLLED ENTITIES40 | OBJECTIVE CORPORATION LIMITED AND ITS CONTROLLED ENTITIES
INDEPENDENT AUDITOR’S REPORT
Level 22 MLC Centre Postal Address: 19 Martin Place GPO Box 1615 Sydney NSW 2000 Sydney NSW 2001 Australia Australia Tel: +61 2 9221 2099 Fax: +61 2 92231762 www.pitcher.com.au [email protected] Pitcher Partners is an association of independent firms Melbourne | Sydney | Perth | Adelaide | Brisbane| Newcastle
An independent New South Wales Partnership. ABN 35 415 759 892
Liability limited by a scheme approved under Professional Standards Legislation
INDEPENDENT AUDITOR’S REPORT TO THE MEMBERS OF OBJECTIVE CORPORATION LIMITED
We have audited the accompanying financial report of Objective Corporation Limited, which comprises the consolidated statement of financial position as at 30 June 2016, the consolidated statement of profit or loss and other comprehensive income, the consolidated statement of changes in equity and the consolidated statement of cash flows for the year then ended, notes comprising a summary of significant accounting policies and other explanatory information, and the directors’ declaration of the company comprising the company and the entities it controlled at the year’s end or from time to time during the financial year. Directors’ Responsibility for the Financial Report
The directors of the company are responsible for the preparation of the financial report that gives a true and fair view in accordance with Australian Accounting Standards and the Corporations Act 2001 and for such internal control as the directors determine is necessary to enable the preparation of the financial report that gives a true and fair view and is free from material misstatement, whether due to fraud or error. In Note 1, the directors also state, in accordance with Accounting Standard AASB 101 Presentation of Financial Statements, that the financial statements comply with International Financial Reporting Standards. Auditor’s Responsibility
Our responsibility is to express an opinion on the financial report based on our audit. We conducted our audit in accordance with Australian Auditing Standards. Those standards require that we comply with relevant ethical requirements relating to audit engagements and plan and perform the audit to obtain reasonable assurance about whether the financial report is free from material misstatement. An audit involves performing procedures to obtain audit evidence about the amounts and disclosures in the financial report. The procedures selected depend on the auditor’s judgement, including the assessment of the risks of material misstatement in the financial report, whether due to fraud or error. In making those risk assessments, the auditor considers internal control relevant to the company’s preparation of the financial report that gives a true and fair view in order to design audit procedures that are appropriate in the circumstances, but not for the purpose of expressing an opinion on the effectiveness of the company’s internal control. An audit also includes evaluating the appropriateness of accounting policies used and the reasonableness of accounting estimates made by the directors, as well as evaluating the overall presentation of the financial report.
For
per
sona
l use
onl
y
INDEPENDENT AUDITOR’S REPORT TO THE MEMBERS OF OBJECTIVE CORPORATION LIMITED
We believe that the audit evidence we have obtained is sufficient and appropriate to provide a basis for our audit opinion.
Independence
In conducting our audit, we have complied with the independence requirements of the Corporations Act 2001.
Opinion
In our opinion:
(a) the financial report of Objective Corporation Limited is in accordance with the Corporations Act 2001, including:
(i) giving a true and fair view of the consolidated entity’s financial position as at 30 June 2016 and of its performance for the year ended on that date; and
(ii) complying with Australian Accounting Standards and the Corporations Regulations 2001; and
(b) the financial report also complies with International Financial Reporting Standards as disclosed in Note 1.
Report on the Remuneration Report
We have audited the Remuneration Report included in the directors’ report for the year ended 30 June 2016. The directors of the company are responsible for the preparation and presentation of the Remuneration Report in accordance with section 300A of the Corporations Act 2001. Our responsibility is to express an opinion on the remuneration report, based on our audit conducted in accordance with Australian Auditing Standards.
Opinion
In our opinion, the Remuneration Report of Objective Corporation Limited for the year ended 30 June 2016, complies with section 300A of the Corporations Act 2001.
M A GODLEWSKI PITCHER PARTNERS
Partner Sydney
26 August 2016
ANNUAL REPORT 2016 | 41
For
per
sona
l use
onl
y
42 | OBJECTIVE CORPORATION LIMITED AND ITS CONTROLLED ENTITIES42 | OBJECTIVE CORPORATION LIMITED AND ITS CONTROLLED ENTITIES
AUDITOR’S INDEPENDENCE DECLARATION
Level 22 MLC Centre Postal Address: 19 Martin Place GPO Box 1615 Sydney NSW 2000 Sydney NSW 2001 Australia Australia Tel: +61 2 9221 2099 Fax: +61 2 92231762 www.pitcher.com.au [email protected] Pitcher Partners is an association of independent firms Melbourne | Sydney | Perth | Adelaide | Brisbane| Newcastle
An independent New South Wales Partnership. ABN 35 415 759 892 Liability limited by a scheme approved under Professional Standards Legislation
AUDITOR'S INDEPENDENCE DECLARATION TO THE DIRECTORS OF OBJECTIVE CORPORATION LIMITED In relation to the independent audit for the year ended 30 June 2016, to the best of my knowledge and belief there have been: (i) no contraventions of the auditor independence requirements of the Corporations Act 2001; and (ii) no contraventions of any applicable code of professional conduct.
M A GODLEWSKI Partner
PITCHER PARTNERS
Sydney 26 August 2016
For
per
sona
l use
onl
y
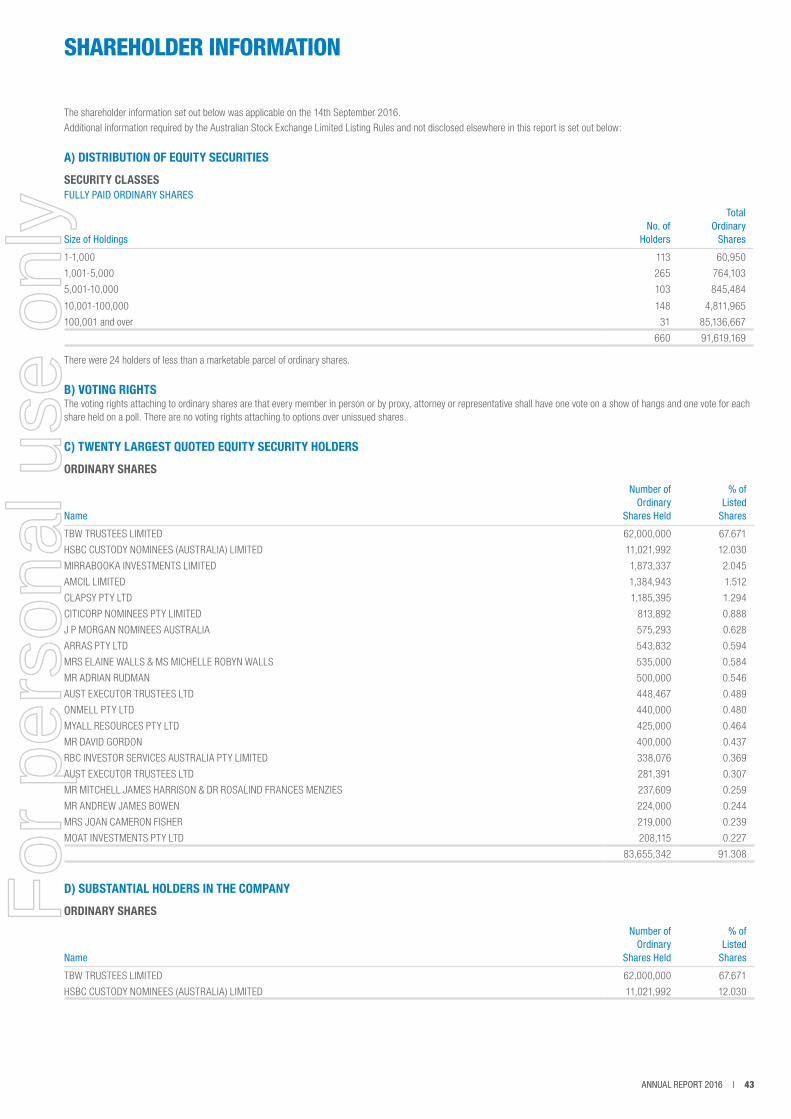
ANNUAL REPORT 2016 | 43ANNUAL REPORT 2016 | 43
SHAREHOLDER INFORMATION
The shareholder information set out below was applicable on the 14th September 2016.
Additional information required by the Australian Stock Exchange Limited Listing Rules and not disclosed elsewhere in this report is set out below:
A) DISTRIBUTION OF EQUITY SECURITIES
SECURITY CLASSES FULLY PAID ORDINARY SHARES
Size of HoldingsNo. of
Holders
TotalOrdinary Shares
1-1,000 113 60,950
1,001-5,000 265 764,103
5,001-10,000 103 845,484
10,001-100,000 148 4,811,965
100,001 and over 31 85,136,667
660 91,619,169
There were 24 holders of less than a marketable parcel of ordinary shares.
B) VOTING RIGHTS The voting rights attaching to ordinary shares are that every member in person or by proxy, attorney or representative shall have one vote on a show of hangs and one vote for each share held on a poll. There are no voting rights attaching to options over unissued shares.
C) TWENTY LARGEST QUOTED EQUITY SECURITY HOLDERS
ORDINARY SHARES
Name
Number of Ordinary
Shares Held
% of Listed Shares
TBW TRUSTEES LIMITED 62,000,000 67.671
HSBC CUSTODY NOMINEES (AUSTRALIA) LIMITED 11,021,992 12.030
MIRRABOOKA INVESTMENTS LIMITED 1,873,337 2.045
AMCIL LIMITED 1,384,943 1.512
CLAPSY PTY LTD 1,185,395 1.294
CITICORP NOMINEES PTY LIMITED 813,892 0.888
J P MORGAN NOMINEES AUSTRALIA 575,293 0.628
ARRAS PTY LTD 543,832 0.594
MRS ELAINE WALLS & MS MICHELLE ROBYN WALLS 535,000 0.584
MR ADRIAN RUDMAN 500,000 0.546
AUST EXECUTOR TRUSTEES LTD 448,467 0.489
ONMELL PTY LTD 440,000 0.480
MYALL RESOURCES PTY LTD 425,000 0.464
MR DAVID GORDON 400,000 0.437
RBC INVESTOR SERVICES AUSTRALIA PTY LIMITED 338,076 0.369
AUST EXECUTOR TRUSTEES LTD 281,391 0.307
MR MITCHELL JAMES HARRISON & DR ROSALIND FRANCES MENZIES 237,609 0.259
MR ANDREW JAMES BOWEN 224,000 0.244
MRS JOAN CAMERON FISHER 219,000 0.239
MOAT INVESTMENTS PTY LTD 208,115 0.227
83,655,342 91.308
D) SUBSTANTIAL HOLDERS IN THE COMPANY
ORDINARY SHARES
Name
Number of Ordinary
Shares Held
% of Listed
Shares
TBW TRUSTEES LIMITED 62,000,000 67.671
HSBC CUSTODY NOMINEES (AUSTRALIA) LIMITED 11,021,992 12.030
For
per
sona
l use
onl
y
44 | OBJECTIVE CORPORATION LIMITED AND ITS CONTROLLED ENTITIES44 | OBJECTIVE CORPORATION LIMITED AND ITS CONTROLLED ENTITIES
CORPORATE DIRECTORY
REGISTERED OFFICELevel 5 77 Berry Street
North Sydney NSW 2060
Australia
Tel: +61 2 9955 2288
Fax: +61 2 9955 5011
ASX CODEOCL
ABN16 050 539 350
DIRECTORSTony Walls
Gary Fisher
Nick Kingsbury
Leigh Warren
COMPANY SECRETARYMark Katz
STOCK EXCHANGE LISTINGThe Company’s shares are listed on the ASX.
ELECTRONIC ANNOUNCEMENTSShareholders who wish to receive a copy of announcements made to the ASX are invited to provide their email address to the Company. This can be done by emailing us at [email protected] or writing to us at our registered office.
SHARE REGISTRYBoardroom Pty Ltd Grosvenor Place Level 12, 225 George Street
Sydney NSW 2000
GPO Box 3993
Sydney NSW 2001
Tel: +61 (0)2 9290 9600
Fax: +61 (0)2 9279 0664
AUDITORPitcher Partners
Level 22, MLC Centre
19 Martin Place
Sydney NSW 2000
WEBSITEwww.objective.com
For
per
sona
l use
onl
y
INFORMATION GOVERNANCE ORGANISATION OF THE YEARAustralian Navy Fleet Air Arm
FAA Governance and Reporting
UnitywaterInformation Management Project
PROCESS GOVERNANCE ORGANISATION OF THE YEARDepartment of the Premier & Cabinet, South Australia
Parliamentary Briefings
COLLABORATION ORGANISATION OF THE YEARWyndham City Council
Planning Approval Automation
MICROSOFT AWARD FOR EXCELLENCEWyndham City Council
Major Projects PMO
For
per
sona
l use
onl
y
www.objective.com
OB
JECTIVE AN
NUA
L REPO
RT 2016
For
per
sona
l use
onl
y