Embed Size (px)
Citation preview

Forecasting Water Supply with B120 Statistical Methodswith B120 Statistical MethodsExample:Cosumnes River
California Cooperative Meeting 11/8/12California Cooperative Meeting 11/8/12By John j. King PE

AA

Water Year 20128 Station Index8 Station Index

Cosumnes Michigan BarB120A‐J % Error FNFCosumnes, Michigan Bar A‐J % Error FNF
April 1 Forecast 50 taf ‐52% 105taf

Cosumnes, Michigan BarB120A‐J % Error FNF
April 1 Forecast 50taf ‐52% 105taf
May 1 Forecast 100taf ‐5% 105taf

Cosumnes, Michigan BarB120A‐J % Error FNF
April 1 Forecast 50taf ‐52% 105tafp
May 1 Forecast 100taf ‐5% 105taf
End of Season Verification 59taf ‐44% 105taf
ROA‐J=.776S4/1 +.094POM+.0073POM2+.00362PAJ2
2012 S4/1=8.8 in POM=23.7 in PAJ=6.6 in
1961 1964 1972 1990 2001
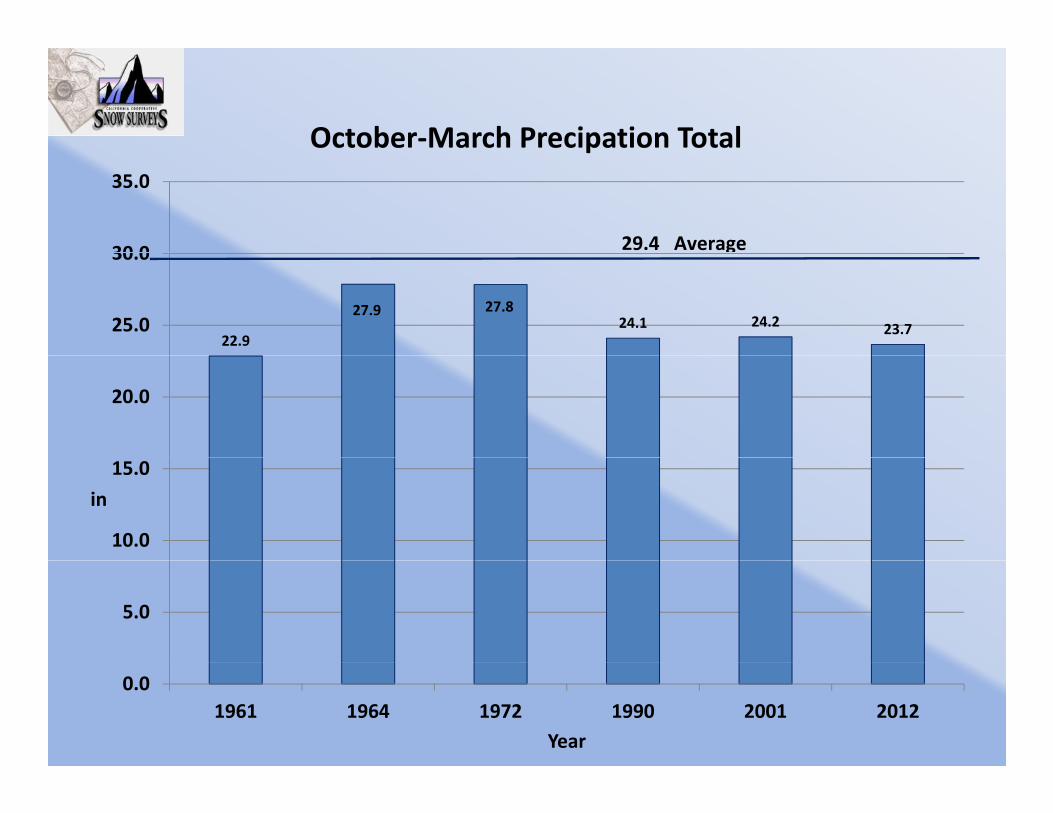
October‐March Precipation Total
30 0
35.0
p
29.4 Average
22.9
27.9 27.824.1 24.2 23.725.0
30.0
20.0
10.0
15.0in
5.0
0.01961 1964 1972 1990 2001 2012
Year

April‐June Precipation Total
7.47.1
6 67.0
8.0
April‐June Precipation Total
5.2 5.25 7
6.6
6.0
7.0
5.9 Average
5.7
4.0
5.0
i
2.0
3.0in
1.0
2.0
0.01961 1964 1972 1990 2001 2012
Year

A il 1 SWE
18.0
20.0April 1 SWE
19.9 Average
14.0
16.0
11.9
8 6 8 6 8.810.0
12.0
E in.
6.2
8.6
7.6
8.6
6.0
8.0SWE
2.0
4.0
0.01961 1964 1972 1990 2001 2012
Year
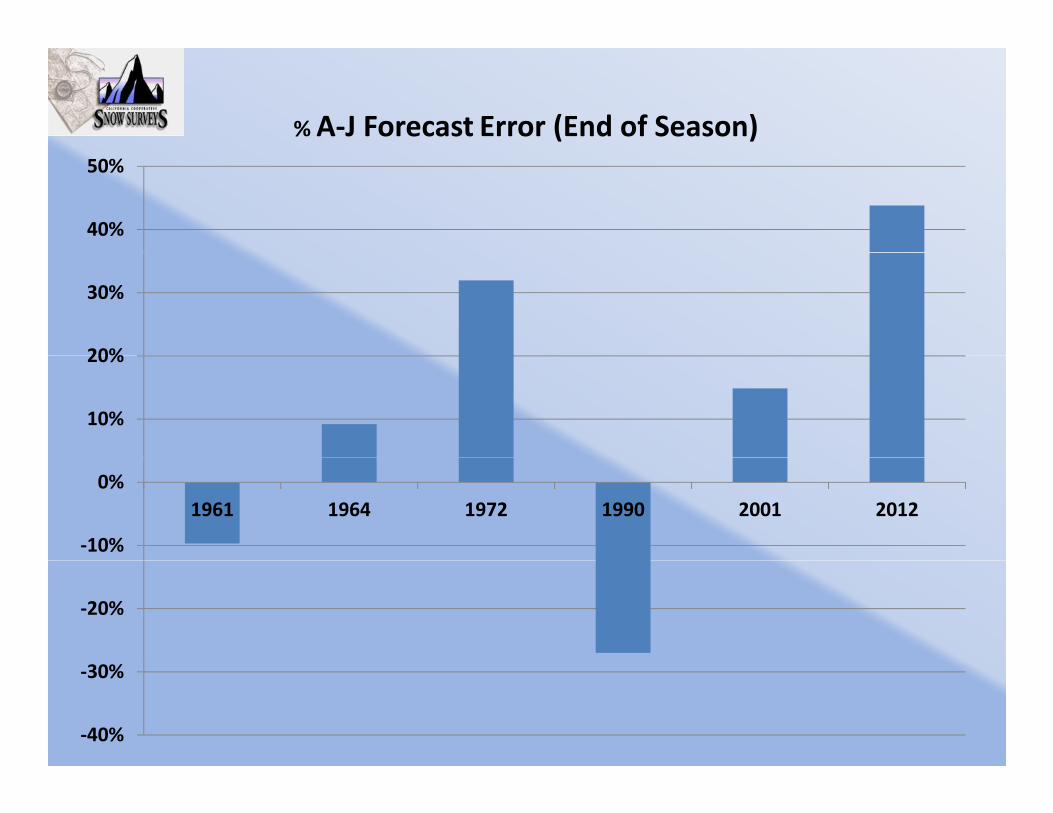
% A‐J Forecast Error (End of Season)
40%
50%
20%
30%
10%
20%
‐10%
0%1961 1964 1972 1990 2001 2012
‐20%
‐40%
‐30%
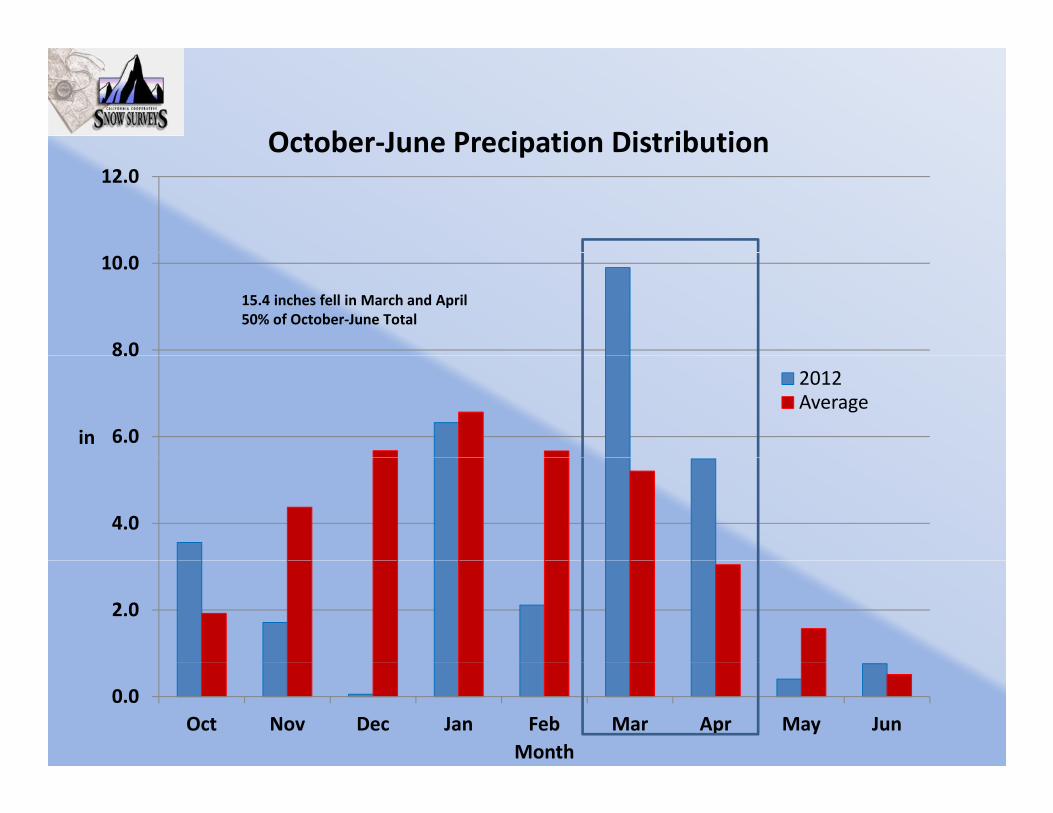
October‐June Precipation Distribution12.0
October June Precipation Distribution
8.0
10.0
15.4 inches fell in March and April 50% of October‐June Total
6.0
8.0
in
2012Average
4.0
2.0
0.0Oct Nov Dec Jan Feb Mar Apr May Jun
Month

P i it ti
Solarradiation
Physical Properties Modeled with B120 Statistical Model
Plant canopyi t ti
Precipitation
Air temperatureSublimationEvaporation
interception
Surface runoff
Snowpack
Transpiration
Evaporationand
TranspirationEvaporation
RainRain
Snowmelt
Throughfall
Streamflowto stream
Impervious-Zone ReservoirSoil-Zone Reservoir
p Snowmelt
Recharge zoneLower zone
Streamflow
SubsurfaceReservoir
Subsurface recharge
Ground-waterrecharge
Interflow orsubsurface
flow to stream
Ground-water recharge
Ground-WaterReservoir Ground-water flow to stream
flow to stream
Ground-watersink

Benefits of PRMS Modeling: Feather River SubsurfaceFeather River Subsurface
Representation
Khalida FazelPRMS Workgroup

Feather River Basin

Feather PRMS Flow Processes at a ll lHillslope Cross‐Section
Source: USGS GSFlow Manual
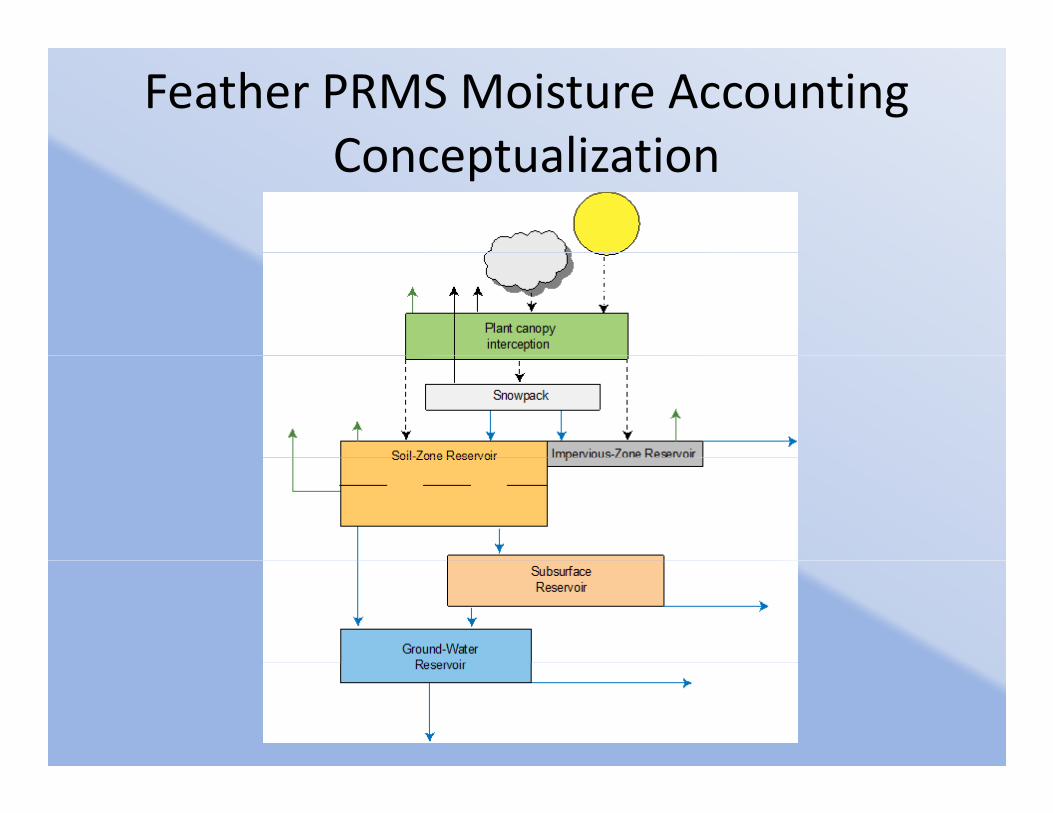
Feather PRMS Moisture Accounting ConceptualizationConceptualization
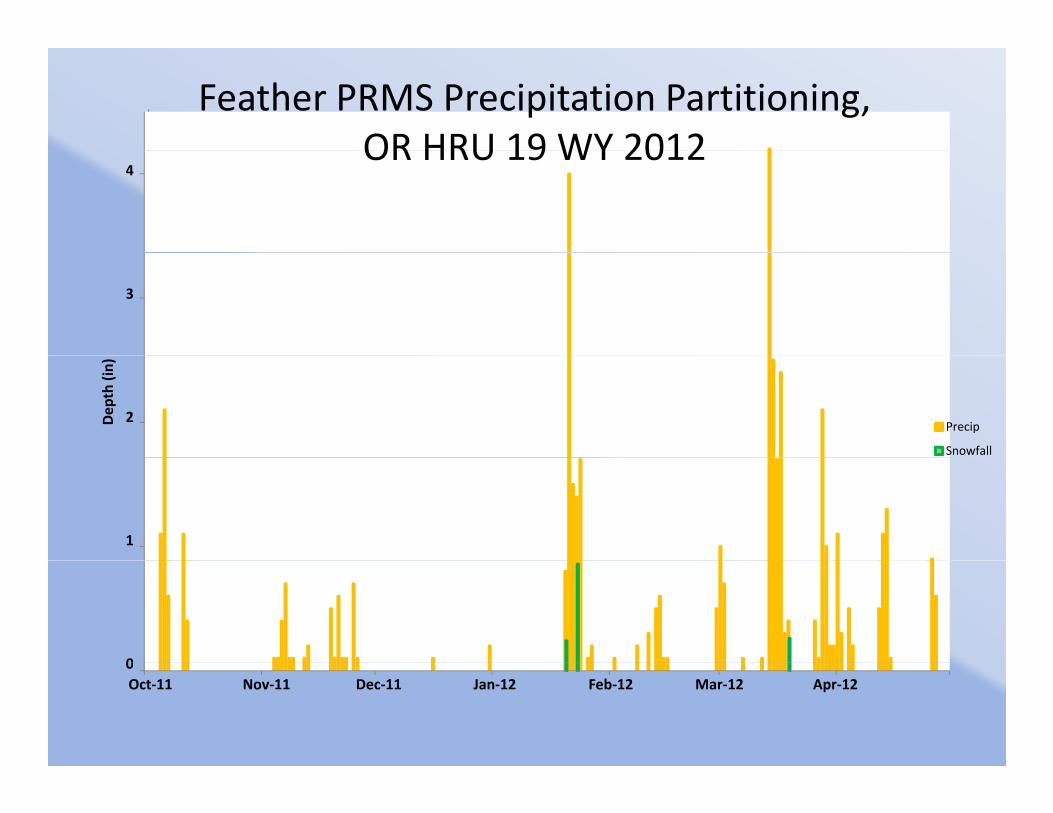
Feather PRMS Precipitation Partitioning, OR HRU 19 WY 2012
4OR HRU 19 WY 2012
3
2Dep
th (in)
Precip
Precip
Snowfall
1
00Oct‐11 Nov‐11 Dec‐11 Jan‐12 Feb‐12 Mar‐12 Apr‐12

OR HRU 19 PRMS Moisture Accounting WY 20120.001Oct2011 01Nov2011 01Dec2011 01Jan2012 01Feb2012 01Mar2012 01Apr2012 01May2012 01Jun2012 01Jul2012 01Aug2012
2.5
Precip(in
)
5.0
0 0
2.5
5.0
nowmelt
(in)
Field capacity = 8.74 in
0.0S
5.0
7.5
10.0
oil Zon
e eservoir
orage (in
)
0.0
2.5S R Sto
5 0
7.5
face
oir
ge
0.0
2.5
5.0
Subsurf
Reservo
Storag
(in)
3.0
ter
r n)
0.0
1.5
Groun
dwat
Reservoir
Storage (in

OR Subsurface Reservoir Outflow WY 2012ace Ru
noff
(cfs)
Surfa
surface
w (cfs)
ter
)Subs
Flow
w
Groun
dwat
Flow
(cfs
Stream
flow
Flow
(cfs)

OR Streamflow Components WY 2012OR Streamflow Components WY 2012
Streamflow
Baseflow

Forecasting with PRMS: Antecedent ConditionsAntecedent Conditions
Source: EM 1110‐2‐1406

ConclusionsConclusions
• Knowledge of storage in each subsurface reservoir o edge o sto age eac subsu ace ese oand the ability to quantify input as either rain or snowmelt can better inform forecast
• PRMS provides a representation of streamflow and its contributing components
• Extreme/unusual events can be better represented in a distributed, conceptual model (PRMS), compared to statistical approaches (Bulletin 120)compared to statistical approaches (Bulletin 120)


Lower N th F kNorth Fork

03000
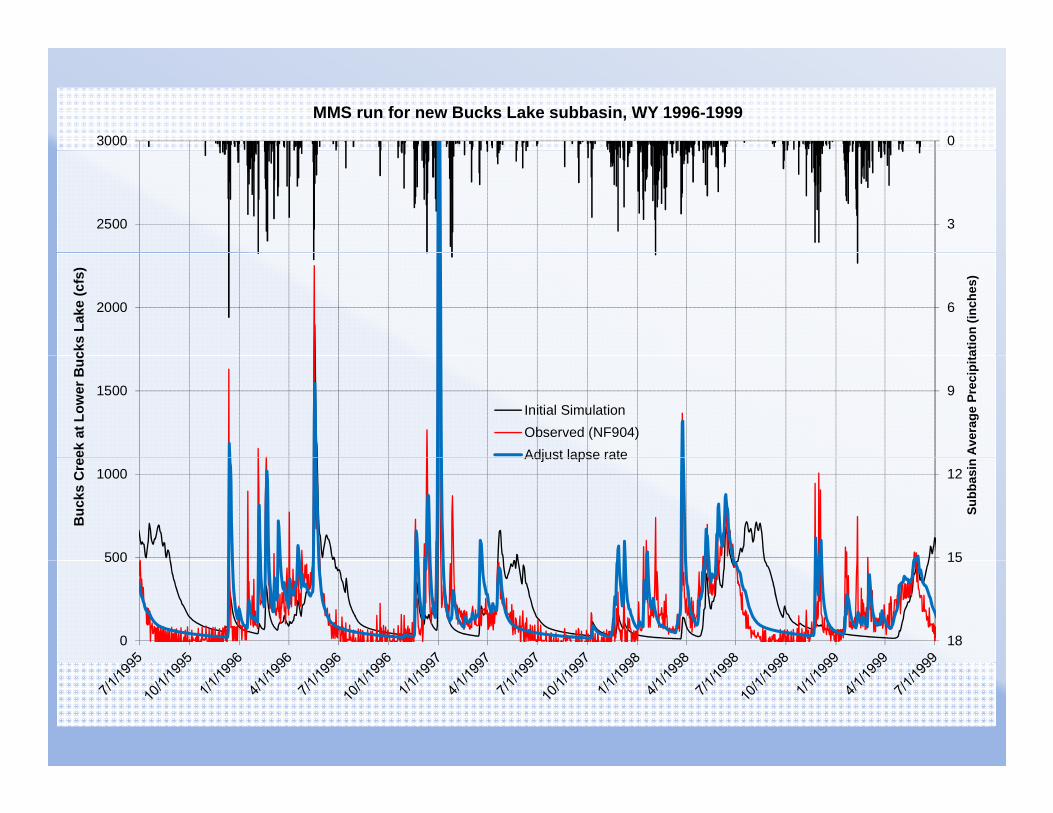
MMS run for new Bucks Lake subbasin, WY 1996-1999
32500
62000
atio
n (in
ches
)
cks
Lake
(cfs
)
91500
Ave
rage
Pre
cipi
ta
ek a
t Low
er B
uc
Initial Simulation
Observed (NF904)
12
15500
1000
Subb
asin
Buc
ks C
re
15
180
500

0150n-ppt (in.) melt (in.) pweqv (in.) Mill Creek Flat, 5900' Bucks Lake SWE, 5750' Letterbox, 5600'
1
2
3120
130
140
4
5
690
100
110
t wat
er (i
nche
s)
ent (
inch
es)
7
8
960
70
80
cipi
tatio
n &
mel
t
ow w
ater
equ
ival
10
11
1230
40
50
Net
pre
Sno
13
14
150
10
20
995
996
997
998
999
000
001
002
003
004
005
006
007
008
009
010
011
7/1/
19
7/1/
19
7/1/
19
7/1/
19
7/1/
19
7/1/
20
7/1/
20
7/1/
20
7/1/
20
7/1/
20
7/1/
20
7/1/
20
7/1/
20
7/1/
20
7/1/
20
7/1/
20
7/1/
20

0150n-ppt (in.) melt (in.) pweqv (in.) Adjust lapse rate Mill Creek Flat, 5900' Bucks Lake SWE, 5750' Letterbox, 5600'
1
2
3120
130
140
4
5
690
100
110
t wat
er (i
nche
s)
ent (
inch
es)
7
8
960
70
80
cipi
tatio
n &
mel
t
ow w
ater
equ
ival
10
11
1230
40
50
Net
pre
Sno
13
14
150
10
20
995
996
997
998
999
000
001
002
003
004
005
006
007
008
009
010
011
7/1/
19
7/1/
19
7/1/
19
7/1/
19
7/1/
19
7/1/
20
7/1/
20
7/1/
20
7/1/
20
7/1/
20
7/1/
20
7/1/
20
7/1/
20
7/1/
20
7/1/
20
7/1/
20
7/1/
20
03000
MMS run for new Bucks Lake subbasin, WY 1996-1999
32500
62000
atio
n (in
ches
)
cks
Lake
(cfs
)
91500
Ave
rage
Pre
cipi
ta
ek a
t Low
er B
uc
Initial SimulationObserved (NF904)Adjust lapse rate
12
15500
1000
Subb
asin
Buc
ks C
re
Adjust lapse rate
15
180
500

PRMS Input Stations
Canyon Dam
Q iB k C k
Caribou PowerhouseDeSabla
QuincyBucks Creek Powerhouse
Brush Creek
Strawberry Valley

PRMSPrecipitation Runoff Modeling System
http://wwwbrr.cr.usgs.gov/projects/SW_MoWS/PRMS.html
PRISMPRISMParameter‐elevation Regressions on
Independent Slopes Modelhttp://www.prism.oregonstate.edu/


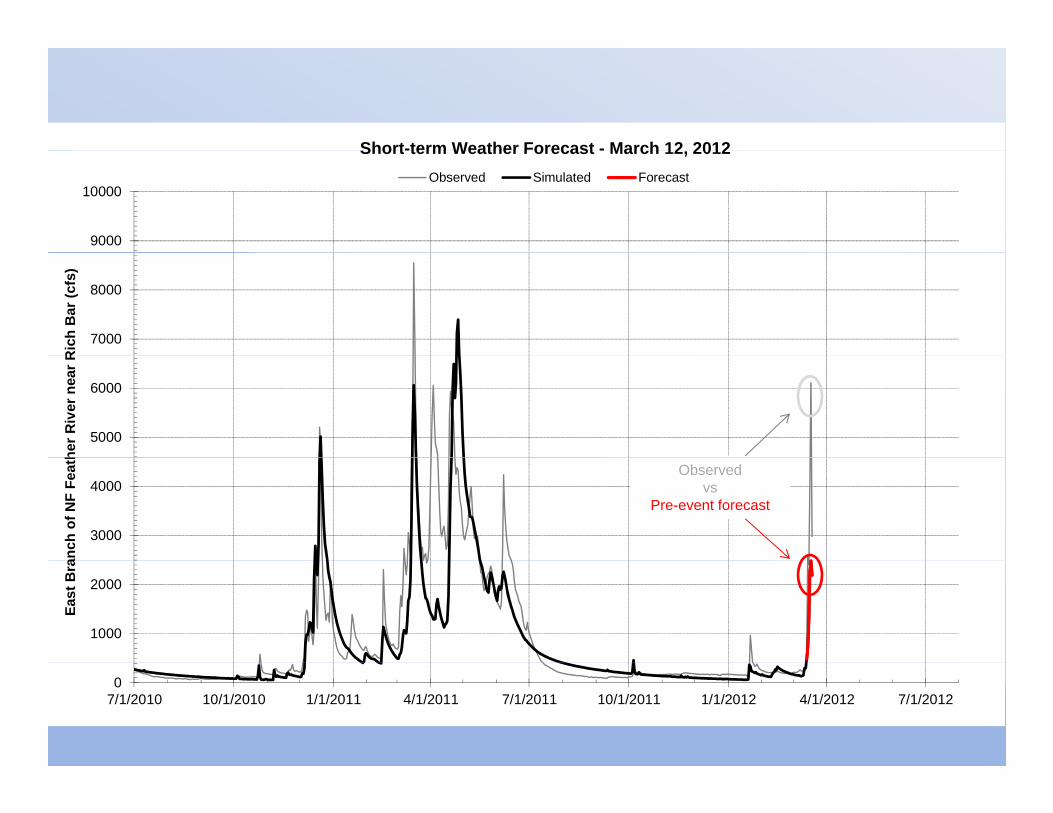
Short-term Weather Forecast - March 12 2012
9000
10000
Short-term Weather Forecast - March 12, 2012Observed Simulated Forecast
7000
8000
Ric
h B
ar (c
fs)
5000
6000
her R
iver
nea
r R
3000
4000
anch
of N
F Fe
ath
Observed vs
Pre-event forecast
1000
2000
East
Bra
07/1/2010 10/1/2010 1/1/2011 4/1/2011 7/1/2011 10/1/2011 1/1/2012 4/1/2012 7/1/2012
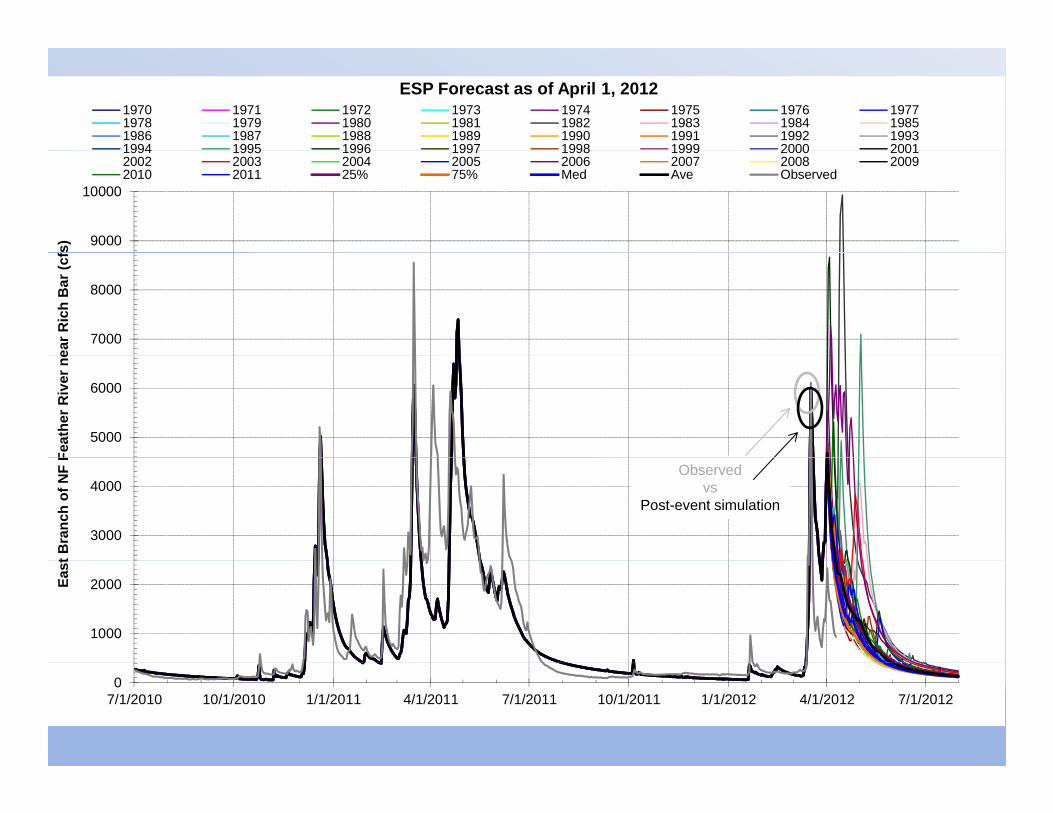
ESP Forecast as of April 1, 20121970 1971 1972 1973 1974 1975 1976 19771978 1979 1980 1981 1982 1983 1984 19851986 1987 1988 1989 1990 1991 1992 19931994 1995 1996 1997 1998 1999 2000 2001
9000
10000
fs)
1994 1995 1996 1997 1998 1999 2000 20012002 2003 2004 2005 2006 2007 2008 20092010 2011 25% 75% Med Ave Observed
7000
8000
ear R
ich
Bar
(cf
5000
6000
Feat
her R
iver
ne
3000
4000
t Bra
nch
of N
F F
Observed vs
Post-event simulation
1000
2000East
07/1/2010 10/1/2010 1/1/2011 4/1/2011 7/1/2011 10/1/2011 1/1/2012 4/1/2012 7/1/2012
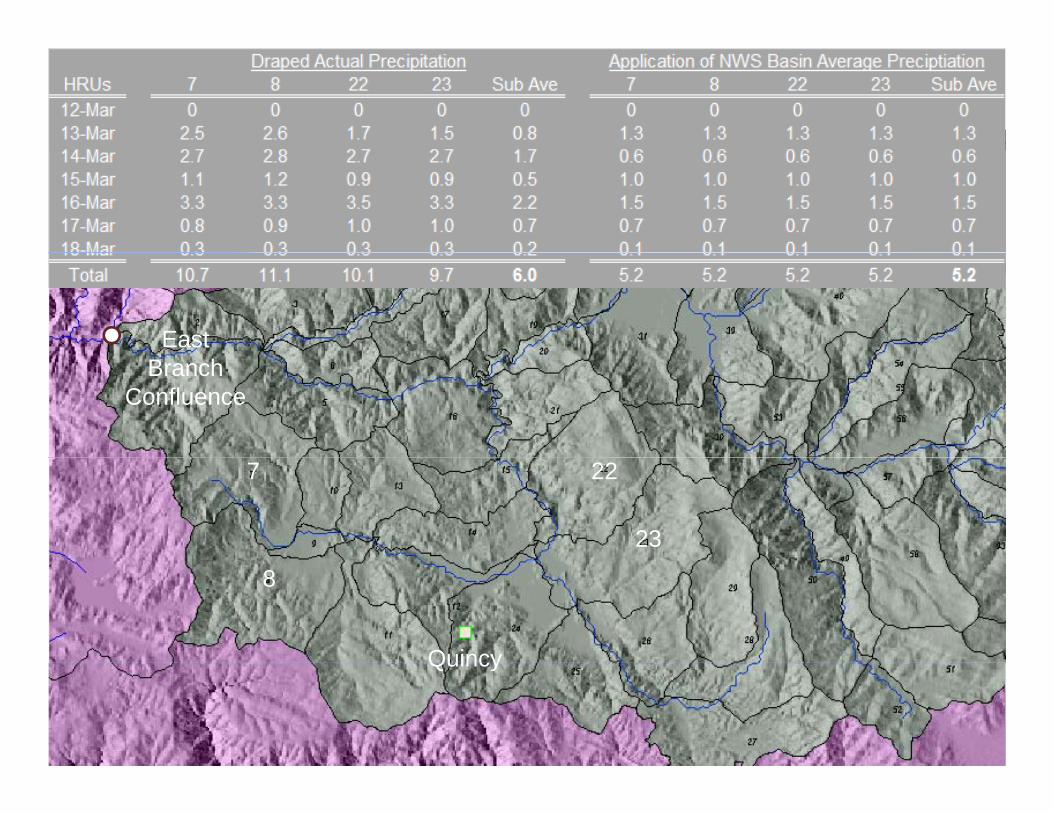
East Branch
Confluence
7 22
23
8
QuincyQuincy

PRMS Feather River PRMS Model Improvement Status
C lif i C i M iCalifornia Cooperative MeetingNovember 8, 2012

Short‐term Forecasting Improvements with Feather PRMS
ModelModel
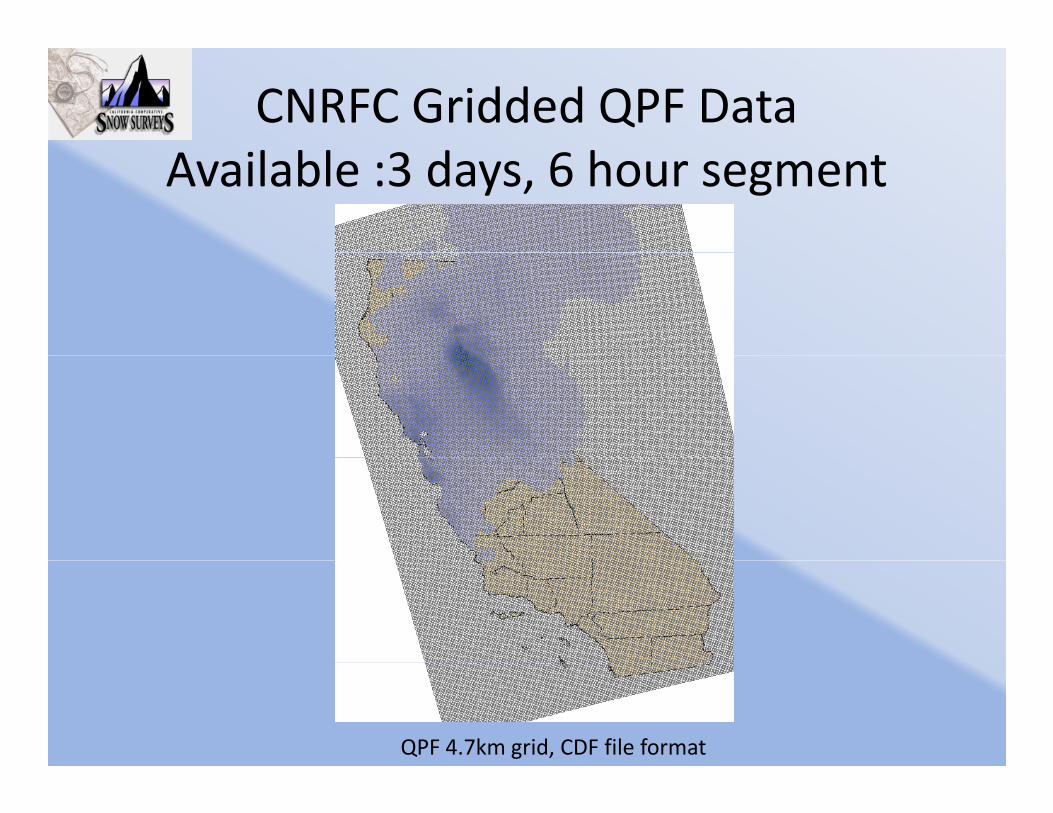
CNRFC Gridded QPF Datal bl d hAvailable :3 days, 6 hour segment
QPF 4.7km grid, CDF file format

Geo‐processing Gridded QPF for PRMS HRUsfor PRMS HRUsProcess the CDF file to a ESRI shape file
Add the four 6 hour QPF grids for each day
p
Q g y
Sample the gridded QPF for the centroid of the HRU
Append data to input fileAppend data to input file(Climate Q files)