Embed Size (px)
Citation preview
TechnicalInformation
GA10 Data Logging SoftwareSetup Guide
TI 04L65B01-02EN
TI 04L65B01-02EN©Copyright January. 2014
3rd Edition Nov. 2016
Yokogawa Electric Corporation2-9-32, Nakacho, Musashino-shi, Tokyo, 180-8750 Japan
The contents of this Technical Information are subject to change without notice.
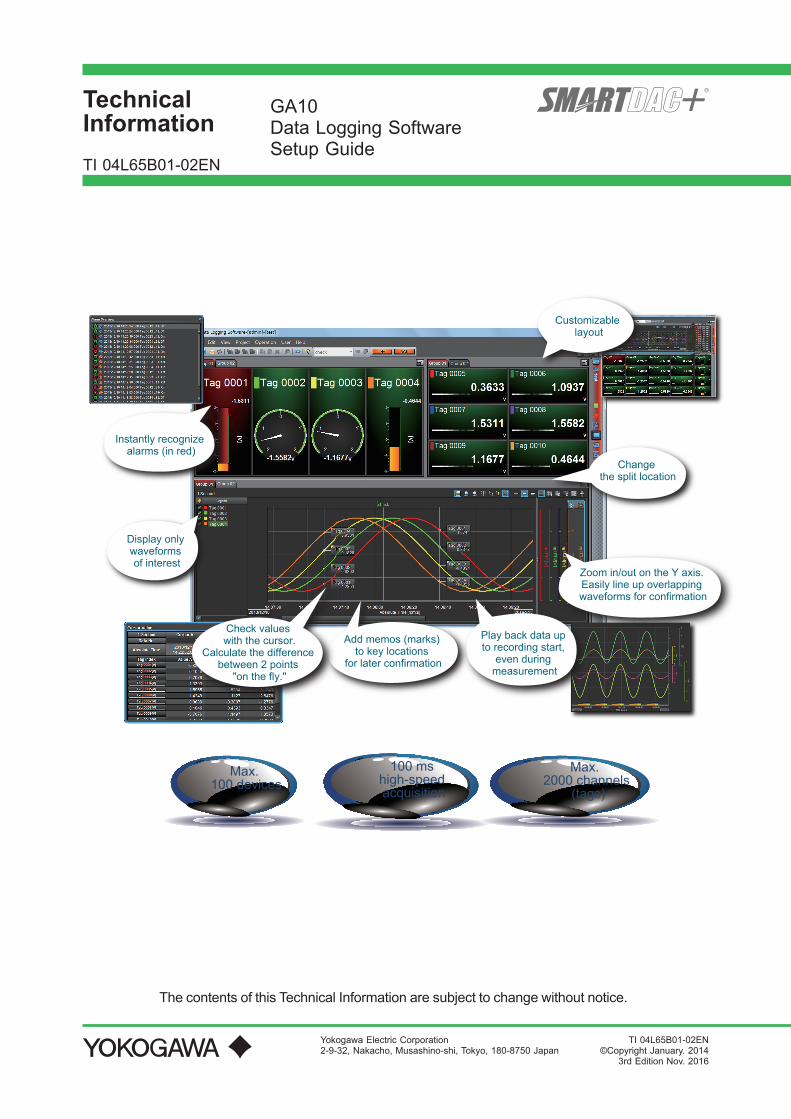
Instantly recognize alarms (in red)
Change the split location
Add memos (marks) to key locations
for later confirmation
Max. 100 devices
100 ms high-speed acquisition
Max. 2000 channels
(tags)
Display onlywaveforms of interest
Play back data up to recording start,
even during measurement
Zoom in/out on the Y axis. Easily line up overlapping waveforms for confirmation
Customizable layout
Check values with the cursor.
Calculate the difference between 2 points
"on the fly."

Blank Page

i
TI 04L65B01-02EN Nov. 01, 2016-00
GA10Data Logging SoftwareSetup Guide TI 04L65B01-02EN
ContentsIntroduction ...................................................................................................... ii
1. Basic Operation of GA10 ....................................................................1-11.1 Collecting Data Easily (Simple Settings) ................................................... 1-1
1.2 Collecting Data with Detailed Settings ....................................................... 1-5
2. Connecting Modbus Devices .............................................................2-1
3. Connecting the WT series ..................................................................3-1
4. For DAQWORX Users .........................................................................4-14.1 Replacing DAQWORX ................................................................................... 4-1
4.2 Using DAQWORX with GA10 ....................................................................... 4-4
4.3 Comparative Table of DAQWORX and GA10 ............................................. 4-5

ii
TI 04L65B01-02EN Nov. 01, 2016-00
IntroductionThis document describes the setup for GA10 Data Logging Software.
■ Notice• The contents of this manual are subject to change without notice as a result of continuing
improvements to the instrument’s performance and functions.
• Every effort has been made to ensure accuracy in the preparation of this manual. Should any errors or omissions come to your attention, however, please inform Yokogawa Electric’s sales office or sales representative.
• Under no circumstances may the contents of this manual, in part or in whole, be transcribed or copied without our permission.
• The images used in this manual may differ from those that actually appear in the software. Such differences do not affect the procedural explanation.
■ Trademarks• Our product names or brand names mentioned in this manual are the trademarks or
registered trademarks of Yokogawa Electric Corporation (hereinafter referred to as YOKOGAWA).
• Microsoft and Windows are registered trademarks or trademarks of Microsoft Corporation in the United States and/or other countries.
• Modbus is a registered trademark of AEG Schneider.
• We do not use the TM or ® mark to indicate these trademarks or registered trademarks in this user’s manual.
• All other product names mentioned in this user’s manual are trademarks or registered trademarks of their respective companies.
■ Scope of This Document This document does not explain the basic operations of the Windows operating system
(OS). For this information, read the relevant user’s guide or related materials.
TI 04L65B01-02EN
1-1
Nov. 01, 2016-00
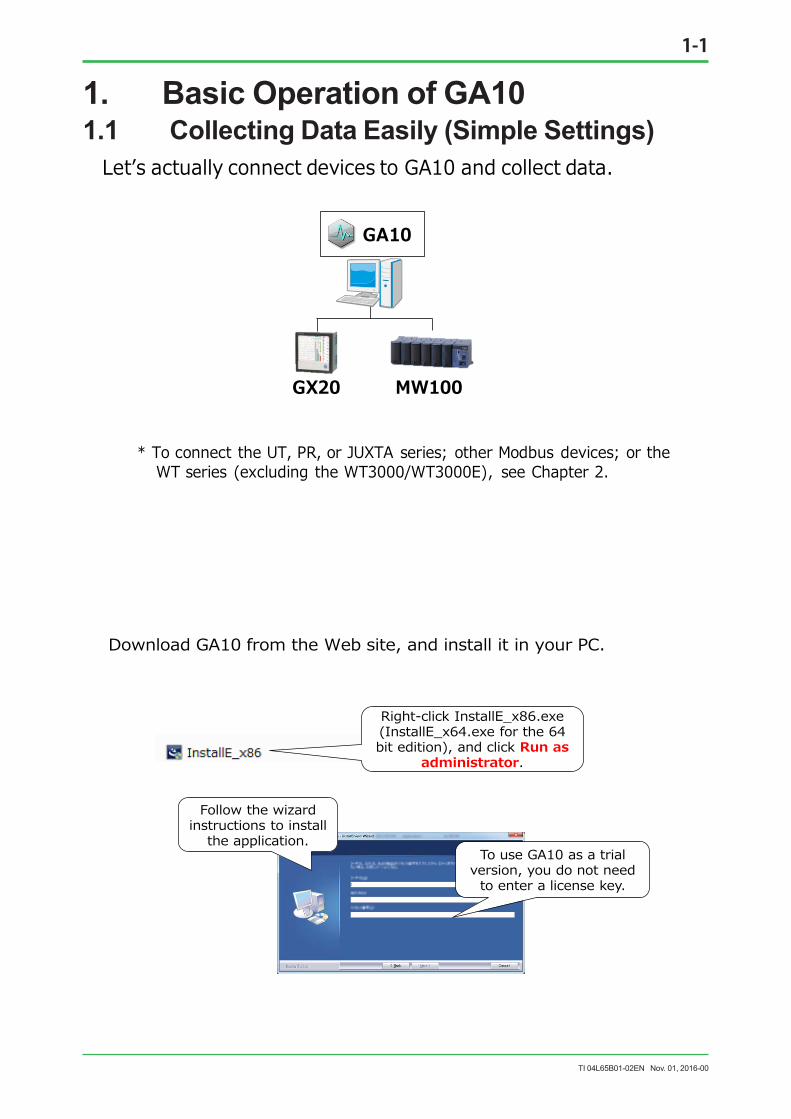
1. Basic Operation of GA101.1 Collecting Data Easily (Simple Settings)
Let’s actually connect devices to GA10 and collect data.
* To connect the UT, PR, or JUXTA series; other Modbus devices; or the WT series (excluding the WT3000/WT3000E), see Chapter 2.
GX20 MW100
GA10
Download GA10 from the Web site, and install it in your PC.
Right-click InstallE_x86.exe (InstallE_x64.exe for the 64 bit edition), and click Run as
administrator.
To use GA10 as a trial version, you do not need
to enter a license key.
Follow the wizard instructions to install
the application.

TI 04L65B01-02EN
1-2
Nov. 01, 2016-00
Start GA10. Start from the Start menu.
Click OK the first time.
Assign a name to the project.
1. On the File menu, click New Project.
2. Enter a name, and click OK.
3. Double-click the new icon.
TI 04L65B01-02EN
1-3
Nov. 01, 2016-00
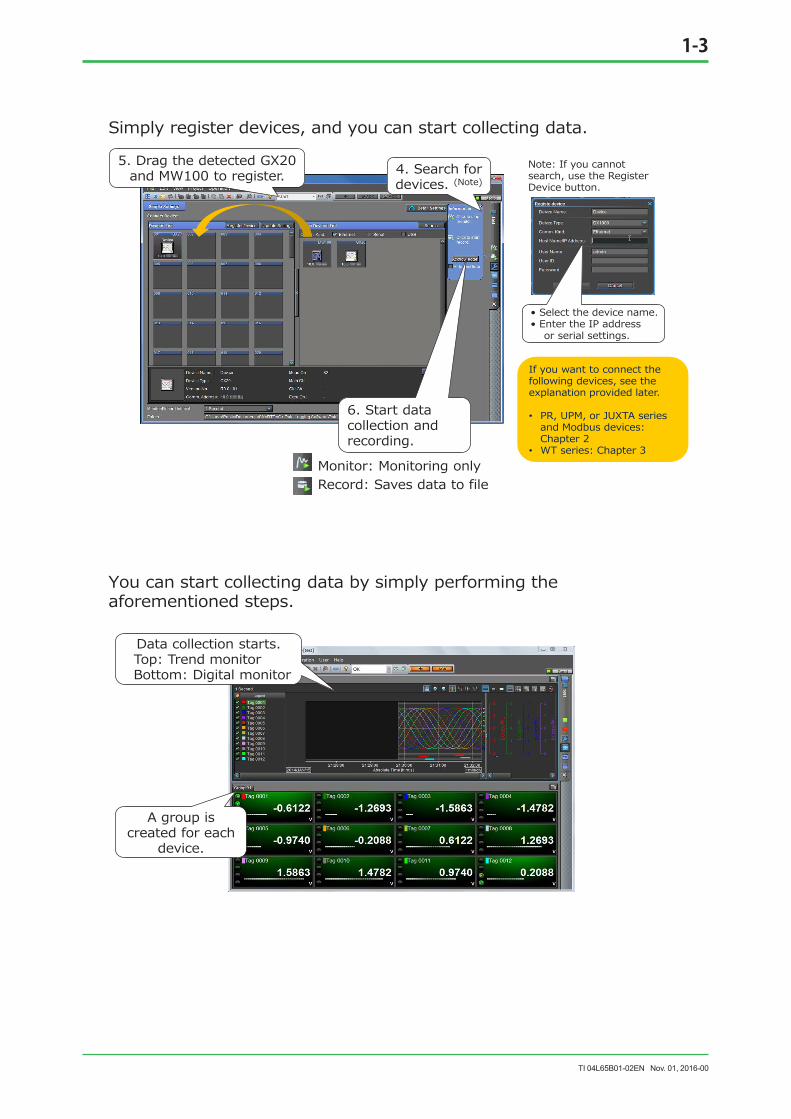
Simply register devices, and you can start collecting data. 5. Drag the detected GX20 and MW100 to register. 4. Search for
devices. (Note)
6. Start data collection and recording.
Monitor: Monitoring only Record: Saves data to file
If you want to connect the following devices, see the explanation provided later. • PR, UPM, or JUXTA series
and Modbus devices: Chapter 2
• WT series: Chapter 3
• Select the device name. • Enter the IP address or serial settings.
Note: If you cannot search, use the Register Device button.
You can start collecting data by simply performing the aforementioned steps.
Data collection starts. Top: Trend monitor Bottom: Digital monitor
A group is created for each
device.

TI 04L65B01-02EN
1-4
Nov. 01, 2016-00
If you recorded data, you can view the data with the viewer.
2. Double-click the data that you want to view.
1. Click the icon on the right side to switch to the
data list page.
The viewer starts.

TI 04L65B01-02EN
1-5
Nov. 01, 2016-00
1.2 Collecting Data with Detailed Settings
Switch to Detail Settings mode.
Click the Detail Settings button.
Use the tabs on the right side to switch pages.
“Detail Settings mode”
Set the items in the left menu in order
from the top.
You can change tag numbers and tag comments. You can enter tag
numbers and tag comments.
You can copy and paste selected lines, turn on and off tags collectively, and assign numbers automatically (increment).z
Select Tag.

TI 04L65B01-02EN
1-6
Nov. 01, 2016-00
Group tags any way you like. Automatic assignment by device or by a specific number of tags is possible.)
On the View menu, click Display Group.
Display group name Y-axis to use
for trends Meter display
type
Max. and min. scale values to
display
You can assign tags to different groups as you like. – You can change how to display the waveforms, such as the waveform color,
meter type, Y-axis, and scale.
Zone
Trip: Displays a horizontal guideline Example: Specify 5.0.
Zone: Specify the vertical waveform position. Example: Specify 1 to 25, 25 to 75, and 75 to 100.
Trip

TI 04L65B01-02EN
1-7
Nov. 01, 2016-00
Selecting the data time We recommend you use “PC time,” which does not divide the screen or files.
– Use “Device time” to back up data or when replacing DAQ32Plus.
Timestamp Collection and record
interval Backfill* Monitor page
(Trend/Alarm) Data file
PC time
Time on the PC
Can be set freely
No Displayed on a single page
Saved to a single file
Device time Time on the device
Uses the interval on the device
Yes Page divided by device or collection interval
File divided by device or collection interval
* Backfill operates under the following conditions. • Applicable devices: GX/GP/GM/DX/MV • Data is retained in the device’s internal memory. • The device’s FTP function is on.
• Monitoring applications on a PC • If you want data to be consolidated into a single file • For replacing DAQLOGGER
• Data backup applications • For replacing DAQ32Plus (using one Darwin unit)
Changing the monitor screen – The monitor page can be divided into up to 16 monitor sets.
Example 1: 4 monitor sets (horizontally divided into 2)
Example 2: 6 monitor sets (horizontally divided into 2)
The available display types are trend, digital, meter, and alarm.
Check the preview.
On the View menu, click Acquisition & Monitor.

Blank Page
TI 04L65B01-02EN
2-1
Nov. 01, 2016-00
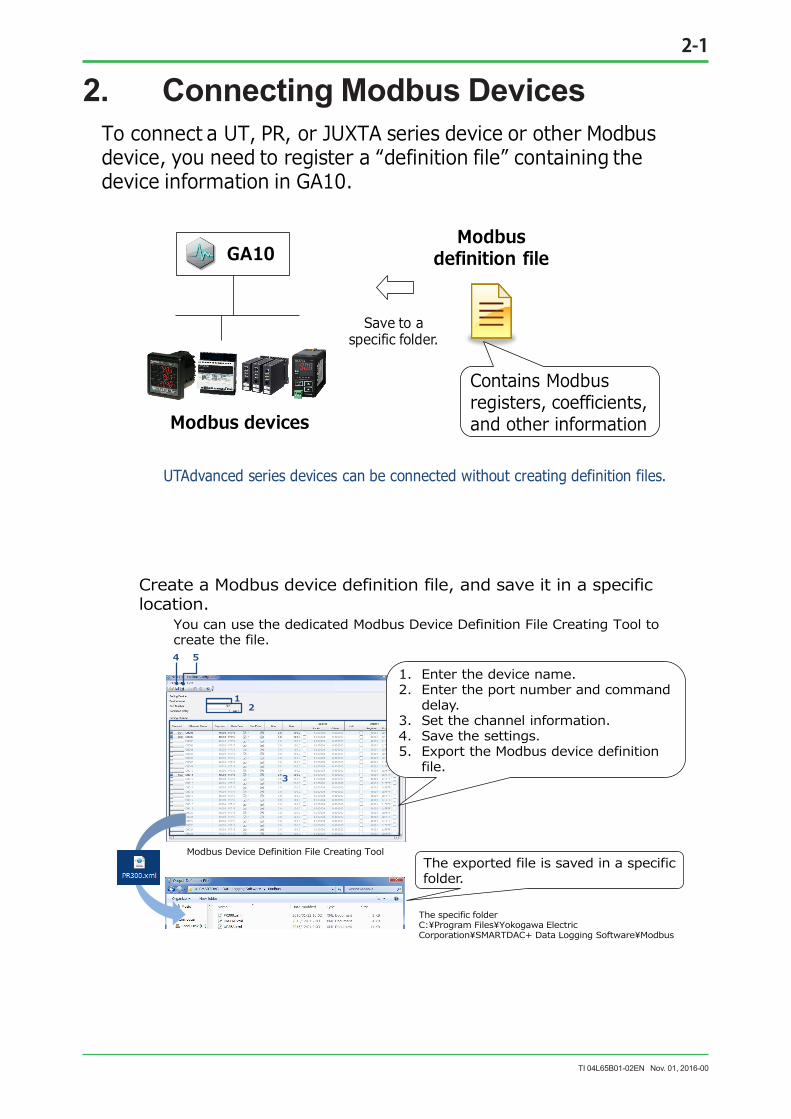
2. Connecting Modbus DevicesTo connect a UT, PR, or JUXTA series device or other Modbus device, you need to register a “definition file” containing the device information in GA10.
Contains Modbus registers, coefficients, and other information
GA10
Save to a specific folder.
Modbus definition file
Modbus devices
UTAdvanced series devices can be connected without creating definition files.
Create a Modbus device definition file, and save it in a specific location.
You can use the dedicated Modbus Device Definition File Creating Tool to create the file.
1 2
3
4 5
Modbus Device Definition File Creating Tool The exported file is saved in a specific folder.
1. Enter the device name. 2. Enter the port number and command
delay. 3. Set the channel information. 4. Save the settings. 5. Export the Modbus device definition
file.
The specific folder C:¥Program Files¥Yokogawa Electric Corporation¥SMARTDAC+ Data Logging Software¥Modbus

TI 04L65B01-02EN
2-2
Nov. 01, 2016-00
Restart the GA10 service.
Select DLGServer, click Stop and then Start.
On the Start menu, click Control Panel and
Administrative Tools, and double-click Services.
The defined device can now be registered on the GA10 Setting Page. The subsequent setting procedure is the same as in the normal case.
The device is added to the list.
TI 04L65B01-02EN
3-1
Nov. 01, 2016-00
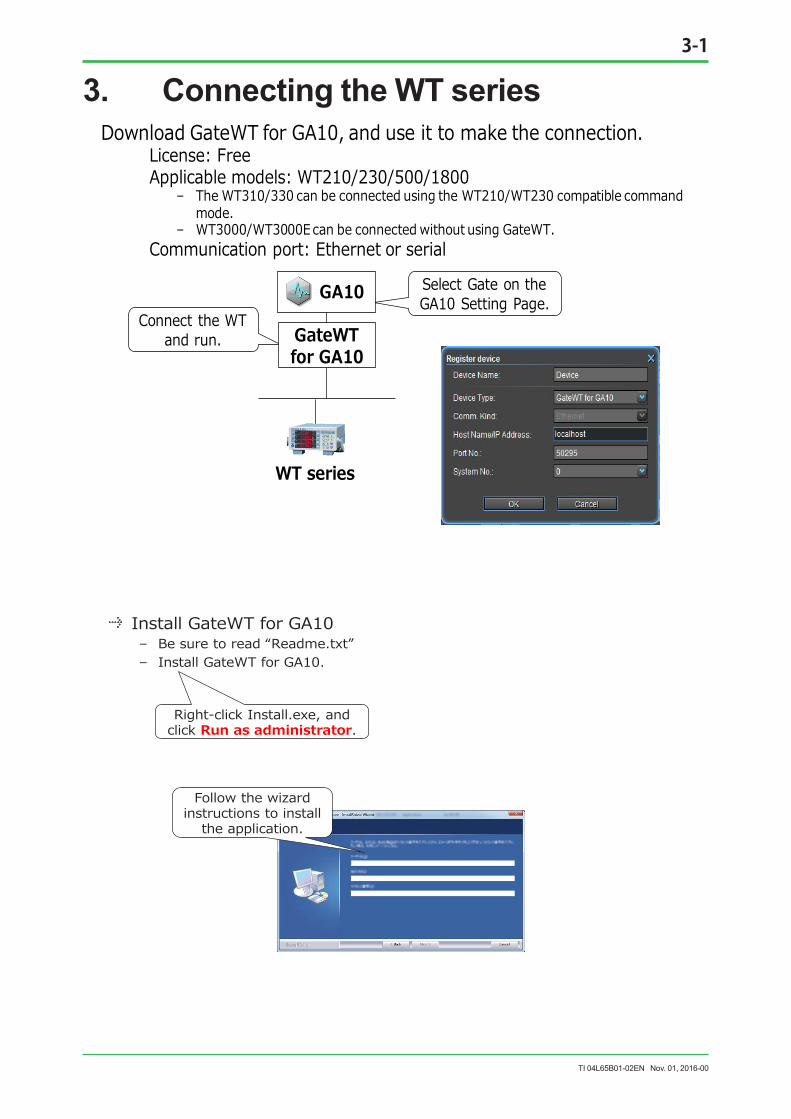
3. Connecting the WT seriesDownload GateWT for GA10, and use it to make the connection.
License: FreeApplicable models: WT210/230/500/1800
– The WT310/330 can be connected using the WT210/WT230 compatible command mode.
– WT3000/WT3000E can be connected without using GateWT.Communication port: Ethernet or serial
Select Gate on the GA10 Setting Page.
Connect the WT and run.
WT series
GA10
GateWT for GA10
Install GateWT for GA10 – Be sure to read “Readme.txt” – Install GateWT for GA10.
Follow the wizard instructions to install
the application.
Right-click Install.exe, and click Run as administrator.

TI 04L65B01-02EN
3-2
Nov. 01, 2016-00
Start GateWT for GA10.
Switch tabs Switch tabs
4. On the Scan Interval Setting Tab, set the scan
interval (msec).
3. Double-click the device number to set the channels to load.
1. Select the communication method.
ETHER: Enter the address (IP address). COM: Set on the serial setting tab in advance.
2. Select the device to automatically detect the device type.
2. Select the device to automatically detect
the device type.
When you finish the settings, register the device to GA10.
5. On the Execution/Status tab, click the process
execution button.
7. Register the device on the GA10 Setting Page.
Device type: GateWT for GA10IP address: localhost
6. Check that the PC information is added to the connection status.
8. Start data collection and recording on GA10.
Switch tabs

TI 04L65B01-02EN
4-1
Nov. 01, 2016-00
4. For DAQWORX Users
If you are using the logger software, you can replace it with GA10. See 4.1
– Applicable products: DAQLOGGER, DAQ32Plus, MXLOGGER
If the following condition applies, use DAQWORX and GA10 together. See 4.2
Item Condition OS Windows XP or earlier is in use. Device A legacy model or a model with an older version not supported by GA10
is in use. Communication GP-IB communication is in use. Function The following DAQWORX function is in use.
-Event processor (e-mail transmission, FTP transfer, html conversion, etc.)-File utility (file split and merge)-Math channels, AO channels, or DO channels are in use. (Mainly, MXLOGGER)
Software The following software application is in use. -AddTrigger -AddObserver -DataBrowser
4.1 Replacing DAQWORX
Check the settings of the logger software that you are using, and configure GA10 from scratch.
It is convenient to use the print function to view the settings.
Print function example: DAQLOGGER “ENVI”, Environment settings
Some Setting Pages have functions for
printing the contents.
GA10
GX20 DX1000
Configure from scratch.
DAQ LOGGER
DX1000
Replace View the settings.

TI 04L65B01-02EN
4-2
Nov. 01, 2016-00
• DAQLOGGER You can view the settings in the following locations.
DAQLOGGER Manager
Display settings (Scale, Zone, Color, etc.)
Data Monitor
Others>Event Processor>Configuration (E-mail, File conversion, etc.)
Logger > Configuration (Scan intervals, File destinations, etc.)
Others>Report>Configuration (Report)
Software Configurator
(Devices, Communication)
Tag Editor (Tag No., Tag comments)
Group Editor (Grouping)
• DAQ32Plus You can view the settings in the following locations.
DAQ32Plus Launcher
Software Configurator (Devices, Communication) Tag Editor
(Tag No., Tag comments)
DARWIN Hardware Configurator
(Math channels)
Logging > Logging Configuration(Scan intervals, File destinations,
etc.)
Option>Run Auto Processor(File conversion, Report)
Logging >General Display Settings
(Scale, Zone, Color, etc.)
Logger

TI 04L65B01-02EN
4-3
Nov. 01, 2016-00
• MXLOGGER You can view the settings in the following locations.
System (Devices,
Communication)
Acquisition (Measurement intervals, File destinations, etc.)
Channel (Tag No., Tag comments)
Event Config. (E-mail)
General Display Settings (Note)
(Groups, Scale, Zone, Color, etc.)
Note: You must start data collection.
MXLOGGER Logger
• GA10 – Configure from scratch. – You can reduce the burden of configuration by using the GA10 tag import
feature, tag auto assignment feature, and the Action bar.
Detail Settings > Tag Detail Settings > Display > Display Group
Detail Settings > Tag or Display You can copy and paste selected
lines, turn on and off tags collectively, and assign numbers automatically
(increment).
You can load a list of tag names and tag comments
that you created with Excel, Notepad, etc.
You can use automatic assignment by device or by the number of tags.

TI 04L65B01-02EN
4-4
Nov. 01, 2016-00
4.2 Using DAQWORX with GA10
1. Parallel use You can use the current configuration and add GA10.
2. Host connection By integrating GA10 as a host to DAQWORX, collected data can be consolidated in GA10.
μR1000
GA10
DX100
DAQ LOGGER
1. Mix GA10 with existing software
GX20
Add Multi
2. Connect GA10 as a host
μR1000
GA10
DX100
DAQ LOGGER
GX20
Add Multi
Existing system Existing system
Use with DAQWORX
Data can be consolidated in
GA10.
No reconfiguration
necessary.
1. Parallel use Install GA10 in the PC that you are using, and configure from scratch.
μR1000
GA10
DX100
DAQ LOGGER
Parallel use example
GX20
Add Multi
Configure from scratch.
Existing system
No changes
TI 04L65B01-02EN
4-5
Nov. 01, 2016-00
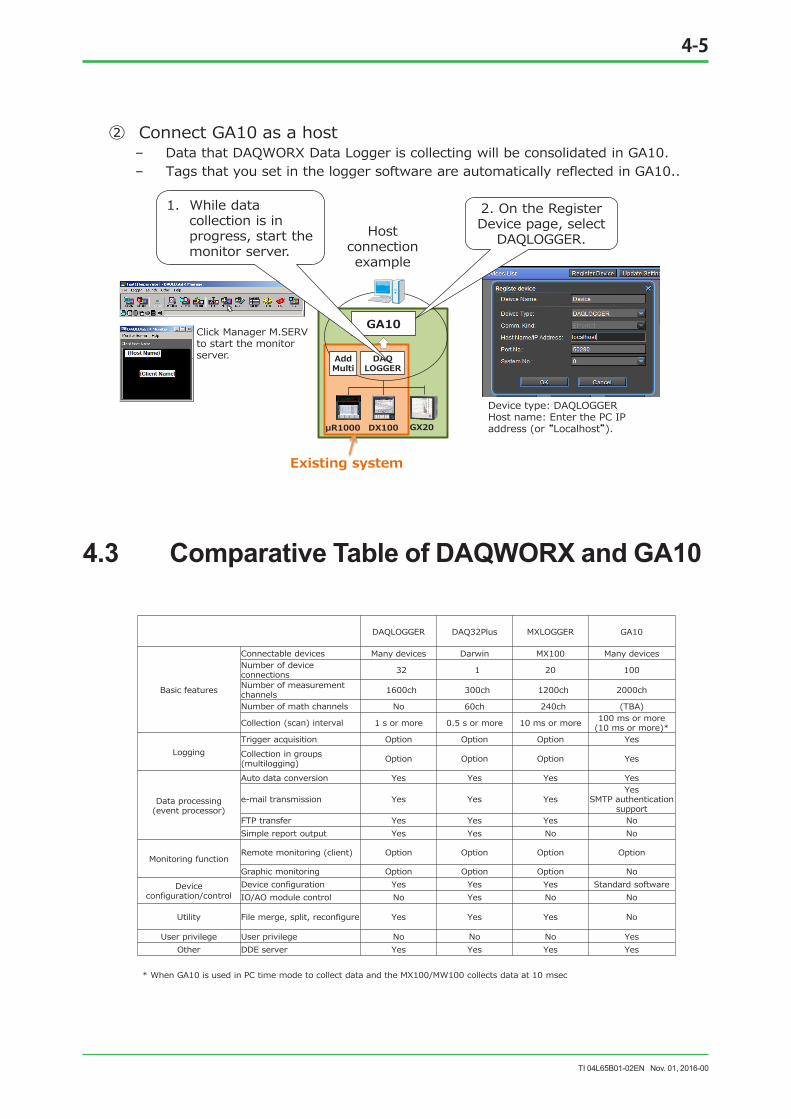
② Connect GA10 as a host – Data that DAQWORX Data Logger is collecting will be consolidated in GA10. – Tags that you set in the logger software are automatically reflected in GA10..
Host connection example
μR1000
GA10
DX100
DAQ LOGGER
GX20
2. On the Register Device page, select
DAQLOGGER.
Click Manager M.SERV to start the monitor server.
1. While data collection is in progress, start the monitor server.
Device type: DAQLOGGER Host name: Enter the PC IP address (or “Localhost”).
Add Multi
Existing system
4.3 Comparative Table of DAQWORX and GA10
DAQLOGGER DAQ32Plus MXLOGGER GA10
Basic features
Connectable devices Many devices Darwin MX100 Many devices Number of device connections 32 1 20 100
Number of measurement channels 1600ch 300ch 1200ch 2000ch
Number of math channels No 60ch 240ch (TBA)
Collection (scan) interval 1 s or more 0.5 s or more 10 ms or more 100 ms or more (10 ms or more)*
Logging Trigger acquisition Option Option Option Yes Collection in groups (multilogging) Option Option Option Yes
Data processing(event processor)
Auto data conversion Yes Yes Yes Yes
e-mail transmission Yes Yes Yes Yes
SMTP authentication support
FTP transfer Yes Yes Yes No Simple report output Yes Yes No No
Monitoring function Remote monitoring (client) Option Option Option Option
Graphic monitoring Option Option Option No Device
configuration/control Device configuration Yes Yes Yes Standard software IO/AO module control No Yes No No
Utility File merge, split, reconfigure Yes Yes Yes No
User privilege User privilege No No No Yes Other DDE server Yes Yes Yes Yes
* When GA10 is used in PC time mode to collect data and the MX100/MW100 collects data at 10 msec

Blank Page

iii
TI 04L65B01-02EN Nov. 01, 2016-00
Revision InformationTitle : GA10 Data Logging Software Setup GuideManual number : TI 04L65B01-02EN
Jan. 2014 1st EditionNewly publishedFeb. 2016 2nd EditionPeriodic correctionNov. 2016 3rd EditionRevised for GA10 R3.01
Written by Yokogawa Electric Corporation Published by Yokogawa Electric Corporation 2-9-32 Nakacho, Musashino-shi, Tokyo 180-8750, JAPAN