Embed Size (px)
Citation preview

The Flying Geese Paradigm: Ver 2.0Masahiko Aoki
Stanford University and VCASI

Flying geese paradigm Ver 2.
• 雁行モデル Ver 1.0, 1.1.
–技術移転モデル(赤松)
–開発援助政策(大来)
• 雁行モデル Ver 2.0
–東アジア比較制度・発展モデル。人口,技術,経済,政治,社会規範を統合的にとらえる。
–含意。東アジアにおける国際関係ゲーム、日本の次世代アジェンダ(『失われた20年』をどう越えてるか)

GDP比較 (2009, IMF)Nominal
(Billion US$)PPP Ranking
by PPPPer capita
(PPP)
China 4,908 8,765 2 6,567
Japan 5,068 4,159 3 32,608
Korea 832 1,364 12 27,978
Taiwan 378 735 19 31,834
Hong Kong 210 307 - 42,748
East Asia, total 11,396 15,330 - -
US 14,256 14,256 1 46,381
Canada 1,336 1,281 14 38,025
North America 15,592 15,537 - -
EU 16,447 14,793 - -

China vs. Japan (GDP/PPP)by Maddison (1990 Geary-Khamis $)
。
0
5,000
10,000
15,000
20,000
25,000
0
500,000
1,000,000
1,500,000
2,000,000
2,500,000
3,000,000
3,500,000
4,000,000
4,500,000
5,000,000
19
50
19
52
19
54
19
56
19
58
19
60
19
62
19
64
19
66
19
68
19
70
19
72
19
74
19
76
19
78
19
80
19
82
19
84
19
86
19
88
19
90
19
92
19
94
19
96
19
98
20
00
China (GDP) Japan (GDP) China (Per Capita GDP):RHS Japan (Per Capita GDP):RHS
1990 G-K dollars1990-million M G-K dollars

中国の高度成長はなにを意味するか?
• “The global imbalance”の主要原因か?
• 「脅威」か?
• 「戦略的的互恵関係」か? なにをそれは意味しているのか?
• なぜ、東アジアか?

Beijing in 1920 Korea Genetically engineered paddy art, Japan
•共通の社会,経済的背景:土地「保有」耕作小農経済 (no plantation, no large-scale hired labor)
市場経済発展の初期条件としての農業雇用人口: 日本: 65% in 1885, 50% in 1950中国: 85% in 1952, 70% 1978韓国: 50% in 1970
• 移転メカニズムMalthusian trap (マルサスの罠)vs. the “unlimited labor supply”(Arthur Lewis)にもとずく資本蓄積.
.
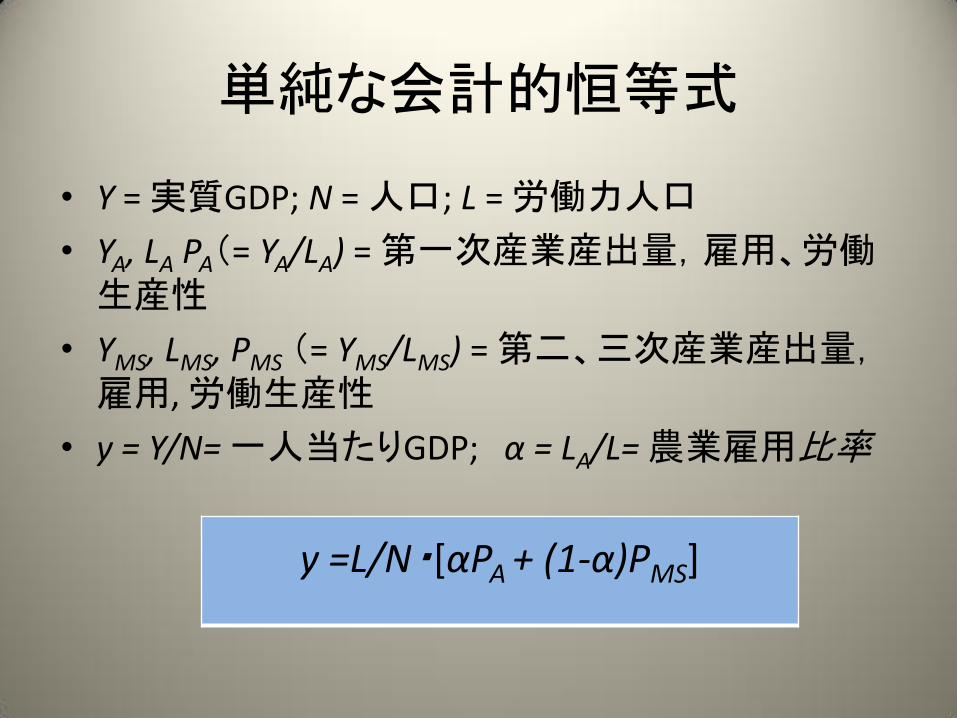
単純な会計的恒等式
• Y = 実質GDP; N = 人口; L = 労働力人口
• YA, LA PA(= YA/LA) = 第一次産業産出量,雇用、労働生産性
• YMS, LMS, PMS (= YMS/LMS) = 第二、三次産業産出量,雇用, 労働生産性
• y = Y/N= 一人当たりGDP; α = LA/L= 農業雇用比率
y =L/N・[αPA + (1-α)PMS]

Fertility & mortality
y
L / N α
Investment in K & HK.
TFP growth?
P
Institutional factors
恒等式 y =L/N・[αPA + (1-α)PMS] の背後にある
動学的メカニズム

Dynamic Path in China (1952-2008)
.
0.0
10.0
20.0
30.0
40.0
50.0
60.0
70.0
80.0
90.0
100.0
0 500 1,000 1,500 2,000 2,500 3,000 3,500 4,000
α =
agr
icu
ltu
ral e
mp
loym
en
t
y = per capita income
1952-1964 1965-1977 1978-1996 1997-2002 2003-2008
index ( 1952=100)
(%)

Classical flying geese pattern within China (1985~2008)
.
0.0
10.0
20.0
30.0
40.0
50.0
60.0
70.0
80.0
90.0
100.0
0 1000 2000 3000 4000 5000 6000
α =
agr
icu
ltu
ral e
mp
loym
en
t
y = per capita income
advanced coastal region less-developed inland region (excl. inner Mongolia)
index (1952=100)
(%)

L/N: マルサスの罠から人口配当へ中国(1950-2010)
0
10
20
30
40
50
60
70
80
19
50
19
55
19
60
19
65
19
70
19
75
19
80
19
85
19
90
19
95
20
00
20
05
20
10
20
15
20
20
20
25
20
30
20
35
20
40
20
45
20
50
aged 0-14
aged 15-64
aged 65 or over
aged 60+ (Du Peng)
(%)
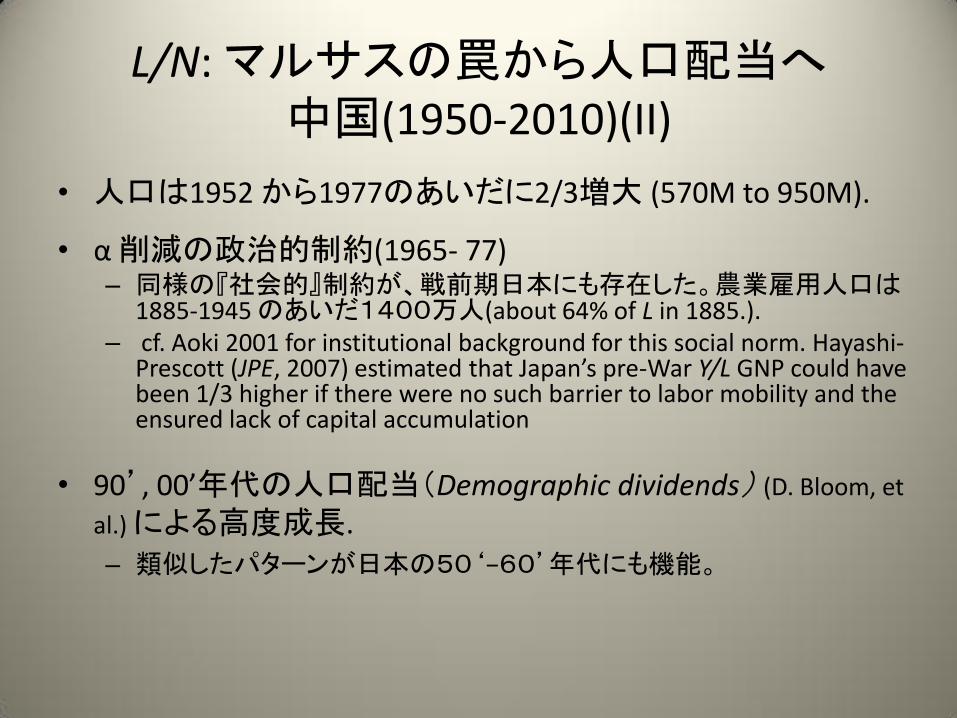
L/N: マルサスの罠から人口配当へ中国(1950-2010)(II)
• 人口は1952 から1977のあいだに2/3増大 (570M to 950M).
• α削減の政治的制約(1965- 77)– 同様の『社会的』制約が、戦前期日本にも存在した。農業雇用人口は
1885-1945 のあいだ1400万人(about 64% of L in 1885.).– cf. Aoki 2001 for institutional background for this social norm. Hayashi-
Prescott (JPE, 2007) estimated that Japan’s pre-War Y/L GNP could have been 1/3 higher if there were no such barrier to labor mobility and the ensured lack of capital accumulation
• 90’, 00’年代の人口配当(Demographic dividends) (D. Bloom, et
al.) による高度成長. – 類似したパターンが日本の50‘−60’年代にも機能。

日本の人口構成動学
.
0.0
10.0
20.0
30.0
40.0
50.0
60.0
70.0
80.0
18
84
18
88
18
98
19
08
19
20
19
30
19
40
19
50
19
55
19
60
19
65
19
70
19
75
19
80
19
85
19
90
19
95
20
00
20
05
20
10
20
15
20
20
20
25
20
30
20
35
20
40
20
45
20
50
aged 0-14
aged 14-64
aged 65 and over
(%)
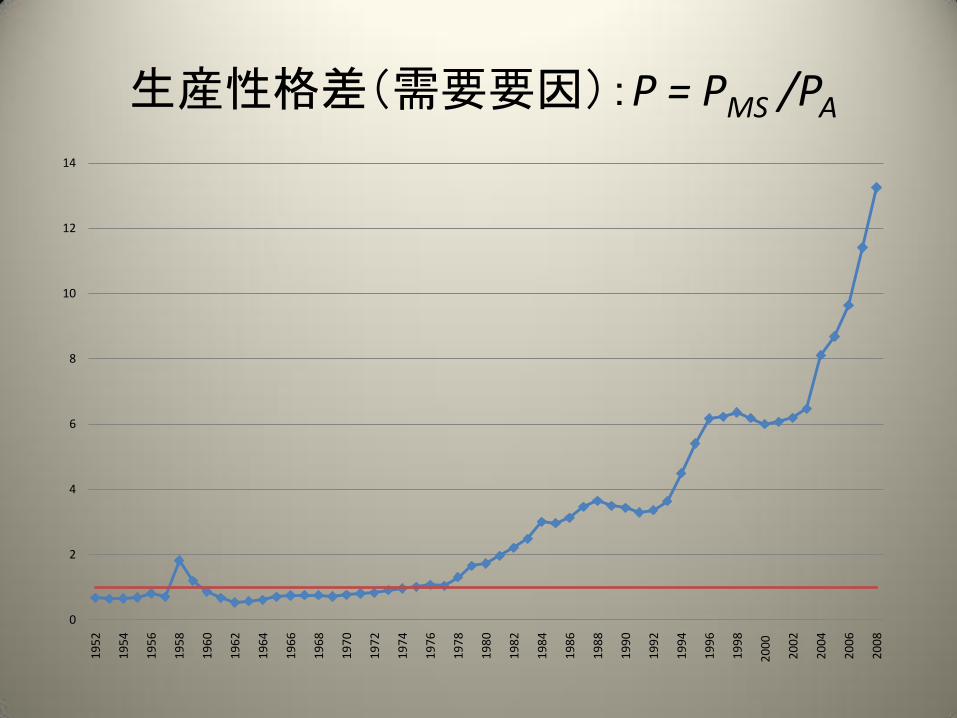
生産性格差(需要要因):P = PMS /PA
.
0
2
4
6
8
10
12
14
19
52
19
54
19
56
19
58
19
60
19
62
19
64
19
66
19
68
19
70
19
72
19
74
19
76
19
78
19
80
19
82
19
84
19
86
19
88
19
90
19
92
19
94
19
96
19
98
20
00
20
02
20
04
20
06
20
08

ルイス・ギャップ(需要)要因• 1969年まで:
–集権的価格コントロール (P~1).
• 1970年代:
–郷鎭企業など、農村における生産性向上
• 1990年代以降:
–国有企業改革、民営化 (都市雇用比率は1978の78% か
らof urban employment in 197、2009年の20.6% ).
– FDI (2009年工業付加価値の26.7%, 輸出の55.3%, 税収入の22%).
–地方財政問題の作り出す不動産・建設ブーム (2008年財政収入の22%)
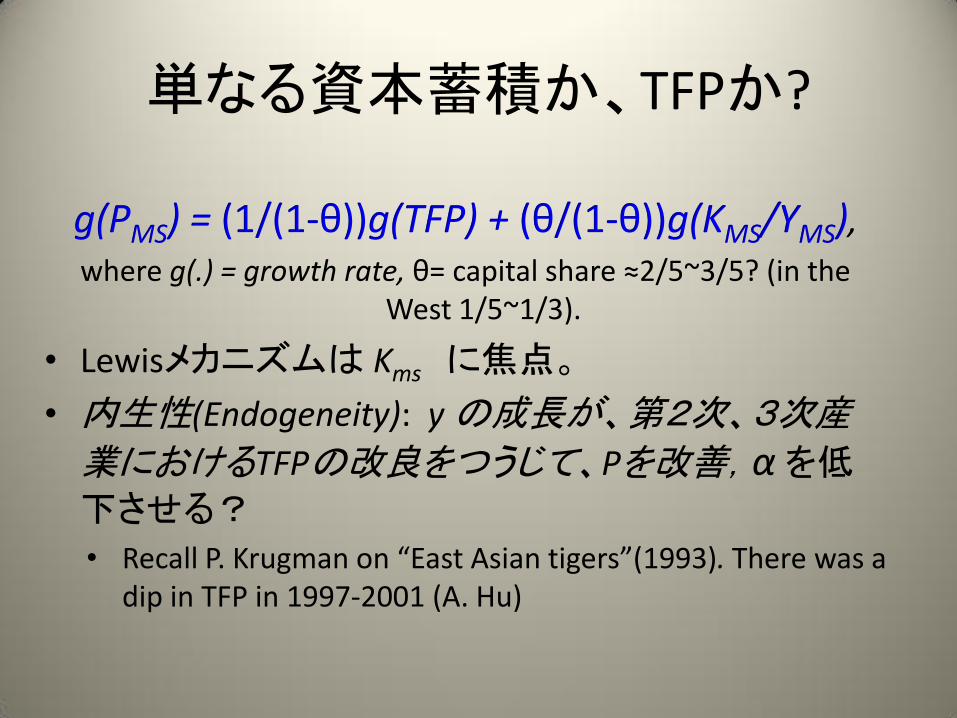
単なる資本蓄積か、TFPか?
g(PMS) = (1/(1-θ))g(TFP) + (θ/(1-θ))g(KMS/YMS),
where g(.) = growth rate, θ= capital share ≈2/5~3/5? (in the West 1/5~1/3).
• Lewisメカニズムは Kms に焦点。
• 内生性(Endogeneity): yの成長が、第2次、3次産業におけるTFPの改良をつうじて、Pを改善,αを低下させる?
• Recall P. Krugman on “East Asian tigers”(1993). There was a dip in TFP in 1997-2001 (A. Hu)

L/N: 人口配当の終わり (2010-)
0
10
20
30
40
50
60
70
80
19
…
19
…
19
…
19
…
19
…
19
…
19
…
19
…
19
…
19
…
20
…
20
…
20
…
20
…
20
…
20
…
20
…
20
…
20
…
20
…
20
…
aged 0-14
aged 15-64
aged 65 or over
aged 60+ (Du Peng)
(%)

The proportion of the aged 65/60 and older: East Asian economies and the US (1950-2050)
.
0
5
10
15
20
25
30
35
40
1950 1955 1960 1965 1970 1975 1980 1985 1990 1995 2000 2005 2010 2015 2020 2025 2030 2035 2040 2045 2050
Japan China (Official estimate) China (60+ by Du Peng) US S.Korea
(%

Dynamic Path in Japan (1920-2005)
.
0.0
10.0
20.0
30.0
40.0
50.0
60.0
70.0
80.0
90.0
100.0
0 500 1,000 1,500 2,000 2,500 3,000 3,500 4,000 4,500
α =
agr
icu
ltu
ral e
mp
loym
en
t
y = per capita income
1920,1930,1940 1950-1970 1975-1990
1995-2005 China coastal PPP,2008 China inland PPP,2008
1,000 JPY (1990)
(%)

Dynamic Path in Korea (1970-2008)
.
0.0
10.0
20.0
30.0
40.0
50.0
60.0
70.0
80.0
90.0
100.0
0 500 1,000 1,500 2,000 2,500
α =
agr
icu
ltu
ral e
mp
loym
en
t
y = per capita income10 Thousand.Won (2005)
(%)

東アジア経済の相対的位置
Japan (1920)
Japan (1950)
Japan (2005)
China coastal PPP (2008)
China inland PPP (2008)
Korea PPP(2008)Japan (1970)
0.0
10.0
20.0
30.0
40.0
50.0
60.0
70.0
80.0
90.0
100.0
0 500 1,000 1,500 2,000 2,500 3,000 3,500 4,000 4,500
α =
agr
icu
ltu
ral e
mp
loym
en
t
y = per capita income 1,000 JPY
(%)

東アジア経済開発の進化プロセス
–準マルサス段階 The quasi-Malthusian phase I: 停滞的な αと y (Japan: until 50, Korea until mid-60’s, China: until 76 )
–準ルイス段階 The quasi-Lewisian phase II: αの継続的低下(up to 20%?)と yの高度成長 (Japan:50-70, Korea:mid60s-90, China:78 - ).
–ポスト・ルイス段階 The post-Lewisian phase III: Pms の自立的発展による yの継続的成長 (Japan:70’-80’, Korea:91- ?)
–低労働参加段階 Forthcoming phase IV
Flying geese pattern
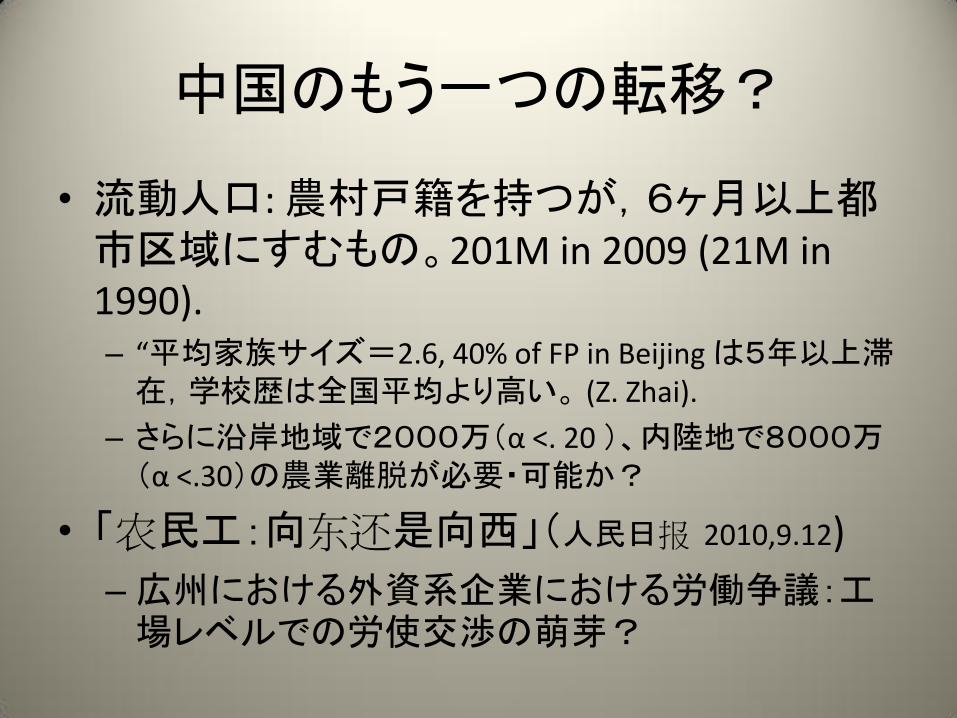
中国のもう一つの転移?
• 流動人口: 農村戸籍を持つが,6ヶ月以上都市区域にすむもの。201M in 2009 (21M in 1990).– “平均家族サイズ=2.6, 40% of FP in Beijing は5年以上滞在,学校歴は全国平均より高い。 (Z. Zhai).
– さらに沿岸地域で2000万(α <. 20 )、内陸地で8000万(α <.30)の農業離脱が必要・可能か?
• 「农民工:向东还是向西」(人民日报 2010,9.12)
–広州における外資系企業における労働争議:工場レベルでの労使交渉の萌芽?

時期 主導産業 政治国家 社会規範
日本 I ~ 1950 農村共同体規範
II 1952~1970 もの造り 開発国家(鉄の三角形)
地縁、同窓縁
III 1970~1992 環境,都市経営
多元的・交渉裁定国家
組織規範(終身雇用)
IV 1992~ 自然資源・サービス?
政権交代/連立?
世代間和解?移民?
中国 I ~1976 一党独裁 政治的規範
II 1978~? 郷鎭企業FDI
開発国家 一人子家族
III ? 工業 交渉裁定国家?
Guanxiとは?
IV
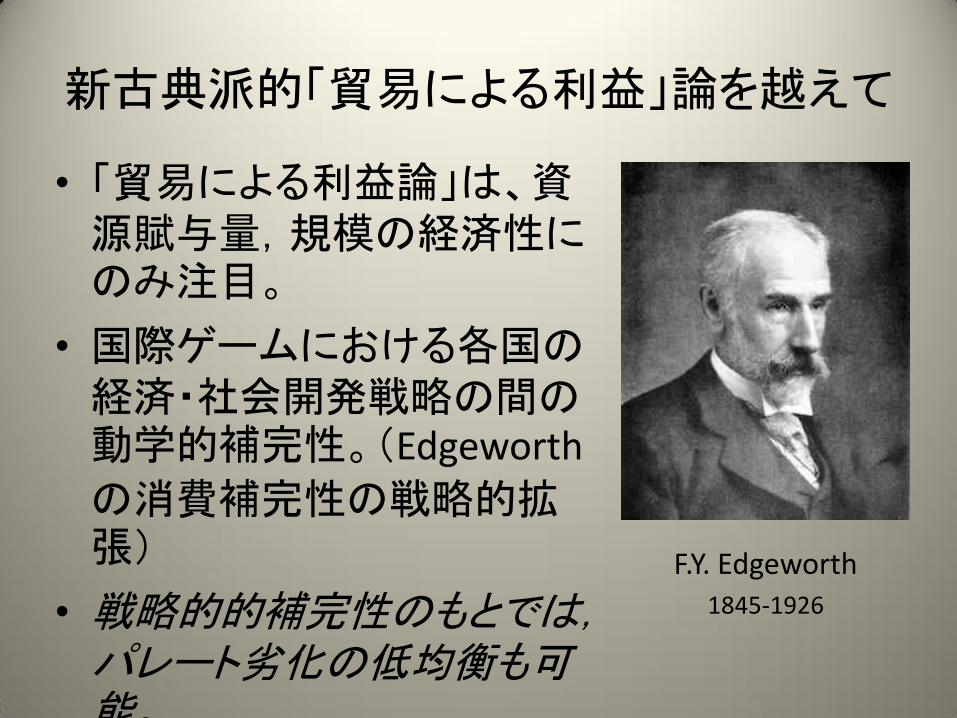
新古典派的「貿易による利益」論を越えて
• 「貿易による利益論」は、資源賦与量,規模の経済性にのみ注目。
• 国際ゲームにおける各国の経済・社会開発戦略の間の動学的補完性。(Edgeworth
の消費補完性の戦略的拡張)
• 戦略的的補完性のもとでは,パレート劣化の低均衡も可能。
F.Y. Edgeworth1845-1926

ゲーム論的戦略的補完性の概念• Between two economies, the (marginal) effectiveness
of developmental strategy of each economy may be enhanced by the pursuit of developmental strategy by the other.
– WC = FC(SC: SA ,SJ, …….), WA = FA(SA: SC ,SJ, …….) WJ = FJ(SJ: SA
,SC, …….) ……
– δ2WC/δSC δSA > 0? Yes, then SC and SA complement.

時期 産業 政治国家 社会規範
日本 I ~ 1950 農村共同体規範
II 1952~1970 もの造り 開発国家(鉄の三角形)
地縁、同窓縁
III 1970~1992 環境,都市経営
多元的・交渉裁定国家
組織規範(終身雇用)
IV 1992~ 自然資源・サービス?
政権交代/連立?
世代間和解?移民?
中国 I ~1976 一党独裁 政治的規範
II 1978~? FDI 開発国家 一人子家族(guanxiとは?)
III ? 工業 交渉裁定国家?
IV

Thank you for listening!
Comments and suggestions are welcome.