Embed Size (px)
Citation preview
8/8/2019 Genting Spore 180810 Nomura
http://slidepdf.com/reader/full/genting-spore-180810-nomura 1/12
18 August 2010Nomura 1
Any authors named on this report are research analysts unless otherwise indicated.See the important disclosures and analyst certifications on pages 9 to 12.
Genting Singapore GENS SP
GAMING, HOTELS & LEISURE | SINGAPORE
Wai Kee Choong +60 3 2027 6893 waikee.choong@n omura.com
Nishit Jalan (Associate)
2Q likely to be peak quarter (II)
A clearer picture emerging
With the two casino operators having reported 2Q10 earnings, the
potential size of the casino market in Singapore is shaping up to be
S$4bn. This is 25% higher than our original estimate of S$3.2bn. But
consensus expectations have gone to S$6bn, which we believe is not
realistic given stringent junket rules. Operators turning cautious on
direct VIP funding would also put a curb on the market, we believe.
Normalised 3Q earnings to fall
Excluding abnormal and highly volatile wins attributed purely to the
luck factor, GENS’ normalised net win per day comes to roughly
S$7mn in 2Q10 — likely down 20% since MBS’ opening. Together
with a rise in potential bad debts, we expect 3Q10F earnings to fall
before stabilising in 4Q10F.
Margins likely to have peaked
The lopsided market share split (currently 67% for GENS) is likely to
attract competition from MBS, and we expect margins to taper off fromthe exceptional levels of 2Q10. Moreover, we see downside risks in
potential bad debt write-offs. GENS chalked up an additional
S$221mn in receivables, bringing the total to S$302mn. Assuming a
credit period of 120 days and S$1bn revenue would imply S$360mn in
receivables. In our FY10-12F estimates, we cut EBITDA by 10% to
account for a potential bad debts write off.
Price target of S$1.01/share
Using the simple average EV/EBITDA multiple of 12x currently
fletched by the Macau operators, we derive a revised price target of
S$1.01/share (previous: S$0.72). Given high expectations, we see thestock as highly sensitive to negative earnings surprises.
Key financials & valuations31 Dec (S$mn) FY09 FY10F FY11F FY12F
Revenue 491 3,173 3,363 3,765
Reported net profit (278) 205 671 809
Normalised net profit (168) 624 615 765
Normalised EPS (S$) (0.017) 0.051 0.051 0.062
Norm. EPS growth (%) na na (1.5) 22.0
Norm. P/E (x) na 30.3 30.7 24.7
EV/EBITDA (x) na 18.2 17.5 14.8
Price/book (x) 3.6 3.8 3.3 3.0
Dividend yield (%) 0.0 0.0 0.0 0.0
ROE (%) (8.1) 4.6 1 2.9 1 3.6
Net debt/equity (%) 24.5 16.5 8.5 net cash
Earnings revisions
Previous norm. net profit 157.4 271.5 381.7
Change from previous (%) 296.5 126.4 100.5
Previous norm. EPS (S$) 0.013 0.022 0.031
Source: Company, Nomura estimates
Share price relative to MSCI Singapore
1m 3m 6m
27.7 53.5 49.0
29.6 57.6 54.4
29.5 52.3 47.1
Hard
Source: Company, Nomura estimates
52-week range (S$)
3-mth avg daily turnover (US$mn)
Stock borrowab ility
Major shareholders (%)
Genting Bhd 51.8
Absolute (S$)
Absolute (US$)
Relative to Index
Estimated free float (%)
Market cap (US$mn) 13,649
48.2
1.58/0.85
98.6
0.7
0.9
1.1
1.3
1.5
1.7
A u g 0 9
S e p 0 9
O c t 0 9
N o v 0 9
D e c 0 9
J a n 1 0
F e b 1 0
M a r 1 0
A p r 1 0
M a y 1 0
J u n 1 0
J u l 1 0
70
90
110
130
150
170
Price
Rel MSCI Singapore(S$)
Closing price on 17 Aug S$1.52
Price target S$1.01(from S$0.72)
Upside/downside -33.5%
Difference from consensus -41.6%
FY11F net profit (S$mn) 671
Difference from consensus -25.5%Source: Nomura
Nomura vs consensus
Consensus seems to have
extrapolated the abnormal and highly
volatile winnings of 2Q10 into its
2H10F and FY11F earnings
estimates.
Maintained
REDUCE
N O M U R A S E C U R I T I E S M A L A Y S I A S D N B H D
Action
Excluding abnormal winnings attributable to the luck factor in 2Q10, GENS’
normalised earnings look set to fall in 3Q10F on lower net wins and bad debts. Withthe Singapore casino market shaping up to be S$4bn in size, together with better
luck, we lift our EBITDA estimates to S$1bn for FY10F and FY11F. Benchmarking
against the Macau operators’ average EV/EBITDA of 12x, we now value GENS at
S$1.01/share. But with consensus expectations rising following the results, we see
significant downside risk to consensus earnings for FY11F. REDUCE reaffirmed.
Catalysts
Expectations of the size of the gaming market in Singapore have gone still higher
post the 2Q results. A fall in normalised earnings in 3Q10 could trigger a selldown.
Anchor themes
Unlike Macau, the Singapore government has no plans to make Singapore a
gambling hub and expectations of the market size should be kept realistic.
8/8/2019 Genting Spore 180810 Nomura
http://slidepdf.com/reader/full/genting-spore-180810-nomura 2/12
Genting Singapore Wai Kee Choong
18 August 2010Nomura 2
Big picture
Clearer picture emergingOn 28 July, Las Vegas Sands (LVS) reported that its newly opened Marina Bay Sands
(MBS) had a net win per day of some S$4mn in its first 65 days of operations, implying
potential revenue of S$364mn for a full quarter. Genting Singapore’s (GENS) Resorts
World at Sentosa (RWS) reported a much stronger net win per day of S$8.2mn on
estimated gaming revenue of S$745mn. Excluding the abnormal and highly volatile
wins attributed purely to luck (commonly known as the luck factor), GENS’ normalised
net win per day comes to roughly S$7mn.
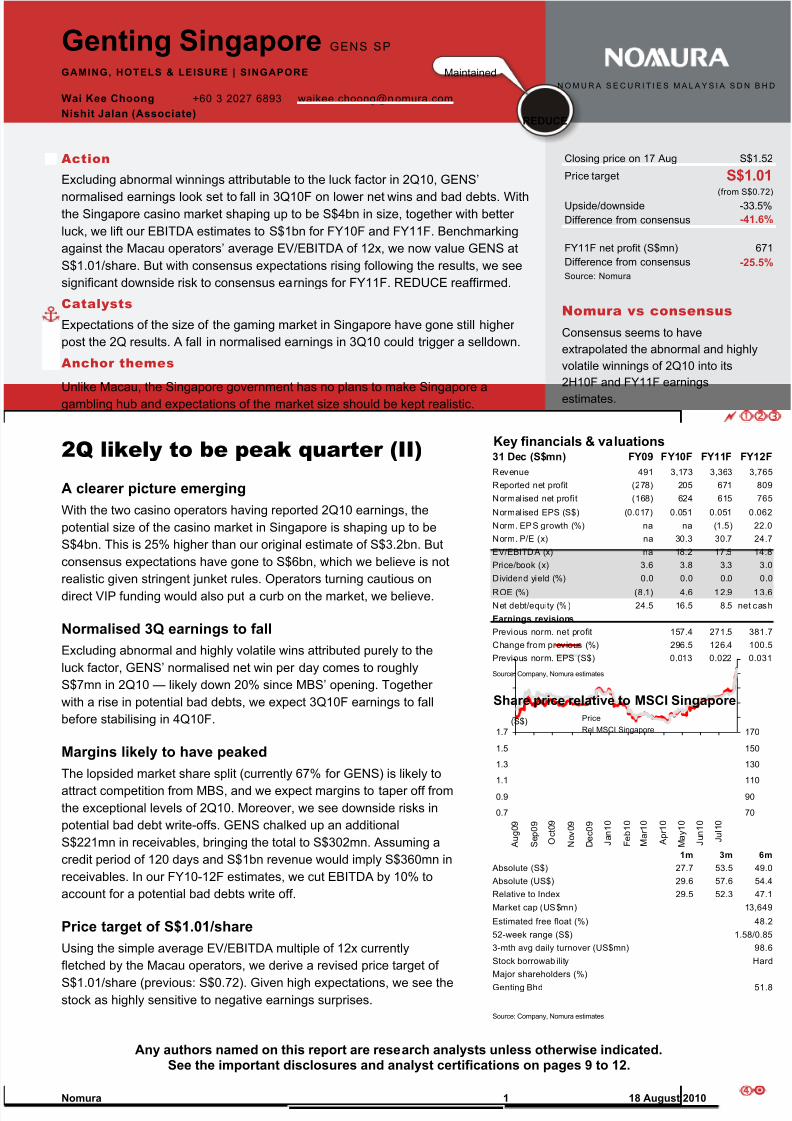
The S$7mn normalised net win per day for GENS is sustainable, in our view. The
effect of MBS’ opening was only felt in May and June, when MBS was facing teething
problems. In our revised assumptions, we assume for 3Q10F and 4Q10F a 20%
decline from the estimated normalised S$7mn net win per day. Based on a net win per
day of S$5.6mn and a 61% market share for GENS, the implied size of the casino
gaming market in Singapore is S$4bn. The market share split once MBS’ operations
pick up momentum is likely to be more evenly divided in 2011F, we believe.
Exhibit 1. Market share split in 2010F
GENS, 61%
MBS, 39%
Source: Company data, Nomura research
Exhibit 2. Market share split in 2011F
GENS, 50%MBS, 50%
Source: Company data, Nomura research
GENS’ remarkable performance in VIP business is unlikely to be repeated, in our view.
In the first place, the surge in VIP business was led by management’s decision to take
on risk by granting credits to players. In 2Q10 alone, receivables rose by about
S$221mn to more than S$300mn. Given the greater risk involved, we believe
management is likely to take a more conservative approach to VIP business. In turn,
we think its share of VIP business should start to taper off from 3Q10F onward.
67% market share for GENS in
2Q10; boosted partly by the luck
factor
S$4bn casino market size
8/8/2019 Genting Spore 180810 Nomura
http://slidepdf.com/reader/full/genting-spore-180810-nomura 3/12
Genting Singapore Wai Kee Choong
18 August 2010Nomura 3
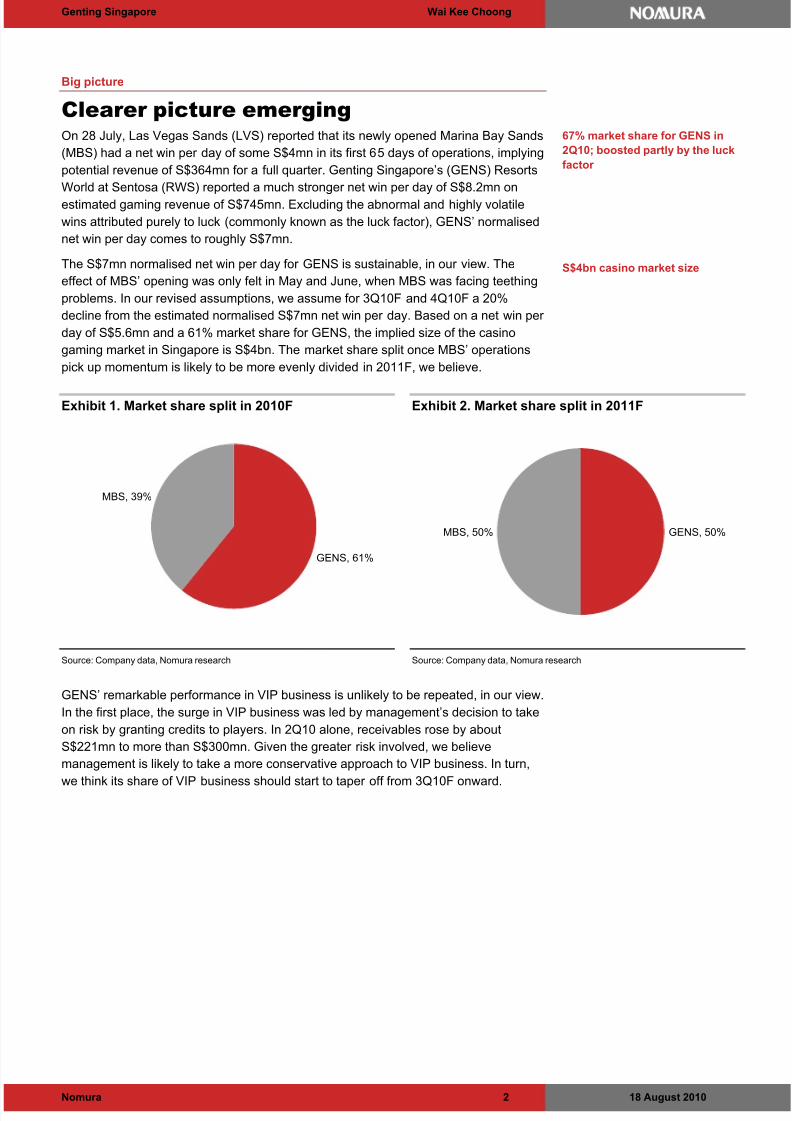
Exhibit 3. Breakdown of Singapore gaming market
Mass
market
tables,
48.9%
VIP, 38.7%
Slots,
12.4%
Note: Based on 2Q revenues; adjusted for luck factor for both MBS and GENS
Source: Company data, Nomura research
Exhibit 4. Market share of GENS and MBS
0%
10%
20%
30%
40%
50%60%
70%
80%
90%
100%
VIP Mass market
tables
Slots Overall
GENS MBS
Note: Based on 2Q revenues; adjusted for luck factor for both MBS and GENS
Source: Company data, Nomura research
Over time, unless junket operations take off in a big way, the large working capitalrequirement and greater risk associated with direct VIP funding are likely to curb the
growth potential of the business, in our opinion. Given the estimated market size of
S$4bn and high EBITDA margins of around 50%, the Singapore government is in no
rush to issue any junket licences to the two operators, in our view. Against this
backdrop, we continue to believe that consensus estimates on the size of the market
remain unrealistically high.
8/8/2019 Genting Spore 180810 Nomura
http://slidepdf.com/reader/full/genting-spore-180810-nomura 4/12
Genting Singapore Wai Kee Choong
18 August 2010Nomura 4
New numbers
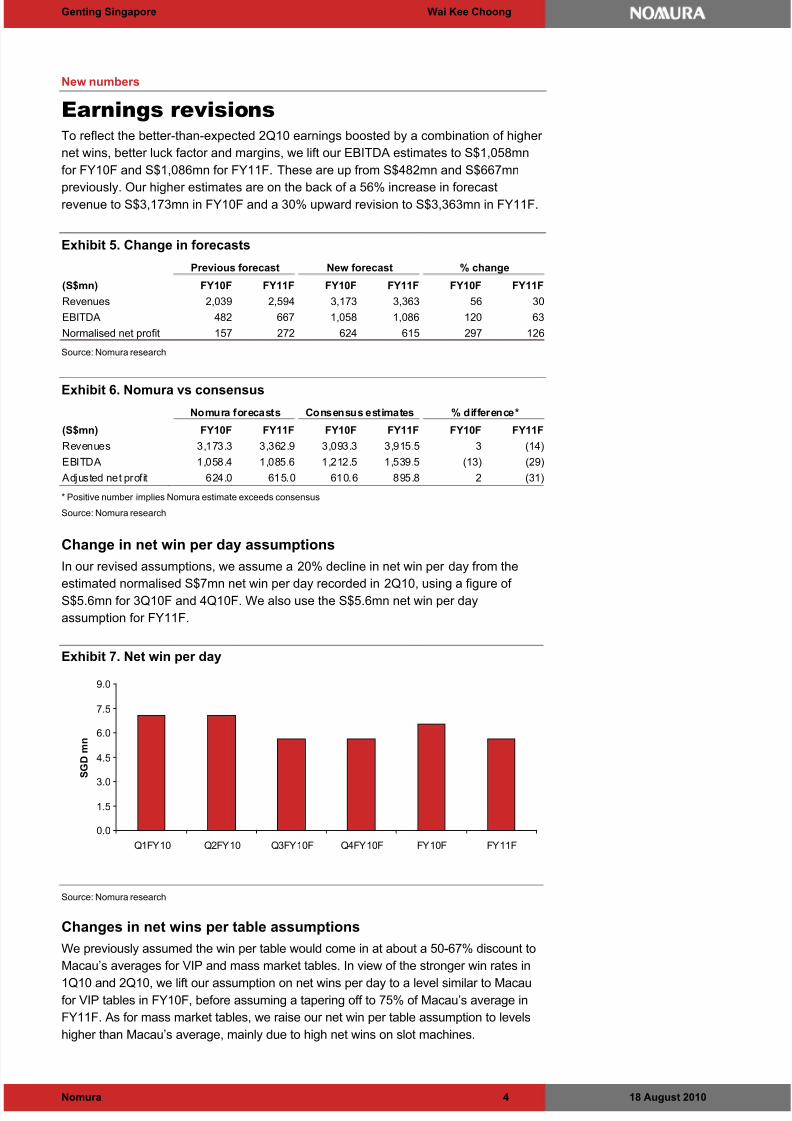
Earnings revisionsTo reflect the better-than-expected 2Q10 earnings boosted by a combination of higher
net wins, better luck factor and margins, we lift our EBITDA estimates to S$1,058mn
for FY10F and S$1,086mn for FY11F. These are up from S$482mn and S$667mn
previously. Our higher estimates are on the back of a 56% increase in forecast
revenue to S$3,173mn in FY10F and a 30% upward revision to S$3,363mn in FY11F.
Exhibit 5. Change in forecasts
Previous forecast New forecast % change
(S$mn) FY10F FY11F FY10F FY11F FY10F FY11F
Revenues 2,039 2,594 3,173 3,363 56 30
EBITDA 482 667 1,058 1,086 120 63
Normalised net profit 157 272 624 615 297 126
Source: Nomura research
Exhibit 6. Nomura vs consensusNomura forecasts Consensus estimates % difference*
(S$mn) FY10F FY11F FY10F FY11F FY10F FY11F
Revenues 3,173.3 3,362.9 3,093.3 3,915.5 3 (14)
EBITDA 1,058.4 1,085.6 1,212.5 1,539.5 (13) (29)
Adjusted net profit 624.0 615.0 610.6 895.8 2 (31)
* Positive number implies Nomura estimate exceeds consensus
Source: Nomura research
Change in net win per day assumptions
In our revised assumptions, we assume a 20% decline in net win per day from the
estimated normalised S$7mn net win per day recorded in 2Q10, using a figure of S$5.6mn for 3Q10F and 4Q10F. We also use the S$5.6mn net win per day
assumption for FY11F.
Exhibit 7. Net win per day
0.0
1.5
3.0
4.5
6.0
7.5
9.0
Q1FY10 Q2FY10 Q3FY10F Q4FY10F FY10F FY11F
S G D m n
Source: Nomura research
Changes in net wins per table assumptions
We previously assumed the win per table would come in at about a 50-67% discount to
Macau’s averages for VIP and mass market tables. In view of the stronger win rates in
1Q10 and 2Q10, we lift our assumption on net wins per day to a level similar to Macaufor VIP tables in FY10F, before assuming a tapering off to 75% of Macau’s average in
FY11F. As for mass market tables, we raise our net win per table assumption to levels
higher than Macau’s average, mainly due to high net wins on slot machines.
8/8/2019 Genting Spore 180810 Nomura
http://slidepdf.com/reader/full/genting-spore-180810-nomura 5/12
Genting Singapore Wai Kee Choong
18 August 2010Nomura 5
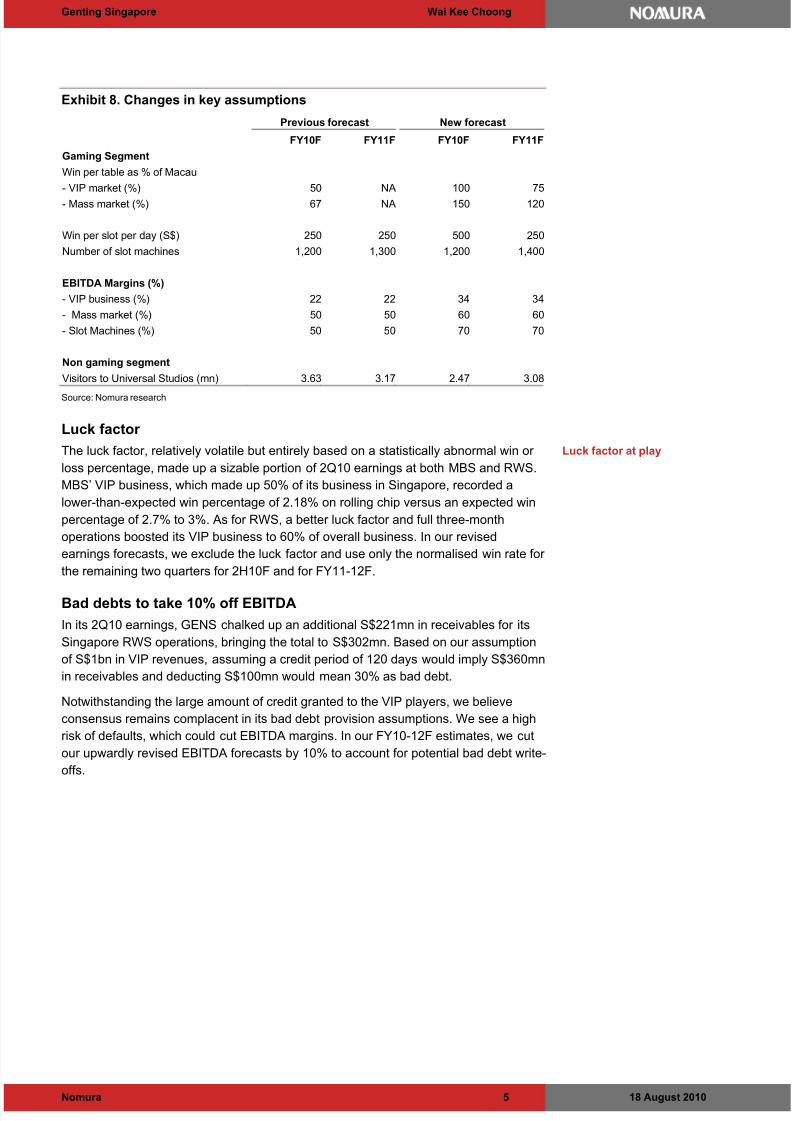
Exhibit 8. Changes in key assumptions
Previous forecast New forecast
FY10F FY11F FY10F FY11F
Gaming Segment
Win per table as % of Macau
- VIP market (%) 50 NA 100 75
- Mass market (%) 67 NA 150 120
Win per slot per day (S$) 250 250 500 250
Number of slot machines 1,200 1,300 1,200 1,400
EBITDA Margins (%)
- VIP business (%) 22 22 34 34
- Mass market (%) 50 50 60 60
- Slot Machines (%) 50 50 70 70
Non gaming segment
Visitors to Universal Studios (mn) 3.63 3.17 2.47 3.08
Source: Nomura research
Luck factor
The luck factor, relatively volatile but entirely based on a statistically abnormal win or
loss percentage, made up a sizable portion of 2Q10 earnings at both MBS and RWS.
MBS’ VIP business, which made up 50% of its business in Singapore, recorded a
lower-than-expected win percentage of 2.18% on rolling chip versus an expected win
percentage of 2.7% to 3%. As for RWS, a better luck factor and full three-month
operations boosted its VIP business to 60% of overall business. In our revised
earnings forecasts, we exclude the luck factor and use only the normalised win rate for
the remaining two quarters for 2H10F and for FY11-12F.
Bad debts to take 10% off EBITDA
In its 2Q10 earnings, GENS chalked up an additional S$221mn in receivables for its
Singapore RWS operations, bringing the total to S$302mn. Based on our assumption
of S$1bn in VIP revenues, assuming a credit period of 120 days would imply S$360mn
in receivables and deducting S$100mn would mean 30% as bad debt.
Notwithstanding the large amount of credit granted to the VIP players, we believe
consensus remains complacent in its bad debt provision assumptions. We see a high
risk of defaults, which could cut EBITDA margins. In our FY10-12F estimates, we cut
our upwardly revised EBITDA forecasts by 10% to account for potential bad debt write-
offs.
Luck factor at play
8/8/2019 Genting Spore 180810 Nomura
http://slidepdf.com/reader/full/genting-spore-180810-nomura 6/12
Genting Singapore Wai Kee Choong
18 August 2010Nomura 6
Valuation
Change in valuation methodology and
price target
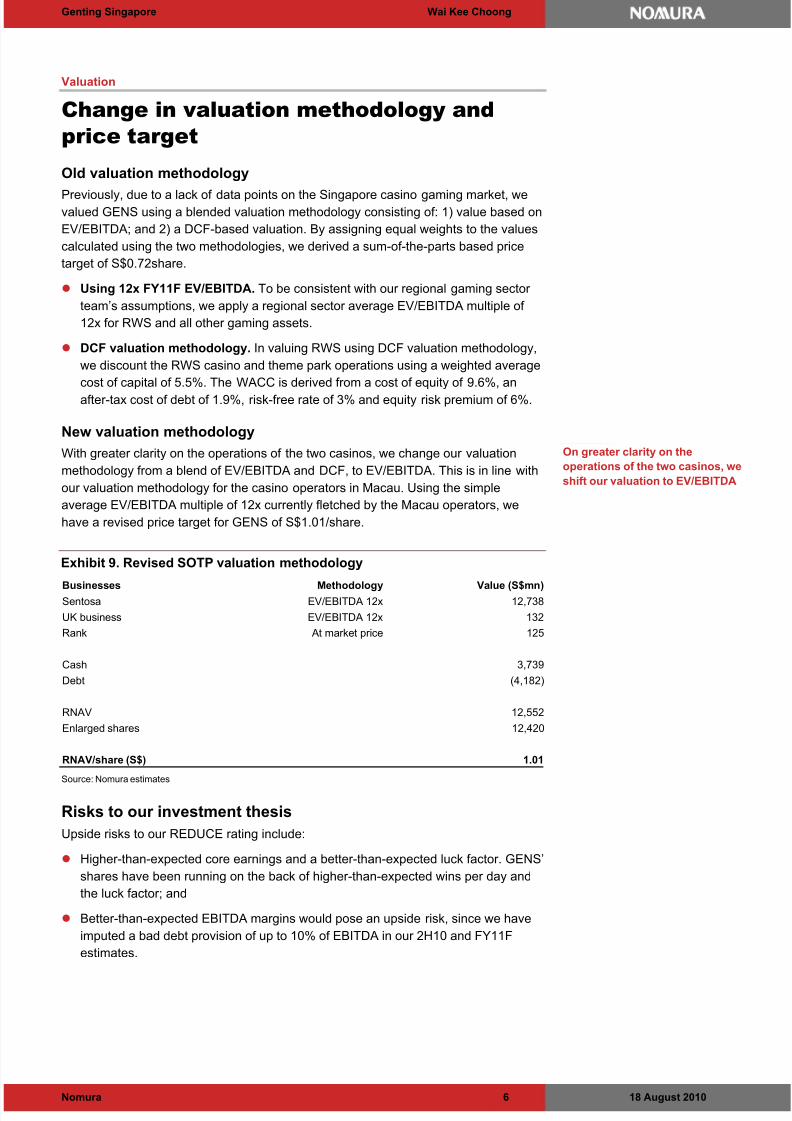
Old valuation methodology
Previously, due to a lack of data points on the Singapore casino gaming market, wevalued GENS using a blended valuation methodology consisting of: 1) value based on
EV/EBITDA; and 2) a DCF-based valuation. By assigning equal weights to the values
calculated using the two methodologies, we derived a sum-of-the-parts based price
target of S$0.72share.
Using 12x FY11F EV/EBITDA. To be consistent with our regional gaming sector
team’s assumptions, we apply a regional sector average EV/EBITDA multiple of
12x for RWS and all other gaming assets.
DCF valuation methodology. In valuing RWS using DCF valuation methodology,
we discount the RWS casino and theme park operations using a weighted average
cost of capital of 5.5%. The WACC is derived from a cost of equity of 9.6%, an
after-tax cost of debt of 1.9%, risk-free rate of 3% and equity risk premium of 6%.
New valuation methodology
With greater clarity on the operations of the two casinos, we change our valuation
methodology from a blend of EV/EBITDA and DCF, to EV/EBITDA. This is in line with
our valuation methodology for the casino operators in Macau. Using the simple
average EV/EBITDA multiple of 12x currently fletched by the Macau operators, we
have a revised price target for GENS of S$1.01/share.
Exhibit 9. Revised SOTP valuation methodology
Businesses Methodology Value (S$mn)Sentosa EV/EBITDA 12x 12,738
UK business EV/EBITDA 12x 132
Rank At market price 125
Cash 3,739
Debt (4,182)
RNAV 12,552
Enlarged shares 12,420
RNAV/share (S$) 1.01
Source: Nomura estimates
Risks to our investment thesis
Upside risks to our REDUCE rating include:
Higher-than-expected core earnings and a better-than-expected luck factor. GENS’
shares have been running on the back of higher-than-expected wins per day and
the luck factor; and
Better-than-expected EBITDA margins would pose an upside risk, since we have
imputed a bad debt provision of up to 10% of EBITDA in our 2H10 and FY11F
estimates.
On greater clarity on the
operations of the two casinos, we
shift our valuation to EV/EBITDA
8/8/2019 Genting Spore 180810 Nomura
http://slidepdf.com/reader/full/genting-spore-180810-nomura 7/12
Genting Singapore Wai Kee Choong
18 August 2010Nomura 7
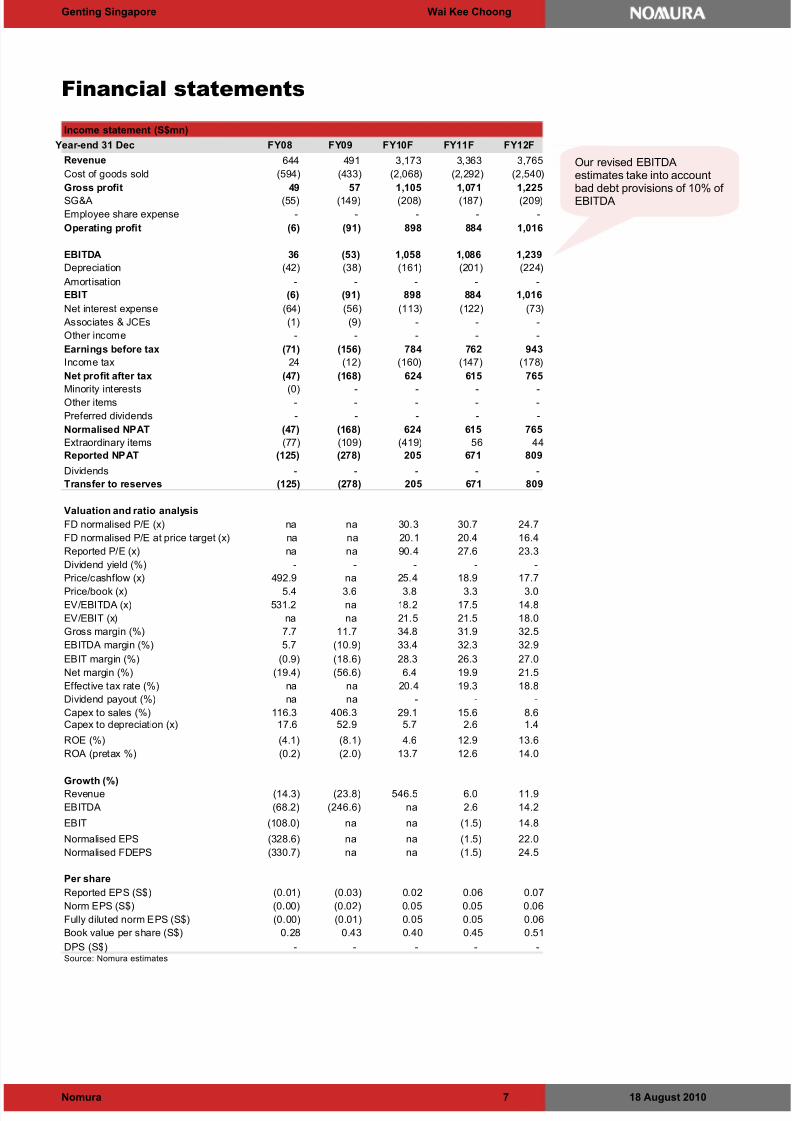
Financial statements
Income statement (S$mn)
Year-end 31 Dec FY08 FY09 FY10F FY11F FY12F
Revenue 644 491 3,173 3,363 3,765
Cost of goods sold (594) (433) (2,068) (2,292) (2,540)
Gross profit 49 57 1,105 1,071 1,225
SG&A (55) (149) (208) (187) (209)
Employee share expense - - - - -
Operating profit (6) (91) 898 884 1,016
EBITDA 36 (53) 1,058 1,086 1,239
Depreciation (42) (38) (161) (201) (224)
Amortisation - - - - -
EBIT (6) (91) 898 884 1,016
Net interest expense (64) (56) (113) (122) (73)
Associates & JCEs (1) (9) - - -
Other income - - - - -
Earnings before tax (71) (156) 784 762 943
Income tax 24 (12) (160) (147) (178)
Net profit after tax (47) (168) 624 615 765
Minority interests (0) - - - -Other items - - - - -
Preferred dividends - - - - -
Normalised NPAT (47) (168) 624 615 765
Extraordinary items (77) (109) (419) 56 44
Reported NPAT (125) (278) 205 671 809
Dividends - - - - -
Transfer to reserves (125) (278) 205 671 809
Valuation and ratio analysis
FD normalised P/E (x) na na 30.3 30.7 24.7
FD normalised P/E at price target (x) na na 20.1 20.4 16.4
Reported P/E (x) na na 90.4 27.6 23.3
Dividend yield (%) - - - - -
Price/cashflow (x) 492.9 na 25.4 18.9 17.7
Price/book (x) 5.4 3.6 3.8 3.3 3.0 EV/EBITDA (x) 531.2 na 18.2 17.5 14.8
EV/EBIT (x) na na 21.5 21.5 18.0
Gross margin (%) 7.7 11.7 34.8 31.9 32.5
EBITDA margin (%) 5.7 (10.9) 33.4 32.3 32.9
EBIT margin (%) (0.9) (18.6) 28.3 26.3 27.0
Net margin (%) (19.4) (56.6) 6.4 19.9 21.5
Effective tax rate (%) na na 20.4 19.3 18.8
Dividend payout (%) na na - - -
Capex to sales (%) 116.3 406.3 29.1 15.6 8.6 Capex to depreciation (x) 17.6 52.9 5.7 2.6 1.4
ROE (%) (4.1) (8.1) 4.6 12.9 13.6
ROA (pretax %) (0.2) (2.0) 13.7 12.6 14.0
Growth (%)Revenue (14.3) (23.8) 546.5 6.0 11.9
EBITDA (68.2) (246.6) na 2.6 14.2
EBIT (108.0) na na (1.5) 14.8
Normalised EPS (328.6) na na (1.5) 22.0
Normalised FDEPS (330.7) na na (1.5) 24.5
Per share
Reported EPS (S$) (0.01) (0.03) 0.02 0.06 0.07
Norm EPS (S$) (0.00) (0.02) 0.05 0.05 0.06
Fully diluted norm EPS (S$) (0.00) (0.01) 0.05 0.05 0.06
Book value per share (S$) 0.28 0.43 0.40 0.45 0.51
DPS (S$) - - - - -Source: Nomura estimates
Our revised EBITDAestimates take into accountbad debt provisions of 10% of EBITDA
8/8/2019 Genting Spore 180810 Nomura
http://slidepdf.com/reader/full/genting-spore-180810-nomura 8/12
Genting Singapore Wai Kee Choong
18 August 2010Nomura 8
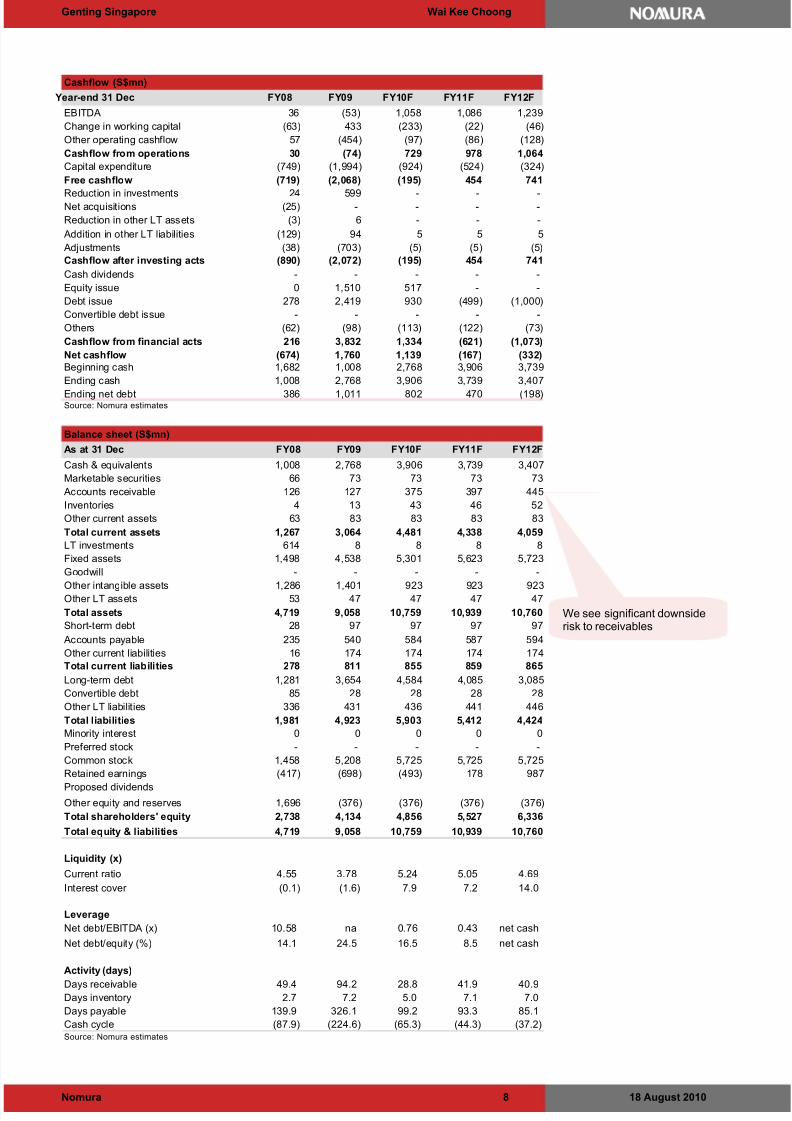
Cashflow (S$mn)
Year-end 31 Dec FY08 FY09 FY10F FY11F FY12F
EBITDA 36 (53) 1,058 1,086 1,239
Change in working capital (63) 433 (233) (22) (46)
Other operating cashflow 57 (454) (97) (86) (128)
Cashflow from operations 30 (74) 729 978 1,064
Capital expenditure (749) (1,994) (924) (524) (324)
Free cashflow (719) (2,068) (195) 454 741
Reduction in investments 24 599 - - -Net acquisitions (25) - - - -
Reduction in other LT assets (3) 6 - - -
Addition in other LT liabilities (129) 94 5 5 5
Adjustments (38) (703) (5) (5) (5)
Cashflow after investing acts (890) (2,072) (195) 454 741
Cash dividends - - - - -
Equity issue 0 1,510 517 - -
Debt issue 278 2,419 930 (499) (1,000)
Convertible debt issue - - - - -
Others (62) (98) (113) (122) (73)
Cashflow from financial acts 216 3,832 1,334 (621) (1,073)
Net cashflow (674) 1,760 1,139 (167) (332)Beginning cash 1,682 1,008 2,768 3,906 3,739
Ending cash 1,008 2,768 3,906 3,739 3,407
Ending net debt 386 1,011 802 470 (198)Source: Nomura estimates
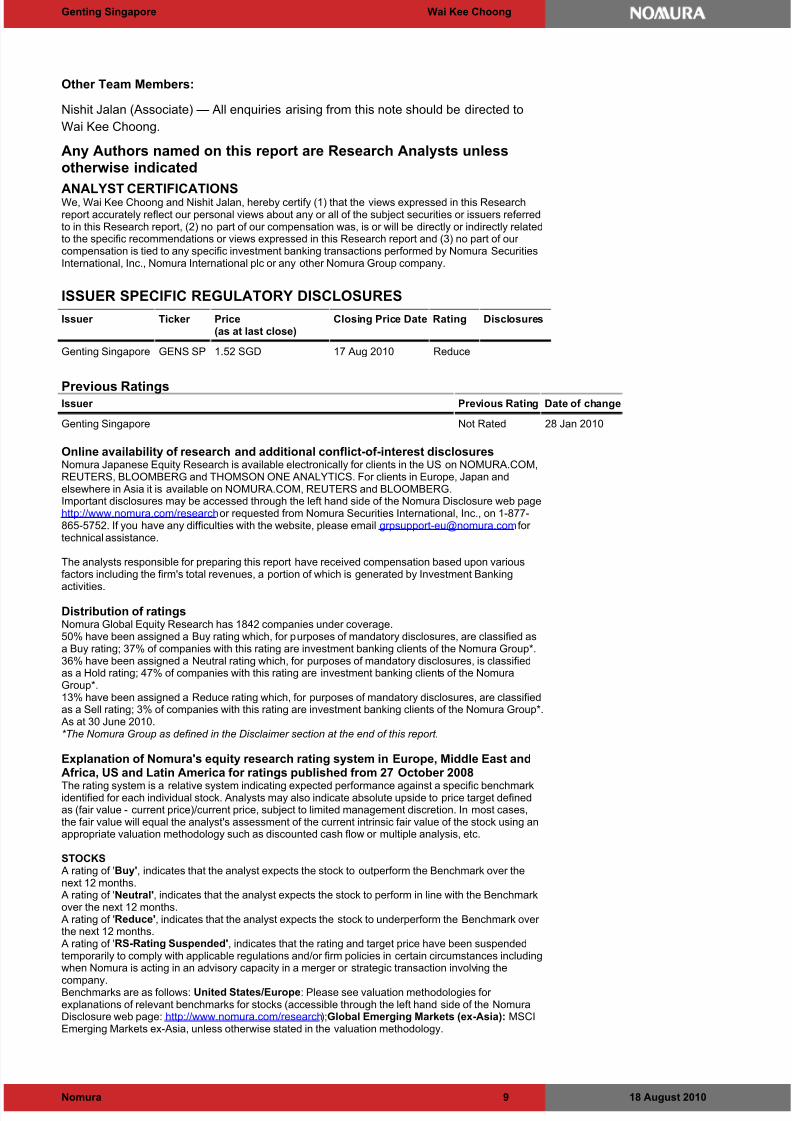
Balance sheet (S$mn)
As at 31 Dec FY08 FY09 FY10F FY11F FY12F
Cash & equivalents 1,008 2,768 3,906 3,739 3,407
Marketable securities 66 73 73 73 73
Accounts receivable 126 127 375 397 445
Inventories 4 13 43 46 52
Other current assets 63 83 83 83 83
Total current assets 1,267 3,064 4,481 4,338 4,059
LT investments 614 8 8 8 8
Fixed assets 1,498 4,538 5,301 5,623 5,723
Goodwill - - - - -
Other intangible assets 1,286 1,401 923 923 923Other LT assets 53 47 47 47 47
Total assets 4,719 9,058 10,759 10,939 10,760
Short-term debt 28 97 97 97 97
Accounts payable 235 540 584 587 594
Other current liabilities 16 174 174 174 174
Total current liabilities 278 811 855 859 865
Long-term debt 1,281 3,654 4,584 4,085 3,085
Convertible debt 85 28 28 28 28
Other LT liabilities 336 431 436 441 446
Total liabilities 1,981 4,923 5,903 5,412 4,424
Minority interest 0 0 0 0 0
Preferred stock - - - - -
Common stock 1,458 5,208 5,725 5,725 5,725
Retained earnings (417) (698) (493) 178 987
Proposed dividendsOther equity and reserves 1,696 (376) (376) (376) (376)
Total shareholders' equity 2,738 4,134 4,856 5,527 6,336
Total equity & liabilities 4,719 9,058 10,759 10,939 10,760
Liquidity (x)
Current ratio 4.55 3.78 5.24 5.05 4.69
Interest cover (0.1) (1.6) 7.9 7.2 14.0
Leverage
Net debt/EBITDA (x) 10.58 na 0.76 0.43 net cash
Net debt/equity (%) 14.1 24.5 16.5 8.5 net cash
Activity (days)
Days receivable 49.4 94.2 28.8 41.9 40.9 Days inventory 2.7 7.2 5.0 7.1 7.0
Days payable 139.9 326.1 99.2 93.3 85.1
Cash cycle (87.9) (224.6) (65.3) (44.3) (37.2) Source: Nomura estimates
We see significant downsiderisk to receivables
8/8/2019 Genting Spore 180810 Nomura
http://slidepdf.com/reader/full/genting-spore-180810-nomura 9/12
Genting Singapore Wai Kee Choong
18 August 2010Nomura 9
Other Team Members:
Nishit Jalan (Associate) — All enquiries arising from this note should be directed to
Wai Kee Choong.
Any Authors named on this report are Research Analysts unlessotherwise indicated
ANALYST CERTIFICATIONSWe, Wai Kee Choong and Nishit Jalan, hereby certify (1) that the views expressed in this Researchreport accurately reflect our personal views about any or all of the subject securities or issuers referredto in this Research report, (2) no part of our compensation was, is or will be directly or indirectly relatedto the specific recommendations or views expressed in this Research report and (3) no part of our compensation is tied to any specific investment banking transactions performed by Nomura SecuritiesInternational, Inc., Nomura International plc or any other Nomura Group company.
ISSUER SPECIFIC REGULATORY DISCLOSURES
Issuer Ticker Price(as at last close)
Closing Price Date Rating Disclosures
Genting Singapore GENS SP 1.52 SGD 17 Aug 2010 Reduce
Previous RatingsIssuer Previous Rating Date of change
Genting Singapore Not Rated 28 Jan 2010
Online availability of research and additional conflict-of-interest disclosures Nomura Japanese Equity Research is available electronically for clients in the US on NOMURA.COM,REUTERS, BLOOMBERG and THOMSON ONE ANALYTICS. For clients in Europe, Japan andelsewhere in Asia it is available on NOMURA.COM, REUTERS and BLOOMBERG. Important disclosures may be accessed through the left hand side of the Nomura Disclosure web pagehttp://www.nomura.com/research or requested from Nomura Securities International, Inc., on 1-877-865-5752. If you have any difficulties with the website, please email [email protected] for technical assistance. The analysts responsible for preparing this report have received compensation based upon variousfactors including the firm's total revenues, a portion of which is generated by Investment Banking
activities. Distribution of ratings Nomura Global Equity Research has 1842 companies under coverage. 50% have been assigned a Buy rating which, for purposes of mandatory disclosures, are classified asa Buy rating; 37% of companies with this rating are investment banking clients of the Nomura Group*. 36% have been assigned a Neutral rating which, for purposes of mandatory disclosures, is classifiedas a Hold rating; 47% of companies with this rating are investment banking clients of the NomuraGroup*.13% have been assigned a Reduce rating which, for purposes of mandatory disclosures, are classifiedas a Sell rating; 3% of companies with this rating are investment banking clients of the Nomura Group*. As at 30 June 2010. *The Nomura Group as defined in the Disclaimer section at the end of this report. Explanation of Nomura's equity research rating system in Europe, Middle East andAfrica, US and Latin America for ratings published from 27 October 2008 The rating system is a relative system indicating expected performance against a specific benchmarkidentified for each individual stock. Analysts may also indicate absolute upside to price target definedas (fair value - current price)/current price, subject to limited management discretion. In most cases,the fair value will equal the analyst's assessment of the current intrinsic fair value of the stock using anappropriate valuation methodology such as discounted cash flow or multiple analysis, etc. STOCKS A rating of 'Buy', indicates that the analyst expects the stock to outperform the Benchmark over thenext 12 months. A rating of 'Neutral', indicates that the analyst expects the stock to perform in line with the Benchmarkover the next 12 months. A rating of 'Reduce', indicates that the analyst expects the stock to underperform the Benchmark over the next 12 months. A rating of 'RS-Rating Suspended', indicates that the rating and target price have been suspendedtemporarily to comply with applicable regulations and/or firm policies in certain circumstances includingwhen Nomura is acting in an advisory capacity in a merger or strategic transaction involving the
company. Benchmarks are as follows: United States/Europe: Please see valuation methodologies for explanations of relevant benchmarks for stocks (accessible through the left hand side of the NomuraDisclosure web page: http://www.nomura.com/research);Global Emerging Markets (ex-Asia): MSCIEmerging Markets ex-Asia, unless otherwise stated in the valuation methodology.
8/8/2019 Genting Spore 180810 Nomura
http://slidepdf.com/reader/full/genting-spore-180810-nomura 10/12
Genting Singapore Wai Kee Choong
18 August 2010Nomura 10
SECTORS A 'Bullish' stance, indicates that the analyst expects the sector to outperform the Benchmark duringthe next 12 months. A 'Neutral' stance, indicates that the analyst expects the sector to perform in line with the Benchmarkduring the next 12 months. A 'Bearish' stance, indicates that the analyst expects the sector to underperform the Benchmarkduring the next 12 months. Benchmarks are as follows: United States: S&P 500; Europe: Dow Jones STOXX 600®; GlobalEmerging Markets (ex-Asia): MSCI Emerging Markets ex-Asia. Explanation of Nomura's equity research rating system for Asian companies under coverage ex Japan published from 30 October 2008 and in Japan from 6 January2009 STOCKS Stock recommendations are based on absolute valuation upside (downside), which is defined as (PriceTarget - Current Price) / Current Price, subject to limited management discretion. In most cases, thePrice Target will equal the analyst's 12-month intrinsic valuation of the stock, based on an appropriatevaluation methodology such as discounted cash flow, multiple analysis, etc. A 'Buy' recommendation indicates that potential upside is 15% or more. A 'Neutral' recommendation indicates that potential upside is less than 15% or downside is less than5%. A 'Reduce' recommendation indicates that potential downside is 5% or more. A rating of 'RS' or 'Rating Suspended' indicates that the rating and target price have been suspendedtemporarily to comply with applicable regulations and/or firm policies in certain circumstances includingwhen Nomura is acting in an advisory capacity in a merger or strategic transaction involving the subject
company. Stocks labelled as 'Not rated' or shown as 'No rating' are not in Nomura's regular research coverage. SECTORS A 'Bullish' rating means most stocks in the sector have (or the weighted average recommendation of the stocks under coverage is) a positive absolute recommendation. A 'Neutral' rating means most stocks in the sector have (or the weighted average recommendation of the stocks under coverage is) a neutral absolute recommendation. A 'Bearish' rating means most stocks in the sector have (or the weighted average recommendation of the stocks under coverage is) a negative absolute recommendation.
Explanation of Nomura's equity research rating system in Japan published prior to 6January 2009 (and ratings in Europe, Middle East and Africa, US and Latin Americapublished prior to 27 October 2008) STOCKS A rating of '1' or 'Strong buy', indicates that the analyst expects the stock to outperform theBenchmark by 15% or more over the next six months. A rating of '2' or 'Buy', indicates that the analyst expects the stock to outperform the Benchmark by 5%or more but less than 15% over the next six months. A rating of '3' or 'Neutral', indicates that the analyst expects the stock to either outperform or underperform the Benchmark by less than 5% over the next six months. A rating of '4' or 'Reduce', indicates that the analyst expects the stock to underperform the Benchmarkby 5% or more but less than 15% over the next six months. A rating of '5' or 'Sell', indicates that the analyst expects the stock to underperform the Benchmark by15% or more over the next six months. Stocks labeled 'Not rated' or shown as 'No rating' are not in Nomura's regular research coverage.Nomura might not publish additional research reports concerning this company, and it undertakes noobligation to update the analysis, estimates, projections, conclusions or other information containedherein. SECTORS A 'Bullish' stance, indicates that the analyst expects the sector to outperform the Benchmark duringthe next six months. A 'Neutral' stance, indicates that the analyst expects the sector to perform in line with the Benchmarkduring the next six months. A 'Bearish' stance, indicates that the analyst expects the sector to underperform the Benchmarkduring the next six months. Benchmarks are as follows: Japan: TOPIX; United States: S&P 500, MSCI World TechnologyHardware & Equipment; Europe, by sector - Hardware/Semiconductors: FTSE W Europe IT Hardware;Telecoms: FTSE W Europe Business Services; Business Services: FTSE W Europe; Auto &Components: FTSE W Europe Auto & Parts; Communications equipment : FTSE W Europe ITHardware; Ecology Focus: Bloomberg World Energy Alternate Sources; Global Emerging Markets:MSCI Emerging Markets ex-Asia. Explanation of Nomura's equity research rating system for Asian companies under coverage ex Japan published prior to 30 October 2008 STOCKS Stock recommendations are based on absolute valuation upside (downside), which is defined as (Fair Value - Current Price)/Current Price, subject to limited management discretion. In most cases, the Fair Value will equal the analyst's assessment of the current intrinsic fair value of the stock using anappropriate valuation methodology such as Discounted Cash Flow or Multiple analysis etc. However, if the analyst doesn't think the market will revalue the stock over the specified time horizon due to a lack
8/8/2019 Genting Spore 180810 Nomura
http://slidepdf.com/reader/full/genting-spore-180810-nomura 11/12
Genting Singapore Wai Kee Choong
18 August 2010Nomura 11
of events or catalysts, then the fair value may differ from the intrinsic fair value. In most cases,therefore, our recommendation is an assessment of the difference between current market price andour estimate of current intrinsic fair value. Recommendations are set with a 6-12 month horizon unlessspecified otherwise. Accordingly, within this horizon, price volatility may cause the actual upside or downside based on the prevailing market price to differ from the upside or downside implied by therecommendation. A 'Strong buy' recommendation indicates that upside is more than 20%. A 'Buy' recommendation indicates that upside is between 10% and 20%. A 'Neutral' recommendation indicates that upside or downside is less than 10%. A 'Reduce' recommendation indicates that downside is between 10% and 20%. A 'Sell' recommendation indicates that downside is more than 20%. SECTORS A 'Bullish' rating means most stocks in the sector have (or the weighted average recommendation of the stocks under coverage is) a positive absolute recommendation. A 'Neutral' rating means most stocks in the sector have (or the weighted average recommendation of the stocks under coverage is) a neutral absolute recommendation. A 'Bearish' rating means most stocks in the sector have (or the weighted average recommendation of the stocks under coverage is) a negative absolute recommendation. Price targets Price targets, if discussed, reflect in part the analyst's estimates for the company's earnings. Theachievement of any price target may be impeded by general market and macroeconomic trends, andby other risks related to the company or the market, and may not occur if the company's earnings differ from estimates.
DISCLAIMERS This publication contains material that has been prepared by the Nomura entity identified on the banner at the top or the bottom of page 1 herein and, if applicable, with the contributions of one or moreNomura entities whose employees and their respective affiliations are specified on page 1 herein or elsewhere identified in the publication. Affiliates and subsidiaries of Nomura Holdings, Inc. (collectively,the 'Nomura Group'), include: Nomura Securities Co., Ltd. ('NSC') Tokyo, Japan; Nomura Internationalplc, United Kingdom; Nomura Securities International, Inc. ('NSI'), New York, NY; Nomura International(Hong Kong) Ltd., Hong Kong; Nomura Financial Investment (Korea) Co., Ltd., Korea; NomuraSingapore Ltd., Singapore (Registration number 197201440E, regulated by the Monetary Authority of Singapore); Nomura Australia Ltd., Australia (ABN 48 003 032 513), regulated by the AustralianSecurities and Investment Commission and holder of an Australian financial services licence number 246412; P.T. Nomura Indonesia, Indonesia; Nomura Securities Malaysia Sdn. Bhd., Malaysia; NomuraInternational (Hong Kong) Ltd., Taipei Branch, Taiwan; Nomura Financial Advisory and Securities(India) Private Limited, Mumbai, India (Registered Address: Ceejay House, Level 11, Plot F, Shivsagar Estate, Dr. Annie Besant Road, Worli, Mumbai- 400 018, India; SEBI Registration No: BSE
INB011299030, NSE INB231299034, INF231299034, INE 231299034).
This material is: (i) for your private information, and we are not soliciting any action based upon it; (ii)not to be construed as an offer to sell or a solicitation of an offer to buy any security in any jurisdictionwhere such offer or solicitation would be illegal; and (iii) based upon information that we consider reliable. NOMURA GROUP DOES NOT WARRANT OR REPRESENT THAT THE PUBLICATION ISACCURATE, COMPLETE, RELIABLE, FIT FOR ANY PARTICULAR PURPOSE ORMERCHANTABLE AND DOES NOT ACCEPT LIABILITY FOR ANY ACT (OR DECISION NOT TOACT) RESULTING FROM USE OF THIS PUBLICATION AND RELATED DATA. TO THE MAXIMUMEXTENT PERMISSIBLE ALL WARRANTIES AND OTHER ASSURANCES BY NOMURA GROUPARE HEREBY EXCLUDED AND NOMURA GROUP SHALL HAVE NO LIABILITY FOR THE USE,MISUSE, OR DISTRIBUTION OF THIS INFORMATION. Opinions expressed are current opinions as of the original publication date appearing on this materialonly and the information, including the opinions contained herein, are subject to change without notice.Nomura is under no duty to update this publication. If and as applicable, NSI's investment bankingrelationships, investment banking and non-investment banking compensation and securities ownership(identified in this report as 'Disclosures Required in the United States'), if any, are specified indisclaimers and related disclosures in this report. In addition, other members of the Nomura Group mayfrom time to time perform investment banking or other services (including acting as advisor, manager or lender) for, or solicit investment banking or other business from, companies mentioned herein.Further, the Nomura Group, and/or its officers, directors and employees, including persons, withoutlimitation, involved in the preparation or issuance of this material may, to the extent permitted byapplicable law and/or regulation, have long or short positions in, and buy or sell, the securities(including ownership by NSI, referenced above), or derivatives (including options) thereof, of companies mentioned herein, or related securities or derivatives. In addition, the Nomura Group,excluding NSI, may act as a market maker and principal, willing to buy and sell certain of the securitiesof companies mentioned herein. Further, the Nomura Group may buy and sell certain of the securitiesof companies mentioned herein, as agent for its clients. Investors should consider this report as only a single factor in making their investment decision and, assuch, the report should not be viewed as identifying or suggesting all risks, direct or indirect, that maybe associated with any investment decision. Please see the further disclaimers in the disclosureinformation on companies covered by Nomura analysts available at www.nomura.com/research under the 'Disclosure' tab. Nomura Group produces a number of different types of research product including,amongst others, fundamental analysis, quantitative analysis and short term trading ideas;
recommendations contained in one type of research product may differ from recommendationscontained in other types of research product, whether as a result of differing time horizons,methodologies or otherwise; it is possible that individual employees of Nomura may have differentperspectives to this publication.
8/8/2019 Genting Spore 180810 Nomura
http://slidepdf.com/reader/full/genting-spore-180810-nomura 12/12
Genting Singapore Wai Kee Choong
NSC and other non-US members of the Nomura Group (ie excluding NSI), their officers, directors andemployees may, to the extent it relates to non-US issuers and is permitted by applicable law, haveacted upon or used this material prior to, or immediately following, its publication. Foreign currency-denominated securities are subject to fluctuations in exchange rates that could havean adverse effect on the value or price of, or income derived from, the investment. In addition,investors in securities such as ADRs, the values of which are influenced by foreign currencies,effectively assume currency risk. The securities described herein may not have been registered under the US Securities Act of 1933,and, in such case, may not be offered or sold in the United States or to US persons unless they havebeen registered under such Act, or except in compliance with an exemption from the registrationrequirements of such Act. Unless governing law permits otherwise, you must contact a Nomura entityin your home jurisdiction if you want to use our services in effecting a transaction in the securitiesmentioned in this material. This publication has been approved for distribution in the United Kingdom and European Union asinvestment research by Nomura International plc ('NIPlc'), which is authorised and regulated by the UKFinancial Services Authority ('FSA') and is a member of the London Stock Exchange. It does notconstitute a personal recommendation, as defined by the FSA, or take into account the particular investment objectives, financial situations, or needs of individual investors. It is intended only for investors who are 'eligible counterparties' or 'professional clients' as defined by the FSA, and may not,therefore, be redistributed to retail clients as defined by the FSA. This publication may be distributed inGermany via Nomura Bank (Deutschland) GmbH, which is authorised and regulated in Germany by theFederal Financial Supervisory Authority ('BaFin'). This publication has been approved by NomuraInternational (Hong Kong) Ltd. ("NIHK"), which is regulated by the Hong Kong Securities and FuturesCommission, for distribution in Hong Kong by NIHK. This publication has been approved for distributionin Australia by Nomura Australia Ltd, which is authorised and regulated in Australia by the AustralianSecurities and Investment Commission ('ASIC'). This publication has also been approved for distribution in Malaysia by Nomura Securities Malaysia Sdn Bhd. In Singapore, this publication hasbeen distributed by Nomura Singapore Limited ('NSL'). NSL accepts legal responsibility for the contentof this publication, where it concerns securities, futures and foreign exchange, issued by its foreignaffiliate in respect of recipients who are not accredited, expert or institutional investors as defined bythe Securities and Futures Act (Chapter 289). Recipients of this publication may contact NSL in respectof matters arising from, or in connection with, this publication. NSI accepts responsibility for thecontents of this material when distributed in the United States. No part of this material may be (i) copied, photocopied, or duplicated in any form, by any means, or (ii)redistributed without the prior written consent of the Nomura Group member identified in the banner onpage 1 of this report. Further information on any of the securities mentioned herein may be obtainedupon request. If this publication has been distributed by electronic transmission, such as e-mail, thensuch transmission cannot be guaranteed to be secure or error-free as information could be intercepted,corrupted, lost, destroyed, arrive late or incomplete, or contain viruses. The sender therefore does notaccept liability for any errors or omissions in the contents of this publication, which may arise as aresult of electronic transmission. If verification is required, please request a hard-copy version. This publication has not been approved for distribution in the Kingdom of Saudi Arabia or to clients
other than 'professional clients' in the United Arab Emirates by Nomura Saudi Arabia, NomuraInternational plc or any other member of the Nomura Group, as the case may be. Neither thispublication nor any copy thereof may be taken or transmitted or distributed, directly or indirectly, by anyperson other than those authorised to do so into the Kingdom of Saudi Arabia or in the United ArabEmirates or to any person located in the Kingdom of Saudi Arabia or to clients other than 'professionalclients' in the United Arab Emirates. By accepting to receive this publication, you represent that you arenot located in the Kingdom of Saudi Arabia or that you are a 'professional client' in the United ArabEmirates and agree to comply with these restrictions. Any failure to comply with these restrictions mayconstitute a violation of the laws of the Kingdom of Saudi Arabia or the United Arab Emirates. Additional information available upon request NIPlc and other Nomura Group entities manage conflicts identified through the following: their ChineseWall, confidentiality and independence policies, maintenance of a Stop List and a Watch List, personalaccount dealing rules, policies and procedures for managing conflicts of interest arising from theallocation and pricing of securities and impartial investment research and disclosure to clients via clientdocumentation. Disclosure information is available at the Nomura Disclosure web page: http://www.nomura.com/research/pages/disclosures/disclosures.aspx
Nomura Securities Malaysia Sdn. Bhd. Tel: +60 3 2027 6811Suite No 16.5, Level 16, Menara IMC, 8 Jalan Sultan Ismail,
50250 Kuala Lumpur, Malaysia Fax: +60 3 2027 6888
Caring for the environment: to receive only the electronic versions of our research, please contact your
sales representative.