Embed Size (px)
Citation preview

Svensk Kärnbränslehantering ABSwedish Nuclear Fueland Waste Management CoBox 5864SE-102 40 Stockholm Sweden Tel 08-459 84 00 +46 8 459 84 00Fax 08-661 57 19 +46 8 661 57 19
R-07-56
CM
Gru
ppen
AB
, Bro
mm
a, 2
007
Geology – Background complementary studies
Forsmark modelling stage 2.2
Editors:
Michael B Stephens, Geological Survey of Sweden
Kristina Skagius, Kemakta Konsult AB
September 2007
R-0
7-56
Geo
log
y – Backg
rou
nd
com
plem
entary stu
dies. F
orsm
ark mo
dellin
g stag
e 2.2

Tänd ett lager:
P, R eller TR.
Geology – Background complementary studies
Forsmark modelling stage 2.2
Editors:
Michael B Stephens, Geological Survey of Sweden
Kristina Skagius, Kemakta Konsult AB
September 2007
This report concerns a study which was conducted for SKB. The conclusions and viewpoints presented in the report are those of the authors and do not necessarily coincide with those of the client.
A pdf version of this document can be downloaded from www.skb.se.
ISSN 1402-3091
SKB Rapport R-07-56

3
Preface
During Forsmark model stage 2.2, seven complementary geophysical and geological studies were initiated by the geological modelling team, in direct connection with and as a background support to the deterministic modelling of deformation zones. One of these studies involved a field control on the character of two low magnetic lineaments with NNE and NE trends inside the target volume. The interpretation of these lineaments formed one of the late deliveries to SKB that took place after the data freeze for model stage 2.2 and during the initial stage of the modelling work. Six studies involved a revised processing and analysis of reflection seismic, refraction seismic and selected oriented borehole radar data, all of which had been presented earlier in connection with the site investigation programme. A prime aim of all these studies was to provide a better understanding of the geological significance of indirect geophysical data to the geological modelling team. Such essential interpretative work was lacking in the material acquired in connection with the site investigation programme. The results of these background complementary studies are published together in this report.
The titles and authors of the seven background complementary studies are presented below. Necessary editing work has been carried out by Michael B. Stephens and Kristina Skagius. Summaries of the results of each study, with a focus on the implications for the geological mod-elling of deformation zones, are presented in the master geological report, stage 2.2 /Stephens et al. 2007/. The sections in the master report, where reference is made to each background com-plementary study and where the summaries are placed, are also provided below. The individual reports are listed in the order that they are referred to in the master geological report and as they appear in this report.
• Scanlinefracturemappingandmagneticsusceptibilitymeasurements across two low magnetic lineaments with NNE and NE trend, Forsmark. Jesper Petersson, Ulf B. Andersson and Johan Berglund. Summary of results in section 3.9.3 in /Stephens et al. 2007/. Page 5
• Integratedinterpretationofsurfaceandborehole(VSP)reflectionseismic data along profiles 2 and 5, Forsmark, Sweden. Christopher Juhlin. Summary of results in section 3.10.1 and 3.10.2 in /Stephens et al. 2007/. Page 17
• Correlationof2Dsurfaceseismic,verticalseismicprofile(VSP),and geological and sonic data in boreholes KFM01A and KFM02A, Forsmark: Background analysis. Nicoleta Enescu and Calin Cosma. Summary of results in section 3.10.3 in /Stephens et al. 2007/. Page 61
• RefractionseismicdataandbedrockvelocitydistributionatForsmark. Johan Nissen. Summary of results in section 3.11.1 in /Stephens et al. 2007/. Page 107
• Correlationbetweenrefractionseismicdata,lowmagneticlineamentsand deformationzones(modelstage2.2).HansIsaksson.Summaryofresults in section 3.11.2 in /Stephens et al. 2007/. Page 113
• Interpretationoftomographyinversionmodelsforseismicrefractiondata alongprofileLFM001017inForsmark.HåkanMattsson.Summaryof results in section 3.11.3 in /Stephens et al. 2007/. Page 131
• Correlationoforientedradarreflectorswithgeologicalfeaturesinboreholes at Forsmark. Seje Carlsten. Summary of results in sections 3.12.1 and 3.12.2 in /Stephens et al. 2007/. Page 145

4
Referencetoeachreportinthemastergeologicalreport/Stephensetal.2007/iscarriedoutinaccordance with the following example:
Petersson J, Andersson U B, Berglund J, 2007. Scan line fracture mapping and magnetic susceptibility measurements across two low magnetic lineaments with NNE and NE trend, Forsmark.InStephensMBandSkagiusK(edits.),Geology−Backgroundcomplementarystudies.Forsmarkmodellingstage2.2.SKBR-07-56,SvenskKärnbränslehanteringAB.
Reference
Stephens M B, Fox A, La Pointe P, Simeonov A, Isaksson H, Hermanson J, Öhman J, 2007. Geology.Forsmarkmodellingstage2.2.SKBR-07-45,SvenskKärnbränslehanteringAB.

5
Scan line fracture mapping and magnetic susceptibility measurements across two low magnetic lineaments with NNE and NE trend, Forsmark
Jesper Petersson, Ulf B Andersson, Johan Berglund
Vattenfall Power Consultant AB
Contents1 Introduction 6
2 Execution 8
3 Rock type and ductile structures 10
4 Fractures 11
5 Magnetic susceptibility 14
6 Discussion and conclusions 14
7 References 15

6
1 Introduction
AdetailedgroundmagneticsurveyintheForsmarkarea/Isakssonetal.2006/hasrevealedsev-eral low magnetic lineaments with NNE to NE trend in the north-western part of the candidate area.Inordertoconfirmtheirpossiblerelationtogeologicalstructures,suchasfracturezones,a relatively well exposed outcrop that clearly coincides with two of these lineaments was chosen for detailed investigations. The outcrop, referred to as PFM000704 in the bedrock mapping work/Stephensetal.2003/,islocatedabout400mnorthofdrillsite6(Figure1-1).Themoredistinctlowmagneticlineament(MFM2273G)isinferredtobe659minlengthandshowsanaveragetrendof29°,whereastheotherlineament(MFM2088G)is68minlengthandtrendsapproximately54°/cf.Isakssonetal.2006/.
Twomoreorlessparalleltraverses(LFM001027andLFM001028),7–10mapart,wereuncov-ered in a direction perpendicular to the low magnetic lineaments, with the purpose to investigate their geological character with the help of scan line fracture mapping and magnetic susceptibil-ity measurements. The total lengths of these two traverses are 40.5 and 46.0 m, respectively, and their widths range generally from 1.5 to 2.5 m. A summary of the results from the scan line mapping work is presented in Figure 1-2.
Figure 1-1. Lineament map based on the detailed ground survey of the magnetic total field /Isaksson et al. 2006/. Outcrops intersected by lineaments are marked by red contours, whereas the other outcrops have blue contours. The location of the traverses is also shown.

7
Fig
ure
1-2.
Sum
mar
y of
the
resu
lts fr
om th
e sc
an li
ne m
appi
ng a
long
LFM
0010
27 a
nd L
FM00
1028
. Ind
ivid
ual f
ract
ures
are
sep
arat
ed o
n th
e ba
sis
of th
eir
dip
and
pre
dom
inan
t min
eral
filli
ng. T
he le
ngth
sho
wn
on th
e di
agra
m is
iden
tical
for
all f
ract
ures
rega
rdle
ss o
f the
ir a
ctua
l len
gth.
Red
deni
ng (o
xida
tion)
ass
ocia
ted
with
inte
rval
s of
in
crea
sed
frac
ture
freq
uenc
y is
illu
stra
ted
by a
gre
y to
ne o
f var
ying
inte
nsity
. Enc
ircle
d nu
mbe
rs m
ark
inte
rval
s re
ferr
ed to
in th
e te
xt. E
xact
loca
tions
of m
agne
tic s
us ce
ptib
ility
mea
sure
men
t are
as a
re in
dica
ted
by b
lack
dot
s al
ong
the
scan
line
s. Th
e di
stan
ce b
etw
een
indi
vidu
al d
ots
is 1
m. G
PS c
oord
inat
es a
re g
iven
for
the
star
t and
end
po
ints
of t
he s
can
lines
. The
tren
d of
indi
vidu
al s
can
line
sect
ions
is in
dica
ted.
Not
e th
at, f
or p
rese
ntat
ion
purp
oses
, the
sca
n lin
es h
ave
been
rota
ted
32°
antic
lock
wis
e.
2 m
1
2
6
3
3
45
Frac
ture
with
no
visi
ble
fillin
g
Med
ium
-gra
ined
met
agra
nite
(101
057)
Pegm
atiti
c gr
anite
(101
061)
Fine
- to
med
ium
-gra
ined
met
agra
nito
id (1
0105
1)
Amph
ibol
ite (1
0201
7)
LFM
0010
27
LFM
0010
28
Aplit
ic m
etag
rani
te (1
0105
8)
Red
deni
ng o
f var
ying
inte
nsity
Adul
aria
fille
d fra
ctur
e
Chl
orite
fille
d fra
ctur
e
Qua
rtz fi
lled
fract
ure
Frac
ture
dip
ping
< 4
5°
Tect
onic
folia
tion
Inte
rval
of s
peci
fic in
tere
st
Susceptibility (10–5 SI units) 120012
00
6700
159
1632
459
6700
144
1632
463
6700
141
1632
467
6700
138
1632
473
6700
130
1632
501
6700
128
1632
491
GPS
cal
ibra
tions
PP1
202
6699
539
163
1320
6699
537
163
1319
2006
-10-
11 0
7:55
2006
-10-
12 0
7:50
6700
131
1632
498
6700
135
1632
491
6700
163
1632
471
6700
165
1632
461
6700
136
1632
491
80080
0
40040
0
0
0
82°
73°
134°
9.45 m 42°
9.20 m 7
9°
111°
141°
121°
107°
117°
123°
145°
179°
73°
75°
Susceptibility (10–5 SI units)

8
2 Execution
Scan lines were marked by measuring-tapes, lined up along the centre of each traverse. Coor-dinatesinRT90forthestartandendpointsofthescanlinesweredefinedbyGPSmeasure-ments. Fix point PP1202 was used for accuracy estimates. During the course of the work, the precisionoftheGPSmeasurementsturnedouttobeinadequate.TheGPSmeasurementswere,therefore, complemented by compass orientations of individual scan line sections. The magnetic declination in the area is 4.4°.
All rock descriptions and identification of fracture minerals were based solely on ocular inspec-tion. The orientation of ductile structures, rock contacts and fractures were measured by using a Silva compass with inclinometer. The scan line fracture mapping did not strictly follow the SKBmethoddescriptionfordetailedfracturemapping(SKBMD132.003,v.1.0).Themappinginvolveddocumentationoforientation(i.e.strikeanddip),width,aperture,mineralogyandpos-sible movement indicators. Other fracture parameters given in the method description, such as terminations, lithological relations, waviness, etc, were not registered in the present study. The truncation level was set to 4 dm.
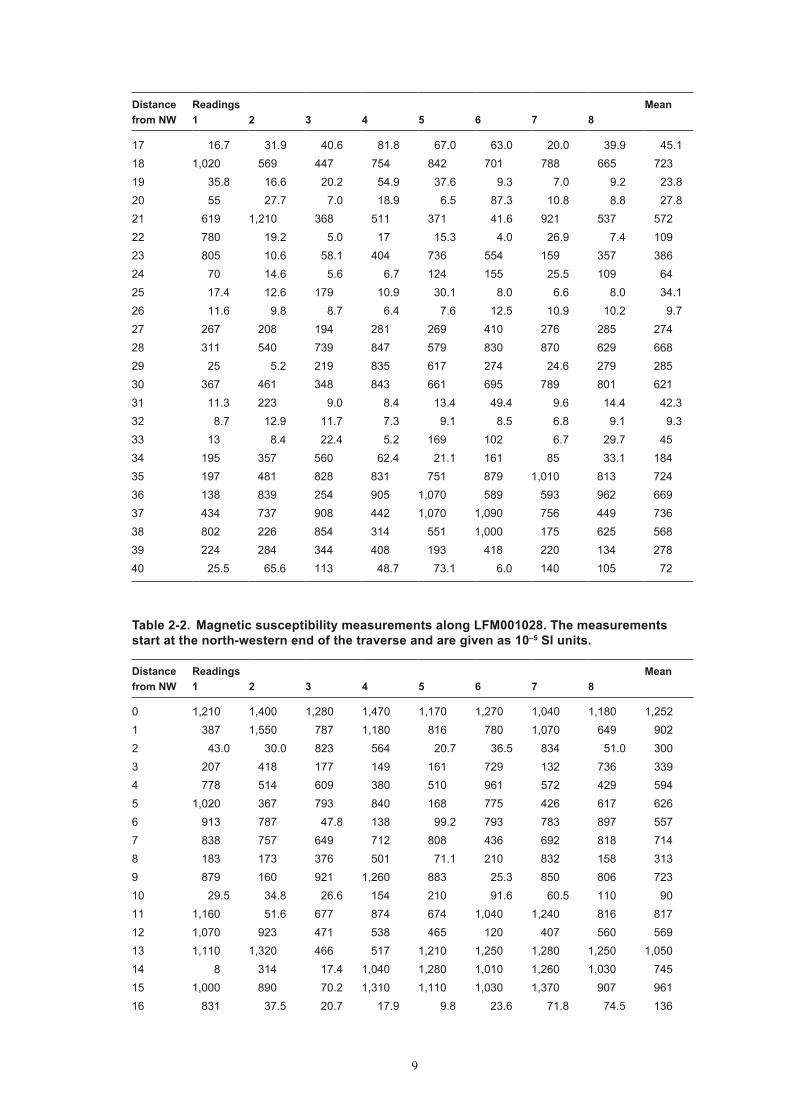
The instrument used to measure magnetic susceptibility was a SM-20 magnetic susceptibility meter(GFinstruments,CzechRepublic)withasensitivityof10–6SIunits(seewww.gfinstruments.czformoredetails).Measurementswereregisteredatapproximately1mintervalsalongboth the scan lines. Each measurement represents the mean of eight instrument readings within an area with a radius less than about 0.5 m. Special care was taken to avoid composite measure-ments comprising readings from more than one rock type. Totally, scan lines LFM001027 and LFM001028comprise41and47measurementareas,respectively.ThestoragecapacityoftheSM-20 magnetic susceptibility meter is 100 readings. The total number of readings along the profileis704(i.e.8×88).SincenoportablePCwasavailable,allreadingswerewrittendownmanually, and later fed into Microsoft Excel. The digital data and the original protocol were checked twice for consistency, and after delivery exported to the SKB database Sicada. The data are also presented in Tables 2-1 and 2-2.
Table 2-1. Magnetic susceptibility measurements along LFM001027. The measurements start at the north-western end of the traverse and are given as 10–5 SI units.
Distance Readings Meanfrom NW 1 2 3 4 5 6 7 8
0 31.2 34.1 33.0 32.1 9.8 33.9 44.1 32.6 31.41 29.8 22.2 15.3 26.5 23.7 29.5 17.7 19.4 23.02 38.5 50.6 25.1 22.8 61.8 65.6 47.6 45.7 44.73 1,060 1,380 460 494 108 514 394 536 6184 1,460 1,430 1,220 1,040 1,200 1,420 1,220 1,310 1,2885 401 957 396 717 1,550 984 257 552 7276 20.7 26.9 356 190 86.8 21.5 126 30.0 1077 206 179 73.7 1,000 793 21.6 723 687 4608 926 365 79.6 992 61.6 1,380 690 142 5809 1,280 1,260 1,130 743 1,050 1,180 1,170 1,000 1,10210 1,200 1,040 797 629 1,080 997 1,220 833 97411 419 860 687 796 186 636 413 559 56912 1,050 734 238 14.8 363 72.8 453 933 48213 51.8 861 666 767 74.4 853 496 283 50614 40.2 23.6 47.6 79.8 19.4 58.3 66.3 74.4 51.215 77.4 67.7 11.5 11.6 55.1 46.5 54.7 30.1 44.316 20.7 45.2 31.6 38.9 25.1 114 31.1 40.5 43
9
Distance Readings Meanfrom NW 1 2 3 4 5 6 7 8
17 16.7 31.9 40.6 81.8 67.0 63.0 20.0 39.9 45.118 1,020 569 447 754 842 701 788 665 72319 35.8 16.6 20.2 54.9 37.6 9.3 7.0 9.2 23.820 55 27.7 7.0 18.9 6.5 87.3 10.8 8.8 27.821 619 1,210 368 511 371 41.6 921 537 57222 780 19.2 5.0 17 15.3 4.0 26.9 7.4 10923 805 10.6 58.1 404 736 554 159 357 38624 70 14.6 5.6 6.7 124 155 25.5 109 6425 17.4 12.6 179 10.9 30.1 8.0 6.6 8.0 34.126 11.6 9.8 8.7 6.4 7.6 12.5 10.9 10.2 9.727 267 208 194 281 269 410 276 285 27428 311 540 739 847 579 830 870 629 66829 25 5.2 219 835 617 274 24.6 279 28530 367 461 348 843 661 695 789 801 62131 11.3 223 9.0 8.4 13.4 49.4 9.6 14.4 42.332 8.7 12.9 11.7 7.3 9.1 8.5 6.8 9.1 9.333 13 8.4 22.4 5.2 169 102 6.7 29.7 4534 195 357 560 62.4 21.1 161 85 33.1 18435 197 481 828 831 751 879 1,010 813 72436 138 839 254 905 1,070 589 593 962 66937 434 737 908 442 1,070 1,090 756 449 73638 802 226 854 314 551 1,000 175 625 56839 224 284 344 408 193 418 220 134 27840 25.5 65.6 113 48.7 73.1 6.0 140 105 72
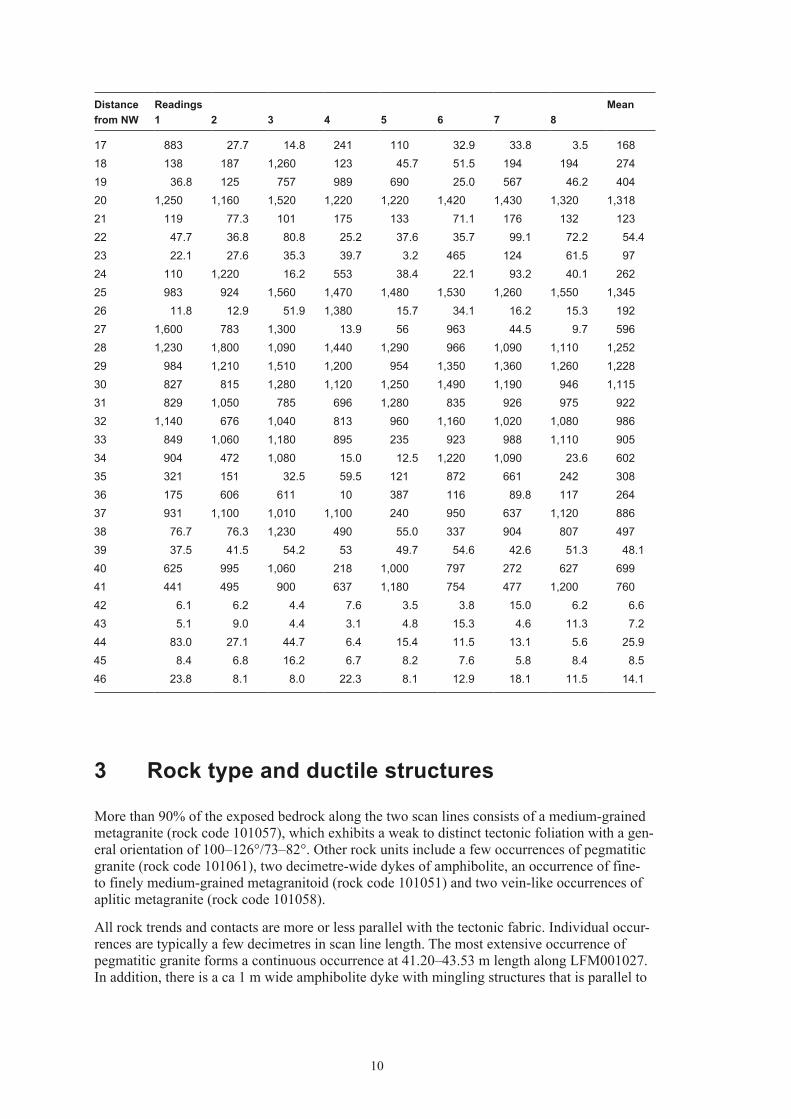
Table 2-2. Magnetic susceptibility measurements along LFM001028. The measurements start at the north-western end of the traverse and are given as 10–5 SI units.
Distance Readings Meanfrom NW 1 2 3 4 5 6 7 8
0 1,210 1,400 1,280 1,470 1,170 1,270 1,040 1,180 1,2521 387 1,550 787 1,180 816 780 1,070 649 9022 43.0 30.0 823 564 20.7 36.5 834 51.0 3003 207 418 177 149 161 729 132 736 3394 778 514 609 380 510 961 572 429 5945 1,020 367 793 840 168 775 426 617 6266 913 787 47.8 138 99.2 793 783 897 5577 838 757 649 712 808 436 692 818 7148 183 173 376 501 71.1 210 832 158 3139 879 160 921 1,260 883 25.3 850 806 72310 29.5 34.8 26.6 154 210 91.6 60.5 110 9011 1,160 51.6 677 874 674 1,040 1,240 816 81712 1,070 923 471 538 465 120 407 560 56913 1,110 1,320 466 517 1,210 1,250 1,280 1,250 1,05014 8 314 17.4 1,040 1,280 1,010 1,260 1,030 74515 1,000 890 70.2 1,310 1,110 1,030 1,370 907 96116 831 37.5 20.7 17.9 9.8 23.6 71.8 74.5 136
10
Distance Readings Meanfrom NW 1 2 3 4 5 6 7 8
17 883 27.7 14.8 241 110 32.9 33.8 3.5 16818 138 187 1,260 123 45.7 51.5 194 194 27419 36.8 125 757 989 690 25.0 567 46.2 40420 1,250 1,160 1,520 1,220 1,220 1,420 1,430 1,320 1,31821 119 77.3 101 175 133 71.1 176 132 12322 47.7 36.8 80.8 25.2 37.6 35.7 99.1 72.2 54.423 22.1 27.6 35.3 39.7 3.2 465 124 61.5 9724 110 1,220 16.2 553 38.4 22.1 93.2 40.1 26225 983 924 1,560 1,470 1,480 1,530 1,260 1,550 1,34526 11.8 12.9 51.9 1,380 15.7 34.1 16.2 15.3 19227 1,600 783 1,300 13.9 56 963 44.5 9.7 59628 1,230 1,800 1,090 1,440 1,290 966 1,090 1,110 1,25229 984 1,210 1,510 1,200 954 1,350 1,360 1,260 1,22830 827 815 1,280 1,120 1,250 1,490 1,190 946 1,11531 829 1,050 785 696 1,280 835 926 975 92232 1,140 676 1,040 813 960 1,160 1,020 1,080 98633 849 1,060 1,180 895 235 923 988 1,110 90534 904 472 1,080 15.0 12.5 1,220 1,090 23.6 60235 321 151 32.5 59.5 121 872 661 242 30836 175 606 611 10 387 116 89.8 117 26437 931 1,100 1,010 1,100 240 950 637 1,120 88638 76.7 76.3 1,230 490 55.0 337 904 807 49739 37.5 41.5 54.2 53 49.7 54.6 42.6 51.3 48.140 625 995 1,060 218 1,000 797 272 627 69941 441 495 900 637 1,180 754 477 1,200 76042 6.1 6.2 4.4 7.6 3.5 3.8 15.0 6.2 6.643 5.1 9.0 4.4 3.1 4.8 15.3 4.6 11.3 7.244 83.0 27.1 44.7 6.4 15.4 11.5 13.1 5.6 25.945 8.4 6.8 16.2 6.7 8.2 7.6 5.8 8.4 8.546 23.8 8.1 8.0 22.3 8.1 12.9 18.1 11.5 14.1
3 Rock type and ductile structures
More than 90% of the exposed bedrock along the two scan lines consists of a medium-grained metagranite(rockcode101057),whichexhibitsaweaktodistincttectonicfoliationwithagen-eralorientationof100–126°/73–82°.Otherrockunitsincludeafewoccurrencesofpegmatiticgranite(rockcode101061),twodecimetre-widedykesofamphibolite,anoccurrenceoffine-tofinelymedium-grainedmetagranitoid(rockcode101051)andtwovein-likeoccurrencesofapliticmetagranite(rockcode101058).
Allrocktrendsandcontactsaremoreorlessparallelwiththetectonicfabric.Individualoccur-rences are typically a few decimetres in scan line length. The most extensive occurrence of pegmatiticgraniteformsacontinuousoccurrenceat41.20–43.53mlengthalongLFM001027.Inaddition,thereisaca1mwideamphibolitedykewithminglingstructuresthatisparallelto

11
thescanlineandrunsafewmetressouth-westofLFM001028.Twoorientationmeasurementsofthenorth-easterndykecontactyielded121°/75°and126°/79°(right-hand-rulemethod).Allrocks along the scan lines have experienced metamorphism under amphibolite-facies conditions.
4 Fractures
ThetotalnumberoffracturesregisteredalongscanlinesLFM001027andLFM001028is208and 229, respectively, i.e. approximately 5 fractures/metre. Confident fracture dips were only possibletomeasurefor270ofthefractures(i.e.62%).Themajorityoffracturesdipsteeply,generallygreaterthan70°.However,thereare13fractureswithdipslessthan40°.Thestrikeof the fractures varies considerably along the scan lines. The most conspicuous fracture set, towhichthemajorityofthefracturesbelong,strikesNE–SW.ThegentlydippingfracturesstrikeWNW–ESEandmainlyoccurinthenorth-westernendsofthetwoscanlines.Naturally,acertainbiascanbeexpectedduetothescanlineorientations.However,thefocushereisonthe presentation of raw data without any line bias correction.
Fracturefillingmineralsaredetectablein122ofthefractures.Inorderofdecreasingabundance,thesemineralsincludeadularia,chloriteandquartz.Individualfracturesmaycontainmorethanone mineral. 153 fractures exhibit oxidized or reddened walls. Two thirds of these fractures occuralongscanlineLFM001028.Moreextensivereddening,whichcannotbeboundtoindi-vidual fractures, occurs in some of the sections with increased fracture frequency.
There are five intervals of highly increased fracture frequency. Two intervals occur along scan lineLFM001027andthreealongscanlineLFM001028(Figure1-2).Thefracturefrequencytypically exceeds 10 fractures/metre in these intervals. The majority of the fractures within all fiveintervalsbelongtothesteepNE–SWfractureset.Furthermore,themoregentlydipping,WNW–ESEfracturesarefrequentinsomeoftheseintervals.Individualintervalsofhighlyincreased fracture frequency, as well as the fractures associated with two amphibolite dykes, aredescribedbrieflybelow.Eachintervalisgivenanumber(1–6),whichcorrespondstothenumbers in Figures 1-2, 4-1 and 4-2.
LFM001027
1. 3.93–7.01m.PredominantlysteeplydippingfractureswithNNE-SSWstrike(Figure4-2).Subordinate,yetdistinct,fractureswithWNW-ESEstrike,whichtypicallydipgently(<40°)towardsNNE,arealsopresent.Adulariaistheonlydistinguishablefracturefilling.Some fractures exhibit oxidized or reddened walls. Additionally, the entire interval has been affectedbyaweakoxidation(Figure4-1).
2. Amphibolitedykesintersectingthescanlineat35.52–35.74and39.01–39.28m.Thedykesareabout1dminwidthandstrikeapproximately80–95°.Bothdykesareintenselyfracturedalongtheirsoutherncontacts(Figure4-1).However,thisdoesnotemergeinthescanlinemapping, since virtually all the fractures are shorter than the truncation level.
3. 41.42–45.66m.Predominantlysteep,NE-SWfractureset(Figure4-2).Fracturesthatbelongto this set, but are shorter than the truncation level are frequent. The high fracture frequency appears to persist under the vegetation cover in the southeastward continuation of the scan line. Adularia and quartz, typically in close association, are the only distinguishable infilling minerals. Oxidation of the fracture wall rock occurs frequently. Some of the fractures exceed 1 mm in width. The entire interval has been affected by oxidation of weak to medium inten-sity(Figure4-1).

12
Figure 4-1. Photographs that show intervals of highly increased fracture frequency and altered (oxidised) bedrock along LFM001027 and LFM001028. (1) A steep, NESW fracture set intersected by gently dipping fractures that strike WNWESE. View towards the south. (2) Decimetrewide amphibolite dyke with intensely fractured southern contact. The general strike of the dyke is approximately 90°. View towards the west. (3) Steep, NESW fractures. The majority are shorter than the truncation level (i.e. 4 dm). View towards the east. (4) Steep, approximately NE–SW fractures intersected by a gently dipping, WNWESE fracture set. View towards the NE. (5) Steep, approximately NESW fractures intersected by a gently dipping, WNWESE fracture set. View towards the NE. (6) Steep, NESW fractures. The majority are shorter than the truncation level (i.e. 4 dm). View towards the east. Scales: compass 10×6.5 cm, pen length 14 cm, brush length 23 cm and length of pocket knife 9 cm.

13
Figure 4-2. Rose diagrams that show the strike of all fractures in the five intervals of highly increased fracture frequency along LFM001027 and LFM001028. All gently dipping fractures belong to the WNW set. The strikes of fractures outside these intervals are presented in a separate diagram for comparison (background). Note that the frequency contours vary between the diagrams.

14
LFM001028
4. 2.84–7.43m.PredominantlysteeplydippingfracturesthatstrikefromNNE-SSWtoNE-SW(Figures4-1and4-2).Subordinate,yetdistinct,fractureswithWNW-ESEstrike,whichtypi-callydipgently(<40°)towardstheNNE,arealsopresent.Adulariaistheonlydistinguish-able fracture filling. A few fractures exhibit oxidized walls.
5. 19.74–21.08m.PredominantlysteepfractureswithNNE-SSWstrike,andsubordinately,fractureswithWNW-ESEstrike(Figure4-2).Adulariaistheonlydistinguishablefracturefilling. Some fractures exhibit oxidized walls. Most of the interval has been affected by faint oxidation(Figure4-1).
6. 37.81–40.40m.PredominantlysteepNE-SWfractureset.Fracturesthatbelongtothisset,but are shorter than the truncation level are frequent. The high fracture frequency appears to persist under the vegetation cover in the southeastward continuation of the scan line. Except for one chlorite-bearing fracture, adularia is the only distinguishable fracture filling. The entireintervalhasbeenaffectedbyoxidationofweakintensity(Figure4-1).
5 Magnetic susceptibility
Magnetic susceptibility was primarily measured in the predominant medium-grained meta-granite(101057),sincemostoftheotherrockunitsaretoothintoyieldreliabledata.However,fourofthe88measurementareaswerelocatedinoccurrencesofpegmatiticgranite(101061).
Typically, the metagranite exhibits a rather low magnetic susceptibility, averaging at c.480·10–5SIunits.However,thesusceptibilitydoes,evenindecimetrescale,varyconsiderablyandrangesfrom3.2·10–5to1,490·10–5SI.Theaveragesusceptibilityofthepegmatiticgraniteisc.190·10–5,witharangefrom3.5·10–5to1,600·10–5SI.Generally,thesusceptibilitytendstodecreasewithanincreasingintensityofoxidation(seeFigure1-2).However,theoverallpatternis not always clear. The distinct susceptibility decrease at interval 3 may be related, in part, to the pegmatitic granite. Furthermore, it must be emphasized that the exposed surface of this highly fractured area largely corresponds to gently dipping fracture planes, which are variably affected by oxidation. For this reason, it is not clear to what extent the decrease in magnetic susceptibility is related to these gently dipping fracture planes.
6 Discussion and conclusions
The spatial relationship between the more intensely fractured intervals along the two scan linesisnotobvious.However,thegeneralcharacteristicsoftheintervals,suchaspredominantfracture orientations and infilling mineralogy, suggest that there is a correlation between the highly fractured intervals 1 and 4, and 3 and 6, and that each of these pairs belongs to the same fracturezone.However,apossiblecontinuationofinterval5inLFM001027ismoredoubtful,suggesting that the extent of some fracture zones in the area is limited.
The principal purpose of the investigation concerned a possible relationship between the more intensely fractured and altered intervals in the bedrock and the two low magnetic lineaments with NNE and NE trend, revealed by the detailed ground magnetic survey. A direct correlation using the magnetic susceptibility values is obviously not possible because of the equivocal susceptibility pattern along the scan lines. The uncertainty in the position of the lineaments as wellasintheGPSmeasurementsinthisfieldstudyalsolimitsconfidenceinsuchcorrelationwork.However,reducedmagneticsusceptibilityvaluesarepresentinthevicinityofthehighly

15
fracturedintervals1and4,and3and6(seealsoabove).Furthermore,thehighlyfracturedintervalsalsoshowrockalteration(oxidation).Thus,althoughtherearesomelimitations,itissuggestedthatintervals1and4correspondtothewesternmostlineament,i.e.MFM2273G,whereasintervals3and6correspondtolineamentMFM2088G.
Inconclusion,thescanlinefracturemappinghasrevealedthatatleasttwolowmagneticlin-ea ments with NNE and NE trend correspond to intervals of high fracture frequency and rock alteration(oxidation).Thecorollaryfollowsthattheselineamentsrepresentminorfracturezones in the bedrock.
7 References
Isaksson I, Thunehed T, Pitkänen T, Keisu M, 2006. Forsmark site investigation. Detailed groundandmarinemagneticsurveyandlineamentinterpretationintheForsmarkarea–2006.SKBP-06-261,SvenskKärnbränslehanteringAB.
Stephens M B, Bergman T, Andersson J, Hermansson T, Wahlgren C-H, Albrecht L, Mikko H, 2003.Forsmark.Bedrockmapping.Stage1(2002)–Outcropdataincludingfracturedata.SKBP-03-09,SvenskKärnbränslehanteringAB.
17
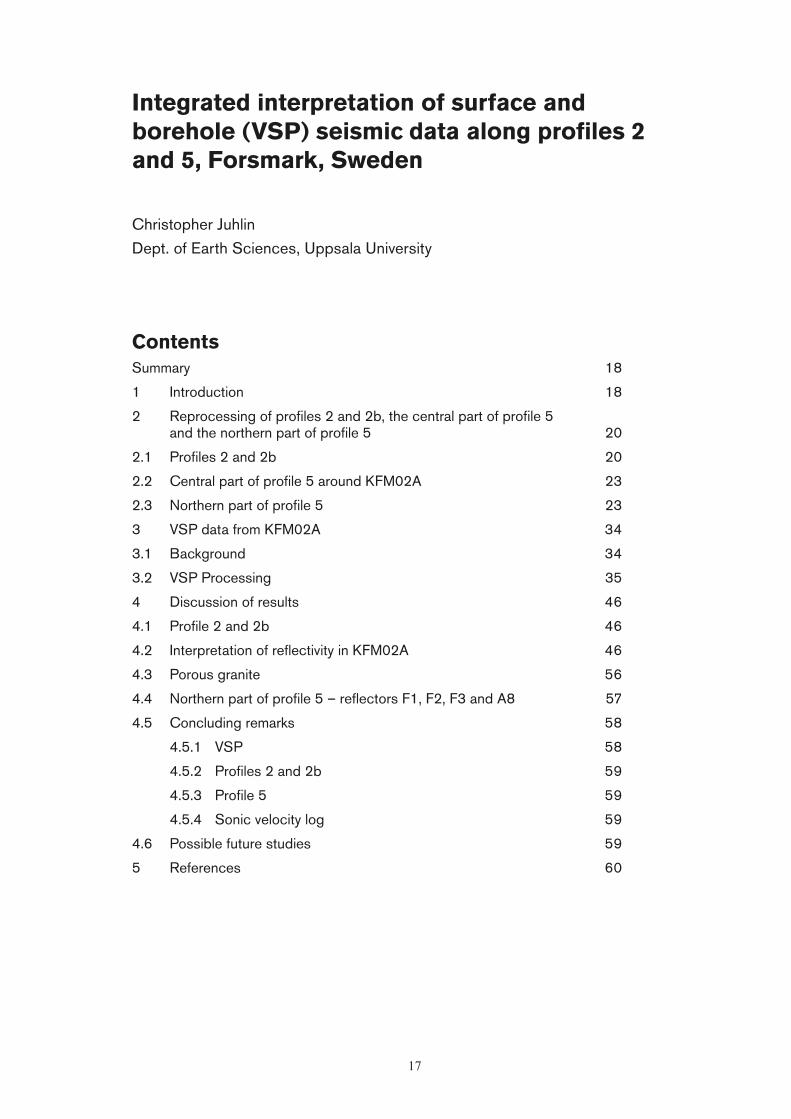
Integrated interpretation of surface and borehole (VSP) seismic data along profiles 2 and 5, Forsmark, Sweden
Christopher Juhlin
Dept. of Earth Sciences, Uppsala University
ContentsSummary 18
1 Introduction 18
2 Reprocessing of profiles 2 and 2b, the central part of profile 5 and the northern part of profile 5 20
2.1 Profiles 2 and 2b 20
2.2 Central part of profile 5 around KFM02A 23
2.3 Northern part of profile 5 23
3 VSP data from KFM02A 34
3.1 Background 34
3.2 VSP Processing 35
4 Discussion of results 46
4.1 Profile 2 and 2b 46
4.2 Interpretation of reflectivity in KFM02A 46
4.3 Porous granite 56
4.4 Northern part of profile 5 – reflectors F1, F2, F3 and A8 57
4.5 Concluding remarks 58
4.5.1 VSP 58
4.5.2 Profiles 2 and 2b 59
4.5.3 Profile 5 59
4.5.4 Sonic velocity log 59
4.6 Possible future studies 59
5 References 60

18
Summary
Borehole KFM02A intersects several hydraulically conductive fracture zones, in particular amajorzoneat415–520m.ThiszoneandtwooftheotherscanbecorrelatedtoreflectionsobservedonthesurfaceseismicdataacquiredduringtheStage1surveys.However,the3Dgeometry of the fracture zones and the fact that the borehole does not lie on the profiles makes a definite correlation uncertain. Moreover, the presence of higher density mafic rock in the bore-hole implies that the reflections could conceivably result from lithological contrasts rather than fromthefracturezones.Therefore,surfaceseismicandverticalseismicprofile(VSP)datahavebeen quantitatively integrated and compared to geological and geophysical data from KFM02A.
The main result is that the F1 reflection, the strongest reflection on the surface seismic data near the borehole, can definitely be identified as intersecting the borehole at about 500 m. Thisisclosetothebaseoftheheavilyfracturedintervalat415–520mandfarfromanyhighdensity mafic rocks, indicating that the F1 reflection is generated from the base of this fractured interval.TheA2reflectionisnotasclearlyobservedontheVSPdata,butappearstointersectthe borehole somewhat below 400 m, suggesting that it originates from the top of the fractured interval.ThedeeperB4reflectorwasnotcoveredbytheVSPsurveyanditsexactintersectiondepth with the borehole cannot be determined, but it probably intersects the borehole at around 920 m. A thick section of high density tonalitic rock at this depth with a 10 m thick fracture zone on top suggests that the nature of the B4 reflector differs from that of the A2 and F1 reflectors.
Surface seismic profiles 2 and 5 from the Stage 1 survey, acquired in 2002, cross one another near borehole KFM02A. Profile 2 was extended to the south-west in the Stage 2 survey in 2004 and a prominent south-west moderately dipping reflection, J1, was observed on this extension.Itprojectstothesurfacealongthesouthernmostpartofprofile2fromtheStage1survey, but was not observed on the profile. Therefore, profile 2 from Stage 1 and profile 2b from Stage 2 were merged and reprocessed in order to increase the potential of tracing J1 to thesurface.Inspiteofdetailedprocessing,ithasnotbeenpossibletotracethereflectortoshallowerthan200mfromthesurface.Inthereprocessedsectionofprofiles2and2b,severalreflections are clearer than on the original processing, due to using slightly different processing parameters. Thus, the central part of profile 5 was also reprocessed along a new CDP line with a more advantageous geometry for migrating profile 5 and correlating with the KFM02A borehole. Migration of the reprocessed section shows that the A2, A3 and F1 reflections contain small offsets that may be related to sub-vertical faulting.
Finally, the northern part of profile 5 was reprocessed to see if F1 could be further traced to the north. The reflection has been split into 3 sections with the northernmost section extending to about 6699400 N, where it is either cut by a sub-vertical fracture zone or by weaker south-east dippingreflectors.Anewreflectionwasidentifiedinthereprocessing,A8,thatstrikesWSW-ENEanddipsabout35°totheSSE.Itsorientationissomewhatuncertainsincenocrossinglinedataareavailable.However,itisobservedonrawshotgathersandhasanorientationsimilartoother reflections in the set A group.
1 Introduction
ReflectionseismicdatawereacquiredintheForsmarkareainnorth-easternUppland,Swedenin2002(Stage1)and2004(Stage2)byUppsalaUniversity,undercontractfromSKB.Approx-imately40kmofhigh-resolution(10mshotandreceiverspacing)reflectionseismicdatahavebeenshotalong15differentprofilesduringthetwocampaigns(Figure1-1).Resultshavebeen

19
reported in /Juhlin et al. 2002, Juhlin and Bergman 2004, Juhlin and Palm 2005/. Borehole seismicdata(VSP)wereacquiredin2004byVibrometricOyandtheresultswerereportedin/Cosma et al. 2005/.
Thepurposeofthepresentstudywastwo-fold.Aclearsouth-westdippingreflection(J1)wasobserved in the stage 2 data on profile 2. The structure generating this reflection appears to cut acrosstheEckarfjärdendeformationzone(ZFMNW0003)andextendsontoprofile2ofthestage 1 data, but could not be traced to the surface. Profiles 2 of Stage 1 and Stage 2 were proc-essedindependentlyofoneanothereventhoughtheyoverlap(Figure1-1).Byreprocessingthetwo profiles together, it was hoped that an improved section of where the profiles overlap could be obtained and that it would easier to determine if the J1 reflection can or cannot be traced to the surface.
The second goal of this study was make an integrated interpretation of the surface seismic data from profiles 2 and 5 together with the borehole seismic data and geophysical logs from bore-hole KFM02A. The integrated interpretation focuses on studying the source of the reflectivity observedonthesurfaceseismicsectionsinthevicinityoftheborehole.Verticalseismicprofile(VSP)dataallows,inprinciple,theexactintersectionpointsofreflectorswiththeboreholetobedetermined.IfreflectionsintheVSPcanbecorrelatedtoreflectionsinthesurfaceseismics,thenthesourceofthesurfaceseismicreflectionscanbedetermined.Inordertoimplementthisexercise, part of profile 5 was also reprocessed to facilitate this integration and interpretation.
Figure 1-1. Stage 2 profiles acquired in 2004 are shown as light blue lines. Station locations for profiles acquired in 2002 (Stage 1) are shown with red lines. Green circles are deep, cored boreholes available at model stage 2.2. Candidate area is marked by purple line.

20
2 Reprocessing of profiles 2 and 2b, the central part of profile 5 and the northern part of profile 5
2.1 Profiles 2 and 2bDatafromprofiles2and2bwereprojectedontoasinglestraightline(Figure2-1)priortostacking. Processing parameters from the Stage 2 data /Juhlin and Palm 2005/ were used for the entiremergedprofile.Alargewindow(1001100ms)wasusedforresidualstaticsinordertoomit any bias in the final image. The merged final stacked time section is shown in Figure 2-2. Forcomparison,theindependentlyprocessedstackedsectionsfromprofile2(Stage1)and2b(Stage2)areshowninFigure2-3.
The sections differ primarily in the central portions where the merged processing appears to haveperformedbetter.Intheupper0.3snorth-eastoftheEckarfjärdendeformationzone(ZFMNW0003),anumberofshortsouth-westdippingreflectionshaveappearedthatwerenotobservedearlier.Inspectionofshotgathersindicatesthatthesearenotartifacts,butreal.
Figure 2-1. CDP stacking lines (red) used for the reprocessing of profiles 2 and 2b and the central and northern parts of profile 5 in this report plotted on top of the geological map of the Forsmark area. Candidate area is marked by purple line. The longer NESW running line represents merged profiles 2 and 2b while the shorter NWSE running line represents the reprocessed central and northern parts of profile 5.

21
Figure 2-2. Stacked section of merged profile 2 down to 1.3 seconds. Location of section indicated in lower left corner.

22
Figure 2-3. Stacked sections of profiles 2 and 2b from /Juhlin and Palm 2005/ down to 1.3 seconds. Location of sections indicated in lower left corners.

23
Inadditiontothesereflections,theimagealongprofile2(Stage1)appearssharperthanintheearlier processing. This may be due to that somewhat lower frequencies were used in the filter-ing and the longer residual statics window. Figures 2-4 and 2-5 show more detailed sections of themergedandpreviousprocessing,respectively,neartheEckarfjärdendeformationzone.Itshould be noted that the apparent break in the prominent south-west dipping reflection directly belowtheEckarfjärdendeformationzoneinFigure2-4movestothenorth-eastaftermigra-tion(Figure4-2)andisnotadirectindicationoftheverticalorientationoftheEckarfjärdendeformation zone. Figures 2-6 and 2-7 show more detailed sections of the merged and previous processing, respectively, near the KFM02A borehole.
2.2 Central part of profile 5 around KFM02AIntheoriginalprocessingofprofile5/Juhlinetal.2002/,aCDPlinewaschosenthatcontainsabend south of the KFM02A borehole. The location of this bend was somewhat arbitrary, but was required to follow the general trend of the source-receiver midpoints. For migrating data along the central portion of profile 5, the selected location of this bend is not an optimum, since reflec-tions have to “migrate around the bend”. Therefore, the central part of profile 5 was reprocessed along a new CDP line that continues further to the south-east, allowing data from further south to be included in the migration. Processing parameters were chosen as in the reprocessing of profiles 2 and 2b. The somewhat lower frequencies used and the wider residual statics window alsoresultinasectionwherethereflectionsaresomewhatmoredistinct(Figure2-8)comparedtotheearlierprocessing(Figure2-9).
A migrated section of the reprocessed stack is shown in Figure 2-10. Note that the image is blurred and biased in the south-east, since the reflections dip in this direction. Aside from this geometrical effect, the image gives a good representation of the true subsurface geometry of the main reflectors along the CDP line. This is confirmed by the observation that the location of the main reflectors, as determined from the cross dip analysis of profiles 2 and 5 /Juhlin and Bergman2004/,fallnearlyontopofthemainreflectorsinthemigratedimage(Figure2-11).Only B5 does not fall on top of its corresponding reflection in the migrated image. This is due to that the orientation of B5 was based on where profiles 3 and 5 cross, not where profiles 2 and 5 cross, and has, therefore, been projected a long distance. The true location of B5 corresponds closelytothestrongreflectionbelowB4inthemigratedimage(Figure2-11).Basedonthemigrated image, the main reflectors expected to be encountered in the KFM02A borehole are A3, A2, F1 and B4.
2.3 Northern part of profile 5The CDP line chosen for reprocessing is shown in Figure 2-1. Note that the CDP numbering system is again different from that in the original processing and from the processing from the central part of profile 5 near KFM02A. The same processing parameters were used as for the central part of profile 5 and profiles 2 and 2b in this report. The reprocessed stacked section showsthereisagroupofsetFreflections,consistingof3sections(Figure2-12),F1,F2andF3. A migrated version is shown in Figure 2-13. After reprocessing, a new reflection has been identified,A8(Figures2-12and2-13).AlthoughnotasclearastheothersetAreflections,itis seen on shot gathers and can be traced nearly to the surface on these gathers.

24
Figure 2-4. Stacked section of merged profile 2 near the Eckarfjärden deformation zone and down to 0.5 seconds. Location of section indicated in lower left corner.

25
Figure 2-5. Stacked sections of profiles 2 and 2b from /Juhlin and Palm 2005/ near the Eckarfjärden deformation zone and down to 0.5 seconds. Location of sections indicated in lower left corners.

26
Figure 2-6. Stacked section of merged profile 2 near to borehole KFM02A and down to 0.5 seconds. Location of section indicated in lower left corner.

27
Figure 2-7. Stacked section of profile 2 as presented in Stage 1 /Juhlin et al. 2002/ near to borehole KFM02A and down to 0.5 seconds. Location of section indicated in lower left corner.

28
Figure 2-8. Reprocessed stacked section of profile 5 near to borehole KFM02A and down to 0.5 seconds. Location of section indicated in lower left corner.

29
Figure 2-9. Stacked section of the central part of profile 5 as presented in Stage 1 /Juhlin et al. 2002/ near to borehole KFM02A and down to 0.5 seconds. Location of section indicated in lower left corner.

30
Figure 2-10. Migrated section of reprocessed profile 5 near to borehole KFM02A and down to 0.5 seconds. Location of section indicated in lower left corner.

31
Figure 2-11. Migrated section of reprocessed profile 5 near to borehole KFM02A and down to 0.5 seconds. Location of section indicated in lower left corner. Depths of the selected reflectors have been projected onto the section. The depths of these reflectors correspond to the depths where the reflectors would be intersected if a borehole were to be drilled along the profile. They should be viewed as nearly true depths.

32
Fig
ure
2-12
. Re
proc
esse
d st
acke
d se
ctio
n of
the
nort
hern
par
t of p
rofil
e 5
dow
n to
0.5
sec
onds
. Loc
atio
n of
sec
tion
indi
cate
d in
low
er le
ft co
rner
.

33
Fig
ure
2-13
. M
igra
ted
sect
ion
of re
proc
esse
d no
rthe
rn p
art o
f pro
file
5 do
wn
to 0
.5 s
econ
ds. L
ocat
ion
of s
ectio
n in
dica
ted
in lo
wer
left
corn
er. D
epth
s of
the
sele
cted
refle
ctor
s ha
ve b
een
proj
ecte
d on
to th
e se
ctio
n. T
he d
epth
s of
thes
e re
flect
ors
cor
resp
ond
to th
e de
pths
whe
re th
e re
flect
ors
wou
ld b
e in
ters
ecte
d if
a bo
reho
le w
ere
to b
e dr
illed
alo
ng th
e pr
ofile
. The
y sh
ould
be
vie
wed
as
near
ly tr
ue d
epth
s.

34
3 VSP data from KFM02A
3.1 BackgroundVerticalseismicprofile(VSP)datawereacquiredintheKFM02Aboreholein2004using10differentsourcepoints(Figure3-1).Thedepthintervalofthesurveywas100mto775mwithareceiverintervalspacingof5m.TheseVSPdatawereprocessedandinterpretedby/Cosmaetal.2005/usingmethodsdevelopedspecificallyformulti-sourceVSPsurveys.Theorientationof both gently and steeply dipping reflectors was obtained.
The main aim of the present study is to investigate the origin of the gently dipping reflections observed on the surface seismic profiles near the KFM02A borehole, in particular reflectors A2, F1andB4.ReflectionsfromthesezonesshouldalsobepresentintheVSPdata.Bytracingthesereflections to where they intersect the borehole, it should be possible to determine the exact depth the reflector is penetrated by the borehole. Changes in rock properties in the bore hole at this depth provide clues to the source of the reflection. This procedure is, in prin ciple, straightforward. However,complicatingfactorsgenerallyariseinacrystallinerockenvironment.Theseinclude:
Figure 3-1. Location of KFM02A VSP source points (cyan circles) and reprocessed profiles 2 and 5 (red lines) in relation to the KFM02A borehole (DS2 green circle). Black dots show midpoint spread along the seismic profiles.

35
1. The surface seismic profile does not cross exactly over the borehole, implying that the reflections observed are not generated where the reflector intersects the borehole.
2. Even if the profile crosses exactly over the borehole, the reflections may come from out-of-the-plane of the profile, implying again that the borehole does not intersect the reflector where the reflections are generated.
3. VSPdataaresinglefoldwhereassurfaceseismicprofilesaremulti-fold,resultinginthatreflectionswillbesignificantlyweakerintheVSPdata.ThismaymakeitdifficulttocorrelatereflectionsonthesurfaceseismicswithreflectionsontheVSP.
4. AnglesofincidencearegenerallyhigherinVSPdata,resultinginthatP-wavesthathavebeenconverted to S-waves, both transmitted and reflected, are more often present in the data. These converted waves may mask P-wave reflections, or be mistaken for P-wave reflections.
3.2 VSP ProcessingVSPprocessinginthisstudyfollowedstandardmethodsdevelopedforimaginggentlydippingreflectors(Table3-1).Figure3-2showsessentiallytherawdataaftersomepreliminaryprocess-ing. The wave-field is dominated by downgoing P- and S-waves, the arrival time of which increaseswithincreasingdepth.Reflectionsfromsub-horizontalzones,whichwillgenerallyhavearrivaltimesthatdecreasewithincreasingdepth,aredifficulttoidentify(Figure3-3).Afterspectralwhiteningandfiltering(Figure3-4),therearemoreindicationsofreflectionsfromsub-horizontalzonesintheVSPdata(Figure3-5).Afterremovalofdown-goingP-andS-waves,reflectedwavesdominatethewave-field(Figures3-6to3-9).However,itisstilldifficulttopickoutdistinctreflectionsasispossibleonthesurfaceseismicdata.Reflectionsfrommoresteeplydipping zones, and even interference between reflections from sub-horizontal zones, mask the potentiallydistinctreflections.TheclearestreflectionobservedintheVSPdataisfoundonSP2andintersectstheboreholeatabout500m(Figure3-8).Itstravel-timecorrespondscloselytothatexpectedofareflectionfromtheF1zone(Figure3-9).Reflectionswithtravel-timescorrespondingtotheF1zonearealsorelativelyclearlyseenonSP1andSP8(Figure3-9),alsothere intersecting the borehole at about 500 m.
Table 3-1. Processing parameters applied to VSP data from KFM02A.
Step Process
1 Read decoded vertical component SEGY data2 Apply –50 ms shift to zero time3 Gain by t0.5
4 Bandpass filter: 40-60-300-450 Hz5 Kill noisy traces6 Infill killed traces: aperture size 77 Spectral whitening: 40-60-200-250 Hz8 Bandpass filter: 60-90-240-360 Hz9 Align first breaks at 5,750 m/s10 Mute at first break11 Remove downgoing Pwaves: 15/1/5,750 (traces/samples/velocity)12 Bandpass filter: 40-60-300-450 Hz13 Remove downgoing Swaves: 15/1/3,300 (traces/samples/velocity)14 Bandpass filter: 40-60-300-450 Hz15 Trace equalization: 0–500 ms16 Convert to two-way travel-time: velocity 5,750 m/s17 2D median filter: enhance sub-horizontal events

36
Fig
ure
3-2.
VSP
dat
a fro
m a
ll 10
sou
rce
poin
ts p
roce
ssed
up
to s
tep
6 in
Tab
le 3
1. H
oriz
onta
l axi
s is
dep
th in
met
res
in b
oreh
ole.

37
Fig
ure
3-3.
VSP
dat
a fro
m a
ll 10
sou
rce
poin
ts p
roce
ssed
up
to s
tep
6 in
Tab
le 3
1 w
ith p
redi
cted
trav
elti
mes
for
refle
ctor
s A2,
B4
and
F1
supe
rim
pose
d. X
axi
s is
dep
th in
met
res.

38
Fig
ure
3-4.
VSP
dat
a fro
m a
ll 10
sou
rce
poin
ts p
roce
ssed
up
to s
tep
10 in
Tab
le 3
1. X
axi
s is
dep
th in
met
res.

39
Fig
ure
3-5.
VSP
dat
a fro
m a
ll 10
sou
rce
poin
ts p
roce
ssed
up
to s
tep
10 in
Tab
le 3
1 w
ith p
redi
cted
trav
elti
mes
for
refle
ctor
s A2,
B4
and
F1
supe
rim
pose
d. X
axi
s is
dep
th in
met
res.

40
Fig
ure
3-6.
VSP
dat
a fro
m a
ll 10
sou
rce
poin
ts p
roce
ssed
up
to s
tep
12 in
Tab
le 3
1. X
axi
s is
dep
th in
met
res.

41
Fig
ure
3-7.
VSP
dat
a fro
m a
ll 10
sou
rce
poin
ts p
roce
ssed
up
to s
tep
12 in
Tab
le 3
1 w
ith p
redi
cted
trav
elti
mes
for
refle
ctor
s A2,
B4
and
F1
supe
rim
pose
d. X
axi
s is
dep
th in
met
res.

42
Fig
ure
3-8.
VSP
dat
a fro
m a
ll 10
sou
rce
poin
ts p
roce
ssed
up
to s
tep
14 in
Tab
le 3
1. X
axi
s is
dep
th in
met
res.

43
Fig
ure
3-9.
VSP
dat
a fro
m a
ll 10
sou
rce
poin
ts p
roce
ssed
up
to s
tep
14 in
Tab
le 3
1 w
ith p
redi
cted
trav
elti
mes
for
refle
ctor
s A2,
B4
and
F1
supe
rim
pose
d. X
axi
s is
dep
th in
met
res.
44
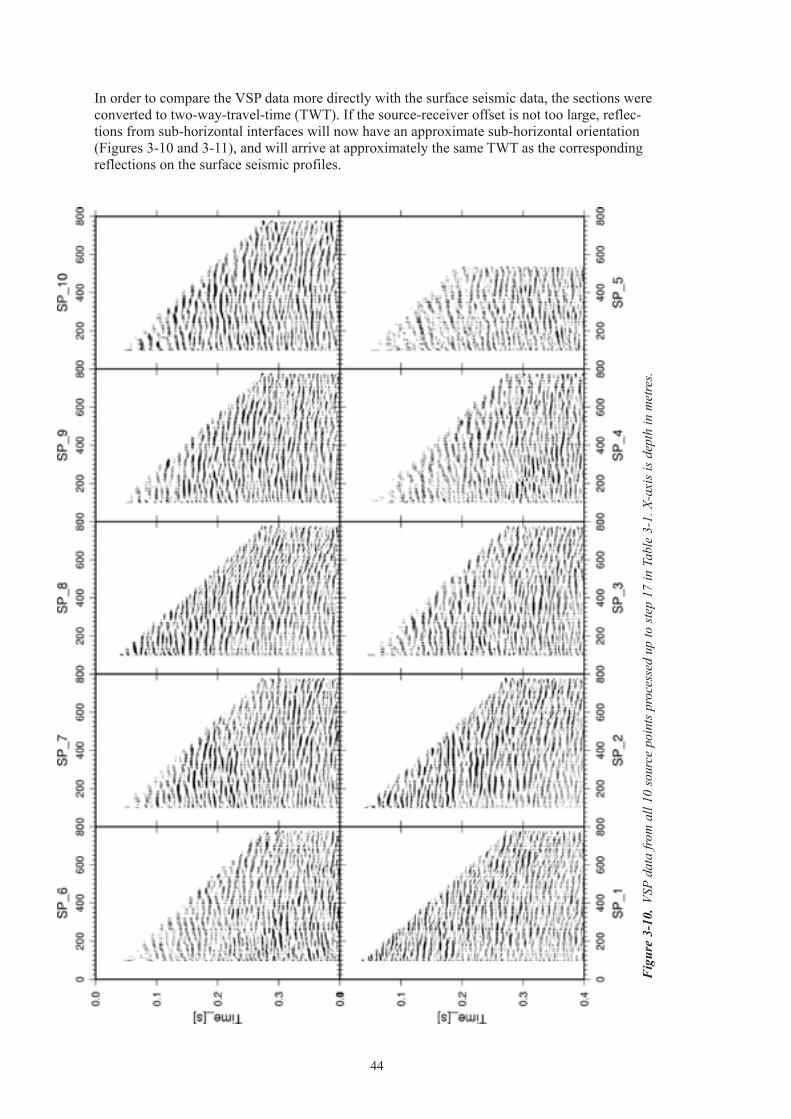
Fig
ure
3-10
. VS
P da
ta fr
om a
ll 10
sou
rce
poin
ts p
roce
ssed
up
to s
tep
17 in
Tab
le 3
1. X
axi
s is
dep
th in
met
res.
InordertocomparetheVSPdatamoredirectlywiththesurfaceseismicdata,thesectionswereconvertedtotwo-way-travel-time(TWT).Ifthesource-receiveroffsetisnottoolarge,reflec-tions from sub-horizontal interfaces will now have an approximate sub-horizontal orientation (Figures3-10and3-11),andwillarriveatapproximatelythesameTWTasthecorrespondingreflections on the surface seismic profiles.

45
Fig
ure
3-11
. VS
P da
ta fr
om a
ll 10
sou
rce
poin
ts p
roce
ssed
up
to s
tep
17 in
Tab
le 3
1 w
ith p
redi
cted
trav
elti
mes
for
refle
ctor
s A2,
B4
and
F1
supe
rim
pose
d. X
axi
s is
dep
th in
met
res.
WhenviewingtheVSPdata,theonsetofareflectioncorrespondstothetopofareflector.Thus,the maximum amplitude of a reflection will not correspond to the top of a reflector. To deter-mine where a reflector intersects the borehole, the location of the onset of the reflection needs to be identified.

46
4 Discussion of results
4.1 Profile 2 and 2bSelected reflections from Stage 1 and Stage 2 have been plotted on top of the new merged section(Figure4-1).Inspectionofthisfigureshowsthatnonewpronouncedreflectionshaveappearedinthereprocessing.ReflectionsfromJ1fallclosetopredictedlocationsstartingonthe south-western end of the profile at 0.75 s and continuing to about CDP 500 at 0.2 s. Above 0.2 s, it is still difficult to trace J1 to the surface. The strong reflectivity along J1 at about 0.3 s at CDP 575 should also be noted. The high amplitude of the reflections may be due to larger quantities of mafic rock.
InordertostudythegeometryofJ1andtheshortSWdippingreflectionsaboveit,themergedsectionhasbeenmigrated(Figure4-2).Themigrationis2Dandassumesthatallreflectionsare from within-the-plane of the profile. This assumption is nearly correct for the J1 reflection, buttheorientationoftheshortSWdippingreflectionsaboveJ1isnotknownanditispossiblethattheyemanatefromout-of-the-planeoftheprofile.Iftheyarefromwithintheplane,thenthe migrated image indicates that they form a cap on the J1 reflector and are part of the J1 structure or zone. A borehole at CDP 450 down to 300 m would then penetrate the J1 structure. Bysimpleprojectiononthetimesection(Figure4-1),J1ispredictedtointersectthesurfaceatabout CDP 300. The migrated image indicates that J1 steepens as it approaches the surface and projects to about CDP 400, although it cannot be traced closer than 200 m from the surface. Thisiswithinazoneofstronglyfoliatedorbandedrockonthegeologicalmap(Figure2-1),suggesting that there may be some connection between the reflector and this banded rock.
Althoughnotveryreliable,itshouldbenotedthattherearetwo,steeplySWdipping,weakreflectionsonthemigratedsection(Figure4-2)thatprojecttothesurfaceclosetotheEckar-fjärdendeformationzone.Thesemaybeanindicationofitsorientationandwouldexplainwhyit does not offset the J1 reflector directly below it.
4.2 Interpretation of reflectivity in KFM02ASeismic reflections arise when the down-going wave encounters changes in the velocity and/or density of the rock, provided that these changes occur over a large enough area and are rea son-ablycontinuous.Iftheboundarybetweengeologicalunitsislimitedornotsufficientlycon-tin uous, then the down-going wave will be scattered and little energy will be reflected back, even if the velocity and density contrasts are large. Signs of scattered waves may be found in dif fraction patterns in the seismic data.
Inordertoidentifywheresub-horizontalreflectionsoriginateintheborehole,theVSPdatafromselectedsourcepointsthatweretransformedtotwo-way-time(Figure3-10)havebeendepth-convertedusingavelocityof5,750m/s.Thesedepth-convertedVSPsectionshavebeenplotted alongside the migrated surface seismic and the sonic and density logs from KFM02A (Figures4-3to4-6).Itneedstobekeptinmindthattherearetwointervalswherethesonicvelocityhasnotbeenproperlycalculated,theseareat350–380mandbelow900m.Thefullwaveformsonicdisplayshowsnoindicationofsuchlowvelocitiesovertheseintervals.Intheinterval250–300m(correspondingtotheporousgranitedescribedby/Mölleratal.2003/),thesonicvelocityisalsoextremelylow(aslowas3.5km/s),butherethefullwaveformsonicshows clear delays, indicating that these velocities have been correctly determined. The full waveformsonicishighlyirregularintheinterval415–520m,indicatingthisintervaltobesig-nificantlyfracturedandaltered.Itshouldalsobenotedthatthedepthsofthereflectorsindicatedin the surface seismics in Figures 4-3 to 4-6 refer to depth below the wellhead of the KFM02A borehole(location:1633182E,6698712N).Theydifferfromtheintersectiondepthsreportedin /Juhlin and Bergman 2004/, where the planned location of the KFM02A borehole was used (location:1633200E,6698670N),nottheactuallocation.

47
Figure 4-1. Stacked section of merged profile 2 down to 1.3 seconds with selected reflections marked. Location of section indicated in lower left corner.

48
Figure 4-2. Migrated section of merged profile 2 down to 1.5 km. Location of section indicated in lower left corner. Migration assumes all reflections originate from withintheplane of the profile.
TheclearestreflectionobservedontheVSPdataisfoundonSP2andintersectstheboreholeatabout500m(Figure4-3).ItsonsettimeagreeswellwiththatpredictedfortheF1reflectorand this reflector is also clearly imaged on profile 5 near the KFM02A borehole at this depth. Adepthof500misclosetothebottomofthehighlyfracturedinterval415–520m/Carlstenet al. 2004/, suggesting that the F1 reflection originates from the base of this interval. Thus, it is the contrast between the fractured rock above and the more intact rock below that generates thestrongF1reflectionobservedonthesurfaceseismics.ReflectionsthatcanbecorrelatedtotheF1reflector,althoughnotasclearlyasonSP2,arealsoobservedonVSPdatafromSP1andSP8(Figures4-4and4-5),alsointersectingtheboreholeatabout500m.SignsoftheF1reflectionareseenontheVSPdatafromtheothersourcepoints(Figure3-11),buteitherthepredicted onset time is not sub-horizontal, or the arrivals from the A2 reflector are predicted to interferewiththeF1reflection,andtherebymaskoneanother.SP1,SP2andSP8arethosesource points closest to the borehole, and have the best geometry for mapping the F1 reflector closetotheborehole.ItshouldalsobenotedthattheF1reflectionisclearestnorthofthebore-hole(Figure4-7),whichsuggeststhatSP2shouldcontainthebestimageofthereflection,inagreement with observations.
ReflectionsthatcanbecorrelatedtotheA2reflectorarealsoobservedonSP1,SP2andSP8(Figures4-3and4-5).Theonsetsofthesereflectionsdonotmatchthepredictedonsetsbased

49
on the surface seismic data as well as the F1 onsets do. This can be explained by the orienta-tion of the A2 reflector being somewhat different near the borehole than predicted from the surface seismic data. The correlated reflections are also not as clear as the ones correlated to the F1 reflector. This is to be expected from the surface seismic data, where the F1 reflection is strongerandmoreclearlyimagedbelowtheKFM02Aboreholeonprofiles2and5(Figures2-6and2-11).TheonsetoftheseapparentA2reflectionsontheVSPdataintersectstheboreholeat about 410 m. This is about 30 m shallower than predicted from the surface seismic data, but coincidescloselywiththetopoftheheavilyfracturedintervalat415–520m/Carlstenetal.2004/.InspectionoftheselectionoftheA2reflectiononthesurfaceseismicdata(Figure4-7)shows that it could indeed intersect the borehole somewhat shallower than what is predicted based on the selection procedure.
The depth to reflector B4 is about 950 m directly below the KFM02A wellhead. Since the bore-holedipsat85°tothenorth,thepredicteddepthofpenetrationisatabout930m,some50moffsetfromthewellheadandcorrespondingtoaboutCDP185onprofile5.Itisexpectedtobemostclearlyimagedonsourcepointslyingsouthoftheborehole(Figure4-7).Clearreflec-tionsfromVSPdataonSP7canbecorrelatedwiththeB4reflector(Figure4-6),althoughsignsofitareobservedonallsourcepointssouthoftheborehole.SincetheVSPsurveydidnotextend down deeper than 775 m, the exact depth at which it penetrates the borehole cannot be determined.However,thereflectionprojectsintotheboreholeatabout920m,closetothedepthexpected based on the surface seismic data. This is in the middle of a high density, tonalitic metagranitoid /Carlsten et al. 2004/, suggesting that it is the density contrast between this unit and the surrounding lower density granitic rock that is generating the B4 reflection.
This interpretation requires that this high density rock is continuous, with approximately the same thickness laterally away from the borehole for several hundreds of metres, if not more. Note that the density log shows a rather gradual transition between the surrounding rock and the tonalitic rock, indicating the boundary may not be sharp. There are also a number of fracture zones close to the B4 reflector, the uppermost one is at about 900 m and is characterized by a clear 10 m thick low velocity anomaly signature. This low velocity zone could also contribute to thereflectivity.Giventhatthereflectivityappearstostartshallowerthan900mattheboreholelocation, it is possible that it is a combination of this fracture zone and the high density rock that is generating the reflectivity associated with the B4 reflection that is observed on the surface seismic data.
The A3 reflector is projected to intersect the borehole at about 115 m, too shallow to be imaged bytheVSPdata.However,thefracturezoneandunderlyingamphiboliteat120–130marecandidates for this reflector. The amphibolite is quite thin and its contribution to the reflection coefficient from the density contrast is less than that from the velocity contrast of the fracture zone.Inaddition,otheramphibolites,inparticularthoseatabout800mand850mdonotgenerate any clear reflections. Thus, it is possible that the A3 reflection is generated by the low velocityzoneat120–130m.
Apartfromtheporousgraniteat250–300m,theonlyotherprominentlowvelocityzonethat does not have a corresponding reflection identified on the surface seismic data is the one 160–180m.ThiszonealsocorrespondstotheA3reflector.Sincetheboreholeisoffsetfromthe profiles by about 100 m, it is not possible to draw any definite conclusions about this zone.However,anothermorespeculativepossibilityexists.Thezoneat160–180mcouldcorrespond to the more steeply dipping reflection seen on profile 2 and tentatively referred to as J4(Figure4-8).ThisreflectionwouldhavethesamestrikeastheprominentJ1reflectiontothesouthanddipatabout40°tothesouth-west.TheearlierinterpretedH1reflectionmayactuallyhavebeenmistakenforthisevent.IftheJ4reflectionhastheassumedorientation,itoverlapstheA3reflectiononprofile5(Figure4-7),makingitdifficulttoensureareliableorientation.A migrated image of profile 2 shows that the potential J4 zone could limit the F1 and A2 reflec-torstowardsthesouth-west(Figure4-9).ItshouldalsobenotedthatonlytheJ4reflectionismigrated reasonably properly on the section. The other reflections have a significant out-of-the-plane of the profile component.

50
Figure 4-3. Density and sonic logs from the KFM02A borehole compared to the migrated seismic section along profile 5 and SP 2 from the VSP. Pwave sonic velocity is plotted on top of the full waveform sonic seismograms from the near receiver. Shaded portions in the FZ core panel indicate where the major deformation zones in the core have been identified /Carlsten et al. 2004/. Reflection coefficients (RC) have been calculated using only the sonic and only the density log, to allow a comparison of the importance of the contrasts in these two parameters. They are plotted on a scale ranging from –0.1 to 0.1. Borehole was cased to 100 m.

51
Figure 4-4. Density and sonic logs from the KFM02A borehole compared to the migrated seismic section along profile 5 and SP 1 from the VSP. Pwave sonic velocity is plotted on top of the full waveform sonic seismograms from the near receiver. Shaded portions in the FZ core panel indicate where the major deformation zones in the core have been identified /Carlsten et al. 2004/. Reflection coefficients (RC) have been calculated using only the sonic and only the density log, to allow a comparison of the importance of the contrasts in these two parameters. They are plotted on a scale ranging from –0.1 to 0.1. Borehole was cased to 100 m.

52
Figure 4-5. Density and sonic logs from the KFM02A borehole compared to the migrated seismic section along profile 5 and SP 8 from the VSP. Pwave sonic velocity is plotted on top of the full waveform sonic seismograms from the near receiver. Shaded portions in the FZ core panel indicate where the major deformation zones in the core have been identified /Carlsten et al. 2004/. Reflection coefficients (RC) have been calculated using only the sonic and only the density log, to allow a comparison of the importance of the contrasts in these two parameters. They are plotted on a scale ranging from –0.1 to 0.1. Borehole was cased to 100 m.

53
Figure 4-6. Density and sonic logs from the KFM02A borehole compared to the migrated seismic section along profile 5 and SP 7 from the VSP. Pwave sonic velocity is plotted on top of the full waveform sonic seismograms from the near receiver. Shaded portions in the FZ core panel indicate where the major deformation zones in the core have been identified /Carlsten et al. 2004/. Reflection coefficients (RC) have been calculated using only the sonic and only the density log, to allow a comparison of the importance of the contrasts in these two parameters. They are plotted on a scale ranging from –0.1 to 0.1. Borehole was cased to 100 m.

54
Figure 4-7. Parts of profiles 2 and 5 viewed from the south (left) and the north (right). Predicted reflection onset times based on /Juhlin and Bergman 2004/ are marked with lines.

55
Figure 4-8. Stacked section of merged profile 2 down to 0.5 seconds with selected reflections marked. Location of section indicated in lower left corner.

56
4.3 Porous graniteAn interesting discovery in the KFM02A borehole was the long interval between 250 m and 300mcontainingporous(vuggy)graniteorepisyenite/Mölleretal.2003/.Thisintervalhasanomalouslylowvelocitiesanddensities.Ifitwerelaterallycontinuousitwouldgenerateverystrongreflections.However,noclearresponseinthesurfaceseismicdataisseenfromthisbody,suggestingthatitislimitedinitslateraldimensions.IsitobservedontheVSPdata?
TheclearestindicationofthisbodyontheVSPisfoundinthevariationsinarrivaltimeofthedirectS-waveatadepthofabout250montheunprocessedVSPdata(Figure3-2).Noclearreflections appear to be generated by it, suggesting that it is limited laterally and that it has an irregular geometry. SP 6 shows the greatest variations in the direct S-wave arrival in the interval 150 m to 300 m at about 0.3 s. Since the body intersects the borehole between 250 m and 300 m, this suggests that the body extends towards the surface on the south side of the borehole towards SP 6 and does not extend much deeper towards the north. Diffraction patterns with anapexatabout300mdeptharealsoseenindatafromsomeoftheunprocessedVSPsourcepoints,inparticularSP2(Figure3-2).ThesediffractionshaveanS-wavevelocity,suggestingthey originate from forward scattering at the base of the body on the north side of the borehole.
Figure 4-9. Migrated section of merged profile 2 near the KFM02A borehole down to 1.5 km. Location of section indicated in lower left corner. Migration assumes all reflections originate from withintheplane of the profile.

57
4.4 Northern part of profile 5 – reflectors F1, F2, F3 and A8The orientation of F1 is well constrained from crossing profile 2, while the orientations of F2 andF3aremoreuncertain.InorientingF2andF3,astrikesimilartoF1hasbeenassumedandthedipadjustedtomatchthereflectiontravel-times.Inspectionofthemigratedsection(Figure2-13)showsthatthesetFreflectionsappeartoformanundulatingsurfacethatmaycontainoffsetsatsomelocations.ThissurfaceappearstoendataboutCDP375(6699400N),where it either terminates or becomes more diffuse, perhaps merging into the B7 reflection zone. Towardsthesouth,thesetFreflectionsextendtoabout6698500N,consistentwithobservationson profile 2.
Giventheconstraintsfromshotgathersandthestackedsection,ithasbeenpossibletogiveanestimateoftheorientationoftheA8reflector(Table4-1)andlocatewhereitprojectstothesurface(Figure4-10).ItpossiblycutstheF1reflector(Figure2-13),andperhapsevenextendsfurtherdownthanmodelled.ItshouldbenotedthattheA8reflectionisnotobservedoncross-ingprofile1.Itprojectsintoprofile1atveryearlytimeswhereprofile1crossesprofile5andit
Figure 4-10. Location of boreholes at drill site 6, the A8 reflector and profile1 (running WE). A8 is seen to intersect the surface close to receiver 5,465 (cyan circle) and to project up to the surface close to CDP 520 on the reprocessed northern part of profile 5. A8 cuts profile 1 at too shallow a depth to be imaged near the crossing point of the profiles. Black dots show midpoint spread along the seismic profiles.

58
wouldnotbeexpectedtobeseenthere.However,itisalsonotseenfurtherwestalongprofile1,whereitwouldbeexpectedtobeobservedat100–200ms.Therefore,itslateralextenttowardsthe west appears to be very limited.
As noted in /Juhlin et al. 2002/, many of the reflections appear to die out towards the north on profile 5, particularly the set A and set B reflections. The set F reflections also follow this pat-tern.BoththeB7andA8reflections,whichlieinthenorthernmostpartoftheprofile,arequitediffuse here. This may be due to the reflectors that generate them being “broken up” and not as laterally homogeneous as further towards the south-east.
4.5 Concluding remarks4.5.1 VSPIntegrationoftheVSPdatawiththesurfaceseismicdatahasprovenusefulfor:
1. Obtaining a realistic velocity profile that can be used for depth conversion of the seismic data.
2. IdentificationofwheretheF1andA2reflectorsintersecttheborehole.TheF1reflectionoriginatesfromnearthebaseoftheheavilyfracturedintervalat415–520mandtheA2reflection from near the top of this fractured interval.
3. Confirmation that the porous granite is probably limited in its lateral extent.
4. EventhoughtheB4reflectorwasnotintersectedbytheVSPsurvey,itislikelythatitintersects the borehole at about 920 m, in good agreement with the surface seismics. A thick section of high density tonalitic rock is present at this depth, but also a 10 m thick fracture zone. Both probably contribute to the reflectivity of the B4 reflector.
ItissurprisingthatfirstarrivalsfromallsourcepointstoallreceiverpointsintheKFM02Aborehole, and also in the KFM01A borehole /Cosma et al. 2005/, indicate a nearly constant velocitymediaof5,750m/s,irrespectiveofazimuthordepth.Giventhevariationsinfracturingand the metamorphic grade of the rock, one would expect some azimuthal or depth dependence. Perhaps the lack of velocity variations is due to the high stresses in the bedrock. Alternatively, itcouldbeduetosomepreprocessingthathasbeenappliedtotheVSPdatathathasnotbeenmentioned in the reports.
OneprobleminusingtheVSPdataisthelowersignaltonoiseratiocomparedtothesurfaceseismicdata.ThisisduetotheVSPdatabeingsinglefold.Itcouldbeusefulinthefuturetocarryoutmovingsourceprofiling(MSP).ThisallowsstackingofVSPdatatoincreasethesignal to noise ratio. Such profiles would focus on certain depths so as to more clearly map the lateral extent of certain reflectors.
Table 4-1. Orientation of the new reflectors discussed in this report. F1 is also included from earlier reports. Distance refers to distance from the arbitrary origin (6699 km N, 1633 km W) to the closest point on the reflector at the surface. Depth refers to depth below the surface at this origin. Strike is measured clockwise from north. Rank indicates how sure the observation of each reflection is on profiles that the reflection is observed on; 1 – definite, 2- probable, 3-possible.
Reflector Strike Dip Distance (m) Depth (m) Rank Profiles observed on
F1 20 20 400 1 2.5F2 20 5 420 2 5F3 20 5 500 2 5A8 80 35 1,150 2 5

59
4.5.2 Profiles 2 and 2bReprocessingofprofiles2and2basoneprofileproducedaseismicsectionthatwassuperiortosimply merging of the two previously processed profiles. This was partly due to taking advan-tage of the overlapping data, but also to using slightly different processing parameters. A major goalfortheprocessingwastodetermineiftheJ1reflectorcanbetracedtothesurface.Inspiteof detailed velocity analysis and inspection of shot gathers, it was not possible to trace the reflectorshallowerthanabout200mfromthesurface.Inthereprocessedasection,areflection(J4)withasimilarapparentdipastheJ1reflectionandpossiblyasimilarstrikewasobserved.Ifcorrectlyoriented,itwouldintersectboreholeKFM02Aatabout150m,inafracturezone.However,thisdepthalsocorrespondsapproximatelytothepositionoftheA3reflector.TheJ4orientationishighlyspeculativeandhasnotbeenconfirmed.However,ifcorrect,theJ4reflec-tor could limit the F1 and A2 reflectors to the south-west.
4.5.3 Profile 5Aninterestingpointtonoteonthemigratedsectionofprofile5(Figures2-10and2-11)isthatthe A3, A2 and F1 reflectors appear to be faulted with offsets on the order of 10 m to 20 m. F1 alsoappearstobefaultedonthemigratedsectionofprofile2(Figure4-9).Ifreal,itmaybepossible to use 3D reflection seismics to map sub-vertical faults in this area. On the reprocessed northernpartofprofile5,apreviouslyunidentifiedreflection,A8,isindicated.Itappearstohave a strike and dip similar to the previously identified set A reflections.
4.5.4 Sonic velocity logSonic velocities were not calculated properly along two sections of borehole KFM02A. Plotting the sonic waveform data together with the sonic velocity provides a method of control for determining where the sonic log is reliable. The waveform data should be reprocessed and a dependable sonic log be archived in the SKB database, rather than the one that is presently archived.
4.6 Possible future studiesApart from carrying out a 3D surface seismic survey over the KFM02A borehole, which is probably necessary to fully understand the geometrical relationships between the reflectors and the observations in the borehole and on the surface, there are several smaller studies that could be made:
1. Due to the crooked line acquisition geometry, there is considerable spread in the mid-points fromprofiles2and5neartheKFM02Aborehole(Figure3-1).Thisimpliesthattherealreadyissome3Dsub-surfacecoverageinthearea.ItmaybepossibletomaptheA3,A2 and F1 reflections to limited extent in 3D in this area and tie borehole observations to observations on the CDP stacking lines.
2. A2Dveryhighresolution(1mor2mstationspacing)surveyoverboreholeKFM02AandrunningintheSW-NEdirectionmaydetecttheporousgraniteandallowitslateraldimensions to be estimated. Such a survey would also better tie the borehole observation to the profile 5.
3. Moving source profiling to better image the F1 and A2 reflectors. This could be carried out in conjunction with point 2 above, with simultaneously recording on the surface and in the borehole simultaneously.

60
5 References
Carlsten S, Petersson J, Stephens M, Mattsson H, Gustafsson J, 2004.Geologicalsingle-holeinterpretationofKFM02AandHFM04–05(DS2).Forsmarksiteinvestigation.SKBP-04-117,SvenskKärnbränslehanteringAB.
Cosma C, Enescu N, Balu L, 2005.VerticalseismicprofilingfromtheboreholesKFM01AandKFM02A.Forsmarksiteinvestigation.SKBP-05-168,SvenskKärnbränslehanteringAB.
Juhlin C, Bergman B, 2004.ReflectionseismicsintheForsmarkarea.UpdatedinterpretationofStage1(previousreportR-02-43).Updatedestimateofbedrocktopography(previousreportP-04-99).SKBP-04-158,SvenskKärnbränslehanteringAB.
Juhlin C, Bergman B, Palm H, 2002.ReflectionseismicstudiesintheForsmarkareaStage1.SKBR-02-43,SvenskKärnbränslehanteringAB.
Juhlin C, Palm H, 2005.ReflectionseismicstudiesintheForsmarkarea,2004Stage2.SKBR-05-42,SvenskKärnbränslehanteringAB.
Möller C, Snäll S, Stephens M B, 2003. Dissolution of quartz, vug formation and new grain growth associated with post-metamorphic hydrothermal alteration in KFM02A. Forsmark site investigation.SKBP-03-77,SvenskKärnbränslehanteringAB.

61
Correlation of 2D surface seismic, vertical seismic profile (VSP), and geological and sonic data in boreholes KFM01A and KFM02A, Forsmark: Background analysis
Nicoleta Enescu, Calin Cosma
Vibrometric AB
Contents 1 Aims of the study 62
2 Background data 62
3 Refined interpretation of the VSP data, in relation to 2D seismic profiles 1, 2, 4 and 5 and the single-hole interpretations for KFM01A and KFM02A 64
3.1 Borehole KFM01A, and 2D profiles 1 and 4 78
3.2 Borehole KFM02A, and 2D profiles 2 and 5 81
3.3 Combined interpretation of reflectors from boreholes KFM01A and KFM02A together with 2D profiles 1, 2, 4 and 5, and some geological features presented in geological model, stage 2.1 84
4 References 89
Appendix 1 Parameters of reflector elements interpreted from the VSP and 2D seismic data 90

62
1 Aims of the study
The purpose of this work was to:
• Refinetheverticalseismicprofile(VSP)resultsfromboreholesKFM01AandKFM02AatForsmark /Cosma et al. 2005/.
• Attempttocorrelatetheseresultswiththe2Dsurfaceseismicaswellasthegeologicalandsonic wave data in each borehole, as inferred from the respective single-hole interpretations /Carlsten et al. 2004ab/.
TheworkinvolvedananalysisandanintegrationoftheVSPdatawiththe2Dsurfaceseismicand geological and sonic wave data from the two boreholes. The results of the correlation work are presented in tabular format in this report. They form a basis for a broader evaluation that is presented in section 3.10.3 in the main stage 2.2 geological report /Stephens et al. 2007/.
2 Background data
Inthisstudy,VSPmeasurementsandinterpretedresultsfromboreholesKFM01AandKFM02Aat Forsmark /Cosma et al. 2005/ were used together with depth migrated sections of 2D reflectionseismicprofilesalonglines1,2,4and5(Figure2-1;see/Juhlinetal.2002,JuhlinandBergman2004/)andthesingle-holeinterpretationsofgeologicalandgeophysicaldatainthesetwoboreholesintheformofWell-Cadplots/Carlstenetal.2004ab/.Fullwavesonicdatafrom the two boreholes were also evaluated, but were not used to aid the refined interpretation produced by this study.
Profile 5 was projected along the line of profile 5b, to produce one profile along a straight line. Furthermore, profiles 2 and 2b were merged into one longer profile. The resulting geometry is shown in Figure 2-2.

63
Figure 2-2. Location of profiles 1, 2, 4 and 5 for which the 2D depth migrated profiles have been used in this interpretation, boreholes KFM01A and KFM02A, and the VSP shot points. View from top.
Figure 2-1. Location of the measured 2D seismic reflection profiles, boreholes KFM01A and KFM02A, and the VSP shot points. View from top.

64
3 Refined interpretation of the VSP data, in relation to 2D seismic profiles 1, 2, 4 and 5 and the single-hole interpretations for KFM01A and KFM02A
ThefiguresbelowshowtheinterpretedreflectorsalongtheVSPprofilesfromKFM01A(Figures3-1to3-4)andKFM02A(Figures3-5to3-8),andalongthe2Ddepthmigratedprofilesalonglines1,2,4and5(Figures3-9to3-12).Averagevaluesfortheparametersthatdetermineeachinterpretedreflector(49)arepresentedinTable3-1andtheresultsarevisualizedinFigures3-13to3-19.AnaveragesetofparameterswerecomputedfortheVSPprofilesmeasured in the same borehole, generating in this way only one set of reflector parameter values for each borehole. The detailed list of parameters is provided in Appendix 1.
Figure 3-1. VSP profile from SP01 close to KFM01A, with interpreted reflector events.
Figure 3-2. VSP profile from SP02 close to KFM01A, with interpreted reflector events.
Figure 3-3. VSP profile from SP03 close to KFM01A, with interpreted reflector events.

65
Figure 3-4. VSP profile from SP05 close to KFM01A, with interpreted reflector events.
Figure 3-6. VSP profile from SP02 close to KFM02A, with interpreted reflector events.
Figure 3-5. VSP profile from SP01 close to KFM02A, with interpreted reflector events.
Figure 3-7. VSP profile from SP07 close to KFM02A, with interpreted reflector events.
66
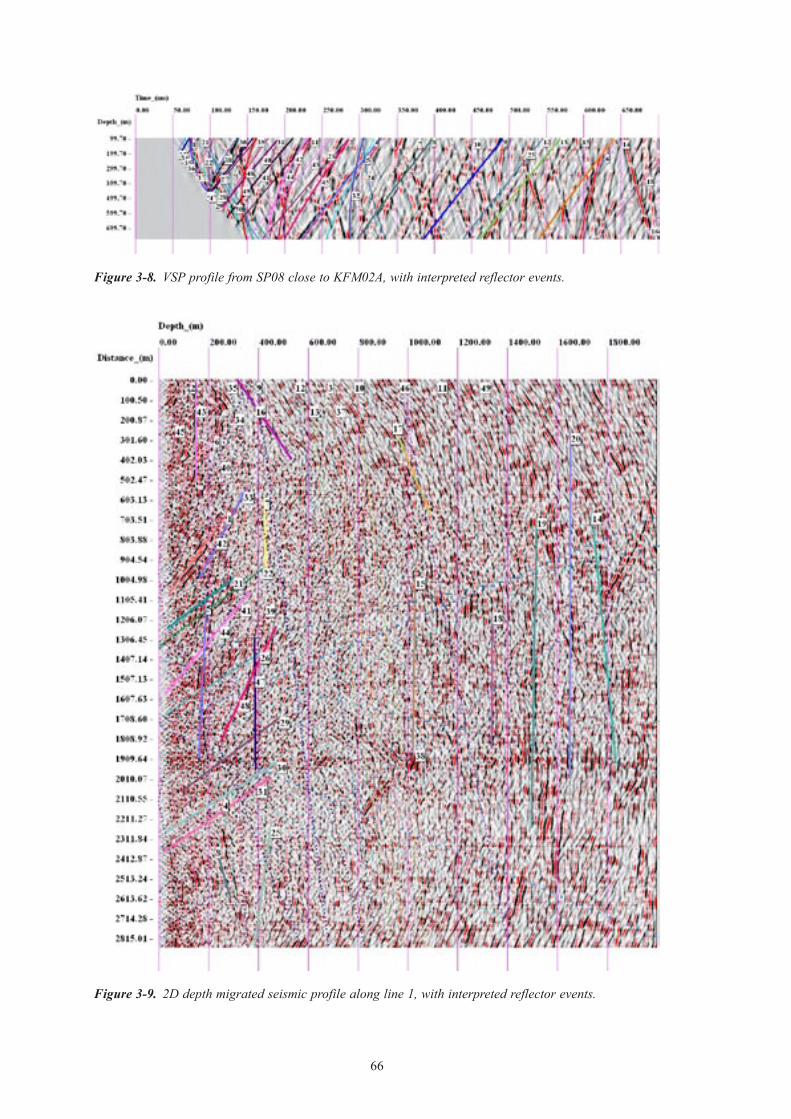
Figure 3-8. VSP profile from SP08 close to KFM02A, with interpreted reflector events.
Figure 3-9. 2D depth migrated seismic profile along line 1, with interpreted reflector events.

67
Figure 3-10. 2D depth migrated seismic profile along line 2, with interpreted reflector events.

68
Figure 3-11. 2D depth migrated seismic profile along line 4, with interpreted reflector events.

69
Figure 3-12. 2D depth migrated seismic profile along line 5, with interpreted reflector events.
Table 3-1. Average parameters of the VSP reflectors interpreted from boreholes KFM01A and KFM02A. For the VSP profiles, Depth (m) is calculated from the top of the hole along an imaginary line along the hole. Similarly, for the 2D profiles, Distance (m) is calculated from the first receiver in the profile, along an imaginary line along the receiver line. The points at Depth (Distance) along these lines are the intersection points between the reflector (or its extension) and the line. The Depth (Distance) values are significant for reflectors physically intersecting the boreholes. The Dip (°) is calculated from horizontal. The Azimuth (°) is calculated from North. Dip Direction (°) is Azimuth +180° (modulo 360°). The coordinates of the Crux point are calculated with respect to a common origin (99000.0 33000.0 0.0). All coordinates are given in a reduced form. These translate to site coordinates by 6600000 on the Northing and 1600000 on the Easting. The Profile column specifies the 2D profile or borehole where the reflector parameters were estimated.
VSP reflector no.
Depth/ Distance (m)
Dip (°)
Dip Dir (°)
Azimuth (°)
Northing Crux (m)
Easting Crux (m)
Elev Crux (m)
Profile
1 1,150.0 40.0 213.0 33.0 98860.2 32909.2 198.7 P1_depth1 1,282.9 40.0 213.0 33.0 98860.2 32909.2 198.7 P4_depth1 385.0 35.5 171.6 351.6 98741.0 33038.5 367.6 P5_depth2 16,443.2 15.0 121.0 301.0 99106.7 32822.4 –773.2 P2_depth2 3,131.4 16.0 142.0 322.0 99192.1 32849.9 –850.3 P4_depth2 5,152.8 14.0 124.0 304.0 99105.2 32844.0 –754.8 P5_depth2 380.2 15.0 121.0 301.0 99106.7 32822.4 –773.2 KFM01A2 850.0 18.0 125.0 305.0 99128.5 32816.4 –689.7 KFM02A

70
VSP reflector no.
Depth/ Distance (m)
Dip (°)
Dip Dir (°)
Azimuth (°)
Northing Crux (m)
Easting Crux (m)
Elev Crux (m)
Profile
3 –10,238.0 35.1 150.8 330.8 99806.6 32549.4 –1,312.8 P2_depth3 4,042.7 35.1 150.8 330.8 99806.6 32549.4 –1,312.8 P5_depth3 1,005.8 35.1 150.8 330.8 99806.6 32549.4 –1,312.8 KFM01A3 2,100.0 35.1 150.8 330.8 99806.6 32549.4 –1,312.8 KFM02A4 –122.2 54.0 170.0 350.0 99447.4 32921.1 –330.1 KFM01A4 1,300.0 53.0 170.0 350.0 99457.8 32919.3 –350.3 KFM02A5 6,145.6 27.5 166.5 346.5 99298.4 32928.4 –589.6 P1_depth5 2,064.7 28.0 170.0 350.0 99357.6 32936.9 –682.9 P4_depth5 2,881.7 27.0 172.0 352.0 99334.3 32953.0 –662.6 P5_depth5 434.6 28.0 170.0 350.0 99357.6 32936.9 –682.9 KFM01A5 1,025.0 29.0 170.0 350.0 99363.4 32935.9 –665.7 KFM02A6 16,888.4 50.0 124.8 304.8 99715.3 31968.9 –1,053.0 P2_depth6 3,691.1 50.2 124.5 304.5 99672.6 32021.7 –987.4 P5_depth6 420.0 49.8 125.2 305.2 99679.3 32035.4 –998.3 KFM01A6 2,496.4 49.8 125.2 305.2 99679.3 32035.4 –998.3 KFM02A7 –33,172.7 25.0 160.0 340.0 99371.6 32864.8 –847.9 P1_depth7 –5,240.6 25.0 160.0 340.0 99371.6 32864.8 –847.9 P2_depth7 3,432.1 25.0 160.0 340.0 99371.6 32864.8 –847.9 P5_depth7 524.0 25.0 160.0 340.0 99371.6 32864.8 –847.9 KFM01A7 1,162.6 35.0 155.0 335.0 99414.9 32806.5 –653.9 KFM02A8 1,318.4 36.0 140.0 320.0 99406.0 32659.4 –729.4 P1_depth8 –17,180.4 36.0 140.0 320.0 99406.0 32659.4 –729.4 P2_depth8 1,300.8 36.0 140.0 320.0 99406.0 32659.4 –729.4 P4_depth8 2,867.5 36.0 140.0 320.0 99406.0 32659.4 –729.4 P5_depth8 70.5 36.0 140.0 320.0 99406.0 32659.4 –729.4 KFM01A8 1,290.0 36.0 140.0 320.0 99406.0 32659.4 –729.4 KFM02A9 –9,484.1 30.0 150.0 330.0 99526.0 32696.3 –1,052.0 P2_depth9 3,687.0 30.0 150.0 330.0 99526.0 32696.3 –1,052.0 P5_depth9 636.0 30.0 150.0 330.0 99526.0 32696.3 –1,052.0 KFM01A9 1,541.7 30.0 150.0 330.0 99526.0 32696.3 –1,052.0 KFM02A10 –322,206.0 12.9 134.8 314.8 99200.6 32798.0 –1,240.0 P2_depth10 7,427.0 12.9 134.8 314.8 99200.6 32798.0 –1,240.0 P5_depth10 940.4 23.0 135.0 315.0 99413.5 32586.5 –1,377.6 KFM01A10 1,366.6 23.0 134.8 314.8 99320.7 32677.2 –1,072.0 KFM02A11 2,010.0 52.0 199.0 19.0 99359.3 33123.7 –296.9 P4_depth11 1,800.0 53.0 198.0 18.0 99317.7 33103.2 –251.7 P5_depth11 775.0 53.1 198.9 18.9 99355.7 33121.7 –281.8 KFM01A11 1,060.0 54.0 198.0 18.0 99347.2 33112.8 –265.3 KFM02A12 –12,755.6 28.8 147.9 327.9 99562.6 32646.4 –1,207.6 P2_depth12 4,140.7 28.8 147.9 327.9 99562.6 32646.4 –1,207.6 P5_depth12 808.0 28.8 147.9 327.9 99562.6 32646.4 –1,207.6 KFM01A12 1,698.3 28.8 147.9 327.9 99562.6 32646.4 –1,207.6 KFM02A13 –14,105.1 29.0 147.0 327.0 99586.4 32619.2 –1,261.4 P2_depth13 4,267.8 29.0 147.0 327.0 99586.4 32619.2 –1,261.4 P5_depth13 865.0 29.0 147.0 327.0 99586.4 32619.2 –1,261.4 KFM01A13 1,771.0 29.0 147.0 327.0 99586.4 32619.2 –1,261.4 KFM02A14 –22,300.0 6.0 28.0 208.0 98834.1 32911.8 –1,787.6 P1_depth

71
VSP reflector no.
Depth/ Distance (m)
Dip (°)
Dip Dir (°)
Azimuth (°)
Northing Crux (m)
Easting Crux (m)
Elev Crux (m)
Profile
14 18,847.9 6.3 30.1 210.1 98816.3 32893.7 –1,933.9 P2_depth14 –24,340.9 6.3 30.1 210.1 98816.3 32893.7 –1,933.9 P4_depth14 –28,500.0 6.3 30.1 210.1 98816.3 32893.7 –1,933.9 P5_depth15 89,382.4 30.0 163.1 343.1 99758.9 32768.7 –1,374.2 P1_depth15 –6,475.7 30.0 163.0 343.0 99740.6 32773.6 –1,341.4 P2_depth15 3,330.0 30.0 163.0 343.0 99740.6 32773.6 –1,341.4 P4_depth15 4,322.2 30.0 163.0 343.0 99740.6 32773.6 –1,341.4 P5_depth15 1,161.9 30.0 163.0 343.0 99740.6 32773.6 –1,341.4 KFM01A15 1,920.1 31.0 161.0 341.0 99745.1 32743.5 –1,311.4 KFM02A16 –582.4 40.0 113.7 293.7 99519.2 31817.7 –1,537.4 P1_depth16 3,389.5 40.0 113.7 293.7 99519.2 31817.7 –1,537.4 P4_depth16 1,090.0 40.0 113.7 293.7 99519.2 31817.7 –1,537.4 KFM01A16 2,659.5 40.0 113.7 293.7 99519.2 31817.7 –1,537.4 KFM02A17 –2,686.3 42.1 134.3 314.3 100081.0 31892.1 –1,713.7 P1_depth17 3,392.6 42.1 134.3 314.3 100081.0 31892.1 –1,713.7 P4_depth17 1,551.0 42.1 134.3 314.3 100081.0 31892.1 –1,713.7 KFM01A18 152,120.0 32.0 162.7 342.7 99980.5 32694.1 –1,643.8 P1_depth18 3,881.9 31.8 162.7 342.7 99966.9 32698.4 –1,636.7 P4_depth18 4,883.5 30.0 162.7 342.7 99872.9 32727.7 –1,583.8 P5_depth18 1,518.9 31.0 162.7 342.7 99927.3 32710.7 –1,615.4 KFM01A18 2,320.7 31.0 162.7 342.7 99927.3 32710.7 –1,615.4 KFM02A19 110,795.0 40.8 162.9 342.9 100399.0 32570.2 –1,697.4 P1_depth19 3,662.4 40.8 162.9 342.9 100399.0 32570.2 –1,697.4 P4_depth19 1,940.4 40.8 162.9 342.9 100399.0 32570.2 –1,697.4 KFM01A20 850,420.0 37.7 161.9 341.9 100368.0 32552.8 –1,860.2 P1_depth20 4,049.7 39.0 161.9 341.9 100447.0 32526.9 –1,879.9 P4_depth20 2,032.5 39.0 161.9 341.9 100403.0 32541.2 –1,823.1 KFM01A21 1,285.4 63.0 216.3 36.3 98747.0 32814.3 159.9 P1_depth21 1,458.7 66.0 217.0 37.0 98721.4 32790.1 155.3 P4_depth21 233.5 64.2 216.3 36.3 98741.9 32810.5 155.1 P5_depth21 265.5 64.2 216.3 36.3 98741.9 32810.5 155.1 KFM01A21 –571.7 64.2 216.3 36.3 98741.9 32810.5 155.1 KFM02A22 1,344.4 63.1 216.6 36.6 98771.8 32830.3 144.1 P1_depth22 1,541.2 63.1 216.6 36.6 98771.8 32830.3 144.1 P4_depth22 297.0 63.1 216.6 36.6 98771.8 32830.3 144.1 P5_depth22 350.9 63.1 216.6 36.6 98771.8 32830.3 144.1 KFM01A22 –472.3 63.1 216.6 36.6 98771.8 32830.3 144.1 KFM02A23 675.6 70.0 233.8 53.8 98597.8 32450.9 247.1 KFM01A24 2,809.5 82.2 237.7 57.7 98548.2 32285.6 116.1 KFM01A24 –16,389.5 84.0 237.8 57.8 98532.9 32257.1 93.0 KFM02A25 6,515.0 47.3 169.9 349.9 99903.3 32839.8 –845.8 P1_depth25 –2,840.9 47.3 169.9 349.9 99903.3 32839.8 –845.8 P2_depth25 2,113.0 47.3 169.9 349.9 99903.3 32839.8 –845.8 P4_depth25 2,931.3 47.3 169.9 349.9 99903.3 32839.8 –845.8 P5_depth25 882.5 47.3 169.9 349.9 99903.3 32839.8 –845.8 KFM01A25 2,068.8 47.3 169.9 349.9 99903.3 32839.8 –845.8 KFM02A26 1,713.7 65.0 220.0 40.0 98912.0 32926.1 53.6 P1_depth

72
VSP reflector no.
Depth/ Distance (m)
Dip (°)
Dip Dir (°)
Azimuth (°)
Northing Crux (m)
Easting Crux (m)
Elev Crux (m)
Profile
26 2,141.3 65.0 220.0 40.0 98912.0 32926.1 53.6 P4_depth26 660.4 65.0 220.0 40.0 98912.0 32926.1 53.6 P5_depth26 1,086.9 65.0 220.0 40.0 98912.0 32926.1 53.6 KFM01A26 –73.0 65.0 220.0 40.0 98912.0 32926.1 53.6 KFM02A27 3,037.3 78.3 226.2 46.2 98826.3 32818.9 52.1 KFM01A27 –12,550.0 86.7 228.1 48.1 98779.6 32754.1 19.2 KFM02A28 2,955.1 69.2 229.3 49.3 98891.7 32874.1 63.0 P4_depth28 2,026.2 69.2 229.3 49.3 98891.7 32874.1 63.0 KFM01A28 –404.2 69.2 229.3 49.3 98891.7 32874.1 63.0 KFM02A29 2,163.2 56.0 223.0 43.0 99090.5 33084.4 –83.4 P1_depth29 1,430.5 56.0 223.0 43.0 99102.9 33096.0 –94.9 P5_depth29 1,520.0 58.9 221.7 41.7 99113.8 33101.3 –92.0 KFM01A29 533.2 58.9 221.7 41.7 99113.8 33101.3 –92.0 KFM02A30 2,305.3 63.0 223.3 43.3 99172.2 33162.4 –120.6 P1_depth30 1,670.0 63.0 223.0 43.0 99176.0 33164.1 –122.6 P5_depth30 1,961.0 61.3 223.3 43.3 99167.0 33157.5 –125.5 KFM01A30 750.0 58.0 223.0 43.0 99186.3 33173.7 –159.1 KFM02A31 2,400.0 62.0 220.0 40.0 99265.4 33222.7 –184.2 P1_depth31 3,255.0 66.0 220.0 40.0 99300.9 33252.5 –174.9 P4_depth31 1,985.0 62.0 220.0 40.0 99277.9 33233.2 –192.9 P5_depth31 2,360.0 64.2 220.1 40.1 99289.7 33243.6 –183.3 KFM01A31 1,251.6 63.0 220.1 40.1 99302.9 33254.8 –201.7 KFM02A32 3,490.9 65.0 216.0 36.0 99559.7 33406.6 –322.6 P4_depth32 2,640.0 66.0 216.0 36.0 99571.8 33415.4 –314.7 P5_depth32 2,970.0 65.0 216.0 36.0 99559.7 33406.6 –322.6 KFM01A32 2,169.2 66.0 216.0 36.0 99538.0 33390.9 –296.1 KFM02A33 1,396.9 35.0 203.6 23.6 99018.3 33008.0 –28.5 P1_depth33 376.3 35.0 203.6 23.6 99018.3 33008.0 –28.5 P2_depth33 1,172.9 35.0 203.6 23.6 99018.3 33008.0 –28.5 P5_depth33 151.9 35.0 203.6 23.6 99018.3 33008.0 –28.5 KFM01A33 185.0 35.0 203.6 23.6 99018.3 33008.0 –28.5 KFM02A34 327.1 35.5 197.8 17.8 99018.7 33006.0 –27.5 P2_depth34 1,281.0 35.5 197.8 17.8 99018.7 33006.0 –27.5 P4_depth34 1,186.6 35.5 197.8 17.8 99018.7 33006.0 –27.5 P5_depth34 205.0 35.5 197.8 17.8 99018.7 33006.0 –27.5 KFM02A35 210.0 42.5 180.0 0.0 98996.5 33000.0 3.9 P2_depth35 582.7 40.0 178.0 358.0 98988.8 33000.4 13.3 P4_depth35 1,142.4 42.5 178.0 358.0 98987.7 33000.4 13.5 P5_depth35 245.0 42.5 178.0 358.0 98987.7 33000.4 13.5 KFM02A36 1,184.7 66.0 108.9 288.9 98966.9 33096.7 45.5 P2_depth36 1,182.9 66.0 108.9 288.9 98966.9 33096.7 45.5 P5_depth36 275.9 66.0 108.9 288.9 98966.9 33096.7 45.5 KFM02A37 137.6 57.0 170.0 350.0 98957.1 33007.6 28.3 P2_depth37 1,127.3 57.0 170.0 350.0 98957.1 33007.6 28.3 P5_depth37 370.4 57.0 170.0 350.0 98957.1 33007.6 28.3 KFM02A38 3,338.6 48.5 120.0 300.0 99071.1 32876.9 –126.0 P2_depth38 1,462.3 48.5 122.7 302.7 99037.7 32941.1 –62.0 P5_depth

73
VSP reflector no.
Depth/ Distance (m)
Dip (°)
Dip Dir (°)
Azimuth (°)
Northing Crux (m)
Easting Crux (m)
Elev Crux (m)
Profile
38 452.3 48.5 122.7 302.7 99037.7 32941.1 –62.0 KFM02A39 1,932.9 28.0 140.5 320.5 99109.4 32909.8 –266.8 P5_depth39 482.1 26.7 140.5 320.5 99099.9 32917.6 –258.0 KFM02A40 220,236.0 5.8 132.3 312.3 99033.3 32963.4 –491.6 P2_depth40 6,725.8 5.8 132.0 312.0 99033.0 32963.3 –490.1 P5_depth40 369.1 6.2 132.3 312.3 99038.6 32957.6 –528.9 KFM01A40 575.2 6.2 132.3 312.3 99038.6 32957.6 –528.9 KFM02A41 –41,478.3 26.0 135.6 315.6 99130.1 32872.5 –373.5 P2_depth41 2,293.5 26.9 135.6 315.6 99138.3 32864.5 –382.2 P5_depth41 631.1 26.9 135.6 315.6 99138.3 32864.5 –382.2 KFM02A42 –29,256.1 24.6 136.9 316.9 99155.6 32854.3 –466.4 P2_depth42 2,586.2 24.6 136.9 316.9 99155.6 32854.3 –466.4 P5_depth42 699.2 24.6 136.9 316.9 99155.6 32854.3 –466.4 KFM02A43 118,385.0 23.3 161.9 341.9 99227.5 32925.7 –554.7 P1_depth43 2,741.9 23.3 161.9 341.9 99227.5 32925.7 –554.7 P5_depth43 220.8 23.3 161.9 341.9 99227.5 32925.7 –554.7 KFM01A43 789.1 23.3 161.9 341.9 99227.5 32925.7 –554.7 KFM02A44 1,627.8 61.6 200.2 20.2 99219.1 33080.5 –126.4 P1_depth44 1,511.6 61.6 200.2 20.2 99219.1 33080.5 –126.4 P5_depth44 624.8 61.6 200.2 20.2 99219.1 33080.5 –126.4 KFM01A44 936.0 61.6 200.2 20.2 99219.1 33080.5 –126.4 KFM02A45 1,312.7 40.0 170.2 350.2 99364.9 32936.8 –441.3 P4_depth45 2,110.8 40.0 170.2 350.2 99364.9 32936.8 –441.3 P5_depth45 981.9 40.0 170.2 350.2 99364.9 32936.8 –441.3 KFM02A46 421.4 82.0 170.5 350.5 98780.6 33036.9 31.1 P2_depth46 –4,089.6 81.8 170.0 350.0 98768.6 33040.8 34.1 KFM01A46 463.4 82.0 170.5 350.5 98780.6 33036.9 31.1 KFM02A47 –88,699.9 3.0 157.0 337.0 99021.8 32990.7 –452.0 P1_depth47 –22,256.7 3.0 157.0 337.0 99021.8 32990.7 –452.0 P2_depth47 8,782.9 2.8 157.0 337.0 99018.3 32992.2 –414.5 P4_depth47 9,888.0 3.0 157.0 337.0 99021.8 32990.7 –452.0 P5_depth47 399.6 3.0 157.0 337.0 99021.8 32990.7 –452.0 KFM01A47 478.7 3.0 157.0 337.0 99021.8 32990.7 –452.0 KFM02A48 2,472.0 31.7 204.7 24.7 99191.3 33088.0 –340.4 P1_depth48 2,206.1 31.7 204.7 24.7 99191.3 33088.0 –340.4 P5_depth48 586.8 31.7 204.7 24.7 99191.3 33088.0 –340.4 KFM01A48 595.2 31.7 204.7 24.7 99191.3 33088.0 –340.4 KFM02A49 1,896.3 59.0 205.0 25.0 99196.9 33091.8 –130.5 P4_depth49 1,517.0 59.0 205.0 25.0 99196.9 33091.8 –130.5 P5_depth49 797.4 59.0 205.0 25.0 99196.9 33091.8 –130.5 KFM01A49 808.0 59.0 205.0 25.0 99196.9 33091.8 –130.5 KFM02A

74
Figure 3-13. Interpreted 3D reflector elements from the VSP (KFM01A and KFM02A) and surface reflection seismic data (lines 1, 2, 4 and 5). 3D perspective view from southeast.
Figure 3-14. Same as Figure 313. 3D orthographic projection, view from southeast.

75
Figure 3-15. Same as Figure 313. 2D view from top.
Figure 3-16. Same as Figure 313. 2D more detailed view from top.

76
Figure 3-17. Interpreted 3D reflector elements from the VSP (KFM01A and KFM02A) and surface reflection seismic data (lines 1, 2, 4 and 5), together with migrated profiles from lines 2 and 4. View from northwest.
Figure 3-18. Interpreted 3D reflector elements from the VSP (KFM01A and KFM02A) and surface reflection seismic data (lines 1, 2, 4 and 5), together with migrated profiles from all four lines. View from northeast.
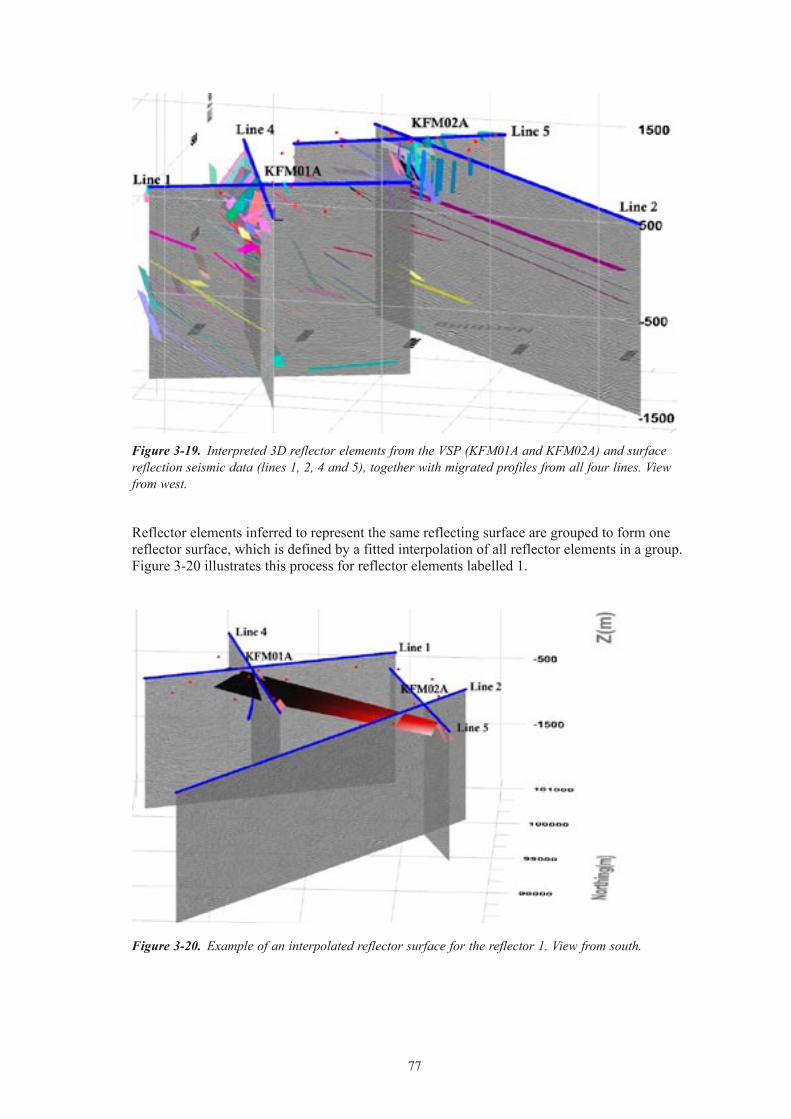
77
Reflectorelementsinferredtorepresentthesamereflectingsurfacearegroupedtoformonereflector surface, which is defined by a fitted interpolation of all reflector elements in a group. Figure 3-20 illustrates this process for reflector elements labelled 1.
Figure 3-19. Interpreted 3D reflector elements from the VSP (KFM01A and KFM02A) and surface reflection seismic data (lines 1, 2, 4 and 5), together with migrated profiles from all four lines. View from west.
Figure 3-20. Example of an interpolated reflector surface for the reflector 1. View from south.

78
3.1 Borehole KFM01A, and 2D profiles 1 and 4ReflectorelementsandinferredreflectorsurfacescomputedfromtheseelementsareshowninFigures3-21to3-24.ThepossiblecorrelationbetweenVSPreflectorsinterpretedfromboreholeKFM01A and the geological data in the borehole is presented in Table 3-2.
Table 3-2. VSP reflectors interpreted from borehole KFM01A, in relation to the single-hole interpretation of KFM01A /Carlsten et al. 2004a/.
Label Depth (m)
Dip (°)
Dip Dir (°)
Azimuth (°)
Comment
46 –4,089.6 81.8 170.0 350.04 –122.2 54.0 170.0 350.08 70.5 36.0 140.0 320.0 RU1. Cannot observe DZ1 in the VSP data, since measure-
ments were made from 100–774 m, DZ1 being too shallow.33 151.9 35.0 203.6 23.6 RU1, amphibolite vein.43 220.8 23.3 161.9 341.9 RU1, amphibolite vein.21 265.5 64.2 216.3 36.3 RU1, amphibolite vein, alteration (oxidised) zone.22 350.9 63.1 216.6 36.6 RU1, gabbro vein.40 369.1 6.2 132.3 312.3 RU12 380.2 15.0 121.0 301.0 RU1
47 399.6 3.0 157.0 337.0 RU1, alteration (oxidised) zone.6 420.0 49.8 125.2 305.2 RU1, sealed fractures. May correspond to DZ2.5 434.6 28.0 170.0 350.0 RU1. May represent reflector B4 (see text below associated
with Figure 3-35).7 524.0 25.0 160.0 340.0 RU3, granite to grandiorite transition, fine- to medium-grained.
48 586.8 31.7 204.7 24.7 RU1, pegmatite.44 624.8 61.6 200.2 20.2 RU1. May correspond to DZ3.9 636.0 30.0 150.0 330.0 RU1, pegmatite.
23 675.6 70.0 233.8 53.8 RU1. May correspond to DZ3.11 775.0 53.1 198.9 18.9 RU1, amphibolite / granite / pegmatite.49 797.4 59.0 205.0 25.0 RU112 808.0 28.8 147.9 327.9 lower RU1 / upper RU2, Granite, granodiorite and tonalite,
metamorphic, fine- to medium-grained.13 865.0 29.0 147.0 327.0 lower RU2 / upper RU1.25 882.5 47.3 169.9 349.9 RU1, pegmatite, steeply dipping, from NW.10 940.4 23.0 135.0 315.0 RU1, Granite, granodiorite and tonalite, metamorphic, fine-
to medium-grained.3 1,005.8 35.1 150.8 330.8 RU1
26 1,086.9 65.0 220.0 40.016 1,090.0 40.0 113.7 293.715 1,161.9 30.0 163.0 343.018 1,518.9 31.0 162.7 342.729 1,520.0 58.9 221.7 41.717 1,551.0 42.1 134.3 314.319 1,940.4 40.8 162.9 342.9 May be related to reflector A1 (see Figure 3-33).30 1,961.0 61.3 223.3 43.328 2,026.2 69.2 229.3 49.320 2,032.5 39.0 161.9 341.9 May represent reflector A1 (see Figure 3-33).31 2,360.0 64.2 220.1 40.124 2,809.5 82.2 237.7 57.7 May correspond to DZ2.32 2,970.0 65.0 216.0 36.027 3,037.3 78.3 226.2 46.2

79
Figure 3-21. Reflector elements interpreted from the VSP data acquired in borehole KFM01A and the 2D depth migrated profiles along lines 1 and 4. View from east.
Figure 3-22. Reflector surfaces computed from the reflector elements shown in Figure 321. View from east.

80
Figure 3-23. Same as Figure 321. View from southeast.
Figure 3-24. Reflector surfaces computed from the reflector elements shown in Figure 321. View from southeast.

81
3.2 Borehole KFM02A, and 2D profiles 2 and 5ReflectorelementsandinferredreflectorsurfacescomputedfromtheseelementsareshowninFigures3-27to3-28.ThepossiblecorrelationbetweenVSPreflectorsinterpretedfromboreholeKFM02A and the geological data in the borehole is presented in Table 3-3.
Figure 3-25. Reflector elements interpreted from the VSP data acquired in borehole KFM02A and the 2D depth migrated profiles along lines 2 and 5. View from east.
Figure 3-26. Reflector surfaces computed from the reflector elements shown in Figure 325. View from east.
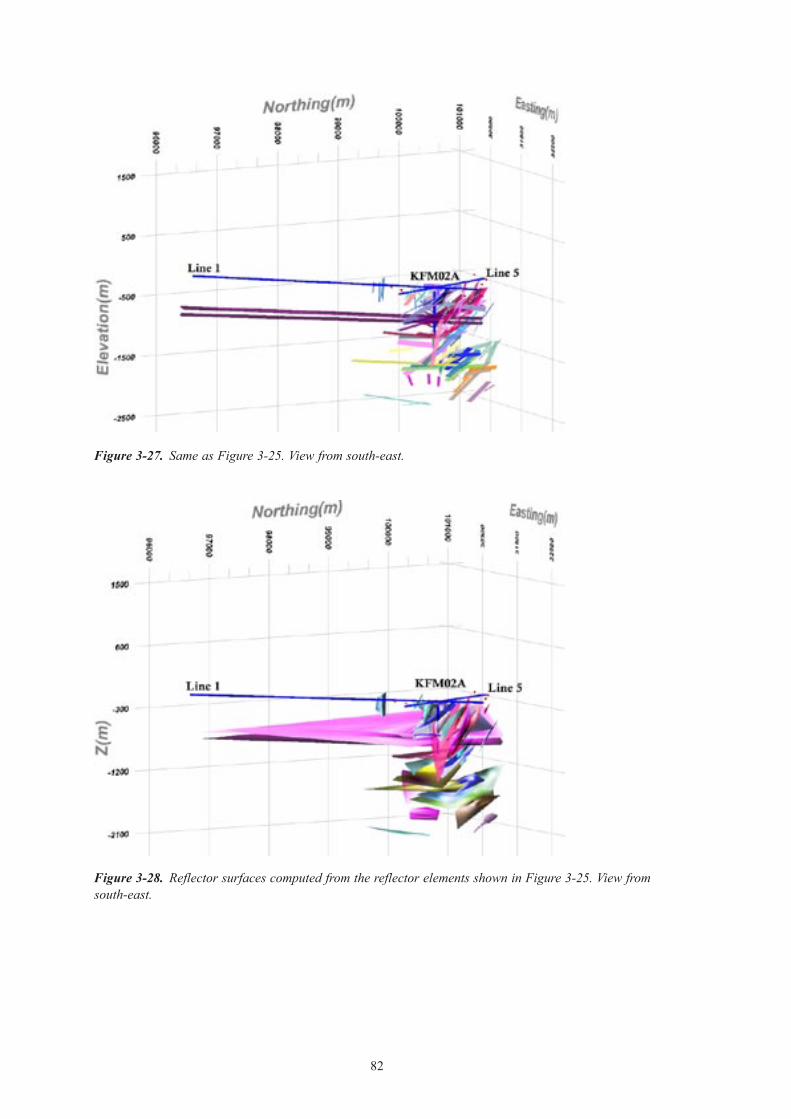
82
Figure 3-28. Reflector surfaces computed from the reflector elements shown in Figure 325. View from southeast.
Figure 3-27. Same as Figure 325. View from southeast.
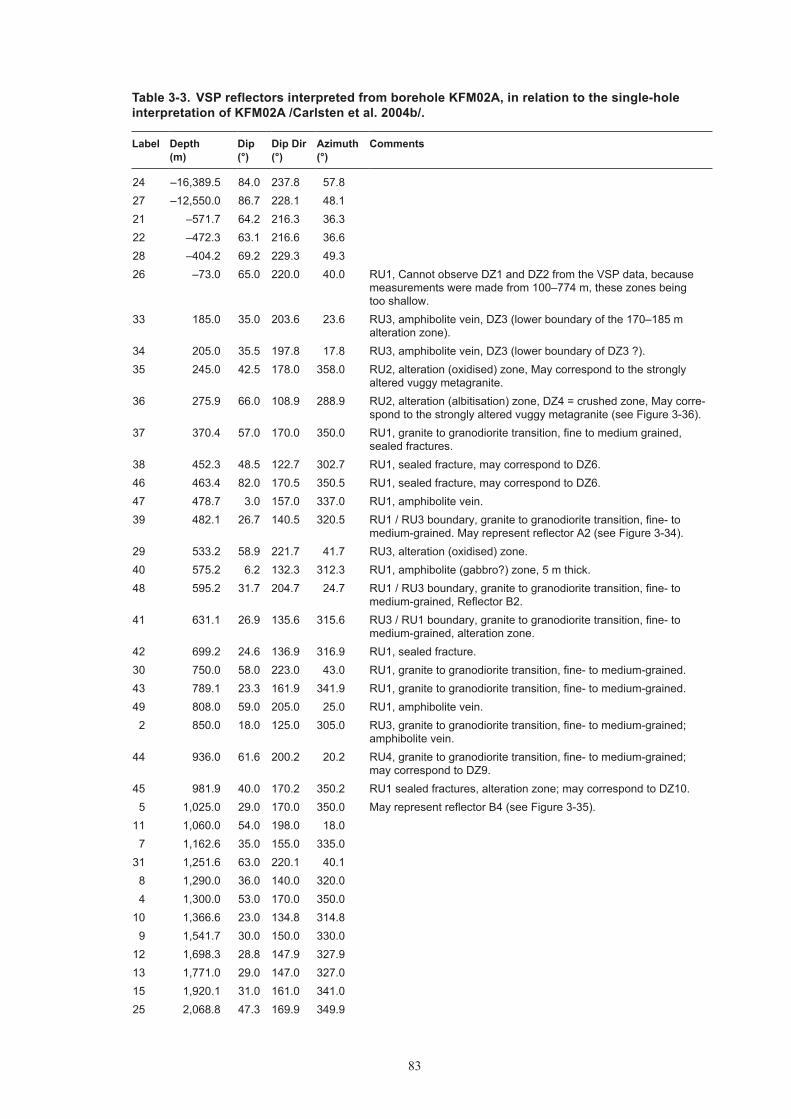
83
Table 3-3. VSP reflectors interpreted from borehole KFM02A, in relation to the single-hole interpretation of KFM02A /Carlsten et al. 2004b/.
Label Depth (m)
Dip (°)
Dip Dir (°)
Azimuth (°)
Comments
24 –16,389.5 84.0 237.8 57.827 –12,550.0 86.7 228.1 48.121 –571.7 64.2 216.3 36.322 –472.3 63.1 216.6 36.628 –404.2 69.2 229.3 49.326 –73.0 65.0 220.0 40.0 RU1, Cannot observe DZ1 and DZ2 from the VSP data, because
measurements were made from 100–774 m, these zones being too shallow.
33 185.0 35.0 203.6 23.6 RU3, amphibolite vein, DZ3 (lower boundary of the 170–185 m alteration zone).
34 205.0 35.5 197.8 17.8 RU3, amphibolite vein, DZ3 (lower boundary of DZ3 ?).35 245.0 42.5 178.0 358.0 RU2, alteration (oxidised) zone, May correspond to the strongly
altered vuggy metagranite.36 275.9 66.0 108.9 288.9 RU2, alteration (albitisation) zone, DZ4 = crushed zone, May corre-
spond to the strongly altered vuggy metagranite (see Figure 3-36).37 370.4 57.0 170.0 350.0 RU1, granite to granodiorite transition, fine to medium grained,
sealed fractures.38 452.3 48.5 122.7 302.7 RU1, sealed fracture, may correspond to DZ6.46 463.4 82.0 170.5 350.5 RU1, sealed fracture, may correspond to DZ6.47 478.7 3.0 157.0 337.0 RU1, amphibolite vein.39 482.1 26.7 140.5 320.5 RU1 / RU3 boundary, granite to granodiorite transition, fine- to
medium-grained. May represent reflector A2 (see Figure 3-34).29 533.2 58.9 221.7 41.7 RU3, alteration (oxidised) zone.40 575.2 6.2 132.3 312.3 RU1, amphibolite (gabbro?) zone, 5 m thick.48 595.2 31.7 204.7 24.7 RU1 / RU3 boundary, granite to granodiorite transition, fine- to
medium-grained, Reflector B2.41 631.1 26.9 135.6 315.6 RU3 / RU1 boundary, granite to granodiorite transition, fine- to
medium-grained, alteration zone.42 699.2 24.6 136.9 316.9 RU1, sealed fracture.30 750.0 58.0 223.0 43.0 RU1, granite to granodiorite transition, fine- to medium-grained.43 789.1 23.3 161.9 341.9 RU1, granite to granodiorite transition, fine- to medium-grained.49 808.0 59.0 205.0 25.0 RU1, amphibolite vein.2 850.0 18.0 125.0 305.0 RU3, granite to granodiorite transition, fine- to medium-grained;
amphibolite vein.44 936.0 61.6 200.2 20.2 RU4, granite to granodiorite transition, fine- to medium-grained;
may correspond to DZ9.45 981.9 40.0 170.2 350.2 RU1 sealed fractures, alteration zone; may correspond to DZ10.5 1,025.0 29.0 170.0 350.0 May represent reflector B4 (see Figure 3-35).
11 1,060.0 54.0 198.0 18.07 1,162.6 35.0 155.0 335.0
31 1,251.6 63.0 220.1 40.18 1,290.0 36.0 140.0 320.04 1,300.0 53.0 170.0 350.0
10 1,366.6 23.0 134.8 314.89 1,541.7 30.0 150.0 330.0
12 1,698.3 28.8 147.9 327.913 1,771.0 29.0 147.0 327.015 1,920.1 31.0 161.0 341.025 2,068.8 47.3 169.9 349.9

84
Label Depth (m)
Dip (°)
Dip Dir (°)
Azimuth (°)
Comments
3 2,100.0 35.1 150.8 330.832 2,169.2 66.0 216.0 36.018 2,320.7 31.0 162.7 342.76 2,496.4 49.8 125.2 305.2
16 2,659.5 40.0 113.7 293.7
3.3 Combined interpretation of reflectors from boreholes KFM01A and KFM02A together with 2D profiles 1, 2, 4 and 5, and some geological features presented in geological model, stage 2.1
Thesub-setofgentlydipping(dip<37.5°)reflectorsispresentedinFigures3-29and3-30.Thesub-setofsteeplydipping(dip>60°)reflectorsispresentedinFigures3-31and3-32.Figures 3-33 to 3-37 present some of the inferred reflectors from the surface seismic data and informationinthegeologicalmodelstage2.1,inrelationtoreflectorsinterpretedfromtheVSPdatafromboreholesKFM1AandKFM02A.ReflectorsA1,A2andB4aretakenfrom/Juhlinetal.2002/andtheporousgranite(includingzoneZFMNE1189)fromthegeologicalmodelstage 2.1 /SKB 2006/.
ThereisaconfidentcorrelationofreflectorsA1andA2inthesurfacedatawithreflectors19–20andreflector39,respectively,intheVSPdata(Figures3-33and3-34).IfB4iscorrelatedwithreflector5interpretedfromtheVSPdata(Figure3-35)andifthecorrelationofVSPreflector5betweentheboreholesKFM01AandKFM02A,asproposedhere,iscorrect(seeTable3-1),it would mean that B4 will have to be reoriented from an intersect along KFM01A at c. 10 m, withanorientation050/28(strike/dip),toanintersectalongKFM01Aatc.430–470m,withanorientation080/28(strike/dip).AnalternativeinterpretationofreflectorB4,inwhichthereisnointersection in borehole KFM01A, was presented in /Juhlin and Bergman 2004/. Finally, zone ZFMNE1189insidetheporousgraniteintervalinboreholeKFM02AappearstocorrelatewithVSPreflector36(Figures3-36and3-37).Asteepdipforthisstructureisinferred.
Figure 3-29. Gently dipping (dip < 37.5°) interpolated surfaces. View from east.
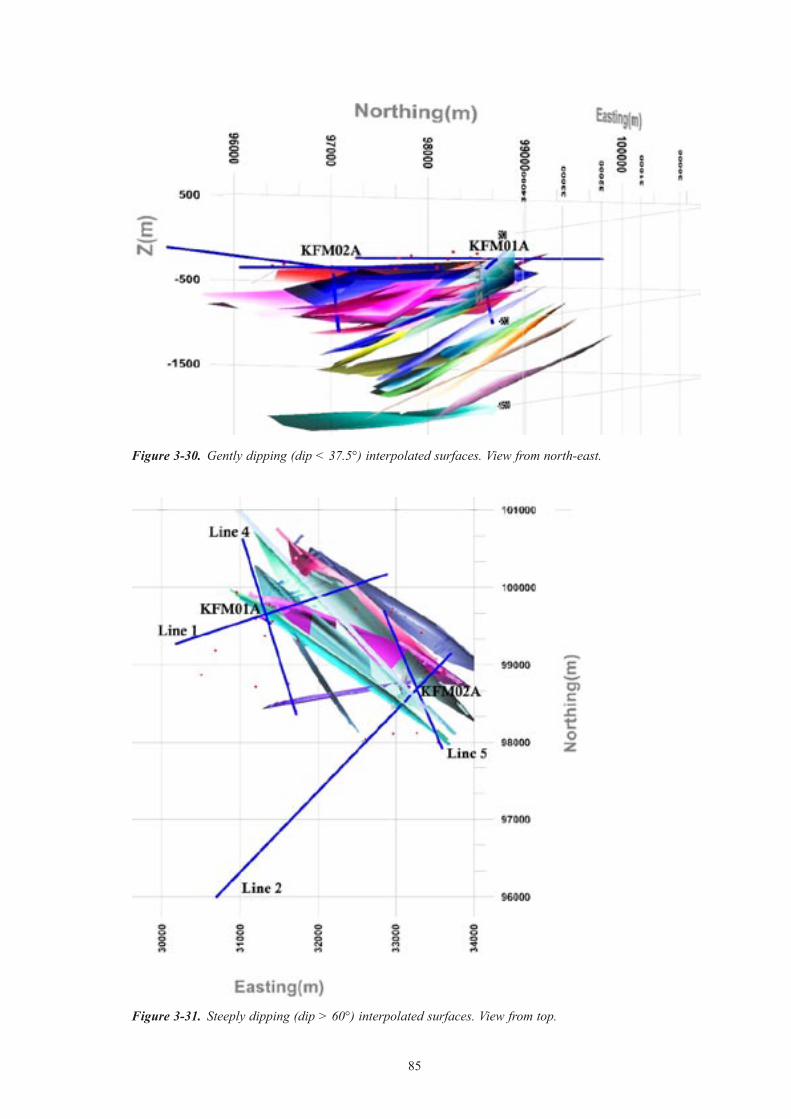
85
Figure 3-31. Steeply dipping (dip > 60°) interpolated surfaces. View from top.
Figure 3-30. Gently dipping (dip < 37.5°) interpolated surfaces. View from northeast.

86
Figure 3-32. Steeply dipping (dip > 60°) interpolated surfaces. 3D view from top.
Figure 3-33. Reflector A1 interpreted from the 2D seismic data and correlation with reflectors 19 and 20 interpreted from the VSP data.

87
Figure 3-34. Reflector A2 interpreted from the 2D seismic data and correlation with reflector 39 interpreted from the VSP data.
Figure 3-35. Reflector B4 interpreted from the 2D seismic data and correlation with reflector 5 interpreted from the VSP data.
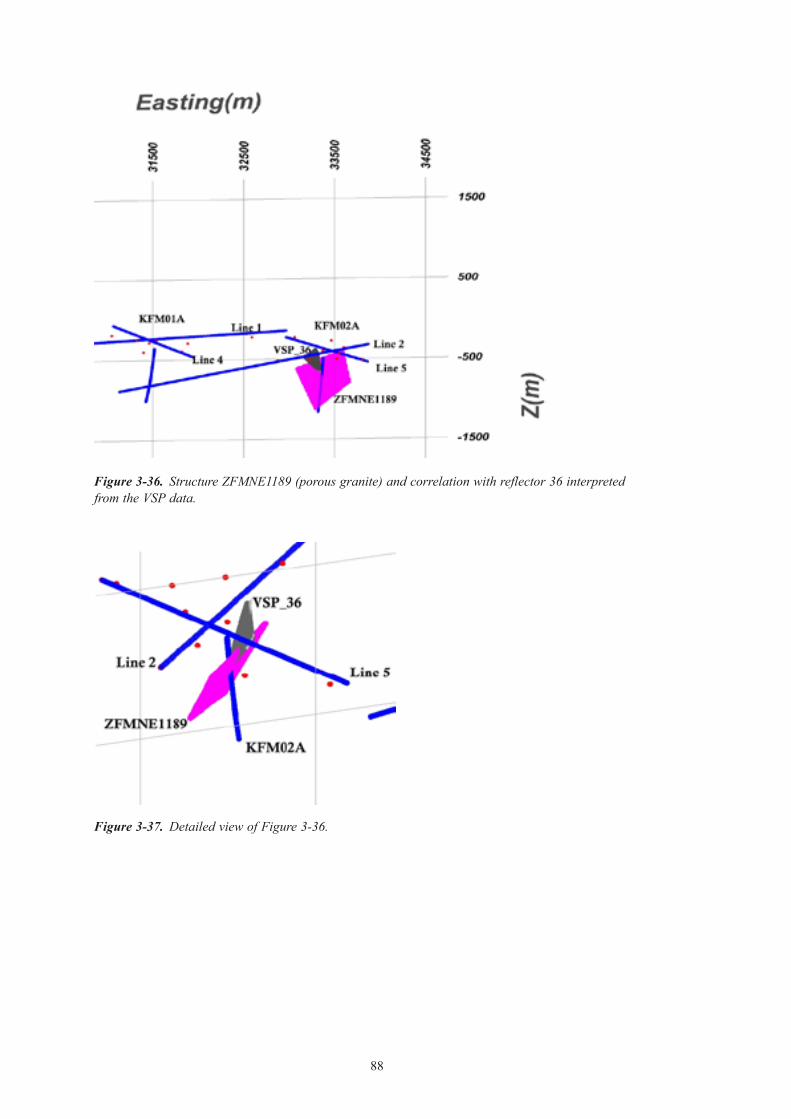
88
Figure 3-37. Detailed view of Figure 336.
Figure 3-36. Structure ZFMNE1189 (porous granite) and correlation with reflector 36 interpreted from the VSP data.

89
4 References
Carlsten S, Petersson J, Stephens M, Mattsson H, Gustafsson J, 2004a.Geologicalsingle-holeinterpretationofKFM01A,KFM01BandHFM01–03(DS1).Forsmarksiteinvestigation.SKBP-04-116,SvenskKärnbränslehanteringAB.
Carlsten S, Petersson J, Stephens M, Mattsson H, Gustafsson J, 2004b.Geologicalsingle-holeinterpretationofKFM02AandHFM04–05(DS2).Forsmarksiteinvestigation.SKBP-04-117,SvenskKärnbränslehanteringAB.
Cosma C, Enescu N, Balu L, 2005.VerticalseismicprofilingfromtheboreholesKFM01AandKFM02A.Forsmarksiteinvestigation.SKBP-05-168,SvenskKärnbränslehanteringAB.
Juhlin C, Bergman B, 2004.ReflectionseismicsintheForsmarkarea.UpdatedinterpretationofStage1(previousreportR-02-43).Updatedestimateofbedrocktopography(previousreportP-04-99).SKBP-04-158,SvenskKärnbränslehanteringAB.
Juhlin C, Bergman B, Palm H, 2002.ReflectionseismicstudiesintheForsmarkareaStage1.SKBR-02-43,SvenskKärnbränslehanteringAB.
SKB 2006. Site descriptive modelling. Forsmark stage 2.1. Feedback for completion of the site investigationincludinginputfromsafetyassessmentandrepositoryengineering.SKBR-06-38,SvenskKärnbränslehanteringAB.
Stephens M B, Fox A, La Pointe P, Simeonov A, Isaksson H, Hermanson J, Öhman J, 2007. Geology.Forsmarkmodellingstage2.2.SKBR-07-45,SvenskKärnbränslehanteringAB.

90
App
endi
x 1
Para
met
ers
of re
flect
or e
lem
ents
inte
rpre
ted
from
the
VSP
and
2D s
eism
ic d
ata
No.
Dep
thD
ip
(°)
Dip
Dir
(°
)A
zim
uth
(°)
Visi
bilit
yTy
peN
orth
ing
Cru
xEa
stin
g C
rux
Elev
C
rux
Prof
ile1st
re
ceiv
erla
st
rece
iver
11,
150.
040
.021
3.0
33.0
2P
-Ref
lect
ion
9886
0.2
3290
9.2
198.
7P
1_de
pth
135
215
11,
282.
940
.021
3.0
33.0
2P
-Ref
lect
ion
9886
0.2
3290
9.2
198.
7P
4_de
pth
120
235
138
5.0
35.5
171.
6–8
.42
P-R
efle
ctio
n98
741.
033
038.
536
7.6
P5_
dept
h20
651
38.5
199.
219
.298
820.
532
952.
325
5.0
216
,443
.215
.012
1.0
301.
02
P-R
efle
ctio
n99
106.
732
822.
4–7
73.2
P2_
dept
h13
030
02
3,13
1.4
16.0
142.
032
2.0
2P
-Ref
lect
ion
9919
2.1
3284
9.9
–850
.3P
4_de
pth
7014
02
5,15
2.8
14.0
124.
030
4.0
2P
-Ref
lect
ion
9910
5.2
3284
4.0
–754
.8P
5_de
pth
230
320
238
0.2
15.0
121.
030
1.0
2P
-Ref
lect
ion
9910
6.7
3282
2.4
–773
.2K
FM01
A_0
11
492
380.
215
.012
1.0
301.
01
P-R
efle
ctio
n99
106.
732
822.
4–7
73.2
KFM
01A
_02
157
238
0.2
15.0
121.
030
1.0
1P
-Ref
lect
ion
9910
6.7
3282
2.4
–773
.2K
FM01
A_0
31
572
380.
215
.012
0.0
300.
01
P-R
efle
ctio
n99
103.
832
820.
2–7
74.7
KFM
01A
_05
157
285
0.0
18.0
125.
030
5.0
2P
-Ref
lect
ion
9912
8.5
3281
6.4
–689
.7K
FM02
A_0
11
136
285
0.0
18.0
125.
030
5.0
1P
-Ref
lect
ion
9912
8.5
3281
6.4
–689
.7K
FM02
A_0
71
136
285
0.0
20.0
120.
030
0.0
1P
-Ref
lect
ion
9912
1.9
3278
8.9
–669
.6K
FM02
A_0
81
136
216
.112
4.0
304.
099
120.
732
822.
5–7
52.2
3–1
0,23
8.0
35.1
150.
833
0.8
2P
-Ref
lect
ion
9980
6.6
3254
9.4
–1,3
12.8
P2_
dept
h1
853
4,04
2.7
35.1
150.
833
0.8
1P
-Ref
lect
ion
9980
6.6
3254
9.4
–1,3
12.8
P5_
dept
h28
038
43
1,00
5.0
35.0
150.
033
0.0
2P
-Ref
lect
ion
9980
1.2
3253
7.4
–1,3
21.3
KFM
01A
_01
113
63
1,00
5.8
35.1
150.
833
0.8
1P
-Ref
lect
ion
9980
6.6
3254
9.4
–1,3
12.8
KFM
01A
_03
113
63
1,00
5.8
35.1
150.
833
0.8
1P
-Ref
lect
ion
9980
6.6
3254
9.4
–1,3
12.8
KFM
01A
_05
113
63
2,10
0.0
35.1
150.
833
0.8
1P
-Ref
lect
ion
9980
6.6
3254
9.4
–1,3
12.8
KFM
02A
_01
113
63
2,10
0.0
35.1
150.
833
0.8
2P
-Ref
lect
ion
9980
6.6
3254
9.4
–1,3
12.8
KFM
02A
_02
113
63
2,10
0.0
35.1
150.
833
0.8
2P
-Ref
lect
ion
9980
6.6
3254
9.4
–1,3
12.8
KFM
02A
_07
113
63
2,10
0.0
35.1
150.
833
0.8
2P
-Ref
lect
ion
9980
6.6
3254
9.4
–1,3
12.8
KFM
02A
_08
113
6

91
No.
Dep
thD
ip
(°)
Dip
Dir
(°
)A
zim
uth
(°)
Visi
bilit
yTy
peN
orth
ing
Cru
xEa
stin
g C
rux
Elev
C
rux
Prof
ile1st
re
ceiv
erla
st
rece
iver
335
.115
0.7
330.
799
806.
032
548.
1–1
,313
.84
–122
.254
.017
0.0
350.
02
P-R
efle
ctio
n99
447.
432
921.
1–3
30.1
KFM
01A
_01
113
64
–122
.254
.017
0.0
350.
02
P-R
efle
ctio
n99
447.
432
921.
1–3
30.1
KFM
01A
_02
113
64
–122
.254
.017
0.0
350.
02
P-R
efle
ctio
n99
447.
432
921.
1–3
30.1
KFM
01A
_03
113
64
–122
.254
.017
0.0
350.
02
P-R
efle
ctio
n99
447.
432
921.
1–3
30.1
KFM
01A
_05
1E+0
90
41,
300.
053
.017
0.0
350.
02
P-R
efle
ctio
n99
457.
832
919.
3–3
50.3
KFM
02A
_01
113
64
1,30
0.0
54.0
170.
035
0.0
2P
-Ref
lect
ion
9944
7.4
3292
1.1
–330
.1K
FM02
A_0
21
136
41,
300.
054
.017
0.0
350.
01
P-R
efle
ctio
n99
447.
432
921.
1–3
30.1
KFM
02A
_07
113
64
1,30
0.0
52.0
170.
035
0.0
1P
-Ref
lect
ion
9946
7.5
3291
7.6
–370
.9K
FM02
A_0
81
136
453
.617
0.0
350.
099
451.
232
920.
4–3
37.7
56,
145.
627
.516
6.5
346.
52
P-R
efle
ctio
n99
298.
432
928.
4–5
89.6
P1_
dept
h22
538
05
2,06
4.7
28.0
170.
035
0.0
1P
-Ref
lect
ion
9935
7.6
3293
6.9
–682
.9P
4_de
pth
125
220
52,
881.
727
.017
2.0
352.
02
P-R
efle
ctio
n99
334.
332
953.
0–6
62.6
P5_
dept
h12
032
05
434.
628
.017
0.0
350.
01
P-R
efle
ctio
n99
357.
632
936.
9–6
82.9
KFM
01A
_01
158
543
4.6
28.0
170.
035
0.0
2P
-Ref
lect
ion
9935
7.6
3293
6.9
–682
.9K
FM01
A_0
21
595
434.
628
.017
0.0
350.
02
P-R
efle
ctio
n99
357.
632
936.
9–6
82.9
KFM
01A
_03
159
543
4.6
28.0
170.
035
0.0
2P
-Ref
lect
ion
9935
7.6
3293
6.9
–682
.9K
FM01
A_0
51
595
1,02
5.0
28.0
170.
035
0.0
1P
-Ref
lect
ion
9935
7.6
3293
6.9
–682
.9K
FM02
A_0
11
136
51,
025.
029
.017
0.0
350.
02
P-R
efle
ctio
n99
363.
432
935.
9–6
65.7
KFM
02A
_02
113
65
1,02
5.0
30.0
168.
034
8.0
2P
-Ref
lect
ion
9936
5.7
3292
2.3
–647
.5K
FM02
A_0
71
136
51,
025.
028
.017
0.0
350.
02
P-R
efle
ctio
n99
357.
632
936.
9–6
82.9
KFM
02A
_08
113
65
28.1
169.
734
9.7
9935
1.4
3293
6.2
–667
.86
16,8
88.4
50.0
124.
830
4.8
2P
-Ref
lect
ion
9971
5.3
3196
8.9
–1,0
53.0
P2_
dept
h21
532
56
3,69
1.1
50.2
124.
530
4.5
2P
-Ref
lect
ion
9967
2.6
3202
1.7
–987
.4P
5_de
pth
275
384
642
0.0
49.8
125.
230
5.2
1P
-Ref
lect
ion
9967
9.3
3203
5.4
–998
.3K
FM01
A_0
166
136
642
0.0
49.8
125.
230
5.2
2P
-Ref
lect
ion
9967
9.3
3203
5.4
–998
.3K
FM01
A_0
21
736
420.
049
.812
5.2
305.
22
P-R
efle
ctio
n99
679.
332
035.
4–9
98.3
KFM
01A
_03
173
642
0.0
49.8
125.
230
5.2
1P
-Ref
lect
ion
9967
9.3
3203
5.4
–998
.3K
FM01
A_0
51
73

92
No.
Dep
thD
ip
(°)
Dip
Dir
(°
)A
zim
uth
(°)
Visi
bilit
yTy
peN
orth
ing
Cru
xEa
stin
g C
rux
Elev
C
rux
Prof
ile1st
re
ceiv
erla
st
rece
iver
62,
496.
449
.812
5.2
305.
21
P-R
efle
ctio
n99
679.
332
035.
4–9
98.3
KFM
02A
_01
113
66
2,49
6.4
49.8
125.
230
5.2
1P
-Ref
lect
ion
9967
9.3
3203
5.4
–998
.3K
FM02
A_0
21
136
62,
496.
449
.812
5.2
305.
21
P-R
efle
ctio
n99
679.
332
035.
4–9
98.3
KFM
02A
_08
113
66
49.8
125.
030
5.0
9968
2.6
3202
6.5
–1,0
03.2
7–3
3,17
2.7
25.0
160.
034
0.0
2P
-Ref
lect
ion
9937
1.6
3286
4.8
–847
.9P
1_de
pth
120
200
7–5
,240
.625
.016
0.0
340.
02
P-R
efle
ctio
n99
371.
632
864.
8–8
47.9
P2_
dept
h22
530
07
3,43
2.1
25.0
160.
034
0.0
2P
-Ref
lect
ion
9937
1.6
3286
4.8
–847
.9P
5_de
pth
145
260
752
4.0
25.0
160.
034
0.0
1P
-Ref
lect
ion
9937
1.6
3286
4.8
–847
.9K
FM01
A_0
21
857
524.
025
.016
0.0
340.
01
P-R
efle
ctio
n99
371.
632
864.
8–8
47.9
KFM
01A
_03
185
752
4.0
25.0
160.
034
0.0
2P
-Ref
lect
ion
9937
1.6
3286
4.8
–847
.9K
FM01
A_0
51
857
1,16
2.6
30.0
155.
033
5.0
1P
-Ref
lect
ion
9939
4.5
3281
6.1
–753
.9K
FM02
A_0
11
136
71,
162.
625
.015
5.0
335.
01
P-R
efle
ctio
n99
358.
632
832.
8–8
48.5
KFM
02A
_02
113
67
1,16
2.6
35.0
155.
033
5.0
2P
-Ref
lect
ion
9941
4.9
3280
6.5
–653
.9K
FM02
A_0
71
136
726
.715
8.3
338.
399
377.
532
849.
4–8
16.0
81,
318.
436
.014
0.0
320.
02
P-R
efle
ctio
n99
406.
032
659.
4–7
29.4
P1_
dept
h47
052
08
–17,
180.
436
.014
0.0
320.
02
P-R
efle
ctio
n99
406.
032
659.
4–7
29.4
P2_
dept
h90
280
81,
300.
836
.014
0.0
320.
02
P-R
efle
ctio
n99
406.
032
659.
4–7
29.4
P4_
dept
h15
024
08
2,86
7.5
36.0
140.
032
0.0
2P
-Ref
lect
ion
9940
6.0
3265
9.4
–729
.4P
5_de
pth
175
325
870
.536
.014
0.0
320.
02
P-R
efle
ctio
n99
406.
032
659.
4–7
29.4
KFM
01A
_01
113
68
70.0
40.0
130.
031
0.0
1P
-Ref
lect
ion
9943
9.0
3247
6.8
–814
.0K
FM01
A_0
21
136
81,
290.
036
.014
0.0
320.
01
P-R
efle
ctio
n99
406.
032
659.
4–7
29.4
KFM
02A
_01
113
68
1,29
0.0
36.0
140.
032
0.0
2P
-Ref
lect
ion
9940
6.0
3265
9.4
–729
.4K
FM02
A_0
21
136
81,
290.
036
.014
0.0
320.
01
P-R
efle
ctio
n99
406.
032
659.
4–7
29.4
KFM
02A
_07
113
68
1,29
0.0
36.0
140.
032
0.0
2P
-Ref
lect
ion
9940
6.0
3265
9.4
–729
.4K
FM02
A_0
81
136
836
.413
9.0
319.
099
409.
332
641.
1–7
37.9
9–9
,484
.130
.015
0.0
330.
02
P-R
efle
ctio
n99
526.
032
696.
3–1
,052
.0P
2_de
pth
3013
09
3,68
7.0
30.0
150.
033
0.0
2P
-Ref
lect
ion
9952
6.0
3269
6.3
–1,0
52.0
P5_
dept
h23
534
09
636.
030
.015
0.0
330.
01
P-R
efle
ctio
n99
526.
032
696.
3–1
,052
.0K
FM01
A_0
11
114

93
No.
Dep
thD
ip
(°)
Dip
Dir
(°
)A
zim
uth
(°)
Visi
bilit
yTy
peN
orth
ing
Cru
xEa
stin
g C
rux
Elev
C
rux
Prof
ile1st
re
ceiv
erla
st
rece
iver
963
6.0
30.0
150.
033
0.0
1P
-Ref
lect
ion
9952
6.0
3269
6.3
–1,0
52.0
KFM
01A
_02
110
69
636.
030
.015
0.0
330.
01
P-R
efle
ctio
n99
526.
032
696.
3–1
,052
.0K
FM01
A_0
31
106
963
6.0
30.0
150.
033
0.0
1P
-Ref
lect
ion
9952
6.0
3269
6.3
–1,0
52.0
KFM
01A
_05
110
69
1,54
1.7
30.0
150.
033
0.0
2P
-Ref
lect
ion
9952
6.0
3269
6.3
–1,0
52.0
KFM
02A
_01
113
69
1,54
1.7
30.0
150.
033
0.0
2P
-Ref
lect
ion
9952
6.0
3269
6.3
–1,0
52.0
KFM
02A
_02
113
69
1,54
1.7
30.0
150.
033
0.0
2P
-Ref
lect
ion
9952
6.0
3269
6.3
–1,0
52.0
KFM
02A
_07
113
69
1,54
1.7
30.0
150.
033
0.0
2P
-Ref
lect
ion
9952
6.0
3269
6.3
–1,0
52.0
KFM
02A
_08
113
69
30.0
150.
033
0.0
9952
6.0
3269
6.3
–1,0
52.0
10–3
22,2
06.0
12.9
134.
831
4.8
2P
-Ref
lect
ion
9920
0.6
3279
8.0
–1,2
40.0
P2_
dept
h80
400
107,
427.
012
.913
4.8
314.
82
P-R
efle
ctio
n99
200.
632
798.
0–1
,240
.0P
5_de
pth
208
350
1094
0.4
23.0
135.
031
5.0
2P
-Ref
lect
ion
9941
3.5
3258
6.5
–1,3
77.6
KFM
01A
_01
113
110
940.
412
.913
4.8
314.
82
P-R
efle
ctio
n99
200.
632
798.
0–1
,240
.0K
FM01
A_0
21
131
1094
0.4
23.0
135.
031
5.0
1P
-Ref
lect
ion
9941
3.5
3258
6.5
–1,3
77.6
KFM
01A
_03
113
110
940.
423
.013
5.0
315.
02
P-R
efle
ctio
n99
413.
532
586.
5–1
,377
.6K
FM01
A_0
51
131
101,
366.
623
.013
5.0
315.
01
P-R
efle
ctio
n99
321.
732
678.
3–1
,071
.9K
FM02
A_0
21
136
101,
366.
623
.013
4.8
314.
82
P-R
efle
ctio
n99
320.
732
677.
2–1
,072
.0K
FM02
A_0
71
136
1019
.213
4.9
314.
999
310.
632
688.
6–1
,249
.611
2,01
0.0
52.0
199.
019
.02
P-R
efle
ctio
n99
359.
333
123.
7–2
96.9
P4_
dept
h33
039
011
1,80
0.0
53.0
198.
018
.02
P-R
efle
ctio
n99
317.
733
103.
2–2
51.7
P5_
dept
h26
035
011
775.
053
.119
8.9
18.9
2P
-Ref
lect
ion
9935
5.7
3312
1.7
–281
.8K
FM01
A_0
11
136
1177
5.0
53.1
198.
918
.91
P-R
efle
ctio
n99
355.
733
121.
7–2
81.8
KFM
01A
_02
113
511
775.
053
.119
8.9
18.9
1P
-Ref
lect
ion
9935
5.7
3312
1.7
–281
.8K
FM01
A_0
31
135
1177
5.0
53.1
198.
918
.92
P-R
efle
ctio
n99
355.
733
121.
7–2
81.8
KFM
01A
_05
113
511
1,06
0.0
54.0
198.
018
.01
P-R
efle
ctio
n99
347.
233
112.
8–2
65.3
KFM
02A
_01
113
611
1,06
3.4
54.0
198.
918
.92
P-R
efle
ctio
n99
348.
633
119.
2–2
67.6
KFM
02A
_02
113
611
1,06
3.4
53.1
198.
918
.92
P-R
efle
ctio
n99
355.
733
121.
7–2
81.8
KFM
02A
_07
113
611
1,06
0.0
54.0
198.
018
.02
P-R
efle
ctio
n99
347.
233
112.
8–2
65.3
KFM
02A
_08
113
611
53.3
198.
618
.699
349.
933
118.
0–2
75.6

94
No.
Dep
thD
ip
(°)
Dip
Dir
(°
)A
zim
uth
(°)
Visi
bilit
yTy
peN
orth
ing
Cru
xEa
stin
g C
rux
Elev
C
rux
Prof
ile1st
re
ceiv
erla
st
rece
iver
12–1
2,75
5.6
28.8
147.
932
7.9
2P
-Ref
lect
ion
9956
2.6
3264
6.4
–1,2
07.6
P2_
dept
h90
250
124,
140.
728
.814
7.9
327.
92
P-R
efle
ctio
n99
562.
632
646.
4–1
,207
.6P
5_de
pth
250
384
1280
8.0
28.8
147.
932
7.9
2P
-Ref
lect
ion
9956
2.6
3264
6.4
–1,2
07.6
KFM
01A
_01
113
612
808.
028
.814
7.9
327.
92
P-R
efle
ctio
n99
562.
632
646.
4–1
,207
.6K
FM01
A_0
21
136
1280
8.0
28.8
147.
932
7.9
2P
-Ref
lect
ion
9956
2.6
3264
6.4
–1,2
07.6
KFM
01A
_03
113
612
808.
028
.814
7.9
327.
92
P-R
efle
ctio
n99
562.
632
646.
4–1
,207
.6K
FM01
A_0
51
136
121,
698.
328
.814
7.9
327.
92
P-R
efle
ctio
n99
562.
632
646.
4–1
,207
.6K
FM02
A_0
11
136
121,
698.
328
.814
7.9
327.
92
P-R
efle
ctio
n99
562.
632
646.
4–1
,207
.6K
FM02
A_0
21
136
121,
698.
328
.814
7.9
327.
92
P-R
efle
ctio
n99
562.
632
646.
4–1
,207
.6K
FM02
A_0
71
136
121,
698.
328
.814
7.9
327.
91
P-R
efle
ctio
n99
562.
632
646.
4–1
,207
.6K
FM02
A_0
81
136
1228
.814
7.9
327.
999
562.
632
646.
4–1
,207
.613
–14,
105.
129
.014
7.0
327.
02
P-R
efle
ctio
n99
586.
432
619.
2–1
,261
.4P
2_de
pth
2528
013
4,26
7.8
29.0
147.
032
7.0
2P
-Ref
lect
ion
9958
6.4
3261
9.2
–1,2
61.4
P5_
dept
h25
038
413
865.
029
.014
7.0
327.
02
P-R
efle
ctio
n99
586.
432
619.
2–1
,261
.4K
FM01
A_0
11
136
1386
5.0
29.0
147.
032
7.0
2P
-Ref
lect
ion
9958
6.4
3261
9.2
–1,2
61.4
KFM
01A
_02
113
613
865.
029
.014
7.0
327.
01
P-R
efle
ctio
n99
586.
432
619.
2–1
,261
.4K
FM01
A_0
31
136
131,
771.
029
.014
7.0
327.
01
P-R
efle
ctio
n99
586.
432
619.
2–1
,261
.4K
FM02
A_0
11
136
131,
771.
029
.014
7.0
327.
01
P-R
efle
ctio
n99
586.
432
619.
2–1
,261
.4K
FM02
A_0
21
136
131,
771.
029
.014
7.0
327.
01
P-R
efle
ctio
n99
586.
432
619.
2–1
,261
.4K
FM02
A_0
71
136
131,
771.
029
.014
7.0
327.
02
P-R
efle
ctio
n99
586.
432
619.
2–1
,261
.4K
FM02
A_0
81
136
1329
.014
7.0
327.
099
586.
432
619.
2–1
,261
.414
–22,
300.
06.
028
.020
8.0
2P
-Ref
lect
ion
9883
4.1
3291
1.8
–1,7
87.6
P1_
dept
h13
538
514
18,8
47.9
6.3
30.1
210.
12
P-R
efle
ctio
n98
816.
332
893.
7–1
,933
.9P
2_de
pth
140
340
14–2
4,34
0.9
6.3
30.1
210.
12
P-R
efle
ctio
n98
816.
332
893.
7–1
,933
.9P
4_de
pth
2518
514
–28,
500.
06.
330
.121
0.1
2P
-Ref
lect
ion
9881
6.3
3289
3.7
–1,9
33.9
P5_
dept
h50
170
146.
229
.520
9.5
9882
0.8
3289
8.2
–1,8
97.3
1589
,382
.430
.016
3.1
343.
12
P-R
efle
ctio
n99
758.
932
768.
7–1
,374
.2P
1_de
pth
200
370
15–6
,475
.730
.016
3.0
343.
02
P-R
efle
ctio
n99
740.
632
773.
6–1
,341
.4P
2_de
pth
185

95
No.
Dep
thD
ip
(°)
Dip
Dir
(°
)A
zim
uth
(°)
Visi
bilit
yTy
peN
orth
ing
Cru
xEa
stin
g C
rux
Elev
C
rux
Prof
ile1st
re
ceiv
erla
st
rece
iver
153,
330.
030
.016
3.0
343.
02
P-R
efle
ctio
n99
740.
632
773.
6–1
,341
.4P
4_de
pth
185
400
154,
322.
230
.016
3.0
343.
02
P-R
efle
ctio
n99
740.
632
773.
6–1
,341
.4P
5_de
pth
205
384
151,
161.
930
.016
3.0
343.
01
P-R
efle
ctio
n99
740.
632
773.
6–1
,341
.4K
FM01
A_0
51
136
151,
920.
130
.016
1.0
341.
01
P-R
efle
ctio
n99
732.
732
747.
7–1
,342
.2K
FM02
A_0
11
136
151,
920.
130
.016
3.0
343.
02
P-R
efle
ctio
n99
740.
632
773.
6–1
,341
.4K
FM02
A_0
21
136
151,
920.
131
.016
1.0
341.
01
P-R
efle
ctio
n99
745.
132
743.
5–1
,311
.4K
FM02
A_0
71
136
151,
920.
132
.016
0.0
340.
01
P-R
efle
ctio
n99
752.
032
726.
3–1
,280
.7K
FM02
A_0
81
136
1530
.316
2.2
342.
299
743.
532
761.
6–1
,335
.116
–582
.440
.011
3.7
293.
72
P-R
efle
ctio
n99
519.
231
817.
7–1
,537
.4P
1_de
pth
180
163,
389.
540
.011
3.7
293.
72
P-R
efle
ctio
n99
519.
231
817.
7–1
,537
.4P
4_de
pth
390
472
161,
090.
040
.011
3.7
293.
72
P-R
efle
ctio
n99
519.
231
817.
7–1
,537
.4K
FM01
A_0
11
136
161,
090.
040
.011
3.7
293.
72
P-R
efle
ctio
n99
519.
231
817.
7–1
,537
.4K
FM01
A_0
21
136
161,
090.
040
.011
3.7
293.
72
P-R
efle
ctio
n99
519.
231
817.
7–1
,537
.4K
FM01
A_0
31
136
161,
090.
040
.011
3.7
293.
72
P-R
efle
ctio
n99
519.
231
817.
7–1
,537
.4K
FM01
A_0
51
136
162,
659.
540
.011
3.7
293.
71
P-R
efle
ctio
n99
519.
231
817.
7–1
,537
.4K
FM02
A_0
11
136
162,
659.
540
.011
3.7
293.
71
P-R
efle
ctio
n99
519.
231
817.
7–1
,537
.4K
FM02
A_0
21
136
162,
659.
540
.011
3.7
293.
71
P-R
efle
ctio
n99
519.
231
817.
7–1
,537
.4K
FM02
A_0
71
136
1640
.011
3.7
293.
799
519.
231
817.
7–1
,537
.417
–2,6
86.3
42.1
134.
331
4.3
2P
-Ref
lect
ion
1000
81.0
3189
2.1
–1,7
13.7
P1_
dept
h45
135
173,
392.
642
.113
4.3
314.
32
P-R
efle
ctio
n10
0081
.031
892.
1–1
,713
.7P
4_de
pth
270
472
171,
551.
042
.113
4.3
314.
32
P-R
efle
ctio
n10
0081
.031
892.
1–1
,713
.7K
FM01
A_0
11
136
171,
551.
042
.113
4.3
314.
32
P-R
efle
ctio
n10
0081
.031
892.
1–1
,713
.7K
FM01
A_0
21
136
171,
551.
042
.113
4.3
314.
32
P-R
efle
ctio
n10
0081
.031
892.
1–1
,713
.7K
FM01
A_0
31
136
171,
551.
042
.113
4.3
314.
32
P-R
efle
ctio
n10
0081
.031
892.
1–1
,713
.7K
FM01
A_0
51
136
1742
.113
4.3
314.
331
892.
1–1
713.
718
152,
120.
032
.016
2.7
342.
72
P-R
efle
ctio
n99
980.
532
694.
1–1
,643
.8P
1_de
pth
235
370
183,
881.
931
.816
2.7
342.
72
P-R
efle
ctio
n99
966.
932
698.
4–1
,636
.7P
4_de
pth
220
472
184,
883.
530
.016
2.7
342.
72
P-R
efle
ctio
n99
872.
932
727.
7–1
,583
.8P
5_de
pth
290
384

96
No.
Dep
thD
ip
(°)
Dip
Dir
(°
)A
zim
uth
(°)
Visi
bilit
yTy
peN
orth
ing
Cru
xEa
stin
g C
rux
Elev
C
rux
Prof
ile1st
re
ceiv
erla
st
rece
iver
181,
518.
931
.016
2.7
342.
72
P-R
efle
ctio
n99
927.
332
710.
7–1
,615
.4K
FM01
A_0
11
136
181,
518.
931
.016
2.7
342.
71
P-R
efle
ctio
n99
927.
332
710.
7–1
,615
.4K
FM01
A_0
21
136
181,
518.
930
.016
2.7
342.
71
P-R
efle
ctio
n99
897.
632
720.
0–1
,628
.6K
FM01
A_0
31
136
181,
518.
931
.016
2.7
342.
71
P-R
efle
ctio
n99
927.
332
710.
7–1
,615
.4K
FM01
A_0
51
136
182,
320.
731
.016
2.7
342.
72
P-R
efle
ctio
n99
927.
332
710.
7–1
,615
.4K
FM02
A_0
21
136
182,
320.
731
.016
2.7
342.
71
P-R
efle
ctio
n99
927.
332
710.
7–1
,615
.4K
FM02
A_0
81
136
1831
.016
2.7
342.
799
928.
332
710.
4–1
,618
.819
110,
795.
040
.816
2.9
342.
92
P-R
efle
ctio
n10
0399
.032
570.
2–1
,697
.4P
1_de
pth
140
450
193,
662.
440
.816
2.9
342.
92
P-R
efle
ctio
n10
0399
.032
570.
2–1
,697
.4P
4_de
pth
274
472
191,
940.
440
.816
2.9
342.
92
P-R
efle
ctio
n10
0399
.032
570.
2–1
,697
.4K
FM01
A_0
11
136
191,
940.
440
.816
2.9
342.
92
P-R
efle
ctio
n10
0399
.032
570.
2–1
,697
.4K
FM01
A_0
21
136
191,
940.
440
.816
2.9
342.
91
P-R
efle
ctio
n10
0399
.032
570.
2–1
,697
.4K
FM01
A_0
31
136
191,
940.
440
.816
2.9
342.
91
P-R
efle
ctio
n10
0399
.032
570.
2–1
,697
.4K
FM01
A_0
51
136
1940
.816
2.9
342.
910
0399
.032
570.
2–1
,697
.420
850,
420.
037
.716
1.9
341.
92
P-R
efle
ctio
n10
0368
.032
552.
8–1
,860
.2P
1_de
pth
5540
020
4,04
9.7
39.0
161.
934
1.9
2P
-Ref
lect
ion
1004
47.0
3252
6.9
–1,8
79.9
P4_
dept
h32
047
220
2,03
2.5
37.7
161.
934
1.9
2P
-Ref
lect
ion
1003
68.0
3255
2.8
–1,8
60.2
KFM
01A
_01
113
620
2,03
2.5
39.0
161.
934
1.9
1P
-Ref
lect
ion
1004
03.0
3254
1.2
–1,8
23.1
KFM
01A
_02
113
620
2,03
2.5
37.7
161.
934
1.9
2P
-Ref
lect
ion
1003
68.0
3255
2.8
–1,8
60.2
KFM
01A
_03
113
620
2,03
2.5
39.0
161.
934
1.9
1P
-Ref
lect
ion
1004
03.0
3254
1.2
–1,8
23.1
KFM
01A
_05
113
620
38.4
161.
934
1.9
1003
92.8
3254
4.6
–1,8
51.1
211,
285.
463
.021
6.3
36.3
2P
-Ref
lect
ion
9874
7.0
3281
4.3
159.
9P
1_de
pth
200
250
211,
458.
766
.021
7.0
37.0
2P
-Ref
lect
ion
9872
1.4
3279
0.1
155.
3P
4_de
pth
160
280
2123
3.5
64.2
216.
336
.32
P-R
efle
ctio
n98
741.
932
810.
515
5.1
P5_
dept
h1
4521
265.
564
.221
6.3
36.3
1P
-Ref
lect
ion
9874
1.9
3281
0.5
155.
1K
FM01
A_0
21
3421
265.
564
.221
6.3
36.3
2P
-Ref
lect
ion
9874
1.9
3281
0.5
155.
1K
FM01
A_0
31
3421
–571
.764
.221
6.3
36.3
1P
-Ref
lect
ion
9874
1.9
3281
0.5
155.
1K
FM02
A_0
11
136
21–5
71.7
64.2
216.
336
.31
P-R
efle
ctio
n98
741.
932
810.
515
5.1
KFM
02A
_02
113
6

97
No.
Dep
thD
ip
(°)
Dip
Dir
(°
)A
zim
uth
(°)
Visi
bilit
yTy
peN
orth
ing
Cru
xEa
stin
g C
rux
Elev
C
rux
Prof
ile1st
re
ceiv
erla
st
rece
iver
21–5
71.7
64.2
216.
336
.31
P-R
efle
ctio
n98
741.
932
810.
515
5.1
KFM
02A
_08
113
621
64.2
216.
436
.498
740.
032
808.
415
5.7
221,
344.
463
.121
6.6
36.6
1P
-Ref
lect
ion
9877
1.8
3283
0.3
144.
1P
1_de
pth
190
270
221,
541.
263
.121
6.6
36.6
1P
-Ref
lect
ion
9877
1.8
3283
0.3
144.
1P
4_de
pth
160
275
2229
7.0
63.1
216.
636
.62
P-R
efle
ctio
n98
771.
832
830.
314
4.1
P5_
dept
h15
5022
350.
963
.121
6.6
36.6
1P
-Ref
lect
ion
9877
1.8
3283
0.3
144.
1K
FM01
A_0
21
5122
350.
963
.121
6.6
36.6
1P
-Ref
lect
ion
9877
1.8
3283
0.3
144.
1K
FM01
A_0
31
5122
–472
.363
.121
6.6
36.6
2P
-Ref
lect
ion
9877
1.8
3283
0.3
144.
1K
FM02
A_0
11
136
2263
.121
6.6
36.6
3283
0.3
144.
123
675.
670
.023
3.8
53.8
2P
-Ref
lect
ion
9859
7.8
3245
0.9
247.
1K
FM01
A_0
11
116
2367
5.6
70.0
233.
853
.82
P-R
efle
ctio
n98
597.
832
450.
924
7.1
KFM
01A
_02
111
623
675.
670
.023
3.8
53.8
2P
-Ref
lect
ion
9859
7.8
3245
0.9
247.
1K
FM01
A_0
31
116
2367
5.6
70.0
233.
853
.81
P-S
, S-P
Con
vers
ion
9859
7.8
3245
0.9
247.
1K
FM01
A_0
51
108
2370
.023
3.8
53.8
9859
7.8
3245
0.9
247.
124
2,80
9.5
82.2
237.
757
.72
P-R
efle
ctio
n98
548.
232
285.
611
6.1
KFM
01A
_01
113
624
2,80
9.5
82.2
237.
757
.72
P-R
efle
ctio
n98
548.
232
285.
611
6.1
KFM
01A
_02
113
624
2,80
9.5
82.2
237.
757
.72
P-R
efle
ctio
n98
548.
232
285.
611
6.1
KFM
01A
_03
113
624
–16,
389.
584
.023
7.8
57.8
1P
-Ref
lect
ion
9853
2.9
3225
7.1
93.0
KFM
02A
_01
113
624
–15,
532.
283
.823
7.9
57.9
2P
-Ref
lect
ion
9853
6.7
3226
2.2
94.6
KFM
02A
_02
113
624
–11,
477.
082
.823
7.2
57.2
2P
-Ref
lect
ion
9853
1.1
3227
3.5
109.
9K
FM02
A_0
71
136
24–4
7,47
4.4
86.0
237.
957
.91
P-R
efle
ctio
n98
545.
932
275.
559
.7K
FM02
A_0
81
136
2483
.323
7.7
57.7
9854
1.6
3227
5.0
100.
825
6,51
5.0
47.3
169.
934
9.9
2P
-Ref
lect
ion
9990
3.3
3283
9.8
–845
.8P
1_de
pth
450
570
25–2
,840
.947
.316
9.9
349.
92
P-R
efle
ctio
n99
903.
332
839.
8–8
45.8
P2_
dept
h15
180
252,
113.
047
.316
9.9
349.
92
P-R
efle
ctio
n99
903.
332
839.
8–8
45.8
P4_
dept
h32
541
725
2,93
1.3
47.3
169.
934
9.9
1P
-Ref
lect
ion
9990
3.3
3283
9.8
–845
.8P
5_de
pth
323
384
2588
2.5
47.3
169.
934
9.9
2P
-Ref
lect
ion
9990
3.3
3283
9.8
–845
.8K
FM01
A_0
11
136
2588
2.5
47.3
169.
934
9.9
2P
-Ref
lect
ion
9990
3.3
3283
9.8
–845
.8K
FM01
A_0
21
136

98
No.
Dep
thD
ip
(°)
Dip
Dir
(°
)A
zim
uth
(°)
Visi
bilit
yTy
peN
orth
ing
Cru
xEa
stin
g C
rux
Elev
C
rux
Prof
ile1st
re
ceiv
erla
st
rece
iver
2588
2.5
47.3
169.
934
9.9
2P
-Ref
lect
ion
9990
3.3
3283
9.8
–845
.8K
FM01
A_0
31
136
2588
2.5
47.3
169.
934
9.9
2P
-Ref
lect
ion
9990
3.3
3283
9.8
–845
.8K
FM01
A_0
51
136
252,
068.
847
.316
9.9
349.
92
P-R
efle
ctio
n99
903.
332
839.
8–8
45.8
KFM
02A
_01
113
625
2,06
8.8
47.3
169.
934
9.9
2P
-Ref
lect
ion
9990
3.3
3283
9.8
–845
.8K
FM02
A_0
21
136
252,
068.
847
.316
9.9
349.
91
P-R
efle
ctio
n99
903.
332
839.
8–8
45.8
KFM
02A
_08
113
625
47.3
169.
934
9.9
9990
3.3
3283
9.8
–845
.826
1,71
3.7
65.0
220.
040
.01
P-R
efle
ctio
n98
912.
032
926.
153
.6P
1_de
pth
275
337
262,
141.
365
.022
0.0
40.0
1P
-Ref
lect
ion
9891
2.0
3292
6.1
53.6
P4_
dept
h25
037
126
660.
465
.022
0.0
40.0
2P
-Ref
lect
ion
9891
2.0
3292
6.1
53.6
P5_
dept
h20
115
261,
086.
965
.022
0.0
40.0
2P
-Ref
lect
ion
9891
2.0
3292
6.1
53.6
KFM
01A
_01
113
626
1,08
6.9
65.0
220.
040
.01
P-R
efle
ctio
n98
912.
032
926.
153
.6K
FM01
A_0
21
136
261,
086.
965
.022
0.0
40.0
1P
-Ref
lect
ion
9891
2.0
3292
6.1
53.6
KFM
01A
_03
113
626
1,08
6.9
65.0
220.
040
.02
P-R
efle
ctio
n98
912.
032
926.
153
.6K
FM01
A_0
51
136
26–7
3.0
65.0
220.
040
.01
P-R
efle
ctio
n98
912.
032
926.
153
.6K
FM02
A_0
21
136
26–7
3.0
65.0
220.
040
.01
P-S
, S-P
Con
vers
ion
9891
2.0
3292
6.1
53.6
KFM
02A
_07
169
2665
.022
0.0
40.0
9891
2.0
3292
6.1
53.6
273,
037.
378
.322
6.2
46.2
2P
-Ref
lect
ion
9882
6.3
3281
8.9
52.1
KFM
01A
_01
113
627
3,03
7.3
78.3
226.
246
.22
P-R
efle
ctio
n98
826.
332
818.
952
.1K
FM01
A_0
21
136
273,
037.
378
.322
6.2
46.2
2P
-Ref
lect
ion
9882
6.3
3281
8.9
52.1
KFM
01A
_03
113
627
3,03
7.3
78.3
226.
246
.22
P-R
efle
ctio
n98
826.
332
818.
952
.1K
FM01
A_0
51
136
27–1
2,55
0.0
86.7
228.
148
.11
P-R
efle
ctio
n98
779.
632
754.
119
.2K
FM02
A_0
11
136
2711
,152
.389
.422
8.4
48.4
1P
-Ref
lect
ion
9876
9.9
3274
0.8
3.6
KFM
02A
_02
113
627
–12,
550.
086
.722
8.1
48.1
1P
-S, S
-P C
onve
rsio
n98
779.
632
754.
119
.2K
FM02
A_0
71
136
274,
935.
189
.149
.122
9.1
1P
-Ref
lect
ion
9879
3.6
3276
1.4
–5.1
KFM
02A
_08
113
627
83.1
249.
869
.898
803.
532
785.
830
.728
2,95
5.1
69.2
229.
349
.32
P-R
efle
ctio
n98
891.
732
874.
163
.0P
4_de
pth
411
472
282,
026.
269
.222
9.3
49.3
2P
-Ref
lect
ion
9889
1.7
3287
4.1
63.0
KFM
01A
_01
113
628
2,02
6.2
69.2
229.
349
.32
P-R
efle
ctio
n98
891.
732
874.
163
.0K
FM01
A_0
21
136

99
No.
Dep
thD
ip
(°)
Dip
Dir
(°
)A
zim
uth
(°)
Visi
bilit
yTy
peN
orth
ing
Cru
xEa
stin
g C
rux
Elev
C
rux
Prof
ile1st
re
ceiv
erla
st
rece
iver
282,
026.
269
.222
9.3
49.3
2P
-Ref
lect
ion
9889
1.7
3287
4.1
63.0
KFM
01A
_03
113
628
2,02
6.2
69.2
229.
349
.32
P-R
efle
ctio
n98
891.
732
874.
163
.0K
FM01
A_0
51
136
28–4
04.2
69.2
229.
349
.31
P-R
efle
ctio
n98
891.
732
874.
163
.0K
FM02
A_0
11
136
28–4
04.2
69.2
229.
349
.31
P-R
efle
ctio
n98
891.
732
874.
163
.0K
FM02
A_0
21
136
28–4
04.2
69.2
229.
349
.32
P-R
efle
ctio
n98
891.
732
874.
163
.0K
FM02
A_0
81
136
2869
.222
9.3
49.3
9889
1.7
3287
4.1
63.0
292,
163.
256
.022
3.0
43.0
2P
-Ref
lect
ion
9909
0.5
3308
4.4
–83.
4P
1_de
pth
340
414
291,
430.
556
.022
3.0
43.0
2P
-Ref
lect
ion
9910
2.9
3309
6.0
–94.
9P
5_de
pth
6015
029
1,52
0.0
58.9
221.
741
.72
P-R
efle
ctio
n99
113.
833
101.
3–9
2.0
KFM
01A
_01
113
629
1,52
0.0
58.9
221.
741
.72
P-R
efle
ctio
n99
113.
833
101.
3–9
2.0
KFM
01A
_02
113
629
1,52
0.0
58.9
221.
741
.72
P-R
efle
ctio
n99
113.
833
101.
3–9
2.0
KFM
01A
_05
113
629
533.
258
.922
1.7
41.7
2P
-S, S
-P C
onve
rsio
n99
113.
833
101.
3–9
2.0
KFM
02A
_01
187
2953
3.2
58.9
221.
741
.71
P-R
efle
ctio
n99
113.
833
101.
3–9
2.0
KFM
02A
_07
187
2953
3.2
58.9
221.
741
.72
P-R
efle
ctio
n99
113.
833
101.
3–9
2.0
KFM
02A
_08
187
2958
.122
2.0
42.0
9910
9.5
3309
8.5
–91.
330
2,30
5.3
63.0
223.
343
.32
P-R
efle
ctio
n99
172.
233
162.
4–1
20.6
P1_
dept
h38
545
530
1,67
0.0
63.0
223.
043
.02
P-R
efle
ctio
n99
176.
033
164.
1–1
22.6
P5_
dept
h55
160
301,
961.
061
.322
3.3
43.3
2P
-Ref
lect
ion
9916
7.0
3315
7.5
–125
.5K
FM01
A_0
11
136
301,
961.
061
.322
3.3
43.3
2P
-Ref
lect
ion
9916
7.0
3315
7.5
–125
.5K
FM01
A_0
21
136
301,
961.
061
.322
3.3
43.3
2P
-Ref
lect
ion
9916
7.0
3315
7.5
–125
.5K
FM01
A_0
31
136
301,
961.
061
.322
3.3
43.3
2P
-Ref
lect
ion
9916
7.0
3315
7.5
–125
.5K
FM01
A_0
51
136
3075
0.0
58.0
223.
043
.02
P-R
efle
ctio
n99
186.
333
173.
7–1
59.1
KFM
02A
_01
112
630
750.
058
.022
3.0
43.0
2P
-Ref
lect
ion
9918
6.3
3317
3.7
–159
.1K
FM02
A_0
21
126
3075
0.0
60.0
223.
043
.01
P-R
efle
ctio
n99
175.
033
163.
2–1
38.1
KFM
02A
_07
112
630
750.
058
.022
3.0
43.0
2P
-Ref
lect
ion
9918
6.3
3317
3.7
–159
.1K
FM02
A_0
81
126
3060
.522
3.2
43.2
9917
5.0
3316
4.1
–136
.131
2,40
0.0
62.0
220.
040
.02
P-R
efle
ctio
n99
265.
433
222.
7–1
84.2
P1_
dept
h40
047
531
3,25
5.0
66.0
220.
040
.02
P-R
efle
ctio
n99
300.
933
252.
5–1
74.9
P4_
dept
h39
047
2
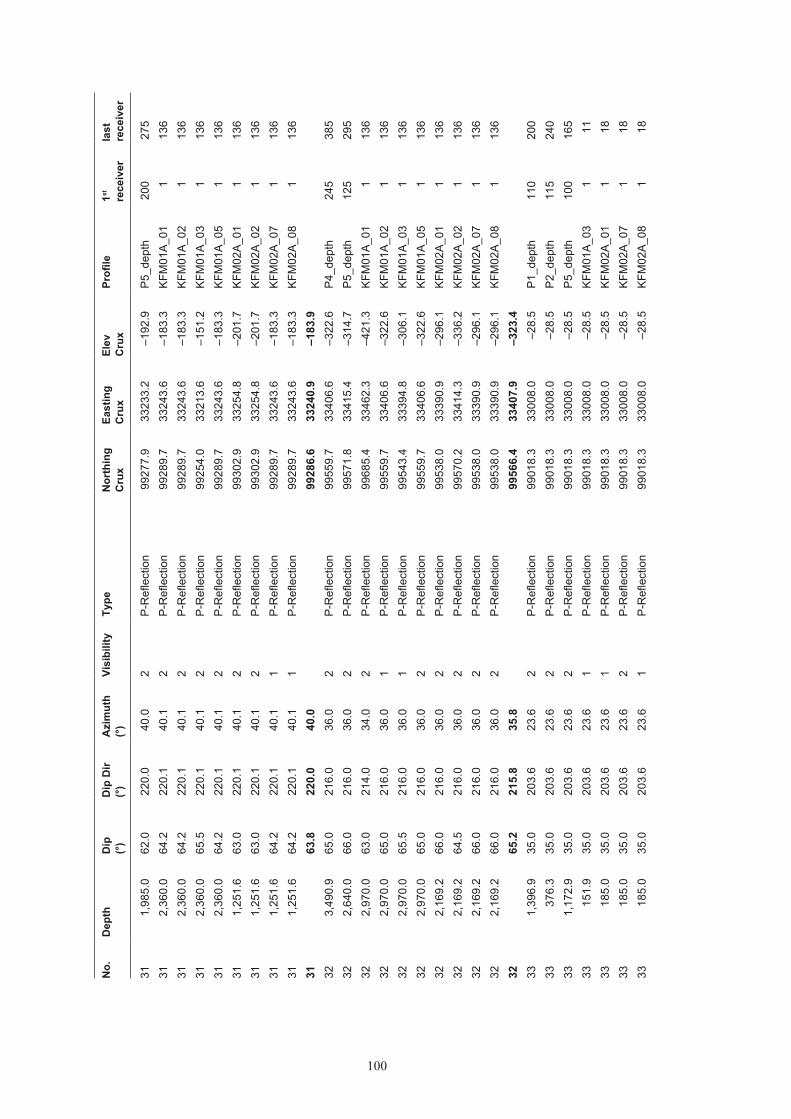
100
No.
Dep
thD
ip
(°)
Dip
Dir
(°
)A
zim
uth
(°)
Visi
bilit
yTy
peN
orth
ing
Cru
xEa
stin
g C
rux
Elev
C
rux
Prof
ile1st
re
ceiv
erla
st
rece
iver
311,
985.
062
.022
0.0
40.0
2P
-Ref
lect
ion
9927
7.9
3323
3.2
–192
.9P
5_de
pth
200
275
312,
360.
064
.222
0.1
40.1
2P
-Ref
lect
ion
9928
9.7
3324
3.6
–183
.3K
FM01
A_0
11
136
312,
360.
064
.222
0.1
40.1
2P
-Ref
lect
ion
9928
9.7
3324
3.6
–183
.3K
FM01
A_0
21
136
312,
360.
065
.522
0.1
40.1
2P
-Ref
lect
ion
9925
4.0
3321
3.6
–151
.2K
FM01
A_0
31
136
312,
360.
064
.222
0.1
40.1
2P
-Ref
lect
ion
9928
9.7
3324
3.6
–183
.3K
FM01
A_0
51
136
311,
251.
663
.022
0.1
40.1
2P
-Ref
lect
ion
9930
2.9
3325
4.8
–201
.7K
FM02
A_0
11
136
311,
251.
663
.022
0.1
40.1
2P
-Ref
lect
ion
9930
2.9
3325
4.8
–201
.7K
FM02
A_0
21
136
311,
251.
664
.222
0.1
40.1
1P
-Ref
lect
ion
9928
9.7
3324
3.6
–183
.3K
FM02
A_0
71
136
311,
251.
664
.222
0.1
40.1
1P
-Ref
lect
ion
9928
9.7
3324
3.6
–183
.3K
FM02
A_0
81
136
3163
.822
0.0
40.0
9928
6.6
3324
0.9
–183
.932
3,49
0.9
65.0
216.
036
.02
P-R
efle
ctio
n99
559.
733
406.
6–3
22.6
P4_
dept
h24
538
532
2,64
0.0
66.0
216.
036
.02
P-R
efle
ctio
n99
571.
833
415.
4–3
14.7
P5_
dept
h12
529
532
2,97
0.0
63.0
214.
034
.02
P-R
efle
ctio
n99
685.
433
462.
3–4
21.3
KFM
01A
_01
113
632
2,97
0.0
65.0
216.
036
.01
P-R
efle
ctio
n99
559.
733
406.
6–3
22.6
KFM
01A
_02
113
632
2,97
0.0
65.5
216.
036
.01
P-R
efle
ctio
n99
543.
433
394.
8–3
06.1
KFM
01A
_03
113
632
2,97
0.0
65.0
216.
036
.02
P-R
efle
ctio
n99
559.
733
406.
6–3
22.6
KFM
01A
_05
113
632
2,16
9.2
66.0
216.
036
.02
P-R
efle
ctio
n99
538.
033
390.
9–2
96.1
KFM
02A
_01
113
632
2,16
9.2
64.5
216.
036
.02
P-R
efle
ctio
n99
570.
233
414.
3–3
36.2
KFM
02A
_02
113
632
2,16
9.2
66.0
216.
036
.02
P-R
efle
ctio
n99
538.
033
390.
9–2
96.1
KFM
02A
_07
113
632
2,16
9.2
66.0
216.
036
.02
P-R
efle
ctio
n99
538.
033
390.
9–2
96.1
KFM
02A
_08
113
632
65.2
215.
835
.899
566.
433
407.
9–3
23.4
331,
396.
935
.020
3.6
23.6
2P
-Ref
lect
ion
9901
8.3
3300
8.0
–28.
5P
1_de
pth
110
200
3337
6.3
35.0
203.
623
.62
P-R
efle
ctio
n99
018.
333
008.
0–2
8.5
P2_
dept
h11
524
033
1,17
2.9
35.0
203.
623
.62
P-R
efle
ctio
n99
018.
333
008.
0–2
8.5
P5_
dept
h10
016
533
151.
935
.020
3.6
23.6
1P
-Ref
lect
ion
9901
8.3
3300
8.0
–28.
5K
FM01
A_0
31
1133
185.
035
.020
3.6
23.6
1P
-Ref
lect
ion
9901
8.3
3300
8.0
–28.
5K
FM02
A_0
11
1833
185.
035
.020
3.6
23.6
2P
-Ref
lect
ion
9901
8.3
3300
8.0
–28.
5K
FM02
A_0
71
1833
185.
035
.020
3.6
23.6
1P
-Ref
lect
ion
9901
8.3
3300
8.0
–28.
5K
FM02
A_0
81
18

101
No.
Dep
thD
ip
(°)
Dip
Dir
(°
)A
zim
uth
(°)
Visi
bilit
yTy
peN
orth
ing
Cru
xEa
stin
g C
rux
Elev
C
rux
Prof
ile1st
re
ceiv
erla
st
rece
iver
3335
.020
3.6
23.6
9901
8.3
3300
8.0
–28.
534
327.
135
.519
7.8
17.8
1P
-Ref
lect
ion
9901
8.7
3300
6.0
–27.
5P
2_de
pth
100
185
341,
281.
035
.519
7.8
17.8
1P
-Ref
lect
ion
9901
8.7
3300
6.0
–27.
5P
4_de
pth
100
150
341,
186.
635
.519
7.8
17.8
1P
-Ref
lect
ion
9901
8.7
3300
6.0
–27.
5P
5_de
pth
140
222
3420
5.0
35.5
197.
817
.81
P-R
efle
ctio
n99
018.
733
006.
0–2
7.5
KFM
02A
_01
122
3420
5.1
35.5
197.
817
.81
P-R
efle
ctio
n99
018.
733
006.
0–2
7.5
KFM
02A
_07
121
3420
5.1
35.5
197.
817
.82
P-R
efle
ctio
n99
018.
733
006.
0–2
7.5
KFM
02A
_08
122
3435
.519
7.8
17.8
9901
8.7
3300
6.0
–27.
535
210.
042
.518
0.0
0.0
1P
-Ref
lect
ion
9899
6.5
3300
0.0
3.9
P2_
dept
h11
518
035
582.
740
.017
8.0
358.
01
P-R
efle
ctio
n98
988.
833
000.
413
.3P
4_de
pth
5011
035
1,14
2.4
42.5
178.
035
8.0
1P
-Ref
lect
ion
9898
7.7
3300
0.4
13.5
P5_
dept
h16
022
035
245.
042
.517
8.0
358.
01
P-R
efle
ctio
n98
987.
733
000.
413
.5K
FM02
A_0
11
2935
245.
042
.517
8.0
358.
01
P-S
, S-P
Con
vers
ion
9898
7.7
3300
0.4
13.5
KFM
02A
_02
130
3524
5.0
42.5
178.
035
8.0
1P
-Ref
lect
ion
9898
7.7
3300
0.4
13.5
KFM
02A
_07
129
3524
5.0
42.5
178.
035
8.0
1P
-Ref
lect
ion
9898
7.7
3300
0.4
13.5
KFM
02A
_08
129
3542
.112
6.9
306.
998
989.
133
000.
312
.136
1,18
4.7
66.0
108.
928
8.9
2P
-Ref
lect
ion
9896
6.9
3309
6.7
45.5
P2_
dept
h17
320
736
1,18
2.9
66.0
108.
928
8.9
2P
-Ref
lect
ion
9896
6.9
3309
6.7
45.5
P5_
dept
h18
022
536
275.
966
.010
8.9
288.
92
P-R
efle
ctio
n98
966.
933
096.
745
.5K
FM02
A_0
11
3636
275.
966
.010
8.9
288.
92
P-R
efle
ctio
n98
966.
933
096.
745
.5K
FM02
A_0
21
3636
275.
966
.010
8.9
288.
92
P-S
, S-P
Con
vers
ion
9896
6.9
3309
6.7
45.5
KFM
02A
_07
136
3627
5.9
66.0
108.
928
8.9
2P
-S, S
-P C
onve
rsio
n98
966.
933
096.
745
.5K
FM02
A_0
81
3636
66.0
108.
928
8.9
9896
6.9
3309
6.7
45.5
3713
7.6
57.0
170.
035
0.0
2P
-Ref
lect
ion
9895
7.1
3300
7.6
28.3
P2_
dept
h10
817
137
1,12
7.3
57.0
170.
035
0.0
2P
-Ref
lect
ion
9895
7.1
3300
7.6
28.3
P5_
dept
h50
150
3737
0.4
57.0
170.
035
0.0
1P
-Ref
lect
ion
9895
7.1
3300
7.6
28.3
KFM
02A
_01
149
3737
0.4
57.0
170.
035
0.0
2P
-S, S
-P C
onve
rsio
n98
957.
133
007.
628
.3K
FM02
A_0
21
4937
370.
457
.017
0.0
350.
02
P-R
efle
ctio
n98
957.
133
007.
628
.3K
FM02
A_0
71
49

102
No.
Dep
thD
ip
(°)
Dip
Dir
(°
)A
zim
uth
(°)
Visi
bilit
yTy
peN
orth
ing
Cru
xEa
stin
g C
rux
Elev
C
rux
Prof
ile1st
re
ceiv
erla
st
rece
iver
3737
0.4
57.0
170.
035
0.0
2P
-Ref
lect
ion
9895
7.1
3300
7.6
28.3
KFM
02A
_08
149
3757
.017
0.0
350.
098
957.
133
007.
628
.338
3,33
8.6
48.5
120.
030
0.0
2P
-Ref
lect
ion
9907
1.1
3287
6.9
–126
.0P
2_de
pth
118
538
1,46
2.3
48.5
122.
730
2.7
2P
-Ref
lect
ion
9903
7.7
3294
1.1
–62.
0P
5_de
pth
107
282
3845
2.3
48.5
122.
730
2.7
2P
-Ref
lect
ion
9903
7.7
3294
1.1
–62.
0K
FM02
A_0
11
7738
452.
348
.512
2.7
302.
71
P-R
efle
ctio
n99
037.
732
941.
1–6
2.0
KFM
02A
_02
171
3845
2.3
48.5
122.
730
2.7
1P
-Ref
lect
ion
9903
7.7
3294
1.1
–62.
0K
FM02
A_0
71
7138
452.
348
.512
2.7
302.
72
P-R
efle
ctio
n99
037.
732
941.
1–6
2.0
KFM
02A
_08
171
3848
.512
2.2
302.
299
043.
332
930.
4–7
2.6
391,
932.
928
.014
0.5
320.
52
P-R
efle
ctio
n99
109.
432
909.
8–2
66.8
P5_
dept
h14
030
039
482.
126
.714
0.5
320.
52
P-R
efle
ctio
n99
099.
932
917.
6–2
58.0
KFM
02A
_01
186
3948
2.1
26.7
140.
532
0.5
2P
-Ref
lect
ion
9909
9.9
3291
7.6
–258
.0K
FM02
A_0
21
8639
482.
126
.714
0.5
320.
51
P-R
efle
ctio
n99
099.
932
917.
6–2
58.0
KFM
02A
_07
186
3948
2.1
26.7
140.
532
0.5
1P
-Ref
lect
ion
9909
9.9
3291
7.6
–258
.0K
FM02
A_0
81
8639
26.9
140.
532
0.5
9910
1.8
3291
6.0
–259
.740
220,
236.
05.
813
2.3
312.
32
P-R
efle
ctio
n99
033.
332
963.
4–4
91.6
P2_
dept
h10
082
540
6,72
5.8
5.8
132.
031
2.0
2P
-Ref
lect
ion
9903
3.0
3296
3.3
–490
.1P
5_de
pth
138
440
369.
16.
213
2.3
312.
31
P-R
efle
ctio
n99
038.
632
957.
6–5
28.9
KFM
01A
_01
154
4036
9.1
6.2
132.
331
2.3
1P
-Ref
lect
ion
9903
8.6
3295
7.6
–528
.9K
FM01
A_0
31
5440
369.
16.
213
2.3
312.
31
P-R
efle
ctio
n99
038.
632
957.
6–5
28.9
KFM
01A
_05
152
4057
5.2
6.2
132.
331
2.3
1P
-Ref
lect
ion
9903
8.6
3295
7.6
–528
.9K
FM02
A_0
11
9640
575.
26.
213
2.3
312.
31
P-R
efle
ctio
n99
038.
632
957.
6–5
28.9
KFM
02A
_02
196
4057
5.2
6.2
132.
331
2.3
2P
-Ref
lect
ion
9903
8.6
3295
7.6
–528
.9K
FM02
A_0
71
9640
575.
26.
213
2.3
312.
32
P-R
efle
ctio
n99
038.
632
957.
6–5
28.9
KFM
02A
_08
196
406.
113
2.3
312.
399
037.
432
958.
9–5
20.4
41–4
1,47
8.3
26.0
135.
631
5.6
2P
-Ref
lect
ion
9913
0.1
3287
2.5
–373
.5P
2_de
pth
192
541
2,29
3.5
26.9
135.
631
5.6
2P
-Ref
lect
ion
9913
8.3
3286
4.5
–382
.2P
5_de
pth
234
384
4163
1.1
26.9
135.
631
5.6
2P
-Ref
lect
ion
9913
8.3
3286
4.5
–382
.2K
FM02
A_0
11
107
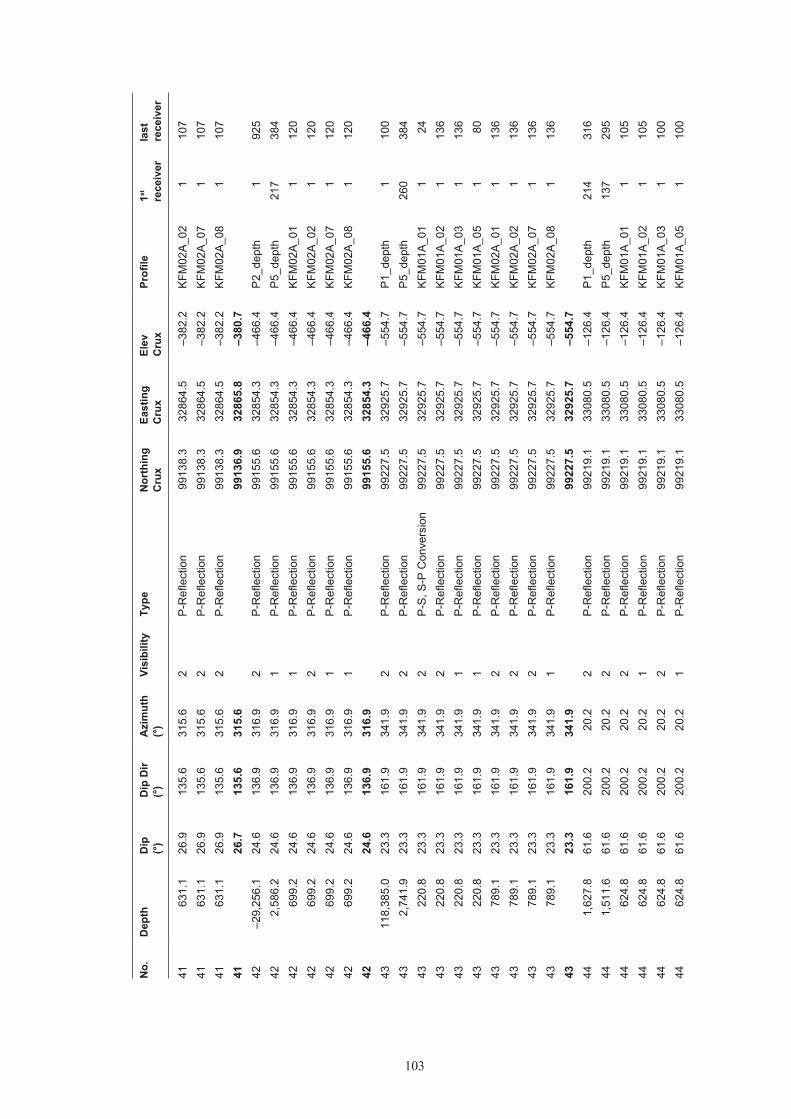
103
No.
Dep
thD
ip
(°)
Dip
Dir
(°
)A
zim
uth
(°)
Visi
bilit
yTy
peN
orth
ing
Cru
xEa
stin
g C
rux
Elev
C
rux
Prof
ile1st
re
ceiv
erla
st
rece
iver
4163
1.1
26.9
135.
631
5.6
2P
-Ref
lect
ion
9913
8.3
3286
4.5
–382
.2K
FM02
A_0
21
107
4163
1.1
26.9
135.
631
5.6
2P
-Ref
lect
ion
9913
8.3
3286
4.5
–382
.2K
FM02
A_0
71
107
4163
1.1
26.9
135.
631
5.6
2P
-Ref
lect
ion
9913
8.3
3286
4.5
–382
.2K
FM02
A_0
81
107
4126
.713
5.6
315.
699
136.
932
865.
8–3
80.7
42–2
9,25
6.1
24.6
136.
931
6.9
2P
-Ref
lect
ion
9915
5.6
3285
4.3
–466
.4P
2_de
pth
192
542
2,58
6.2
24.6
136.
931
6.9
1P
-Ref
lect
ion
9915
5.6
3285
4.3
–466
.4P
5_de
pth
217
384
4269
9.2
24.6
136.
931
6.9
1P
-Ref
lect
ion
9915
5.6
3285
4.3
–466
.4K
FM02
A_0
11
120
4269
9.2
24.6
136.
931
6.9
2P
-Ref
lect
ion
9915
5.6
3285
4.3
–466
.4K
FM02
A_0
21
120
4269
9.2
24.6
136.
931
6.9
1P
-Ref
lect
ion
9915
5.6
3285
4.3
–466
.4K
FM02
A_0
71
120
4269
9.2
24.6
136.
931
6.9
1P
-Ref
lect
ion
9915
5.6
3285
4.3
–466
.4K
FM02
A_0
81
120
4224
.613
6.9
316.
999
155.
632
854.
3–4
66.4
4311
8,38
5.0
23.3
161.
934
1.9
2P
-Ref
lect
ion
9922
7.5
3292
5.7
–554
.7P
1_de
pth
110
043
2,74
1.9
23.3
161.
934
1.9
2P
-Ref
lect
ion
9922
7.5
3292
5.7
–554
.7P
5_de
pth
260
384
4322
0.8
23.3
161.
934
1.9
2P
-S, S
-P C
onve
rsio
n99
227.
532
925.
7–5
54.7
KFM
01A
_01
124
4322
0.8
23.3
161.
934
1.9
2P
-Ref
lect
ion
9922
7.5
3292
5.7
–554
.7K
FM01
A_0
21
136
4322
0.8
23.3
161.
934
1.9
1P
-Ref
lect
ion
9922
7.5
3292
5.7
–554
.7K
FM01
A_0
31
136
4322
0.8
23.3
161.
934
1.9
1P
-Ref
lect
ion
9922
7.5
3292
5.7
–554
.7K
FM01
A_0
51
8043
789.
123
.316
1.9
341.
92
P-R
efle
ctio
n99
227.
532
925.
7–5
54.7
KFM
02A
_01
113
643
789.
123
.316
1.9
341.
92
P-R
efle
ctio
n99
227.
532
925.
7–5
54.7
KFM
02A
_02
113
643
789.
123
.316
1.9
341.
92
P-R
efle
ctio
n99
227.
532
925.
7–5
54.7
KFM
02A
_07
113
643
789.
123
.316
1.9
341.
91
P-R
efle
ctio
n99
227.
532
925.
7–5
54.7
KFM
02A
_08
113
643
23.3
161.
934
1.9
9922
7.5
3292
5.7
–554
.744
1,62
7.8
61.6
200.
220
.22
P-R
efle
ctio
n99
219.
133
080.
5–1
26.4
P1_
dept
h21
431
644
1,51
1.6
61.6
200.
220
.22
P-R
efle
ctio
n99
219.
133
080.
5–1
26.4
P5_
dept
h13
729
544
624.
861
.620
0.2
20.2
2P
-Ref
lect
ion
9921
9.1
3308
0.5
–126
.4K
FM01
A_0
11
105
4462
4.8
61.6
200.
220
.21
P-R
efle
ctio
n99
219.
133
080.
5–1
26.4
KFM
01A
_02
110
544
624.
861
.620
0.2
20.2
2P
-Ref
lect
ion
9921
9.1
3308
0.5
–126
.4K
FM01
A_0
31
100
4462
4.8
61.6
200.
220
.21
P-R
efle
ctio
n99
219.
133
080.
5–1
26.4
KFM
01A
_05
110
0

104
No.
Dep
thD
ip
(°)
Dip
Dir
(°
)A
zim
uth
(°)
Visi
bilit
yTy
peN
orth
ing
Cru
xEa
stin
g C
rux
Elev
C
rux
Prof
ile1st
re
ceiv
erla
st
rece
iver
4493
6.0
61.6
200.
220
.22
P-S
, S-P
Con
vers
ion
9921
9.1
3308
0.5
–126
.4K
FM02
A_0
11
136
4493
6.0
61.6
200.
220
.22
P-R
efle
ctio
n99
219.
133
080.
5–1
26.4
KFM
02A
_02
113
644
936.
061
.620
0.2
20.2
2P
-Ref
lect
ion
9921
9.1
3308
0.5
–126
.4K
FM02
A_0
71
136
4493
6.0
61.6
200.
220
.22
P-S
, S-P
Con
vers
ion
9921
9.1
3308
0.5
–126
.4K
FM02
A_0
81
136
4461
.620
0.2
20.2
9921
9.1
3308
0.5
–126
.445
1,31
2.7
40.0
170.
235
0.2
2P
-Ref
lect
ion
9936
4.9
3293
6.8
–441
.3P
4_de
pth
181
247
452,
110.
840
.017
0.2
350.
22
P-R
efle
ctio
n99
364.
932
936.
8–4
41.3
P5_
dept
h29
138
445
981.
940
.017
0.2
350.
22
P-R
efle
ctio
n99
364.
932
936.
8–4
41.3
KFM
02A
_01
113
645
981.
940
.017
0.2
350.
22
P-R
efle
ctio
n99
364.
932
936.
8–4
41.3
KFM
02A
_02
113
645
981.
940
.017
0.2
350.
22
P-R
efle
ctio
n99
364.
932
936.
8–4
41.3
KFM
02A
_07
113
645
981.
940
.017
0.2
350.
22
P-R
efle
ctio
n99
364.
932
936.
8–4
41.3
KFM
02A
_08
113
645
40.0
170.
235
0.2
9936
4.9
3293
6.8
–441
.346
421.
482
.017
0.5
350.
52
P-R
efle
ctio
n98
780.
633
036.
931
.1P
2_de
pth
112
186
46–4
,089
.681
.817
0.0
350.
01
P-R
efle
ctio
n98
768.
633
040.
834
.1K
FM01
A_0
11
136
46–4
,089
.682
.017
0.5
350.
52
P-R
efle
ctio
n98
780.
633
036.
931
.1K
FM01
A_0
21
136
46–4
,089
.682
.017
0.5
350.
52
P-R
efle
ctio
n98
780.
633
036.
931
.1K
FM01
A_0
31
136
46–4
,089
.682
.017
0.5
350.
52
P-R
efle
ctio
n98
780.
633
036.
931
.1K
FM01
A_0
51
136
4646
3.4
82.0
170.
535
0.5
2P
-Ref
lect
ion
9878
0.6
3303
6.9
31.1
KFM
02A
_01
173
4646
3.4
82.0
170.
535
0.5
2P
-Ref
lect
ion
9878
0.6
3303
6.9
31.1
KFM
02A
_07
173
4646
3.4
82.0
170.
535
0.5
2P
-Ref
lect
ion
9878
0.6
3303
6.9
31.1
KFM
02A
_08
173
4682
.017
0.4
350.
498
779.
133
037.
431
.547
–88,
699.
93.
015
7.0
337.
02
P-R
efle
ctio
n99
021.
832
990.
7–4
52.0
P1_
dept
h26
039
047
–22,
256.
73.
015
7.0
337.
02
P-R
efle
ctio
n99
021.
832
990.
7–4
52.0
P2_
dept
h10
020
047
8,78
2.9
2.8
157.
033
7.0
2P
-Ref
lect
ion
9901
8.3
3299
2.2
–414
.5P
4_de
pth
229
294
479,
888.
03.
015
7.0
337.
02
P-R
efle
ctio
n99
021.
832
990.
7–4
52.0
P5_
dept
h30
330
4739
9.6
3.0
157.
033
7.0
1P
-Ref
lect
ion
9902
1.8
3299
0.7
–452
.0K
FM01
A_0
11
5747
399.
63.
015
7.0
337.
01
P-R
efle
ctio
n99
021.
832
990.
7–4
52.0
KFM
01A
_02
157
4739
9.6
3.0
157.
033
7.0
1P
-Ref
lect
ion
9902
1.8
3299
0.7
–452
.0K
FM01
A_0
31
57

105
No.
Dep
thD
ip
(°)
Dip
Dir
(°
)A
zim
uth
(°)
Visi
bilit
yTy
peN
orth
ing
Cru
xEa
stin
g C
rux
Elev
C
rux
Prof
ile1st
re
ceiv
erla
st
rece
iver
4739
9.6
3.0
157.
033
7.0
1P
-Ref
lect
ion
9902
1.8
3299
0.7
–452
.0K
FM01
A_0
51
5747
478.
73.
015
7.0
337.
01
P-R
efle
ctio
n99
021.
832
990.
7–4
52.0
KFM
02A
_01
176
4747
8.7
3.0
157.
033
7.0
2P
-Ref
lect
ion
9902
1.8
3299
0.7
–452
.0K
FM02
A_0
21
7647
478.
73.
015
7.0
337.
02
P-R
efle
ctio
n99
021.
832
990.
7–4
52.0
KFM
02A
_07
176
4747
8.7
3.0
157.
033
7.0
2P
-Ref
lect
ion
9902
1.8
3299
0.7
–452
.0K
FM02
A_0
81
7647
3.0
157.
033
7.0
9902
1.5
3299
0.8
–448
.948
2,47
2.0
31.7
204.
724
.72
P-R
efle
ctio
n99
191.
333
088.
0–3
40.4
P1_
dept
h24
936
348
2,20
6.1
31.7
204.
724
.72
P-R
efle
ctio
n99
191.
333
088.
0–3
40.4
P5_
dept
h13
727
348
586.
831
.720
4.7
24.7
1P
-Ref
lect
ion
9919
1.3
3308
8.0
–340
.4K
FM01
A_0
11
9848
586.
831
.720
4.7
24.7
1P
-Ref
lect
ion
9919
1.3
3308
8.0
–340
.4K
FM01
A_0
21
9848
586.
831
.720
4.7
24.7
2P
-Ref
lect
ion
9919
1.3
3308
8.0
–340
.4K
FM01
A_0
31
9848
586.
831
.720
4.7
24.7
1P
-Ref
lect
ion
9919
1.3
3308
8.0
–340
.4K
FM01
A_0
51
136
4859
5.2
31.7
204.
724
.72
P-R
efle
ctio
n99
191.
333
088.
0–3
40.4
KFM
02A
_01
110
048
595.
231
.720
4.7
24.7
2P
-Ref
lect
ion
9919
1.3
3308
8.0
–340
.4K
FM02
A_0
21
100
4859
5.2
31.7
204.
724
.72
P-R
efle
ctio
n99
191.
333
088.
0–3
40.4
KFM
02A
_07
110
048
595.
231
.720
4.7
24.7
1P
-Ref
lect
ion
9919
1.3
3308
8.0
–340
.4K
FM02
A_0
81
100
4831
.720
4.7
24.7
9919
1.3
3308
8.0
–340
.449
1,89
6.3
59.0
205.
025
.02
P-R
efle
ctio
n99
196.
933
091.
8–1
30.5
P4_
dept
h24
032
049
1,51
7.0
59.0
205.
025
.02
P-R
efle
ctio
n99
196.
933
091.
8–1
30.5
P5_
dept
h25
030
049
797.
459
.020
5.0
25.0
2P
-Ref
lect
ion
9919
6.9
3309
1.8
–130
.5K
FM01
A_0
11
136
4979
7.4
59.0
205.
025
.01
P-R
efle
ctio
n99
196.
933
091.
8–1
30.5
KFM
01A
_02
113
649
797.
459
.020
5.0
25.0
1P
-Ref
lect
ion
9919
6.9
3309
1.8
–130
.5K
FM01
A_0
31
136
4979
7.4
59.0
205.
025
.02
P-R
efle
ctio
n99
196.
933
091.
8–1
30.5
KFM
01A
_05
113
649
808.
059
.020
5.0
25.0
2P
-Ref
lect
ion
9919
6.9
3309
1.8
–130
.5K
FM02
A_0
11
136
4980
8.0
59.0
205.
025
.02
P-R
efle
ctio
n99
196.
933
091.
8–1
30.5
KFM
02A
_02
113
649
808.
059
.020
5.0
25.0
2P
-Ref
lect
ion
9919
6.9
3309
1.8
–130
.5K
FM02
A_0
71
136
4980
8.0
59.0
205.
025
.02
P-R
efle
ctio
n99
196.
933
091.
8–1
30.5
KFM
02A
_08
113
649
59.0
205.
025
.099
196.
933
091.
8–1
30.5

107
Refraction seismic data and bedrock velocity distribution at Forsmark
Johan Nissen, Malå Geoscience AB
Contents 1 Introduction 108
2 Results 110
2.1 Bedrock velocity distribution 110
3 References 111

108
1 Introduction
RefractionseismicprofilinghasbeenperformedintheForsmarkinvestigationareaduringseveralcampaigns(Table1-1).Inthepresentnote,wediscussonlydatacollectedduringthetimeperiod2004–2006,inconnectionwiththeSKBsiteinvestigationwork(Figure1-1).These data are described in /Toresson 2005, 2006/. The data from the construction of the nuclear powerplantandSFR(1970–1982)arepresentedin/IsakssonandKeisu2005/andthegeo-logicalimplicationsarediscussedin/SKB2005,p.184–185/.Thepurposeofthepresentnoteis to discuss the bedrock velocity distribution based on the results of the refraction seismics.
Thedatafrom2004–2006areallcollectedwithadigitalseismograph(ABEMTerralocMk6).The geophone separation was 5 metres except for some minor parts where the separation was 2–3metres.Table1-2liststhe43profiles.Thevalues“AssumedLength”and“ActualLength”in this table differ slightly, due to the fact that the geophone cable is not completely straight between the geophone positions.
Table 1-1. Summary of refraction seismic campaigns at Forsmark.
Time period Total length of profiles
1970–82 107.2 km2004–06 30.3 km
Figure 1-1. Overview of the Forsmark investigation area, showing the location of the 43 refraction seismic profiles listed in Table 12. The campaign was focussed on the target area around Bolundsfjärden, in the northwestern part of the candidate area.

109
Table 1-2. 43 refraction seismic profiles completed during the 2004–2006 campaign. The column “Assumed length” is based upon the length of the geophone cable, and the column “Actual length” is based upon the coordinates of the geophone positions.
Idcode Start Date Assumed length (m)
Actual length (m)
LFM000825 2004-09-16 00:00 1,692.4 1,677.0LFM000826 2004-09-24 00:00 175.1 174.8LFM000827 2004-09-24 00:00 220.4 220.3LFM000828 2004-09-16 00:00 316.4 316.1LFM000829 2004-09-16 00:00 106.4 106.4LFM000830 2004-09-19 00:00 1,208.0 1,206.8LFM000831 2004-09-09 00:00 1,964.1 1,962.1LFM000832 2004-09-15 00:00 126.0 126.0LFM000833 2004-09-15 00:00 188.0 188.0LFM000834 2004-09-15 00:00 162.0 161.9LFM000835 2004-09-14 00:00 446.1 445.9LFM000836 2004-09-23 00:00 730.9 728.6LFM000889 2005-05-17 08:00 1,432.7 1,432.8LFM000890 2005-05-15 08:00 452.3 452.2LFM000891 2005-06-18 08:00 109.5 109.6LFM000892 2005-06-18 08:00 310.5 310.4LFM000893 2005-05-15 08:00 501.0 501.0LFM000894 2005-05-12 08:00 115.0 115.0LFM000895 2005-05-14 08:00 572.9 573.0LFM000896 2005-05-14 08:00 324.0 324.0LFM000897 2005-05-13 08:00 447.5 447.3LFM000898 2005-05-13 08:00 110.0 110.0LFM000899 2005-05-13 08:00 361.0 361.0LFM000900 2005-05-16 08:00 672.5 672.4LFM000901 2005-05-13 08:00 443.0 443.1LFM000902 2005-09-30 08:00 583.0 582.9LFM000903 2005-07-13 08:00 1,186.0 1,184.1LFM000904 2005-10-07 08:00 1,804.5 1,797.3LFM000905 2005-11-02 08:00 250.0 250.0LFM000906 2005-11-24 08:00 100.0 100.0LFM000907 2005-11-24 08:00 100.0 100.0LFM000908 2005-11-01 08:00 178.0 178.0LFM000915 2005-09-12 08:00 2,012.5 2,012.1LFM000916 2006-03-15 08:00 1,185.0 1,184.6LFM000917 2006-03-16 08:00 460.0 460.0LFM000918 2005-09-28 08:00 755.0 755.0LFM000919 2005-06-18 08:00 1,092.0 1,092.0LFM001013 2005-07-05 08:00 1,293.0 1,293.0LFM001014 2005-07-05 08:00 584.0 584.0LFM001015 2005-10-30 08:00 1,007.5 1,007.0LFM001016 2005-07-12 08:00 1,137.1 1,137.1LFM001017 2005-06-21 17:00 2,332.5 2,327.0LFM001018 2005-10-29 08:00 1,105.0 1,104.9
Total 30,352.7 30,314.3

110
2 Results
2.1 Bedrock velocity distributionInordertostudythedistributionofthebedrockvelocity,allvelocityestimationsfromthecampaigns2004–2006arecompiledinthehistograminFigure2-1.Table2-1presentsaclas-sification of velocity ranges observed in the present study and a comparison with the older data from1970–1982/IsakssonandKeisu2005/.Themostprobablebedrockvelocityintheareais5,400m/s(i.e.5,350–5,450m/s).Furthermore,alongmorethan88%ofthetotalmeasuredprofile length, the bedrock velocity exceeds 5,000 m/s.
TheolddatafromtheForsmarknuclearpowerplantandSFRshowasimilarvelocitydistribu-tion.Themost“typical”velocityis5,500m/s/IsakssonandKeisu2005/,althoughthenumberof profiles with high velocity is lower than in the present data set.
Figure 2-1. The distribution of measured velocities, based upon the 30.3 km profile data from 2004–2006, together with the accumulated distribution (right scale). Each velocity bin covers a range of 100 m/s.
Table 2-1. Classification of velocity ranges based upon the present data set (2004–2006) and from old data (1970–1982) taken from /Isaksson and Keisu 2005/.
Velocity range Amount of total profile length
1970–1982 2004–2006
High velocity ≥ 5,000 m/s 75% 88%Medium velocity 4,000–5,000 m/s 23% 9.5%Low velocity ≤ 4,000 m/s 2% 2.5%
0
5
10
15
20
25
2600 3000 3400 3800 4200 4600 5000 5400 5800
Rock velocity [m/s]
Perc
enta
ge
0
20
40
60
80
100
Acc
umul
ated
per
cent
age

111
3 References
Isaksson H, Keisu M, 2005.InterpretationofairbornegeophysicsandintegrationwithtopographyStage2(2002–2004).Anintegrationofbathymetry.topography.refrac-tionseismicsandairbornegeophysics.Forsmarksiteinvestigation.SKBP-04-282,SvenskKärnbränslehanteringAB.
SKB 2005.Preliminarysitedescription.Forsmarkarea−version1.2.SKBR-05-18,SvenskKärnbränslehanteringAB.
Toresson B, 2005. Seismic refraction survey 2004. Forsmark site investigation. SKB P-05-12, SvenskKärnbränslehanteringAB.
Toresson B, 2006.Seismicrefractionsurvey2005–2006.Forsmarksiteinvestigation.SKBP-06-138,SvenskKärnbränslehanteringAB.
113
Correlation between refraction seismic data, low magnetic lineaments and deformation zones (model stage 2.2)
Hans Isaksson, GeoVista AB
Contents1 Introduction 114
2 Methodology 114
3 Correlation of low velocity anomalies and low magnetic lineaments 116
4 Correlation of low velocity anomalies and modelled deformation zones (stage 2.2) 119
5 Discussion and conclusions 121
6 References 124
Appendix 1 Low rock velocity anomalies (LV), ≤ 4,000 m/s, from refraction seismics 2004–2006 and their relation to deformation zones and low magnetic lineaments 125
Appendix 2 Low rock velocity anomalies (LV), ≤ 4,000 m/s, from refraction seismics 1970–1982 and their relation to deformation zones and low magnetic lineaments 127

114
1 Introduction
This report addresses the correlation between refraction seismic data, low magnetic lineaments anddeformationzones(modelstage2.2).Thefollowingdatahavebeenusedinthestudy:
• RefractionseismicdataandbedrockvelocityfromtheconstructionofthenuclearpowerplantatForsmarkandSFRduring1970–1982/KeisuandIsaksson2004,IsakssonandKeisu2005/(Figure1-1).Thesedataarereferredheretoasolddata.
• Refractionseismicdataandbedrockvelocityfromthesiteinvestigationsduring2004–2006(Figure1-1).DatafromSicada_06_148,2006-06-30havebeenused.Thesedataarereferredto here as new data.
• Large-scaleairbornelowmagneticlineamentsthatarepresentinsidetheregionalmodelareaand airborne low magnetic lineaments that intersect the local model area. These lineaments were established in connection with the modelling work stage 2.1 /SKB 2006/.
• Lowmagneticlineamentsfromthedetailedgroundandmarinemagneticsurvey2006/Isakssonetal.2006/.
• Aninterim,stage2.22Dgroundmodelfordeformationzones,deliveredbyA.SimeonovandM.B.Stephenson2007-04-18.
• AsummaryoftherefractionseismicprofilingcompletedintheForsmarkinvestigationarea(seepaperbyNissenonp.107inthisreport).
2 Methodology
Previousworkhasshown/e.g.Sjögren1984/thatP-wavevelocitycorrelateswelltofractureintensityandhencecanbeusedasanindicatorofstrongbrittledeformation(Figure2-1).Basedon these considerations, a velocity magnitude of 4,000 m/s has been chosen as a threshold to identify low velocity anomalies in both the old and new data. For both sets of data, a buffer zone has been constructed that takes account of the uncertainty in the survey locations. The buffer zone is 5 and 10 m for the new and old data, respectively. Bearing in mind also the uncertainty inthepositionofthelowmagneticlineaments(Figure3-1)/IsakssonandKeisu2005,Isakssonet al. 2006/, these structures have been treated in a similar manner. Lineaments identified from fixed-wing airborne survey data, helicopter survey data and detailed ground magnetic survey datahavebeengivenabufferzoneof40,20and10m,respectively(Figure3-2).
Whenlowvelocityandlowmagneticlineamentbufferzonesintersect,thisisconsideredasamatch(Figure3-2),andthelineamentidentityhasbeennotedasanewattributeinthelowvelocitydataset(Appendices1and2attheendofthisreport).Theindividualidentityorthetype of low magnetic lineament that matches has not been documented in this work.
Acorrelationbetweenlowvelocityanomaliesanddeformationzones(siteinvestigationmodel,stage2.2)isregisteredwhenthelowvelocityanomalyoccursatorwithinthesurfaceinter-sectionoftheinferreddeformationzones(Figure4-1).Thewidthofthezoneatthegroundsurface is accounted for in the analysis. This match is also noted in the low velocity data set as anewattribute(Appendices1and2).

115
Figure 1-1. Overview of refraction seismic profiles in the Forsmark area. Old surveys from 1970–1982 are shown with blue lines and the site investigation surveys from 2004–2006 in red. Green sections of the latter profiles show parts where no bedrock velocity data were determined. The local model area is shown with a dashed magenta line and the Forsmark candidate area with a yellow dotdashed line. One short profile from the older surveys is located at Forsmarks bruk, immediately south of the viewed area. © Lantmäteriet, Gävle 2007, Consent 1 2007/1092.

116
3 Correlation of low velocity anomalies and low magnetic lineaments
A comparison of the low velocity anomalies and the current interpretation of low magnetic lineaments(Figure3-1)yieldsatotalof97matchesoutof266possiblelowvelocitysections,(Figure3-2).Statisticaldatathataddressthecorrelationbetweenlowvelocityanomaliesandlow magnetic lineaments indicate that the results are very similar for both the old and new data (Table3-1).36%ofalllowvelocityanomalies(40%ofthelength)showacorrelationwithalowmagneticlineament,while64%(60%)shownocorrelation.Thenumberofcorrelationsinthe detailed, ground magnetic survey area is higher. This can be expected, bearing in mind the higher frequency of low magnetic lineaments. The low magnetic lineaments that correlate to low rock velocity anomalies are documented in Appendices 1 and 2 for the new and old data sets, respectively. Sections of low velocity within the detailed, magnetic ground survey area are marked with an asterisk in Appendices 1 and 2.
Figure 2-1. Pwave velocity for bedrock in relation to cracks (fractures) per m (blue line) and RQD value (black line) according to /Sjögren 1984/.
2000 3000 4000 5000 6000
P-wave velocity [m/s]
0
4
8
12
16
20
Cra
cks/
m
100
80
60
40
20
0R
QD

117
Figure 3-1. Low velocity determinations in the bedrock (≤ 4,000 m/s) from both old and new data and their relationship to low magnetic lineaments according to /Isaksson et al. 2006/. Thick, medium and thin black solid lines represent discordant magnetic minima with a length of > 3 km, 1–3 km and < 1 km, respectively. Thin dashed lines show magnetic minima connections of concordant nature. The local model area is shown with a dashed yellow line. © Lantmäteriet, Gävle 2007, Consent 1 2007/1092.

118
Figure 3-2. Intersections between low velocity anomalies and low magnetic lineaments (blue circles). These intersections take into account the buffer zones that address the uncertainty in the location of the anomalies and the lineaments. The grey corridors indicate buffer zones around the lineaments and the corresponding low magnetic lineaments, > 1 km in length, are outlined with a black solid line. The local model area is shown with a dashed black line. The detailed ground magnetic survey area is shown with a green solid line. As in Figure 31, the parts of the refraction seismic profiles that indicate a rock velocity > 4,000 m/s are shown as blue solid lines. © Lantmäteriet, Gävle 2007, Consent 1 2007/1092.

119
4 Correlation of low velocity anomalies and modelled deformation zones (stage 2.2)
A comparison of the low velocity anomalies and the current interpretation of deformation zones inmodelstage2.2(Figure4-1)yieldsatotalof87matchesoutof266possiblelowvelocitysections, Statistical data that address the correlation between low velocity anomalies and deformation zones are presented in Table 4-1. As for low magnetic lineaments, the percentage of no correlation is higher and 2 out of 3 low velocity anomalies do not match deformation zones. The low rock velocity anomalies that correlate to deformation zones are documented in Appendices 1 and 2.
The number of deformation zones inside the detailed ground magnetic survey area is somewhat higher than outside. For this reason, it can be expected that there should be a higher matching frequency inside the ground magnetic survey area and this is indeed valid for the new data. However,thestatisticalbasisisinsufficientandtheresultisonlyindicative.Sectionsoflow velocity within the detailed ground magnetic survey area are marked with an asterisk in Appendices 1 and 2.
Table 3-1. Statistical summary of correlation between low velocity anomalies (LV) and low magnetic lineaments in and around the local model area (MFM), and within the detailed, ground magnetic survey area (DGM).
Old data New data Total
Number of sections 1,322 494 * 1,816Profile length (m) 108,485 29,656 * 138,141Average velocity (m/s) 5,202 5,236 5,209Mode velocity, ca (m/s) 5,400–5,500 5,400–5,500 5,400–5,500LV, sections(% of total number)
195(15%)
71(14%)
266(15%)
LV, length (m)(% of total length)
3,189(2.9%)
746(2.5%)
3,935(2.8%)
LV, average velocity (m/s) 3,675 3,637 3,668LV-MFM match, no. of sections(% of LV, no. of sections)
72(37%)
25(35%)
97(36%)
LV-MFM match, length (m)(% of LV length)
1,287(40%)
294(39%)
1,581(40%)
LV-MFM within DGM, match, no. of sections(% of LV, no. of sections)
5 of 9(56%)
12 of 22(55%)
17 of 31(55%)
LV-MFM within DGM, match length (m)(% of LV length)
65 of 90(72%)
129 of 192(67%)
194 of 282(69%)
* Sections with no rock velocity determined are omitted.

120
Table 4-1. Statistical summary of correlation between low velocity indications (LV) and deformation zones (DZ) in and around the local model area, and within the detailed ground magnetic survey area (DGM).
Old data New data Total
LV-DZ match, no. of sections(% of LVi, no. of sections)
62(32%)
25(35%)
87(33%)
LVi-DZ match, length (m)(% of LVi length)
1,004(31%)
335(45%)
1,339(34%)
LV-DZ within DGM, match, no. of sections(% of LVi, no. of sections)
0 of 9(0%)
9 of 22(41%)
9 of 31(29%)
LV-DZ within DGM, match length (m)(% of LVi of length)
0 of 90(0%)
112 of 192(58%)
112 of 282(40%)
Figure 4-1. Low velocity anomalies in the bedrock (≤ 4,000 m/s) from both old and new data and their relationship to the ground intersection of inferred deformation zones in the site investigation model, stage 2.2 (thin black lines). The width of the deformation zones at the surface is taken into account in the analysis work. The local model area is shown with a dashed yellow line. The rock velocity in refraction seismic profiles is illustrated in the same manner as in Figure 31. © Lantmäteriet, Gävle 2007, Consent 1 2007/1092.

121
5 Discussion and conclusions
The analysis carried out here shows that there is moderate correlation between low velocity anomalies and low magnetic lineaments or modelled deformation zones. Typically, there are only one or a few low velocity anomalies along some of the intersecting profiles and several profiles lack anomalies. Both survey methodology and geological conditions need to be considered in the assessment of the relatively poor correlation. These two features are explored in more detail below.
Astudyoftherefractionseismicdataalongthewell-establishedSingödeformationzone(ZFMWNW0001)yieldssomeinterestingresults.Thec.200mwidesurfaceextensionoftheSingödeformationzoneisintersectedbyrefractionseismicsoveratotallengthofc.5,000m(Figure5-1).Thezonecanbeconsideredaswell-definedbythreetunnelsandbyconsiderabledrilling close to the seismic surveys. A comparison between the refraction seismic data and the intersection of the zone at the surface shows that only 11% of the total profile length within the zonehasavelocity≤4,000m/s(Table5-1).Anotherimportantdifferencetothesurroundingdata is that 46% of the total length is within the medium velocity interval compared to 17% overall.
Figure 5-1. Refraction seismic profiles and bedrock velocity magnitudes in the Singö deformation zone (ZFMWNW0001). Profiles outside the zone are shown as cyan lines. Blue dashed line shows the local model area. Background, GSDortofoto © Lantmäteriet, Gävle 2001, Permission M2001/5268.

122
TheinformationalongtheSingödeformationzoneindicatessomedifficultytoresolveindi-vidual narrow sections with low velocity in the refraction seismic data, since the given velocity is determined by an average velocity over longer sections composed of both normal and low velocity sections. Bearing in mind the high velocity for the intact bedrock in the Forsmark area, this also indicates that the average velocity for such a mixed section will show a bias towards ahighervalue.Interpretationtemplatesforrefractionseismicsurveys,completedduringtheconstructionofthenuclearpowerplantandSFR/IsakssonandKeisu2005,Figure5-7/,showthatvelocities≤4,000m/sarecharacterizedascrushedorfracturedbedrock,whilevelocities≥4,500m/sindicatemediumtogoodbedrockquality.Thus,theinterval4,000–4,500m/swouldpossibly indicate poor to medium bedrock quality. /Fagerlund 1977/ also noted that sections withinthisvelocityintervalpossiblycancontainnarrowfracturezones.Itisconcludedthattheadoptionofasinglevelocitythreshold,suchas≤4,000m/s,mayleadtoanunderestimationof matches between low velocity anomalies and inferred deformation zones or low magnetic lineaments.
Together with the bedrock velocity contrasts, the geophone spacing has a strong influence on the spatial resolution of the velocity determinations. For most of the refraction seismic surveys intheForsmarkarea,5mgeophonestationspacinghasbeenused.Intheseaarea,10mgeo-phonespacingisnotedinafewcasesfromtheolddataandinthe2004–2006survey,2mspacingwasonlyusedalongafewlines.Fromall1,816velocitysectionsavailable(Table3-1),onlythreesections(fromtheoldsurvey)weredeterminedasshorterthan5m.
Figure5-2showsanexampleinwhichtwocloseprofiles(between0and20mapart)havebeen carried out with 5 m and 2 m geophone spacing, respectively. The profiles both traverse theinferreddeformationzoneZFMENE0060AthatcorrespondstothelowmagneticlineamentMFM0060A0.The5mprofileLFM000825showsnoindicationoflowervelocities,whilethe 2 m profile LFM000906 yields one 6 m wide section at 3,000 m/s and one 29 m section at 4,060 m/s intersecting the deformation zone. Along the adjacent 5 m profile LFM000919, a 10mwidelowvelocityanomalycorrelateswellwiththedeformationzone.Itisconcludedthat,with a geophone spacing of 5 m, there is a strong possibility that low velocity zones narrower than 5 m will not be detected.
Low velocity anomalies in the bedrock may represent brittle deformation zones that contain an anomalousconcentrationofopenfracturesoroneormoreopencrushzones.However,thereisan inherent heterogeneity along such zones, where it concerns the frequency of open fractures, and the methodology is considerably less efficient where it concerns the detection of brittle deformation zones with sealed fractures and sealed fracture networks. This type of steeply dip-ping deformation zone is common at Forsmark /SKB 2006/, not least inside the north-western part of the candidate volume where the new refraction seismic data have been acquired. Many of the low magnetic lineaments may be related to a bedrock alteration around sealed fractures orevenotherrockcontrasts(e.g.GroupDdykes,pegmatiteandamphibolite)thatdonotresultin a sufficiently decreased P-wave velocity. Thus, the geological character of the Forsmark area is a key factor that helps to explain the absence of a strong correlation between low velocity anomalies, deformation zones and low magnetic lineaments.
Table 5-1. Classification of velocity ranges based on Table 3 in paper by Nissen on p. 107 in this report. A column has been added for data intersecting ZFMWNW0001 (Singö deforma-tion zone).
Velocity range Amount of total profile length1970–1982 2004–2006 Total ZFMWNW0001
High velocity ≥ 5,000 m/s 75% 88% 80% 43%Medium velocity 4,000–5,000 m/s 23% 9.5% 17% 46%Low velocity ≤ 4,000 m/s 2% 2.5% 2.8% 11%

123
HighlyfracturedbedrockclosetothesurfaceisoneofthedistinctivefeaturesoftheForsmarksite. A continuously increasing velocity downwards, which is related to a decrease of fracturing in this direction, may obscure the occurrences of sub-vertical low velocity zones in the deeper parts of the bedrock. Furthermore, care needs to be taken in the interpretation work concerning the influence of older, well-packed boulder clay that shows a higher P-wave velocity relative to the normal Quaternary cover.
The low velocity anomalies that do not match low magnetic lineaments and/or deformation zonesandthatareasyetnotexplainedmayrepresentunidentifiedfracturezones.However,they may also be related to local narrow depressions in the bedrock surface that correlate with fractured near-surface bedrock or are simply filled with Quaternary cover material. Most of the low velocity anomalies that are so far not explained occur outside the Forsmark candidate area and in areas where the coverage of magnetic data is poor. Thus, mismatches may be explained by lack of magnetic data. The correlation rate between low velocity anomalies and low magnetic lineaments would probably increase significantly if detailed ground magnetic data was available over larger areas.
Figure 5-2. Refraction seismic profiles LFM000825 (5 m geophone spacing) and LFM000906 (2 m geophone spacing) traversing the inferred deformation zone ZFMENE0060A (black dashed lines) and low magnetic lineament MFM0060A0 (black solid line) close to drill sites 1 and 5. Magnitude of bedrock velocity as in Figure 51. Roads and drill sites are shown with a red dashed line. The profile LFM000906 is 100 m long. Background, GSDortofoto © Lantmäteriet, Gävle 2001, Permission M2001/5268.

124
6 References
Fagerlund H, 1977. Rapport58/21överseismiskagrundundersökningarförSFR,Forsmark.StatensVattenfallsverk,arkivnummer:764445/0917.
Keisu M, Isaksson H, 2004. Acquisition of geological information from Forsmarks verket. InformationfromtheVattenfallarchive,Råcksta.SKBP-04-81,SvenskKärnbränslehanteringAB.
Isaksson H, Keisu M, 2005.Interpretationofairbornegeophysicsandintegrationwithtopo-graphy.Stage2(2002–2004).Anintegrationofbathymetry,topography,refractionseismicsandairbornegeophysics.SKBP-04-282,SvenskKärnbränslehanteringAB.
Isaksson H, Thunehed H, Pitkänen T, Keisu M, 2006. Detailed ground and marine magneticsurveyandlineamentinterpretationintheForsmarkarea–2006.SKBP-06-261,SvenskKärnbränslehanteringAB.
Sjögren B, 1984.Shallowrefractionseismics.ChapmanandHall.ISBN0412242109.
SKB, 2006. Site descriptive modelling Forsmark stage 2.1. Feedback for completion of the site investigationincludinginputfromsafetyassessmentandrepositoryengineering.SKBR-06-38,SvenskKärnbränslehanteringAB.

125
Appendix 1
Low rock velocity anomalies (LV), ≤ 4,000 m/s, from refraction seismics 2004–2006 and their relation to deformation zones and low magnetic lineaments.
Id code Rock velocity [m/s] Length [m] DZ_Correlation MFM_lineament correlation
LFM000825 3,000 10.00 NNW0404 MFM1196LFM000827 * 3,000 15.00 ENE2254 MFM2233G, MFM2254GLFM000830 3,200 5.00 none MFM0060LFM000831 * 3,800 10.00 NNE2008 MFM2008GLFM000831 4,000 10.00 ENE0062A MFM0126LFM000831 3,700 17.50 ZFM866 NoneLFM000831 3,700 10.00 none NoneLFM000836 * 3,000 7.50 ENE2320 NoneLFM000889 * 3,800 10.00 ENE2320 NoneLFM000889 3,950 15.00 none MFM1197LFM000890 3,000 5.00 none NoneLFM000892 3,600 5.00 none NoneLFM000892 3,000 5.00 none MFM1200,(MFM0159)LFM000892 3,850 15.00 none NoneLFM000892 3,600 5.00 none NoneLFM000893 3,300 5.00 ENE0061,ZFMA2 MFM0061LFM000895 3,900 15.00 none NoneLFM000895 3,300 15.00 none NoneLFM000895 2,900 5.00 none NoneLFM000895 3,900 45.00 NNW0100,ENE1208A MFM0100LFM000897 3,300 5.00 none NoneLFM000897 2,600 5.00 none NoneLFM000897 3,300 10.00 none NoneLFM000897 3,500 5.00 ENE2320 NoneLFM000897 3,800 10.00 none NoneLFM000898 3,800 40.00 ENE2325A NoneLFM000900 3,900 20.00 NW1200 MFM1200, MFM2254G, MFM0100LFM000900 3,800 10.00 NNW0100 MFM0100LFM000900 3,500 15.00 none NoneLFM000900 3,300 10.00 none NoneLFM000900 3,500 5.00 ENE0159A MFM0159LFM000901 3,000 5.00 ENE2325A NoneLFM000901 3,000 5.00 none NoneLFM000901 3,600 10.00 none MFM0159LFM000903 * 3,200 5.00 none MFM2261GLFM000904 4,000 10.00 ZFMA7 NoneLFM000904 2,900 5.00 ZFMA7 NoneLFM000904 3,700 10.00 ZFMA7 NoneLFM000904 4,000 5.00 none NoneLFM000904 3,300 5.00 none NoneLFM000904 3,000 10.00 none NoneLFM000904 3,900 5.00 none NoneLFM000906 2 3,000 6.00 none NoneLFM000908 2 3,600 8.00 none None

126
Id code Rock velocity [m/s] Length [m] DZ_Correlation MFM_lineament correlation
LFM000915 3,200 5.00 ZFM866 MFM0683LFM000915 3,500 10.00 none NoneLFM000915 * 3,300 5.00 none NoneLFM000915 * 2,800 9.00 none MFM2424GLFM000915 * 4,000 5.00 none NoneLFM000915 * 3,500 5.00 none NoneLFM000915 3,600 10.00 none NoneLFM000916 * 3,700 5.00 none NoneLFM000916 * 4,000 10.00 ZFM1203 NoneLFM000916 * 4,000 5.00 none NoneLFM000917 * 3,900 5.00 none MFM0168LFM000918 * 3,300 10.00 ENE2332 MFM2332G0LFM000918 * 3,500 5.00 none MFM2351G, MFM2354GLFM000919 * 3,900 10.00 ENE0060A MFM0060, MFM0060G0 and G1LFM000919 * 4,000 5.00 none NoneLFM001013 * 4,000 10.00 none MFM1198GLFM001013 * 3,800 5.00 none NoneLFM001014 3,800 15.00 none NoneLFM001015 3,700 37.90 none NoneLFM001015 4,000 10.00 none NoneLFM001016 * 3,900 20.00 ENE0060B MFM0060G1, (MFM2085G)LFM001016 * 4,000 20.00 ENE0060A MFM0060G0LFM001017 3,100 5.00 none NoneLFM001017 * 4,000 10.00 none MFM2445G, MFM2382GLFM001018 3,600 20.00 NW0017 MFM0017LFM001018 3,900 25.00 none NoneLFM001018 3,600 10.00 none None
* Shows LV within the detailed, magnetic ground survey area. The digit 2 after the profile identity stands for 2 m geophone spacing.

127
Appendix 2
Low rock velocity anomalies (LV), ≤ 4,000 m/s, from refraction seismics 1970–1982 and their relation to deformation zones and low magnetic lineaments.
Id code Rock velocity [m/s] Length [m] DZ_Correlation MFM_lineament correlation
LFK000150 3,500 15.83 none NoneLFK000147 4,000 23.21 none NoneLFK000058 3,500 5.13 none NoneLFK000059 3,000 5.36 none NoneLFK000060 3,000 5.35 none NoneLFK000061 4,000 7.29 none MFM1088LFK000062 3,900 11.76 none NoneLFK000065 4,000 9.20 none MFM1088LFK000066 4,000 13.69 none MFM1092, MFM1088LFK000068 4,000 10.12 none NoneLFK000070 4,000 10.00 none NoneLFK000071 3,900 14.64 none NoneLFK000072 3,800 12.25 none NoneLFK000001 3,000 5.00 none NoneLFK000002 3,800 11.00 none NoneLFK000002 3,000 5.00 none NoneLFK000003 3,000 3.00 NNW1204 NoneLFK000005 3,000 5.00 none NoneLFK000006 4,000 25.00 WNW1068 MFM1068LFK000006 3,500 10.00 none NoneLFK000007 4,000 19.99 none NoneLFK000008 4,000 9.00 none NoneLFK000009 3,000 5.00 none NoneLFK000010 3,000 6.00 NW0017 MFM0017LFK000010 3,500 11.00 none MFM1072LFK000011 3,000 5.00 NNW0100 NoneLFK000011 * 3,000 5.01 none NoneLFK000021 3,000 5.01 WNW1068,NNW0100 MFM0100, MFM1068LFK000022 3,600 18.00 NNW0100,ENE1208B MFM0100LFK000023 4,000 29.00 NNW0100,ENE0159A MFM0100, MFM0159LFK000030 4,000 14.00 none NoneLFK000030 4,000 10.00 none MFM0137LFK000030 3,000 5.01 none NoneLFK000030 4,000 6.00 none NoneLFK000030 3,600 30.00 WNW0001 MFM803LFK000030 4,000 20.00 none NoneLFK000030 3,500 10.01 none NoneLFK000030 3,500 39.00 none NoneLFK000046 3,000 2.99 none NoneLFK000047 3,400 8.00 none NoneLFK000044 4,000 23.99 none NoneLFK000044 4,000 13.00 none NoneLFK000044 3,300 13.00 WNW0001 NoneLFK000044 3,500 5.00 none NoneLFK000044 3,900 13.00 NW0002 MFM0804LFK000044 3,800 7.00 none None

128
Id code Rock velocity [m/s] Length [m] DZ_Correlation MFM_lineament correlation
LFK000045 3,700 10.00 none NoneLFK000045 4,000 19.00 none NoneLFK000045 3,000 16.00 WNW0001 NoneLFK000045 3,900 18.00 WNW0001 MFM0803LFK000045 4,000 30.01 WNW0001 NoneLFK000045 3,500 9.99 NW0002 MFM0804LFK000045 3,600 22.00 NW0002 NoneLFK000045 3,700 11.00 none NoneLFK000045 3,850 10.00 none NoneLFK000039 3,000 5.01 none NoneLFK000039 3,700 5.00 none NoneLFK000039 3,000 5.00 none NoneLFK000039 4,000 20.00 NW0017 MFM0017LFK000040 4,000 5.01 none NoneLFK000041 3,000 5.00 NW0017 MFM0017LFK000041 3,000 5.01 none NoneLFK000043 3,000 5.01 none MFM0015LFK000031 * 3,500 10.00 none NoneLFK000031 * 4,000 15.00 none MFM2126GLFK000031 * 4,000 20.00 none MFM2505GLFK000032 * 4,000 10.00 none NoneLFK000033 * 4,000 15.00 none MFM2165GLFK000034 * 4,000 5.00 none MFM2165GLFK000034 * 3,500 10.00 none MFM2310GLFK000037 3,800 20.00 none MFM0137LFK000037 3,800 20.00 WNW0001 NoneLFK000054 3,500 10.00 WNW0001 MFM803LFK000054 3,800 15.00 WNW0001 MFM803LFK000054 3,950 15.00 WNW0001 NoneLFK000055 3,700 10.00 WNW0001 MFM803LFK000055 3,000 6.00 WNW0001 MFM803LFK000055 3,700 4.00 WNW0001 MFM803LFK000055 3,000 5.00 WNW0001 NoneLFK000056 3,500 15.00 EW0137 MFM0137LFK000057 3,500 14.00 EW0137 MFM0137LFK000081 3,700 15.00 none NoneLFK000082 4,000 22.00 none NoneLFK000082 4,000 8.00 none NoneLFK000083 3,500 12.00 WNW0001 NoneLFK000083 3,600 15.00 none NoneLFK000083 3,200 12.00 none NoneLFK000083 3,400 15.01 NW0002,NW1127 MFM1127, MFM0804LFK000076 3,000 7.00 none MFM1093LFK000077 3,500 5.99 none NoneLFK000077 3,900 29.99 none MFM0137LFK000078 3,900 35.01 WNW0001 NoneLFK000078 3,600 10.01 NW0002 MFM0804LFK000078 4,000 19.00 none NoneLFK000078 3,000 5.00 none NoneLFK000079 3,700 16.00 WNW0001 None

129
Id code Rock velocity [m/s] Length [m] DZ_Correlation MFM_lineament correlation
LFK000079 3,000 16.00 WNW0001 NoneLFK000079 3,000 4.99 none NoneLFK000079 4,000 10.00 NW0002 MFM0804LFK000079 3,900 15.00 none NoneLFK000080 3,600 17.00 WNW0001 NoneLFK000080 3,600 5.00 none NoneLFK000080 3,300 19.00 none NoneLFK000080 3,400 10.00 none NoneLFK000103 3,800 8.00 WNW1068 MFM1068LFK000104 3,800 5.00 WNW1068 MFM1068, MFM0810LFK000105 4,000 10.00 WNW1068,ENE0810 MFM1068, MFM0810LFK000142 3,500 13.00 none MFM1093LFR000013 3,300 10.00 NW0001 MFM0803LFR000013 4,000 25.00 NW0001 NoneLFK000130 4,000 25.00 none MFM1093LFK000132 4,000 15.01 none NoneLFK000133 3,000 12.00 none MFM1093LFK000133 3,800 65.00 none MFM1092LFK000134 3,500 16.01 none NoneLFK000134 3,200 40.01 none MFM1092LFK000134 3,200 30.00 none MFM1092LFK000134 3,500 10.00 none NoneLFK000135 4,000 18.00 none MFM1093LFK000136 3,500 10.00 none NoneLFK000136 3,300 10.01 EW0137 MFM0137LFK000138 3,000 7.00 EW0137 MFM0137LFK000138 3,800 35.00 none NoneLFK000125 3,700 14.99 none NoneLFK000137 3,900 25.00 none MFM1092LFK000137 3,700 70.01 none MFM1092LFK000137 4,000 20.01 none MFM1092LFK000137 3,700 48.01 none NoneLFK000126 3,500 55.00 none MFM1092LFK000139 4,000 16.00 EW0137 MFM0137LFK000139 4,000 19.01 NW0001 NoneLFK000139 4,000 17.01 NW0001 MFM0803LFK000139 4,000 23.00 NW0001 NoneLFK000141 3,000 5.00 none MFM1088LFK000141 4,000 10.00 none NoneLFK000141 4,000 27.01 EW0137 MFM0137LFK000141 3,000 5.01 none NoneLFK000038 3,800 17.99 NW0001 NoneLFK000038 4,000 11.99 NW0001 MFM0803LFK000038 3,700 15.00 none NoneLFK000038 3,000 10.00 NW0002,NW1127 MFM1127, MFM0804LFK000038 4,000 12.00 none NoneLFK000038 3,000 10.00 none NoneLFK000053 3,500 5.00 NW0001 MFM803LFK000053 3,200 18.99 NW0001 NoneLFK000151 4,000 35.00 none None

130
Id code Rock velocity [m/s] Length [m] DZ_Correlation MFM_lineament correlation
LFR000013 3,800 15.00 none MFM1035LFR000014 3,800 15.00 none MFM1035LFR000014 3,500 10.01 NNE0869 NoneLFR000015 3,700 10.00 none MFM1035LFK000152 3,500 17.00 none NoneLFK000152 3,500 18.00 none NoneLFK000153 3,500 10.00 none NoneLFK000153 3,500 13.00 none NoneLFK000154 3,500 10.01 none NoneLFK000155 3,200 14.99 NW0003 NoneLFK000156 3,900 26.00 NW0004 MFM0014LFK000156 3,500 10.00 NW0003 NoneLFK000042 3,000 5.00 NW0017 MFM0017LFK000042 3,000 5.00 none NoneLFK000042 3,500 10.99 none MFM0015LFR000018 3,800 16.61 none NoneLFR000018 3,800 26.27 none NoneLFR000019 4,000 21.52 none NoneLFR000019 3,700 22.79 none NoneLFR000019 3,500 14.26 none NoneLFR000024 4,000 34.51 none NoneLFR000021 3,700 13.62 none MFM0805LFR000021 3,600 12.96 none NoneLFR000022 4,000 27.75 none NoneLFR000020 3,300 15.65 none NoneLFR000020 4,000 31.05 none NoneLFR000020 4,000 15.78 none MFM0805LFR000020 4,000 32.86 none NoneLFR000025 4,000 18.18 NW0001 NoneLFR000025 2,000 78.32 NW0001 MFM0803LFR000025 3,200 24.63 NW0001 NoneLFR000025 4,000 26.30 none NoneLFR000025 3,600 16.54 none MFM0137B0LFR000026 3,900 23.01 none MFM1035LFR000026 3,800 25.71 NNE0869 NoneLFR000026 4,000 22.07 none NoneLFR000029 3,700 12.95 none NoneLFR000016 3,800 35.38 none NoneLFR000016 4,000 39.56 none MFM0137B0LFR000017 3,500 8.95 none NoneLFR000017 3,500 19.02 none NoneLFR000017 3,600 14.76 none NoneLFR000017 4,000 36.90 NW0805 MFM0805LFR000031 3,700 18.49 none NoneLFR000031 3,950 48.10 none NoneLFR000031 3,700 17.83 none NoneLFR000032 3,800 22.03 none NoneLFR000032 3,900 41.52 none NoneLFR000032 3,400 23.55 none None
* Shows LV within the detailed, magnetic ground survey area.

131
Interpretation of tomography inversion models for seismic refraction data along profile LFM001017 in Forsmark
Håkan Mattsson, GeoVista AB
Contents1 Introduction 132
2 Methodology and limitations − general considerations 133
3 Data input 134
4 Data processing 134
5 Results and interpretation 134
6 Discussion 143
7 References 144

132
1 Introduction
A test to use tomography inversion to model refraction seismic data along profile LFM001017 inForsmark(Figure1-1)wasperformedinordertoevaluatethepossibilityofextractingmoreinformation from the raw data. LFM001017 was chosen since several magnetic lineaments cross-cut the profile, without any indications of decreased P-wave velocity along these sub-sections in the traditional velocity model /Toresson 2006/. Thus, the tomography inversion could possibly help explain uncertainties in the geological model for some deformation zones in the area.
Figure 1-1. Location of the refraction seismic profile LFM001017. Labels denote section length coordinates in metres along the profile.

133
2 Methodology and limitations − general considerations
ThedataprocessingwasperformedwiththesoftwareRayfractTM, which uses inversion of first arrivaltraveltimedatatoestimatea2DvelocitymodelbasedonWavepathEikonalTraveltime(WET)tomography.TheEikonalequationsareobtainedfromtheelasticwaveequationsandprovide the travel time of the fastest arriving waves, which makes the Eikonal solvers especially suitable for refraction seismic data /Lecomte et al. 2000/. The technique assures valid travel time calculations, even in models with strong velocity contrasts, and the exact topography of the surface is also a part of the model.
Wavepropagationismodelledinaphysicallymeaningfulwaywithraypaths.RayfractTM han-dles several real life geological situations, such as sharp vertical or horizontal velocity gradients caused by e.g. brittle deformation zones. Quality control of velocity models is performed by direct graphical comparison of the measured travel-time data to those calculated from the model solution.Quantitativestatistics(e.g.meanresidualandmaximumerror)ofthefitofthemod-elled travel times to the measured travel times is also presented. 2D plots of the ray coverage as a function of depth along the profile is displayed for all models, which provides information on areas with low data coverage.
As for traditional data processing, the tomography inversion of refraction seismic data will fail if it encounters site conditions that conflict with the underlying assumptions of the method. One example is laterally continuous constant velocity layers for which the method inserts a velocity gradient when none is present. This may occur if the rock underlying the soft soil is perfectly solid, fresh crystalline rock. Other possible pitfalls are artefacts caused by low data coverage in combination with low smoothing, or artefacts caused by low ray coverage.
TofullybenefitfromthepossibilitiesoftomographyinversionbyRayfractTM, the data coverage shouldbehigh,preferablyatleast7–8shots/arrayof24geophones.Furthermore,thedifferentgeophone arrays should overlap with several geophone stations so as to avoid low data cover-age at the boundaries. The data in this investigation were collected for traditional processing techniquewith5–7shots/arrayandonlyoneornooverlappinggeophones.Themodelresolutionis therefore limited. Furthermore, the geophone distance is 5 m, which makes it very difficult to detectlowvelocityzonesnarrowerthan5–10mwithanykindofprocessingtechnique,assum-ing that the velocity contrast is 2,000 m/s. Thus, all low velocity zones narrower than c. 10 m, and those located close to the array boundaries, should be handled with extreme care.
SomedisadvantageswiththeWET-techniquearetheriskofvelocityartefactswhenusingalow degree of smoothing in combination with low data coverage. This is the case especially if there are strong topography variations. The reason for using minimum smoothing in this test was to try to extract as much information as possible from the data. Another drawback is that the gradient approach used by the software may indicate increasing velocity with depth, even though the bedrock is almost homogenous rock with presumably more or less constant P-wave velocity.
AdvantageswiththeWET-techniquearethatitisfast,automatedandallarrivaltimedataareused in the creation of the velocity model. The quality control is based on independent statistics suchasuncertaintynumbers,raycoverageplotsandmodelfitparameters.Inthetraditionalprocessing technique, the velocity model is the result of a combination of manual interpolation and personal judgements made by the interpreter. The interpreter may also have to decide if one shot is more “reliable” than another shot, even if the raw data quality is equally good for both shots. This makes the traditional velocity model less general compared with the tomography inversion model.

134
3 Data input
Firstarrivaltimes,layoutgeometriesandtopographydataweresuppliedbyBjörnToressonatImpaktGeofysik.
4 Data processing
DataprocessingwasperformedbyuseofthesoftwareRayfract™version2.64.Eachgeophonearraywasprocessedseparately.However,thearrays8–11(sectionlength768.5–1,194.5m)and14–15(sectionlength1,419.5–1,639.5m)werealsoprocessedascontinuouslines.Rawdatawere rearranged to fit the software specifications. A 2D velocity gradient model was constructed andafirstsmoothinversionwasperformed(10iterations),whichresultsina“stable”lowresolution model. Following this procedure, the data were re-processed starting with the 2D velocitygradientasstartingmodel,with40–100iterationsandminimalsmoothing.Minimalsmoothing gives high resolution but also increases the risk of artefacts in the resulting velocity model, especially in this test when the data coverage is close to the lower limits according to the software demands. The high and low smoothing models were subsequently interpreted with respect to velocity variations that indicate soil cover thickness, bedrock topography and areas or zones with decreased P-wave velocity possibly related to rock deformation.
Quality control of the resulting velocity models was performed by:
• Quantitativestatisticsofmodelfittorawdata(maxerror,meanerror,relativemisfit).
• Qualitativecomparisonbetweencalculatedandmeasuredtraveltimecurves.
• Inspectionofraycoverageplots.
5 Results and interpretation
ThevelocitymodelforprofileLFM001017basedonWETtomographyinversionispresentedinFigure5-1togetherwiththemodelbasedonthetraditionalprocessingtechnique.InFigure5-1theintersectionpointsbetweentheseismicprofileanddiscordantmagneticlineaments(possibledeformationzones)from/Isakssonetal.2006/areshownbytriangles.Lineamentslongerandshorter than 1,000 m are shown by larger and smaller triangles, respectively. Two geophone arrays(117–232mand2,217.5–2,232.5m)containtoofewshotsforafullyreliablemodelcalculation. Notwithstanding this limitation, these sections have also been processed. Possible anomalies along these two sections should be viewed with considerable care.
Meanerrors(meanresidualbetweenmeasuredandmodelledtraveltime)aregenerallybelow0.3ms,whichindicatesagoodmodelfittothemeasureddata.Geophonearrayswithanomalouslyhighmeanerrors(error>0.5ms)andpoormodelfitsoccurat430.5–530.5m,530.5–634.5m,883.5–998.5mand1,861.5–1,976.5m.However,modelfitstothedataalongthesefoursectionsarefair,andnomeanerrorsexceed0.8ms.Thecombinedinversionmodelforlines8,9,10and11(768.5–1,194.5)showsameanerrorof0.7ms(shot1ofline9wasdisregarded).Thecombinedinversionmodelforlines14–15(1,419.5–1,639.5m)showsameanerrorof0.41ms.Ingeneral,thereisagoodagreementbetweenthetomographyinversionmodels and the velocity model presented in /Toresson 2006/, but significant deviations between the two models do occur. The velocity intervals roughly correspond to the geological features indicated in the table below.

135
Velocity interval Geological feature
0–1,500 m/s soft soil or heavily crushed rock1,500–3,000 m/s moraine or fractured rock3,000–4,000 m/s fractured/weathered/altered rock (soil rock boundary at c. 3,000 m/s)> 4,000 m/s sound rock
The bedrock surface roughly corresponds to the magenta colour in the velocity model.
Inthefollowingtext,commentstothevelocitymodelforeachline(geophonearray)arepresented. The term “soil” refers to the Quaternary cover.
Array 1 (0–115 m)
Majordepressionofthebedrocksurfaceat30–40m,possiblyincombinationwithalowveloc-ityzone.Diffuseboundarybetweensoilcoverandbedrocksurfaceat0–30m,possiblyindicat-ing weathering and/or increased fracturing in the uppermost part of the bedrock, or another type of moraine.
Array 2 (117–232 m) (few shots, extra care)
Thin soil cover, high P-wave velocities in the bedrock.
Array 3 (233–348 m)
Majordepressionofthebedrocksurfaceatc.250–285m,whichpossiblyindicatesalowvelocityzone.Diffuseboundarybetweensoilcoverandbedrocksurfaceat340–350m,pos-sibly indicating weathering and/or increased fracturing in the uppermost part of the bedrock or anothertypeofmoraine(alsosupportedbythemodelforArray4).
Array 4 (348–430 m)
Diffuseboundarybetweensoilcoverandbedrocksurfaceat380–400m,possiblyindicatingweathering and/or increased fracturing in the uppermost part of the bedrock or another type of moraine.
Array 5 (430.5–530.5 m) (poor model fit)
Diffuseboundarybetweensoilcoverandbedrocksurfaceat420–450m,possiblyindicatingweathering and/or increased fracturing in the uppermost part of the bedrock. Low velocity zone inthebedrockindicatedatc.488–494m(highuncertainty).
Array 6 (530.5–634.5 m) (poor model fit)
Startingat510m(array5)andendingat540m(array6).Diffuseboundarybetweensoilcoverand bedrock surface, possibly indicating weathering and/or increased fracturing in the upper-mostpartofthebedrockoranothertypeofmoraine.Highuncertaintyduetopoormodelfitbutbedrock surface shows good correlation with traditional model.

136
Array 7 (646.5–761.5 m)
Along the entire section the model indicates thin or “normal” soil cover with unusually high velocities. The reason could be fractured rock close to the ground surface or soil cover thickness of1–2mwithanomalouslyhighP-wavevelocity(1,500–3,000m/s),“solidmoraine”,oreffectsrelated to the fact that the profile cross-cuts a wetland or lake.
Array 8 (768.5–883.5 m)
Along the entire section, the model indicates thin or “normal” soil cover with unusually high velocities. The reason could be fractured rock close to the ground surface, a soil cover thickness of1–2mwithanomalouslyhighP-wavevelocity(1,500–3,000m/s),i.e.“solidmoraine”,oreffects related to the fact that the profile cross-cuts a wetland or lake. Sharp bedrock depression inthebedrockindicatedatc.838–848m(highuncertainty).
Array 9 (883.5–998.5 m) (poor model fit)
AreaofindicateddecreasedP-velocityinthesectionc.870–910mmayberelatedtoincreasedsoilcoverthickness.Increasedmeanerrorofmodelfitlowersthecertaintyofthepresentedmodel.
Array 10 (998.5–1,113.5 m)
Increasedsoilcoverthicknessalongmajorpartofthesection.Sharpbedrockdepressionindi-catedinthesectionc.1,000–1,010m.
Array 11 (1,113.5–1,194.5 m)
Bedrock depression in combination with either high soil or low rock velocities in the section 1,125–1,155m.Thedepressionisindicatedalongthesectionc.1,060–1,155m.
Arrays 8–11 combined processing (768.5–1,194.5 m)
The combined processing of these four arrays shows a similar result as the single-array process-ingapartfromonemajordeviation.Inthecombinedvelocitymodel,asignificantlowvelocityzoneisindicatedatc.1,020–1,035m.Inthesingle-arraymodel,thereisnosuchanomalyinthispartofthesection,butthereisabedrockdepressionindicatedatc.1,000–1,010m.Sincenolowvelocityzoneatc.1,020–1,035misindicatedinthemodelpresentedby/Toresson2006/,thesuggested low velocity zone is interpreted as an artefact caused by boundary condition problems in the combined model between the two geophone arrays at c. 1,000 m.
Array 12 (1,194.5–1,309 m)
Thesection1,160–1,290mischaracterizedbyaninferredsoilcoverthicknessof0.5–2mwithpartlyanomalouslyhighP-wavevelocity(1,500–3,000m/s).Thereasoncouldbefracturedrockclosetothegroundsurface,asoilcoverthicknessof1–2mwithanomalouslyhighP-wavevelocity, i.e. “solid moraine”, or effects related to the fact that the profile cross-cuts a wetland or lake.Bedrockdepressionandpossiblelowvelocityzoneatc.1,270–1,280m.
Array 13 (1,309–1,424 m)
Topographichighthatcoincideswithincreasedsoilcoverthicknessofc.2–4m(normalsoilP-wavevelocities,c.500–1,500m/s).Indicationoflowvelocityzoneat1,310m.However,thisanomalyisclosetothearrayboundary,whichmakesitveryuncertain(mostlikelyartefact).

137
Array 14 (1,419.5–1,534.5 m)
Inferredsoilcoverthicknessof1–2mandgenerallyhighP-wavevelocitiesintheunderlyingbedrock.Lowvelocityzoneindicatedinthesectionc.1,507–1,515m.Decreasedvelocitiesinthebedrockalongtheintervalc.1,510–1,560m.
Array 15 (1,534.5–1,639.5 m)
Inferredsoilcoverthicknessof1–2m.Apartfromthesectionc.1,534–1,550m,therearefairlyhigh P-wave velocities in the underlying bedrock with a diffuse boundary between soil cover and bedrock surface. Possibly indicates weathering and/or increased fracturing in the uppermost part of the bedrock or another type of moraine.
Arrays 14–15 combined processing (1,419.5–1,639.5 m)
The combined velocity model fully supports the single-array models and their interpretations.
Array 16 (1,641.5–1,756.5 m)
Large variations in the bedrock surface topography. Decreased P-wave velocity present in the uppermost part of the bedrock along the entire profile, as well as a diffuse boundary between soil cover and bedrock surface. Possibly indicates weathering and/or increased fracturing in the uppermost part of the bedrock or another type of moraine.
Array 17 (1,861.5–1,976.5 m) (poor model fit)
The model indicates large variations in the bedrock topography along the major part of the pro-file.Possiblelowvelocityzonesinthebedrockareindicatedinthesectionsc.1,860–1,870mand1,942–1,953m(highuncertainty).Themodelfittothedataispoorbuttheaboveresultisalsosupportedbyamorelowresolutionmodelwithmaximumsmoothing(100iterations).
Array 18 (1,986.5–2,101.5 m)
Increasedsoilcoverthickness(c.3m)alongtheentireprofile.Fairlydistinctdepressionofthebedrocksurfaceinthesection2,058–2,073m.Lowvelocityzoneinthebedrockindicatedatc.2,093–2,100m,whichisattheboundaryofthearray.Thisrendersthemodelinterpretationas more uncertain.
Array 19 (2,101.5–2,216.5 m)
Increasedsoilcoverthickness(c.3–4m)alongtheentireprofileandlargevariationsofthebedrocktopography.Distinctdepressionofthebedrocksurfaceinthesection2,145–2,161m.Thiscoincideswithanear-surfacehighvelocityanomalythatismostlikelyartificial.However,asimilardepressionisindicatedinthehighsmoothingmodel(withoutanyartefact)andalsointhe model by /Toresson 2006/. The depression coincides with indicated decrease in the P-wave velocity in the underlying bedrock.
Array 20 (2,217.5–2,332.5 m) (few shots, extra care)
Increasedsoilcoverthickness(c.2–4m)alongtheentireprofileandlargevariationsofthebedrocktopography.Distinctdepressionofthebedrocksurfaceinthesection2,265–2,290m.Diffuse boundary between soil cover and bedrock surface, possibly indicating weathering and/or increased fracturing in the uppermost part of the bedrock.

138

139

140
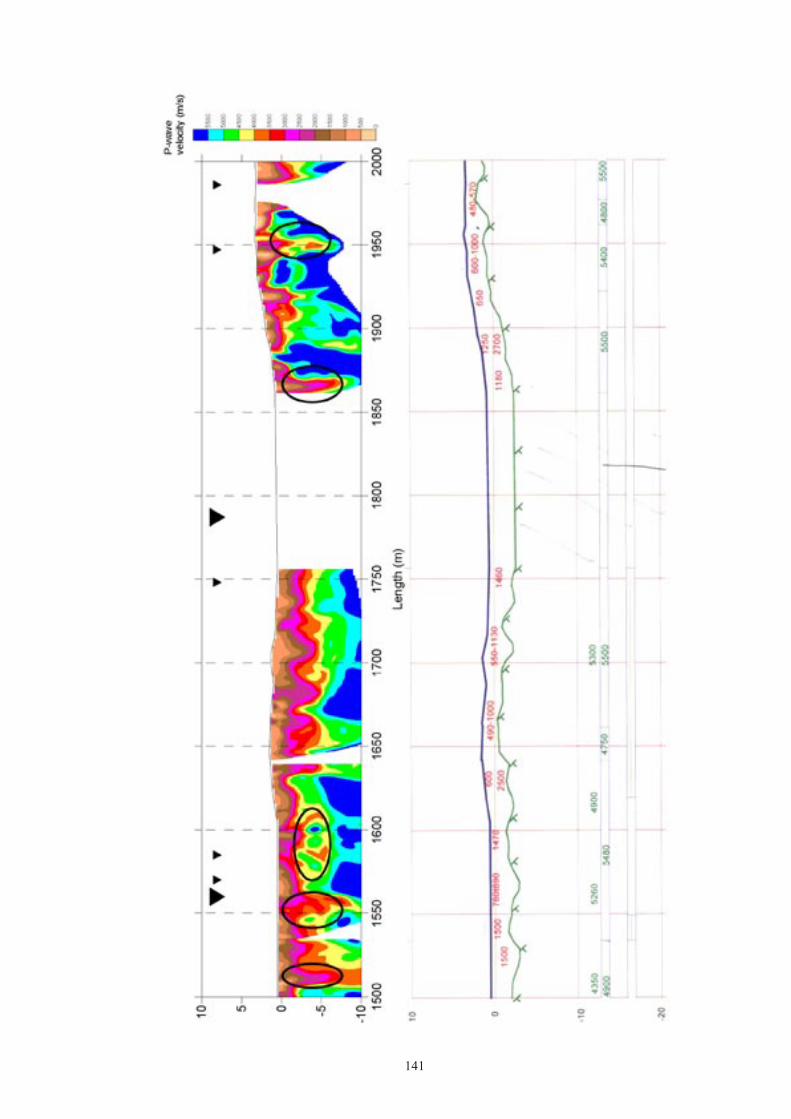
141

142
Fig
ure
5-1.
Vel
ocity
mod
el b
ased
on
WET
inve
rsio
n to
mog
raph
y (to
p) a
nd tr
aditi
onal
pro
cess
ing
(bot
tom
) alo
ng th
e LF
M00
1017
refr
actio
n se
ism
ic p
rofil
e. S
ectio
ns a
long
ea
ch o
f the
pro
files
with
an
infe
rred
dec
reas
ed P
wav
e ve
loci
ty a
re in
dica
ted
by th
e el
lipse
s. Th
e tr
iang
les
indi
cate
pos
ition
s w
here
dis
cord
ant m
agne
tic li
neam
ents
inte
rsec
t th
e pr
ofile
/Isa
ksso
n et
al.
2006
/. Li
neam
ents
long
er th
an 1
,000
m a
re s
how
n by
larg
er tr
iang
les.
The
sect
ion
c. 0
–270
m w
as n
ot in
clud
ed in
the
inte
rpre
tatio
n of
mag
netic
da
ta.
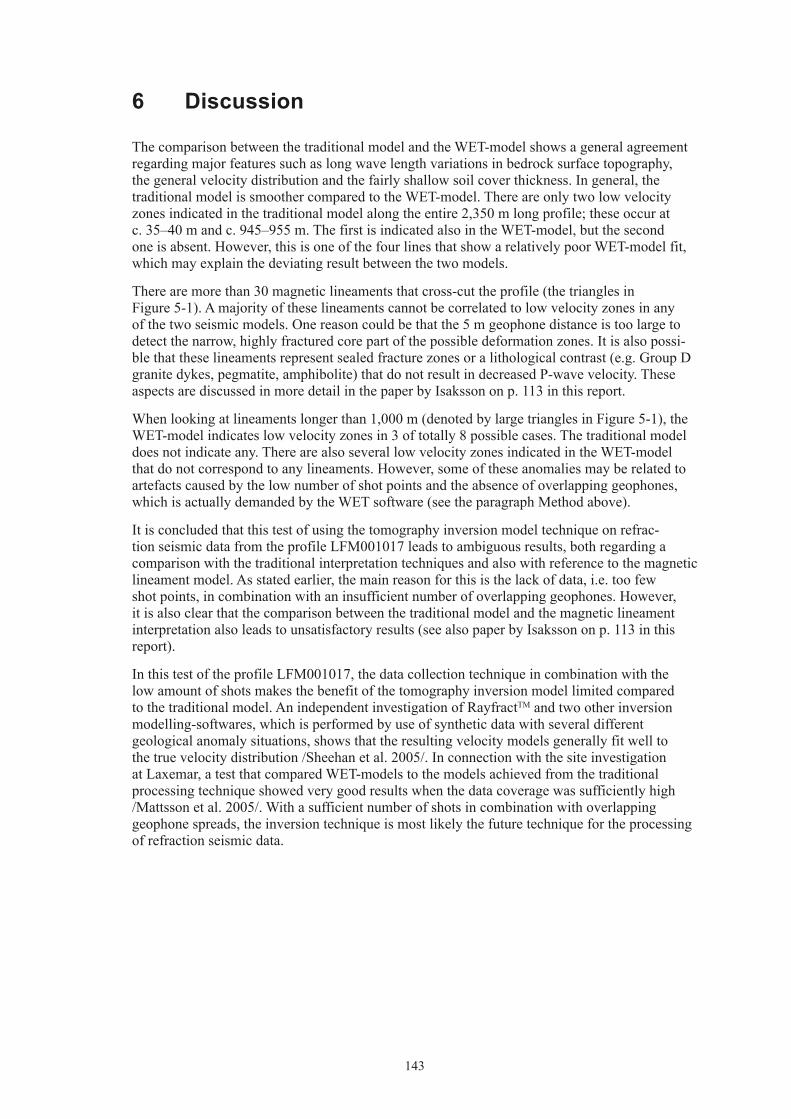
143
6 Discussion
ThecomparisonbetweenthetraditionalmodelandtheWET-modelshowsageneralagreementregarding major features such as long wave length variations in bedrock surface topography, thegeneralvelocitydistributionandthefairlyshallowsoilcoverthickness.Ingeneral,thetraditionalmodelissmoothercomparedtotheWET-model.Thereareonlytwolowvelocityzonesindicatedinthetraditionalmodelalongtheentire2,350mlongprofile;theseoccuratc.35–40mandc.945–955m.ThefirstisindicatedalsointheWET-model,butthesecondoneisabsent.However,thisisoneofthefourlinesthatshowarelativelypoorWET-modelfit,which may explain the deviating result between the two models.
Therearemorethan30magneticlineamentsthatcross-cuttheprofile(thetrianglesinFigure5-1).Amajorityoftheselineamentscannotbecorrelatedtolowvelocityzonesinanyof the two seismic models. One reason could be that the 5 m geophone distance is too large to detectthenarrow,highlyfracturedcorepartofthepossibledeformationzones.Itisalsopossi-blethattheselineamentsrepresentsealedfracturezonesoralithologicalcontrast(e.g.GroupDgranitedykes,pegmatite,amphibolite)thatdonotresultindecreasedP-wavevelocity.TheseaspectsarediscussedinmoredetailinthepaperbyIsakssononp.113inthisreport.
Whenlookingatlineamentslongerthan1,000m(denotedbylargetrianglesinFigure5-1),theWET-modelindicateslowvelocityzonesin3oftotally8possiblecases.Thetraditionalmodeldoesnotindicateany.TherearealsoseverallowvelocityzonesindicatedintheWET-modelthatdonotcorrespondtoanylineaments.However,someoftheseanomaliesmayberelatedtoartefacts caused by the low number of shot points and the absence of overlapping geophones, whichisactuallydemandedbytheWETsoftware(seetheparagraphMethodabove).
Itisconcludedthatthistestofusingthetomographyinversionmodeltechniqueonrefrac-tion seismic data from the profile LFM001017 leads to ambiguous results, both regarding a comparison with the traditional interpretation techniques and also with reference to the magnetic lineament model. As stated earlier, the main reason for this is the lack of data, i.e. too few shotpoints,incombinationwithaninsufficientnumberofoverlappinggeophones.However,it is also clear that the comparison between the traditional model and the magnetic lineament interpretationalsoleadstounsatisfactoryresults(seealsopaperbyIsakssononp.113inthisreport).
InthistestoftheprofileLFM001017,thedatacollectiontechniqueincombinationwiththelow amount of shots makes the benefit of the tomography inversion model limited compared tothetraditionalmodel.AnindependentinvestigationofRayfractTM and two other inversion modelling-softwares, which is performed by use of synthetic data with several different geo logical anomaly situations, shows that the resulting velocity models generally fit well to thetruevelocitydistribution/Sheehanetal.2005/.InconnectionwiththesiteinvestigationatLaxemar,atestthatcomparedWET-modelstothemodelsachievedfromthetraditionalprocessing technique showed very good results when the data coverage was sufficiently high /Mattssonetal.2005/.Withasufficientnumberofshotsincombinationwithoverlappinggeophone spreads, the inversion technique is most likely the future technique for the processing of refraction seismic data.

144
7 References
Isaksson H, Thunehed H, Pitkänen T, Keisu M, 2006. Detailed ground and marine magneticsurveyandlineamentinterpretationintheForsmarkarea–2006.SKBP-06-261,SvenskKärnbränslehanteringAB.
Isaksson H, 2007. Correlation between refraction seismic data, low magnetic lineaments anddeformationzones(modelstage2.2);inGeology−backgroundcomplementarystudies.Forsmarkmodellingstage2.2.SKBR-07-56,SvenskKärnbränslehanteringAB.
Lecomte I, Gjøstdal H, Dahle A, Pedersen O C, 2000.Improvingmodellingandinversioninrefractionseismicswithfirst-orderEikonalsolver.GeophysicalProspecting,v48,pp437–454.
Mattsson H, Triumf C-A, Lindqvist G, 2005.Re-interpretationoftherefractionseismicprofiles277,280and506byuseofWavepathEkonalTraveltimeTomography–acomparisonwiththetraditionalinterpretationtechnique.SKBP-05-179,SvenskKärnbränslehanteringAB.
Sheehan J R, Doll W E, Mandell W A, 2005. An evaluation of methods and available software forSeismicRefractionTomographyAnalysis.JEEG,v10,pp21–34.
Toresson B, 2006.Seismicrefractionsurvey2005–2006.SKBP-06-138,SvenskKärnbränslehanteringAB.

145
Correlation of oriented radar reflectors with geological features in boreholes at Forsmark
Seje Carlsten, GeoSigma AB
Contents 1 Aim of study 146
2 Description of borehole radar 146
2.1 Radar measurements with RAMAC 146
2.2 Radar interpretation 147
3 Data used for the radar correlation 149
4 Execution of the radar correlation 150
4.1 General 150
4.2 Correlation procedure 153
5 Results 155
5.1 Correlation of oriented radar reflectors with geological features in possible deformation zones 155
5.2 Correlation between radar reflectors and vuggy rock 156
6 Summary and conclusions 157
7 References 158
Appendix 1 Correlation between oriented radar reflectors and geological features in possible deformation zones 160
Appendix 2 Correlation between radar reflectors and occurrences of vuggy rock 187

146
1 Aim of study
This report aims to correlate oriented borehole radar reflectors with geological features from geological Boremap-mapping in the Forsmark investigation area. Only radar reflectors located within possible deformation zones from the single-hole interpretation work and their extension according to model stage 2.1 have been assessed in the correlation process. The correlation aims toaddressthekeyquestion−whatisthegeologicalsignificanceoftheorientedradarreflectorsinsidethezones?
A separate study was made on the correlation of borehole radar reflectors with vuggy rock sections. This study aims to establish whether these rocks correlate with radar reflectors and whether the reflectors provide any information on the orientation of the vuggy rock sections.
2 Description of borehole radar
The description of the borehole radar system in this chapter is mainly from the radar reports /AaltonenandGustafsson2004,GustafssonandGustafsson2004a–f,2005a–f,2006a–e/.
2.1 Radar measurements with RAMACTheRAMACGPRsystem,whichisownedbySKB,isafullydigitalGPRsystem,whereemphasis has been laid on rapid survey execution and easy field operation. The system operates dipoleanddirectionalantennae(seeFigure2-1).
Figure 2-1. Example of a borehole radar antenna.
Receiver (Rx)
Transmitter (Tx)
Glass fiber rod separating the two antennas
The directional antenna

147
The borehole radar system consists of a transmitter and a receiver antenna. During operation, anelectromagneticpulse,withinthefrequencyrangeof20MHzupto250MHz,isgeneratedinside the bedrock. Once a feature, e.g. a water-filled fracture or a lithological contact, with suf-ficiently different electrical properties is encountered, the pulse is reflected back to the receiver and recorded.
2.2 Radar interpretationThe results from radar measurements are presented in the form of a radargram, where the positionoftheprobeintheboreholeisshownalongoneaxis(denotedDistance(metre)inFigure2-2)andtheradarwavepropagationandreflectionisshownalongtheotheraxis(denotedDepth(metre)inFigure2-2).AnexampleofaradargramfromaboreholeinForsmarkis shown in Figure 2-2. The amplitude of the received signal is visualized in the radargram using a grey scale where black colour corresponds to large positive signals and white colour to large negativesignals.Greycolourcorrespondstonoreflectedsignals.Reflectorsfromthesurround-ing rock constitute lines in the radargram. The data are adjusted for the measurement point of the antennae. The measurement point is defined to be the central point between the transmitter and the receiver antenna.
The two basic patterns to interpret in borehole measurements are point and planar reflectors. Inthereflectionmode,boreholeradaressentiallygivesahigh-resolutionimageoftherockmass.Itshowsthegeometryofplanesorstructures,whichmayormaynotintersecttheborehole(contactbetweenlayers,thinmarkerbeds,fractures),orthepresenceoflocalfeaturesaroundtheborehole(cavities,lensesetc).
The distance to a reflecting feature or plane is determined by measuring the difference in arrival time between the direct and the reflected pulse. The basic assumption is that the speed of propagation is the same everywhere.
Onlythelarger,clearlyvisiblestructuresareinterpretedinRadinterSKB.Anumberofminorstructures also exist but are not interpreted. Commonly, several structures can be identified, but they are most probably situated so close to each other that it is impossible to distinguish onefromtheother.Ifpresent,largerstructuresparalleltotheboreholearealsodocumented.Itshouldalsobepointedoutthatinterpretedreflectionsincludeanintersectionpointwiththeborehole,eveniftheyarelocatedfarawayfromtheborehole.Insomecases,theymaynotintersect the borehole.
The resolution and penetration of radar waves depend on the antenna frequency used. Low antennafrequency(20MHz)yieldslowerresolutionbuthigherpenetrationdepthcomparedtoahigherfrequency.Ifstructurescanbeidentifiedwithallthreeantennafrequencies,itisprob-able that the structure is a significant geological feature.
Figure 2-2. Radargram showing an overview (20 MHz data) of the borehole radar measurements in KFM08C.

148
Theorientationofthefeature(reflector)canalsobeprovided.ThedatafromdirectionalantennaconsistsofseveralradargramsdisplayedindividuallyinRadinterSKB.Thereisoneradargramfor each 3 degrees step around the borehole. The interpretor changes the radargrams during the interpretation process, in order to find the correct direction to the feature. The interpretation forsomeradarreflectorsisuncertain.Inthesecases,thedirectionfromtheprobetothefeature(reflector)canbe±180degrees,forexamplethedirectiontoanfeaturecanbeeither70°or250°. The direction to the feature is defined in Figure 2-3. As the borehole inclination is less than85°,thedirectiontothefeatureiscalculatedusinggravityroll.Thedirectiontothefeatureandtheintersectionangle(alpha)arerecalculatedtostrikeanddip.Thestrikeofaplaneisthe angle between the line of the plane’s cross-section with the surface and the magnetic north direction.Itiscountedclockwiseandcanbebetween0and359°.Astrikeof0°impliesadiptotheeastwhileastrikeof180°impliesadiptothewest.Theplanedipistheanglebetweentheplaneandthesurface.Itcanvarybetween0and90°,where0°ishorizontaland90°isvertical.
Itshouldbenotedthattheinterpretationoforientationfromthedirectionalradarantennaisbased on the internal deviation measurements in the directional antenna. For this reason, the radarinterpretationsareunaffectedbyanyrevisionsinboreholedeviations.Itshouldalsobenotedthatastructuremayhaveseveraldifferentangles,ifthestructure(reflector)isundulatingintheradargram.Thesedifferentintersectiondepthsaregivenforsomestructures(reflectors).Normally, the part that is interpreted closest to the borehole is the one that can be connected to a mapped geological structure in the borehole.
Figure 2-3. Definition of intersection angle, direction to feature using gravity roll, and inferred strike and dip using the righthandrule method.

149
3 Data used for the radar correlation
The following data and interpretations have been used for the radar correlation of the boreholes:
• Possibledeformationzonesfromthesingle-holeinterpretationworkandtheirextensionsasdefined in model stage 2.1 /SKB 2006/.
• RevisedBoremapdatafromSicada(includingBIPSandgeologicalmappingdata)forthesezonesthattakesaccountoftheorientationcorrectionscompletedduringearly2007.InTable 3-1 the date for extraction and delivery of data is presented. Data were extracted from SicadabyAllanStråhle.
• Radardataandtheirinterpretation,withtablesandradargrams/AaltonenandGustafsson2004,GustafssonandGustafsson2004a–f,2005a–f,2006a–e/.AccuracyforinterpretedradardataispresentedinTable3-2.Ifthereflectorisnotplanar,theaccuracyofintersectiondecreases. Furthermore, the angle close to the borehole may differ from the angle further away from the borehole.
Table 3-1. Date for extraction of Boremap data from Sicada.
Borehole Date for extraction and delivery of Boremap data in Sicada
KFM01A 2007-03-09KFM01B 2007-03-05KFM01D 2007-03-05KFM02A 2007-03-05KFM03A 2007-05-23KFM03B 2007-03-05KFM04A 2007-03-05KFM05A 2007-03-05KFM06A 2007-03-05KFM06B 2007-03-05KFM06C 2007-03-05KFM07A 2007-03-05KFM07B 2007-03-05KFM07C 2007-03-08KFM08A 2007-03-05KFM08B 2007-03-05KFM08C 2007-03-08KFM09A 2007-03-05KFM09B 2007-03-05KFM10A 2007-03-05

150
4 Execution of the radar correlation
4.1 General20boreholeswereincludedintheradarcorrelationstudy(Table4-1andAppendix1).78possi-ble deformation zones from the single-hole interpretation work and their extensions, as defined in model stage 2.1 /SKB 2006/, were used. A total number of 271 oriented radar reflectors were defined within the possible deformation zones and their extended parts. Some possible deforma-tion zones were excluded due to the absence of oriented radar reflectors within the zones. A few orientedradarreflectorswereexcludedduetotheabsenceofBIPS-images.
A separate study was made on the correlation between vuggy rock sections in the boreholes and radarreflectors(Table4-2andAppendix2).Inthisstudy,bothorientedradarreflectorsandnon-oriented radar reflectors were included. All the occurrences of vuggy rock in 9 boreholes were studied. Most occurrences contain more than one borehole interval that are separated by one or several,shortintervalsoffresh,unalteredrock(Table4-2).
Thegeneralworkingprocedurereliesonacarefulvisualinspection.ItissummarizedinFigure 4-1 and in the text below.
Table 3-2. Accuracy of intersection length, angle to borehole axis and direction (azimuth) for a reflector. From SKB MD 252.020 vers. 3.0.
Antenna type (MHz)
Angle to borehole axis (interval) Parameter0–29° 30–59° 60–90°
20 > ± 5 m ± 4–5 m < ± 5 m Intersection length100 > ± 3 m ± 2–3 m < ± 2 m Intersection length250 > ± 2 m ± 1–2 m < ± 1 m Intersection length100 ± 2° ± 5° ± 10° Angle to borehole axis250 ± 2° ± 5° ± 10° Angle to borehole axis60 (Directional) ± 2° ± 5° ± 5° Direction (azimuth)
Figure 4-1. Schematic chart that shows the procedure for the development of the radar correlation.
Radar correlation
Boremap dataSingle-hole
interpretation data
Radar data

151
Table 4-1. Boreholes, possible deformation zones, oriented radar reflectors and confidence of correlation included in the correlation study.
Borehole Number of possible deformation zones
Number of radar reflectors
Number of confidence levels between radar reflector and geological featureNone Low Medium High
KFM01A 2 6 1 3 1 1KFM01B 3 7 3 – 2 2KFM01D 5 7 – – 3 4KFM02A 4 24 2 9 6 7KFM03A 5 13 – 1 7 5KFM03B 2 4 – – 1 3KFM04A 5 19 2 4 7 6KFM05A 5 38 2 20 7 9KFM06A 10 27 1 3 9 14KFM06B 1 4 – – 3 1KFM06C 5 32 1 – 10 21KFM07A 4 11 – 2 3 6KFM07B 3 5 – – 1 4KFM07C 2 4 – 1 2 1KFM08A 5 23 – 5 12 6KFM08B 0 0 – – – –KFM08C 4 13 2 4 4 3KFM09A 5 10 – 3 3 4KFM09B 5 17 – 1 5 11KFM10A 3 7 – 4 2 1
Table 4-2. Occurrence of altered vuggy rock in the boreholes /Olofsson et al. 2007/.
Occurrence Borehole Adjusted SECUP (m)
Adjusted SECLOW (m)
Intensity
1 KFM02A 171.4017 172.0464 Medium1 KFM02A 174.3257 174.6049 Medium1 KFM02A 174.6069 175.1762 Weak1 KFM02A 175.1792 175.2756 Medium1 KFM02A 176.9033 177.0077 Faint1 KFM02A 179.4226 180.0532 Medium2 KFM02A 247.8602 248.2394 Faint2 KFM02A 248.8501 264.6114 Weak2 KFM02A 264.6143 266.0617 Medium2 KFM02A 266.0638 272.9400 Weak2 KFM02A 272.9420 274.9207 Medium2 KFM02A 274.9238 276.6634 Strong2 KFM02A 276.6664 279.6094 Medium2 KFM02A 279.6124 283.1108 Strong2 KFM02A 283.1138 283.4965 Medium2 KFM02A 283.4985 284.3242 Strong2 KFM02A 284.3262 284.8857 Weak2 KFM02A 284.8867 296.5319 Strong2 KFM02A 298.8883 299.0470 Strong

152
Occurrence Borehole Adjusted SECUP (m)
Adjusted SECLOW (m)
Intensity
2 KFM02A 299.2398 299.5151 Strong2 KFM02A 301.6063 301.7067 Weak3 KFM06A 332.4962 332.7465 Medium4 KFM06A 610.6420 611.0861 Weak5 KFM06A 770.8406 770.8858 Weak6 KFM06B 66.5638 66.9108 Weak6 KFM06B 68.6588 69.0540 Medium6 KFM06B 69.0570 70.1661 Weak7 KFM06C 451.4576 452.2256 Strong8 KFM08A 409.8545 412.0399 Strong9 KFM08C 454.9640 458.2870 Medium9 KFM08C 462.0960 462.2760 Faint9 KFM08C 462.2790 462.4950 Medium10 KFM08C 497.8410 497.9030 Weak10 KFM08C 497.9040 498.9950 Strong11 KFM08C 511.6210 511.6410 Faint11 KFM08C 512.8850 512.9310 Faint11 KFM08C 517.2170 517.2880 Faint11 KFM08C 519.1460 519.9780 Medium11 KFM08C 520.4340 520.7890 Weak11 KFM08C 523.1160 523.4460 Weak11 KFM08C 523.4510 525.7750 Medium11 KFM08C 526.2380 526.4410 Weak11 KFM08C 531.5300 531.7940 Medium12 KFM09A 511.7505 513.9343 Faint12 KFM09A 513.9343 515.4333 Weak12 KFM09A 515.4344 515.7068 Medium12 KFM09A 515.7068 520.0322 Weak13 KFM09B 382.3123 382.3254 Weak14 KFM09B 568.9249 569.3978 Weak14 KFM09B 569.3998 572.6340 Medium14 KFM09B 572.6360 573.4531 Weak15 KFM10A 86.9287 88.7894 Weak15 KFM10A 89.3205 89.9060 Weak15 KFM10A 92.6009 93.0834 Faint15 KFM10A 93.0864 94.2436 Weak15 KFM10A 96.6878 97.4517 Weak15 KFM10A 98.7714 98.9686 Faint15 KFM10A 98.9706 99.8841 Weak15 KFM10A 99.8851 100.3489 Medium15 KFM10A 100.3509 101.0936 Weak15 KFM10A 104.0204 104.7111 Faint15 KFM10A 104.9550 105.4848 Faint15 KFM10A 111.4764 111.5854 Faint15 KFM10A 111.5874 114.6291 Weak15 KFM10A 114.6341 118.5576 Faint16 KFM10A 483.5521 487.7752 Faint

153
4.2 Correlation procedureThe first step in the working procedure is to define the oriented radar reflectors occurring within the possible deformation zones from the single-hole interpretation work and their extension. The IDoftheorientedradarreflector,theboreholelength,thealphaangle,theorientationandtheradargrams are collected from the radar P-reports.
Thesecondstepistointerprettheradiusandthestrengthoftheradarreflectors(Figure4-2)andthe presence of low radar amplitude. The strength is a subjective judgement of a combination of the intensity and the extension of a radar structure in the radargram. The strength is judged on the following basis: 3 = strong, 2 = medium and 1 = weak. The strength and the radius have been judged in one or several of the different radargrams with different frequency. The frequency radargram, where the reflector is most distinct, is used for judgement of radius and strength.However,theorientationofthereflectorisalwaystakenfromthe60MHzdirectionalradargram.
The radar amplitude is the first arrival of the radar wave travelling along the borehole wall. The amplitude variation indicates changes of the electrical conductivity in the borehole wall and the closest surroundings. Low radar amplitude may indicate the presence of a fracture zone, clay, a different lithology or a higher porosity of the rock. This step is made on the basis of the radargrams in the radar P-reports.
The third step is to correlate the oriented radar reflector with a geological feature from Boremap. ThisismadeonthebasisofBIPS-imagesandtheBoremapmapping.Thefirstcriterionforthecorrelationistheboreholelengthoftheradarreflector.Theboreholelength±2–3missearchedforsuitablegeologicalfeatureswithasimilaralphaangleastheorientedradarreflector.Ifmorethan one candidate is present, the orientation of the geological feature is compared with the orientationoftheradarreflectorandtheonewithbestagreementisselected.Insomecases,whenthealphaangleissmall,anintervalupto±3–5mintheboreholeissearchedforsuitablegeological features. This is based on the fact that the interpreted intersection of radar reflectors
Figure 4-2. Principle for calculation of the radius of a radar reflector outside a borehole.
Borehole
Radar reflector
Radius

154
with borehole length is more uncertain for radar reflectors with small alpha angle compared to thosewithlargealphaangle.Inmanycases,asinglefracturecanbecorrelatedwiththeradarreflector. The single fracture may be one of several parallel single fractures occurring close to each other.
The fourth step is to place a confidence level on each correlation between oriented radar reflec-tor and geological feature. The confidence level is a subjective judgement of the agreement between the oriented radar reflector and the geological feature, based on a combination of the borehole length, the alpha angle and the orientation of the radar reflector and the geological feature. The confidence level is made on the following basis: 3 = high, 2 = medium, 1 = low and0=none.Insomecases,therearenoBoremapdataavailableandtheconfidencelevelisset to N/A, and is not included in the statistics.
The fifth step is a statistical analysis of the correlated data. The results of this analysis are pre-sented in Tables 5-1 to 5-4. The correlation between radar reflectors and vuggy rock is presented in Table 5-5. An explanation of the columns in the correlation tables in Appendices 1 and 2 are provided below.
Borehole radar
DZ Possibledeformationzonefromthesingle-holeinterpretationworkandtheirextension(indicatedbyExtinthetable)asdefinedinmodelstage 2.1 /SKB 2006/.
ID Identificationnumberoforientedradarreflectorfromtheradarinterpretation report.
Borehole length Adjusted length of the oriented radar reflector from the radar interpretation report.
Alpha Theanglebetweenaplaneandtheboreholeaxis.Ifthealphaangleis0°,theplaneisparalleltotheboreholeaxis.Ifthealphaangleis90°,the plane is perpendicular to the borehole axis.
Ori1 The orientation of the radar reflector from the radar interpretation report. The strike and dip of the oriented radar reflectors make use of the right-hand-rulemethod,e.g.040°/80°correspondstoastrikeofN40°Eandadipof80°totheSE.
Ori2 An alternative orientation of the radar reflector from the radar interpreta-tion report. This alternative is presented only in the cases where the inter-pretationofthedirectiontothefeature(reflector)isuncertain.Selectedalternative for the correlation is indicated by extra bold type.
Radius Thedistancebetweentheboreholeandthepointfurthestawayfromtheborehole where the reflector can still be observed. The radius is always perpendiculartotheboreholeaxis(Figure4-2).Theradiusisinterpretedfrom the radargram in the radar interpretation report.
Strength A subjective judgement of a combination of the intensity and the exten-sion of a radar structure in the radargram. The strength is interpreted from the radargram in the radar interpretation report. The strength is assessed on the following basis: 3 = strong, 2 = medium and 1 = weak.
Low radar amplitude The amplitude of the first arrival of the radar wave travelling along the borehole wall. The amplitude variation indicates changes of the electrical conductivity in the borehole wall and the closest surroundings. Low radar amplitude might indicate the presence of a fracture zone, clay, a different lithology or a higher porosity in the rock. The amplitude is from the radargram in the radar report.

155
Inferred geological feature from Boremap
Borehole length Adjusted length of the geological feature from the Boremap data in Sicada.
Alpha Theanglebetweenthegeologicalfeature(plane)andtheboreholeaxis.Ifthealphaangleis0°theplaneisparalleltoboreholeaxis.Ifthealphaangle is 90° the plane is perpendicular to the borehole axis.
Ori The orientation of the geological feature from Boremap data. The strike and dip of the orientation of geological structures make use of the right-hand-rulemethod,e.g.040°/80°correspondstoastrikeofN40°Eandadipof80°totheSE.
Feature Description of the geological feature from Boremap data.
Comment Description of the geological feature.
Confidence level Subjective judgement of the agreement between the oriented radar reflector and the geological feature, based on a combination of the bore-hole length, the alpha angle and the orientation. The confidence is made on the following basis: 3 = high, 2 = medium, 1 = low and 0 = none. N/A indicates intersection above or below available Boremap data.
5 Results
5.1 Correlation of oriented radar reflectors with geological features in possible deformation zones
The results of the correlation of oriented radar reflectors with geological features in possible deformation zones are presented in Appendix 1. The correlation of oriented radar reflectors shows that 45% of all oriented radar reflectors can be correlated with contacts between differ-entrocktypes(Table5-1).37%oftheorientedradarreflectorscanbecorrelatedwithbrokenfractures, crush zones or breccias, and only 10% can be correlated with unbroken fractures or sealed networks. Alteration is shown by 1% and foliation by 2% of the oriented radar reflectors. Finally, 5% of the oriented radar reflectors within possible deformation zones show no correla-tion with geological features. Since the correlation is made with reflectors that are observed somedistance(uptoatleast3–4m)fromtheborehole,itisprobablethattheradarreflectorsthat fail to correlate with a geological feature simply do not intersect the borehole along the possible deformation zone.
The confidence level is high for 41% of the correlations between oriented radar reflectors and geological features, medium for 32% and low for 22%. For 5% of the oriented radar reflectors nocorrelationcouldbecarriedout(Table5-2).
Oriented radar reflectors that have been correlated with contact between rock types show a high confidence level for 50%, medium confidence level for 30% and low confidence level for 20% (Table5-3).
The corresponding confidence level for oriented radar reflectors that have been correlated with a broken fracture, a crush zone or a breccia is high for 36%, medium for 40% and low for 24% (Table5-4).
Itisapparentthatthedirectionalantennadetectsrockcontactstoahigherdegreethanbrokenfractures, crush zones or breccias. The correlation with unbroken fractures, sealed networks, alteration and foliation is very limited.

156
Table 5-1. Oriented radar reflectors and correlation with geological features from Boremap.
Oriented radar reflectors in DZ
Contact between rock types
Broken fracture, crush zone or breccia
Unbroken fracture or sealed fracture network
Alteration Foliation No correlation
271 121 101 28 3 5 1345% 37% 10% 1% 2% 5%
Table 5-2. Oriented radar reflectors and confidence of correlation with geological features from Boremap.
Oriented radar reflectors in DZ
Confidence 3 = high
Confidence 2 = medium
Confidence 1 = low
Confidence 0 = none
271 110 88 60 1341% 32% 22% 5%
Table 5-3. Oriented radar reflectors and confidence of correlation with contact between rock types.
Oriented radar reflectors in DZ
Confidence 3 = high
Confidence 2 = medium
Confidence 1 = low
121 60 36 2550% 30% 20%
Table 5-4. Oriented radar reflectors and confidence of correlation with a broken fracture, crush zone or a breccia.
Oriented radar reflectors in DZ
Confidence 3 = high
Confidence 2 = medium
Confidence 1 = low
101 36 41 2436% 40% 24%
5.2 Correlation between radar reflectors and vuggy rockThe results of the correlation between radar reflectors and vuggy rock are presented in Appendix 2. For 57% of the vuggy rock occurrences, there is no correlation with the radar data (Table5-5).Itissuggestedthateitherthereisnoradarreflectoratthelocationorthereisaverypoor agreement between the orientation of the radar reflector and the orientation of the vuggy rock.Lowconfidenceisshownby26%oftheoccurrences,8.5%showmediumconfidenceandonly8.5%showahighconfidenceofcorrelationbetweenradarreflectorandvuggyrock.
Table 5-5. Sections with vuggy rock and confidence of correlation with with radar reflectors.
Sections with vuggy rock
Confidence 3 = high
Confidence 2 = medium
Confidence 1 = low
Confidence 0 = none
47 4 4 12 278.5% 8.5% 26% 57%

157
One explanation for the results presented above can be that the contrast in electrical properties between vuggy rock and its surroundings is not distinct enough to favour detection by borehole radar. The radar waves need a rather sharp electrical contrast to be reflected i.e. a distinct rock contact or a fracture zone. A second explanation can be that the boundary between the vuggy rock and its surroundings is not a planar structure, cf. a fracture zone or a rock contact. For this reason, it is not detected by borehole radar. Thirdly, the vuggy rock may form diffuse, scattered areas in the rock mass and the data from Boremap may simply not be representative of the orientation ofthevuggyrockanomaly.Inthiscase,vuggyrockisrepresentedintheboreholeradarandtheorientation of the reflector may provide a better interpretation of the orientation of this rock.
Insummary,thisstudyshowsthatthereisnosimplecorrelationbetweenboreholeradarandthe occurrences of vuggy rock. For this reason, it can be concluded that borehole radar is not an efficientmethodtodetectorevaluatetheorientationofvuggyrockinboreholes.However,thesecond statement is only valid if it is assumed that the vuggy rock sections are planar structures in the rock mass and if the Boremap data represent the orientation of these structures.
6 Summary and conclusions
• Theattempttocorrelateorientedradarreflectorswithgeologicalfeaturesalongpossibledeformation zones in boreholes shows that 45% of all oriented radar reflectors can be corre-lated with contacts between different rock types, 37% can be correlated with a broken fracture, a crush zone or a breccia and only 10% can be correlated with an unbroken fracture or a sealed network. Alteration is shown by 1% and foliation by 2% of the correlated oriented radar reflectors. Finally, 5% of the correlated oriented radar reflectors within possible deformation zones show no correlation with geological features.
• Theconfidencelevelishighfor41%oforientedradarreflectorsthathavebeencorrelatedwith geological features, a medium confidence level exists for 32%, a low confidence level for 22% and 5% lack a correlation.
• Theconfidencelevelforthecorrelationoforientedradarreflectorswiththecontactbetweenrock types is high for 50% of the reflectors, medium for 30% and low for 20%. The cor-responding confidence level for oriented radar reflectors, which have been correlated with a broken fracture, a crush zone or a breccia, is high for 36%, medium for 40% and low for 24%.
• Itisconcludedthatthedirectionalantennaisabletodetectrockcontactsmoreefficientlythan broken fractures, crush zones or breccias. The method is not effective for the detection of unbroken fractures, sealed networks, alteration and foliation.
• Theseparatestudyofvuggyrockshowsthatifthevuggyrocksectionsareplanarstructuresin the rock mass and if the Boremap data is representative of the orientation of these structures, then the borehole radar is not an effective method to detect this type of geological feature. For 57% of the vuggy rock occurrences, there is no correlation at all between these occurrencesandradardata,26%showalowconfidence,8.5%showamediumconfidenceandonly8.5%showahighconfidenceofcorrelationbetweenradarreflectorandvuggyrock.
• Oneexplanationforthepoorcorrelationbetweenboreholeradarandvuggyrockmaybethatthe electrical properties between vuggy rock and its surrounding are not distinct enough to favour detection by borehole radar. The radar waves need a rather sharp electrical contrast to be reflected, i.e. a rock contact or a fracture zone. A second explanation can be that the bound-ary between the vuggy rock and its surroundings is not a planar structure, cf. a fracture zone or a rock contact. For this reason, it is not detected by borehole radar. Thirdly, the vuggy rock may form diffuse, scattered areas in the rock mass and the data from Boremap may simply notberepresentativeoftheorientationofthevuggyrockanomaly.Inthiscase,vuggyrock

158
is represented in the borehole radar and the orientation of the reflector may provide a better interpretation of the orientation of this rock.
7 References
Aaltonen J, Gustafsson C, 2004.Forsmarksiteinvestigation.RAMACandBIPSlogginginboreholeKFM01A.SKBP-03-45,SvenskKärnbränslehanteringAB.
Gustafsson J, Gustafsson C, 2004a.Forsmarksiteinvestigation.RAMACandBIPSlogginginboreholeKFM01BandRAMACdirectionalre-logginginboreholeKFM01A.SKBP-04-79,SvenskKärnbränslehanteringAB.
Gustafsson J, Gustafsson C, 2004b.Forsmarksiteinvestigation.RAMACandBIPSlogginginboreholeKFM02A.SKBP-04-40,SvenskKärnbränslehanteringAB.
Gustafsson J, Gustafsson C, 2004c.Forsmarksiteinvestigation.RAMACandBIPSlogginginboreholeKFM03AandKFM03B.SKBP-04-41,SvenskKärnbränslehanteringAB.
Gustafsson J, Gustafsson C, 2004d.Forsmarksiteinvestigation.RAMACandBIPSlogginginboreholesKFM04A,KFM04B,HFM09andHFM10.SKBP-04-67,SvenskKärnbränslehanteringAB.
Gustafsson J, Gustafsson C, 2004e.Forsmarksiteinvestigation.RAMACandBIPSlogginginboreholesKFM05A.SKBP-04-152,SvenskKärnbränslehanteringAB.
Gustafsson J, Gustafsson C, 2004f.Forsmarksiteinvestigation.RAMACandBIPSlogginginboreholesKFM06A,HFM16,HFM17,HFM18andHFM19.SKBP-04-69,SvenskKärnbränslehanteringAB.
Gustafsson J, Gustafsson C, 2005a.Forsmarksiteinvestigation.RAMACandBIPSlogginginboreholeKFM06B.SKBP-05-53,SvenskKärnbränslehanteringAB.
Gustafsson J, Gustafsson C, 2005b.Forsmarksiteinvestigation.RAMACandBIPSlogginginboreholeKFM06C.SKBP-05-242,SvenskKärnbränslehanteringAB.
Gustafsson J, Gustafsson C, 2005c.Forsmarksiteinvestigation.RAMACandBIPSlogginginboreholeKFM07A(0–100m),HFM20andHFM21.SKBP-05-64,SvenskKärnbränslehanteringAB.
Gustafsson J, Gustafsson C, 2005d.Forsmarksiteinvestigation.RAMACandBIPSlogginginboreholeKFM07A.SKBP-reportP-05-52,SvenskKärnbränslehanteringAB.
Gustafsson J, Gustafsson C, 2005e.Forsmarksiteinvestigation.RAMACandBIPSlogginginboreholeKFM08A.RevisedApril2006.SKBP-05-158,SvenskKärnbränslehanteringAB.
Gustafsson J, Gustafsson C, 2005f.Forsmarksiteinvestigation.RAMACandBIPSlogginginboreholeKFM08B.RevisedApril2006.SKBP-05-58,SvenskKärnbränslehanteringAB.
Gustafsson J, Gustafsson C, 2006a.Forsmarksiteinvestigation.RAMACandBIPSlogginginboreholesKFM07B,KFM09A,HFM25andHFM28.SKBP-06-44,SvenskKärnbränslehanteringAB.
Gustafsson J, Gustafsson C, 2006b.Forsmarksiteinvestigation.RAMACandBIPSlogginginboreholesKFM07C,HFM36,HFM37andBIPSre-logginginHFM26.SKBP-06-120,SvenskKärnbränslehanteringAB.

159
Gustafsson J, Gustafsson C, 2006c.Forsmarksiteinvestigation.RAMACandBIPSlogginginboreholesKFM08C,HFM30,HFM31,HFM33andHFM34.SKBP-06-178,SvenskKärnbränslehanteringAB.
Gustafsson J, Gustafsson C, 2006d.Forsmarksiteinvestigation.RAMACandBIPSlogginginboreholesKFM09B,HFM24,HFM26,HFM27,HFM29andHFM32.SKBP-06-64,SvenskKärnbränslehanteringAB.
Gustafsson J, Gustafsson C, 2006e.Forsmarksiteinvestigation.RAMACandBIPSlogginginboreholesKFM10A,HFM35andHFM38.SKBP-06-177,SvenskKärnbränslehanteringAB.
Olofsson O, Simeonov A, Stephens M B, Follin S, Nilsson A-C, Röshoff K, Lindberg U, Lanaro F, Frederiksson A, Persson L, 2007. Site descriptive modelling, Forsmark stage 2.2. Presentation of a fracture domain concept as a basis for the statistical modeling of fracturesandminordeformationzones,andinterdisciplinarycoordination.SKBR-07-15,SvenskKärnbränslehanteringAB.
SKB, 2006. Site descriptive modelling, Forsmark stage 2.1. Feedback for completion of the site investigationincludinginputfromsafetyassessmentandrepositoryengineering.SKBR-06-38,SvenskKärnbränslehanteringAB.

160
App
endi
x 1
Cor
rela
tion
betw
een
orie
nted
rada
r ref
lect
ors
and
geol
ogic
al fe
atur
es in
pos
sibl
e de
form
atio
n zo
nes
KFM
01A
DZ
Bor
ehol
e ra
dar
Infe
rred
geo
logi
cal f
eatu
re fr
om b
orem
apC
onfid
ence
le
vel
In d
ata
Inte
rpre
tatio
nC
orre
latio
nId
Bor
ehol
e le
ngth
(m)
Alp
haO
ri1O
ri2R
adiu
s (m
) St
reng
thLo
w ra
dar
ampl
itude
(m)
Bor
ehol
e le
ngth
(m)
Alp
haO
riFe
atur
eC
omm
ent
2M
xx38
7.0
5304
4/45
232/
25 5
–10
239
0–40
0–
––
Non
eR
efle
ctor
out
side
bor
ehol
e0
2M
x39
8.6
1623
6/66
054/
82 5
139
0–40
039
8.6
906
1/89
Unb
roke
n fra
ctur
es4
para
llel t
o O
ri23
3V
xx64
1.3
4719
1/32
– 5
165
0–65
364
0.8
5333
9/41
Roc
k oc
curr
ence
1010
57/1
0106
11
3X
651.
950
055/
5524
8/29
41
650–
653
651.
751
359/
49R
ock
occu
rren
ce10
1057
/111
058
23
659.
3 8
223/
86–
18–2
43
650–
653
659.
023
259/
58R
ock
occu
rren
ce10
1057
/111
058
R
efle
ctor
out
side
bor
ehol
e1
31
663.
545
348/
53–
4–6
165
0–65
366
3.6
3327
0/50
Bro
ken
fract
ure
Qua
rtz, 1
6 m
m
Ref
lect
or o
utsi
de b
oreh
ole
1

161
KFM
01B
DZ
Bor
ehol
e ra
dar
Infe
rred
geo
logi
cal f
eatu
re fr
om b
orem
apC
onfid
ence
le
vel
In d
ata
Inte
rpre
tatio
nC
orre
latio
nID
Bor
ehol
e le
ngth
(m)
Alp
haO
ri1O
ri2R
adiu
s (m
) St
reng
thLo
w ra
dar
ampl
itude
(m)
Bor
ehol
e le
ngth
(m)
Alp
haO
riFe
atur
eC
omm
ent
1E
40.8
8503
3/09
341/
152
120
–25
27–3
138
–42
45–5
0
40.8
8208
6/13
Cru
sh z
one
3
1F
49.2
6902
5/33
240/
155
120
–25
27–3
138
–42
45–5
0
49.7
6913
2/11
Cru
sh z
one
2
21
111.
18
153/
71–
73
129–
132
112.
27
156/
85U
nbro
ken
fract
ure
Epi
dote
2 m
m3
2Q
122.
470
339/
33–
31
129–
132
123.
771
150/
07B
roke
n fra
ctur
eC
lay
6 m
m2
2R
131.
459
018/
4321
6/22
21
129–
132
––
–0
330
417.
542
018/
6620
5/33
62
416–
420
417.
743
354/
65R
ock
type
1010
57/1
0105
73
335
445.
755
028/
4923
8/19
31
416–
420
––
–0
KFM
01D
DZ
Bor
ehol
e ra
dar
Infe
rred
geo
logi
cal f
eatu
re fr
om b
orem
apC
onfid
ence
le
vel
In d
ata
Inte
rpre
tatio
nC
orre
latio
nId
Bor
ehol
e le
ngth
(m)
Alp
haO
ri1O
ri2R
adiu
s (m
) St
reng
thLo
w ra
dar
ampl
itude
(m)
Bor
ehol
e le
ngth
(m)
Alp
haO
riFe
atur
eC
omm
ent
122
182.
356
137/
71–
101
179–
184
182.
448
161/
68B
roke
n fra
ctur
e2
272
414.
421
351/
89–
122
–41
4.7
1734
7/77
Bro
ken
fract
ure
33
169
488.
445
144/
8003
2/27
182
488–
491
488.
339
149/
88R
ock
occu
rren
ce10
1058
/101
057
33
8748
9.8
5906
7/13
–60
348
8–49
149
0.2
4301
3/13
Roc
k oc
curr
ence
1010
57/1
0201
72
413
167
6.8
5816
2/40
–15
268
8–69
767
6.8
5016
0/69
Alb
itiza
tion
Alte
ratio
n2
413
069
2.2
6007
6/52
158/
5217
268
8–69
769
2.2
5215
8/67
Roc
k ty
pe10
1057
/102
017,
Ori2
35
141
772.
019
219/
5124
7/82
213
–77
2.0
1925
0/81
Roc
k oc
curr
ence
1010
57/8
022,
Ori2
3
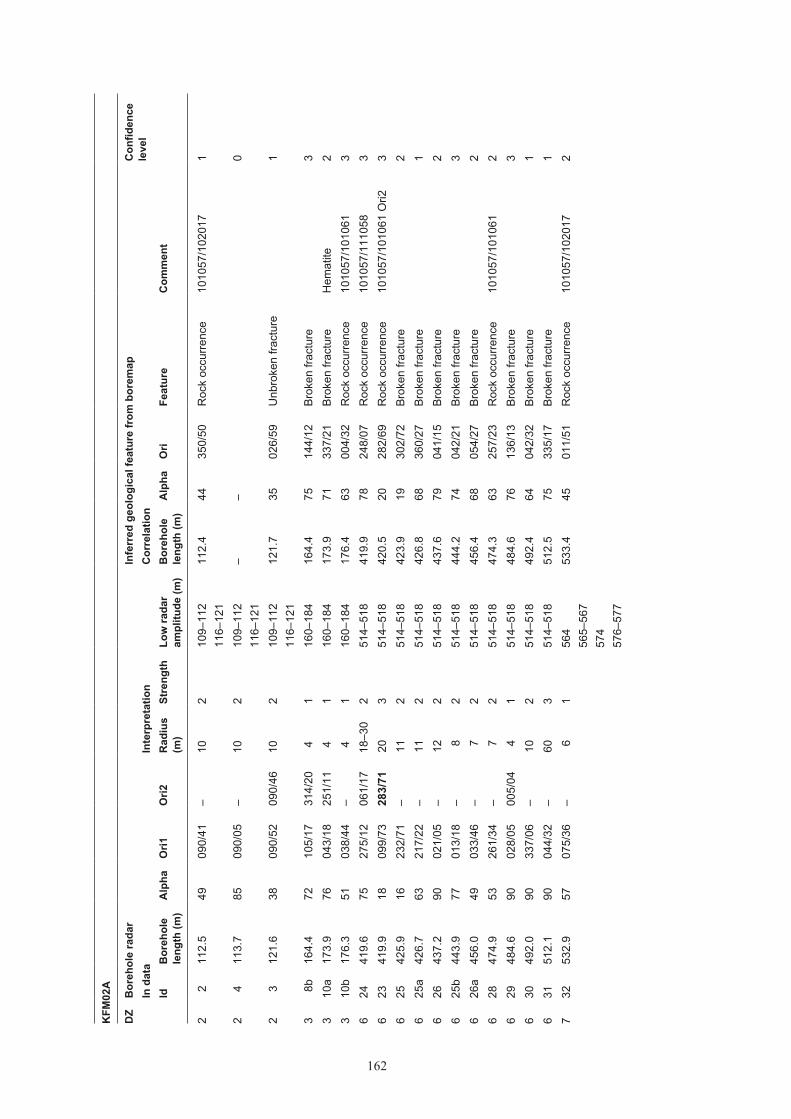
162
KFM
02A
DZ
Bor
ehol
e ra
dar
Infe
rred
geo
logi
cal f
eatu
re fr
om b
orem
apC
onfid
ence
le
vel
In d
ata
Inte
rpre
tatio
nC
orre
latio
nId
Bor
ehol
e le
ngth
(m)
Alp
haO
ri1O
ri2R
adiu
s (m
) St
reng
thLo
w ra
dar
ampl
itude
(m)
Bor
ehol
e le
ngth
(m)
Alp
haO
riFe
atur
eC
omm
ent
2 2
112.
549
090/
41–
102
109–
112
116–
121
112.
444
350/
50R
ock
occu
rren
ce10
1057
/102
017
1
2 4
113.
785
090/
05–
102
109–
112
116–
121
––
0
2 3
121.
638
090/
5209
0/46
102
109–
112
116–
121
121.
735
026/
59U
nbro
ken
fract
ure
1
3 8
b16
4.4
7210
5/17
314/
204
116
0–18
416
4.4
7514
4/12
Bro
ken
fract
ure
33
10a
173.
976
043/
1825
1/11
41
160–
184
173.
971
337/
21B
roke
n fra
ctur
eH
emat
ite2
310
b17
6.3
5103
8/44
–4
116
0–18
417
6.4
6300
4/32
Roc
k oc
curr
ence
1010
57/1
0106
13
624
419.
675
275/
1206
1/17
18–3
02
514–
518
419.
978
248/
07R
ock
occu
rren
ce10
1057
/111
058
36
2341
9.9
1809
9/73
283/
7120
351
4–51
842
0.5
2028
2/69
Roc
k oc
curr
ence
1010
57/1
0106
1 O
ri23
625
425.
916
232/
71–
112
514–
518
423.
919
302/
72B
roke
n fra
ctur
e2
625
a42
6.7
6321
7/22
–11
251
4–51
842
6.8
6836
0/27
Bro
ken
fract
ure
16
2643
7.2
9002
1/05
–12
251
4–51
843
7.6
7904
1/15
Bro
ken
fract
ure
26
25b
443.
977
013/
18–
82
514–
518
444.
274
042/
21B
roke
n fra
ctur
e3
626
a45
6.0
4903
3/46
–7
251
4–51
845
6.4
6805
4/27
Bro
ken
fract
ure
26
2847
4.9
5326
1/34
–7
251
4–51
847
4.3
6325
7/23
Roc
k oc
curr
ence
1010
57/1
0106
12
629
484.
690
028/
0500
5/04
41
514–
518
484.
676
136/
13B
roke
n fra
ctur
e3
630
492.
090
337/
06–
102
514–
518
492.
464
042/
32B
roke
n fra
ctur
e1
631
512.
190
044/
32–
603
514–
518
512.
575
335/
17B
roke
n fra
ctur
e1
732
532.
957
075/
36–
61
564
565–
567
574
576–
577
533.
445
011/
51R
ock
occu
rren
ce10
1057
/102
017
2

163
KFM
02A
DZ
Bor
ehol
e ra
dar
Infe
rred
geo
logi
cal f
eatu
re fr
om b
orem
apC
onfid
ence
le
vel
In d
ata
Inte
rpre
tatio
nC
orre
latio
nId
Bor
ehol
e le
ngth
(m)
Alp
haO
ri1O
ri2R
adiu
s (m
) St
reng
thLo
w ra
dar
ampl
itude
(m)
Bor
ehol
e le
ngth
(m)
Alp
haO
riFe
atur
eC
omm
ent
733
549.
863
193/
22–
202
564
565–
567
574
576–
577
549.
441
105/
51R
ock
occu
rren
ce10
1051
/101
061
1
734
a56
0.8
6635
5/29
158/
204
156
456
5–56
757
457
6–57
7
––
0
7B
B56
6.2
2801
3/68
191/
5620
–30
356
456
5–56
757
457
6–57
7
566.
224
220/
60R
ock
occu
rren
ce10
1061
/102
017
Ori2
3
736
a59
6.9
3604
5/60
228/
483
156
456
5–56
757
457
6–57
7
570.
627
182/
57B
roke
n fra
ctur
eO
ri21
Ext
Q91
4.7
5730
9/33
–12
291
2–92
091
4.7
5309
7/41
Unb
roke
n fra
ctur
eP
rehn
ite1
Ext
Q91
7.3
7309
8/19
–10
291
2–92
091
7.5
5204
8/46
Roc
k oc
curr
ence
1080
19/1
0105
11

164
KFM
03A
DZ
Bor
ehol
e ra
dar
Infe
rred
geo
logi
cal f
eatu
re fr
om b
orem
apC
onfid
ence
le
vel
In d
ata
Inte
rpre
tatio
nC
orre
latio
nID
Bor
ehol
e le
ngth
(m)
Alp
haO
ri1O
ri2R
adiu
s (m
) St
reng
thLo
w ra
dar
ampl
itude
(m)
Bor
ehol
e le
ngth
(m)
Alp
haO
riFe
atur
eC
omm
ent
1Y
359
6135
3/36
171/
263
136
4–36
636
9–37
438
6–39
0
359.
156
180/
29B
roke
n fra
ctur
eO
ri23
1X
365
7311
6/14
321/
216
136
4–36
636
9–37
438
6–39
0
364.
570
302/
22B
roke
n fra
ctur
eO
r23
1U
367
1604
0/78
222/
7010
136
4–36
636
9–37
438
6–39
0
369.
115
015/
79U
nbro
ken
fract
ure
Pyr
ite3
1Zx
375
6219
4/23
010/
3310
236
4–36
636
9–37
438
6–39
0
375.
145
156/
41B
roke
n fra
ctur
e2
1 2
389
7127
7/22
073/
2318
336
4–36
636
9–37
438
6–39
0
388.
671
095/
19C
rush
Ori2
3
1 3
399
6608
2/24
–12
336
4–36
636
9–37
438
6–39
0
399.
374
044/
20R
ock
occu
rren
ce10
1057
/102
017
2
210
452
5804
3/36
235/
276
245
0–45
545
2.6
6107
0/31
Roc
k ty
pe10
1057
/102
017
23
3264
063
183/
2000
8/34
123
645–
650
640.
861
126/
27R
ock
occu
rren
ce10
1061
/102
017
23
3364
469
045/
30–
153
645–
650
644.
462
084/
30R
ock
occu
rren
ce10
1057
/102
017
24
4780
458
268/
27–
163
803–
805
813–
817
803.
851
110/
39R
ock
occu
rren
ce10
1057
/101
061
1
447
x81
168
092/
23–
41
803–
805
813–
817
811.
064
130/
24R
ock
occu
rren
ce10
1061
/101
051
2
448
815
8132
8/21
109/
176
280
3–80
581
3–81
781
5.4
7135
1/24
Bro
ken
fract
ure
3
556
944
7603
1/26
223/
106
294
2–94
694
4.6
7102
5/50
Bro
ken
fract
ure
Mus
covi
te, c
lay
2

165
KFM
03B
DZ
Bor
ehol
e ra
dar
Infe
rred
geo
logi
cal f
eatu
re fr
om b
orem
apC
onfid
ence
le
vel
In d
ata
Inte
rpre
tatio
nC
orre
latio
nId
Bor
ehol
e le
ngth
(m)
Alp
haO
ri1O
ri2R
adiu
s (m
) St
reng
thLo
w ra
dar
ampl
itude
(m)
Bor
ehol
e le
ngth
(m)
Alp
haO
riFe
atur
eC
omm
ent
1C
2762
276/
2509
6/25
31
26–2
827
.258
054/
35R
ock
type
1010
61/1
0201
7 O
ri22
1C
x29
4609
6/44
–10
126
–28
28.6
5510
5/33
Bro
ken
fract
ure
31
D37
5918
0/33
000/
33 8
226
–28
36.5
6100
9/34
Roc
k oc
curr
ence
V
ein
1010
57/1
0106
1 O
ri23
2H
6659
359/
36–
122
64–6
765
.161
025/
34C
rush
3
KFM
04A
DZ
Bor
ehol
e ra
dar
Infe
rred
geo
logi
cal f
eatu
re fr
om b
orem
apC
onfid
ence
le
vel
In d
ata
Inte
rpre
tatio
nC
orre
latio
nId
Bor
ehol
e le
ngth
(m)
Alp
haO
ri1O
ri2R
adiu
s (m
) St
reng
thLo
w ra
dar
ampl
itude
(m)
Bor
ehol
e le
ngth
(m)
Alp
haO
riFe
atur
eC
omm
ent
Ext
D13
2.4
4632
0/19
129/
7112
3–
132.
036
137/
82R
ock
occu
rren
ce10
2017
/101
056
Ori2
3E
xtI
153.
846
343/
17–
182
–15
3.6
5921
5/10
Bro
ken
fract
ure
1E
xtJ
156.
338
129/
8031
3/24
51
–15
6.0
4113
4/77
Bro
ken
fract
ure
Ap
= 3
31
L17
0.9
3132
6/32
–9
217
0–17
617
0.9
2932
6/90
Roc
k oc
curr
ence
1010
56/1
0201
71
2T
205.
946
128/
73–
122
202–
206
206–
214
205.
542
148/
76R
ock
occu
rren
ceD
yke
1010
57/1
0105
83
2V
210.
949
316/
11–
51
202–
206
206–
214
–0
3Y
234.
761
136/
5704
4/09
152
232–
242
235.
552
022/
17B
roke
n fra
ctur
eA
p =
10 m
m O
ri23
Ext
932
1.6
5234
6/12
–6
231
7–32
432
1.8
5704
3/14
Bro
ken
fract
ure
2E
xt12
353.
954
134/
7601
6/09
51
–35
3.5
4412
2/78
Bro
ken
fract
ure
3E
xt13
361.
762
131/
57–
132
358–
362
361.
961
109/
58R
ock
occu
rren
ce10
1051
/101
057
3E
xt14
370.
353
121/
0306
3/42
61
–37
0.2
5412
5/69
Bro
ken
fract
ure
Hem
atite
Ori2
2

166
KFM
04A
DZ
Bor
ehol
e ra
dar
Infe
rred
geo
logi
cal f
eatu
re fr
om b
orem
apC
onfid
ence
le
vel
In d
ata
Inte
rpre
tatio
nC
orre
latio
nId
Bor
ehol
e le
ngth
(m)
Alp
haO
ri1O
ri2R
adiu
s (m
) St
reng
thLo
w ra
dar
ampl
itude
(m)
Bor
ehol
e le
ngth
(m)
Alp
haO
riFe
atur
eC
omm
ent
Ext
1639
2.4
5014
6/76
–7
1–
392.
346
078/
60R
ock
occu
rren
ce10
1061
/101
051
1E
xt17
406.
643
165/
6304
3/41
82
–40
6.5
5612
9/70
Roc
k oc
curr
ence
She
ar z
one
24
2442
5.0
924
3/61
–25
341
4–42
644
5–45
045
8–46
1
412.
79
234/
69B
recc
iaR
ock
occu
rren
ceB
recc
iate
d10
1051
/601
52
419
434.
554
338/
07–
81
414–
426
445–
450
458–
461
–0
420
447.
655
253/
0612
0/70
51
414–
426
445–
450
458–
461
447.
635
114/
88R
ock
occu
rren
ce10
1061
/102
017
Ori2
2
421
455.
251
350/
08–
102
414–
426
445–
450
458–
461
455.
443
137/
82R
ock
occu
rren
ceV
ein
1010
57/1
0106
11
430
459.
37
206/
87–
–1
414–
426
445–
450
458–
461
458.
09
259/
75B
roke
n fra
ctur
e2
545
658.
048
143/
78–
163
656–
661
657.
949
136/
80S
truct
ure
Folia
tion
stro
ng2
Ext
7998
6.2
5414
1/81
–3
198
4–98
8N
o bo
rem
ap d
ata
N/A

167
KFM
05A
DZ
Bor
ehol
e ra
dar
Infe
rred
geo
logi
cal f
eatu
re fr
om b
orem
apC
onfid
ence
le
vel
In d
ata
Inte
rpre
tatio
nC
orre
latio
nId
Bor
ehol
e le
ngth
(m)
Alp
haO
ri1O
ri2R
adiu
s (m
) St
reng
thLo
w ra
dar
ampl
itude
(m)
Bor
ehol
e le
ngth
(m)
Alp
haO
riFe
atur
eC
omm
ent
1A
111.
362
192/
5310
0/20
193
–11
1.5
5132
2/11
Bro
ken
fract
ure
Cla
y, A
pertu
re =
31
Ext
2840
2.4
4116
4/81
–15
240
4–40
940
2.5
4214
9/77
Roc
k oc
curr
ence
1010
61/1
0105
73
Ext
2940
5.6
4122
4/76
–27
340
4–40
940
5.7
3922
0/81
Bre
ccia
6005
/101
057
32
31a
417.
322
011/
80–
41
426–
433
417.
522
347/
79R
ock
occu
rren
ce10
1057
/102
017
32
3242
4.2
3415
1/88
–18
242
6–43
342
3.5
3316
4/90
Roc
k oc
curr
ence
1010
61/1
0201
73
233
424.
750
166/
7229
9/02
41
426–
433
424.
460
176/
64A
ltera
tion
12
3442
7.6
5309
2/24
200/
658
242
6–43
342
7.8
5814
0/55
Roc
k oc
curr
ence
1010
57/1
0106
1 O
ri21
366
604.
552
260/
27–
61
590–
600
613–
617
629–
631
704–
708
714–
723
752–
753
–0
365
604.
636
308/
31–
112
590–
600
613–
617
629–
631
704–
708
714–
723
752–
753
–0
362
605.
562
154/
6424
9/23
81
590–
600
613–
617
629–
631
704–
708
714–
723
752–
753
605.
255
114/
17R
ock
occu
rren
ce10
1057
/101
051
1
364
a60
6.2
1930
5/47
–12
159
0–60
061
3–61
762
9–63
170
4–70
871
4–72
375
2–75
3
605.
413
055/
80B
roke
n fra
ctur
e1

168
KFM
05A
DZ
Bor
ehol
e ra
dar
Infe
rred
geo
logi
cal f
eatu
re fr
om b
orem
apC
onfid
ence
le
vel
In d
ata
Inte
rpre
tatio
nC
orre
latio
nId
Bor
ehol
e le
ngth
(m)
Alp
haO
ri1O
ri2R
adiu
s (m
) St
reng
thLo
w ra
dar
ampl
itude
(m)
Bor
ehol
e le
ngth
(m)
Alp
haO
riFe
atur
eC
omm
ent
369
a61
0.2
5616
7/74
284/
1410
359
0–60
061
3–61
762
9–63
170
4–70
871
4–72
375
2–75
3
610.
639
186/
86B
roke
n fra
ctur
e2
368
610.
961
232/
25–
122
590–
600
613–
617
629–
631
704–
708
714–
723
752–
753
611.
073
191/
52B
roke
n fra
ctur
e1
371
613.
946
258/
3614
1/67
122
590–
600
613–
617
629–
631
704–
708
714–
723
752–
753
613.
531
027/
89B
recc
iaR
ock
occu
rren
ce10
1057
/600
5 B
recc
ia1
372
628.
237
158/
86–
102
590–
600
613–
617
629–
631
704–
708
714–
723
752–
753
628.
033
007/
88B
roke
n fra
ctur
e2
373
a64
1.1
4230
1/20
–4
159
0–60
061
3–61
762
9–63
170
4–70
871
4–72
375
2–75
3
640.
734
107/
55R
ock
occu
rren
ce10
1057
/101
061
1

169
KFM
05A
DZ
Bor
ehol
e ra
dar
Infe
rred
geo
logi
cal f
eatu
re fr
om b
orem
apC
onfid
ence
le
vel
In d
ata
Inte
rpre
tatio
nC
orre
latio
nId
Bor
ehol
e le
ngth
(m)
Alp
haO
ri1O
ri2R
adiu
s (m
) St
reng
thLo
w ra
dar
ampl
itude
(m)
Bor
ehol
e le
ngth
(m)
Alp
haO
riFe
atur
eC
omm
ent
376
657.
441
311/
20–
202
590–
600
613–
617
629–
631
704–
708
714–
723
752–
753
656.
941
031/
14U
nbro
ken
1
378
671.
756
258/
22–
72
590–
600
613–
617
629–
631
704–
708
714–
723
752–
753
671.
931
160/
89B
roke
n fra
ctur
e1
379
678.
863
159/
55–
51
590–
600
613–
617
629–
631
704–
708
714–
723
752–
753
679.
634
115/
58S
truct
ural
feat
ure
Folia
ted
1
382
694.
845
259/
3814
2/68
61
590–
600
613–
617
629–
631
704–
708
714–
723
752–
753
694.
537
212/
84S
eale
d ne
twor
k1
385
a70
0.0
1528
5/62
–9
359
0–60
061
3–61
762
9–63
170
4–70
871
4–72
375
2–75
3
701.
121
284/
59B
roke
n fra
ctur
eP
yrite
3

170
KFM
05A
DZ
Bor
ehol
e ra
dar
Infe
rred
geo
logi
cal f
eatu
re fr
om b
orem
apC
onfid
ence
le
vel
In d
ata
Inte
rpre
tatio
nC
orre
latio
nId
Bor
ehol
e le
ngth
(m)
Alp
haO
ri1O
ri2R
adiu
s (m
) St
reng
thLo
w ra
dar
ampl
itude
(m)
Bor
ehol
e le
ngth
(m)
Alp
haO
riFe
atur
eC
omm
ent
385
712.
832
123/
71–
31
590–
600
613–
617
629–
631
704–
708
714–
723
752–
753
712.
421
121/
81R
ock
occu
rren
ce10
1061
/102
017
3
313
871
7.1
806
3/80
–18
259
0–60
061
3–61
762
9–63
170
4–70
871
4–72
375
2–75
3
717.
225
030/
82B
roke
n fra
ctur
e3
386
718.
119
338/
37–
41
590–
600
613–
617
629–
631
704–
708
714–
723
752–
753
718.
824
044/
85R
ock
occu
rren
ceV
ein
1010
51/1
0106
11
389
734.
938
288/
3015
5/79
62
590–
600
613–
617
629–
631
704–
708
714–
723
752–
753
735.
239
152/
82R
ock
occu
rren
ce10
1057
/101
061
Ori2
3
390
741.
438
271/
32–
82
590–
600
613–
617
629–
631
704–
708
714–
723
752–
753
741.
738
325/
20B
roke
n fra
ctur
e2

171
KFM
05A
DZ
Bor
ehol
e ra
dar
Infe
rred
geo
logi
cal f
eatu
re fr
om b
orem
apC
onfid
ence
le
vel
In d
ata
Inte
rpre
tatio
nC
orre
latio
nId
Bor
ehol
e le
ngth
(m)
Alp
haO
ri1O
ri2R
adiu
s (m
) St
reng
thLo
w ra
dar
ampl
itude
(m)
Bor
ehol
e le
ngth
(m)
Alp
haO
riFe
atur
eC
omm
ent
391
749.
229
276/
51–
52
590–
600
613–
617
629–
631
704–
708
714–
723
752–
753
748.
028
012/
82R
ock
occu
rren
ce10
1057
/111
058
1
392
750.
239
248/
62–
41
590–
600
613–
617
629–
631
704–
708
714–
723
752–
753
751.
327
035/
84R
ock
type
1010
57/1
0201
71
394
757.
836
268/
55–
31
590–
600
613–
617
629–
631
704–
708
714–
723
752–
753
757.
831
011/
85B
roke
n fra
ctur
e1
397
779.
224
032/
82–
81
590–
600
613–
617
629–
631
704–
708
714–
723
752–
753
778.
938
120/
64R
ock
occu
rren
ceD
yke
1010
57/1
0106
11
411
090
3.2
2808
6/48
–10
390
5–91
290
3.5
4623
0/70
Bro
ken
fract
ure
14
111
909.
334
041/
26–
62
905–
912
909.
328
233/
89U
nbro
ken
fract
.1
511
593
2.9
2200
1/33
005/
757
293
6–95
093
1.5
1605
1/43
Roc
k oc
curr
ence
1010
57/1
0106
12
511
794
6.1
3025
8/65
–12
293
6–95
094
6.1
3223
0/87
Unb
roke
n fra
ct.
Laum
ontit
e2
Ext
118
950.
930
241/
81–
82
–95
2.1
3821
7/85
Sea
led
netw
ork
Cal
cite
, lau
mon
tite
2E
xt12
096
0.8
4707
1/15
–10
2–
961.
936
041/
20U
nbro
ken
fract
Pre
hnite
2E
xt12
797
7.8
2622
0/79
–2
797
8–97
997
8.1
4021
4/83
Bro
ken
fract
ure
3E
xt12
2a98
0.2
3433
1/28
–2
498
1–98
298
0.9
2307
7/45
Bro
ken
fract
ure
1

172
KFM
06A
DZ
Bor
ehol
e ra
dar
Infe
rred
geo
logi
cal f
eatu
re fr
om b
orem
apC
onfid
ence
le
vel
In d
ata
Inte
rpre
tatio
nC
orre
latio
nId
Bor
ehol
e le
ngth
(m)
Alp
haO
ri1O
ri2R
adiu
s (m
) St
reng
thLo
w ra
dar
ampl
itude
(m)
Bor
ehol
e le
ngth
(m)
Alp
haO
riFe
atur
eC
omm
ent
Ext
Dx
112.
248
030/
76–
21
–11
2.5
4203
8/78
Roc
k ty
pe10
2017
/101
057
31
J13
3.6
6334
0/16
158/
536
112
8–13
113
4–13
614
0–14
6
–0
1Lx
142.
642
050/
75–
163
128–
131
134–
136
140–
146
142.
946
024/
73B
roke
n fra
ctur
eA
spha
lt 4
mm
3
1K
145.
630
014/
84–
112
128–
131
134–
136
140–
146
145.
540
024/
80R
ock
occu
rren
ce10
1057
/101
061
2
1L
145.
946
043/
72–
503
128–
131
134–
136
140–
146
145.
741
024/
80R
ock
occu
rren
ce10
1057
/101
061
3
2X
206.
078
033/
15–
242
217–
221
236–
240
241–
244
206.
261
105/
10B
roke
n fra
ctur
e2.
5 m
m2
22
218.
873
045/
1603
2/45
182
217–
221
236–
240
241–
244
218.
170
050/
11B
roke
n fra
ctur
eC
lay
5 m
m3
2Z
225.
921
207/
3821
1/81
142
217–
221
236–
240
241–
244
224.
513
241/
76B
roke
n fra
ctur
eC
lay
Ori2
2
214
226.
025
228/
8505
6/66
212
217–
221
236–
240
241–
244
226.
119
187/
82B
roke
n fra
ctur
e2
25
238.
863
041/
5101
8/10
232
217–
221
236–
240
241–
244
237.
958
134/
05B
roke
n fra
ctur
eP
yrite
1

173
KFM
06A
DZ
Bor
ehol
e ra
dar
Infe
rred
geo
logi
cal f
eatu
re fr
om b
orem
apC
onfid
ence
le
vel
In d
ata
Inte
rpre
tatio
nC
orre
latio
nId
Bor
ehol
e le
ngth
(m)
Alp
haO
ri1O
ri2R
adiu
s (m
) St
reng
thLo
w ra
dar
ampl
itude
(m)
Bor
ehol
e le
ngth
(m)
Alp
haO
riFe
atur
eC
omm
ent
26
243.
755
027/
65–
102
217–
221
236–
240
241–
244
244.
165
020/
54R
ock
occu
rren
ce10
1057
/101
061
3
311
269.
346
217/
09–
182
268.
751
289/
17C
rush
23
11x
269.
475
043/
47–
162
267–
270
269.
262
005/
62R
ock
type
1010
57/1
1105
82
427
335.
633
209/
2603
4/89
122
330–
338
347–
359
334.
249
040/
73U
nbro
ken
fract
.P
yrite
Ori2
3
428
xx35
4.0
2020
9/79
202/
386
133
0–33
834
7–35
935
3.6
2721
0/86
Unb
roke
n fra
ct.
Oxi
dize
d w
alls
3
585
x62
2.6
3820
9/81
–18
262
0–62
562
2.5
3220
7/90
Sea
led
netw
ork
Qua
rtz3
585
624.
037
117/
42–
62
620–
625
624.
652
100/
49R
ock
occu
rren
ce10
1051
/101
061
36
88x
656.
238
047/
88–
51
651–
658
656.
344
053/
80R
ock
occu
rren
ce11
1058
/101
061
37
105
743.
440
168/
25–
183
743–
746
768–
773
744.
353
107/
45R
ock
type
1010
61/1
0201
71
710
5xx
756.
725
249/
80–
14–1
82
743–
746
768–
773
756.
631
210/
89B
roke
n fra
ctur
eLa
umon
tite
2
716
477
1.2
3723
6/17
057/
899
174
3–74
676
8–77
377
0.8
3009
9/42
Cru
sh1
711
1x77
2.3
7002
7/35
080/
4414
274
3–74
676
8–77
377
2.7
6908
6/39
Bro
ken
fract
ure
Ori2
2
711
177
2.4
5701
1/39
–18
374
3–74
676
8–77
377
2.0
6301
2/43
Roc
k oc
curr
ence
1010
58/1
0106
13
913
788
6.1
1627
6/76
294/
4512
288
4–89
088
5.3
2033
1/68
Roc
k oc
curr
ence
1010
58/1
0106
12
913
388
7.2
2924
1/23
241/
813
188
4–89
088
7.1
2424
1/76
Sea
led
netw
ork
Laum
ontit
e H
emat
ite
Ori2
3
1013
692
5.7
2323
9/76
–17
292
6–93
192
5.4
2321
5/78
Unb
roke
n fra
ct.
Chl
orite
Lau
mon
tite
311
144
962.
568
062/
1006
2/66
41
964–
969
962.
677
068/
50R
ock
occu
rren
ce10
1058
/101
061
Ori2
3
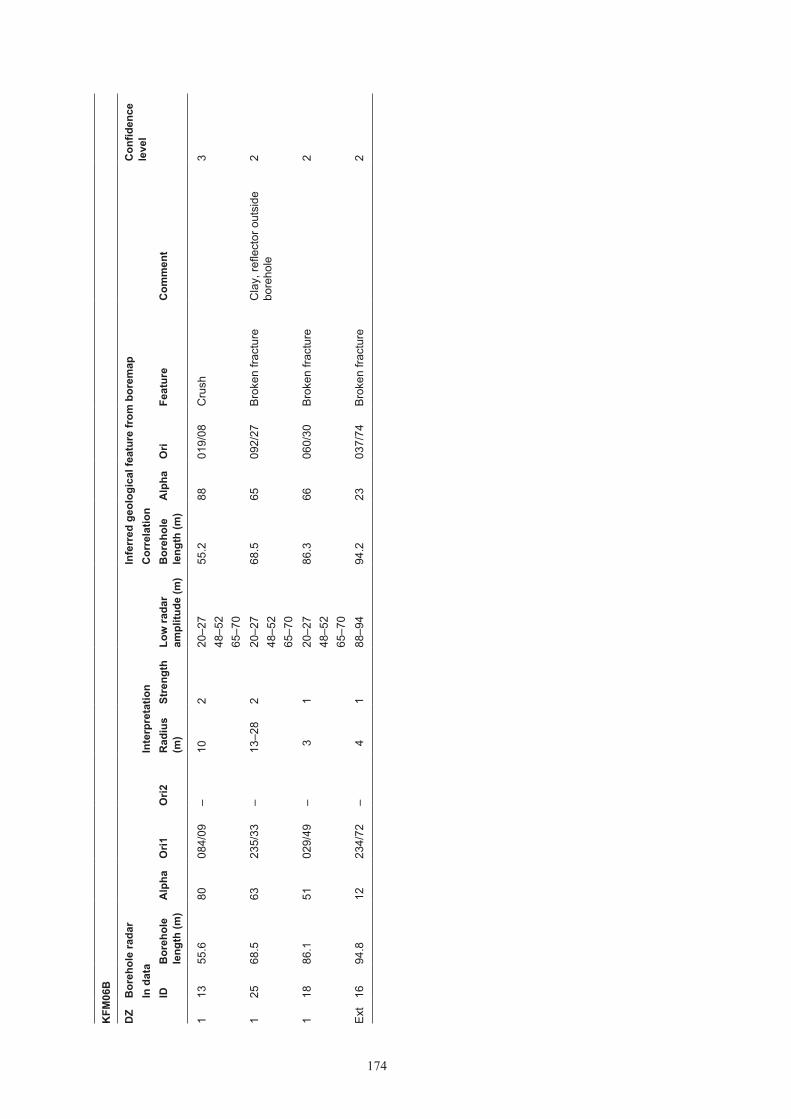
174
KFM
06B
DZ
Bor
ehol
e ra
dar
Infe
rred
geo
logi
cal f
eatu
re fr
om b
orem
apC
onfid
ence
le
vel
In d
ata
Inte
rpre
tatio
nC
orre
latio
nID
Bor
ehol
e le
ngth
(m)
Alp
haO
ri1O
ri2R
adiu
s (m
) St
reng
thLo
w ra
dar
ampl
itude
(m)
Bor
ehol
e le
ngth
(m)
Alp
haO
riFe
atur
eC
omm
ent
113
55.6
8008
4/09
–10
220
–27
48–5
265
–70
55.2
8801
9/08
Cru
sh3
125
68.5
6323
5/33
–13
–28
220
–27
48–5
265
–70
68.5
6509
2/27
Bro
ken
fract
ure
Cla
y, re
flect
or o
utsi
de
bore
hole
2
118
86.1
5102
9/49
–3
120
–27
48–5
265
–70
86.3
6606
0/30
Bro
ken
fract
ure
2
Ext
1694
.812
234/
72–
41
88–9
494
.223
037/
74B
roke
n fra
ctur
e2
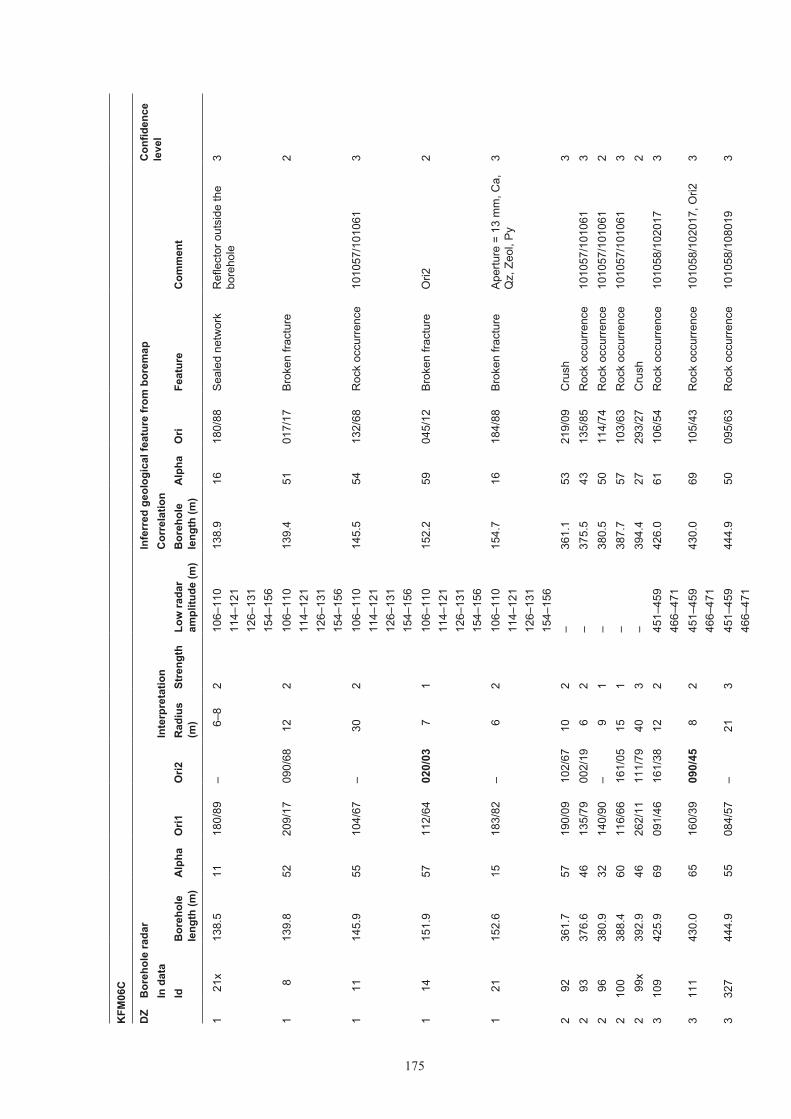
175
KFM
06C
DZ
Bor
ehol
e ra
dar
Infe
rred
geo
logi
cal f
eatu
re fr
om b
orem
apC
onfid
ence
le
vel
In d
ata
Inte
rpre
tatio
nC
orre
latio
nId
Bor
ehol
e le
ngth
(m)
Alp
haO
ri1O
ri2R
adiu
s (m
) St
reng
thLo
w ra
dar
ampl
itude
(m)
Bor
ehol
e le
ngth
(m)
Alp
haO
riFe
atur
eC
omm
ent
121
x13
8.5
1118
0/89
–6–
82
106–
110
114–
121
126–
131
154–
156
138.
916
180/
88S
eale
d ne
twor
kR
efle
ctor
out
side
the
bore
hole
3
18
139.
852
209/
1709
0/68
122
106–
110
114–
121
126–
131
154–
156
139.
451
017/
17B
roke
n fra
ctur
e2
111
145.
955
104/
67–
302
106–
110
114–
121
126–
131
154–
156
145.
554
132/
68R
ock
occu
rren
ce10
1057
/101
061
3
114
151.
957
112/
6402
0/03
71
106–
110
114–
121
126–
131
154–
156
152.
259
045/
12B
roke
n fra
ctur
eO
ri22
121
152.
615
183/
82–
62
106–
110
114–
121
126–
131
154–
156
154.
716
184/
88B
roke
n fra
ctur
eA
pertu
re =
13
mm
, Ca,
Q
z, Z
eol,
Py
3
292
361.
757
190/
0910
2/67
102
–36
1.1
5321
9/09
Cru
sh3
293
376.
646
135/
7900
2/19
62
–37
5.5
4313
5/85
Roc
k oc
curr
ence
1010
57/1
0106
13
296
380.
932
140/
90–
91
–38
0.5
5011
4/74
Roc
k oc
curr
ence
1010
57/1
0106
12
210
038
8.4
6011
6/66
161/
0515
1–
387.
757
103/
63R
ock
occu
rren
ce10
1057
/101
061
32
99x
392.
946
262/
1111
1/79
403
–39
4.4
2729
3/27
Cru
sh2
310
942
5.9
6909
1/46
161/
3812
245
1–45
946
6–47
142
6.0
6110
6/54
Roc
k oc
curr
ence
1010
58/1
0201
73
311
143
0.0
6516
0/39
090/
458
245
1–45
946
6–47
143
0.0
6910
5/43
Roc
k oc
curr
ence
1010
58/1
0201
7, O
ri23
332
744
4.9
5508
4/57
–21
345
1–45
946
6–47
144
4.9
5009
5/63
Roc
k oc
curr
ence
1010
58/1
0801
93

176
KFM
06C
DZ
Bor
ehol
e ra
dar
Infe
rred
geo
logi
cal f
eatu
re fr
om b
orem
apC
onfid
ence
le
vel
In d
ata
Inte
rpre
tatio
nC
orre
latio
nId
Bor
ehol
e le
ngth
(m)
Alp
haO
ri1O
ri2R
adiu
s (m
) St
reng
thLo
w ra
dar
ampl
itude
(m)
Bor
ehol
e le
ngth
(m)
Alp
haO
riFe
atur
eC
omm
ent
331
7x44
9.0
1304
8/89
313/
7525
345
1–45
946
6–47
1R
efle
ctor
out
side
the
bore
hole
–
311
744
9.4
6608
4/45
163/
4316
245
1–45
946
6–47
144
8.9
6109
2/41
Roc
k oc
curr
ence
1010
58/1
0201
73
311
845
3.8
6508
9/48
167/
4110
245
1–45
946
6–47
145
3.8
6810
5/43
Roc
k oc
curr
ence
1010
58/1
0201
73
312
246
0.8
7009
4/32
–24
245
1–45
946
6–47
146
0.7
6910
6/42
Roc
k oc
curr
ence
1010
58/1
0201
73
312
848
0.1
5914
4/64
077/
203
145
1–45
946
6–47
147
8.8
6710
9/48
Roc
k oc
curr
ence
1010
58/1
0106
12
414
150
7.4
2634
0/89
014/
376
153
3–54
050
7.6
2400
3/85
Bro
ken
fract
ure
Cla
y3
414
050
9.8
6415
0/56
085/
2918
253
3–54
050
9.7
5408
0/34
Roc
k oc
curr
ence
1010
58/1
0106
1, O
ri23
414
853
3.8
6617
1/38
097/
5110
253
3–54
053
4.0
5709
9/50
Roc
k oc
curr
ence
1010
58/1
0201
7, O
ri23
431
753
7.3
922
3/88
–30
–36
353
3–54
0R
efle
ctor
out
side
the
bore
hole
, par
t of 3
17x
–
415
254
0.2
5509
0/62
–25
253
3–54
054
0.6
5207
8/31
Roc
k oc
curr
ence
1010
51/1
0106
12
517
663
0.2
5110
6/74
211/
275
1–
630.
148
118/
73R
ock
occu
rren
ce10
1058
/101
061
35
177
633.
956
200/
1311
9/74
152
–63
4.2
4310
6/71
Roc
k oc
curr
ence
1010
58/1
0106
1, O
ri23
533
364
0.1
1035
4/65
–6
1–
638.
58
292/
65S
eale
d ne
twor
k2
520
5x65
3.6
1721
7/79
–24
–40
3–
651.
723
023/
89B
roke
n fra
ctur
eR
efle
ctor
out
side
the
bore
hole
, par
t of 2
052
533
065
5.6
4623
0/06
130/
809
1–
655.
145
137/
85R
ock
occu
rren
ce10
1058
/101
061,
Ori2
35
205
659.
319
210/
81–
243
–65
9.9
1822
4/81
Sea
led
netw
ork
35
183
662.
614
059/
84–
132
–0
518
5x66
2.6
2520
8/67
066/
716
1–
662.
819
290/
78R
ock
occu
rren
ce10
1058
/101
061
25
184
663.
618
203/
8104
8/70
122
–66
3.7
1522
4/86
Bro
ken
fract
ure
35
185
666.
322
052/
69–
202
–66
6.1
3703
3/89
Sea
led
netw
ork
25
185x
xxx
675.
819
222/
6806
6/83
18–3
03
–67
5.5
2622
0/75
Sea
led
netw
ork
Ref
lect
or o
utsi
de th
e bo
reho
le3

177
KFM
06C
DZ
Bor
ehol
e ra
dar
Infe
rred
geo
logi
cal f
eatu
re fr
om b
orem
apC
onfid
ence
le
vel
In d
ata
Inte
rpre
tatio
nC
orre
latio
nId
Bor
ehol
e le
ngth
(m)
Alp
haO
ri1O
ri2R
adiu
s (m
) St
reng
thLo
w ra
dar
ampl
itude
(m)
Bor
ehol
e le
ngth
(m)
Alp
haO
riFe
atur
eC
omm
ent
331
7x44
9.0
1304
8/89
313/
7525
345
1–45
946
6–47
1R
efle
ctor
out
side
the
bore
hole
–
311
744
9.4
6608
4/45
163/
4316
245
1–45
946
6–47
144
8.9
6109
2/41
Roc
k oc
curr
ence
1010
58/1
0201
73
311
845
3.8
6508
9/48
167/
4110
245
1–45
946
6–47
145
3.8
6810
5/43
Roc
k oc
curr
ence
1010
58/1
0201
73
312
246
0.8
7009
4/32
–24
245
1–45
946
6–47
146
0.7
6910
6/42
Roc
k oc
curr
ence
1010
58/1
0201
73
312
848
0.1
5914
4/64
077/
203
145
1–45
946
6–47
147
8.8
6710
9/48
Roc
k oc
curr
ence
1010
58/1
0106
12
414
150
7.4
2634
0/89
014/
376
153
3–54
050
7.6
2400
3/85
Bro
ken
fract
ure
Cla
y3
414
050
9.8
6415
0/56
085/
2918
253
3–54
050
9.7
5408
0/34
Roc
k oc
curr
ence
1010
58/1
0106
1, O
ri23
414
853
3.8
6617
1/38
097/
5110
253
3–54
053
4.0
5709
9/50
Roc
k oc
curr
ence
1010
58/1
0201
7, O
ri23
431
753
7.3
922
3/88
–30
–36
353
3–54
0R
efle
ctor
out
side
the
bore
hole
, par
t of 3
17x
–
415
254
0.2
5509
0/62
–25
253
3–54
054
0.6
5207
8/31
Roc
k oc
curr
ence
1010
51/1
0106
12
517
663
0.2
5110
6/74
211/
275
1–
630.
148
118/
73R
ock
occu
rren
ce10
1058
/101
061
35
177
633.
956
200/
1311
9/74
152
–63
4.2
4310
6/71
Roc
k oc
curr
ence
1010
58/1
0106
1, O
ri23
533
364
0.1
1035
4/65
–6
1–
638.
58
292/
65S
eale
d ne
twor
k2
520
5x65
3.6
1721
7/79
–24
–40
3–
651.
723
023/
89B
roke
n fra
ctur
eR
efle
ctor
out
side
the
bore
hole
, par
t of 2
052
533
065
5.6
4623
0/06
130/
809
1–
655.
145
137/
85R
ock
occu
rren
ce10
1058
/101
061,
Ori2
35
205
659.
319
210/
81–
243
–65
9.9
1822
4/81
Sea
led
netw
ork
35
183
662.
614
059/
84–
132
–0
518
5x66
2.6
2520
8/67
066/
716
1–
662.
819
290/
78R
ock
occu
rren
ce10
1058
/101
061
25
184
663.
618
203/
8104
8/70
122
–66
3.7
1522
4/86
Bro
ken
fract
ure
35
185
666.
322
052/
69–
202
–66
6.1
3703
3/89
Sea
led
netw
ork
25
185x
xxx
675.
819
222/
6806
6/83
18–3
03
–67
5.5
2622
0/75
Sea
led
netw
ork
Ref
lect
or o
utsi
de th
e bo
reho
le3
KFM
07A
DZ
Bor
ehol
e ra
dar
Infe
rred
geo
logi
cal f
eatu
re fr
om b
orem
apC
onfid
ence
le
vel
In d
ata
Inte
rpre
tatio
nC
orre
latio
nId
Bor
ehol
e le
ngth
(m)
Alp
haO
ri1O
ri2R
adiu
s (m
) St
reng
thLo
w ra
dar
ampl
itude
(m)
Bor
ehol
e le
ngth
(m)
Alp
haO
riFe
atur
eC
omm
ent
15
108.
015
133/
82–
92
111–
113
118–
121
150–
170
108.
17
253/
78B
roke
n fra
ctur
e2
12
111.
671
326/
1800
1/45
31
111–
113
118–
121
150–
170
111.
576
017/
33B
roke
n fra
ctur
e1.
5 m
m O
ri23
13x
120.
965
343/
55–
31
111–
113
118–
121
150–
170
120.
752
127/
11B
roke
n fra
ctur
e1.
5 m
m2
14
133.
455
250/
1000
2/63
183
111–
113
118–
121
150–
170
133.
752
097/
18C
rush
2
18
134.
214
161/
73–
123
111–
113
118–
121
150–
170
136.
77
127/
75R
ock
occu
rren
ce10
1057
/102
017
3
18x
159.
337
342/
82–
61
111–
113
118–
121
150–
170
159.
737
200/
24B
roke
n fra
ctur
e1
118
169.
618
148/
80–
132
111–
113
118–
121
150–
170
168.
723
170/
82B
roke
n fra
ctur
e3
110
178.
468
303/
15–
213
111–
113
118–
121
150–
170
178.
454
256/
17C
rush
3
215
203.
030
343/
87–
51
195–
205
203.
844
230/
21U
nbro
ken
fract
13
5341
9.9
3017
5/89
–3
141
8–42
242
0.6
2719
0/84
Roc
k oc
curr
ence
1010
57/1
0106
13
415
782
7.1
2920
8/85
–9
182
3–82
783
5–84
085
4–86
187
4–87
988
0–88
689
6–89
992
1–92
493
3–93
796
0–97
2
827.
231
175/
86B
roke
n fra
ctur
e3

178
KFM
07B
DZ
Bor
ehol
e ra
dar
Infe
rred
geo
logi
cal f
eatu
re fr
om b
orem
apC
onfid
ence
le
vel
In d
ata
Inte
rpre
tatio
nC
orre
latio
nId
Bor
ehol
e le
ngth
(m)
Alp
haO
ri1O
ri2R
adiu
s (m
) St
reng
thLo
w ra
dar
ampl
itude
(m)
Bor
ehol
e le
ngth
(m)
Alp
haO
riFe
atur
eC
omm
ent
11
52.9
3129
5/61
153/
7170
3N
/A50
.740
167/
63R
ock
occu
rren
ce10
1057
/102
017,
Ori2
32
1096
.174
221/
5420
9/19
203
95–1
0296
.076
225/
24R
ock
occu
rren
ce10
1057
/102
017,
Ori2
33
1412
0.1
3319
5/90
–20
211
8–12
313
2–13
612
2.2
2717
0/81
Roc
k oc
curr
ence
1010
57/1
0205
82
322
127.
130
145/
64–
61
118–
123
132–
136
127.
428
150/
64R
ock
occu
rren
ce10
1057
/102
017
3
442
231.
724
153/
79–
483
232–
240
232.
315
147/
80R
ock
occu
rren
ce10
1057
/101
061
3
KFM
07C
DZ
Bor
ehol
e ra
dar
Infe
rred
geo
logi
cal f
eatu
re fr
om b
orem
apC
onfid
ence
le
vel
In d
ata
Inte
rpre
tatio
nC
orre
latio
nId
Bor
ehol
e le
ngth
(m)
Alp
haO
ri1O
ri2R
adiu
s (m
) St
reng
thLo
w ra
dar
ampl
itude
(m)
Bor
ehol
e le
ngth
(m)
Alp
haO
riFe
atur
eC
omm
ent
12x
94.0
2216
0/68
–36
3–
–N
o bo
rem
ap d
ata
N/A
110
98.0
3815
1/49
320/
5025
3–
–N
o bo
rem
ap d
ata
N/A
14
102.
622
151/
68–
52
–10
2.6
2314
0/65
Roc
k oc
curr
ence
1020
17/1
0106
13
248
332.
421
264/
7308
6/62
31
365–
372
333.
212
214/
83U
nbro
ken
Hem
atite
, oxi
dize
d w
alls
12
6134
0.6
1313
0/76
–16
236
5–37
234
3.2
1215
7/78
Roc
k oc
curr
ence
1010
61/1
0105
72
266
388.
527
276/
7010
2/58
121
365–
372
388.
715
240/
81B
roke
n fra
ctur
e–
2

179
KFM
08A
DZ
Bor
ehol
e ra
dar
Infe
rred
geo
logi
cal f
eatu
re fr
om b
orem
apC
onfid
ence
le
vel
In d
ata
Inte
rpre
tatio
nC
orre
latio
nId
Bor
ehol
e le
ngth
(m)
Alp
haO
ri1O
ri2R
adiu
s (m
) St
reng
thLo
w ra
dar
ampl
itude
(m)
Bor
ehol
e le
ngth
(m)
Alp
haO
riFe
atur
eC
omm
ent
125
190.
158
076/
62–
142
256–
260
272–
276
308–
311
339–
344
189.
957
086/
55R
ock
occu
rren
ce10
1057
/101
061
3
130
198.
358
319/
05–
252
256–
260
272–
276
308–
311
339–
344
197.
844
204/
14B
roke
n fra
ctur
e2
131
202.
360
050/
67–
202
256–
260
272–
276
308–
311
339–
344
203.
460
089/
50R
ock
occu
rren
ce10
1058
/101
061
2
123
521
7.9
1233
2/76
– 8
–14
325
6–26
027
2–27
630
8–31
133
9–34
4
216.
815
323/
73S
truct
ural
feat
.Fo
liatio
n, ra
dar r
efle
ctor
out
side
th
e bo
reho
le, d
o no
t rea
ch b
ore-
hole
in ra
darg
ram
3
137
224.
445
055/
7722
5/10
61
256–
260
272–
276
308–
311
339–
344
224.
657
079/
59R
ock
occu
rren
ce10
1057
/101
061
2
138
229.
634
014/
78–
303
256–
260
272–
276
308–
311
339–
344
229.
844
070/
78B
roke
n fra
ctur
e1
123
424
3.2
4206
4/81
–15
125
6–26
027
2–27
630
8–31
133
9–34
4
242.
544
032/
79B
roke
n fra
ctur
e2

180
KFM
08A
DZ
Bor
ehol
e ra
dar
Infe
rred
geo
logi
cal f
eatu
re fr
om b
orem
apC
onfid
ence
le
vel
In d
ata
Inte
rpre
tatio
nC
orre
latio
nId
Bor
ehol
e le
ngth
(m)
Alp
haO
ri1O
ri2R
adiu
s (m
) St
reng
thLo
w ra
dar
ampl
itude
(m)
Bor
ehol
e le
ngth
(m)
Alp
haO
riFe
atur
eC
omm
ent
143
247.
733
172/
36–
102
256–
260
272–
276
308–
311
339–
344
248.
429
340/
68R
ock
type
1010
57/1
0106
11
153
307.
056
122/
43–
122
256–
260
272–
276
308–
311
339–
344
307.
543
142/
34B
roke
n fra
ctur
eO
xidi
zed
2
155
312.
531
008/
80–
31
256–
260
272–
276
308–
311
339–
344
311.
835
355/
70R
ock
type
1010
57/1
0106
13
157
x31
8.6
5100
2/51
–4
125
6–26
027
2–27
630
8–31
133
9–34
4
318.
440
009/
74R
ock
occu
rren
ce10
1057
/101
061
2
123
632
1.7
5112
4/42
015/
596
125
6–26
027
2–27
630
8–31
133
9–34
4
321.
274
073/
45R
ock
occu
rren
ce10
1057
/101
061
1
160
x33
2.9
4734
1/39
–15
–20
325
6–26
027
2–27
630
8–31
133
9–34
4
332.
940
003/
69R
ock
occu
rren
ce10
1057
/101
061
2
160
341.
633
354/
68–
153
256–
260
272–
276
308–
311
339–
344
342.
028
004/
85B
roke
n fra
ctur
e3

181
KFM
08A
DZ
Bor
ehol
e ra
dar
Infe
rred
geo
logi
cal f
eatu
re fr
om b
orem
apC
onfid
ence
le
vel
In d
ata
Inte
rpre
tatio
nC
orre
latio
nId
Bor
ehol
e le
ngth
(m)
Alp
haO
ri1O
ri2R
adiu
s (m
) St
reng
thLo
w ra
dar
ampl
itude
(m)
Bor
ehol
e le
ngth
(m)
Alp
haO
riFe
atur
eC
omm
ent
296
495.
664
107/
3903
2/52
303
476–
483
490–
497
496.
278
070/
48R
ock
occu
rren
ce10
1057
/101
061
Ori2
2
310
453
0.2
5811
1/50
–14
254
2–54
555
2–55
753
0.0
6305
1/67
Roc
k oc
curr
ence
1010
57/1
0106
1, p
roba
bly
a po
int
refle
ctor
1
324
053
5.1
5110
2/65
–16
–24
254
2–54
555
2–55
753
5.6
4707
8/80
Roc
k oc
curr
ence
1010
57/1
0106
11
310
754
4.1
6909
8/42
–7
154
2–54
555
2–55
754
4.4
7303
4/44
Roc
k oc
curr
ence
1010
57/1
0106
12
414
067
5.4
6907
2/20
–12
268
6–69
067
3.3
6309
5/21
Sea
led
netw
ork
Adu
laria
24
143
686.
147
001/
30–
82
686–
690
686.
849
354/
08R
ock
occu
rren
ce10
1057
/802
1 Q
uartz
35
243
807.
315
149/
84–
91
800–
803
820–
823
807.
013
184/
85U
nbro
ken
fract
.2
524
481
0.4
5112
7/50
–9
180
0–80
382
0–82
381
0.5
5510
3/69
Roc
k ty
pe10
1058
/102
017
2
516
981
2.5
6905
9/29
086/
6710
280
0–80
382
0–82
381
2.5
7907
0/57
Roc
k oc
curr
ence
1010
58/1
0106
1 O
ri23
KFM
08B
DZ
Bor
ehol
e ra
dar
Infe
rred
geo
logi
cal f
eatu
re fr
om b
orem
apC
onfid
ence
le
vel
In d
ata
Inte
rpre
tatio
nC
orre
latio
nId
Bor
ehol
e le
ngth
(m)
Alp
haO
ri1O
ri2R
adiu
s (m
) St
reng
thLo
w ra
dar
ampl
itude
(m)
Bor
ehol
e le
ngth
(m)
Alp
haO
riFe
atur
eC
omm
ent
NO
DIR
EC
TIO
NA
L R
AD
AR
RE
FLE
CTO
RS

182
KFM
08C
DZ
Bor
ehol
e ra
dar
Infe
rred
geo
logi
cal f
eatu
re fr
om b
orem
apC
onfid
ence
le
vel
In d
ata
Inte
rpre
tatio
nC
orre
latio
nId
Bor
ehol
e le
ngth
(m)
Alp
haO
ri1O
ri2R
adiu
s (m
) St
reng
thLo
w ra
dar
ampl
itude
(m)
Bor
ehol
e le
ngth
(m)
Alp
haO
riFe
atur
eC
omm
ent
138
173.
950
279/
08–
31
185–
188
174.
253
111/
67R
ock
occu
rren
ce10
1058
/101
057
11
237
174.
323
178/
86–
202
185–
188
174.
410
248/
85B
roke
n fra
ctur
e1
133
178.
49
027/
73–
92
185–
188
178.
513
297/
72B
roke
n fra
ctur
e1
293
439.
931
212/
5507
2/71
102
453–
465
496–
500
518–
535
440.
337
060/
53R
ock
occu
rren
ce10
1061
/101
057,
Ori2
2
297
456.
636
074/
69–
122
453–
465
496–
500
518–
535
––
–0
210
045
7.6
5021
1/22
107/
669
245
3–46
549
6–50
051
8–53
5
––
–0
210
146
8.1
3308
4/77
–30
345
3–46
549
6–50
051
8–53
5
468.
447
080/
55R
ock
occu
rren
ce80
21/1
0105
72
210
950
9.0
3704
2/44
–24
245
3–46
549
6–50
051
8–53
5
509.
128
052/
60R
ock
occu
rren
ce10
1061
/101
057
3
222
352
0.5
4221
3/45
–6
145
3–46
549
6–50
051
8–53
5
521.
045
215/
39B
roke
n fra
ctur
e3
313
868
3.2
3019
6/71
–12
269
2–69
668
3.6
2904
6/54
Roc
k oc
curr
ence
1020
17/1
0105
71
314
369
8.0
1632
0/71
–20
369
2–69
669
8.3
1730
0/71
Unb
roke
n fra
ctur
e3
314
570
1.5
3602
5/34
164/
8214
269
2–69
670
1.1
4006
1/50
Roc
k oc
curr
ence
1010
61/1
0105
72
417
782
9.7
4617
9/61
–12
282
7–83
282
9.7
3219
5/72
Unb
roke
n fra
ctur
e2

183
KFM
09A
DZ
Bor
ehol
e ra
dar
Infe
rred
geo
logi
cal f
eatu
re fr
om b
orem
apC
onfid
ence
le
vel
In d
ata
Inte
rpre
tatio
nC
orre
latio
nId
Bor
ehol
e le
ngth
(m)
Alp
haO
ri1O
ri2R
adiu
s (m
) St
reng
thLo
w ra
dar
ampl
itude
(m)
Bor
ehol
e le
ngth
(m)
Alp
haO
riFe
atur
eC
omm
ent
12
18.8
5519
2/11
–20
216
–21
30–3
219
.451
149/
09B
roke
n fra
ctur
e2
239
83.0
2618
0/44
336/
8920
292
–106
82.7
2334
0/88
Roc
k ty
pe10
1058
/802
1, O
ri23
222
97.5
4831
8/70
–20
292
–106
97.4
3534
1/75
Roc
k oc
curr
ence
1010
57/1
0106
13
224
110.
717
206/
67–
203
92–1
0611
0.8
1915
4/85
Roc
k oc
curr
ence
1010
57/1
0106
12
370
246.
88
154/
71–
62
226–
237
247.
511
163/
76S
truct
ural
feat
ure
Brit
tle d
uctil
e sh
ear z
.3
390
265.
840
139/
16–
152
226–
237
264.
835
075/
25R
ock
occu
rren
ce10
1057
/101
061
23
9127
3.9
3021
9/57
–30
322
6–23
727
3.9
2910
9/85
Roc
k ty
pe10
1057
/101
061
13
8427
7.8
3219
5/44
–24
222
6–23
727
7.8
3634
5/77
Bro
ken
fract
ure
14
246x
730.
051
360/
07–
203
731–
754
731.
145
146/
88R
ock
occu
rren
ce10
1057
/102
017
15
253
783.
948
313/
8404
4/14
61
782–
785
783.
850
330/
89B
roke
n fra
ctur
e3

184
KFM
09B
DZ
Bor
ehol
e ra
dar
Infe
rred
geo
logi
cal f
eatu
re fr
om b
orem
apC
onfid
ence
le
vel
In d
ata
Inte
rpre
tatio
nC
orre
latio
nId
Bor
ehol
e le
ngth
(m)
Alp
haO
ri1O
ri2R
adiu
s (m
) St
reng
thLo
w ra
dar
ampl
itude
(m)
Bor
ehol
e le
ngth
(m)
Alp
haO
riFe
atur
eC
omm
ent
13
28.2
5623
5/70
–4
113
–21
26–5
010
6–11
011
9–12
2
28.8
5823
3/67
Roc
k oc
curr
ence
1010
57/1
0106
13
15
40.4
4023
0/86
–4
113
–21
26–5
010
6–11
011
9–12
2
40.5
4325
6/77
Sea
led
netw
ork
3
19
49.6
4609
5/11
234/
7914
213
–21
26–5
010
6–11
011
9–12
2
49.9
4108
5/16
Bro
ken
fract
ure
Ape
rture
= 5
mm
, cla
y, a
spha
lt3
111
76.5
1713
9/71
299/
8210
213
–21
26–5
010
6–11
011
9–12
2
76.4
1412
9/65
Roc
k ty
pe10
1061
/101
061
folia
ted
3
120
81.6
2500
9/88
–12
213
–21
26–5
010
6–11
011
9–12
2
80.7
2604
6/81
Bro
ken
fract
ure
2
117
101.
752
124/
0823
3/74
152
13–2
126
–50
106–
110
119–
122
101.
742
212/
81B
roke
n fra
ctur
eO
ri22
116
105.
520
131/
62–
243
13–2
126
–50
106–
110
119–
122
105.
818
167/
87R
ock
occu
rren
ce10
1057
/101
061
2

185
KFM
09B
DZ
Bor
ehol
e ra
dar
Infe
rred
geo
logi
cal f
eatu
re fr
om b
orem
apC
onfid
ence
le
vel
In d
ata
Inte
rpre
tatio
nC
orre
latio
nId
Bor
ehol
e le
ngth
(m)
Alp
haO
ri1O
ri2R
adiu
s (m
) St
reng
thLo
w ra
dar
ampl
itude
(m)
Bor
ehol
e le
ngth
(m)
Alp
haO
riFe
atur
eC
omm
ent
118
123.
724
148/
69–
102
13–2
126
–50
106–
110
119–
122
123.
422
168/
83A
ltera
tion
2
261
311.
738
094/
16–
303
–31
1.4
3909
4/17
Bro
ken
fract
ure
Laum
, hem
atite
32
63x
327.
929
029/
2304
6/81
253
–32
7.6
3205
9/84
Bro
ken
fract
ure
Ori2
32
6433
5.0
3007
4/85
–15
1–
335.
037
250/
89B
roke
n fra
ctur
e3
257
x33
6.4
913
0/77
299/
899–
132
–33
6.5
814
7/85
Roc
k oc
curr
ence
1010
57/1
0106
1, o
utsi
de b
oreh
ole
33
8240
7.8
2715
4/65
–7
1–
407.
722
359/
88S
truct
ural
feat
ure
13
122
411.
841
276/
7315
5/46
61
–41
2.2
3727
8/78
Alte
ratio
nA
lbiti
zatio
n3
410
252
2.7
2614
5/61
–18
352
2–52
952
2.4
3117
7/76
Roc
k oc
curr
ence
1010
57/1
056
24
139
538.
311
122/
58–
10–1
42
522–
529
537.
37
096/
61R
ock
type
1010
57/1
0106
1O
utsi
de b
oreh
ole
3
510
956
9.2
6319
6/60
262/
374
156
6–57
357
0.5
6423
1/20
Roc
k ty
pe10
1057
/101
061,
Ori2
3

186
KFM
10A
DZ
Bor
ehol
e ra
dar
Infe
rred
geo
logi
cal f
eatu
re fr
om b
orem
apC
onfid
ence
le
vel
In d
ata
Inte
rpre
tatio
nC
orre
latio
nId
Bor
ehol
e le
ngth
(m)
Alp
haO
ri1O
ri2R
adiu
s (m
) St
reng
thLo
w ra
dar
ampl
itude
(m)
Bor
ehol
e le
ngth
(m)
Alp
haO
riFe
atur
eC
omm
ent
11
78.3
4603
0/48
133/
639
284
–125
131–
136
78.4
4014
2/77
Roc
k oc
curr
ence
1020
17/1
0105
7, O
ri23
16
86.8
5203
4/50
–12
284
–125
131–
136
86.6
4306
4/79
Bro
ken
fract
ure
2
19
106.
185
085/
4109
2/44
31
84–1
25
131–
136
106.
067
096/
64B
roke
n fra
ctur
eA
spha
lt, O
ri22
116
133.
349
033/
51–
122
84–1
25
131–
136
133.
032
142/
89R
ock
occu
rren
ce10
2017
/101
057
1
119
143.
945
028/
51–
152
84–1
25
131–
136
144.
269
092/
63C
rush
1
296
435.
435
337/
0928
7/74
403
428–
433
431.
842
048/
13B
roke
n fra
ctur
eA
pertu
re =
5 m
m1
310
148
0.7
3534
5/11
290/
7415
248
3–48
848
0.6
5209
9/17
Bro
ken
fract
ure
1

187
App
endi
x 2
Cor
rela
tion
betw
een
rada
r ref
lect
ors
and
occu
rren
ces
of v
uggy
rock
Vugg
y ro
ckB
orem
apB
oreh
ole
rada
r
Vugg
y ro
ck s
ectio
nIn
dat
aIn
terp
reta
tion
Bor
ehol
eFr
omTo
Alp
haO
riLo
w ra
dar
ampl
itude
Ref
lect
or
IDB
oreh
ole
leng
thA
lpha
Ori1
Ori2
Stre
ngth
Rad
ius
(m)
Com
men
tC
onfi-
denc
e
KFM
02A
171.
4062
102/
2816
5–18
5–
017
2.04
4210
2/28
165–
185
–0
KFM
02A
174.
334
306/
2316
5–18
510
a17
3.9
7604
3/18
251/
112
15S
traig
ht re
flect
or, p
roba
bly
indi
cate
s a
natu
ral f
ract
ure
with
hem
atite
at 1
73.8
m
with
alp
ha 7
2 an
d or
ient
atio
n 01
2/23
0
175.
2765
306/
2316
5–18
5–
0K
FM02
A17
6.90
6332
5/30
165–
185
10b
176.
351
038/
44–
220
Stra
ight
refle
ctor
. Pro
babl
y in
dica
tes
rock
oc
curr
ence
(peg
mat
ite) a
t 176
.1 m
with
al
pha
64 a
nd o
rient
atio
n 03
8/30
or r
ock
occu
rren
ce (f
ine-
grai
ned
gran
ite) a
t 176
.5 m
w
ith a
lpha
64
and
the
orie
ntat
ion
028/
31
1
177.
0058
325/
3016
5–18
5–
0K
FM02
A17
9.42
2603
2/69
165–
185
–0
180.
0575
032/
6916
5–18
5–
0K
FM02
A24
7.86
4807
4/46
240–
320
17a
240.
350
036/
45–
324
Stra
ight
refle
ctor
whi
ch b
ends
clo
se to
the
bore
hole
and
pro
babl
y in
ters
ects
dee
per
2
296.
5321
137/
6724
0–32
016
280.
216
090/
7411
8/73
220
Ref
lect
or p
aral
lel t
o bo
reho
le a
long
18
0–24
0 m
bor
ehol
e le
ngth
2
KFM
02A
298.
8967
066/
2724
0–32
0–
029
9.05
240–
320
–0
KFM
02A
299.
2429
9.51
4907
9/44
240–
320
–0
KFM
02A
301.
6030
1.71
6604
2/28
240–
320
1930
0.9
70–
16
1

188
Vugg
y ro
ckB
orem
apB
oreh
ole
rada
r
Vugg
y ro
ck s
ectio
nIn
dat
aIn
terp
reta
tion
Bor
ehol
eFr
omTo
Alp
haO
riLo
w ra
dar
ampl
itude
Ref
lect
or
IDB
oreh
ole
leng
thA
lpha
Ori1
Ori2
Stre
ngth
Rad
ius
(m)
Com
men
tC
onfi-
denc
e
KFM
06A
332.
4963
037/
5933
0–34
025
332.
856
––
13
233
2.75
6409
2/22
330–
340
–0
KFM
06B
66.5
627
019/
6965
–72
–0
70.1
662
199/
2265
–72
2568
.563
235/
33–
330
Cur
ved
refle
ctor
2
KFM
06C
451.
4650
171/
7045
0–46
011
744
9.4
6608
4/45
163/
433
20S
traig
ht re
flect
or, p
roba
bly
indi
cate
s am
phib
olite
at 4
48.9
m w
ith a
lpha
60
and
orie
ntat
ion
097/
48
0
452.
2328
351/
8645
0–46
011
845
3.8
6508
9/48
167/
413
12S
traig
ht re
flect
or, p
roba
bly
indi
cate
s am
phib
olite
at 4
53.8
m w
ith a
lpha
68
and
orie
ntat
ion
105/
43
0
KFM
08A
409.
8554
095/
5940
9–41
474 74
x74
xx
410.
1(4
15.8
)(4
32.8
)
4312
3/58
358/
583
12R
efle
ctor
s 74
x an
d 74
xx p
roba
bly
part
of 7
4,
they
are
obs
erve
d ou
tsid
e th
e bo
reho
le3
412.
0439
013/
7740
9–41
475
413.
248
––
26
Ref
lect
or p
roba
bly
indi
cate
s a
brok
en
fract
ure
with
cla
y at
413
.0 m
, 49
degr
.0
KFM
08C
454.
9645
8.29
3504
1/43
453–
466
97 100
456.
645
7.6
36 5007
4/69
211/
22– 10
7/66
2 110 9
1 0K
FM08
C46
2.09
462.
5050
029/
1545
3–46
6–
0K
FM08
C49
7.84
499.
041
195/
6149
5–50
110
810
749
7.9
499.
261 41
– –1 1
3 100 1
KFM
08C
511.
6251
1.64
3321
1/60
495–
501
111
511.
749
–1
31
KFM
08C
512.
8951
2.93
2816
6/83
495–
501
–0
KFM
08C
519.
1551
9.98
4007
5/56
516–
535
112
520.
444
–1
21
KFM
08C
520.
4352
0.79
2004
4/65
516–
535
223
520.
542
213/
451
40

189
Vugg
y ro
ckB
orem
apB
oreh
ole
rada
r
Vugg
y ro
ck s
ectio
nIn
dat
aIn
terp
reta
tion
Bor
ehol
eFr
omTo
Alp
haO
riLo
w ra
dar
ampl
itude
Ref
lect
or
IDB
oreh
ole
leng
thA
lpha
Ori1
Ori2
Stre
ngth
Rad
ius
(m)
Com
men
tC
onfi-
denc
e
KFM
08C
523.
1252
5.77
3924
6/28
516–
535
–0
KFM
08C
526.
2452
6.44
2603
1/48
516–
535
–0
KFM
08C
531.
553
1.8
5817
6/53
516–
535
–0
KFM
09A
511.
7531
.830
6/82
510–
520
259
511.
036
––
312
352
0.03
37.6
135/
8851
0–52
019
451
8.8
40–
–2
12R
efle
ctor
dis
loca
ted
at 1
2 m
351
0–52
019
251
7.0
38–
–3
60S
trong
and
per
sist
ent r
efle
ctor
3
KFM
09B
382.
3141
224/
89–
7738
3.8
38–
–2
6R
efle
ctor
mig
ht a
s w
ell i
ndic
ate
brok
en
fract
ure
with
hem
atite
at 3
83.9
m w
ith a
lpha
35
and
orie
ntat
ion
191/
86
1
382.
3241
222/
90–
KFM
09B
568.
9238
280/
8456
6–57
310
956
9.2
6319
6/60
262/
371
3R
efle
ctor
mig
ht in
dica
te ro
ck ty
pe
(peg
mat
ite) a
t 570
.49
m w
ith a
lpha
64
and
orie
ntat
ion
231/
21
0
573.
4547
210/
8256
6–57
311
057
2.1
72–
–1
3R
efle
ctor
mig
ht in
dica
te ro
ck o
ccur
renc
e (p
egm
atite
) at 5
73.0
m w
ith a
lpha
70
and
orie
ntat
ion
258/
31
0
KFM
10A
86.9
388
.79
4813
5/72
82–1
246
86.8
5203
4/50
210
1K
FM10
A89
.32
89.9
147
030/
3882
–124
–0
KFM
10A
92.6
094
.25
3913
7/82
82–1
247
92.4
78–
13
0K
FM10
A96
.69
97.4
563
122/
6382
–124
898
.146
–1
21
KFM
10A
98.7
710
1.09
6212
2/64
82–1
24–
0K
FM10
A10
4.02
104.
7157
127/
6782
–124
–0
KFM
10A
104.
9610
5.48
6212
1/64
82–1
2410
105.
054
12
1K
FM10
A11
1.48
118.
5661
126/
6382
–124
12 1311
3.3
116.
666 62
– –1 1
2 21 1
KFM
10A
483.
5548
7.78
7911
7/66
483–
488
112
485.
561
–1
61


![Geology · Geology Forthescientificjournal,seeGeology(journal). Geology(fromtheAncientGreekγῆ,gē,i.e.“earth”and-λoγία,-logia,i.e.“studyof,discourse”[1][2](https://img.pdfslide.tips/doc/110x75/5f512a8dc36d4d05a271efd1/geology-geology-forthescientiicjournalseegeologyjournal-geologyfromtheancientgreekgieaoeearthaand-o-logiaieaoestudyofdiscoursea12.jpg)