Embed Size (px)
Citation preview

Global rangelands and their role in food security
Temuulen “Teki” SankeyNorthern Arizona University
Flagstaff, AZ

Background
• I am a plant ecologist/dendrochronologist/RS
• I study rangeland use/land cover changes:– Intermountain USA: grassland-forest ecotones,
aspen and pinyon-juniper woodlands– Great Basin: sagebrush shrublands– Sonoran Desert: desert invasive forbs– Central Asia: grassland steppe

Cropland
Grassland
Shrubland
Woodland
Rangeland dynamics
Time
Years Decades

Western US Rangelands• Climate change and land
management-induced changes– Fire – Woody encroachment

Western US Rangelands• Wildfires are increasing in frequency and extent

Idaho Rangelands• Cheatgrass invasion– Fire cycle feedback– Sagebrush recovery

Post-fire recovery in sagebrush• 16 fires since 1937• SPOT image
Sankey et al. 2008. Post-fire recovery of sagebrush communities: Assessment using SPOT5 and Very Large Scale Aerial Imagery. Rangeland Ecology and Management 61: 598-604

Post-fire recovery in sagebrush
Mountain big sagebrushMean cover = 38%
Time = 27 years
Sankey et al. 2008. Post-fire recovery of sagebrush communities: Assessment using SPOT5 and Very Large Scale Aerial Imagery. Rangeland Ecology and Management 61: 598-604

Sagebrush characterization - Lidar
• Classify sagebrush communities
• Shrub height
Sankey, T. and P. Bond. 2010. Lidar-based classification of sagebrush community types. Rangeland Ecology and Management 64: 92-98

Sagebrush Height - Lidar
Field-based maximum shrub height (cm)
0 50 100 150 200 250 300
LiD
AR
-der
ived
max
imu
m s
hru
b h
eigh
t (c
m)
0
50
100
150
200
250
300
y= -24.52 +0.94XAdj. R2 = 0.77SB = 9%NU = 3%LC = 84%
Sankey, T. and P. Bond. 2010. Lidar-based classification of sagebrush community types. Rangeland Ecology and Management 64: 92-98

Sagebrush Height - Lidar
Vegetation classes
Herb ARAR ARTR PUTR Other
Veg
etat
ion
heig
ht (
cm)
0
100
200
300
400
500
600
Lidar measurementField measurement
a b
c
d
a
Sankey, T. and P. Bond. 2010. Lidar-based classification of sagebrush community types. Rangeland Ecology and Management 64: 92-98

Sagebrush Height - Lidar

Western Rangelands: Juniper encroachment• Juniper cover increase: 30-600%• Encroachment leads to:– Understory vegetation loss– Soil erosion– Habitat loss– Fire hazard
• Control treatment– Prescribed fire– Cutting– Shredding

Juniper encroachment• Quantify encroachment rates and patterns• Identify priority areas for control treatment

Juniper encroachment
Sankey et al. 2010. Characterizing western juniper expansion via a fusion of Landsat 5 Thematic Mapper and lidar data. Rangeland Ecology and Management 63: 514-523
-
A
C
B
0 100 M
Legend
Juniper absenceJuniper presence
! Juniper trees
Landsat
Fusion
Lidar
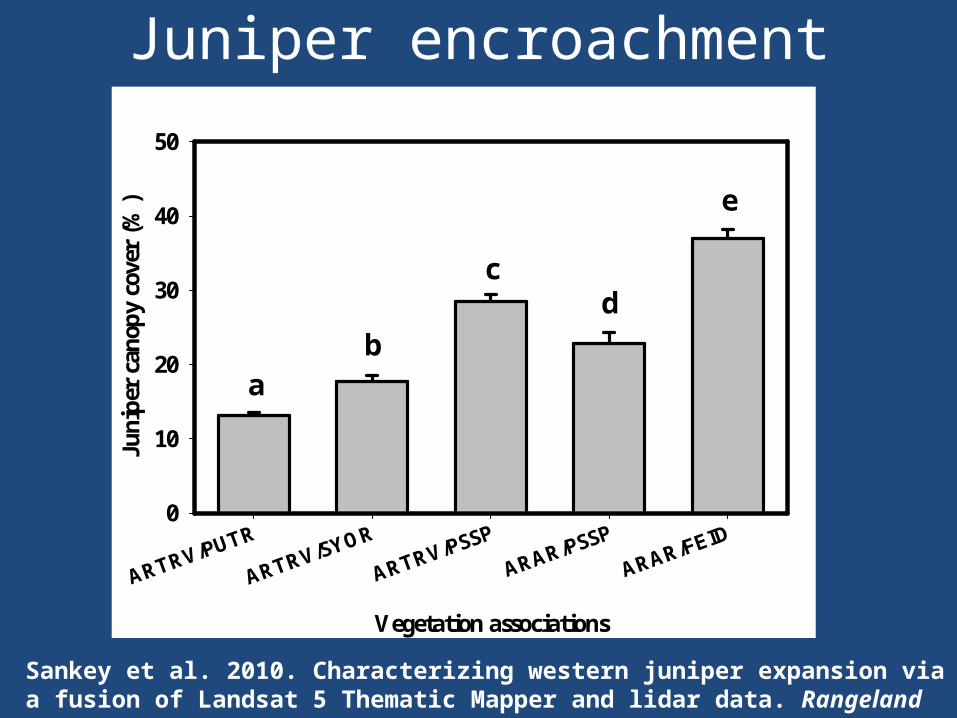
Vegetation associations
ARTRV/PUTR
ARTRV/SYOR
ARTRV/PSSP
ARAR/PSSP
ARAR/FEID
Juni
per
cano
py c
over
(%
)
0
10
20
30
40
50
ab
cd
e
Sankey et al. 2010. Characterizing western juniper expansion via a fusion of Landsat 5 Thematic Mapper and lidar data. Rangeland Ecology and Management 63: 514-523
Juniper encroachment

Juniper encroachment
Shrubland Grassland
Juni
per
incr
ease
(%
)
0
10
20
30
40
50
Grazed Ungrazed
Sankey, T. and M. Germino. 2008. Assessment of juniper encroachment with the use of satellite imagery and geospatial data. Rangeland Ecology and Management 61: 412-418

Decades
1700 1750 1800 1850 1900 1950 2000
Rel
ativ
e di
stri
buti
on o
f tr
ee a
ge (
%)
0
2
4
6
8
10
12
14
16
N=228
Juniper encroachment
Sankey et al. 2013. Lidar-derived carbon estimates in woody encroachment. Journal of Geophysical Research (In Press)

Field-measured tree height (m)
0 4 8 12 16
Lid
ar-d
eriv
ed tr
ee h
eigh
t (m
)
0
4
8
12
16
y = -0.14 + 0.82XR2 = 0.84p < 0.001RMSE = 4.9
Juniper encroachment
Sankey et al. 2013. Lidar-derived carbon estimates in woody encroachment. Journal of Geophysical Research (In Press)

Juniper encroachment

Field-measured tree canopy cover
0 20 40 60 80 100
Lid
ar-d
eriv
ed tr
ee c
anop
y co
ver
0
20
40
60
80
100
y = 6.72 + 1.44XR2 = 0.82p = 0.04
Juniper encroachment
Sankey et al. 2013. Lidar-derived carbon estimates in woody encroachment. Journal of Geophysical Research (In Press)

Field-measured juniper tree density
0 10 20 30 40 50 60
Lid
ar-d
eriv
ed j
un
iper
tre
e d
ensi
ty
0
10
20
30
40
50
60
R2=0.79y=8.38+0.59*X
Juniper encroachment
Sankey et al. 2013. Lidar-derived carbon estimates in woody encroachment. Journal of Geophysical Research (In Press)

Juniper encroachment
0 2 4 6 80
2
4
6
8
Ground-predicted biomass (ln(kg))
Lid
ar-p
red
icte
d b
iom
ass
(ln
(kg)
)Y= 0.85 + 0.77*XR2 =0.77p <0.001RMSE = 0.5
Sankey et al. 2013. Lidar-derived carbon estimates in woody encroachment. Journal of Geophysical Research (In Press)

Central Asian Rangelands• Mongolia’s political
changes• Changes in herding
practices• Livestock numbers
tripled

Changes in herd distribution

Effects on rangelands• Landsat 5 TM• 6 years: 1986,
1989,1990,…...shift… 2001, 2002, 2007
• Collective vs post-collective
• Significant decrease

Rangelands vs Croplands• Many abandoned fields in former socialist
countries• Abandoned fields were used as rangelands• New shift now

Grassland
Shrubland
Woodland
Cropland
Rangeland dynamics
Time
Years Decades
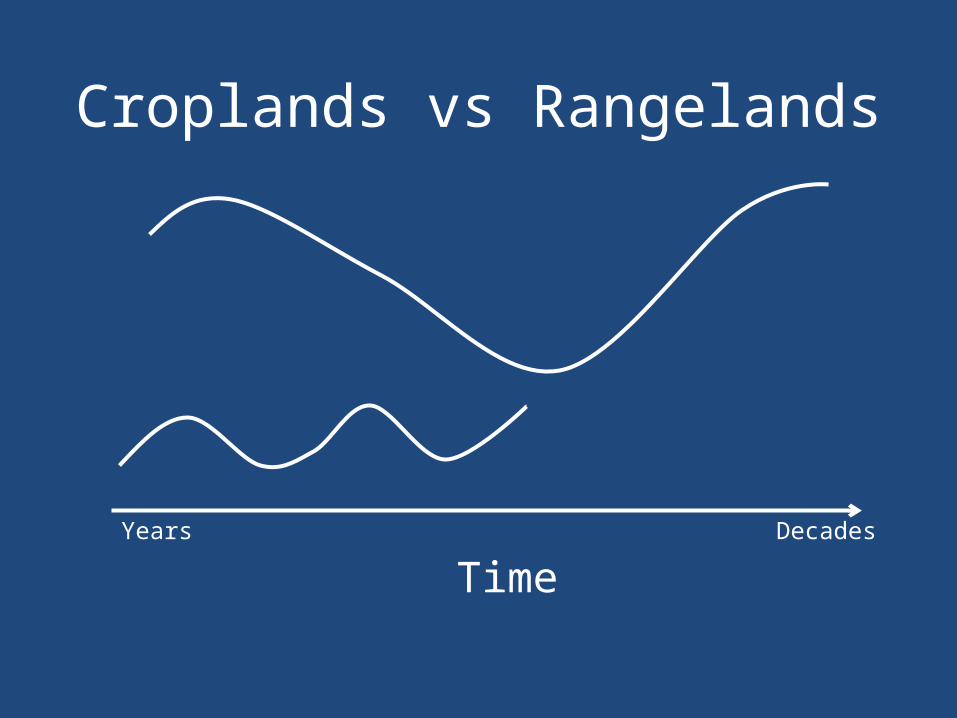
Croplands vs Rangelands
Time
Years Decades

Crop Demand vs Supply
Time Years Decades
Spac
e
Demand
Supply?
Supply?