Embed Size (px)
Citation preview

Green PaPer on PensionsGr
een Pa
Per
on
Pen
sions
ww
w.p
ensi
onsg
reen
pape
r.ie design_w
ww
.redd
og
.ie

Green Paper on Pensions
BAILE ÁTHA CLIATHARNA FHOILSIÚ AG OIFIG AN tSOLÁTHAIR
Le ceannach díreach ónOifig Dhíolta Foilseacháin Rialtas,
TEACH SUN ALLIANCE, SRÁID THEACH LAIGHEAN, BAILE ÁTHA CLIATH 2.nó trid an bpost ó
FOILSEACHÁN RIALTAS, AN RANNÓG POST-TRÁCHTA,51 FAICHE STIABHNA, BAILE ÁTHA CLIATH 2.(Teil: 01 647 6834/35/36/37; Fax: 01 647 6843)
nó trí aon díoltáir leabhar.
DublinPUBLISHED BY THE STATIONERY OFFICE
To be purchased directly from theGOVERNMENT PUBLICATIONS SALES OFFICE,
SUN ALLIANCE HOUSE,MOLESWORTH STREET, DUBLIN 2.or by mail order from
GOVERNMENT PUBLICATIONS, POSTAL TRADE SECTION,51 ST.STEPHEN’S GREEN, DUBLIN 2.
(Tel: 01 647 6834/35/36/37; Fax: 01 647 6843)or through any bookseller.
s15.00
Government of Ireland 2007
(PRN A7/0505)

GREEN PAPER ON Pensions
�

�
GREEN PAPER ON Pensions
Table of Contents Government Foreword I
Executive Summary III
Consultation Process XV
Chapter 1: The Current System and its Overall Philosophy 1 Introduction 2 The pensions system in Ireland 2 Objectives of the Pension System 3 An Evolving System 5 Role of the State 6 Role of the Employer 8 Role of the Employee/Individual 9 International Reform 10 Chapter Summary 12
Chapter 2: The Demographic Challenge 13 Introduction 14 Migration 14 Mortality 15 Fertility 15 Labour Force Projection 15 Scenario Analysis 17 International demographic and labour market comparisons 18 Chapter Summary 21
Chapter 3: A Modern and Sustainable Pensions System 23 Introduction 24 Economic and Financial Sustainability 24 Challenges Facing the Existing System 24 Meeting the Challenges 28 Changes to the Existing System 30 Conclusion 31 Social Sustainability 31 Chapter Summary 33
Chapter 4: Maintaining Income Adequacy in Retirement 35 Introduction 36 Current Pensioners’ Incomes 36 Retirement Income Expectations for People of Working Age 41 Minimum Incomes and Risk of Poverty for Older People 43 Replacement Income on Retirement 46 DC and PRSA Income Adequacy 48 Role of Other Arrangements and Supports 49 Supplementary Pension Coverage 51 International Comparisons 52 Chapter Summary 56

�
GREEN PAPER ON Pensions
Chapter 5: The Social Welfare Pension in Ireland 57 Introduction 58 Current Issues in Relation to Social Welfare Pensions 59 The Social Insurance System from 1953 and its Impact on Pensions 59 Caring and Pension Entitlements 60 The Operation of the Average Contributions Test 61 Differential between Contributory and Non-Contributory Payment Rates 63 Means Testing of Increases for Qualified Adults 63 Chapter Summary 65
Chapter 6: The Social Welfare Pension: Reform Options 67 Introduction 68 “Reform” A: Maintain the Current Arrangements 68 Reform B: Universal Pensions 69 Reform C: Reforming and Backdating the Homemaker’s Scheme 76 Reform D: Replacing the Average Contribution Test with a Total Contributions Approach 82 Reform E: Miscellaneous Issues Relating to Social Welfare Pensions 90 Reform F: Approaches to Address Sustainability 95 Chapter Summary 98 Chapter 7: Supplementary Pensions - Incentives for Retirement Saving 101 Introduction 102 The Private Pension System 102 Principal Features of Pensions Tax Arrangements 103 Current rules of Funding Pension Benefits 105 Cost of Tax Reliefs 106 Value for Money 107 Considerations of Equity 108 Flexible Options - Approved Retirement Funds 110 Options for Change 112 Chapter Summary 118
Chapter 8: Possible Approaches to Pensions Development 119 Introduction 120 A) The Current System 121 B) Delivering improved adequacy through enhanced Social Welfare benefits 122 C) Enhancement in respect of voluntary pension provision 123 D) Soft Mandatory Pensions 125 E) Mandatory Pensions 126 Trade-offs in the supplementary pensions debate 128 Trade-offs in the supplementary versus social insurance debate 128 Strategic Considerations 128 Chapter Summary 130
Chapter 9: Issues Regarding Defined Benefit and Defined Contribution Pension Schemes 131 Introduction 132 Definitions of Pension Schemes 132 Issues for Defined Benefit and Defined Contribution Pension Schemes 133 Defined Benefit Schemes in Pension Provision 134 Integration/Pensionable Salary 135 Defined Contribution 136 Guarantees and Security 138 Security for Pension Scheme Members 141 ECJ Judgment 145 Chapter Summary 146

�
GREEN PAPER ON Pensions
Chapter 10: The Funding Standard 149 Introduction 150 History of the Funding Standard 150 The Current Funding Standard 150 Impact on Funding of Recent Economic/Financial Developments 151 Changes to the Funding Standard, 1990 to 2002 155 Current Situation 156 Options 159 Criteria for Change 164 Current Status of the Funding Standard Review 164 Chapter Summary 164
Chapter 11: Annuities and related issues 167 Introduction 168 Annuities - what they are and how they operate 168 Is the Annuity Market Working Well? 169 The Role of Annuities in the Overall Provision of Pensions 169 Alternatives to Annuities 170 Annuity Purchase 171 Future of the Annuity Market 171 The Role of the State in Relation to Annuities 172 Chapter Summary 176 Chapter 12: The Role of Regulation 177 Introduction 178 Role of Regulation 178 Supervision of Pensions: Role and Objectives 179 Regulatory Objectives 179 Regulation and Pension Scheme Governance 180 Regulation and Disclosure of Information 181 Regulation and Different Types of Pension Scheme 181 PRSA Regulation 182 Regulation - Raising Awareness 183 Pensions Legislation 185 Operational Review 186 Charges and Pension Products 186 Chapter Summary 197 Chapter 13: Public Service Pensions 199 Introduction 200 Public Service Pensions System 200 Public Service Pension Reform Process 201 Future Outlook for Public Service Pensions 204 The Link Between Pensions and Pay Determination: The Benchmarking Body and Review Body 205 Chapter Summary 206

�
GREEN PAPER ON Pensions
Chapter 14: Work flexibility in older age: a new approach to retirement 209 Introduction 210 Policy Context 210 Environmental Changes 211 The Individual Perspective 211 The Employers’ Perspective 211 Barriers to Older Persons Working Longer 212 Overcoming Barriers to Working Longer 213 Pensions and the EU 215 Retirement Age Options 216 Retirement Age and the Social Welfare pension 218 Retirement Age and Occupational Schemes 220 Chapter Summary 223
Appendices 225Appendix A: International Pension Systems 226Appendix B: The Social Welfare Pension System in Ireland: Development and Cost 229Appendix C: Footnotes to table 7.2 - Estimate of the cost of tax and PRSI reliefs
for private pension provision 2006 238Appendix D: Retirement Annuity Contracts by range of gross income (2003) 240Appendix E: Press Release - ECJ Judgment (Robins case) 241Appendix F: Terms of Reference of Annuity Study 243Appendix G: Extract from the Review of the Funding Standard by the Pensions Board 244Appendix H: Pensions Board Publications 246
Acronyms 248
Bibliography 249

i
GREEN PAPER ON Pensions
The Government is proud of its record of achievements for older people and greatly values the contribution this group has made to our economic success and continued prosperity. This success and prosperity has generated the resources to enable the Government to provide significant increases in the State Pension and other supports, resulting in consistent improvements in the standard of living for all older people over many years. We will continue to make improvements for older people a key priority and have set out a wide range of commitments in the Programme for Government, including: increasing the basic State Pension to at least €300 per week by 2012; aiming to secure a retirement income from all sources of at least 50% of pre-retirement earnings; and working to develop flexible responses to retirement.
Reflecting awareness of the fact that our population is ageing, the issue of pensions has moved closer to the top of the public agenda in recent years. The social and economic implications of this trend are emerging and we need to assess our ability to ensure the protection of all our pensioners, both now and in the future. As has been the case with many developed countries, we know that there are significant challenges ahead. We are living longer, and in better health, which is a wonderful achievement. However, while Ireland currently has a younger population than most European countries, over the longer term the impact of population ageing in this country will be considerable. According to new data in this Green Paper, the number of people
of working age for each person age 65 and over will fall from 6 in 2006 to 2 in 2050. Taking account of the fact that a proportion of those of working age will not be in employment, the ratio of workers to people aged 65 and over in 2050 will be 1.5 to 1. This demographic change will be a challenge for the sustainability of the pension system because of the expected substantial increase in age-related expenditure in the decades ahead. This issue needs to be considered in the context of our aims to increase supplementary pension coverage and to enable people in retirement to have adequate replacement incomes.
We now have a ‘window of opportunity’ in which to address these concerns. Thus, the objective of this Green Paper on Pensions is to carefully consider the issues involved, before making appropriate decisions for ourselves and future generations. We must decide what sort of retirement we want for ourselves and our children and what choices we as a society are prepared to make to secure that future. Good pension provision costs, whether it is done through a system of private provision and personal contributions or through the State by way of taxes and social insurance contributions.
The Green Paper sets out the wide and complex range of issues involved. It addresses specific issues in relation to Social Welfare pensions, occupational and public sector pensions, and incentives for supplementary pension saving. In addition, it examines issues regarding defined benefit and defined contribution schemes, and the
Government Foreword
Bertie Ahern, T.DTaoiseach
Brian Cowen, T.D.Tánaiste and Minister for Finance
Martin Cullen, T.D.Minister for Social and Family Affairs

ii
GREEN PAPER ON Pensions
role of regulation. It also sets out some key issues related to work flexibility in older age and barriers to older people working longer, including possible approaches to flexibility in retirement age.
The essential purpose of this Green Paper is to stimulate debate. Key questions for consideration are posed and some possible approaches to pension development are set out. We wish to thank the social partners and the many individuals, groups and organisations who have engaged in this process to date. We also wish to thank the officials across a number of Government Departments who contributed to the development of the Green Paper.
The consultation process that will follow the publication of this document will allow all stakeholders to contribute towards shaping a framework for addressing the pensions challenge over the longer term. The Government looks forward to engaging in these discussions and invites all stakeholders to participate in working towards achieving an affordable, sustainable and modern pension system to meet the individual needs of those currently in retirement and which also secures the same objective for younger generations.

EXECuTIVE SuMMARy

iV
GREEN PAPER ON Pensions
Chapter 1: The Current System and its Overall Philosophy
This Green Paper on Pensions is published in fulfilment of the commitment in the social partnership agreement, Towards 2016. It builds upon two major reports from the Pensions Board - the ‘National Pensions Review’ (2006) and ‘Special Savings for Retirement’ (2006). These two reports built on the earlier report of the Board on the National Pensions Policy Initiative (1998).
The pensions system in Ireland comprises two main elements. The first is the State-run Social Welfare system and the second comprises voluntary supplementary pensions provided through a variety of arrangements and regulated by the State. The overall objective of our pensions system is to provide an adequate basic standard of living through direct State supports and to encourage people to make supplementary pension provision so that they may have an adequate income in retirement.
It is an objective of the Social Welfare pension system to provide income and other supports at an adequate level. Pension adequacy is also about the maintenance of a level of retirement income which is adequately related to pre-retirement income.
In common with many other countries, Ireland is experiencing demographic changes which increasingly, over time, will add considerably to the cost of pension provision. Therefore, along with the focus on adequate income in retirement, a key objective of our pension system is sustainability.
Modernisation of the Irish pension system is an ongoing process. In order to provide adequate pensions and to remain sustainable, a pensions system must move in tandem with changes in the labour market. This has particular implications for women.
The current pensions system can be described as a tripartite arrangement between the State, employers and individuals. Different views on the appropriate respective roles of each of these stakeholders are held within society.
In the current environment, many people are not making adequate supplementary pension provision. Changes may be needed to address this. The
Green Paper is intended to continue the debate on the most appropriate form of any new direction on pensions and to outline various options for the most appropriate way forward.
Chapter 2: The Demographic Challenge
There is a wide range of population projections for Ireland based on various demographic assumptions, which reflects the difficulty in making long term forecasts. However, the scale of the transition from a lower to higher old age dependency ratio has been highlighted in a number of recent reports on the long-term demographic pressures facing Ireland.
Net migration has been the most volatile component of Ireland’s population change since the foundation of the State. Migration patterns in Ireland have changed materially in recent years. Future levels of migration are extremely difficult to predict with any degree of certainty. Demographic assumptions in this chapter take account of the actual migration experience of recent years.
Future expected levels of mortality within the population and the labour force are also important in determining the number of people requiring pension income in the future and the length of time for which they will require it. Projections suggest that, by 2061, life expectancy at age 65 will increase by 6.4 years for men and 6.3 years for women over the current position.
The fertility rate recovered somewhat between 1994 and 2004, and is at a very high level relative to most other European countries. Projections suggest that, while decreasing, the fertility rate will remain high by international standards.
The population aged 65 and over will increase by 59% to 2021 and by a further 142% to 2061. There will be a relatively rapid and severe decline in the Pensioner Support Ratio (PSR - the ratio of the number of people of working age to the number of people over pension age) from 5.6 in 2006 to 1.8 in 2061. The analysis of sustainability in Chapter 3 is based on other demographic projections which show the same pattern of changing dependency.

V
GREEN PAPER ON Pensions
Increases in the retirement age were found to have a significant impact on the ‘real’ PSR (the ratio of people in employment to those aged over 65). We would require high sustained net inward migration to reverse the underlying trend of falling PSRs. Increased female participation in the labour force will bring about a temporary increase in the real PSR.
The age structure of the Irish population is different to most other countries in the EU, and our demographic situation is relatively favourable over the medium term. The Irish working age population is projected to peak in 2041 at around 29% higher than its current level and to fall back thereafter. Older workers are eventually projected to form a significant part of the labour force.
Chapter 3: A Modern and Sustainable Pension System
A key objective of pension policy design is to ensure the sustainability of the system over the longer term. For many countries, including Ireland, a growing concern in this respect is demographic change.
The projected ageing of the population will give rise to a substantial increase in age-related expenditure, of which pension provision is expected to be the single largest component. Recent projections indicate that spending on this age-related aggregate will increase from roughly 5% of GDP today to 13% by 2050. This is the equivalent of a €12 billion increase in 2007 present value terms.
A further consequence of demographic change is that the task of financing increasing pension spending will fall to a diminishing share of the population. By 2050, it is projected that there will be fewer than two workers per pensioner.
Taken together, these changes in the composition of the population imply a mismatch between the spending demands facing the public pension system and its ability to meet these demands (notwithstanding the accumulation of assets in the National Pensions Reserve Fund). In short, the existing system is not sustainable on the basis of current projections, without adjustments to the overall policy mix.
To safeguard the pension system into the future, a combination of measures aimed at financing and reducing the size of the projected funding gap will be required. In broad terms, the available options are:
l Increasing Exchequer savings (raising taxes or reducing spending elsewhere) and / or private savings;
l Easing upward spending pressures;
l Raising the retirement age;
l Increasing the share of the population at work;
l Improving the economy’s productive capacity and overall competitiveness.
Meeting future challenges will clearly require major policy choices on our part. In making these choices, it will be important to recognise the trade-offs that exist, and to take advantage of the current ‘window of opportunity’, so as to put in place an appropriate and timely policy mix. This should aim to secure the financial and social sustainability of the pension system, with minimum disruption to the wider economy.
Chapter 4: Maintaining Income Adequacy in Retirement
The average net income for single pensioners and pensioner couples in 2005 was €327.55 per week, compared to net average weekly incomes for all households in the population of €776.11. Social Welfare pensions are the main source of income for Irish pensioners. Age, gender and household composition factors affect pensioners’ incomes. Around 32% of pensioner units have income from occupational or personal pensions, but relatively few pensioners in the bottom two-fifths of incomes have income from these sources.
50% of people at work expect that supplementary pensions, rather than Social Welfare pensions, will be their main retirement income source. While over 50% of workers are scheme members, Social Welfare pensions are likely to be the main retirement income source for many of this group based on current contribution levels to occupational schemes. Savings and investments are seen as an important additional source of income but are not widely expected to be the main income source.

Vi
GREEN PAPER ON Pensions
Based on the official consistent poverty indicator, older people are in a better position than the rest of the population (3.7% for those over 65, compared to 7% overall). The risk of income poverty indicator is at approximately the same level for both groups.
The limited evidence available would suggest that some pensioners are not attaining the replacement income target suggested by the National Pensions Policy Initiative/National Pensions Review. There is also evidence that many PRSA contributors are under-saving for retirement, based on the same target.
A relatively low percentage of workers without pension coverage had either investment income or a second home. The majority of those with investment income or second homes also had pensions. Around 23% of workers without a pension had an SSIA, compared to around 46% of those with pensions.
Non-cash benefits, including the household benefits package, are an important support for pensioners’ living standards.
Coverage surveys conducted in 1995 and 2002 were not directly comparable, and the best conclusion that can be drawn is that there was no change in pension coverage over the period. Pension coverage increased from 51% in 2002 to 55% in 2005. The supplementary pension coverage target suggested by NPPI/NPR is 70% of the working population between age 30 and 65 from 2013. Current coverage for this group is 62%. Despite this improvement, certain groups remain hard to reach through supplementary pensions. These groups include part-time workers, workers in sectors with traditionally low coverage, women, and groups outside the labour market.
The risk of income poverty for older people in Ireland is relatively high by international standards. Replacement income provided by the Social Welfare pension for middle and high income groups is also low by international standards.
Chapter 5: The Social Welfare Pension in Ireland
This chapter identifies and discusses the main issues which have arisen in relation to the Social Welfare pension system. In the main, the issues identified have arisen because of the limited coverage of the
social insurance system up until the late 1980s and early 1990s, and societal norms which applied until the early 1970s. The manner in which the qualifying conditions for pensions are designed, particularly the average contribution test, can give rise to difficulties and there are also issues in relation to the use of means testing in relation to contributory payments. The appropriateness of the rates of payment, vis-à-vis the objectives of the Social Welfare system, is also an area which could be looked at. Possible approaches to the future development of the system are set out in the next chapter.
Chapter 6: The Social Welfare Pension: Reform Options
This chapter sets out a range of approaches, including pros and cons, that could be considered to deal with the issues set out in Chapter 5. The approaches are not mutually exclusive. Reform options discussed are:
“Reform” A: Maintain the Current ArrangementsThe gap in pension coverage are mainly the result of the structure of our social insurance system in the past and societal norms which existed through to the 1970s. Over the years, a range of measures has been introduced to deal with issues within the existing contributory and means-tested structure. While the impact of our earlier social insurance structures and societal norms will reduce in the years ahead, maintaining the status quo would mean that, in the short to medium term, about 47,000 people (mainly retired public servants and self-employed people) would remain outside the Social Welfare pensions system.
Reform B: universal PensionsThis pension could take a number of forms, including a standard rate of payment to all on reaching pension age; a minimum payment to those without any existing welfare entitlement; or a minimum age-related payment to those without any existing welfare entitlement. A universal payment would, however, be a radical departure from the present system - but it would deal with many of the societal and equality issues associated with the current system.

Vii
GREEN PAPER ON Pensions
Reform C: Reforming and Backdating the Homemaker’s SchemeOne of the main issues relating to the Social Welfare pensions system is the treatment of those who left employment to care for children or sick or incapacitated people. Issues continue to be raised regarding those who left employment before 1994, when the Homemaker’s Scheme was introduced. This reform examines options for changes to the Homemaker’s Scheme, including: changing the period covered by the scheme, replacing disregards with credits, and backdating the Homemaker’s Scheme.
Reform D: Replacing the Average Contribution Test with a Total Contributions ApproachA change to a system of qualifications based on total contributions, allied to a more comprehensive rate structure, would be a more equitable and transparent way of awarding pensions. In deciding on an appropriate structure and, in particular the contributions for maximum and minimum pensions, this should also have regard to the potential people now have to make social insurance contributions. Having examined the implications, it may be considered that it would be prudent to postpone a move towards a total contributions approach because of the varying levels of contribution which people qualifying for pension today have on their records. This will improve in future as improved social insurance coverage feeds into the system and brings more consistency into the insurance records of those applying for a pension.
Reform E: Miscellaneous issues relating to Social Welfare pensionsThis reform examined issues relating to the indexation of Social Welfare pensions, the existence of two contributory schemes, the role of the Living Alone Increase, and social insurance for spouses of farmers and self-employed people.
Reform F: Approaches to address sustainabilityThere is a significant projected rise in the cost of the Social Welfare pension system, arising from demographic change, improvements in social insurance coverage, and ongoing improvements in pension rates. In a Social Welfare context, if it was decided that savings were required, these may be achieved by one or a combination of the following: introduce an indexing arrangement which would limit the growth in costs; increase social insurance contributions; defer payments by increasing Social Welfare pension age; introduce means-testing for Social Welfare pensions.
Questions for ConsiderationIn view of the issues and challenges facing the Social Welfare pensions system and the approaches to reform discussed in this chapter, the key questions include:
1. In the light of the reforms to the Social Welfare system undertaken in the 1970s, 80s and 90s which will, in future, see most people qualifying for contributory pensions, are there implications for people who are at present not receiving support through the Social Welfare pension system?
2. Is the introduction of a universal pension arrangement a desirable and feasible option?
3. If universal provisions are not considered appropriate, then what groups, if any, currently outside the Social Welfare pensions system should be targeted for action?
4. Policy in relation to pensions has, for many years, concentrated on improving the position of all pensioners. Is this the most appropriate way of improving pensioner incomes or should there be a more targeted approach using measures such as the Living Alone Increase?
5. If the basis of qualification for contributory pensions was changed from average contributions made, to one based on total contributions, what would be an appropriate level of contribution a person should be required to have to receive a full pension?
6. Should a formal indexing arrangement linking pensions to some level of prices, earnings or risk of poverty threshold be introduced? How would a formal indexation mechanism be operated having regard to the overall budgetary and economic position?
7. Given the issues raised in this chapter, in Chapter 3, and in the Green Paper in general in relation to the long-term affordability of existing arrangements, how can the challenge of the growing cost of Social Welfare pensions be addressed?

Viii
GREEN PAPER ON Pensions
Chapter 7: Supplementary Pensions - Incentives for Retirement Saving
This Chapter details the current tax arrangements for investment in supplementary pensions. These arrangements involve tax relief on amounts contributed by employers and employees to approved pension schemes and on the investment income and capital gains of the pension funds. Pension benefits payable on or after retirement are taxable subject to an entitlement to a tax-free lump-sum cash benefit.
The Chapter also discusses issues surrounding the estimated cost of these tax incentives. It also discusses value for money and equity issues relating to the current tax relief arrangements. In this context, the potential factors militating against an improvement in supplementary pension coverage are outlined, notwithstanding the tax incentives on offer. The arguments made for tax incentives to be better targeted for those on lower incomes in a cost effective way are considered.
Changes made since 1999 introduced more flexibility and control for certain individuals in relation to their pension arrangements, including the option of investing pension funds in an Approved Retirement Fund (ARF). The Chapter considers the case being made for a general extension of the availability of these flexible options including the arguments for and against such an extension.
Finally, the Chapter discusses various options for change to the existing tax incentive regime and for some forms of mandatory pension schemes for those without supplementary pensions which were previously raised by the Pensions Board. The advantages and disadvantages of these various options are considered, including estimates of the costs involved.
Questions for Consideration1. Can tax incentives be better targeted to
encourage improved coverage in a cost-effective way?
2. Should the over-riding principle be coverage or equity and should incentives be offered at the marginal, standard or a hybrid rate?
3. Should pension arrangements (e.g. the ARF option) differentiate between individuals or
be open to all on the same basis? Where is the proper balance to be struck between the competing calls for equitable treatment of all pensioners, appropriate protection for vulnerable pensioners and the costs involved?
Chapter 8: Possible Approaches to Pensions Development
The chapter looks at possible approaches, any of which could, in combination with elements selected from the options discussed previously or others which might emerge over time, provide the framework within which pensions policy might be developed in Ireland. They are presented for illustrative purposes and to encourage the national pensions debate.
In that context, the models for supplementary pension reforms discussed are based on either enhancing the existing system of voluntary provision or on introducing mandatory or soft mandatory approaches. As an alternative to reforms based on supplementary pensions, a rise in the social insurance pension combined with an increase in the statutory retirement age is also considered.
These four approaches (voluntary, mandatory, soft mandatory and enhanced Social Welfare) need to be compared to the current system across a range of criteria. The main criteria that facilitate comparisons of the five approaches are coverage, adequacy, cost, competitiveness, modernisation and redistribution. These criteria apply both to the level of pensions provided under the system and to the means of delivery.
Decisions on the adoption and implementation of any particular approach would have to take full account of its likely impact on the economy and of the need to maintain budgetary stability in the light of the analysis presented in Chapter 3. A decision to adopt any particular approach would need to recognise that it would take effect over a long period and that an early and complete commitment to any one approach could restrict the options in relation to other proposals later on.
Questions for Consideration1. In light of the discussion in this Chapter,
and giving consideration to the sustainability

iX
GREEN PAPER ON Pensions
concerns raised in Chapter 3, is the current system of retirement provision, based on a combination of State provision through the social insurance system, and voluntary provision through occupational and other supplementary pension arrangements, appropriate? If the current system requires to be enhanced, should higher pensions be provided through social insurance or through supplementary provision or both?
2. If an enhanced supplementary pension approach to coverage and adequacy is preferred, should it be addressed through changes in the current voluntary system, or by way of soft mandatory or mandatory provision?
3. Can either a “soft” or “hybrid” mandatory pension scheme be designed to ensure that it would not operate to the detriment of the existing voluntary pension arrangements, for example by encouraging movement out of existing systems (which may be potentially better from the member’s point of view) into any new mandatory arrangement?
4. How can the extra costs of enhanced provision be financed? Are improvements in pension coverage and adequacy through enhancement of the social insurance system and/or the introduction of a system of soft mandatory or mandatory pensions provision outweighed by the likely costs and economic impacts?
5. Is the introduction of either a “soft” or “hybrid” mandatory scheme a desirable option given the economic, financial and competitiveness implications of such systems?
Chapter 9: Issues Regarding Defined Benefit and Defined Contribution Pension Schemes
Almost all schemes in Ireland are either defined benefit (DB) or defined contribution (DC), though the development of hybrid schemes is gathering momentum.
A number of issues arise which are particularly related to the nature of DB. These issues include:
The impact of the funding standard (which is dealt with in detail in Chapter 10).
The growth of DC. While the number of DB schemes is remaining constant, the majority of new schemes are DC. DB schemes are an important part of Irish pension provision and DB scheme members currently outnumber DC scheme members by a ratio of about 2:1, down from 4.5:1 in 1996. While DC schemes can provide certain advantages, the main concerns about the declining proportion of DB membership include: i) that retirement benefits are too low, given the contribution rates for DC schemes and; ii) a change in the allocation of risks from employers to employees.
The integration of DB pensions with Social Welfare pension. An integrated scheme is a scheme, usually DB, where the contribution and benefits are calculated net of the Social Welfare retirement benefit. A frequent criticism of these schemes is that if Social Welfare retirement benefits increase rapidly in the years before retirement, the benefits paid by the scheme, particularly for the lower paid, can be lower than expected.
The main issue which arises in relation to DC is the adequacy of the pension benefit payable on retirement. Most DC members are unlikely to have a retirement income equal to, or greater than, the NPPI target. The level of contribution into a DC scheme is an essential factor in this regard.
Issues that are common to both DB and DC include:
Guarantees. People save to provide for the future. In allocating assets towards a long-term target, the acceptable level of risk and return will vary, depending on the objective. However no-one, including the State, can give long term absolute guarantees.
The security of the pensions benefit. Security of pension benefit as it relates to DC is concerned with the security of what was expected from the investment.
From time to time, a DB scheme may have a shortfall, i.e. the value of the assets of the scheme may be less than the calculated value of the future benefits of the scheme. Usually the shortfall is made up by additional contributions into the scheme. A shortfall becomes important in two circumstances;

X
GREEN PAPER ON Pensions
where future contributions are not sufficient to cover the shortfall and where the scheme is being wound up and there is an uncovered shortfall.
In Ireland, the security of benefits of members of DB schemes depends on the assets already accumulated in the pension fund, and on the willingness of the employer to continue to make contributions.
In some countries, there are mechanisms to provide additional security for scheme members in the event that the scheme has an unmanageable asset shortfall, including obligations on employers to make contributions and/or to take responsibility for fund shortfalls and insurance or similar arrangements to meet part or all of any shortfalls that may arise.
Questions for Consideration1. Are there problems with the current integration
arrangements for DB schemes?
If so, what are the possible solutions? a. prohibit integration? b. restrict a reduction in pensionable pay in
last, say, 3 or 5 years? c. have a different integration formula for lower
earners, as is the case in the public sector?
2. How can we ensure that savers understand that the level of contributions, the length of time the contributions will be made, and the return on investments will influence the level of benefits in a DC scheme?
3. What would be considered appropriate security of pension benefits? Does this exist at present?
4. Are people sufficiently aware of the trade-off between risk and the return on investments, i.e. usually the higher the potential return, the greater the risk?
5. What could be done to enhance guarantees of pension benefit? Do guarantees justify the associated costs and risks?
6. In some countries, there are arrangements to meet at least part of a shortfall in the event of a scheme shortfall. Some of these arrangements include the Pension Protection Fund in the UK, the Pension Benefit Guarantee Corporation (PBGC) in the USA and the German Pensions-Sicherungs-Verein. These arrangements can
run into considerable difficulties, with the experience of the PBGC, which is currently experiencing large deficits, being a particular case in point. Having considered the discussion, would you be in favour of any of these arrangements, having regard to the pros and cons outlined in this chapter?
Chapter 10: The Funding Standard
The funding standard was introduced in 1991 in order to set out the minimum assets that a defined benefit scheme must hold and what steps must be taken if the assets of the scheme fall below this minimum. Before 2000, very few schemes failed the funding standard because of high investment returns and low revaluation liabilities. However, between 2000 and 2004, many schemes failed the standard due to a fall in investment returns and a sharp decline in long-term interest rates. There has been an improvement in the situation recently, reflecting the progress of equity markets since 2003. There is now a divergence of views about the standard: some believe that the number of schemes failing the standard is a sign that the standard is too high: others believe that the standard is appropriate or even too low, and that schemes’ failure to meet the standard is a result of increases in longevity and lower expected future yields.
The operation of the current funding standard comprises two elements: (i) the preparation of an Actuarial Funding Certificate (AFC), which compares assets of the scheme with the liabilities, calculated on a specified basis, and, (ii) if the AFC shows a shortfall, the preparation of a funding proposal, designed to eliminate the shortfall over an agreed period.
The funding standard does not determine the cost of a DB scheme. This cost is determined by the benefits provided by the scheme, the investment returns earned and the experience of the scheme in terms of the actual salary of the member at retirement; the rate of price inflation during the course of pension payment (if payments are inflation linked); demographics, i.e. how long will the member live while in retirement and, if there is a spouse’s pension, how long the spouse will live and the fact that pension funds have acquired

Xi
GREEN PAPER ON Pensions
much higher commitments on wind-up. Schemes are also faced with higher annuity costs. The cost is also determined by the impact of the FRS17 accounting standard (which obliges employers to show the amount of their pension commitments (liabilities) compared to the amount of the scheme assets (fund) and to disclose the net difference in their annual accounts). The funding standard as a wind-up standard obliges schemes to aim to hold assets that would be enough if the scheme wound up to meet the scheme’s accrued liabilities. There is an issue in relation to the priority given to pensioners and non-pensioners in a wind-up situation.
Options include:1. Make no change to the funding standard;
2. Base the funding standard on long-term expected returns, but leave the current wind-up entitlements unchanged;
2.1 A variation of this scheme has been suggested which is to change the funding standard for large DB scheme members; and
3. Change the wind-up entitlements for DB scheme members. This would result in the funding standard being reduced.
Finally, the Pensions Board has been asked by the Minister for Social and Family Affairs to examine the operation of the funding standard and plans to submit a report to the Minister in 2007.
Questions for Consideration1. Are there any particular difficulties with
the funding standard? If so, what are these difficulties and what implications do they have in your opinion?
2. Should the funding standard be based on long-term expected returns, but leaving the current wind-up entitlements unchanged?
3. Should the link between the funding standard and wind-up entitlements be broken?
4. Should the funding standard remain unchanged?
5. Should the benefit entitlements underlying the funding standard be reduced in value, thereby reducing member entitlements in the event of
a wind-up happening, as compared with the current standard?
6. Should the funding standard be changed for large DB schemes only?
Chapter 11: Annuities and Related Issues
This Chapter considers the operation of the annuity market, the factors determining the price of annuities and the role of annuities in the supplementary pension system.
Annuities provide a secure means of converting pension savings into pension income and avoid the danger that pensioners could exhaust their pension savings before dying. Despite their advantages, there has been debate as to whether the market for annuities is operating efficiently and effectively.
There are reasons to expect that demand for annuities will grow in the future, though this is highly sensitive to policy developments, particularly in relation to any extension of the option to invest in an Approved Retirement Fund (ARF). Certain groups are required to use their retirement funds to buy an annuity while others are allowed the option to convert their pension savings into an ARF. There have been calls for more flexibility in relation to the options available to those obliged to purchase an annuity.
In choosing between an ARF and an annuity, many factors need to be considered including price, charges, control and risks. Many would likely prefer to retain control over their funds by means of an ARF rather than buying an annuity. However with an ARF there is the risk of outliving one’s pension assets since life expectancy generally tends to be underestimated by individuals. Prospective returns from ARFs may also be overestimated. ARFs may be particularly unsuited to holders of small pension funds in view of their likely inability to cope with fluctuations in income and capital deriving from investment performance.
The Chapter also outlines the role of annuities in relation to defined benefit occupational pension schemes and considers suggestions that the State should become a provider of annuities in certain circumstances. It cautions that the broader implications of a ‘State Annuity’ deserve careful
Xii
GREEN PAPER ON Pensions
attention and critical examination and questions whether it would be appropriate in view of the State’s existing exposure to longevity risk within the economy. Finally, some questions are raised in relation to the State’s potential role in improving the functioning of the market for both providers and purchasers of annuities.
Questions for Consideration1. Do annuities offer value for money?
2. Should DC holders continue to be compelled to buy an annuity at the precise moment of retirement or should they be allowed some flexibility in timing? Should PRSA and other personal fund holders continue to be allowed to avoid annuitisation and to continue to hold their retirement funds until death?
3. Should the State be more involved in the annuity market and, if so, in what way? Is it appropriate that the State takes on the additional risk involved in the form of a State Annuity Fund?
4. What measures could be introduced to assist individuals to recognise annuity terms that they may find satisfactory? For example:
l Are there steps which could be taken to better inform customers in relation to the comparative cost of annuities?
l Should providers be obliged to inform a prospective purchaser that their annuity can be bought from a different provider?
l Should measures be introduced to encourage people to look at alternatives to fixed single life annuities?
5. How can the market for annuities be encouraged to diversify and become more competitive? Can measures be taken to encourage new entrants to enter the market?
6. In what ways can employers and trade unions be more proactive? Can more information be provided about annuities and the options available when employees are coming up to the point of retirement?
Chapter 12: The Role of Regulation
The main reason the State establishes systems of regulation in any area of activity is to provide confidence and stability in that system. The State may also intervene where markets are not operating efficiently. As pensions saving involves providers investing other people’s money on their behalf, it is important that those people can be confident that the system is secure and that their own savings are secure.
The State ensures that sufficient levels of confidence and security exist in the pensions system by intervening through legislation or other means to ensure standards are put in place and monitored. The State has established bodies to monitor those standards. This Chapter sets out the State’s regulatory objectives in relation to pensions. These include:
l ensuring that savers receive the benefits to which they are entitled;
l giving those saving enough information to assess the adequacy of their provision;
l ensuring that pension contributions are not misappropriated and are accounted for;
l ensuring that people have enough information to make investment decisions, where relevant;
l ensuring that tax reliefs are used appropriately;
l providing pension savers with enough information to decide whether or not to use that vehicle for retirement saving, particularly in respect of value for money;
l providing pension savers with the information needed to make specific decisions, for example, at retirement or on leaving employment.
The number of occupational pension schemes in existence creates particular regulatory challenges.
Information on pensions is essential to heighten pension awareness, safeguard the rights of scheme members and to ensure that people have sufficient information to make appropriate financial decisions. The overall approach to pension regulation continues to evolve to address, proactively, challenges of a changing environment. In order to address these challenges, the Pensions Board is undertaking an operational review, with the intention of moving

Xiii
GREEN PAPER ON Pensions
towards a risk-based approach. This will ensure that the Board is structured and skilled to ensure confidence and stability in the occupational pension system as far as possible.
Finally, the Chapter outlines options for streamlining some aspects of regulation of PRSAs, while deepening other aspects of regulation, in particular issues in relation to information and charges.
ChargesFunded supplementary pension arrangements are subject to both explicit and implicit charges, depending on the nature of the arrangement and services required. Employers may also incur their own costs in operating funded supplementary pension arrangements in relation to the deduction and submission of employee contributions, providing various administration services (e.g. record keeping), providing information and advice to employees and making annual returns of certain information to Revenue.
Only PRSAs are currently subject to statutory control over the type and level of explicit charges; there is no readily available central source of information on the level of explicit third party charges made to funded supplementary pension arrangements. This makes it difficult to compare different arrangements or know whether value for money is being received. For defined contribution arrangements, high charges can reduce the individual’s retirement fund. For defined benefit arrangements, higher charges increase the cost of providing the promised benefit. A perception of high charges can act as a disincentive to employers and individuals alike to start and contribute to a voluntary pension arrangement.
The key issue in relation to charges is the lack of detailed knowledge and the Chapter outlines options that may address this information deficit. Options are also outlined in relation to controlling charges for supplementary pension schemes.
There are impacts attached to each of these options and any change in the regulatory approach would need to have regard to the principles of better regulation and undergo a regulatory impact analysis.
Questions for Consideration1. Is the overall approach to the regulation of
pensions appropriate to ensure confidence and security in the system?
2. Are the regulatory objectives appropriate?
3. Is the level of regulation appropriate to the regulatory objectives we are trying to achieve?
4. Are there measures that could be taken to introduce transparency in relation to pension fund charges?
Chapter 13: Public Service Pensions
This Chapter details the defining features of public service pensions and the significant reforms that have been implemented in this area in recent years. It shows that pension coverage is close to 100% across the public service and that most public service pension schemes are contributory, pay as you go, defined benefit schemes.
It gives details on the programme of reform which was based largely on the recommendations of the Commission on Public Service Pensions. The key cost containment aspect in this programme was the raising in 2004 of the minimum pension age for new entrants to the public service from 60 to 65. The mandatory retirement age of 65 years was abolished for most new entrants at this time also.
The Chapter also considers the cost of public service pensions, which are set to rise significantly in the medium-term (mainly because of increases in the number of public servants and improved life expectancy), notwithstanding implementation of the reform programme.
The Chapter outlines a number of further reform options which the Government intends to research and consider in respect of future appointees to the public service to address demographic and other developments since the Commission reported in 2000. These include:
l raising the minimum public service pension age
l increasing the rate of pension contributions

XiV
GREEN PAPER ON Pensions
l modifying the ‘pay parity’ basis for post-retirement increases in pensions
l removal of fast accrual terms
l abolition of certain notional added years arrangements
l options for accounting for pension costs
l a slower accrual rate in respect of retirement pension and lump sum
l moving to calculation of pensions on the basis of ‘career average’ earnings.
At present, the Public Service Benchmarking Body and the Review Body on Higher Remuneration in the Public Sector are carrying out reviews of the appropriate level of remuneration of the categories of public service grades coming within their respective remits. The terms of reference of the Benchmarking Body state that:
“the body should have regard to the differences between the public service and the private sector and between the various public service groups within its remit in working conditions, the organization of work, perquisites, and conditions of employment and other relevant benefits, including security of tenure and superannuation benefits”.
Questions for Consideration1. How should the cost of funding public service
pensions be met?
2. Which individual reform options offer the most realistic potential?
Chapter 14: Work Flexibility in Older Age: A New Approach to Retirement
With people living longer and fitter lives, the costs of pensions increasing, and younger workers seeking to increase their current living standards, growing numbers of people want to work, or feel a need to work, beyond the State pension age. Sustainability considerations may mean that the idea of increasing retirement age should play a central role in our pensions strategy.
Government policy is to facilitate those who wish to extend their working lives. The average exit age from the labour force in Ireland was 64.1 years in 2005,
compared to the average EU25 age of 60.9 years. The current employment rate for older people (55-64) is over 53%. The OECD has commented, however, that population ageing in Ireland could have a profound socio-economic impact if Ireland’s potential labour supply is not mobilised more effectively.
There are a wide range of viewpoints held by both individuals and employers on an increase in retirement age. While recent legislative change has improved the possibilities for people to work into older age if they wish, there is a view that a change of mindset needs to be promoted among both employees and employers to encourage older workers to remain in employment.
Flexibility in pension arrangements and working conditions may assist in removing some structural barriers to working longer. In addition, more flexibility may be needed in the Social Welfare pension system. Attention might also be given to the alignment of other policies to support any change in retirement age, including continuing to create the conditions for economic growth and competitiveness, narrowing health inequalities, and adapting HR processes and practices.
Allowing people to postpone retirement and to improve their Social Welfare benefits through further employment would be in keeping with EU policy in this area.
While the primary argument in favour of increasing retirement age is financial, a further argument is on the grounds of intergenerational equity. There are nevertheless some obstacles which would have to be overcome and issues to be addressed if the State retirement age were to be increased.
The Actuarial Review of the Social Insurance Fund presents a number of methods for phasing in retirement age increases. It is clear that increasing the retirement age has the potential to contain, to some degree, the extent of the projected rise in benefit expenditure. A balance will need to be achieved between maintaining the stability of the Social Welfare pension system, supporting the voluntary nature of occupational pension provision and intergenerational fairness.
Given that Ireland is seen to be in a position of strength relative to other developed economies in terms of retirement age, properly designed,

XV
GREEN PAPER ON Pensions
imaginative incentives which allow a flexible approach to employment in later life may bring the results needed.
Questions for Consideration1. Should measures be put in place to encourage
later retirement? Should measures be put in place to encourage employers to retain older workers? What form should such measures take?
2. Should a system allowing for voluntary deferral of the Social Welfare pension be introduced? How should this operate?
3. Should other incentives be introduced to encourage people to work beyond normal retirement age?
4. In order to encourage later retirement, should employers be prohibited from setting a retirement age below a certain age? Should they be prohibited from setting any retirement age?
5. In order to contain costs and reflect increased life expectancy, should a change be made to the retirement age for Social Welfare pensions? How should such a change be implemented?
Consultation Process
The Government is publishing the Green Paper on Pensions in order to stimulate debate on the challenges and options for the future development of pensions in Ireland. The Government would like all interested individuals and organisations to give their views and we welcome comments on any aspect. Your contribution will help to inform us in making appropriate decisions for ourselves and future generations.
The Government appreciates that issues in relation to pensions can be wide-ranging and complex. Accordingly, in order to ensure that adequate time is allowed for reflection and debate, the consultation process will extend to mid-2008. This will ensure that the consultation is both thorough and inclusive.
To assist you in formulating your response, key questions for consideration are set out at the end of each chapter – these are also repeated in the executive summary.
When making a submission, please state whether you are responding as an individual or representing the views of an organisation. Submissions received will be published on the website.
An electronic version of the Green Paper is available at the website:
www.pensionsgreenpaper.ie.
You can make your submission using this website. Alternatively, a written response may be submitted by email, letter or fax to:
Green Paper ConsultationPensions Policy UnitDepartment of Social and Family AffairsÁras Mhic DhiarmadaStore StreetDublin 1
email: [email protected]
Fax: 01-7043457


CHAPTER 01
The CurrenT sysTem and iTs oVerall PhilosoPhy

Introduction
1.1 This Green Paper on Pensions is published in fulfilment of the commitment in the social partnership agreement, ‘Towards 2016’. The publication of the Green Paper follows a period of increased activity in the development of pensions policy which has seen the publication of two major reports by the Pensions Board - the ‘National Pensions Review’ (2006) and ‘Special Savings for Retirement’ (2006). These two reports built on the earlier report of the Board on the National Pensions Policy Initiative (NPPI), published in 1998. This Green Paper takes account of all of these reports and, using the most up-to-date data, sets out the key issues and challenges now facing the Irish pensions system.
1.2 The publication of the Green Paper will be followed by a period of consultation. Through this process, the Government will seek the views of all stakeholders, with a view to developing a framework for comprehensively addressing the pensions agenda over the longer-term.
1.3 This opening chapter sets out the main elements of the Irish pension system, the objectives and philosophy which underpin it, the challenges it faces and the type of reforms undertaken in other countries in recent years in response to the challenges facing their national pension systems.
1.4 Following a discussion on demographic projections in Chapter 2, the sustainability of the present system is discussed in Chapter 3. Chapter 4 examines the adequacy of Social Welfare and supplementary pensions. An extended discussion of current issues on Social Welfare pensions is contained in Chapters 5 and 6. Chapter 7 discusses incentives for retirement saving. Chapter 8 looks at some possible approaches to pensions development. The following chapters examine defined benefit and defined contribution schemes, the funding standard, annuities, the role of regulation and public sector pensions respectively. Work flexibility and retirement age, issues that cut across various themes in this Green Paper, are discussed in the final chapter. A short summary is given at the end of each chapter together with questions for consideration for Chapters 6 to 14.
The pensions system in Ireland
1.5 The pensions system in Ireland comprises two main elements. The first is the state-run Social Welfare system and the second comprises voluntary supplementary pensions provided through a variety of arrangements and regulated by the State. These take the form of pensions sponsored by the employer, or personal pensions such as Retirement Annuity Contracts (RACs) and Personal Retirement Savings Accounts (PRSAs). The overall objective of our pensions system is to provide an adequate basic standard of living through direct state supports and to encourage people to make supplementary pension provision for themselves so that they may have an adequate income on retirement.
Social Welfare System1.6 The pensions provided under the Social Welfare
system are intended to provide an adequate basic standard of living. They comprise flat-rate payments with eligibility based on achieving a certain level of social insurance contributions over a person’s working life (State Pension (Contributory)) or through satisfying a means test (State Pension (Non-Contributory)). Means-tested payments are funded entirely through taxation. Payments based on social insurance contributions are funded through pay-related contributions made to the Social Insurance Fund by employers, employees and the self-employed with subvention, where necessary, by the State. Those who are unable to contribute because of unemployment or illness are, subject to conditions, credited with contributions, while arrangements are also in place since 1994 to protect the pension entitlements of those who spend time out of the workforce on caring duties.
1.7 Social Welfare pensions can also include additional allowances for dependants, those living alone and those over 80 years of age. Supplements are also provided to assist in meeting the costs of electricity, fuel in the winter months, telephone rental and a television licence. All persons aged 66 and over are entitled to free travel on public transport while the other benefits, except the fuel allowance, are available on a universal basis to those over 70 years of age. The current (January 2007)
GREEN PAPER ON Pensions
�

�
GREEN PAPER ON Pensions
weekly rates of payment are €209.30 for the full-rate State Pension (Contributory) and €200 for the State Pension (Non-Contributory).
1.8 Means-testing remains an important, but declining, feature of Social Welfare pensions. In the 20 years from 1974, a number of significant changes were made to the social insurance system - with coverage extended to groups such as the self-employed, part-time workers and new public servants. These changes are now feeding through to the Social Welfare pensions system, with more people qualifying for pensions on the basis of their social insurance record rather than on the basis of a means test.
Voluntary Supplementary Pensions1.9 Voluntary supplementary pensions account
for approximately one quarter of overall income in retirement. Due to the immaturity of the system, however, this is expected to increase. The role of voluntary supplementary pensions in the Irish system is, generally, to encourage people to make supplementary pension arrangements to ensure that income in retirement is related to the income received by them when they were employed. Pensions can be provided through a person’s employment or directly through financial institutions acting as pension providers. Employers are not obliged to provide occupational pension schemes for their employees, but many do so, and where an employee does not have access to an occupational pension scheme or where one does not exist, the employer must enable his or her employees to access a Personal Retirement Savings Account (PRSA).
1.10 The State encourages and promotes membership of occupational and personal pension schemes through favourable tax treatment and regulation to safeguard entitlements in so far as possible. The tax approach is EET (exempting contributions, exempting fund growth but benefits are taxable). Payment of tax (and PRSI and Health Levy) is exempted on contributions to such schemes within certain limits. Investment returns on the contributions are also exempt from taxation at the point when they are earned. However, with certain exceptions, income drawn down from such schemes is taxed under the normal tax rules at the time of drawdown. This deferral of
taxation, together with the fact that, for many individuals, a combination of lower retirement income (and therefore lower income tax), more favourable rates for older people, and the promise which exists for a tax-free lump sum payment or the opportunity for some to further defer tax through an Approved Retirement Fund (ARF) structure (to be described later) mean that, in practice, an EET system is operated in a way which provides a considerable tax incentive for pension provision, depending on personal circumstances.
Objectives of the pensions system
1.11 The overall objective of the pensions system, as outlined above, is to ensure that people have an adequate income in retirement. In relation to Social Welfare pensions, the objective is to provide income and other supports so that pensioners are assured of an adequate basic standard of living. The role of voluntary supplementary pension arrangements is to encourage people to make supplementary pension provision. In this respect, a private pension may supplement the Social Welfare pension as well as other forms of retirement income.
1.12 In preparing the annual Budget, the Government considers what increases can be provided in Social Welfare pensions in the light of its social policy commitments and the resources it has available to meet pensioners’ needs and the other competing demands for public expenditure. A number of different approaches have been proposed by advisory bodies about appropriate targets for Social Welfare and other pensions. For example, the National Pensions Policy Initiative (NPPI) (1998) considered that a target rate of 34% of gross average industrial earnings (GAIE) was an appropriate benchmark for Social Welfare pensions. It also suggested that, for Social Welfare pension and supplementary pension combined, 50% of pre-retirement gross earnings was an appropriate level. After reviewing the position, the Pensions Board’s ‘National Pensions Review’ (NPR), published in 2006, indicated that these benchmarks

�
GREEN PAPER ON Pensions
should continue to be taken into account by Government in the implementation of its policy. The State Pension (Contributory) now stands at approximately 35% of GAIE, following significant increases in Social Welfare pensions in recent years. The NPR also recommended the continuation as an ultimate target (to be achieved some time after 2013) that 70% of the working population over 30 should have a supplementary pension. Pension coverage for this group is now 61.8% (QNHS, Quarter 4, 2005), up from 58% in 2002.
1.13 The objectives of the EU Open Method of Co-ordination (OMC) in a number of social policy areas form another useful input in the context of setting objectives for the pension system. The OMC pensions objectives of adequacy, sustainability and modernisation are also key objectives of our national pension system. These three objectives are interdependent. For example, in considering increasing pension levels, it is necessary to have regard to issues of sustainability. In addition, in the context of modernisation of the pension system, it is important to ensure that changes made do not impact negatively on the adequacy of pension provision. These three broad objectives, common to all EU Member States, constitute a suitable framework to consider the many issues that arise in Irish pension reform, and are discussed briefly now and, in more detail, in later chapters.
Adequacy1.14 It is an objective of the Social Welfare pension
system to provide income and other supports at an adequate level. Pension adequacy is also about the maintenance of a level of retirement income which is adequately related to pre-retirement income. Recent Social Welfare pension increases have brought both the non-contributory and contributory pensions to and above a €200 per week target set by Government.
1.15 In relation to supplementary pensions, the National Pensions Review (2006) identified a number of adequacy issues. Firstly, it outlined the view that defined benefit schemes will tend to offer higher pensions to individuals that remain with the same employer. Also, low contribution levels in defined contribution schemes are likely to result in relatively low
replacement rates. Typical contribution levels, and anecdotal evidence, suggest that contributions to PRSAs and Retirement Annuity Contracts (RACs) are proportionately less than contributions for occupational pension schemes. Finally, about one third of occupational pension schemes provide for guaranteed increases of pensions in payment - so the value of other arrangements may be eroded through inflation. The adequacy of Social Welfare and supplementary pensions is discussed in detail in Chapter 4.
Sustainability1.16 In common with many other countries, Ireland
is experiencing demographic changes which increasingly, over time, will add considerably to the cost of pension provision. In the case of the Exchequer, these pressures will be reinforced by the impact of an ageing population on health expenditures. Assessments by international organisations have shown that many countries, including Ireland, will, in the absence of countervailing factors, face widening budget deficits and rising levels of public debt as a result of age-related expenditures of which pension provision is the single largest component. Therefore, along with the focus on adequate income in retirement, a key objective of our pension system is sustainability. In a situation where people are, happily, living longer, the sustainability of our system becomes an issue of even greater concern in that we need to consider efficient ways of ensuring that older people are adequately provided for throughout their retirement. It is inevitable that the proportion of people aged over 65 will increase rapidly compared to the proportion at work in the coming decades. Projections in the National Pensions Review indicated that pension costs impacting on the Exchequer will already show a noticeable increase by 2016. Projections by international organisations indicate that this trend will accelerate in the following decades. Clearly, the changing composition of the population will pose significant challenges for the economy and the public finances, with implications for the long-term sustainability of the pension system.
1.17 Several options for reform are suggested in this Green Paper with a view to ensuring the long-term sustainability of pension provision. As well as financial and economic sustainability, we

�
GREEN PAPER ON Pensions
also need to have regard to social sustainability which covers issues such as inter-generational solidarity and expectations around future living standards.
1.18 Ensuring sustainability will require an appraisal of existing policies. Increasing the size of the labour force (particularly in terms of increasing participation rates for groups currently under-represented, including older workers), increasing pension coverage, improving the economy’s productive capacity and overall competitiveness, providing a sound regulatory environment, reform of the social insurance system and the establishment of the National Pensions Reserve Fund are channels through which Ireland is already addressing sustainability issues. Financial sustainability is also an issue for supplementary defined benefit pensions. Increasing longevity is causing a continuing increase in the cost of benefits, and risk awareness and asset volatility is causing some employers to re-examine their sponsorship of such schemes. Sustainability is discussed in detail in Chapter 3 while specific issues related to defined benefit schemes are discussed in Chapter 9.
Modernisation1.19 In order to provide adequate pensions and to
remain sustainable, a pensions system must, for example, move in tandem with changes in the labour market and facilitate people who move jobs or adopt more flexible working patterns. This has particular implications for women who currently tend to avail of more flexible working arrangements than men.
1.20 Modernisation of the Irish pensions system is an ongoing process. In recent years, significant changes have been made to the system in an attempt to adapt pensions to a changing economy, society and labour market. The introduction of PRSAs, changes in qualifying conditions for Social Welfare pensions, increased provision for protection of supplementary pension entitlements, the establishment of the Pensions Ombudsman, the implementation of equal treatment legislation in the pensions area and the significant discussions brought about through the National Pensions Review have all contributed to this process.
1.21 The issue of equality of treatment between women and men is crucial. A modern system must provide equal access to men and women. This Green Paper discusses issues that are of particular relevance to gender equality. In particular, the issue of women’s eligibility for social insurance pensions is discussed, and how periods of care outside of the labour force might be recognised in the social insurance system (see Chapters 5 and 6). In addition, the relatively low proportion of women in supplementary pension coverage is examined (see Chapter 4).
An evolving system
1.22 While the delivery of a pensions system is closely dependent on economic, social and financial factors, political, philosophical and cultural values also play a part in people’s attitudes and demands. Typically, there may be fundamentally differing views on the respective roles and obligations of the individual, the employer and the State in pensions delivery.
1.23 In this context, Ireland has witnessed a growing debate on pension provision over the last decade. Policy development, on foot of projected demographic change, has been ongoing since the mid-1990s. The future development of pensions policy is central to the development of economic and social policy in Ireland. Over successive social partnership agreements, there has been a growing focus on pensions - culminating in the commitment in ‘Towards 2016’ to produce this Green Paper - leading ultimately to the publication of a Government framework for comprehensively addressing the pensions agenda over the longer-term.
1.24 The issues are also particularly topical due to the real, very practical challenges that have arisen for employers, employees, pensioners and Government itself (as both Government and employer). The challenges are similar to those in other countries and arise from demographic change, the rising cost of pensions, and investment and financial risk.
1.25 In keeping with international trends, virtually all of the pension schemes which have been put in place in the private sector in Ireland over the

�
GREEN PAPER ON Pensions
past 15 years have been defined contribution. In addition, some pre-existing schemes have changed from defined benefit to defined contribution. (It should be noted, however, that the total membership of defined benefit schemes is remaining steady - although defined benefit membership as a proportion of total pension scheme membership is declining.) As a result of the decisions being made to close or alter defined benefit schemes, there may now be a greater awareness among employees generally as to their pension situation and the type of pension scheme to which they belong (defined contribution or defined benefit). They may also be more conscious of the respective advantages and disadvantages of different types of pension arrangements.
1.26 Pension provision by Government has involved Social Welfare pensions, which have been significantly increased in recent years, and support for the voluntary supplementary system. While the cost of pensions will rise, achieving a fair and proportionate sharing of the cost - which takes account of the need to secure future growth of the economy - is the fundamental challenge facing the Irish pensions system.
1.27 The current pensions system in Ireland can be described as a tripartite arrangement between the State, employers and individuals/employees/self-employed. This tripartite arrangement applies, in different ways, to both first pillar (Social Welfare) and second pillar (occupational) pensions.
First Pillar Pensions - the tripartite arrangement1.28 First pillar pensions in Ireland consist of
two types of payment - non-contributory and contributory. The State Pension (Non-Contributory) is financed through general taxation and is paid according to need. It is a means-tested payment, paid from 66 years of age. The State Pension (Contributory), however, is paid to those people over the age of 66 years who have made sufficient social insurance contributions. The Social Insurance Fund, from which contributory payments are drawn, is funded by employers, the self-employed and employees, with subvention from the Exchequer where necessary.
Second Pillar Pensions - the tripartite arrangement1.29 Second pillar pensions follow a different
arrangement, whereby the State, employers, self-employed and employees are involved in a mutually beneficial (but voluntary) system. An employer, for example, may provide an occupational pension scheme for its employees as part of a remuneration package. Contributions made by both employees and employers receive tax relief at the appropriate rate (provided by the State through tax foregone) which is designed to encourage take-up of, and contributions to, such occupational pension schemes. Pension fund investments are also exempt from tax on their capital gains and income. This arrangement is designed to assist in achieving the State’s objective to encourage individuals to provide adequate replacement income by encouraging employees and the self-employed to contribute to funding their own pensions. In addition, the adequacy of such arrangements is enhanced through financial incentives for employers to contribute. (See Chapter 7 for a discussion on financial incentives.)
1.30 In addition, the State provides a regulatory structure for second pillar pensions through primary and secondary legislation. The function of such regulation is to protect the integrity of the pension system, including the protection of the interests of members and the protection of pension schemes generally. In addition, the Pensions Board and the Pensions Ombudsman seek, respectively, to ensure compliance with the Pensions Act 1990, and to resolve complaints and disputes in relation to occupational pension schemes and PRSAs. The Financial Regulator also has a part to play in relation to consumer protection and overall issues of solvency of providers.
Role of the State
1.31 In relation to Social Welfare pensions, the traditional role of the State has been to provide income and other supports so that pensioners are assured of an adequate basic standard of living. (A Government commitment to provide pensions of at least €200 per week was achieved in Budget 2007.) An alternative view, however, is that Social Welfare pensions should provide for

�
GREEN PAPER ON Pensions
more than this, that is, that they should provide for an income in retirement that reflects a higher share of the economy’s resources. In this context, some argue that the role of the State should be to provide pensions that are well above the ‘risk of poverty’ line, are set at a higher level of gross average industrial earnings (e.g. 40% or 50%) and uprated in line with that, or are set at a higher monetary level. Essentially, the argument is that state resources should be redirected from other purposes towards higher levels of pension provision, that additional taxation should be raised for this purpose, or that other policy measures are put in place to ensure the increase is sustainable. These options are discussed in Chapters 6 and 8.
1.32 Others see an even greater role for the State in providing Social Welfare pensions, suggesting that pensions should not be means-tested or based on social insurance contributions, but rather paid to all people reaching retirement age as a right of residence or citizenship. This issue is discussed in Chapter 6.
1.33 However, raising the level of Social Welfare pensions (in the absence of other reform), raises major sustainability considerations, due in particular, to the ageing population - where the proportion of those at work compared to those over 65 years of age will see a dramatic reduction in the coming decades. This will significantly increase the cost of Social Welfare pensions. The cost of public service pensions will also rise significantly over this period. The cost of both Social Welfare and public service pensions will be met only in part by the National Pensions Reserve Fund. Therefore, the sustainability of making substantial additional pension promises to future generations of older persons must be considered in the context of a general expectation that, relatively speaking, there may be less taxpayers then to finance these promises. Moreover, any such pensions will fall to be paid at a time when other age-related expenditures - such as health - will also be much increased.
1.34 In reaching its pension objectives, the State needs to strike a balance between maintaining economic growth and stability, social cohesion, and raising resources to meet growing, long-term pension liabilities. There are certain
things that the State can do to meet increasing demographically-related liabilities, including pensions - such as increasing taxes or PRSI contributions, introducing measures to extend working lives, reallocating resources from other areas of public expenditure and introducing measures to increase take-up and the level of pension contributions - but any decisions made need to have regard to the effects that they may have on other areas of the economy and society. The Government notes, in this regard, that environmental, social and corporate governance issues are taken into account in the implementation of the National Pension Reserve Fund’s statutory investment policy.The pension issue must be seen in its broad economic and social context.
1.35 The State’s role should also extend to providing for the current generation of pensioners as well as the pensioners of the future. The wider population also has needs which carry resource implications. There are complex issues of social sustainability and inter-generational equity to be considered in striking the right balance between these needs and those of future generations. This will require a balance to be struck between social sustainability (for example, solidarity between generations) and economic sustainability.
1.36 Supplementary pensions are taken out by individuals to provide adequate income in retirement. Supplementary pensions are also closely aligned with the State’s economic objectives of sustainable economic and employment growth and improved competitiveness. Fostering a successful supplementary pensions environment assists in creating financial stability and wealth creation and provides a basis for retirement income beyond a reliance on State support.
1.37 The future role which the State may play in supplementary pensions is also discussed in this Green Paper. As a facilitator of supplementary pension provision through financial incentives, are the means through which the State strives to increase coverage rates and encourage adequate provision the most efficient and effective? Should the State provide incentives in a different way, for example (see Chapter 7)? What regulatory role should

�
GREEN PAPER ON Pensions
the State play in the supplementary pension system (see Chapter 12) and would a mandatory or soft mandatory supplementary pension route be a more effective way of achieving objectives (see Chapters 7 and 8)? What is the role of the State in encouraging take up and the provision of information and support, including to trustees (see Chapter 12)?
1.38 It may be considered that the State’s role in supplementary pensions should not radically change, that it should continue to provide incentives to encourage pension provision and also ensure consumer protection. Others will argue that the State should adopt a more directive role, intervening in a market that, as they see it, has failed, and requires greater State intervention to ensure that people save for the long-term and that their savings are secure. The discussion in this Green Paper, and the subsequent consultation process, will be designed to further this debate.
1.39 As stated, the impact of choices in the pensions area must also be assessed by reference to the other functions of the State, including those relating to maintaining economic growth and social cohesion. State intervention is only one potential means through which to achieve a sustainable pensions system. The respective roles of both the employer and the employee/individual are crucial to the success of any pension reforms.
Role of the employer
1.40 Many employers have provided workers with pension opportunities through occupational pension schemes and, since 2003, employers are obliged to provide access to a PRSA where an occupational pension scheme is not an option. Under a voluntary system, an employer may decide whether or not to put an occupational pension scheme in place, or may alter the terms of an arrangement already in place. In this regard, the employer is a key actor in defining the shape of work-based pension provision.
1.41 The two standard types of occupational pension scheme offered by employers in Ireland are defined benefit and defined contribution
schemes. Defined benefit schemes generally offer a pension ‘promise’ (usually taking account of the Social Welfare pension) of a certain percentage of an employee’s final salary, while defined contribution schemes provide the employee with an amount determined by the level of contributions paid into a fund, its investment performance and the charges levied. For employers, there is a greater level of risk associated with defined benefit schemes in as much as the employer generally makes up any shortfall in the performance of the pension fund. While, in the past, defined benefit schemes were more the norm1 in employments which offered a pension scheme, various issues associated with such schemes have contributed to a significant decline in the share of the workforce covered by such schemes, with virtually all new private sector schemes being established as defined contribution. In this scenario, the investment risk associated with pension provision is shifted from the employer to the employee.
1.42 Defined benefit provision provides a degree of certainty and security for workers and retirees that post-retirement income will be related to their earnings. However, increasing pension costs can impact negatively upon firm competitiveness. These issues lie at the heart of the debate about pension reform and are addressed throughout this document, but particularly in Chapter 9. In that chapter, particular issues related to defined benefit and defined contribution schemes and how scheme design impacts on employers and employees are discussed. The State, as an employer, also has responsibilities to its employees in this regard, and public sector pensions are discussed in Chapter 13. In considering these issues, the appropriate future role of the employer in pension provision has to be addressed. For example, what responsibilities does an employer have to his or her employees when decisions need to be made about the type of pension scheme and benefits offered? And does provision of a good pension scheme provide advantages to employers?
1 In 1999, there were 145,000 members of defined contribution schemes and 425,000 members of defined benefit schemes (half of whom were in the non-commercial public sector). By 2005, there were 235,000 members of defined contribution schemes, and 500,000 members of defined benefit schemes (again approximately half of whom were in the non-commercial public sector).

�
GREEN PAPER ON Pensions
1.43 In seeking a new direction on pensions, the additional costs that pensions may place upon employers must be recognised, as must the competitive advantages that may be afforded employers through their providing quality pension provision. For example, good quality pensions can attract and retain employees and can lead to an employer being seen as an ‘employer of choice’. In addition, a role may exist for employers and others in encouraging financial awareness among workers and in encouraging older workers to remain in the workforce (Chapter 14).
1.44 One of the key questions is who should bear the risk of pension provision in the future, or at least how that risk should be shared between employee, employer and the State, and between generations. The next section focuses on the role of the employee.
Role of the employee/individual
1.45 It is generally accepted that individuals should take responsibility for providing a retirement income by saving during their working lives. The level of responsibility that a person is willing or able to take may be related to age, their experiences, their values, the type of employment, their appetite for risk and their understanding of the issues involved in retirement provision. While one employee might be happy to engage with these issues, another might prefer the employer to decide the components of the remuneration package. It is generally accepted that supplementary pensions, while simple in concept or objective, are often complex in design, maintenance and delivery. There is also now an awareness of the lack of certainty regarding the precise level of benefit delivered at retirement. The challenge for an individual in understanding all of the various issues involved has to be kept in mind.
1.46 In this context, it should also be recognised that the decisions taken by today’s employees, and any costs associated with such decisions, will have an effect on the employees of tomorrow who will need to support an increasing number of pensioners. Research suggests that, due to what can be termed financial myopia, some people must be incentivised if they are to
increase savings for their long-term future. (It should also be noted, however, that many individuals have taken out their own pensions under the current incentive regime.) While tax reliefs at the marginal rate are in place for individuals, increased awareness of the value of such reliefs may assist in overcoming the inertia that frequently works against an individual’s decision to save for his or her future. The success of the SSIA initiative shows that people will save when there are clear and understandable incentives for them to do so. One option that could be considered is to seek to replicate the success of the SSIA initiative in the context of the pension system by examining options for changing the current system of pension incentives (see Chapter 7).
1.47 When saving in pensions, however, people need to be confident that they are getting good value for money. While people are themselves bearing the investment risk under defined contribution arrangements, as compared to defined benefit schemes, any supplementary pension arrangements must be underpinned by a regulatory regime that protects their interests while maintaining a proportionate regulatory burden upon employers and commercial pension providers. It should also be noted that defined benefit arrangements have their own risks, including, for example, the possibility of losing a large part of accrued benefits. (The role of regulation is discussed in Chapter 12. People are also concerned about the effect of charging structures on the performance of their investment funds and this issue is also discussed in that chapter.)
1.48 While incentives and work-based provision can go some way towards encouraging such saving, there is also a view that individuals should be obliged to provide for their own futures. For many retirees, a Social Welfare pension may not be enough to provide an income appropriately related to their pre-retirement standard of living. If the view prevails that individuals should be obliged to provide for themselves, there are several options that can be taken. One is that the Social Welfare pension should be set at a certain minimum level and, beyond that, individuals should be able to make their own additional provision for retirement. At the other end of the spectrum, individuals might be compelled,

10
GREEN PAPER ON Pensions
through a mandatory supplementary pension system, to provide for themselves beyond the basic Social Welfare pension. In view of the increased pension costs facing most developed countries, such an approach could be considered as one of the possible policy options. A key requirement in considering a move towards mandatory savings would be the need to ensure that the system would not undermine economic and financial sustainability and that it would meet the income needs of retired people. These and other options are discussed in detail in Chapter 8.
International Reform
1.49 It is useful to look at international developments and how countries - whose populations have aged earlier than ours - have adapted to the new demographic context. The main elements of our pension system - Social Welfare pensions provided by the State, occupational pensions provided through employers, and private pensions arranged by individuals through insurance companies and other financial institutions - are generally found in other developed countries. The size and relative importance of each element is determined by the manner in which each country has decided to deliver the greater part of retirement income for older people. A number of countries, for example, have some type of general state-sponsored pension with a formal link to earnings. It should be noted, however, that while other countries can offer us interesting and useful examples, their reforms are often unique to the social, economic and political context and are designed to address different challenges. There is no common one-size-fits-all solution to the funding of future pensions.
1.50 In many parts of Europe, there has been, broadly speaking, an earnings-related pension operated on a pay as you go basis through state social insurance systems, with private and occupational provision playing a relatively minor part. In other places, notably Australia, Chile and Singapore, a mandatory system of individual defined contribution accounts operates through social security or the private sector, sometimes supplemented by means-tested benefits where pensions fall below a minimum threshold.
1.51 Over the years, effective retirement ages have declined in many countries across the developed world, the age at which people enter the labour-market has increased and, at the same time, life expectancy after retirement has improved significantly. In short, contribution years have decreased while years in receipt of benefits have increased, putting pressure on the financing of pensions systems.2
1.52 The nature of reforms being undertaken varies from country to country but generally include some or all of the following measures:
l Disincentives to work longer have been reduced and, in some cases, positive incentives have been provided;
l In some cases, normal retirement age is being raised;
l The link between the contributions made and the benefits paid has been strengthened by, in some cases, increasing the number of years a person must contribute in order to qualify for full pensions. (In the UK, however, as part of an overall package of pension reform covering first and second pillar provision, the requirement for a basic state pension is being lowered from 40 to 30 years);
l Income replacement rates from State systems are being reduced over time and in parallel with promoting the provision of supplementary pensions;
l There is a tendency to use more defined contribution type arrangements in the public sector;
l Account is being taken of increasing life expectancy in setting the level of State pensions.
1.53 The driver of pension reform in other countries, particularly in Europe, is, primarily, sustainability rather than adequacy. Adequacy of pensions is not seen as a current issue in other European countries due to their relatively high level of payments. In Ireland, up to now, our focus has been on maintaining sustainability and increasing adequacy. For people who have spent a full career on average earnings, for example, the average gross replacement rate of earnings provided by a pension in OECD countries is 57% of pre-retirement earnings.
2 European Commission (2006) Adequate and Sustainable Pensions: Synthesis Report 2006

11
GREEN PAPER ON Pensions
By contrast, Ireland has the lowest replacement rate at average earnings of 30.6%.3
1.54 Appendix A provides examples of how pensions systems are organised in different countries. Generally speaking, these examples are intended to illustrate the different types of system which can apply: defined benefit earnings-related payments through the state system, mandatory private pensions, and a basic State pension with no incentives for private provision. The case of the Netherlands is also included - a system which combines a statutory scheme and a voluntary occupational system which has achieved almost 100% coverage through the use of industry-wide schemes.
Conclusion
1.55 In the current environment, many people are not making adequate supplementary pension provision. Changes may be needed to address this. The Green Paper is intended to continue the debate on the most appropriate form of any new direction on pensions and to outline various options for the most appropriate way forward. Because people are living longer, individual pensions are likely to cost more in the future. A debate is required on how such costs should be shared. In that context, we must also consider whether some form of mandatory or soft mandatory provision would be appropriate and the Green Paper outlines options in this regard (see Chapter 8).
1.56 It is clear, however, that pensions are also a form of partnership - between the State, the employer and the individual. The question arises as to whether all stakeholders are accepting appropriate responsibility and whether a new direction is required to achieve the goal of adequate replacement income in retirement. While demographic change suggests that pensions will cost more in the future, making key decisions now to ensure sustainability of our pensions system will make any transition an easier one for all. To do this, the Green Paper sets out the type of reforms that might be considered in order to improve our pensions system.
3 OECD (2005) Pensions at a Glance: Public Policies Across OECD Countries
1.57 This chapter has discussed the philosophy of pension provision, particularly focusing on the need to reassess the current pensions landscape and to consider how the costs and risks associated with pension provision in the future might be shared. It is intended that the Green Paper process will examine and progress the debate on these issues.
1.58 The chapter has also outlined the direction of pensions reform in other jurisdictions, and the fact that, while facing similar challenges, responses vary widely across countries (see Appendix A). This may reflect the different social, economic and political contexts in which decisions are made, as well as the starting point from which reforms begin.
1.59 In addition, a brief overview of the objectives of the Irish pension system has set the scene for the discussion in the following chapters. These objectives need to be considered by all of the interests concerned if we are to proceed with a reform strategy that will work. Indeed, while it is possible to consider these objectives separately, the Green Paper shows the overlaps and interlinkages between the different objectives, affecting employees, employers, the self-employed and pensioners alike. The pensions issue is one which presents challenges across society as a whole. Our response to these challenges should be a shared one. The Green Paper process offers the opportunity for all stakeholders to participate in finding equitable and effective solutions.

1�
GREEN PAPER ON Pensions
The Current System and its Overall Philosophy
This Green Paper on Pensions is published in fulfilment of the commitment in the social partnership agreement, Towards 2016. It builds upon two major reports from the Pensions Board - the ‘National Pensions Review’ (2006) and ‘Special Savings for Retirement’ (2006). These two reports built on the earlier report of the Board on the National Pensions Policy Initiative (1998).
The pensions system in Ireland comprises two main elements. The first is the State-run Social Welfare system and the second comprises voluntary supplementary pensions provided through a variety of arrangements and regulated by the State. The overall objective of our pensions system is to provide an adequate basic standard of living through direct State supports and to encourage people to make supplementary pension provision so that they may have an adequate income in retirement.
It is an objective of the Social Welfare pension system to provide income and other supports at an adequate level. Pension adequacy is also about the maintenance of a level of retirement income which is adequately related to pre-retirement income.
In common with many other countries, Ireland is experiencing demographic changes which increasingly, over time, will add considerably to the cost of pension provision. Therefore, along with the focus on adequate income in retirement, a key objective of our pension system is sustainability.
Modernisation of the Irish pension system is an ongoing process. In order to provide adequate pensions and to remain sustainable, a pensions system must move in tandem with changes in the labour market. This has particular implications for women.
The current pensions system can be described as a tripartite arrangement between the State, employers and individuals. Different views on the appropriate respective roles of each of these stakeholders are held within society.
In the current environment, many people are not making adequate supplementary pension provision. Changes may be needed to address this. The Green Paper is intended to continue the debate on the most appropriate form of any new direction on pensions and to outline various options for the most appropriate way forward.

CHAPTER 02
The demograPhiCChallenge
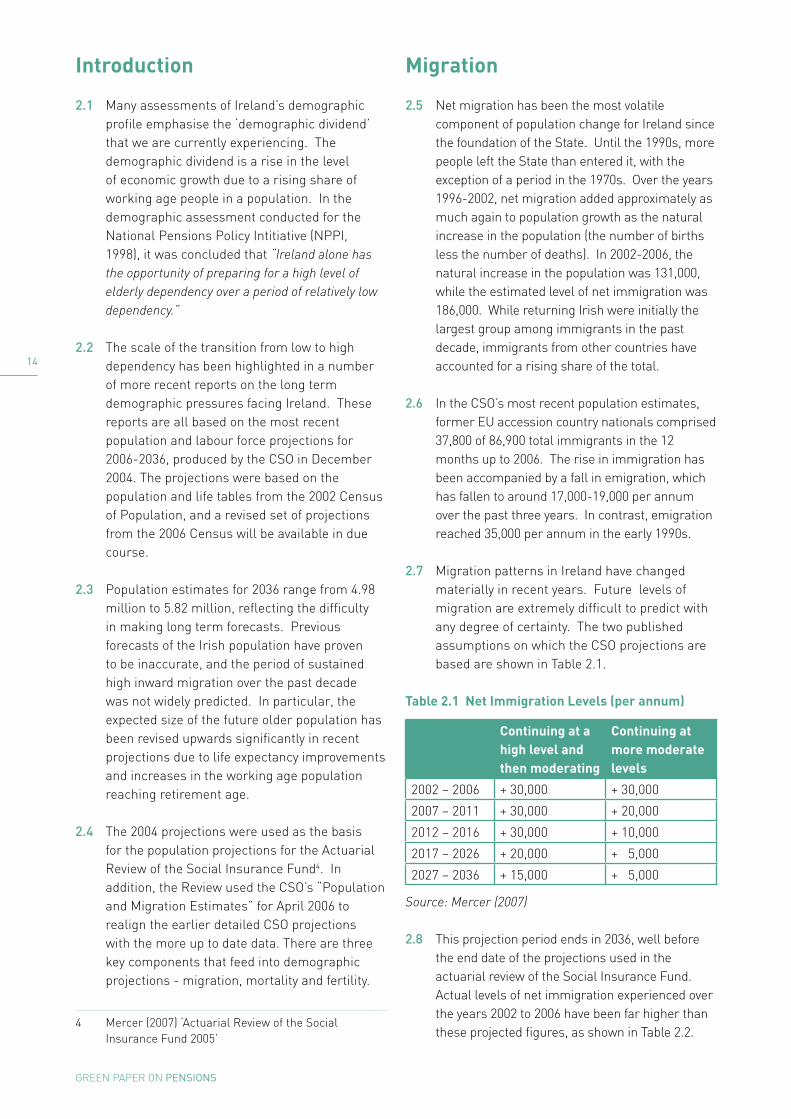
1�
GREEN PAPER ON Pensions
Introduction
2.1 Many assessments of Ireland’s demographic profile emphasise the ‘demographic dividend’ that we are currently experiencing. The demographic dividend is a rise in the level of economic growth due to a rising share of working age people in a population. In the demographic assessment conducted for the National Pensions Policy Intitiative (NPPI, 1998), it was concluded that “Ireland alone has the opportunity of preparing for a high level of elderly dependency over a period of relatively low dependency.”
2.2 The scale of the transition from low to high dependency has been highlighted in a number of more recent reports on the long term demographic pressures facing Ireland. These reports are all based on the most recent population and labour force projections for 2006-2036, produced by the CSO in December 2004. The projections were based on the population and life tables from the 2002 Census of Population, and a revised set of projections from the 2006 Census will be available in due course.
2.3 Population estimates for 2036 range from 4.98 million to 5.82 million, reflecting the difficulty in making long term forecasts. Previous forecasts of the Irish population have proven to be inaccurate, and the period of sustained high inward migration over the past decade was not widely predicted. In particular, the expected size of the future older population has been revised upwards significantly in recent projections due to life expectancy improvements and increases in the working age population reaching retirement age.
2.4 The 2004 projections were used as the basis for the population projections for the Actuarial Review of the Social Insurance Fund4. In addition, the Review used the CSO’s “Population and Migration Estimates” for April 2006 to realign the earlier detailed CSO projections with the more up to date data. There are three key components that feed into demographic projections - migration, mortality and fertility.
4 Mercer (2007) ‘Actuarial Review of the Social Insurance Fund 2005’
Migration
2.5 Net migration has been the most volatile component of population change for Ireland since the foundation of the State. Until the 1990s, more people left the State than entered it, with the exception of a period in the 1970s. Over the years 1996-2002, net migration added approximately as much again to population growth as the natural increase in the population (the number of births less the number of deaths). In 2002-2006, the natural increase in the population was 131,000, while the estimated level of net immigration was 186,000. While returning Irish were initially the largest group among immigrants in the past decade, immigrants from other countries have accounted for a rising share of the total.
2.6 In the CSO’s most recent population estimates, former EU accession country nationals comprised 37,800 of 86,900 total immigrants in the 12 months up to 2006. The rise in immigration has been accompanied by a fall in emigration, which has fallen to around 17,000-19,000 per annum over the past three years. In contrast, emigration reached 35,000 per annum in the early 1990s.
2.7 Migration patterns in Ireland have changed materially in recent years. Future levels of migration are extremely difficult to predict with any degree of certainty. The two published assumptions on which the CSO projections are based are shown in Table 2.1.
Table 2.1 Net Immigration Levels (per annum)
Continuing at a high level and then moderating
Continuing at more moderate levels
2002 – 2006 + 30,000 + 30,000
2007 – 2011 + 30,000 + 20,000
2012 – 2016 + 30,000 + 10,000
2017 – 2026 + 20,000 + 5,000
2027 – 2036 + 15,000 + 5,000
Source: Mercer (2007)
2.8 This projection period ends in 2036, well before the end date of the projections used in the actuarial review of the Social Insurance Fund. Actual levels of net immigration experienced over the years 2002 to 2006 have been far higher than these projected figures, as shown in Table 2.2.

1�
GREEN PAPER ON Pensions
Table 2.2 Actual Net Immigration
2002 41,300
2003 29,800
2004 31,600
2005 53,400
2006 69,900
Source ; CSO ‘Population and Migration Estimates’ 2006
2.9 To ignore this known recent experience would clearly be inappropriate given the material differences between the CSO projections and the actual experience. On this basis, the latest actuarial review of the Social Insurance Fund5 adopted the migration level in Table 2.3 for their central forecast.
Table 2.3 Net Inward Migration (per annum)
2006 70,000
2007 – 2010 40,000
2011 – 2015 30,000
2016 – 2025 20,000
2026 – 2061 15,000
Source: Mercer (2007)
Mortality
2.10 Future expected levels of mortality within the population are also an important factor in determining the number of people requiring pension income in future and the length of time for which they will require it. There is consensus internationally that the improvements in mortality experienced over recent decades will continue into the future. In Ireland, life expectancy at birth increased by 2.1 and 1.7 years respectively for males and females between 1996 and 2002, which represents a rapid closing of the gap in life expectancy with other EU countries. The CSO projections include projections of life expectancy to 2036 by extrapolation of recent improvements, as set out in the table below. The latest actuarial review of the Social Insurance Fund6 extended this table to 2061, assuming the rate of improvement in longevity halves over this period compared with the assumed rate over the period prior to 2036.
5 Mercer (2007)
6 Mercer (2007)
Table 2.4 Life Expectancies
2006 2036 2061
From Birth - Male 76.0 82.5 84.6
From Birth - Female 81.1 86.9 89.0
From Age 65 - Male 15.9 20.6 22.3
From Age 65 - Female 19.3 23.8 25.6
Source: Mercer (2007)
Fertility
2.11 The fertility rate7 recovered somewhat between 1994 and 2004 and is at a very high level relative to most other European countries. It was at 1.95 in 2004, which is lower than the population replacement level of 2.1 but higher than the EU 25 level of 1.5 (2003). The actuarial review8 used the medium assumption adopted by the CSO – this assumes that the total fertility rate would decrease from 1.98 in 2003 to 1.85 by 2011 and would stabilise at that level until 2036. By interpolation, the fertility rate has thus been taken to be 1.93 in 2006 reducing to 1.85 in 2011, and is maintained at this level until 2061. This would still be a relatively high fertility rate by international standards.
Labour Force Projection
2.12 A projection of the labour force is built up from the population projections, the key determinant being the rate of participation in the labour force. Participation rates are affected by factors such as the rate of unemployment, the extent to which people (particularly at younger ages) remain in full time education and the extent to which married females9, especially, participate in the labour market.
7 Based on the Total Period Fertility rate (TPFR), which is the sum of the age-specific birth rates of women in single year cohorts
8 Mercer (2007)
9 Marriage rate assumptions also feed into the participation rate assumptions; the CSO marriage rate assumptions from the ‘Population and Labour Force Projections’ are used out to 2016 which show falling rates across all ages; constant marriage rates are assumed thereafter

1�
GREEN PAPER ON Pensions
2.13 The labour force participation rates were again taken from the CSO projections, adjusted for known experience to 2006. For the period beyond 2016 (the end of the CSO projection period), participation rates were assumed to remain constant except at the older ages, when recent trends were assumed to continue, as a result of increasing longevity (for both genders) and the increased level of participation in the labour force (for females).
2.14 The labour force participation rates used are set out in Table 2.5 above.
Results of Projections
2.15 Table 2.6 above summarises the results of the population projections.
2.16 The trends identified in the last review of the Social Insurance Fund in 2000, which showed the population over pension age growing rapidly, are now even more striking. The population over age 65 will increase by 59% to 2021 and by a further 142% to 2061, although the rate of growth of this section of the population slows down in the final decade of the projection period. While the population of current working age (20-64) increases for most of this period, this increase is not as marked as the upsurge in the population over 65. In the latter years of the projection period, there is a slight fall in the working population. Reduced fertility rates (offset by the impact of assumed immigration) are the explanation for the pattern seen.
2.17 An inevitable consequence of the changes in the older and working populations shown by
Table 2.5: Labour force participation rate projections
Age 2008 2018 2026 2046 2061
Males 25 93% 93% 93% 93% 93%
35 93% 93% 93% 93% 93%
45 93% 93% 93% 93% 93%
55 77% 79% 81% 85% 88%
All Males 80% 81% 81% 82% 83%
All Females 60% 63% 64% 65% 67%
Married Females 25 69% 71% 71% 71% 71%
35 66% 74% 74% 74% 74%
45 64% 71% 74% 74% 74%
55 43% 52% 56% 64% 70%
Single Females 25 83% 85% 85% 85% 85%
35 80% 82% 82% 82% 82%
45 73% 75% 77% 81% 82%
55 54% 58% 62% 66% 66%
Source: Mercer (2007)
Table 2.6 Summary of Population Projection (000s)
Age Group 2006 2011 2021 2031 2041 2051 2061
Children (0-19) 1,165 1,242 1,408 1,372 1,316 1,366 1,367
Working Ages (20-64) 2,644 2,880 3,120 3,318 3,411 3,238 3,287
Over Pension Age (65+) 472 538 750 1,019 1,337 1,733 1,815
Total 4,281 4,660 5,278 5,709 6,063 6,337 6,469
Pensioner Support Ratio 5.6 5.4 4.2 3.3 2.6 1.9 1.8
Total Support Ratio 1.6 1.6 1.5 1.4 1.3 1.0 1.0
Source: Mercer (2007)

1�
GREEN PAPER ON Pensions
the projections is the relatively rapid and severe decline in the key parameter known as the Pensioner Support Ratio (PSR - the ratio of the number of people of working age to the number of people over pension age) from 5.6 in 2006 to 1.8 in 2061. The analysis of sustainability in Chapter 3 is based on other demographic projections that show the same pattern of changing dependency.10
2.18 Figure 2.1 compares the projected PSR with that projected for the previous Social Insurance Fund review. Independent projections11 examined developments in the PSR over time on a similar projection basis; most of the analysis was based on the ‘real PSR’, which is the ratio of people in employment to those aged 65+. It is termed the real PSR as it more accurately reflects the level of economic dependence by adjusting for participation and unemployment rates. The real PSR is considered more representative of actual economic dependency, as changes to the labour force may have significant contributing or countervailing effects on the actual level of dependency.
2.19 The real PSR is projected to fall from 4.2 currently to 1.5 by 2052. The real PSR will not decline to 1991 levels (2.9) until the 2022-2027 period. This indicates that the increasing burden,
10 The Central Scenario in Figure 2.1 is based on the migration assumption in Table 2.3, the fertility assumption in paragraph 2.11, and the life expectancy assumption in Table 2.4.
11 Goodbody Economic Consultants (2007) The Economic Implications of Demographic Change
while significant, will be within the range of recent experience for approximately another 20 years. It should be recognised, however, that the underlying population structure was more favourable in 1991 than is projected for the 2022-2027 period, as the PSR is projected to fall from 5.6 to about 3.6 (see trend in table 2.6).
Scenario Analysis
2.20 The latest actuarial review12 also carried out a number of different scenario tests for the population, based on the lower migration (adjusted for recent experience) and fertility assumptions used in the CSO projections. The resulting impacts on the PSR are summarised in Table 2.7 on the following page.
2.21 The independent projections13 produced extensive analysis of the impact of different demographic and economic assumptions on the real PSR in their analysis. Different fertility assumptions do not have any discernable impacts on the real PSR until 2032, since it takes a number of years before the increase in births feeds into the labour market. An increase in fertility levels to above the 2.1 replacement ratio will not be sufficient to prevent the real PSR from falling to low levels.
12 Mercer (2007)
13 Goodbody Economic Consultants (2007)
0
10
20
30
40
50
60
0.00
1.00
2.00
3.00
4.00
5.00
6.00
2006 2016 2021 2031 2041 2051 2061
Central Scenario 2005
2000 Review
Figure 2.110 Pensioner Support Ratio

1�
GREEN PAPER ON Pensions
2.22 High net immigration can raise the real PSR, although it cannot reverse the underlying trend. Migrant workers eventually increase pensioner numbers. Migrant inflows can be useful in moderating imbalances between those of working age and those above.
2.23 Increased female participation will bring about a temporary increase in the real PSR. The effects of increased participation are transitory.
2.24 Increases in the retirement age were found to have a significant impact on the real PSR. If the retirement age were to be increased progressively to 68 years by 2032, the real PSR would rise from 1.5 to 1.9 at the year 2052. This has the largest impact on the real PSR of any of the scenarios considered in the projections.
International demographic and labour market comparisons
2.25 The age structure of the Irish population is different to most other countries in the EU and our demographic situation is very favourable over the medium term. Ireland’s peak population age group is about 10-15 years younger than in the EU 25. However, by 2050, Ireland’s population structure will be quite similar to the rest of Europe, as can be seen in figures 2.2 and 2.3 on the following page. The impact of our higher than average projected fertility rates can be seen in lower age groups.
2.26 The Irish working age population is projected to peak at around 29% higher than its current level in 2041 and to fall back thereafter. The labour force closely follows the working age population, since there is limited scope for participation growth or falling unemployment in the Irish situation. Older workers are eventually projected to form a significant part of the labour force. The Irish working age/labour force projections differ from the EU projected scenario, where employment peaks earlier and gradually falls off to around or below its 2003 level. Rising employment rates are projected in this scenario, while the working age population falls over the period (see figure 2.4 on page 21).
Table 2.7 Pensioner Support Ratio
Scenario 2006 2011 2021 2031 2041 2051 2061
Central Scenario 5.60 4.72 4.16 3.26 2.55 1.87 1.81
2000 Actuarial Review 5.40 4.42 3.86 3.03 2.37 2.00 1.81
Lower Migration 5.60 4.50 3.88 2.93 2.21 1.57 1.58
Lower Fertility and Migration 5.60 4.50 3.88 2.91 2.15 1.50 1.47
Source: Mercer (2007)

1�
GREEN PAPER ON Pensions
Figure 2.2: Age pyramids for the Irish population in 2002 and 2052
250,000 200,000 150,000 100,000 50,000 0Population
50,000 100,000 150,000 200,000 250,000
80+75-7970-7465-6960-6455-5950-5445-4940-4435-3930-3425-2920-2415-1910-14
5-90-4
Males Females
250,000 200,000 150,000 100,000 50,000 0Population
50,000 100,000 150,000 200,000 250,000 300,000
80+75-7970-7465-6960-6455-5950-5445-4940-4435-3930-3425-2920-2415-1910-14
5-90-4
Males Females
2002
2052
Source: Goodbody Economic Consultants (2007)

�0
GREEN PAPER ON Pensions
Figure 2.3: Age pyramids for Eu25 population in 2004 and 2050
Source: Eurostat
0 50005000 1000010000 1500015000 2000020000 2500025000
0500010000150002000025000 0 5000 10000 15000 20000 25000
Males Females
80 plus75-7970-7465-6960-6455-5950-5445-4940-4435-3930-3425-2920-2415-1910-14
5-90-4
2004
05000100001500020000250003000035000 0 5000 10000 15000 20000 25000 30000 35000
0 50005000 1000010000 1500015000 2000020000 2500025000 3000030000 3500035000
80 plus75-7970-7465-6960-6455-5950-5445-4940-4435-3930-3425-2920-2415-1910-14
5-90-4
Males Females
2050

�1
GREEN PAPER ON Pensions
The Demographic ChallengeThere is a wide range of population projections for Ireland based on various demographic assumptions, which reflects the difficulty in making long-term forecasts. However, the scale of the transition from a lower to higher old age dependency ratio has been highlighted in a number of recent reports on the long term demographic pressures facing Ireland.
Net migration has been the most volatile component of Ireland’s population change since the foundation of the State. Migration patterns in Ireland have changed materially in recent years. Future levels of migration are extremely difficult to predict with any degree of certainty. Demographic assumptions in this chapter take account of the actual migration experience of recent years.
Future expected levels of mortality within the population and the labour force are also important in determining the number of people requiring pension income in the future and the length of time for which they will require it. Projections suggest that, by 2061, life expectancy at age 65 will increase by 6.4 years for men and 6.3 years for women over the current position.
The fertility rate recovered somewhat between 1994 and 2004 and is at a very high level relative to most other European countries. Projections suggest that, while decreasing, the fertility rate will remain high by international standards.
The population aged 65 and over will increase by 59% to 2021 and by a further 142% to 2061. There will be a relatively rapid and severe decline in the Pensioner Support Ratio (PSR - the ratio of the number of people of working age to the number of people over pension age) from 5.6 in 2006 to 1.8 in 2061. The analysis of sustainability in Chapter 3 is based on other demographic projections which show the same pattern of changing dependency.
Increases in the retirement age were found to have a significant impact on the ‘real’ PSR (the ratio of people in employment to those aged over 65). We would require high sustained net inward migration to reverse the underlying trend of falling PSRs. Increased female participation in the labour force will bring about a temporary increase in the real PSR.
The age structure of the Irish population is different to most other countries in the EU, and our demographic situation is relatively favourable over the medium term. The Irish working age population is projected to peak in 2041 at around 29% higher than its current level and to fall back thereafter. Older workers are eventually projected to form a significant part of the labour force.
180
200
220
240
260
280
300
320
58
60
62
64
66
68
70
72
period 2003-2011rising employment
but slow growthworking-agepopulation period
2002-2017rising
employmentdespite the decline in
working-age
from 2018 onward: employment and working-age population both declining
total employment working-age population employment rate (right scale)2003 2008 2013 2018 2023 2028 2033 2038 2043 2048
Figure 2.4: Projected working-age population and total employment, Eu25
Source: Eurostat/EPC


CHAPTER 03
a modern and susTainable
Pensions sysTem
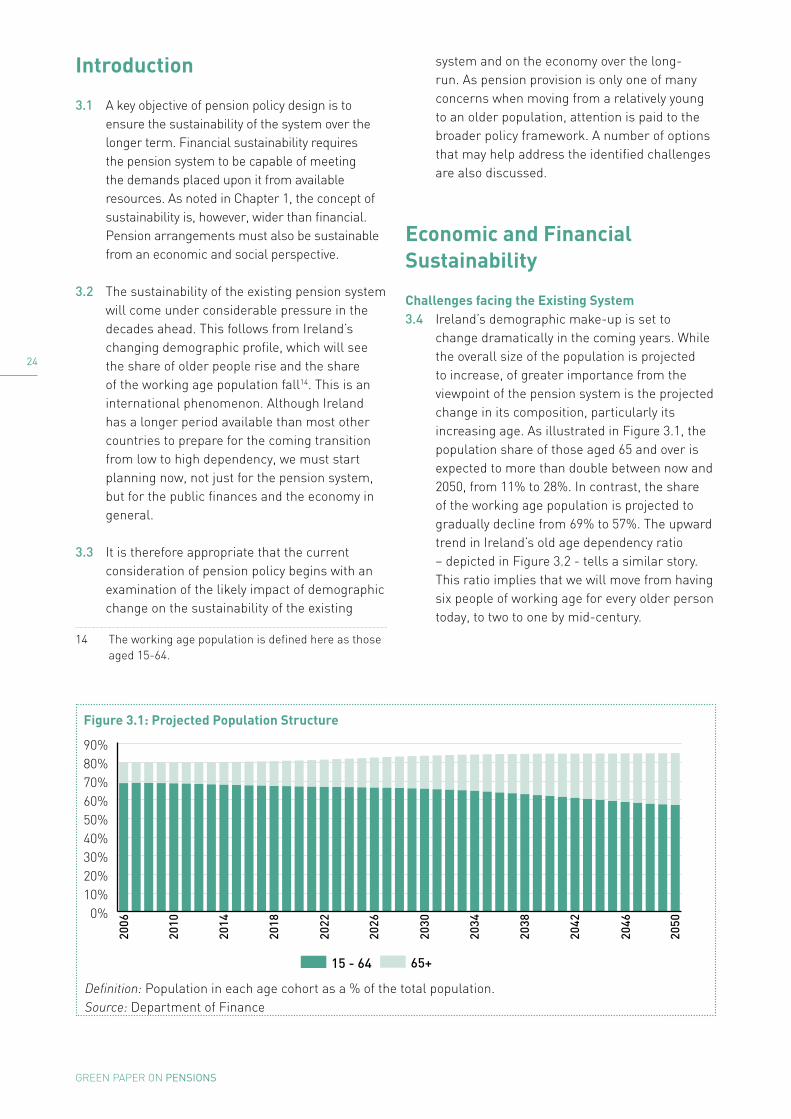
��
GREEN PAPER ON Pensions
Introduction
3.1 A key objective of pension policy design is to ensure the sustainability of the system over the longer term. Financial sustainability requires the pension system to be capable of meeting the demands placed upon it from available resources. As noted in Chapter 1, the concept of sustainability is, however, wider than financial. Pension arrangements must also be sustainable from an economic and social perspective.
3.2 The sustainability of the existing pension system will come under considerable pressure in the decades ahead. This follows from Ireland’s changing demographic profile, which will see the share of older people rise and the share of the working age population fall14. This is an international phenomenon. Although Ireland has a longer period available than most other countries to prepare for the coming transition from low to high dependency, we must start planning now, not just for the pension system, but for the public finances and the economy in general.
3.3 It is therefore appropriate that the current consideration of pension policy begins with an examination of the likely impact of demographic change on the sustainability of the existing
14 The working age population is defined here as those aged 15-64.
system and on the economy over the long-run. As pension provision is only one of many concerns when moving from a relatively young to an older population, attention is paid to the broader policy framework. A number of options that may help address the identified challenges are also discussed.
Economic and Financial Sustainability
Challenges facing the Existing System 3.4 Ireland’s demographic make-up is set to
change dramatically in the coming years. While the overall size of the population is projected to increase, of greater importance from the viewpoint of the pension system is the projected change in its composition, particularly its increasing age. As illustrated in Figure 3.1, the population share of those aged 65 and over is expected to more than double between now and 2050, from 11% to 28%. In contrast, the share of the working age population is projected to gradually decline from 69% to 57%. The upward trend in Ireland’s old age dependency ratio – depicted in Figure 3.2 - tells a similar story. This ratio implies that we will move from having six people of working age for every older person today, to two to one by mid-century.
2006
2010
2014
2018
2022
2026
2030
2034
2038
2042
2046
2050
0102030405060708090
15 - 64 65+
0%10%20%30%40%50%60%70%80%90%
Figure 3.1: Projected Population Structure
Definition: Population in each age cohort as a % of the total population.Source: Department of Finance

��
GREEN PAPER ON Pensions
3.5 These population projections were prepared by the Department of Finance taking the results of Census 2006 as the starting point and assuming a particular pattern for fertility, life expectancy and migration15. While we can say with near certainty that the number of older people will increase over time, the size of the working age population is highly sensitive to the fertility and migration assumptions made at the outset. Notwithstanding these sensitivities, the above projections serve to demonstrate the likely scale of future demographic change. Moreover, alternative projections (see Chapter 2) by the Central Statistics Office and Mercer, present a broadly similar picture of demographic change: namely an increase in the share of older people, a decline in the share of the working age population and a rise in the old age dependency ratio. This is despite somewhat different underlying assumptions.
3.6 As the population ages, age-related public expenditure will begin to rise. Recent projections provide an estimate of the magnitude of the impact that Ireland might expect in this respect16. These projections indicate that public spending on pensions, health and long-term care will increase from
15 The assumed pattern is as follows - the total fertility rate of 1.88 observed in 2005 falls to 1.80 in 2016 and remains constant thereafter; improvements in mortality continue at recent rates until 2041 and halve thereafter; net migration flows will be in the region of 45,000 per annum over the period 2007-2011, falling gradually to 10,000 per annum post 2041.
16 These projections were prepared by the Department of Finance and reflect the Department’s short-term outlook (as of summer 2007) for the economy.
around 12% of GDP (14% of GNP) today to 26% (31%) by 2050.
3.7 The magnitude of the projected increase in age-related spending is such that Ireland is considered to be at ‘medium’ risk when it comes to the long-term sustainability of the public finances. To reduce this risk, the European Council has pointed to the importance of ‘maintaining high primary surpluses over the medium term and implementing measures aimed at curbing the significant increase in age-related expenditures’17. Similarly, an analysis by the European Commission indicates that Ireland would need to run substantial budget surpluses – in the region of 5.7% of GDP – over the medium term to cope with the long-term costs of population ageing18. This would imply a reduction in spending elsewhere or a large increase in taxation, with implications for the actual growth rate of the economy.
17 European Council (2007) Council Opinion on the Updated Stability Programme of Ireland, 2006-2009.
18 European Commission (2007) Economic Assessment of the Stability Programme of Ireland (Update of December 2006).
05
101520253035404550
0%5%
10%15%20%25%30%35%40%45%50%
2006
2010
2014
2018
2022
2026
2030
2034
2038
2042
2046
2050
Figure 3.2: Projected Old Age Dependency Ratio
Definition: Population aged 65+ as a % of the population aged 15-64.Source: Department of Finance

��
GREEN PAPER ON Pensions
19202122232425
3.8 While the shift towards an older society will give rise to increased spending on health and long-term care, it is expected that the majority of the rise in age-related public expenditure will be accounted for by pensions. Spending on public pensions (Social Welfare and Public Service occupational pensions) is projected to increase
19 OECD (2007) OECD Economic Outlook No 81.
20 Barrett, A. and Bergin, A. (2005) ‘Assessing Age-Related Pressures on the Public Finances, 2005 to 2050’. Budget Perspectives 2006.
21 Botman, D. and Iakova, D. (2007) Policy Challenges of Population Ageing in Ireland.
22 Economic Policy Committee & European Commission (2006) The impact of ageing on public expenditure: projections for the EU25 Member States on pensions, health care, long-term care, education and unemployment transfers (2004-2050).
23 The Pensions Board (2006) National Pensions Review.
24 Mercer Human Resource Consulting (2007) Actuarial Review of the Social Insurance Fund 2005.
25 See footnote 22.
from roughly 5% of GDP (6% of GNP) at present, to 13% (15%) by 205026. Of this increase, over two-thirds can be attributed to the Social Welfare component of the pension system, with the Public Service element accounting for the remainder.
3.9 This rise in public pension expenditure is the equivalent of €12 billion in 2007 present value terms27. In the absence of countervailing policies, an increase of this scale would lead to a deterioration in the General Government Balance of 6.1 percentage points of GDP28.
26 These projections were prepared by the Department of Finance on the basis of work carried out at EU level by the Economic Policy Committee and the EU Commission. They reflect the Department’s short-term outlook (as of summer 2007) for the economy.
27 The present value of pension spending in 2050 was calculated using a 3% discount rate.
28 This calculation is based on figures provided by the Department of Finance.
Box 3.1: Demographic Change and Age-Related Public Spending
Long-term projections of this nature have also been undertaken by the OECD for the period 2005-205019. Allowing for differences in methodology and underlying demographic and other assumptions, the projected rise in public spending on pensions, health and long-term care (14.4 percentage points) in the OECD report is largely in line with that set out above (14.2 percentage points). Studies carried out by the ESRI20, the IMF21, and at EU level by the Economic Policy Committee and the EU Commission22, report similar findings. These also suggest that relatively minor savings may be possible in respect of some age-related aggregates, namely education spending.
As pensions are expected to account for the bulk of the increase in age-related expenditure, a number of recent studies have paid particular attention to trends in pension spending. As illustrated below, these present a similar picture of rising costs (notwithstanding the use of varying demographic assumptions and methodological approaches).
Public Pension Spending Projections % of GNP
2006 2016 2026 2036 2046 2056
Department of Finance n/a 7.4 9.1 11.1 14.2 n/a
EPC & the Commission 5.8 7.3 8.8 10.4 12.6 n/a
National Pensions Review23 4.3 5.8 7.7 9.8 12.3 13.8
Mercer (Social Insurance only)24 2.4 3.0 4.4 6.1 8.0 8.9
As in Ireland, rising public pension spending is a concern in many countries. Although Ireland has a longer timeframe than most to prepare for the coming challenge, the increase that we are set to experience over the period to 2050 is roughly three times greater than the European average25. While this primarily reflects Ireland’s lagging demographic profile, the effect of cost-reducing reforms in other European countries also plays a part.

��
GREEN PAPER ON Pensions
Taking account of the build-up of debt out to 2050, the deterioration in the General Government Balance would be much greater. This is not a sustainable position, and although alternative projections to those presented here could be chosen, this broad outcome would remain the same.
3.10 The projected longer term path for public pension spending is graphed in Figure 3.3. The projection methodology takes on board the recent Programme for Government commitments to provide personal pension payments to pensioner spouses in receipt of the Qualified Adult Allowance; to extend the Age Allowance to Qualified Adults over 80 years old; and to increase Social Welfare pension payments to €300 per week by 2012. Thereafter, payments are assumed to rise in line with nominal earnings. This is to ensure that the position of pensioners relative to workers does not worsen over time – in the case of the State Pension (Contributory), this translates into a payment of roughly €550 per week (in real terms) by 2050. The impact of moving towards a more contributory based Social Welfare system is also modelled. While these factors account for some of the upward trend in pension spending, the bulk of the increase is attributable to demographic effects.
3.11 A further consequence of demographic change is that the task of financing increasing pension spending will fall to a diminishing share of the population. The public pension system is largely funded on a ‘pay as you go’ basis, that is, contributions made by today’s workforce
are used to meet existing pension liabilities. By 2050 however, not only will pension costs have significantly increased, but there will be fewer than two workers per pensioner.
3.12 Taken together, these changes in the
composition of the population imply a mismatch between the spending demands facing the public pension system and its ability to meet these demands. On the positive side, the assets accumulated in the National Pensions Reserve Fund (NPRF) will be available for drawdown from 2025 onwards. The NPRF was established in 2000 with the objective of pre-funding in part the future Exchequer cost of Social Welfare and Public Service occupational pensions. A statutory obligation was placed on the Exchequer to pay a sum equivalent to 1% of GNP into the Fund each year from 2001 until at least 2055, with drawdowns prohibited prior to 2025. The market value of the NPRF at end-2006 was €18.9 billion and it is estimated that in 2050, assets amounting to roughly 3% of GNP will be available for drawdown29. While these assets will go some way towards easing funding concerns, they fall far short of the projected 2050 pension liability of 15% of GNP. As such, the bulk of the funding gap will have to be met by the Exchequer. An alternative is to pursue options which reduce the size of the gap.
29 This estimate is of course sensitive to the chosen rate of return and to the drawdown pattern assumed. See Economic Policy Committee & European Commission (2006) The impact of ageing on public expenditure: projections for the EU25 Member States on pensions, health care, long-term care, education and employment transfers (2004-2050).
0
2
4
6
8
10
12
14
0%
2%
4%
6%
8%
10%
12%
14%
2007
2010
2013
2016
2019
2022
2025
2028
2031
2034
2037
2040
2043
2046
2049
Total
Social Welfare
Public Service
Figure 3.3: Public Pension Spending Projections (% of GDP)
Source: Department of Finance

��
GREEN PAPER ON Pensions
These are discussed below under the heading ‘Meeting the Challenges’.
3.13 Turning to private pension provision, Ireland’s changing demographic profile will also have implications for the manner in which the Exchequer provides tax relief to encourage supplementary coverage. At present, incentives for private saving are skewed towards older age cohorts. As the population ages, these cohorts will account for an increasing share of the total. Thus, a large proportion of the population will be able to avail of tax relief at a time when public pension costs are rising and the public finances are not best placed to forgo this tax.
Meeting the Challenges
3.14 Clearly, the changing composition of the population will pose significant challenges for the long-term sustainability of the pension system. Our ability to meet these challenges will depend on the implementation of appropriate and timely policy responses. In broad terms, the available options are:
l Increasing Exchequer and / or private savings;
l Easing upward spending pressures;
l Raising the retirement age;
l Increasing the share of the population at work;
l Improving the productive capacity of the economy.
In considering which approach, or combination of approaches, to pursue, it will be necessary to bear in mind the wider implications of the various options for the public finances and the economy.
3.15 In particular, securing the sustainability of the public pension system over the longer term will require measures aimed at financing or reducing the size of the projected funding gap. Financing the gap would require an adjustment either on the tax side (taxes would have to be raised) or on the expenditure side (spending elsewhere would have to fall).
3.16 The wider impact of such an adjustment can be illustrated by analysing the macroeconomic effects of raising - by means of higher taxation - the extra €12 billion (in 2007 present value terms) needed to fund pension spending in 2050 alone. As Figure 3.4 shows, an adjustment of this scale would have a negative impact on personal consumption and savings as well as distorting labour market incentives. As a result, it is estimated that both employment and economic output could be up to 6% lower than otherwise. A higher cost base would also serve to undermine Ireland’s competitiveness and attractiveness as an investment location. However, additional taxes on this scale could have substantially greater effects than an economic model could capture.30 As a result, some restructuring of the economy might
30 See ESRI (2006) Economic Impact of Various Mandatory Systems in Pensions Board (2006) Special Savings for Retirement.
First year
0
5
10
15
20
25
0.00
-5.00
-10.00
-15.00
-20.00
-25.00
Consumption GDPTotal
investmentLabourforce
Savingsrate
Totalemployment
Second year Third year Fourth year Fifth year
% d % d % d % d d % d
Figure 3.4: Illustrative Macroeconomic Effects of Increasing Taxes to Raise an Extra €12 billion
Definition: d = change; %d = change in percentage terms. Source: Department of Finance

��
GREEN PAPER ON Pensions
occur, though much would depend on the type of tax change.
3.17 With respect to timing, the Exchequer could opt to meet pension liabilities as they arise, or frontload looming pension costs by running budget surpluses or pre-funding along the lines of the National Pensions Reserve Fund. While raising taxation today and setting aside the funds would have an adverse effect on the economy, by postponing the necessary adjustment into the future, subsequent tax increases will be even higher. Moreover, a rising share of older people and a fall in the population share of working age will lead to slower economic growth - by the mid-2030s, employment growth is expected to have turned negative, with a declining growth trend also projected for labour productivity31. In these circumstances, raising taxes will arguably have more injurious consequences.
3.18 If pursued, a frontloading approach could however lead to misappropriation concerns. In light of this, it would be necessary to ensure that any additional revenue raised by the Exchequer to meet the projected funding gap be used for that purpose. To protect against the temptation to draw on these funds for other reasons, adequate restrictions would have to be put in place.
3.19 While raising taxes is one possible means of addressing the financing imbalance, there are clearly drawbacks to this approach. Given these, another possible option would be to reduce spending elsewhere, although the largely growth-orientated nature of current Exchequer spending means that pursuing this option is not as straightforward as it may seem. For example, appropriate investment over the short to medium term is needed to boost the productive capacity of the economy. Such investment will improve competitiveness and help to sustain economic growth into the future. This, in turn, will place the public finances in a better position to meet the pensions funding gap.
31 Economic Policy Committee & European Commission (2006) The impact of ageing on public expenditure: projections for the EU25 Member States on pensions, health care, long-term care, education and unemployment transfers (2004-2050).
3.20 Of course, some resource reallocation may be possible over the longer term. In particular, it is anticipated that the present high level of capital spending will fall as Ireland’s infrastructural deficit is reduced. While this would free up funds, potential savings in this and other areas will not be sufficient to offset the projected increase in spending on pensions and other age-related aggregates. A recent analysis by the ESRI makes this point32. This projects a General Government deficit in 2050 of more than 2% of GNP. This is after assuming a fall in capital and education expenditure and allowing for a rise in the tax share from 29% of GNP in 2005 to 33.3% by 2050. Moreover, given recent spending commitments, such potential savings may not in fact materialise.
3.21 As an alternative to meeting increased pension costs by raising taxation or reducing spending elsewhere, measures to improve the sustainability of the public pension system, or reduce the size of the gap, should be considered. A number of options, including curtailing the growth in pension payments, increasing social insurance contributions and raising the statutory retirement age, are considered in this Green Paper. Of these, curtailing benefits would run counter to the adequacy objective. On the other hand, indexing to prices would keep payments at the same level in real terms.
3.22 Increasing the retirement age is also an option given rising life expectancy. In 2004, life expectancy for males / females aged 65 was 15.4 / 18.6 years. By 2050, EUROSTAT project that this will have risen to 20.2 / 23.4 years respectively33. In this context, raising the retirement age would be an effective approach. Such a step would allow for contributions over a longer time period and, if the number of years in retirement was held constant at today’s average, would considerably ease spending pressures.
32 Barrett, A. and Bergin, A. (2005) ‘Assessing Age-Related Pressures on the Public Finances, 2005 to 2050’. Budget Perspectives 2006.
33 Economic Policy Committee & European Commission (2005) The 2005 EPC Budgetary Projections Exercise: Agreed Underlying Assumptions and Projection Methodologies.

�0
GREEN PAPER ON Pensions
3.23 Pension system reforms involving increases in the retirement age are becoming increasingly common across European countries, as are rewards in the form of higher entitlements for deferring retirement and penalties for retiring early. Of course, any moves in this direction would need to be introduced on a phased basis. This and other issues surrounding a potential increase in the statutory retirement age in Ireland are discussed in detail in Chapter 14. However, by way of illustrating the potential savings from such an approach, a sensitivity analysis on the projections set out in Figure 3.3 shows that if the statutory retirement age were increased by one year per decade from 2026 onwards, the projected increase in Social Welfare pension costs between now and 2050 would fall by around €1 billion (in 2007 present value terms).
3.24 More generally, putting in place policy measures that aim to increase the share of the population at work (family supports, removing barriers to employment, migration, etc.) as well as improving the economy’s productive capacity and overall competitiveness, will be of benefit in meeting future challenges. Figures set out in Table 3.1 above illustrate this point. These show the impact of alternative scenarios on public pension spending relative to the baseline projections graphed in Figure 3.3. As is evident from this table, higher net migration and an unchanged fertility rate lead to lower public pension spending as a percentage of GDP than would otherwise be the case. While of value, the scale of these effects indicates that such factors are likely to play only a partial role in addressing the sustainability challenge.
3.25 Overall, given the magnitude of the task, it is unlikely that any one of the options discussed in
sections 3.14 to 3.24 will be sufficient to secure the long-term sustainability of the pension system. Instead, a combination of some or all may be required. In this context, it should be borne in mind that these challenges will not materialise in full for some time yet. As such, a ‘window of opportunity’ exists in which the public finances and the economy have time to adjust. Moreover, as the debate progresses, it will be important to ensure that the budgetary and economic considerations set out above form the backdrop to the chosen policy response.
Changes to the Existing System
3.26 While the discussion so far has focused on the challenges facing the existing pension system, it will also be necessary to consider the sustainability implications of the policy options outlined in later chapters.
3.27 By way of illustration, a sensitivity analysis on the projections presented in figure 3.3 shows that even relatively modest changes to the level of pension provision would have significant longer term effects. For example, an increase in the Social Welfare pension to 40% of Gross Average Industrial Earnings (GAIE) would require an extra €1 billion (in 2007 present value terms) in order to meet pension liabilities in 2050 alone. This is on top of existing pension costs and the additional €12 billion needed to cover costs arising from demographic change. A more significant increase to 50% of GAIE would add an extra €5 billion to overall costs. If financed by means of increased taxation, the economic consequences illustrated in section 3.16 would be even more pronounced.
Table 3.1: Impact of Alternative Scenarios on Public Pension Spending Projections (% point of GDP)
2015 2020 2030 2040 2050
Higher Net Migration -0.04 -0.14 -0.41 -0.68 -0.94
Unchanged Fertility Rate 0.00 0.00 -0.01 -0.09 -0.22
Definition: Negative figures indicate a percentage point decrease relative to the baseline public pension expenditure projections graphed in Figure 3.3. It is assumed that the total fertility rate of 1.88 observed in 2005 remains constant throughout the projection period and that net migration flows will be in the region of 45,000 per annum over the period 2007-2011, falling gradually to 20,000 per annum post 2041.
Source: Department of Finance

�1
GREEN PAPER ON Pensions
3.28 As is evident from this simple illustration, any changes in pension provision can have profound long term financial consequences. For this reason, policy changes that seek to improve the pension system should have regard to reforms to the public pension system, including key issues such as the retirement age.
3.29 Similarly, policy changes to encourage supplementary pension coverage, such as extending tax relief, will have longer term impacts that require careful assessment.
Conclusion
3.30 A central objective of pension policy design is to ensure the sustainability of the system over the longer term. As discussed above, demographic change means that the existing pension system is simply not sustainable. In light of this, the current consideration of pension policy needs to cover not only the scope and adequacy of benefits, but also funding arrangements.
3.31 In safeguarding the pension system into the future, the next step will be to consider how we put in place appropriate measures. In broad terms, the available options are:
l Increasing Exchequer savings (raising taxes or reducing spending elsewhere) and / or private savings;
l Easing upward spending pressures;
l Raising the retirement age;
l Increasing the share of the population at work;
l Improving the productive capacity of the economy.
In considering which policy responses to pursue, due attention needs to be paid to the public finance and economy-wide implications of the various options, particularly their effect on competitiveness.
3.32 Timeliness should also be a key concern when moving forward. In particular, if we are to secure the long-term sustainability of the pension system, we must take action before the challenges of an ageing society fully materialise and our ability to act is either limited or our
actions have more injurious consequences. This suggests that we take advantage of the current fiscal and demographic ‘window of opportunity’ to pursue appropriate policy responses. Doing so will place the economy and the public finances in a better position to cope with future spending pressures.
3.33 Finally, when considering modifications to the existing pension system, a set of criteria against which all proposed changes should be examined, needs to be drawn up. Inter alia, this should include:
l Funding arrangements;
l The public finance and economic implications of the policy change;
l Timeliness;
l The wider policy framework.
Social Sustainability
3.34 Social sustainability is not as straightforward to define or project as economic or financial sustainability. However, there are clearly some current social trends that will impact on future pensioners’ welfare. These trends include supplementary coverage levels, family formation patterns and home ownership developments. This section attempts to assess the implications of these developments for public policy in the long term.
3.35 Demographic ageing is a social success and an economic challenge. Increasing life expectancy is a highly valued social outcome, and is clear evidence of successful policies across the social domain. The costs of this success, however, will have to be borne by the working population. There will have to be some level of re-allocation of resources between the generations as a result. This will either be done formally through taxes and Social Welfare, or otherwise through asset sales by pensioners to people at work. The economic costs of ageing need to be balanced against the social costs of not dealing with pension provision. These potential costs include:
l 38% of employees aged 30-65 have no supplementary pension, and a further 20% of people in this age group are not employed. The current Social Welfare pension is at

��
GREEN PAPER ON Pensions
around the level of the risk of poverty line (60% of median income). Around half of the working age population could be at risk of poverty in retirement under current pension arrangements (though other sources of wealth and income-sharing in pensioner households would lessen this risk). This translates into around 750,000 pensioners in 2056. This would result in pressure for state intervention to make up for system failures;
l It would be difficult at that stage to respond to this pressure given the strain on public finances due to ageing;
l Over 90% of pensioners are owner occupiers without mortgages at present. Future pensioners are more likely to have housing costs if home ownership declines and mortgage terms continue to extend;
l Current workers are likely to have had higher lifetime earnings than current pensioners, and are also likely to have more expensive lifestyles. The drop in living standards at retirement for future pensioners could be exacerbated by both factors;
l Current pensioners are experiencing rapidly rising real Social Welfare incomes;
l Women have lower coverage, earnings and employment rates than men. Women’s entitlements to pensions will become an even more important issue over time as marriage breakdowns become increasingly prevalent;
l Family supports are an important feature of Irish society at present, and could be expected to be relatively more important for low income pensioner households. This might not be the case in future, due to changes in family formation and lower fertility.

��
GREEN PAPER ON Pensions
A Modern and Sustainable Pensions System
A key objective of pension policy design is to ensure the sustainability of the system over the longer term. For many countries, including Ireland, a growing concern in this respect is demographic change.
The projected ageing of the population will give rise to a substantial increase in age-related expenditure, of which pension provision is expected to be the single largest component. Recent projections indicate that spending on this age-related aggregate will increase from roughly 5% of GDP today to 13% by 2050. This is the equivalent of a €12 billion increase in 2007 present value terms.
A further consequence of demographic change is that the task of financing increasing pension spending will fall to a diminishing share of the population. By 2050, it is projected that there will be fewer than two workers per pensioner.
Taken together, these changes in the composition of the population imply a mismatch between the spending demands facing the public pension system and its ability to meet those demands (notwithstanding the accumulation of assets in the National Pensions Reserve Fund). In short, the existing system is not sustainable on the basis of current projections, without adjustments to the overall policy mix.
To safeguard the pension system into the future, a combination of measures aimed at financing and reducing the size of the projected funding gap will be required. In broad terms, the available options are:
l Increasing Exchequer savings (raising taxes or reducing spending elsewhere) and/or private savings;
l Easing upward spending pressures;
l Raising the retirement age;
l Increasing the share of the population at work;
l Improving the economy’s productive capacity and overall competitiveness.
Meeting future challenges will clearly require major policy choices on our part. In making these choices, it will be important to recognise the trade-offs that exist, and to take advantage of the current ‘window of opportunity’, so as to put in place an appropriate and timely policy mix. This should aim to secure the financial and social sustainability of the pension system, with minimum disruption to the wider economy.


CHAPTER 04
mainTaining inCome adequaCy in reTiremenT

��
GREEN PAPER ON Pensions
Introduction
4.1 Pensioners’ living standards are supported by the pensions system, through Social Welfare pensions and tax-supported supplementary pensions. In addition, some pensioners have income from non-pension investments and some continue to work to supplement their pensions. People of working age are also building up pensions and investments to fund their retirement provision. This chapter firstly looks at the incomes of current pensioners with comparison of incomes by household types, age and gender. It then examines the distribution of pensioners’ incomes by source. It also discusses the trends in consistent poverty and the “risk of poverty” for older people. Retirement income expectations of the current labour force are outlined. This is discussed in the context of data on current working age savings and pension provision. This discussion covers replacement income in retirement, the role of other arrangements and supports (including non-pension savings), supplementary pension coverage, and defined contribution and PRSA adequacy. The chapter concludes with international comparisons of pensioners’ incomes.
Current pensioners’ incomes (Eu-SILC)34
4.2 This section examines incomes of current pensioners. Average incomes for various groups of pensioners are compared, and the income sources from which pensioners draw their incomes are also analysed.
4.3 The average net income for a pensioner unit35
34 All statistics are taken from the 2005 EU-SILC survey - the most recent available source of household income data.
35 Pensioner units are either single pensioner households where the person is aged 65 and over or pensioner couples where the male spouse/partner is aged 65 and over. All pensioner units are included regardless of household composition, but only the income of the pensioner/couple is included in this analysis. There were 750 pensioner couples and 1,498 single pensioners available for this analysis, which is broadly representative of the overall pensioner population (around half of people aged over 65 in their own private homes are single pensioners).
in 2005 was €327.55 per week, compared to net average weekly incomes for all households in the population of €776.11. Social Welfare pensions are the main source of income for Irish pensioners; they account for 53.9% of overall gross income (before taxes). Occupational/personal pensions (including public service pensions) are the next most important contributor to pensioners’ incomes, accounting for 24.2% of income. Income from work and self-employment36 is also a relatively important income source for pensioners, providing 11.2% of income. By contrast, income from work and self-employment accounts for 78% of gross household income for the population overall37. Other direct income, including investment income, and other social benefits are of less importance to pensioners. However, since drawdowns of wealth (e.g. from property sales or withdrawal of savings) are not included in the income statistics, the contribution of investments to pensioners’ living standards is likely to be understated. Taxes are of relatively low significance for pensioner households, due to their lower incomes and the relatively favourable tax treatment of older people.
4.4 Gross incomes for single pensioners are around half those of pensioner couples, although the composition of incomes for the two household types is quite different. Social Welfare pensions form a much higher share of single pensioners’ average incomes than of couples’ incomes (62.2% compared to 45.9%), while income from work and occupational/personal pensions are relatively more important for couples.
36 Includes employer’s contribution to social insurance; this is subsequently deducted as part of tax on income and social contributions to calculate net incomes, and is minor for pensioners in any case
37 Also from EU-SILC 2005

��
GREEN PAPER ON Pensions
4.5 Single pensioners have significantly more than half of the average Social Welfare pension of pensioner couples. This is partly due to the Qualified Adult Allowance (QAA) for contributory pensions being lower than the full pension rate. In addition, the QAA is means tested, which may further reduce pensioner couples’ incomes relative to single pensioners on an individualised basis38. Differences in work and supplementary pension incomes are difficult to analyse based on household composition alone.
4.6 Marital status and age are closely related, since single pensioners have an older age profile than pensioner couples. One third of people aged 65-69 are single or widowed while two thirds of people aged 75+ are single or widowed39.
4.7 There are important age-related differences in pensioners’ incomes, which are set out in Table 4.2 on the following page. Income from work and self-employment is concentrated in the youngest age categories, and is of particular importance for pensioner couples with a male spouse/partner aged 65-69. This is balanced to some extent by relatively low Social Welfare incomes for the same pensioner group, and working spouses could account for some of the higher work income and lower Social Welfare income. Otherwise, Social
38 Other possible explanations for the higher individualised Social Welfare incomes of single pensioners include the presence of working spouses in pensioner couple households, whether pensioners without Social Welfare entitlements (mainly former public servants) live predominantly in couple arrangements or alone and whether couples generally have higher means than single pensioners
39 Census 2002
Welfare incomes are not strongly differentiated by age for both types of pensioner household. The ‘Living Alone’ and ‘Over 80’ allowances paid on top of Social Welfare pensions would predominantly benefit pensioners in older age groups, and this is reflected in their higher Social Welfare incomes.
4.8 Occupational/personal pensions fall dramatically in importance for pensioner couples as age rises, while the pattern is not so clear for single pensioners. For single pensioners, the younger age cohort of pensioners is different in composition to the older age cohort, and widows account for a larger share of the older age categories. For pensioner couples, the decline in importance of occupational pension with age is likely to be caused by a number of factors.
i) The supplementary pensions system in Ireland is relatively immature. Hughes and Whelan40 (1996) estimated that almost half of all occupational pension schemes in existence in 1994 were set up in the previous decade, just over 23% were set up in the period 1961 – 75, a further 24% dated from the period 1976 – 85 and less than 10% were established before 1960. Supplementary coverage of older pensioners is likely to have been lower than for younger pensioners.
ii) While Social Welfare pensions have generally risen in line with earnings, the situation is less clear for occupational/personal pensions in payment. Public service pensions have
40 Hughes, G. and Whelan, B. (1996), ‘Occupational and Personal Pension Coverage 1995’, Economic and Social Research Institute
Table 4.1: Pensioner unit incomes (€) classified by pensioner unit type
Pensioner unit type Couple Single All
Income from work and self employment 80.07 16.94 38.28
Other direct income (investment income, etc.) 29.22 11.88 17.74
Occupational/personal pensions 143.82 51.82 82.92
Social Welfare pensions 238.67 157.41 184.88
Other benefits 27.64 15.06 19.32
Total gross income 519.42 253.11 343.13
Tax and social contributions 31.16 7.62 15.57
Net disposable income 488.26 245.49 327.55
A pensioner couple refers to a couple where the male partner is aged 65+.Incomes are based on the combined income of the couple. Source: Special analysis of 2005 EU-SILC survey provided by CSO.

��
GREEN PAPER ON Pensions
Table 4.2: Pensioner unit incomes (€) classified by age
Age of head of household 65-69 70-74 75+ All
All pensioner units
Income from work and self employment 105.51 27.48 9.15 38.28
Other direct income (investment income, etc.) 23.84 12.73 17.23 17.74
Occupational/personal pensions 110.62 100.03 59.48 82.92
Social welfare pensions 172.41 187.55 189.92 184.88
Other benefits 23.58 19.91 16.79 19.32
Total gross income 435.95 347.69 292.58 343.13
Tax and social contributions 33.14 12.74 7.97 15.57
Net disposable income 402.81 334.95 284.61 327.55
Pensioner couples
Income from work and self employment 164.55 46.24 25.23 80.07
Other direct income (investment income, etc.) 35.44 21.04 29.66 29.22
Occupational/personal pensions 174.27 162.61 99.59 143.82
Social welfare pensions 199.90 247.50 269.11 238.67
Other benefits 35.00 26.86 21.16 27.64
Total gross income 609.17 504.26 444.76 519.42
Tax and social contributions 57.05 20.84 14.32 31.16
Net disposable income 552.12 483.42 430.44 488.26
Single pensioners
Income from work and self employment 53.54 16.26 3.75 16.94
Other direct income (investment income, etc.) 13.62 7.76 13.06 11.88
Occupational/personal pensions 54.61 62.61 46.01 51.82
Social welfare pensions 148.21 151.70 163.33 157.41
Other benefits 13.53 15.75 15.33 15.06
Total gross income 283.51 254.08 241.47 253.11
Tax and social contributions 12.10 7.90 5.84 7.62
Net disposable income 271.40 246.18 235.63 245.49
A pensioner unit refers to a single person aged 65+ or a couple where the male partner is aged 65+.
Incomes are based on the combined income of the couple. For couples, the age of the male is used.
Source: Special analysis of 2005 EU-SILC survey provided by the CSO.
Table 4.3: Single pensioner incomes (€) classified by sex
Pensioner unit type Male Female All
Income from work and self employment 33.72 8.77 16.94
Other direct income (investment income, etc) 13.35 11.16 11.88
Occupational/personal pensions 74.36 40.85 51.82
Social welfare pensions 153.03 159.54 157.41
Other benefits 14.81 15.19 15.06
Total gross income 289.27 235.51 253.11
Tax and social contributions 11.78 5.59 7.62
Net disposable income 277.50 229.92 245.49
Source: Special analysis of 2005 EU-SILC survey provided by CSO

��
GREEN PAPER ON Pensions
increased in line with public service earnings, while occupational schemes tend to offer increases in line with consumer prices (CPI) or CPI subject to a cap41. Most annuities sold in the Irish market are not indexed at all, so their real value diminishes over time.
4.9 Pensioner incomes also vary by gender. Single pensioners are specifically analysed in Table 4.3 above, since it can be difficult to break down pensioner couples’ incomes between the male and female spouse/partner. While female single pensioners have slightly higher Social Welfare incomes than male single pensioners, their income from work and self-employment and occupational/personal pension income is substantially lower. There is also an age dimension to this comparison, since single female pensioners have an older age profile than their male counterparts due to the gender gap in life expectancy.
4.10 The comparisons of household incomes so far have been based on average incomes for various groups of pensioners. It is also useful to examine the income distribution of pensioner households to see whether pensioners tend to be close to the average level, and to analyse which income sources contribute to relatively high or low incomes.
4.11 In the bottom quintile (or one-fifth) of the income distribution for pensioner units, below an income level of €183.97, the average gross income is €156.61. Incomes in this quintile are predominantly from Social Welfare pensions (84.2%), with other sources being of minor importance. The average gross income for single pensioners in this quintile, who have incomes below €175.73, is slightly lower than the non-contributory pension rate of €154 in 200442. A
similar picture emerges for pensioner couples in
41 IAPF benefits survey 2002
42 The income year used in the EU-SILC survey depends on the date of the interview; for a person interviewed in January 2005, their income would be based on the period January 2004-January 2005.For this reason, the 2004 Social Welfare rate is the most appropriate comparison for low income pensioners in the 2005 survey results. Pensioners in this quintile could have a lower Social Welfare income than the non-contributory pension level for a variety of reasons, including the assets means test in operation for non-contributory pensions.
the lowest quintile, who have a combined income of less than €314.44. Low income pensioner couples are almost as heavily dependent on Social Welfare pensions as single pensioners.
4.12 The next quintile of pensioners in both household types has higher Social Welfare pensions than in the bottom quintile, but has similarly low incomes from other sources. Social Welfare incomes account for 85-90% of household incomes at this level.
4.13 From the third quintile and above for pensioner couples, other income sources become much more important, with income from work and self-employment and occupational/personal pensions becoming the main income sources in the top quintile. The income distribution of single pensioners shows a steadier increase, and work incomes and occupational/personal pensions mainly feature in the top quintile.
4.14 Occupational/personal pension income becomes significant for the top 40% of pensioner units, who have incomes above €304.73. For the top quintile of pensioner units (incomes above €425.48), all income sources contribute strongly to pensioners’ incomes, and pensioners at this income level could either have high incomes from one source or could be drawing income from multiple sources.
4.15 31.6% of pensioner units in the State have income from occupational/personal pensions but relatively few pensioners in the bottom two quintiles have income from this source. Occupational or personal pensions rise in importance as an income source through the next three quintiles as incomes rise (31.5%, 42.9% and 70.3% of pensioner units in each quintile respectively).
4.16 Social Welfare pensions are paid to most pensioner units (90.8% overall), with the lowest and highest quintiles showing slightly lower coverage. 13.1% of pensioner units have income from work and self-employment, and they are particularly concentrated at higher income levels. The distribution of pensioners with other direct income (investment income, etc.) is quite similar to those with occupational/personal pensions, but the overall share of units with income from this source is lower at 17.4%.

�0
GREEN PAPER ON Pensions
Table 4.4: Pensioner unit incomes (x) classified by net disposable income quintiles, 2005
Quintile ranges Quintile 1 Quintile 2 Quintile 3 Quintile 4 Quintile 5 State
All pensioner units by weekly threshold (); <183.97 -206.08 -304.73 -425.48 >425.48
Income from work and self employment 3.37 1.67 7.64 15.71 163.14 38.28
Other direct income (investment income, etc.)
3.61 2.18 8.62 7.87 66.47 17.74
Occupational/personal pensions 5.99 2.05 27.29 64.14 315.39 82.92
Social welfare pensions 131.82 172.71 180.86 248.51 190.59 184.88
Other benefits 11.82 16.97 22.97 25.37 19.47 19.32
Total gross income 156.61 195.58 247.38 361.60 755.06 343.13
Tax and social contributions 3.31 0.21 3.05 3.59 67.76 15.57
Net disposable income 153.29 195.37 244.33 358.01 687.30 327.55
% of units with income from work/self employment
5.2 2.6 8.0 13.1 36.8 13.1
% of units with other direct income (investment etc)
8.6 9.6 21.2 17.6 43.0 17.4
% of units with occupational/personal pensions
8.3 4.9 31.5 42.9 70.3 31.6
% of units with Social Welfare pensions 87.7 98.7 93.4 94.8 79.6 90.8
Pensioner couples by weekly threshold (); <314.44 -355.80 -445.95 -630.80 >630.80
Income from work and self employment 6.16 7.58 25.31 79.52 282.29 80.07
Other direct income (investment income, etc)
8.88 1.64 7.67 27.29 100.76 29.22
Occupational/personal pensions 15.46 9.38 41.59 190.66 462.77 143.82
Social welfare pensions 187.61 288.83 289.19 223.56 204.31 238.67
Other benefits 35.43 32.34 30.12 22.70 17.59 27.64
Total gross income 253.54 339.76 393.88 543.73 1067.73 519.42
Tax and social contributions 7.67 0.05 4.04 13.29 130.96 31.16
Net disposable income 245.87 339.72 389.84 530.44 936.76 488.26
Single pensioners by weekly threshold (); <175.73 -193.34 -208.06 -285.86 >285.86
Income from work and self employment 4.11 2.00 1.08 7.62 70.10 16.94
Other direct income (investment income, etc)
3.51 0.98 2.32 9.44 43.29 11.88
Occupational/personal pensions 4.79 2.53 1.91 28.40 222.22 51.82
Social welfare pensions 123.88 166.52 177.20 173.09 146.33 157.41
Other benefits 8.86 13.61 18.28 20.20 14.39 15.06
Total gross income 145.15 185.64 200.79 238.75 496.32 253.11
Tax and social contributions 1.93 0.12 0.20 2.47 33.46 7.62
Net disposable income 143.22 185.52 200.59 236.28 462.86 245.49
A pensioner unit refers to a single person aged 65+ or a couple where the male partner is 65+.
Incomes are based on the combined income of the couple.
Source: Special analysis of 2005 EU-SILC survey provided by CSO.

�1
GREEN PAPER ON Pensions
Retirement income expectations for people of working age
4.17 The Social Welfare pension is the main source of retirement income for the current generation of pensioners. This can be at least partially attributed to the limited coverage of the social insurance system up until the late 1980s and early 1990s (see Chapter 5), an immature supplementary pensions system and broken career patterns feeding into current pensioners’ incomes. Low participation rates (especially for women), widespread periods of emigration and our traditional dependence on farming have resulted in high numbers of people qualifying for non-contributory pensions up to now.
4.18 The same factors, in addition to low career earnings levels and immaturity of supplementary pensions43, have resulted in low retirement savings among pensioners. While the level of retirement savings among pensioners may be low, the IMF (October 2005) have also concluded that Irish savings do not necessarily decrease beyond retirement age and in fact continuously increase as consumption profiles fall much faster than income after retirement. Pensioners also hold high levels of housing wealth, but this cannot be easily drawn down or consumed as financial/pension wealth for a number of possible reasons, including:
l Pensioners may prefer to pass on housing capital gains to their children who are likely to face higher lifetime housing costs;
l People do not often associate housing wealth with retirement income;
l Housing capital gains are either anticipated or perceived as transitory and so do not impact on savings decisions with expected capital gains;
l There is limited availability of equity withdrawal.
43 Hughes and Whelan, 1995 – detailed reference at paragraph 4.8
4.19 The current labour force could be expected to be less dependent on Social Welfare in retirement than current pensioners. The recent CSO44 pension coverage estimates included information on the retirement income expectations for people currently at work, which are reproduced in table 4.5 below.
4.20 Half of the workforce expect supplementary pensions to be their main source of income in retirement, while 59.9% expect to have some level of supplementary pension income. 20.1% expect the Social Welfare pension to be the main source, although this increases with age. 5.5% of the labour force, predominantly women, expect their spouse/partner’s supplementary pension to be their main retirement income source. While a relatively low percentage (7.9%) of workers expect their main income source to come from ‘Savings or investments; sale of business, farm or other property’ (around 20% of agricultural sector workers and the self-employed see this being the main source), 29% expect to have some income from these sources. 10.9% of people without a pension expect savings, investments or property sales to be their main retirement income source.
4.21 In summary, people of working age expect that supplementary pensions will replace Social Welfare as the main retirement income source for pensioners in the future. Upon retirement, the reality of these expectations will depend on pension coverage levels, the type of coverage (DB or DC), contribution rates and investment returns. Savings and investments are seen as an important additional source of retirement income, but are not widely expected by individuals to be the main income source.
44 Quarterly National Household Survey, Q4 2005
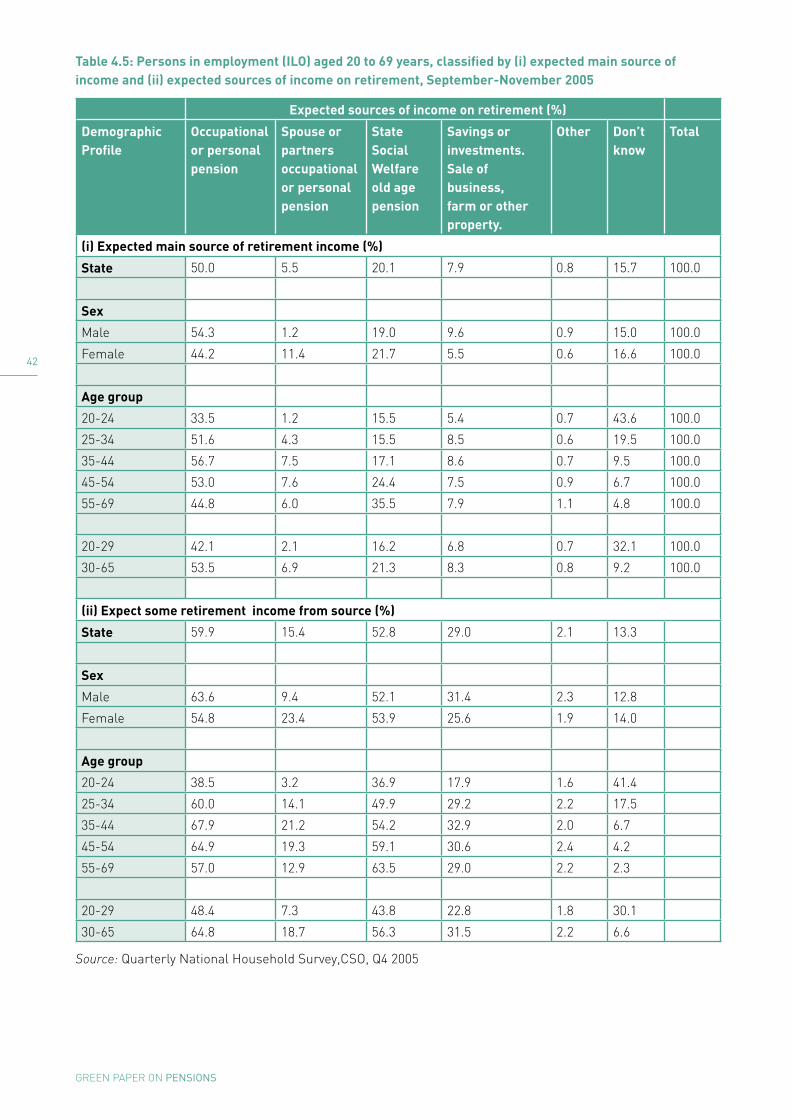
��
GREEN PAPER ON Pensions
Table 4.5: Persons in employment (ILO) aged 20 to 69 years, classified by (i) expected main source of income and (ii) expected sources of income on retirement, September-November 2005
Expected sources of income on retirement (%)
Demographic Profile
Occupational or personal pension
Spouse or partners occupational or personal pension
State Social Welfare old age pension
Savings or investments. Sale of business, farm or other property.
Other Don’t know
Total
(i) Expected main source of retirement income (%)
State 50.0 5.5 20.1 7.9 0.8 15.7 100.0
Sex
Male 54.3 1.2 19.0 9.6 0.9 15.0 100.0
Female 44.2 11.4 21.7 5.5 0.6 16.6 100.0
Age group
20-24 33.5 1.2 15.5 5.4 0.7 43.6 100.0
25-34 51.6 4.3 15.5 8.5 0.6 19.5 100.0
35-44 56.7 7.5 17.1 8.6 0.7 9.5 100.0
45-54 53.0 7.6 24.4 7.5 0.9 6.7 100.0
55-69 44.8 6.0 35.5 7.9 1.1 4.8 100.0
20-29 42.1 2.1 16.2 6.8 0.7 32.1 100.0
30-65 53.5 6.9 21.3 8.3 0.8 9.2 100.0
(ii) Expect some retirement income from source (%)
State 59.9 15.4 52.8 29.0 2.1 13.3
Sex
Male 63.6 9.4 52.1 31.4 2.3 12.8
Female 54.8 23.4 53.9 25.6 1.9 14.0
Age group
20-24 38.5 3.2 36.9 17.9 1.6 41.4
25-34 60.0 14.1 49.9 29.2 2.2 17.5
35-44 67.9 21.2 54.2 32.9 2.0 6.7
45-54 64.9 19.3 59.1 30.6 2.4 4.2
55-69 57.0 12.9 63.5 29.0 2.2 2.3
20-29 48.4 7.3 43.8 22.8 1.8 30.1
30-65 64.8 18.7 56.3 31.5 2.2 6.6
Source: Quarterly National Household Survey,CSO, Q4 2005

��
GREEN PAPER ON Pensions
Minimum incomes and risk of poverty for older people
4.22 There is no one measure that gives a complete picture of the situation regarding deprivation, poverty and social exclusion. This is particularly true for a country like Ireland that has experienced rapid economic growth over the last ten years. Therefore, a number of indicators are used to measure progress in achieving social inclusion covering areas such as income, levels of deprivation, early school leaving, jobless households, long-term unemployment, and life expectancy.45 A multi-dimensional analysis of the situation of older people should take account of some or all of these indicators; life expectancy, deprivation levels, real and relative income levels all feed into the quality of life of pensioners.
4.23 The official Government approved measure used in Ireland is consistent poverty, developed independently by the Economic and Social Research Institute (ESRI). This measure identifies the proportion of people, from those with an income below a certain threshold (less than 60% of median income46), who are deprived of one or more goods or services considered essential for a basic standard of living.
4.24 Based on the official consistent poverty indicator47, older people are in a relatively better position than the rest of the population (3.7% for those aged 65+ compared to 7.0% overall), while the risk-of-poverty is at about the same level for both groups. Family supports, lower housing costs and different consumption patterns among older people could improve their situation on the basis of consistent poverty, but would not feed into the purely income based ‘risk-of-poverty’ measure.
45 EU Member States adopted a revised set of common indicators of social protection and social inclusion in June 2006, against which to report in their National Reports on Strategies for Social Protection and Social Inclusion (NSSPIs).
46 Median income is the amount which divides the income distribution into two equal parts, half of people having incomes above the median, half having incomes below the median.
47 Based on the methodology adopted for the 2007 NAPinclusion Report, i.e. enforced lack of two out of 11 deprivation items
4.25 Other poverty measures, as referred to above, are also useful and highlight different aspects of the reality of poverty. The ‘at risk of poverty’ measure is the best known and quoted as it affords some comparisons with other countries. It does not, however, measure poverty as such, but rather the proportion of people below a certain income threshold. The income threshold used can result in very different findings. For example, taking the EU threshold of 60% of median income, the measure indicates that 20.1% of older people in Ireland are at risk of poverty while, at the Organisation for Economic Co-operation and Development (OECD) or United Nations (UN) threshold of 50%, only 7.5% are at risk.
4.26 The ‘at risk of poverty’ indicator has particular limitations as a measure of poverty in the case of Ireland in recent years. All groups in society have benefited from economic growth; therefore the main value of the indicator is in identifying particular groups which may have difficulty keeping pace with living standards generally. It has also been acknowledged that the ‘at risk of poverty’ indicator is not suited to making comparisons between countries at different stages of economic development. Recent trends for the ‘at risk of poverty’ indicator are examined in more detail below.
4.27 The ‘risk of poverty’ measure offers a view of how incomes for different groups compare over time, as it is based on comparisons of household incomes against the ‘median’ household (i.e., the mid-point by count of all household incomes from lowest to highest). Household incomes are adjusted for household composition in this analysis to allow for differences in family sizes, so that incomes are individualised or ‘equivalised’.
4.28 Disposable incomes after tax are used to give a clearer reflection of the resources available to individuals and households. While many other factors apart from incomes feed into pensioners’ living standards – such as family supports, housing costs and non-cash benefits – incomes are of particular relevance in assessing the effectiveness of the pension system. The most commonly used risk of poverty line is based on 60% of median net equivalised household income, and the

��
GREEN PAPER ON Pensions
percentage of the population or specific groups with incomes below this line is deemed to be at risk of poverty.
4.29 The risk of poverty grew steadily for older people and the overall population over the course of the late 1990s, but there is evidence of an improvement in the most recent (2003-2005) survey results. The change in levels was more pronounced for older people than for the general population, due to the importance of Social Welfare in their incomes.
4.30 The overall risk of poverty increased from 15.6% in 1994 to 21.9% in 2001, and subsequently fell to 18.5% by 2005 (see table 4.6 below). The rise in the risk of poverty for people aged 65 and over was particularly sharp over the 1994-2001 period when it grew from 5.9% to 44.1%. There was a significant improvement by 2005, however, when the risk of poverty for older people stood at 20.1%.
4.31 Older people tend to be more welfare-dependent than groups among the working age population, and their Social Welfare incomes tend to be close to the risk of poverty line. The recent relationships between Social Welfare incomes, earnings and household incomes are set out in more detail below.
4.32 Social Welfare pensions increased more quickly than industrial earnings and far more quickly than prices throughout the period. However, despite strong real income growth for pensioners, pensions failed to keep up with the
rise in household incomes over the period 1994-2001 in particular (see table 4.7 below).
4.33 These results should be viewed in the context of reforms undertaken through social partnership, where tax reform, moderation in earnings growth and increased employment were inter-related. Tax reform and changes in participation and employment largely fed into incomes above the risk of poverty line. People on Social Welfare incomes during this period would not have benefited from either of these factors directly unless they moved into employment. Female employment and taxes on average incomes moved rapidly from 1994 to 2001 (see Table 4.8), and both could be expected to have benefited households that were above the risk of poverty line throughout the period. From 2003 to 2005, effective tax rates remained relative static - as did participation - and the rate of growth in household incomes fell back in line with average industrial earnings. Social Welfare incomes grew more rapidly than household incomes from 2003 to 2005, which has resulted in reduced risk of poverty outcomes generally.
4.34 The result of this period of growth in household
incomes is that a gap has emerged between Social Welfare incomes and the risk of poverty line. However, there is clear evidence that the gap is closing in recent years. Examples of the income gaps for various types of pensioner households are shown in table 4.9 below. The risk of poverty line for 2005 is compared to Social Welfare rates for pensioner couples and single pensioner households. All household
Table 4.6 - Risk of poverty rates for the population and aged 65+, at the 60% median income line
1994 1997 2001 2003 2004 2005Risk of poverty rate 15.6 18.2 21.9 19.7 19.4 18.5Risk of poverty rate for all aged 65+ 5.9 24.2 44.1 29.8 27.1 20.1
Sources: 1994-2001 Living in Ireland Survey (ESRI); 2003-2005 EU-SILC Survey (CSO)
Table 4.7 - Rise in average industrial earnings and OACP compared to the 60% median income poverty line
1994 1997 2001 % rise 1994-2001
2003 2005 % rise 2003-2005
Equivalised median income 138.96 170.74 273.80 97.0% 292.95 321.23 9.7%Poverty line (60%) 83.38 102.44 164.28 97.0% 175.77 192.74 9.7%Average industrial earnings 344.06 371.42 470.96 36.9% 535.74 580.88 8.4%Contributory Pensions 90.15 99.04 134.59 49.3% 157.30 179.30 14.0%
Source: ESRI; CSO

��
GREEN PAPER ON Pensions
types had fallen below the risk of poverty line by 2001, while some pensioner couples were back above the line by 2005. The ‘2005 target’ scenario (contributory pensions rise to 34% of GAIE and the increase for the qualified adult is raised to the level of the State Pension (Non-Contributory)) leaves all household types above the risk of poverty line. There has been significant progress since 2005 on these target levels, so a further reduction in the risk of poverty for older people could be expected. In
addition, recent Programme for Government commitments could further improve the relative situation of older people out to 2012.
4.35 Different income definitions and equivalence scales are used in the EU monitoring process, however, which particularly affect comparisons of single person households. As a result of this, risk of poverty rates will be higher for older people on this basis, as is shown in the second target scenario in table 4.9 above.
Table 4.8: Context for rise in household incomes, 1994-2005
% rise
1994-2001 2003-2005
Household incomes 97% 10%
Social welfare incomes 49% 14%
Average industrial earnings 37% 8%
1994 2001 2005
Female employment rate 40% 55% 56%
Tax on average industrial earnings 32% 17% 17%
Source: ESRI; CSO; DSFA
Table 4.9 - Selected Social Welfare incomes compared to the 60% median income poverty line
1994 1997 2001 % rise1994-2001
2005 (SILC)
2005 Target*
2005 Target**
Poverty line 83.38 102.44 164.28 97.0% 192.74 192.74 215.15
2 person pensioner households
State Pension (Con) + Qualified Adult aged over 66
154.91 169.38 235.66 52.1% 317.80 356.66 356.66
Equivalised income 93.32 102.04 141.96 191.45 214.86 237.77
Income gap 9.94 -0.41 -22.32 -1.29 22.12 22.62
2 State Pension (Con) 180.30 198.08 269.18 49.3% 358.60 381.32 381.32
Equivalised income 108.61 119.33 162.16 216.02 229.71 254.22
Income gap 25.24 16.89 -2.12 23.29 36.98 39.07
2 State Pension (Non-Con) Pensioners
154.91 171.41 242.52 56.6% 332.00 332.00 332.00
Equivalised income 93.32 103.26 146.10 200.00 200.00 221.33
Income gap 9.94 0.82 -18.18 7.26 7.26 6.18
1 person pensioner household
(State Pension (Con) + Living Alone Allowance)
96.24 106.66 142.21 47.8% 187.00 198.36 198.36
Equivalised income 96.24 106.66 142.21 187.00 198.36 198.36
Income gap 12.87 4.21 -22.07 -5.74 5.62 -16.79
Source: ESRI; CSO; DSFA* State Pension (Contributory) set at 34% of 2004 GAIE and Qualified Adult Allowance (QAA) equal to the
non-contributory pension** Same, but poverty line based on EU definitions - 2 pensioner household incomes divided by 1.5 instead of 1.66

��
GREEN PAPER ON Pensions
Replacement income on retirement
4.36 A key objective of the pensions system is to ensure people have an adequate replacement income in retirement. For some, the Social Welfare pension will provide an adequate replacement income and the main policy objective for this group is alleviation of the risk of poverty.
4.37 For most people at work, some form of supplementary provision will be necessary to facilitate the transition to retirement. The NPPI policy target for replacement income is to ‘measure adequacy of gross post-retirement income from all sources (including lump sums and gratuities) against a benchmark of 50% of gross pre-retirement income’. The replacement rate is found by dividing post-retirement income for an individual by pre-retirement income.48
48 This is usually calculated by dividing the first year of pension by the last year of earnings. So, for example, if a person retires on a pension of €10,000 and had earned a salary of €40,000 in the year preceding retirement, his or her replacement rate would be 25%, i.e. 10,000 / 40,000.
4.38 Traditional arrangements, such as defined benefit pensions, target a percentage of final salary as a replacement rate based on the number of years of accrued rights. The evidence on replacement rates currently being attained by Irish pensioners is fairly limited.
4.39 The ESRI49 produced estimates for people who retired in 1994-2000 from the Living in Ireland survey, which put replacement rates for single pensioners at 43% and for couples at 51%. These results were based on the relatively small number of pensioners who retired over the course of the first seven years of the Living in Ireland Survey. The greater importance of occupational and personal pensions than State pensions for those in their first year of retirement is due to a significant proportion of people in the small sample retiring before they are eligible for a State pension.
4.40 This would suggest that some pensioners are not attaining the 50% NPPI/NPR replacement
49 ‘Pensioners incomes and replacement rates in 2000’, G. Hughes and D. Watson, ESRI, table 5.2
Table 4.10: Replacement rates for pensioner units based on income in year of retirement relative to last year in work
Pensioner unit type (each year from 1994-2000) Income in year before retirement
Income in year after retirement
Replacement Rate (%)
Pensioner couples
Gross benefit income €44 €99
Gross occupational/personal pension €37 €164
Gross investment income €32 €14
Gross earnings €564 €71
Gross other income €7 €1
Total Gross income €684 €348 51
Single pensioners
Gross benefit income €31 €62
Gross occupational/personal pension €65 €89
Gross investment income €3 €11
Gross earnings €293 €9
Gross other income €3 €0
Total Gross income €394 €171 43
The source is the Living in Ireland Survey, combining data from all waves from 1994 to 2001. The number of cases is 260 (60 single pensioners and 200 pensioner couples). An adjustment for the CPI is included. Only the income of the pensioner and spouse are considered. This table is based on data relating to those who retired from their main job in the relevant years while other tables are based on all pensioner units or all aged 65+.

��
GREEN PAPER ON Pensions
income target at present, and would have difficulty in maintaining their pre-retirement living standards. However, wealth factors are not well accounted for in the available statistics, and it is possible that pensioners might not make the 50% benchmark based on income alone but could have accumulated assets to fall back on.
4.41 It is clear that pensions are not the only means of achieving the NPPI/NPR target, and it is inevitable in a voluntary setting that people will provide for themselves as they see fit. Pensions are in competition with other types of investment, and may have suffered by comparison with, in particular, returns on property investments over the past decade. However, a purely voluntary approach, whereby it is left up to people themselves to provide for their retirement in any way they see fit, runs the risk that some people will be imprudent or short-sighted. In many cases, people may not possess the requisite knowledge or information to make correct investment decisions. In such an environment, it may be more likely that people will experience a significant drop in living standards at retirement.
4.42 People might not fully understand the investment risks involved in the assets they choose, or may underestimate their life expectancy or their replacement income needs. Some people may decide that they cannot afford a pension based on their current level of income and expenditure, in which case the drop in living standards at retirement will be exacerbated.
4.43 Gradual and later retirement is another option for smoothing incomes over the course of a life cycle. People could be allowed to either improve their replacement income by working longer or improve their retirement income through flexible working arrangements. There are some barriers to employment in the Social Welfare and tax systems that could be addressed. These reforms would need to be complemented by changes to occupational scheme rules. Employers may also have to deal with more informal barriers to employment of older workers. These issues are explored in more detail in Chapter 14.
4.44 Increasing the Social Welfare pension received strong support from the Pensions
Board in discussions around the ‘Securing Retirement Income’ (1998) report. It would be administratively simple to implement and result in low charges to workers and pensioners. It would also have a relatively low impact on current voluntary pension provision, and would help to ease funding difficulties for DB schemes through integration arrangements.
4.45 Most importantly, the Social Welfare pension is progressively redistributive and gives disproportionate value for money to groups who do not currently fare well in supplementary provision. These labour force groups include low income workers, workers in sectors with low occupational scheme coverage and women who take time out of the workforce to rear children. For many pensioners, the State pension is the only means of avoiding the risk of poverty. Pensioners do not have the same level of opportunities as people of working age to supplement their incomes, since their scope for savings or participation in the workforce is likely to be more limited. This level of social protection has a high cost associated with it, which was presented in Chapter 3.
4.46 Three broad options are emerging as the preferred responses to dealing with the retirement income gap through supplementary provision. Enhancements to the voluntary system of incentives, soft mandatory pensions and mandatory pensions have been presented in recent Pension Board reports. They are all particularly focused on medium and low earners, who have lower supplementary coverage at present. All are discussed and compared in more detail in Chapters 7 and 8. The annual retirement savings shortfall in Ireland was estimated, in one study, at €7 billion50. The IMF Report in October 2005 found that, despite respectable aggregate savings rates in Ireland, there is a significant group of householders with little savings, with those at the peak of their working lives having relatively low savings and the young and the poor saving very little. The IMF recommended that policy approaches to promote savings should consider targeting those who are preparing poorly for retirement. It can be seen therefore that there is still a need to encourage savings for retirement.
50 Life Strategies ‘The Pensions Gap - Two Years On’, IIF November 2006 Conference

��
GREEN PAPER ON Pensions
DC and PRSA income adequacy
4.47 While many factors feed in to whether people in DC arrangements will attain the NPPI/NPR replacement income target on retirement, the contribution rate is the main option available to the individual employee to improve his or her retirement income. For occupational scheme members, additional voluntary contributions (AVCs) and PRSAs can be used to increase their likelihood of making the replacement income target.
4.48 Statistical sources on contribution rates of DC scheme members51 and on AVC contributions by occupational scheme members are limited. While PRSA members account for a small, but growing, share of DC scheme members, it is possible to estimate broadly the numbers of PRSA holders who are currently undersaving for retirement based on the NPPI/NPR 50% replacement income target.
51 IAPF benefits survey 2002; average employee contribution to DC schemes was 4.6% and average employer contribution was 6.7%
4.49 The collection of Personal Public Service (PPS) Numbers for PRSA contributors in the Pension Board’s regulatory framework allows for data matching against information on employment and earnings held by Revenue/DSFA. The data matching is carried out by CSO under the confidentiality provisions of the Statistics Act 1993.
4.50 While there are some timing mismatches between the Pension Board and Revenue/DSFA data, the results are based on the actual recorded information on contributions and earnings in both sources, which improves their accuracy. The analysis covers some 42,109 active PRSA contributors. The Society of Actuaries in Ireland translated the NPPI/NPR target into a set of required contribution rates at various income levels and ages for DC/PRSA contributors. These required rates reflect the position at May 2006. The 2007 increase in the Social Welfare pension and the increase in interest rates since have probably lowered the required present level of contribution.
Table 4.11: PRSA 2005 (at PPSN level, aged 23-47 and individual contribution in 2005 > €0) and DSFA 2004 income €15,000-€64,999
Income contribution rate by age in 2005 (%)
Income 2004 23-27 28-32 33-37 38-42 43-47
€15,000-€24,999 5.1 6.8 7.7 8.6 9.2
€25,000-€34,999 5.9 6.0 7.1 7.7 10.3
€35,000-€44,999 6.6 6.8 7.7 9.1 9.8
€45,000-€54,999 7.6 7.2 8.7 10.3 12.9
€55,000-€64,999 6.0 7.8 9.6 12.0 14.6
Source: Pensions Board PRSA register and Revenue/DSFA earnings data, matched by CSO
Table 4.12: PRSA 2005 - % meeting SAI recommendations
Proportion meeting SAI contribution rates by age in 2005 (%)
Income 2004 23-27 28-32 33-37 38-42 43-47 Total
€25,000-€34,999 27.8 29.5 22.3 19.1 17.4 25.2
€35,000-€44,999 17.3 17.6 16.2 14.3 10.6 16.0
€45,000-€54,999 19.5 14.9 15.8 16.8 9.8 15.3
€55,000-€64,999 12.0 16.4 12.7 11.8 8.4 12.8
Total (€25,000 +) 24.5 23.3 18.8 16.7 13.4 20.5
Source: Pensions Board PRSA register and Revenue/DSFA earnings data, matched by CSO

��
GREEN PAPER ON Pensions
4.51 From the analysis above, 79.5% of PRSA holders aged 23-47 earning over €25,000 are undersaving for retirement based on the NPPI/NPR replacement income target52.While further analysis by CSO shows that people in older age categories tend to have much higher contribution rates (people aged 55-69 have an average contribution rate of 17.4%), the Society of Actuaries analysis shows the value of early contributions to pensions.
4.52 In summary, many people who are currently saving for retirement through PRSAs are not contributing enough to meet the NPPI/NPR target for replacement income. Contribution rates to DC occupational schemes are broadly similar53. Given that DC arrangements are most likely to be offered to new employees by companies, and already cover a substantial share of the existing labour market, contribution rates to DC schemes and pensions will need to be monitored closely over time.
Role of other arrangements and supports
4.53 The contribution of investment income to pensioners’ incomes was examined in section 4.16. While this is at best a proxy for the wealth held by pensioners, it gives a useful indication of the percentage and spread of pensioners that hold non-pension assets. The overall share of pensioner units with other direct income, including investment income, is
52 Some of this group could be AVC contributors via PRSAs, and the PRSA savings would represent only part of their occupational pension
53 IAPF Benefits Survey 2002
17.4%, and relatively few low income pensioner households have income from this source. Around 20% of middle income households and 43% of pensioners in the top one-fifth (quintile) of the income distribution have other direct income (see table 4.4). The income provided by this source is relatively low at 5.2% of overall pensioners’ incomes, and is concentrated in the top quintile.
4.54 More comprehensive data on wealth levels among Irish pensioners will be available from the SHARE54 survey, which is being conducted in Ireland for the first time this year. The data provided by this survey on the overlap between pension coverage, incomes and wealth for people aged 50+ will be of great value for pensions policy.
4.55 Retirement income expectations for the working age population were examined in sections 4.17-4.21. Investment income is seen as an important contributor to retirement income by many people at work, without being widely expected to be the main retirement income source. While the information on expectations is extremely useful, it is important to complement it with data on the assets being accumulated by working age people. In particular, it is useful to examine whether people without pensions are using other assets to fund their retirement provision.
4.56 Table 4.14 shows that a broadly comparable percentage of persons at work had investment income and second homes, and the majority in both cases also had supplementary pensions. A relatively low percentage of workers without
54 The Study of Health, Ageing and Retirement in Europe
Table 4.13: SAI recommended contribution rates as of May 2006 (for half-salary pension)
Age you start saving
Annual salary 25 30 35 40 45
€20,000* 0% 0% 0% 0% 0%
€30,000 6% 7% 9% 11% 14%
€40,000 9% 11% 13% 17% 22%
€50,000 11% 13% 16% 20% 26%
€60,000 12% 14% 18% 22% 29%
Source: Society of Actuaries in Ireland, ‘How much do you need to save for a pension?’, May 2006* The half salary pension is being provided by the Social Welfare pension.

�0
GREEN PAPER ON Pensions
pension coverage had either investment income (4.5%) or lived in a household with a second home (6.4%). These numbers are broadly comparable with the percentage of people without pensions who expect that other sources of income will be adequate to fund their retirement55.
4.57 It is also useful to examine differences in asset accumulation between employees and the self-employed. Table 4.15 shows that the self-employed make more use of other methods of investment. Employees tend to rely on pensions.
4.58 The analysis so far has focused on individual persons at work and their pensions and investments. Income sharing in households helps to determine living standards in retirement, so it is also useful to examine the percentage of households that are building up investments apart from pensions. 5.7% of working age households have second homes, while 9.8% of households have investment income.
4.59 The Q4 2005 QNHS pension coverage survey included a question on whether people at work
55 CSO Pension Coverage Survey, QNHS Q4, 2005
with and without pension coverage also took out SSIAs. 45.6% of those with pensions also had an SSIA, while 23.3% of people without a pension had an SSIA. For those without pensions, people in older age categories and the self-employed were more likely than average to have taken out SSIAs (30-33%).
4.60 While Social Welfare pension policy is largely focused on income support, household benefits also play an important role in supporting the basic needs of pensioners. The household benefits package operated by the Department of Social and Family Affairs is valued at €985 per annum56 for pensioner households, and is paid on a universal basis to all persons aged 70 and over. The free travel scheme is also available to all residents aged 66 and over, while the free fuel scheme is available to pensioner households subject to a means test. The schemes are currently paid directly to transport and utility companies, apart from the fuel allowance (which is a supplement to pensions during the winter months) and if a mobile phone is chosen for telephone allowance.
56 DSFA estimates
Table 4.14: Individual pension eligibility by investment income and whether the household has a second home, 2005
Pension No pension All
% of persons with investment income 12.7 4.5 8.7
% living in households with second home 10.1 6.4 8.3
Source: Special analysis of 2005 EU-SILC survey provided by CSO
Table 4.15: Individuals in 2005 with (i) pension coverage, (ii) investment income and (iii) whether the household has a second home, 2005
% with pension % with investment income % in households with a second home
Employee 53.7 7.6 7.3
Self-employed 42.1 14.2 13.0
All 51.8 8.7 8.3
Source: Special analysis of 2005 EU-SILC survey provided by CSO
Table 4.16: Household level data, i.e. % of households with investment income or a second home
% of households with second home 5.7
% of households with investment income 9.8
Source: Special analysis of 2005 EU-SILC survey provided by CSO

�1
GREEN PAPER ON Pensions
4.61 The Commission on Social Welfare (CSW) (1986) stated that if payment levels were adequate, there was no reason in principle why non-cash benefits should also be provided. The CSW also claimed that the schemes could be described as unnecessarily paternalistic and could deprive people of choice in relation to how they spent their income. (However, there was no evidence to suggest that recipients shared this view.) The alternative approach to delivery of the schemes would be to pay the value of the schemes directly to pensioners. However, there are important social protection dimensions to the schemes that need to be considered:
l The household benefits package is paid on a household basis in respect of basic overheads that are similar for all households regardless of composition. This is particularly beneficial to single person households, who tend to have a higher risk of poverty than other pensioner households;
l The fuel and electricity schemes are particularly important in avoiding fuel poverty, which occurs when a household has to spend 10% or more of their income on energy. The consequences of fuel poverty for health and social exclusion are well established57;
l The travel and telephone schemes, in particular, assist social participation through facilitating mobility and social contact for pensioners;
l The schemes are very highly valued by pensioners, as shown by research58.
57 ‘Fuel poverty and policy; Ireland in the EU context’, J. Healy, Combat Poverty Agency (2004)
58 Quinn, O. (2000) A Review of the Free Schemes Operated by the Department of Social, Community and Family Affairs
4.62 Other important non-pension supports to older people include the extension of the medical card on a universal basis to the over 70s in 2001 and home care packages provided by the Health Service Executive (HSE).
Supplementary pension coverage
4.63 In the analysis carried out for the NPPI, it was estimated that 70% of the workforce will need supplementary pensions to meet the 50% replacement income target. The remaining 30% of the workforce have low earnings from work, and the Social Welfare pension is considered adequate as a replacement income in retirement. This analysis was updated in the National Pensions Review (NPR), and the same relationship between earnings, Social Welfare pensions and replacement income held at that point. The benchmark for the supplementary system is to achieve 70% coverage of the workforce aged 30-65 in the medium term.
4.64 Coverage under the existing voluntary system
has been measured at various points over the past decade. The assessment of coverage carried out for the NPR set the first CSO QNHS pensions survey (Quarterly National Household Survey, Q1 2002) as the monitoring benchmark, since the NPPI reforms were implemented at that point. The 1995 and 2002 coverage surveys were not directly comparable, and the best conclusion that can be drawn is that there was no change in pension coverage over the period. Given the large rise in services, part time, and female employment over the period, this could be interpreted as a fairly positive development.
Table 4.17: Comparison of opening position (2002) with NPPI targets
1995 ESRI 2002 CSO NPPI ultimate target59
Supplementary pension coverage – all workforce 46% 51% 60%Pension coverage Age less than 30 28% 36% 35%
30 to 65 54% 58% 70%Pension coverage Men 49% 56% 59%
Women 40% 45% 61%Pension coverage Self-employed 27% 44% 44%
Employees 51% 53% 64%
Source: National Pensions Review (2006)59 To be achieved some time after 2013.

��
GREEN PAPER ON Pensions
4.65 Since Q1 2002, pension coverage has been measured on a consistent basis through the QNHS. Pension coverage increased between Q1 2002 and Q4 2005, from 51.2% to 55%. This increase can be attributed to an increase in occupational pension coverage, which has risen from 35.4% to 40.2% over the same period.
4.66 The coverage surveys undertaken in 2002 and 2005 also include estimated breakdowns by economic sector, hours of work, occupation and company size. Broad patterns can be seen over the 4 year period:
l The sectors that had below average coverage in 2002 show similar patterns in 2005. The agriculture, construction, wholesale and retail trades and hotels and restaurants sectors are below the average occupational coverage level for employees of 51.5%. The self-employed show less variation by sector;
l Part-time workers report lower than average coverage levels, as do employees of small companies;
l Higher professional and technical occupations report higher than average coverage.
4.67 There is a complex relationship between pension coverage and hours worked, female employment, sector of employment and income levels that makes it difficult to interpret the root cause of low coverage across these dimensions. It is likely that low income is the main cause of lower than average pension coverage, since it is present across all of the other dimensions of employment and occupation.
4.68 Apart from low income, however, there are other reasons for low coverage when examined across gender, sector and part/full time employment dimensions. For example, 15% of women in employment without pensions expect their
spouse/partner’s supplementary pension to be their main retirement income source. Also, labour market participation (and thus pension coverage) of younger women is much closer to the situation for men of the same age than for men and women of comparable older ages. Male and female coverage levels might be expected to converge somewhat over time, but the differences in sectoral coverage caused by low incomes would appear to be more intractable. More detailed sectoral information on pension coverage can be expected from the 2008 National Employment Survey.
International comparisons of pension adequacy4.69 Pension adequacy in the EU Open Method of
Co-ordination process is mainly assessed using relative income measures. The risk of poverty for Irish pensioners is relatively high compared to other European countries, and recent trends in this indicator were described in sections 4.29-4.35. In 2005, the risk-of-poverty for Irish people aged 65+ was 33% based on EU definitions61 compared to an EU-25 average of 19%. This was 13% higher than the risk of poverty for the overall population, while the EU-25 risk of poverty levels for people aged 65+ was 3% higher than for the total population.
61 The equivalence scales used for EU poverty monitoring result in risk of poverty rates for single person households being higher than those based on the ESRI equivalence scales. This has implications for comparisons of the older and working age populations, and also for comparisons of groups among the older sector where the number of single pensioner households varies – e.g., gender and age comparisons. The EU definition of income is also slightly different to the ESRI/CSO definition, as certain types of personal pension are excluded.
Table 4.18: Comparison of progress with NPPI supplementary pension coverage targets since 2002
2002 CSO survey
2005 CSO survey
NPPI 5 yr. target
NPPI ultimate target60
Pension coverage – all workforce 51% 55% 53% 60%Pension coverage Aged less than 30 36% 39% 34% 35%
30 to 65 58% 62% 62% 70%Pension coverage Men 56% 58% 54% 59%
Women 45% 51% 51% 61%Pension coverage Self-employed 44% 44% 36% 44%
Employees 53% 57% 58% 64%
Source: National Pensions Review (2006)60 To be achieved some time after 2013.
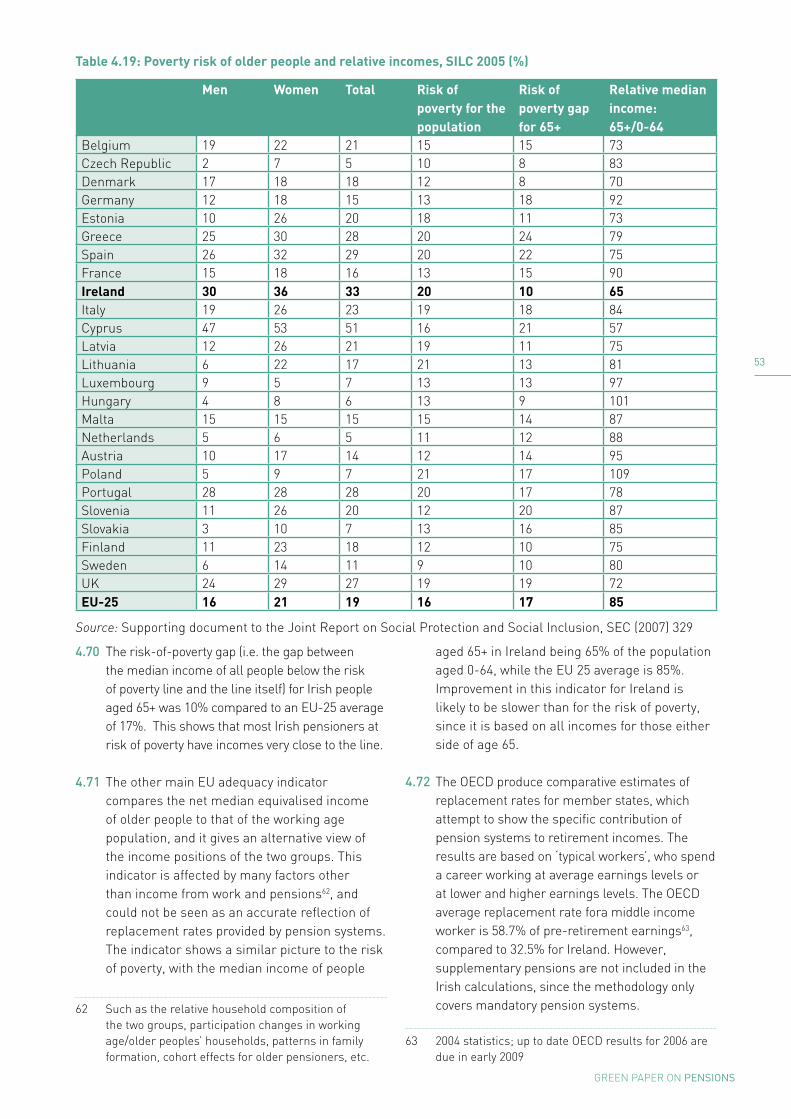
��
GREEN PAPER ON Pensions
4.70 The risk-of-poverty gap (i.e. the gap between the median income of all people below the risk of poverty line and the line itself) for Irish people aged 65+ was 10% compared to an EU-25 average of 17%. This shows that most Irish pensioners at risk of poverty have incomes very close to the line.
4.71 The other main EU adequacy indicator compares the net median equivalised income of older people to that of the working age population, and it gives an alternative view of the income positions of the two groups. This indicator is affected by many factors other than income from work and pensions62, and could not be seen as an accurate reflection of replacement rates provided by pension systems. The indicator shows a similar picture to the risk of poverty, with the median income of people
62 Such as the relative household composition of the two groups, participation changes in working age/older peoples’ households, patterns in family formation, cohort effects for older pensioners, etc.
aged 65+ in Ireland being 65% of the population aged 0-64, while the EU 25 average is 85%. Improvement in this indicator for Ireland is likely to be slower than for the risk of poverty, since it is based on all incomes for those either side of age 65.
4.72 The OECD produce comparative estimates of replacement rates for member states, which attempt to show the specific contribution of pension systems to retirement incomes. The results are based on ‘typical workers’, who spend a career working at average earnings levels or at lower and higher earnings levels. The OECD average replacement rate fora middle income worker is 58.7% of pre-retirement earnings63, compared to 32.5% for Ireland. However, supplementary pensions are not included in the Irish calculations, since the methodology only covers mandatory pension systems.
63 2004 statistics; up to date OECD results for 2006 are due in early 2009
Table 4.19: Poverty risk of older people and relative incomes, SILC 2005 (%)
Men Women Total Risk of poverty for the population
Risk of poverty gap for 65+
Relative median income: 65+/0-64
Belgium 19 22 21 15 15 73Czech Republic 2 7 5 10 8 83Denmark 17 18 18 12 8 70Germany 12 18 15 13 18 92Estonia 10 26 20 18 11 73Greece 25 30 28 20 24 79Spain 26 32 29 20 22 75France 15 18 16 13 15 90Ireland 30 36 33 20 10 65Italy 19 26 23 19 18 84Cyprus 47 53 51 16 21 57Latvia 12 26 21 19 11 75Lithuania 6 22 17 21 13 81Luxembourg 9 5 7 13 13 97Hungary 4 8 6 13 9 101Malta 15 15 15 15 14 87Netherlands 5 6 5 11 12 88Austria 10 17 14 12 14 95Poland 5 9 7 21 17 109Portugal 28 28 28 20 17 78Slovenia 11 26 20 12 20 87Slovakia 3 10 7 13 16 85Finland 11 23 18 12 10 75Sweden 6 14 11 9 10 80UK 24 29 27 19 19 72Eu-25 16 21 19 16 17 85
Source: Supporting document to the Joint Report on Social Protection and Social Inclusion, SEC (2007) 329

��
GREEN PAPER ON Pensions
Table 4.20: Gross/net replacement rates for men from mandatory schemes by individual earnings level, 2004 and pension wealth (the present value of future pension entitlements in relation to average earnings)
Gross replacement rates Net replacement rates Pension wealth
Individual pension entitlement as a percentage of individual
pre-retirement gross earnings
Individual pension entitlement net of taxes and contributions as a percentage of individual
pre-retirement earnings net of taxes and contributions
Individual earnings, multiple of average
Individual earnings, multiple of average
Worker on average earnings
0.5 1 2 0.5 1 2 Gross Net
OECD average 73.0 58.7 49.2 83.8 70.1 60.7 9.4 8.1
Australia 70.7 43.1 29.2 83.5 56.4 40.8 7.3 7.3
Austria 80.1 80.1 58.8 90.4 90.9 66.4 11.7 9.0
Belgium 57.3 40.4 23.5 77.3 63.0 40.7 6.2 5.6
Canada 75.4 43.9 22.2 89.2 57.4 30.8 6.7 6.7
Czech Rep. 78.8 49.1 28.9 98.8 64.4 40.2 8.1 8.1
Denmark 119.6 75.8 57.1 132.7 86.7 72.2 11.9 8.0
Finland 71.3 63.4 63.4 77.4 68.8 70.5 10.0 7.4
France 63.8 51.2 44.7 78.4 63.1 55.4 9.2 8.1
Germany 39.9 39.9 30.0 53.4 58.0 44.4 7.2 6.0
Greece 95.7 95.7 95.7 113.6 110.1 107.0 14.3 13.0
Hungary 76.9 76.9 76.9 94.7 102.2 98.5 12.4 9.8
Iceland 109.9 77.5 72.9 110.9 84.2 79.7 11.8 9.1
Ireland 65.0 32.5 16.2 65.8 38.5 23.5 5.8 5.8
Italy 67.9 67.9 67.9 81.8 77.9 79.3 10.0 8.4
Japan 47.8 34.4 27.2 52.5 39.2 31.3 5.7 5.3
Korea 99.9 66.8 45.1 106.1 71.8 50.7 9.3 9.1
Luxembourg 99.8 88.3 82.5 107.6 96.2 91.0 - -
Mexico 52.8 35.8 33.6 50.3 38.3 40.0 4.8 4.8
Netherlands 80.6 81.9 82.6 97.0 96.8 94.8 - -
New Zealand 79.5 39.7 19.9 81.4 41.7 23.2 7.4 6.1
Norway 66.4 59.3 42.7 77.1 69.3 55.1 9.3 7.6
Poland 61.2 61.2 61.2 74.5 74.9 77.1 8.4 7.0
Portugal 70.4 54.1 52.7 81.6 69.2 73.7 7.9 7.9
Slovak Rep. 56.7 56.7 56.7 66.4 72.9 76.7 8.8 8.8
Spain 81.2 81.2 67.1 82.0 84.5 72.4 12.2 10.1
Sweden 79.1 62.1 66.3 81.4 64.0 73.9 10.0 6.8
Switzerland 62.5 58.4 30.5 75.0 64.3 35.1 9.8 8.1
Turkey 72.5 72.5 72.5 101.0 104.0 108.3 9.2 9.2
United Kingdom 53.4 30.8 17.0 66.1 41.1 24.0 4.6 4.5
United States 55.2 41.2 32.1 67.4 52.4 43.2 5.9 5.7
Notes and definitions are available in OECD (2007), Pensions at a Glance: Public Policies Across OECD Countries, 2007 Edition.

��
GREEN PAPER ON Pensions
The OECD also calculate estimates of pension wealth, which is the present value of future pension entitlements as a multiple of average earnings. This is a more comprehensive indicator of pension promises, since it takes account of retirement age, the level of pension, life expectancy and indexation. However, it does not take account of the lower social contributions paid by Irish employees and employers in respect of Irish Social Welfare benefits64.
4.73 While detailed statistics on current adequacy levels are available from various sources, projections of future adequacy levels are not regularly available to complement the sustainability projections produced by the Economic Policy Committee. The European
64 Employee contributions were 4.6% and employer contributions were 9.7% of labour costs for an Irish average earner per. the OECD ‘Taxing wages 2005/2006’ publication; total contributions were mostly in the 25-35% range for other European countries
Centre for Social Welfare Policy and Research65 forecasted the effect of currently implemented or legislated pension policy reforms on future risk of poverty levels across Europe in 2006. These estimates were based on combining current household incomes data with projections of benefit levels derived from the EPC sustainability projections. Ireland is one of the only countries for which a decrease in the risk of poverty was forecast on this basis, although our projected 2050 level is still among the highest for the countries in the study.
65 ‘Pension policy in the EU 25 and its possible impact on elderly poverty’, A. Zaidi, B. Marin and M. Fuchs, European Centre for Social Welfare Policy and Research
Table 4.21: Projections of at-risk-of-poverty rates for 65+, 2004 and 2050 (%)
Total Men Women
Now 2050 Now 2050 Now 2050
Belgium 21 24.6 20 23.4 21 24.7
Denmark 17 19.8 16 18.7 18 20.9
Estonia 17 44 7 32.8 22 49.9
Spain 30 30.2 27 27.2 32 32.3
France 16 29.5 14 26.8 17 30.6
Ireland 40 35.9 34 30.2 45 40.4
Italy 16 34.7 13 31.3 18 35.6
Cyprus 52 45.3 48 41.8 55 48.1
Latvia 14 29.9 7 24 17 33.5
Lithuania 12 13.3 5 6.3 15 16.3
Malta 20 43.6 19 43.6 20 39.3
Austria 17 36.1 13 31.3 20 39.3
Portugal 29 32.8 29 32.6 30 33.9
Slovenia 19 23.6 11 15.7 23 27.3
Finland 17 21.7 11 15.5 20 24.7
Sweden 14 27.8 9 22.6 18 31.6
Source: Zaidi, A., B.Marin and M.Fuchs (2006) Pension policy in the EU25 and it possible impact on elderly poverty, European Centre for Social Welfare Policy and Research

��
GREEN PAPER ON Pensions
Maintaining income adequacy in retirement
The average net income for single pensioners and pensioner couples in 2005 was €327.55 per week, compared to net average weekly incomes for all households in the population of €776.11. Social welfare pensions are the main source of income for Irish pensioners. Age, gender and household composition factors affect pensioners’ incomes. Around 32% of pensioner units have income from occupational or personal pensions, but relatively few pensioners in the bottom two-fifths of incomes have income from these sources.
50% of people at work expect that supplementary pensions, rather than Social Welfare pensions, will be their main retirement income source. While over 50% of workers are scheme members, Social Welfare pensions are likely to be the main retirement income source for many of this group based on current contribution levels to occupational schemes. Savings and investments are seen as an important additional source of income but are not widely expected to be the main income source.
Based on the official consistent poverty indicator, older people are in a better position than the rest of the population (3.7% for those over 65, compared to 7% overall). The risk of income poverty indicator is at approximately the same level for both groups.
The limited evidence available would suggest that some pensioners are not attaining the replacement income target suggested by the NPPI/NPR. There is also evidence that many PRSA contributors are under-saving for retirement, based on the same target.
A relatively low percentage of workers without pension coverage had either investment income or a second home. The majority of those with investment income or second homes also had pensions. Around 23% of workers without a pension had an SSIA, compared to around 46% of those with pensions.
Non-cash benefits, including the household benefits package, are an important support for pensioners’ living standards.
Coverage surveys conducted in 1995 and 2002 were not directly comparable, and the best conclusion that can be drawn is that there was no change in pension coverage over the period. Pension coverage increased from 51% in 2002 to 55% in 2005. The supplementary pension coverage target suggested by NPPI/NPR is 70% of the working population between age 30 and 65 from 2013. Current coverage for this group is 62%. Despite this improvement, certain groups remain hard to reach through supplementary pensions. These groups include part-time workers, workers in sectors with traditionally low coverage, women, and groups outside the labour market.
The risk of income poverty for older people in Ireland is relatively high by international standards. Replacement income provided by the Social Welfare pension for middle and high income groups is also low by international standards.

CHAPTER 05
The soCial Welfare Pension in ireland

��
GREEN PAPER ON Pensions
Introduction
5.1 Social Welfare pensions are flat-rate payments with eligibility based on either achieving a particular level of social insurance contributions over a person’s working life or through satisfying a means test. Means-tested payments are funded through taxation. Payments based on social insurance are funded through pay-related contributions made by employers, employees and the self-employed to the Social Insurance Fund. Those who are unable to contribute because of unemployment or illness are, subject to conditions, credited with contributions. Since 1994, arrangements are in place through the Homemaker’s Scheme to protect the pension entitlements of those who spend time out of the workforce because of caring duties. There is also a system of voluntary contributions in place with eligibility to contribute subject to certain conditions. Details regarding the history of the Social Welfare pensions system, the qualifying conditions for the various payments and the manner in which these have developed over the years are set out in Appendix B.
5.2 Social Welfare pensions are not related to previous income (though it could be said that non-contributory payments are linked to retirement income as they are means tested) and are intended to cover basic living costs. Additional allowances are paid for dependants, those living alone and those aged over 80 years. In addition, supplements are provided to assist with meeting the costs of electricity, fuel in the winter months, telephone rental and a television licence. These benefits (except the fuel allowance) are available to all aged over 70. Everybody aged 66 and over is entitled to free travel on public transport.
5.3 Expenditure on the main pension schemes amounted to €3,279 million in 2006, or 24.1% of overall Social Welfare expenditure. At January 2007, the personal rate of payment on contributory pension schemes is €209.30 per week and €20066 per week for non-contributory payments. The additional payment for a
66 The Government committed as part of the Programme for Government to achieving a rate of €200 per week by 2007 and this was achieved in Budget 2007.
dependent adult is €173 per week. These are the maximum rates paid, reduced rates are paid to those with incomplete social insurance records or means in excess of certain levels.
5.4 Means-testing remains an important, though declining, feature of pensions provided through the Social Welfare system. Since 1974, several important changes were made to the social insurance system with coverage extended to groups including the self-employed, part-time workers and new public servants. These changes are now feeding into the pensions system with more people qualifying for pensions based on their social insurance record rather than through means testing. Social insurance pensions have the advantages of being paid as of right and independent of any other income/earnings and they are usually paid at a higher rate than the means-tested equivalent.
5.5 As outlined in Appendix B, the Social Welfare pensions system has been improved on an incremental basis over the years. In general, this has involved reductions in the average contribution rate required for minimum pensions67 and the introduction of different categories of pension to deal with various perceived anomalies and issues which have arisen from time to time. As a result, contributory payments are available on a much wider basis. That said, the minimum number of paid contributions required for pension purposes has been standardised at 260 from April 2002 and will, under current legislation, increase to 520 contributions in 2012 in line with the recommendations made in the Final Report of National Pensions Board (1993)68.
5.6 The system of social insurance coverage for pensions is now comprehensive as a result of the changes which have been made to the qualifying conditions, extensions in the insurability of different classes of employment
67 The standard qualifying conditions require that a person commence paying social insurance 10 years before reaching pension age, pay a minimum of 260 contributions at an appropriate rate and achieve a yearly average of at least 10 contributions paid or credited on their record from the time they first join social insurance until they reach pension age. An average of 48 is needed for a full pension.
68 National Pensions Board (1993) “Developing the National Pensions System”.

��
GREEN PAPER ON Pensions
(most notably the self-employed in 1988 and part-time workers in 1991), as well as increased employment participation across all sectors of society. In time, this will translate into a pensions system largely based on social insurance and with almost total coverage. The expanding role of social insurance pensions in the system is already apparent in the decrease of 17% over the last 10 years in the numbers relying on means-tested non-contributory pensions.
Current issues in relation to Social Welfare Pensions
5.7 The current issues in relation to Social Welfare pensions can be categorised under a number of broad headings:
(i) Legacy issues arising from the structure of the system of social insurance which applied up until the late 1980s and early 1990s.
(ii) Issues for older people’s incomes as a result of societal norms which applied until the 1970s which meant that many women, particularly in the public service, were required to leave employment when they married.
(iii) The manner in which the qualifying conditions for pensions are structured which can give rise to anomalies and create difficulties for people with less than complete insurance records, particularly where large gaps arise after a person first enters insurance.
(iv) The relationship between the respective rates at which the contributory and non-contributory pensions are paid. A related issue is the extent to which the rates currently being paid achieve objectives in the area of poverty relief.
(v) The appropriateness of the system of means testing for Qualified Adult payments.
These issues are discussed in more detail in the following sections.
The Social Insurance System from 1953 and its impact on pensions
5.8 The unified system of social insurance was introduced in 1953 and eligibility to contribute was, in some cases (mainly for non-manual workers), based on income. In 1953, the income limit was the equivalent of €761 per annum and this was increased over the years until the limit was abolished in 1974. Some categories, such as the self-employed and part-time workers, were excluded from social insurance altogether. Where a person exceeded the income limit it was open to them to become voluntary contributors.
5.9 Not everyone was insured at full rates with some, mostly public sector workers, contributing at modified rates. It was considered that their conditions of employment, providing for sickness and retirement, made full coverage under the Social Welfare system unnecessary in their case.
5.10 There was little change in the coverage of the social insurance system until 1974 when, as already indicated, the insurable income limit for non-manual workers was abolished. Further expansion of the system occurred over the following 20 years as follows:
l 1979: pay-related social insurance contributions introduced;
l 1988: the self-employed became compulsorily insured;
l 1991: part-time workers were brought into the system;
l 1994: Homemaker’s Scheme introduced to protect Social Welfare pension rights of those leaving the paid workforce for caring duties
l 1995: public service workers recruited after 6 April 1995 became fully insured for Social Welfare purposes, including pensions. At the same time, their occupational pensions were adjusted to integrate them with Social Welfare pensions to arrive at the overall pension promised.
5.11 Generally speaking, changes to insurability have operated from the date new measures

�0
GREEN PAPER ON Pensions
were introduced69. While this matters little to someone who became insured for the first time as a result of these changes, pension entitlements can be affected where people moved in and out of insurance. For instance, a person who first became insured in say, 1955, paid insurance until 1957, exceeded the income limit and was not insured again until 1974 when the income limit was abolished, will have the period from 1957 to 1974 counted when their insurance record is being averaged. If only the years in which insurance was paid were counted the person would, assuming no gaps in these years, end up with a yearly average of 52 contributions in 2006. If the years of non-insurance are included in the equation, the average decreases to 32. In monetary terms, the impact on the level of pension received is relatively small at these levels (€4.10 per week at 2007 rates) but once the yearly average drops below 20 the impact can be very significant with differences in rate bands of €48 per week.
5.12 With few exceptions70, the average contribution rate is calculated using the period from the first day a person becomes insured until the end of the last contribution year before they reach pension age. As indicated, this will impact on pension entitlements where there are significant gaps in a person’s insurance record and can result in a reduced payment, or worse, no pension being paid. The only way in which this particular problem could be addressed in the context of the existing arrangements would be to disregard certain years e.g. years of exclusion from social insurance, caring or spent abroad. Alternatively, a cap could be placed on the years used for averaging e.g. use a person’s 30 best years of insurance. However, as will be seen in the following chapter, the total number of contributions with which people are qualifying for pensions is already quite low and, accordingly, measures such as this might be seen as undermining the contributory principle underlying entitlement and could make it difficult to set a reasonable benchmark for future entitlements in the context of a change
69 In the case of the self-employed earlier insurance contributions can be ignored in the case of a person who entered insurance in April 1988 under the new arrangements introduced at that time.
70 A person’s insurance record can be averaged from 1979 but only to qualify for a full rate pension.
to a system based on total contributions paid or credited (see Chapter 6).
Caring and Pension Entitlements
5.13 The Homemaker’s Scheme, introduced in 1994, is designed to protect the pension entitlements of those who leave the workforce to care for children under 12 years of age or an incapacitated child or adult who needs full-time care and attention. The scheme operates by disregarding up to 20 years spent caring when a person’s social insurance record is being averaged for pension purposes. However, the scheme will not of itself qualify a person for a pension as the standard qualifying conditions in relation to paid contributions must also be satisfied.
5.14 In common with most changes to social insurance, the scheme, when introduced, operated from a current date (1994). Accordingly, the scheme is not yet a factor in deciding pension applications, as those who will benefit from the scheme are generally some way off pension age.
5.15 Recipients of Carer’s Allowance and Carer’s Benefit may be entitled to receive credited contributions if their last PRSI contribution was made within two years of claiming the allowance or benefit. The credit is awarded at the same class as the last paid contribution.
5.16 The main criticism of the Homemaker’s Scheme is that it fails to recognise periods spent caring prior to 1994. This can result in very significant gaps in social insurance records that will reduce a person’s average contribution rate and may also affect the rate at which their pension is paid. This can have implications for women returning to employment after many years out of the workforce as well as those who never returned. More than likely, the latter will not qualify for any payment in their own right but they will receive support as a qualified adult on the pension of their spouse or partner. Couples can, since 2002, arrange to have the qualified adult allowance paid directly to the spouse or partner and, since September 2007, a separate

�1
GREEN PAPER ON Pensions
payment to a spouse or partner will be the default arrangement for new claims to pension.
5.17 The scheme’s practice of disregarding years rather than awarding credits has been criticised. Firstly, the use of the term ‘disregard’ is considered inappropriate because it is considered that it does not adequately reflect and recognise the contribution which full-time carers of children and incapacitated people make to society. Secondly, awarding credits can be more advantageous than a disregard when averaging for pension purposes. The extent of this advantage will depend on the nature of the individual’s contribution record (see below).
Disregards vs Credits in the Homemaker’s Scheme
For example: Person A was born in 1960. She entered social insurance in 1978 at age 18. She will reach age 66 (qualifying age for State Pension (Contributory)) in 2026. This is a “working life” of 48 years. Assume she paid 520 contributions (10 years) and spent 20 years homemaking. The following outlines her entitlement to State Pension (Contributory) in 3 different scenarios
Scenario (a) - no homemaker credits or disregards. The yearly average is 10.8 (520/48) and gives entitlement to a 50% pension.
Scenario (b) - 20 years homemaker disregard. The yearly average is 18.57 (520/28) and gives entitlement to a 75% pension.
Scenario (c) - 20 years homemaker credits. The yearly average is 32.5 [(520+1040)/48] giving entitlement to 98% pension.
5.18 One of the main issues raised in relation to the scheme is the position of women who left employment on marriage through the operation of the marriage bar in the public service or voluntarily as a result of the societal norms which applied at the time. This group consider that they were denied the opportunity to establish their own pension rights. Under
the present system, people in that situation may consider that:
l there is no formal recognition of their work in the home;
l they do not receive a payment in their own right;
l they were not afforded the opportunity to contribute towards a pension in their own right because many were forced to leave employment. In this context, however, those in the public service did not, and would not have been contributing to a social insurance old age pension even if they had been allowed to remain in employment. Accordingly, it could be argued that the issue in relation to the marriage bar is one that is more appropriately dealt with in the context of public service occupational pensions and employment policies;
l the application, from 1994 only, of Homemaker arrangements is of no benefit to older homemakers. In addition, the current system only benefits those who have paid full rate PRSI at some stage. In this regard, it is worth stating that it has always been possible for a full rate PRSI contributor to maintain his or her record through voluntary contributions. Changes in the way in which qualified adult allowances are paid will benefit many in this position where their spouse qualifies for a contributory pension.
5.19 A review of qualifying conditions for Old Age Contributory and Retirement Pensions71
published in 2000 suggested that, in principle, the Homemaker’s Scheme should be backdated and that the disregard system should be replaced with one based on the award of credits although, as will be outlined later, there are equity issues to be considered vis-a-vis the position of other categories excluded from social insurance over the years.
The Operation of the Average Contributions Test
5.20 The average contribution test is a major element of the qualifying conditions for
71 Now State Pension (contributory) and State Pension (Transition)

��
GREEN PAPER ON Pensions
contributory pensions. This requires that a person achieve a yearly average of at least 10 contributions on his/her social insurance record for a minimum pension72, with an average of 48 contributions for a maximum rate pension.
5.21 There are two main issues in relation to the average contributions test. The first relates to the impact it can have on entitlements when there are significant gaps in a person’s record and this has already been illustrated at paragraph 5.11 in the context of changes to the PRSI system. The second issue relates to a lack of consistency in the relationship between contributions made and pensions awarded.
5.22 The operation of the average contributions test can give rise to anomalous situations, as the level of payment achieved may not reflect the total number of contributions a person has accumulated over their working life. For example, a person with 500 contributions may receive a higher rate of payment than a person with 1,000 contributions, depending on when each person first entered social insurance. As can be seen from the following table relating to claims to State Pension (Contributory) from May 2006, people are qualifying for maximum rate pension with the equivalent of 10 years of contributions while others can have in excess of the equivalent of 40 years of contributions. For example, 52.47% of people have the equivalent of between 10 and 20 years’ contributions (520-1,039). However, 22.5% of those qualifying for the contributory pension receive a full-rate pension for this amount of contributions while 7.71% of those with the same level of contributions receive a 50% pension due to a reduced average.
72 50% of maximum rate
5.23 The qualifying conditions for contributory pensions largely date from 1961 when the Old Age Contributory Pension was first introduced. While changes have been introduced over the years to make qualification easier and to provide for situations where people have different classes of social insurance contributions or contributions in other countries, the basic principles introduced in 1961 still apply. These were designed at the time to ensure that people could qualify for a pension from the outset rather than having a long lead in time before pensions started to be paid. They were also designed to suit a social insurance system that was less than comprehensive, and involved some people moving in and out of coverage, depending on their income.
5.24 The National Pensions Board, in its final report, summarised the situation as follows:
“On the one hand, certain categories of insured persons can qualify for a rate of pension which is much higher than the period of insurance completed justifies. On the other hand insured persons fail to qualify for any pension payment despite having contributed for significant periods”.
5.25 It has been suggested that switching to a total contributions approach would be a more transparent and equitable way of assessing eligibility for pensions. However, as will be seen later, this may not be feasible in the short to medium term because of the inconsistent nature of the contribution records of those qualifying for pension today as a result of the continuing impact that previous gaps in social insurance coverage are still having on the records of older workers.
Table 5.1: Total Contributions paid or credited v average contribution rate achieved (%)
Average* Contributions
156 to 259
260 to 519
520 to 1,039
1,040 to 1,559
1,560 to 2,079
>2,079
10 to 14 0.04 3.86 7.71
15 to 19 0.55 9.90
20/24 to 47 0.07 2.40 12.36 11.90 4.40 0.91
48 or over 0.18 22.50 16.67 2.44 4.11
Total 0.11 6.99 52.47 28.57 6.84 5.02
*Average contributions required for different rates of pension. Average 10 gives a 50% pension while 48+ gives a full rate.

��
GREEN PAPER ON Pensions
Differential between contributory and non-contributory payment rates
5.26 Another relevant issue relates to the rate of payment of contributory and non-contributory pensions. Traditionally, contributory pensions are paid at a higher rate than their non-contributory equivalents in recognition of the contribution such people have made to the social insurance system over their working lives.
5.27 The counter argument is that if the function of the Social Welfare pensions system is to provide for basic living costs so that people do not live in poverty, then the rates should be aligned at a level which will ensure that everyone (particularly those relying solely on Social Welfare pensions) will be above that level. On the other hand, this does not necessarily rule out a premium on social insurance rates provided the non-contributory equivalent is set at a level which will provide an income that is above poverty thresholds, though some may view this as an unnecessary additional overhead on overall pension costs.
5.28 In relation to poverty thresholds there are, of course, differing views on the appropriateness of various poverty measures. In Ireland, Government policy is to use consistent poverty. The 2005 SILC report published by the CSO estimates that the level of consistent poverty among older people in 2005 was 3.7% compared to 7% generally. However, the standard used at EU level is 60% of median equivalised income and the rates at which pensions were paid over a number of years have not been sufficient to ensure that the EU poverty thresholds are cleared for all pensioners. However, the 2005 EU SILC survey also shows an improvement in this area with the poverty risk based on relative incomes falling from 27% in 2004 to just over 20% in 2005. There is a view that a formal indexing arrangement for pensions is required to ensure that payments keep pace with movements in income generally. On the other hand, setting payment rates from Budget to Budget allows Government the flexibility to respond quickly to general economic conditions and, as is evident from the significant pension
increases granted in recent years, this can also be beneficial for pensioners. Different indexing arrangements are discussed in more detail in Chapter 6.
5.29 There have been differing views over the years on the relationship between contributory and non-contributory pensions. The Commission on Social Welfare (1986) recommended that a uniform differential of the order of 10% should be maintained between social insurance and social assistance payments. The Commission saw this as being necessary “to preserve the acceptability of the social insurance concept”. In arriving at its conclusion, the Commission considered arguments that the most important principle which should underlie payments is adequacy in relation to need. On the other hand, the National Pensions Board (1993) in its report considered that “the fact that contributors are entitled under social insurance to pensions on a non-means tested basis provides sufficient recognition of the contributory principle underlying social insurance.”
5.30 The differential between the contributory and non-contributory schemes currently stands at less than 5% but it has been in decline for the last 10 years. In 1996, contributory pensioners received a premium of about 14% on their pensions. The full year cost of equalising the contributory and non-contributory rates (with means testing maintained) is estimated at €46 million, based on 2007 rates.
Means Testing of Increases for Qualified Adults
5.31 All contributory pensions include, where appropriate, an increase for a dependent spouse or partner. However, this increase is means-tested with a full increase payable where a spouse’s income is less than €100 per week, with reduced rates payable until income exceeds €250 per week. Unlike the means test for non-contributory payments, a household means test does not apply, i.e. a decision is made on the basis of the income enjoyed by the qualified adult only. However, where capital or property (other than the family home) is jointly owned, then the qualified adult will be assessed

��
GREEN PAPER ON Pensions
with 50% of any actual/notional income or capital value deriving from that asset.
5.32 Issues have been raised in relation to the appropriateness of this approach, particularly by the farming community, though representations have also been received from couples owning second houses or bank accounts in joint names. The farming community have also raised the question of the insurability of spouses who assist with the operation of a farm and this issue also has relevance for self-employed people in general where both of a couple are involved in running a business. This question is discussed in Chapter 6.
5.33 This system of means testing has its origins in the implementation of the EU Directive (79/7/EEC) which dealt with equality of treatment between men and women in matters of social security. At that time, married women were discriminated against in a number of ways by the Social Welfare system. In certain circumstances, they received lower rates of payment, the duration of benefits was shorter than those applying to men, they were effectively debarred from applying for assistance and they could only receive an increase for a dependent husband where he was invalided (a man qualified for the allowance no matter what the income/employment status of his wife). There were also difficulties in relation to the payment of increases for child dependants.
5.34 It was considered at the time that: “If equal treatment were applied by simply giving married women exactly the same rights married men now have, it would lead to ludicrous results…..Simply to extend to women the present conditions which men enjoy would mean that a wasteful and inequitable payment of adult and child dependant increases, even in respect of spouses at work in well-paid employment would be expanded enormously…” Accordingly, it was decided to redefine dependency in economic terms rather than basing it on gender or marital status … “one spouse will be regarded as dependent on the other spouse only if he or she is being wholly maintained by that spouse”73.
73 Dáil Eireann – Volume 359 –25th June 1985. Social Welfare (Amendment) (No. 2) Bill, 1984. Minister for Social Welfare (Mr B Desmond).
5.35 When introduced, the Qualified Adult Increase was payable in full where income was below a certain threshold and withdrawn completely once income exceeded the threshold. In 1997, the income threshold was €76.18. This created a poverty trap which was highlighted in various reports including the Report of the Review Group on the Treatment of Households in the Social Welfare Code (1991), the Second Commission on the Status of Women (1993) and the Expert Working Group on the Integration of the Tax and Social Welfare Systems (1996). Partnership 2000, a social partnership agreement which ran for three years from 1997, also provided for measures to alleviate this poverty trap.
5.36 Budget 1997 provided for the introduction of a tapered withdrawal of the Qualified Adult Increase with full payment being made where the income of the spouse or partner was up to €76.18 per week and reduced rates payable until income exceeded €114.28. Initially the tapered withdrawal was only introduced for a range of short-term benefits such as Disability Benefit (now Illness Benefit) and Unemployment Benefit (now Jobseeker’s Benefit) and their non-contributory equivalents. The arrangements were extended to contributory pensions in 2000.
5.37 It has been argued that means testing has no place in a social insurance type scheme. The purpose of the social insurance system is to provide income in the event of a person experiencing certain contingencies and it could be said that the existence of a spouse in a household who is “wholly or mainly maintained” by the insured person is part of the contingency covered.
5.38 In a pensions context, the means testing of qualified adult increases gives rise to particular difficulties. As already indicated, representations in this area have generally come from organisations representing farmers, and centre on cases where property is in joint ownership. Where such arrangements exist, half the actual income or capital value of the property is assessed against the qualified adult and may, depending on the income assessed, result in no payment being made in respect of the spouse or partner.

��
GREEN PAPER ON Pensions
5.39 These arrangements have been criticised because, on the one hand, in the context of paying social insurance, they do not recognise the shared ownership and divide the income for the purposes of assessing social insurance contributions while, on the other hand, when a person reaches pension age an income is attributed to them for the purposes of deciding on their entitlement to a qualified adult increase.
5.40 Where couples are concerned, the general view is that the preferred arrangement is for property and capital generally to be in joint ownership. It could be argued that the arrangements for payment of qualified adult increases militate against this.
5.41 Government policy is for people to maximise the income they can have in retirement and to allow as many people as possible to receive a personal payment. In the circumstances, some adjustments to the manner in which means are assessed in these cases might be appropriate. Another option might be a significant increase in the income levels at which the qualified adult increase continues to be paid to ensure that only those at higher income levels do not receive the payment.74 However, any changes in the arrangements for pensioners would need to have regard to similar arrangements which are also currently in place for qualified adults in other social insurance schemes. Obviously, the cost of any improvement would depend on the extent of reform introduced but the maximum potential cost is approximately €36 million in a full year.
74 There is a commitment in the Programme for Government to increase the income limits to enable more people to qualify.
The Social Welfare
Pension in Ireland
This chapter identifies and discusses the main issues which have arisen in relation to the Social Welfare pension system. In the main, the issues identified have arisen because of the limited coverage of the social insurance system up until the late 1980s and early 1990s, and societal norms which applied until the early 1970s. The manner in which the qualifying conditions for pensions are designed, particularly the average contribution test, can give rise to difficulties and there are also issues in relation to the use of means testing in relation to contributory payments. The appropriateness of the rates of payment, vis-à-vis the objectives of the Social Welfare system, is also an area which could be looked at. Possible approaches to the future development of the system are set out in the next chapter.


CHAPTER 06
The soCial Welfare Pension:reform oPTions

��
GREEN PAPER ON Pensions
Introduction
6.1 In this chapter the objective is to set out a range of approaches that could be considered to deal with the issues set out in the previous chapter. These range from maintaining the status quo to fundamental reforms involving the use of measures such as universal entitlements. The chapter also deals with the possibilities for structural reforms within the existing arrangements to address anomalies and inconsistencies which arise within the system. These latter options are not mutually exclusive and could be considered as stand-alone measures or as a series of reforms.
6.2 The “reforms” discussed in this chapter are put forward for consideration notwithstanding the sustainability issues discussed in Chapter 3 and which show that public spending on pensions is projected to increase from about 6% of GNP today to 15% by 2050. In the context of the Social Insurance Fund, the recently completed actuarial review shows that, on the basis of current policies, income to the fund will equal or slightly exceed outgoings up to 2010. From 2011 onwards, outgoings will exceed income with the shortfall growing continuously both in real terms and as a percentage of GNP. By 2061, outgoings are projected to exceed income by 6.4% of GNP. The increase in spending is largely driven by increases in pension recipients from 417,000 to 1.77 million over the period in question.
6.3 Clearly there are issues in relation to the funding of Social Welfare pensions which will need to be addressed by Government. These can be considered in the context of the funding of the overall Social Welfare system or through the overall budgetary position.
“Reform” A: Maintain the Current Arrangements
6.4 Any change in pension provision has long-term implications and it can take many years for the benefits accruing from reforms to come to fruition. In an Irish context the changes made in social insurance in the 20 year period from 1974 could be viewed as part of a long-term process
of transition of our Social Welfare pensions system to one based comprehensively on social insurance contributions.
6.5 The gaps in pension coverage which exist today are, to a great extent, the result of the structure of our social insurance system in the past and societal norms which existed through to the 1970s and which, for instance, required women in many cases to retire from employment when they married.
6.6 Despite the impact of these constraints on pension provision, the Government has sought to deal with as many issues as possible within the existing contributory and means tested structure, with due regard being paid to the need to uphold the contributory principle underpinning social insurance payments and, in the case of means tested benefits, to ensure that resources are used to best effect in addressing income needs. Over the years a range of measures have been introduced in pursuit of these goals including:
l Pro-rata pensions were introduced to cater for situations where people have social insurance contributions at different rates;
l The Homemaker’s Scheme was introduced from 1994 to recognise periods spent out of the paid workforce caring for children or incapacitated people;
l The yearly average contribution rate required for standard pensions was reduced from 20 to 10;
l Special pensions for self-employed who were already over 56 in 1988, and could not therefore satisfy the standard qualifying conditions, when compulsory social insurance was introduced for this group;
l Special pre-53 pensions were introduced to give additional recognition to contributions made prior to the creation of the unified system of social insurance;
l The means test for non-contributory pensions has been improved by increases in capital allowances and basic income disregards.
6.7 In addition to the measures outlined, pension increases have been well ahead of inflation thus ensuring that not only is the real value of pensions maintained but that they are

��
GREEN PAPER ON Pensions
significantly improved in real terms. Since 1996, and including the most recent increases pensions have increased by almost 119%, or about 57% in real terms, faster than both price and wages growth over the period.
6.8 As outlined in Chapter 4, based on the official consistent poverty indicator, older people are in a relatively better position than the rest of the population (3.7% compared to an overall rate of 7%). When considered in relative income terms the risk of poverty for older people is much the same as that for the overall population having shown a very significant improvement in SILC 2005, with the ‘at risk’ rate dropping to just over 20%, representing a significant decline on the 27% recorded one year previously. Further improvements in this regard can be expected as further significant Budget increases granted in 2006 and 2007 impact on the figures.
6.9 The impact of our earlier social insurance structures and societal norms will decrease in the years ahead as the Social Welfare pensions landscape is now very different:
l Almost all workers are now covered by the PRSI system and are contributing towards a Social Welfare pension;
l Arrangements are in place within the social insurance system to recognise time out of the paid workforce on caring duties in respect of periods from 1994;
l Workforce participation across all sectors of society has increased with consequent improvement in coverage for contributory pensions;
l Women are no longer required to leave employment on marriage. Even when women do make the choice to leave employment when they start a family, with an average age at marriage of 30.4 years75 and first births at 28.4 years76, they are more likely to have established a basic social insurance record which will ensure that the Homemaker’s Scheme is relevant to them.
6.10 Research undertaken in connection with the National Pensions Review projects the
75 CSO Vital Statistics Marriages Report 2002
76 CSO Vital Statistics Q3 2005
percentage of the population aged 66 and over covered by Social Welfare schemes (contributory and non-contributory) rising from a current level of about 88% to 98% by 2056. Within that coverage, there will also be a significant change in the proportion of the population on the contributory and non-contributory schemes, with the share on the latter dropping to just 2%.
6.11 Maintaining the status quo would mean that, in the short to medium term, about 47,000 people on average would remain outside the Social Welfare pensions system although changes in the means test for State Pension (Non-Contributory) introduced in 2006 and 200777 will see some of this group qualifying for some level of pension. That said, a significant number will still not qualify and these are mainly retired public servants and self-employed people together with their spouses and partners.
Reform B: universal Pensions
6.12 At the other end of the spectrum of reform options is the option of some type of universal pension. As already indicated, there are at present about 47,000 people outside the Social Welfare pensions system. Given the level of coverage which has been achieved, and the fact that over time we will achieve almost 100% coverage through social insurance, it has been argued that a restructuring should take place that would bring in those who remain outside the system and ensure that all people resident in the State are guaranteed some form of Social Welfare pension in their retirement. This would mean making pensions available on a universal basis, presumably with some minimum residency period required for qualification. Such an arrangement would deal with the anomalies and other issues outlined in the previous chapter. However, it means incurring significant additional costs to provide for people who would not otherwise qualify for Social Welfare support because they have not contributed to the social insurance
77 The basic means disregard increased from €7.60 to €30 per week and an earnings disregard of €200 per week is in place. Capital disregards have also increased to €20,000.

�0
GREEN PAPER ON Pensions
system, or their contribution is not deemed adequate under present arrangements, or their means (including pensions from other sources) and resources are such that their assessable income exceeds the current means test thresholds. It should be noted that the introduction of universal pensions does not necessarily mean the end of means testing in a pensions context. The possibility remains that there will be a number of people who may not satisfy the residency conditions that might apply to a universal pension. Some form of social assistance scheme may need to be maintained to cater for such people.
6.13 This pension could take a number of forms, including:
l A standard rate of payment to all on reaching pension age of, say, 66 years;
l A minimum payment to those without any existing welfare entitlement;
l A minimum age-related payment to those without any existing welfare entitlement.
6.14 A universal system would, however, be a radical departure from the present system, particularly if the suggestion for a standard payment for all were adopted. It would change the basis of payments from a system based on social insurance or need to one based on citizenship and/or residency. The introduction of such a scheme could have far reaching implications, not only for the State Pensions system, but also for the Social Insurance Fund in general.
Models of universal Pension Provision in Other Countries6.15 Universal pension systems operate in a
number of other countries. In general, entitlement to the universal pension is based on residency. However, in some cases, it is necessary to satisfy an asset and income test in addition to meeting the residency requirements. Typically, these universal pensions require a minimum period of residency in a country to qualify with payment related to the length of time a person has lived in a country. For instance, in the Netherlands all residents between the ages of 15 and 65 are insured for the General Old Age Pension. During the period of insurance, entitlement
to a pension is being built up by steps of 2% for every insured year. This leads to 100% entitlement to the relevant pension benefit upon reaching age 65, provided there are no gaps in the period of insurance. Years of non-insurance, for instance due to residence and work outside the Netherlands, do not count for entitlement to the pension benefit (the rate of pension is not reduced for years spent at school or university). Family status and the length of insured periods determine the rate paid. New Zealand has a universal pension known as New Zealand Superannuation. To qualify a person needs to be aged 65 or over and a legal resident of New Zealand, having lived there for ten years since age 20. Five of those years have to be since a person turned age 50. If a person receives a pension from an overseas Government, it is likely to be deducted from their New Zealand pension. In Australia, payment of pension is subject to a means and asset test.
6.16 In many instances, the universal pension is operated in conjunction with a social insurance based pension, which is usually earnings-related. While Ireland does not have the earnings-related pensions which social insurance provides in many countries, the basic principle of a social insurance based system allied to Exchequer-funded pensions for those without the necessary insurance applies in Ireland. A residency condition also applies in many instances and, while this is not something that has featured here to date it is something that may merit consideration in the context of overall future policy in this area.
The National Pensions Board and universal Pensions6.17 The National Pensions Board examined the
option of a universal pension scheme for Ireland in 1993. It considered a scenario whereby a flat-rate basic pension would be paid to all residents in the country on reaching pension age, in the event of invalidity, or to surviving dependants without having to satisfy a means test78.
78 Developing the National Pensions System – Final Report of the National Pensions Board (1993) p96.

�1
GREEN PAPER ON Pensions
6.18 Such a scheme would involve paying pensions to residents who have insufficient contributions to qualify for a contributory pension and who have means in excess of the maximum limits for social assistance pensions. Assuming that the rate of this pension would be equivalent to the maximum rate of the State Pension (Contributory), its introduction would also have implications for existing recipients of contributory and non-contributory reduced rate pensions. It is presumed that the notion of reduced pensions would disappear and those currently receiving these payments would be increased to the level set for the Universal Pension.
6.19 The main advantage of such an approach would be its breadth, simplicity and ease of administration, as the need for means testing would be eliminated. However, it would also have serious cost implications and could call into question the whole notion of social insurance in the pensions area as it is presently constituted. The issue of making special arrangements for people who have paid/are paying social insurance contributions would also have to be addressed.
6.20 Having examined all these issues, the National Pensions Board reached the following conclusion:
“The Board considered that a social insurance scheme, supported by means-tested social assistance, best satisfies the various criteria identified as appropriate for a flat-rate Social Welfare scheme. Such an arrangement is already well established and accepted and would avoid the need for elaborate transitional arrangements.”79
6.21 The present contribution conditions incorporate an element of solidarity as lower rates of contributions apply to those on lower earnings. The link between contributions and benefits tends to be more direct in pension systems in other countries. This solidarity is financed from the narrow base of contributions
79 The criteria identified by the Board included a sense of entitlement, consistency, financially sustainable, simplicity, provide equality of treatment and comprehensiveness.
on employment and self-employment. A universal scheme could perhaps be financed from the tax base, which would be more appropriate for such a solidarity based system, thus reducing non-wage costs.
Implications of a universal Pension6.22 Currently, Ireland, at 11%, has the lowest
proportion of people over 65 in the population in the EU. However, this will increase steeply in the coming years reaching a projected 15% in 2021, 19% in 2031 and 27% in 2051. Assessments on the financing of the State pensions system (Social Welfare and public service pensions) carried out by the EU Social Protection Committee in 2003 and 2005 suggested that our system, as currently constituted, was sustainable80. However, a more recent assessment by the EU (2006) puts Ireland at a medium risk in the area of sustainability81. A universal pension would serve to further increase costs and the burden on future taxpayers and would undoubtedly have implications for the sustainability of the system. As already indicated, the percentage of people who will be outside the pensions system will fall to about 2% of those aged 65 years and over. This still represents about 30,000 people and, in today’s terms, would cost about €331 million per annum if pensions were to be provided to them.
6.23 The financial sustainability of pension systems is a necessary precondition for the provision of adequate pensions. The ability of pensions to meet pensioners’ income needs in retirement is also important, however. Over time most people will, under the current arrangements, qualify for a contributory pension.
6.24 A large part of any additional expenditure incurred on a universal pension would be in respect of persons who are not eligible for a pension under current arrangements. These are people who do not have the necessary social insurance contributions to qualify for contributory pensions and whose means are at such a level that they cannot satisfy the means
80 Assessments under the Open Method of Coordination on national strategy reports for adequate and sustainable pensions 2003 and 2005.
81 The long-term sustainability of public finances in the European Union, European Economy No. 4, 2006.

��
GREEN PAPER ON Pensions
test for a non-contributory pension. This group consists largely of self-employed people with private or occupational pension cover and includes many public servants who are insured at modified rates which do not provide eligibility for contributory pensions, and whose occupational pension is such that they are not eligible for non-contributory payments. (From 1995, new public servants pay social insurance at full rates and are therefore eligible for a contributory pension. However, this will be integrated with their occupational pension.)
6.25 The introduction of a universal pension could also have very significant implications for Social Insurance Fund income. Clearly, in order to engender the necessary commitment and acceptance of social insurance, it is essential that people consider that they are deriving a significant benefit from their contributions. The introduction of a Universal Pension, which did not have a very significant differential between it and the contributory pension, could undermine this commitment and acceptance. PRSI contributions could be seen as more of a tax than an insurance measure with resultant pressure for the elimination of the pension element from the contribution. However, as already suggested, there is a significant element of social solidarity in the current system and this might be more appropriate for general taxation.
6.26 The Actuarial Review of Social Welfare Pensions (2000) estimated that approximately 62.5% of contributions could be allocated to the costs of long term benefits, i.e. State Pension (Contributory) and (Transition), Widow(er)’s Pension, Invalidity Pension, Deserted Wife’s Benefit and Household Benefits. When it is considered that Social Insurance Fund income in 2005 was €5,663 million the implications of any developments in this area for the funding of pensions could be very significant.
Social Insurance6.27 Apart from the additional costs involved, a
universal system would be contrary to the social insurance principle to which successive Governments have been committed. In fact, the Commission on Social Welfare (1986) argued for an extension of social insurance
in order to minimise the reliance on means-tested payments82. This has been the general thrust of policy for some years with additional groups, particularly part-time workers (1991) and the self-employed (1988), brought into the system.
6.28 There is now a comprehensive system of social insurance in place and, in light of rising workforce participation rates, the indications are that, in time, Ireland will have a comprehensive pension system operated through social insurance and for which most people will qualify. This trend is already obvious with 72% of old age-type pensions in payment in 2005 being contributory-based compared to 57% in 199683. However, despite the growing numbers qualifying for contributory pensions, there will still be a significant group relying on means-tested payments or outside the system altogether.
6.29 Breaking the link between social insurance and State Pension represents a fundamental shift in policy. It would mean a return to the situation prior to 1961 when the social insurance system provided for contingencies such as illness, unemployment and survivor benefits. At present, the link between social insurance contributions and contributory Social Welfare payments is reasonably obvious, particularly in relation to pensions.
6.30 The Commission on Social Welfare (1986) described the system of social insurance as:
“an expression of social solidarity and citizenship in which the risks and costs should be spread as widely as possible in the community”
and stated that:
“A sense of entitlement to benefit is an important principle which should underlie the Social Welfare code, and this sense of entitlement is most easily achieved in the social insurance system where benefits are paid as of right on the basis of contributions paid.”84
82 Commission on Social Welfare (1986) p220.
83 Statistical Information on Social Welfare Services 2005.
84 Commission on Social Welfare (1986) p220.

��
GREEN PAPER ON Pensions
6.31 The Commission also called for an extension of social insurance so that reliance on means-tested payments could be minimised. As the social insurance system is based on entitlements rather than means-testing, this helps to lessen any stigma attached to claiming a means-tested payment. The Social Insurance in Ireland report, published by the Department of Social Welfare in 1996, outlines other advantages of a social insurance based system:
“…it gives them (individuals and families) a degree of certainty in advance regarding their entitlements in the event of specified [e.g. old age, being widowed] contingencies arising”
“recipients contribute to the cost of their benefits and rely on Exchequer financing only to a very small extent.” 85
6.32 However, the link between residency, general tax and the (eventual) contingency is not obvious or transparent. Therefore, the introduction of a residency-based pension could weaken the incentive/acceptance of the need to contribute towards funding. In addition, persons who had contributed for many years to the contributory schemes under social insurance could find that these contributions conferred no benefit, unless a universal system was phased in over a long period for new entrants to the labour force.
Eu and Bilateral Arrangements6.33 The introduction of a residency-based scheme
could have an impact on the operation of EU pro-rata pension arrangements as well as bilateral agreements with non-EU countries. EU Regulation 1408/71 coordinates social security arrangements across the EU by means of a number of underlying principles, two of which are relevant in this context; waiving of residency requirements and aggregation of periods of residence or contribution.
6.34 The first principle is usually applied to allow payment of benefits and pensions abroad. It is estimated that, at present, we export contributory payments to about 45,000 people. In addition, the Regulation provides that, where
85 Social Insurance in Ireland (1996) p21.
the legislation of a Member State makes the acquisition, retention or recovery of the right to benefits subject to the completion of periods of insurance or of residence, that Member State shall take account, where necessary, of the periods of insurance or of residence or of completed under the legislation of another Member State. In effect, this means a continuation of existing pro-rata arrangements, but instead of eligibility being based on social insurance contributions, the assessment would be based on periods of residency. Given that we already export a significant number of payments, it is difficult to say to what extent this would increase under a residency-based system. Clearly, the export of payments will, in any event, increase in the years ahead as the entitlements of migrant workers mature.
6.35 The administration of a system based on residency would pose added difficulties. There is no system in place to confirm residency on an ongoing basis and it is difficult to envisage how such a system would be monitored. The Habitual Residency Test (HRT) is in operation to assess entitlement to assistance and this approach may offer some solutions to this problem.
6.36 The National Pensions Board considered that a universal pension could be financed through general taxation and stated that:
“A special tax could be introduced to partly or fully finance expenditure on pensions as is the case, for example of the health contributions, payment which does not confer specific entitlements to benefits.” 86
6.37 However, as already indicated the final report did not support the introduction of such a pension.
Options for universal Pensions and Estimated Costsuniversal Standard Rate Pension6.38 The most straightforward option would
involve a standard rate payment to all with an associated residency condition to ensure that only long-term residents of the country received the full benefit of the pension.
86 Developing the National Pensions System – Final report of the National Pensions Board (1993) p.96.

��
GREEN PAPER ON Pensions
6.39 At this stage of our development, it is probably reasonable to assume that those residents who are at present outside the Social Welfare pensions system have lived here for most of their lives. Accordingly, a universal pension would involve introducing payments for the approximately 47,000 people currently outside the system and increasing the payments of existing welfare recipients and qualified adults on reduced payments to the agreed level of the universal pension. These include public servants recruited prior to 1995 who are not currently eligible for Social Welfare contributory pensions (they can apply for non-contributory pensions, which are means tested). It could be argued that such people are already getting significant State support in retirement while, on the other hand, excluding them could be viewed as discrimination given that, in common with many other workers, their retirement income derives from an occupational pension. For the purposes of this exercise it is assumed that the pension would be paid at the existing maximum rate of the State Pension (Contributory) which for 2007 is €209.30.
6.40 The full year cost of providing a standard rate pension for all citizens at €209.30 per week is estimated as follows:
Table 6.1: universal Pension at existing maximum rate of State Pension (Contributory)
Cost €
million
Providing for 47,000 outside the Social Welfare system
518
Upgrading QAI, non-contributory and reduced rate payments
657
Total 1,175 6.41 The long-term cost would be considerably
less because over time more people will, in any event, qualify for full-rate pensions as a result of improved social insurance cover and work-force participation and qualified adult payments and non-contributory will have a much reduced role in the system in the future. However, the group remaining outside the system, although small in overall percentage terms (2% per the National Pensions Review), will still comprise about 30,000 people and
cost of the order of €326 million per annum in today’s terms to provide for. The estimated costing does not take account of the cost of exporting payment to former residents. (For illustrative purposes, the net present value of the cost of a universal pension out to 2050 would be some €30 billion in 2007 terms, two thirds of which would relate to modified rate public servants).
Standard Rate Reduced Pension for those currently outside the SW system6.42 In recent years a number of special pensions
have been introduced to provide pension cover for a number of groups who could not satisfy the standard qualifying conditions. These include the special pre-53 pension and the special pension for the self-employed which are paid at 50% of the maximum personal rate. A similar approach could be adopted to provide pensions for those currently outside the system.
6.43 This approach would be less radical than the first suggestion as it would not call into question the contributory principle underlying the current PRSI system. There would still be significant benefits for those at the higher end of the contribution ladder. People with the minimum number, however, would derive no extra benefits from their contributions - although the number receiving payments at less than 50% of the maximum State Pension (Contributory) rate is relatively small.
6.44 The estimated full year cost of providing a pension at 50% of maximum State Pension (Contributory) rate (€104.65) is as follows:
Table 6.2: universal Pension at 50% of the maximum rate of State Pension (Contributory)
Cost €
million
Providing for 47,000 outside the Social Welfare system
259
Non-con and reduced rate payments currently receiving less than 50%
98
Total 357

��
GREEN PAPER ON Pensions
universal Age-Related Pension6.45 Another option for reform is paying a
pension based on age to those who are outside the Social Welfare system. A similar approach has been taken in relation to the Household Benefits where, until relatively recently, eligibility was based on the receipt of designated payments and household composition. In 2000, qualifying conditions for Household Benefits were changed to allow those over 75 years of age to qualify regardless of income or household composition and this was extended to those over 70 years in 2001.
6.46 A similar approach could be taken in relation to pensioners, although this group (i.e. those who do not satisfy a means test and who do not have the required number of contributions) would not usually be considered appropriate for targeted income support payments. Despite the easing of the qualifying conditions for pensions introduced in recent years, this group does not satisfy the contribution conditions for social insurance payments. Neither can they satisfy a means test, suggesting that they have an adequate income (in Social Welfare terms) through occupational or private pension coverage, income from property or savings/capital. It should be pointed out, however, that many private occupational pensions do not provide for indexation so, in real terms, their overall income may deteriorate as they grow older. That said, EU-SILC results found that poverty rates are lower for those aged 75 or over than for those aged between 65 and 74.
6.47 Accordingly, if it were decided to issue a payment based on age then it would be more in recognition of senior citizens rather than any perceived Social Welfare need. However, for those with income just above the level for the State Pension (Non-Contributory), any payment would be welcome and could make a significant difference in the quality of their lives.
6.48 Table 6.3 gives an estimate of the numbers of people at various ages who are not receiving Social Welfare payments either in their own right or as dependants on their spouse or partner’s pension.
Table 6.3: Estimated numbers at various ages not receiving SW payments
Age Number not receiving SW payments
65-69 14,000
70-74 12,000
75-80 10,000
80-84 6,000
85+ 5,000
6.49 If it were decided to pay a pension/recognition payment to people based on age, the level of such a payment has to be determined. In suggesting a rate, it is assumed that the existing insurance based/means based structure remains in place. Accordingly, in fairness to those who have contributed to the PRSI system or whose means are such that they are in need of income support, any payment based on age would have to be pitched at a level which was very much below the maximum rates payable.
6.50 Accordingly, the estimated cost of paying a 50% (€104.65) pension at various age levels is as follows:
Table 6.4: Cost of age-related pension for non-welfare recipients87
Age Cost €m
65 259
70 182
75 116
80 61
85+ 28
Advantages/Disadvantages of a universal Pension6.51 The introduction of universal payments has
advantages and disadvantages and the extent to which these would apply depends on the level of payment decided upon. In addition, the relative merits of the proposal depend on whether the intention is to provide a standard payment to all or a recognition payment in retirement.
6.52 On the positive side, a full-rate universal pension would:
87 These figures do not take account of knock-on costs of increasing Social Welfare pensions paid at less than 50%.

��
GREEN PAPER ON Pensions
l Provide a standard, individualised payment to all long-term residents (as suggested at 6.12 some means tested scheme may need to be maintained for those who do not satisfy the residency conditions);
l Deal with issues of equity associated with people who work inside and outside the home;
l Eliminate anomalies associated with contribution conditions and ensure consistent treatment for everyone;
l Be simple to administer and eliminate the need for schemes such as the Homemaker’s Scheme as well as means testing to a large extent. That said, some arrangements to confirm residency would be required in the longer term.
6.53 Reduced rate pensions would also provide an income for all residents and would make some contribution in the area of equity (although not to the extent that a full payment would). Indeed, it could be argued that paying less to someone who worked in the home because they did not contribute could perpetuate arguments relating to parity of esteem between those who work outside the home and homemakers. That said, it would afford some recognition to all residents in retirement. In terms of reduced administration, reduced payments would likely have little impact as there would always be the possibility of someone improving on the recognition payment through means assessment or PRSI contributions.
6.54 The negative aspects of the system can be summarised as follows:
l A universal pension would be against longstanding Government policy that has sought to provide individual pensions through expanding PRSI coverage;
l While means testing would be eliminated (if a universal pension was at the full rate), other administrative complexities would be introduced to confirm periods of residency in the country;
l It would involve a very significant increase in expenditure in the medium term which, depending on the option involved, could be as much as €1 billion per annum;
l New funding arrangements might be required for pensions as payment of a standard rate to all residents funded from PRSI contributions might not be tenable;
l It would add to the growth in numbers which are already projected for the Social Welfare pension in the coming years putting further pressure on funding in the future. However, in this regard, improved social insurance will, in any event, see up to 98% qualifying for payments against 88% today;
l There would be reduced incentives for older people to return to/remain in active employment;
l It would involve poor targeting of resources by payment of pensions to people who have not contributed to the PRSI system and whose position is such that they cannot qualify at present for means tested benefits;
l It would weaken the link between contributions and pensions.
Conclusion6.55 The payment of a universal pension is, from
some perspectives, an attractive proposition because of the potential it has to deal with many issues in the pensions area. However, it would be contrary to long-standing policy in this area that favours the provision of individual entitlement through payment of PRSI contributions. The possible need for alternative funding arrangements for pensions in a scenario where they were paid as of right, rather than on the basis of contributions or means, and the very significant extra costs involved are major issues that also need to be considered.
Reform C: Reforming and Back-Dating the Homemaker’s Scheme
6.56 As already indicated, one of the main issues relating to the Social Welfare pensions system is the treatment of those who left employment to care for children or sick or incapacitated people. Their position, in so far as pensions are concerned, is protected for the future, but issues continue to be raised regarding those who left employment before 1994, when the Homemaker’s Scheme was introduced.

��
GREEN PAPER ON Pensions
6.57 The Homemaker’s Scheme was examined as part of a general review of qualifying conditions for Old Age Contributory and Retirement Pensions in 2000. That report highlighted two areas which it considered should be examined further:
l A proposed switch from the current 'disregard' system to a credits-based mechanism which would provide cover for State Pension (Contributory) only.
l The report also considered that there was no fundamental reason, in principle, why the Homemaker provisions should only apply from 1994.88 That said, any proposals in relation to homemakers give rise to issues of equity and consistency vis-à-vis other groups who are/were outside the Social Welfare pension system or getting reduced payments by virtue of their exclusion from social insurance cover over the years.
6.58 The Equality Authority has stated that “the question of extending the Homemaker’s Scheme to older women, in particular those who were obliged to leave the labour force on marriage, should now be addressed with a view to allowing as many as possible to qualify for pension entitlements in their own right”89. However, such a recommendation does not take account of the fact the Homemaker’s Scheme will not of itself provide a person with a pension, as the basic qualifying conditions in terms of, inter alia, contributions paid, must also be satisfied. In particular, the scheme cannot deal with the position of public servants who left employment as a result of the marriage bar. Such people were insured at modified rates of social insurance, which did not provide cover for contributory pensions, and unless they subsequently worked in employment covered by Class A PRSI it is unlikely they could benefit from the scheme, no matter what measures are taken in relation to backdating the scheme.
6.59 It is also worth noting that the Government has committed to increasing the Qualified Adult Increase to the rate of the State Pension (Non-Contributory) and has legislated to provide for a direct payment to the qualified adult
88 Review of the Qualifying Conditions for the Old Age (Contributory) and Retirement PensionsDepartment of Social and Family Affairs (2000).
89 Implementing Equality for Older People (2002).
from September 2007. This facility has been available on a voluntary basis, and where both of a couple agreed to the arrangement, since 2002. To October 2006, 1,400 couples have opted to have the Qualified Adult Increase paid directly to the spouse. This represents 8% of claims awarded with a Qualified Adult Increase since October 2002. It is expected that the new arrangements will see separate payments to qualified adults increasing by about 4,000 each year.
6.60 According to the CSO, there were 262,00090 women aged 65 and over in the State in 2006. Some 215,000 women receive Social Welfare payments in their own right and 32,000 are qualified adults on their spouse’s pension. However, 17,000 of these are resident abroad which means that about 88% of women over 65 years of age resident in Ireland are receiving Social Welfare payment.
Options for Changes to the Homemaker’s Schemei) Period covered by the Homemaker’s Scheme
- Approaches in some other countries91 6.61 Pension provision varies considerably from
country to country. In countries where old age pensions are based on a social insurance system, there are some differences in the periods of non-insurance taken into account/credited for entitlement. The most common intervals covered by such arrangements are periods of sickness, invalidity, unemployment, maternity, childcare and education. Denmark operates a social insurance based system but no non-contributory periods are taken into account in assessing entitlement to old age pension. In countries such as Australia and New Zealand, where qualification for old age pension is based on means or residency, such issues do not arise.
6.62 The periods of non-insurance due to caring duties which are credited/taken into account in other countries are generally quite short. The following are some examples:
Germany - 36 months can be credited for looking after a child born since 1992;
90 Population and Migration Estimates April 2006.
91 Unless otherwise stated the information in this section derives from MISSOC.

��
GREEN PAPER ON Pensions
Spain - the first year of parental leave granted to bring up a child under three years of age is credited for pension purposes;
Greece - for periods covered by parental leave, there is an option to repay missing contributions, amounting to 3 months per child;
France - credit of 2 years insurance per child for mothers and periods of parental leave with a limit of 3 years;
Luxembourg - periods spent caring for a child or dependant;
Norway - years caring for a child under 7 or caring for a disabled, sick or older person;
Austria - periods spent raising children (up to 4 years per child); and
uK - Provision for homemakers within the UK State Pension system is similar to the situation in Ireland. In the UK, a programme called Home Responsibilities Protection (HRP) helps to protect the basic state Retirement Pension position of carers. A person may be entitled to HRP if s/he is not working, or his/her work is low-paid because s/he is looking after:
l a child under 16;
l a person with a long-term illness; or
l a person with a disability.
In the UK, full years of HRP can be ignored when the number of qualifying years needed to earn a full basic state Retirement Pension is being examined. However, it is still necessary for the person to have at least 20 qualifying years in addition to any years covered by HRP92. The UK is, however, engaged in an overall reform of its pension system, including the Basic State Pension. The reforms involve reducing the requirement for a full pension to 30 years and introducing weekly credits to recognise and reward caring in the same way as working. The reform will mean that almost half a million extra women over State Pension age in 2025 - aged around 45 to 55 today - will be entitled to a full Basic State Pension.
92 www.pensionsguide.gov.uk
6.63 The international experience outlined would suggest that allowing credits or disregards for caring for a child up to 12 years of age is excessive (although the UK adopts a similar approach to here), particularly given the improved workforce participation of women.
ii) Replacing disregard system with credits6.64 It is generally thought that credits would be a
more appropriate way of recognising periods of caring and, as outlined at 5.17, they are also more beneficial to a person than a system of disregards. The extent of this advantage will depend on the nature of the individual’s contribution record. Credits also will keep a record active, complete and transparent during periods of mobility between the paid workforce and work in the home.
6.65 As with the existing Homemaker’s Scheme, it would seem appropriate that a Homemaker’s Credit should only be relevant in the context of qualification for the State Pension (Contributory), although it could be argued that if the purpose of the scheme is to protect pension entitlements of employees then the scheme should also apply to eligibility for State Pension (Transition). Homemaker Credits could be earned at any time in a person’s career and need not necessarily follow a period of insurable employment.The important issue is that the Homemaker’s Credit must be supplemented by the necessary paid contributions, at the appropriate rate, and these could be earned at any time.
6.66 As is the case with the present disregard system, men and women could be treated equally on the introduction of Homemaker’s Credits. However, it would seem appropriate that only one parent should be entitled to Homemaker’s Credits in respect of time spent caring for their children at a given time. Where a couple is separated/divorced, only one parent could be awarded credits in respect of a particular child at any given time. It would also seem appropriate that only parents, or those with legal guardianship/custody of children, should qualify for credits. This would be necessary to ensure that people engaging in informal childcare arrangements do not receive credits.

��
GREEN PAPER ON Pensions
6.67 Periods spent homemaking abroad would, in general, not be covered by credits though regard would have to be had to EU legislation. This would mean that a person whose last insurable employment was in this country would remain entitled to Homemaker Credits until they became subject, through employment, to the insurance legislation of another Member State. Similarly, a person from another Member State who took up residence in this country would have to become insurably employed here before they could benefit from the Homemaker’s Scheme.
6.68 The position of the spouses/partners of foreign aid workers who travel with them to developing countries is also an area where concessions might be considered. The current scheme requires that a homemaker is normally resident in this country and, while at present they may receive Child Benefit as the child is still regarded as resident in this country, there is no such assumption made in respect of the carer and they cannot, therefore, benefit from the Homemaker’s Scheme.
6.69 The cost of changing to credits will depend on a number of factors, with the employment history of those applying and their ability to combine caring duties with work being particularly important. The latter will mean less reliance on Homemaker Credits. As already outlined, credits will serve to increase the average contributions a person has and will tend to move them to the next higher rate. However, the Homemaker’s Scheme is not yet a factor in deciding pension claims and it may be some time yet before it becomes relevant. In the circumstances, it is difficult to say what the cost implications will be or when they are likely to arise.
(iii) Backdating the Homemaker’s Scheme 6.70 When the Homemaker’s Scheme was
introduced in 1994, it was not backdated. Accordingly, existing pensioners or those who have not yet reached pension age but whose children were already over 12 years of age at that time may not benefit from the scheme. A number of options for backdating are discussed in the following sections. Apart from the abolition of the marriage bar, these dates coincide with milestones in the development of
the social insurance system.
6.71 Before dealing with possible options for back-dating the scheme, it is appropriate to outline some of the principles underlying the existing qualifying conditions for state pensions as these are relevant in considering what, if any, action should be taken in this area. Therefore, it is considered that options for change must be:
l consistent with the social insurance principle and the contributory nature of the non-means-tested system which is in place. This means that, in order to qualify for a contributory pension, a person must have a sufficient number of paid/credited contributions at the appropriate rate. People whose only attachment to the insurance system is, or was, at a modified rate of insurance, which did not include coverage for contributory pension, cannot benefit from homemakers provisions. The position of this group could perhaps be dealt with in the context of consideration of the merits of a system of universal pension to cover all groups outside the Social Welfare pensions system. Alternatively, it could be a matter for consideration in the context of public service pensions policy generally, as public service policies are what gave rise to these issues in the first place;
l equitable not just in its treatment of men and women but in its treatment of different generations of contributors;
l affordable - this will be a major factor in deciding what action should be taken in this area, particularly given the demographic projections for the ageing of our population. Clearly, extending coverage/increasing payments to large numbers of people will be costly;
l administratively workable - changing eligibility conditions means reviewing large numbers of existing cases. Records to support individual cases are not always readily available, particularly where they relate to periods before 1979 i.e. when insurance records were computerised.
6.72 In general, the various extensions of the

�0
GREEN PAPER ON Pensions
social insurance system over the years have been effective from the date of introduction of the relevant change. Such development has not, to date, involved any underlying or retrospective change to the social insurance history of contributors. The introduction of Homemaker’s Credits for periods prior to 1994 would represent a significant shift in the method used to develop the system and could give rise to serious equity issues vis-à-vis other groups who were excluded on a compulsory basis from coverage over significant periods since 1953. The self employed, higher earning non-manual workers, and certain part-time workers are among the groups who could, with certain justification, argue that they too were excluded from cover in the past and that they too should have their social insurance records enhanced. Any such special arrangements for other groups would inevitably have cost implications.
6.73 Backdating the Homemaker’s Scheme could be very beneficial for a certain group of older women, i.e. those who were in insurable employment at standard rates and who managed to accumulate the basic paid requirement of 260 contributions. For instance, a woman who started work at 16 years of age in 1956, worked for 5 years (260 contributions) and then left employment on marriage would have no pension entitlement at age 66. Her 260 contributions would be averaged over 50 years giving a yearly average of just over 5 contributions (an average of 10 is required for a minimum pension). Applying the homemakers disregard of 20 years still leaves this person without an entitlement as the record is averaged over 30 years giving a result of 8.5 which is also short for a minimum pension. However, the addition of 20 years credits to the basic paid requirement of 260 brings total contributions to 1,300 which averaged over 50 years gives a result of 26 contributions which, at present, entitles a person to a pension of 98% of the maximum rate.
6.74 Accordingly, it must be understood that back-dating the Homemaker’s Scheme will only benefit a certain cohort of women, i.e., those who were in employment at standard social insurance rates and who worked long enough
to accumulate the basic paid requirement of 260 contributions. It will not benefit those, mainly public servants, who left employment as a result of the marriage bar. As outlined at paragraphs 6.58 and 5.18, other avenues of redress may be required for this group if it is considered that action is required in this area. A factor in this regard would be the comparative position of those who left as a result of the marriage bar and those who left the public service prior to the mid-1970s for reasons other than marriage and who did not have preserved pension entitlements (as there were no vesting requirements at that time). Further considerations would be (i) the marriage gratuity paid in lieu of pension entitlement to women who resigned because of the marriage bar and (ii) the fact that occupational pension benefit is only payable in respect of actual service with a relevant employer.
6.75 If, having considered all of the implications, including those for other groups excluded from the social insurance system over the years, it was decided that the scheme should be backdated, there are a number of options which could be considered. Clearly, the further the scheme is backdated, the more impact it would have on the position of older women generally. The options which could be considered are as follows:
l 1953 which coincides with the introduction of the unified system of social insurance in this country. Backdating to 1953 potentially benefits the most women including those who are already over pension age. From an administrative point of view, and based on the Department’s experience in operating the pre-53 pension scheme, such backdating would be difficult to operate as records from then until 1979 are mostly paper/micro-film based;
l 1973/1974 when the marriage bar was abolished and the upper income limit on eligibility to contribute to social insurance was removed. Operating the scheme from 1973/74 would certainly benefit existing pensioners and those nearing pension age, though the extent to which they would benefit would be considerably less than if the scheme operated from 1953. Pensioners currently at or just over

�1
GREEN PAPER ON Pensions
pension age were born around 1940 and it is possible that some of their children would be past the current qualifying age of 12 years by 1973/74 (and, for older women, most likely all of their children would have been over the qualifying age) and so the scope for accumulating credits is much reduced;
l 1979 was another milestone in the development of the social insurance system with the replacement of the flat rate contribution with one based on a percentage of earnings. The central records system was also computerised which made the maintenance and retrieval of a person’s contribution record from 1979 much easier. By 1979, existing pensioners will have generally been in their forties. At that stage, their children would be expected to be in their early teens and past the stage where they would qualify for Homemaker’s Credits. Accordingly, the main beneficiaries of backdating to 1979 would probably be people who have not yet reached pension age. People caring for older/sick relatives could possibly benefit. However, as over 70% of this group is caring for less than 3 years, the impact on their pension entitlements would be limited;93
l 1988, 1990, 1991. There are a number of options around this time which could be considered as dates from which the scheme could operate including: 1988 - Compulsory social insurance extended to the self employed; 1990 - Introduction of the Carer’s Allowance which was the first payment made directly to carers; 1991 - Social insurance extended to part-time workers. Backdating to these dates would be unlikely to benefit existing pensioners or those near pension age. The benefit would almost all accrue to those who still have relatively young families. Accordingly, it would be some time before the effect of such backdating would be felt in terms of pension payments.
6.76 The cost of backdating the scheme will obviously be an important factor in deciding what action, if any, should be taken in this area.
93 Department of Social and Family Affairs (1998) Review of Carer’s Allowance
In the absence of any information on those involved, including their family circumstances, their work record or their insurance record, it is extremely difficult to estimate with any degree of certainty what the likely impact of backdating will be. Accordingly, the following estimates are extremely tentative. Also, it should be noted that a large part of the additional cost involved would go towards improving the position of those who are already receiving reduced rate pensions or are being supported as qualified adults on the pension of their spouse or partner.
Table 6.5: Cost of backdating the Homemaker’s Scheme
Backdating Option Estimated Immediate Annual Cost €millions
1953 160
1973/74 150
1979 10
1988/1990/1991 No immediate impact.
6.77 Having regard to the pre-1953 experience, it would also be prudent to make allowance for the eligibility of women currently abroad but who may have established an insurance record here before emigrating. Allowing for perhaps 13,000 such claims with people qualifying for pensions at say 75% of the maximum rate the annual cost would be an additional €107 million on backdating to 1953 or 1973/74.
6.78 As can be seen, backdating this scheme could be quite costly. While a number of options are presented, if backdating was to occur on an equity principle alone, then it should probably go back all the way to 1953. To do otherwise would be to discriminate against older women without any objective reason. As already indicated, however, there is a view that backdating the Homemaker’s Scheme would be inequitable in the context of the wider Social Welfare insurance system, in that it only deals with one section of the population (mainly women) who were excluded from social insurance coverage for many years and ignores the position of others who were also affected by earlier policies on social insurance coverage.

��
GREEN PAPER ON Pensions
Reform D: Replacing the Average Contribution Test with a Total Contributions Approach
6.79 The current qualifying conditions were set out in 1961 when contributory pensions were first introduced. They were designed to ensure that people could qualify for pensions from day one and to reflect the less than comprehensive nature of social insurance at that time, the result of which could be significant gaps in a person’s insurance record. While some changes have been made down the years by changing the average number of contributions required for different rates, the basic principles that applied then are still in operation.
6.80 At present, in order to qualify for State Pension (Contributory) or State Pension (Transition), a person must have a yearly average of at least 10 or 24 contributions respectively (in addition to satisfying the other conditions). As already indicated, this Yearly Average Test gives rise to what some consider are anomalous situations, as people with the same overall number of contributions may receive different levels of payment. A person with, for example, 500 contributions could, depending on when they became insured, qualify for a higher pension than someone with 1,000 contributions. The key is the length of time over which the contributions are averaged.
6.81 The Review of Qualifying Conditions for Old Age Contributory and Retirement Pensions suggested that the possibility of switching to a system based on the total number of contributions, paid and credited should be considered. The report concluded that
“…the adoption of a system whereby title to pension would be determined by the total number of contributions paid and credited during a person’s working life, would seem to deliver transparency and fairness.”
6.82 A key issue in any decision to change the basis of assessment from average to total contributions is to set an appropriate level of contribution which takes account of the potential people now have, as a result
of improved social insurance coverage and increased workforce participation, to accumulate contributions over their working lives. In this regard, a Social Welfare pension is a valuable asset, which could cost €250,000 to purchase by way of a (price-indexed) annuity. While there is a significant amount of redistribution in operation via the PRSI system, it would still seem reasonable to insist that those qualifying for a pension should have contributed towards that pension to the maximum extent possible. At the same time, we must be conscious of the fact that those qualifying for pensions today, and for some time to come, will have worked through an era when social insurance was less than comprehensive and also societal norms limited access to labour markets for women.
6.83 Before assessing the current situation in relation to the contribution records of existing pensioners, and possible options for change, it is helpful to briefly examine the manner in which the current system of averaging operates.
Operation of the yearly Average Test6.84 The ‘Yearly Average’ is arrived at by dividing
the total number of reckonable contributions (i.e. full rate contributions which are either paid or credited) in the period from the person’s date of entry into social insurance or from 1953 (if the person entered insurance prior to that date) to the last complete contribution year prior to age 66 or 65, by the number of years in question. Currently, a minimum average of 10 contributions is required to qualify for a State Pension (Contributory) at age 66 and a minimum average of 24 contributions is required to qualify for State Pension (Transition) at age 65.
6.85 In addition to this yearly average, a person must have a minimum number of paid contributions in order to qualify for a pension. At present this is set at 260 contributions and will be increased to 520 in 201294. They must also enter insurance 10 years before pension age.
6.86 Current claimants may have entered employment as early as 1954 and face a
94 Standardised at 260 from 2002. Prior to then, 156 was sufficient in certain circumstances.

��
GREEN PAPER ON Pensions
potential divisor of up to 50 years when their yearly average is being calculated. However, they may also avail of the “alternative yearly average test” which was introduced in 1992. This allows a person to qualify for a full pension if s/he has a yearly average of 48 or over since 6 April 1979, when the PRSI system came into operation.
6.87 Special arrangements also apply to self-employed contributors that facilitate discounting earlier periods of insurance (if applicable) prior to 6 April 198895. These arrangements mean that 6 April 1988 is taken as the date of entry into social insurance (provided that the person actually entered compulsory social insurance on that date) for the purposes of calculating the yearly average.
6.88 Since April 1994, up to a maximum of 20 years spent homemaking can be disregarded when calculating the yearly average.
6.89 The present arrangement of a four rate band structure, i.e., 100%, 98%, 75% and 50% for State Pension (Contributory) (there are only 2 bands for State Pension (Transition)) dates from 2000. Prior to that there were six rate bands. The present 98% band replaced the previous 92%, 94% and 97% bands96. The current rates of payment are presented in the following table.
6.90 The issues in relation to the average contributions test, and the anomalies it
95 Compulsory social insurance was extended to self employed at that time.
96 Since 2001 the rate paid in respect of qualified adults reflects the rate of the main pension i.e. if the pensioner qualifies for a 50% pension the qualified adult payment is also 50% of the full rate.
creates, have already been outlined earlier in this section. However, it is worth noting in relation to the above that a person with a yearly average of 20 contributions receives just €4.30 per week less than someone with an average of 48 contributions. This is despite the fact that the latter person could have had a much greater attachment to the social insurance system over the course of his/her career and a higher total number of contributions (paid and/or credited).
6.91 In a total contributions approach, the impact, or lack of impact, of additional contributions on the level of payment received is more obvious than in the yearly average test. In the circumstances, a more gradual rise in payment in line with the contribution levels achieved might be more appropriate.
Contribution history of a sample of pension awards6.92 A survey of about 9,000 cases where a State
Pension (Contributory) or State Pension (Transition) was awarded in the period May to December 2006, was carried out in order to establish the level of contributions held by those people qualifying for pension. The results of the analysis of these data are presented in this section.
Number of years with contributions6.93 The following tables illustrate the numbers
of years in which contributions were paid by the sample of 9,000 successful applicants for State Pension (Contributory) and State Pension (Transition) referred to in paragraph 6.92.
Table 6.6: Weekly Rates of Payment from January 2007
Scheme Average 48+ Average20-47* Average15-19 Average 10-14
State Pension (Contributory)
€209.30 €205.00 €158.00 €104.70
State Pension (Transition)*
€209.30 €205.00
*An average of 24 contributions is required to qualify for State Pension (Transition)

��
GREEN PAPER ON Pensions
6.94 It is clear from this table that the number of people with contributions paid or credited in more than 40 years is quite small. The effective retirement age in Ireland is at present about 64 years of age which is, for a person starting work at 18, a working life of about 46 years. Accordingly, it seems inconsistent that only 7.6% of claimants have years of contributions approaching this level with just over 61% recording contributions from 10 to 24 years. Part of the explanation lies in the fact that the self-employed, who are only insurable from 1988, feature here. Furthermore, the qualifying conditions for State Pension (Contributory) are less stringent than those applying for State Pension (Transition) and so
people with less than complete contribution records would be expected to feature here.97
6.95 The position improves significantly when applicants to State Pension (Transition) are examined. In order to qualify for this payment, a person needs a yearly average of at least 24 contributions (10 required for State Pension (Contributory)) and so it would be expected that records would be more complete. Also, this scheme is confined to employees who have been fully insured since 1974.
97 These are the years in which a contribution is re-corded. Each year could include anything from 1 to 52 contributions.
Table 6.7: Number of years with Paid and Credited Contributions - State Pension (Contributory)98
Claims Awarded
No of years with contributions, (paid or credited) Males % Females % Total %
<5 0.02 0.00 0.02
5 to 9 2.31 0.74 3.04
10 to 14 10.17 7.36 17.54
15 to 19 24.16 7.29 31.45
20 to 24 7.13 5.02 12.15
25 to 29 15.02 5.06 20.07
30 to 34 3.10 1.41 4.51
35 to 39 2.73 0.83 3.57
40 to 44 2.73 0.45 3.18
45+ 3.86 0.62 4.48
Total 71.23 28.77 100.00
Table 6.8: Number of years with Paid and Credited Contributions - State Pension (Transition)
Claims Awarded
No of years with contributions, (paid or credited) Males % Females % Total %
<5 0.00 0.04 0.04
5 to 9 0.08 0.08 0.16
10 to 14 0.46 0.84 1.30
15 to 19 1.30 1.34 2.64
20 to 24 3.37 2.72 6.09
25 to 29 37.63 12.83 50.46
30 to 34 5.78 5.02 10.80
35 to 39 5.02 2.76 7.77
40 to 44 6.81 1.26 8.08
45+ 10.87 1.80 12.67
Total 71.32 28.68 100.0

��
GREEN PAPER ON Pensions
6.96 In the case of State Pension (Contributory), some 16% of claimants have contributions in more than 30 years with almost 40% reaching this level in the case of the State Pension (Transition), with 90% having contributions in excess of 25 years against 36% for State Pension (Contributory). Females comprise about 28% of applicants for both pensions and their records follow a broadly similar pattern.
Total Number of Contributions - Paid and Credited6.97 The total number of contributions (paid and
credited) held by those awarded both pensions was examined and the results are presented in Table 6.9.
6.98 The majority (75%) of those who received a pension had between 520 and 1,559 contributions. This is equivalent to between 10 and 30 full years of social insurance. About 53% of those in this bracket were men and 22% women. Only 19% of people awarded a payment had more than 1,560 contributions (30 full years of social insurance).
Number of paid only contributions6.99 The number of paid contributions (excluding
credits) held by those who were awarded a
pension was also examined and the results are presented in Table 6.10.
6.100 The results of this analysis are generally consistent with other tables presented and show that the majority of claimants have less than 30 years paid contributions. One area of concern is the number with less than 520 contributions paid which account for 13% of the total. Under legislation enacted in 1997, the basic paid requirement for qualification for pensions will increase to 520 contributions in 2012. Accordingly, unless this position improves in the next 5 years, significant numbers will not qualify for a contributory pension. The position should improve given improved social insurance coverage and workforce participation but it is a situation that will require monitoring in the run up to 2012.
Total versus average number of contributions6.101 The tables on the following page demonstrate
the way in which, under the present system, people with different levels of contribution can receive the same rate of payment, or how those with the same contribution levels can receive different levels of payment.
Table 6.9: Total Contributions (Paid and Credited) State Pension (Contributory) and State Pension (Transition)
Total Contributions (paid and credited) Male % Female % Total %
156-259 0.04 0.01 0.05
260-519 3.01 1.96 4.97
520-1039 24.33 11.54 35.87
1040-1559 28.43 11.45 39.88
1560-2079 7.73 2.66 10.39
>2080 7.72 1.12 8.84
Total 71.26 28.74 100.0
Table 6.10: State Pension (Contributory) and State Pension (Transition) - Paid Contributions Only
Total Paid Contributions Male % Female % Total %
<156 0.02 0.01 0.03
156-259 0.13 0.10 0.23
260-519 8.08 4.93 13.01
520-1039 29.95 13.78 43.73
1040-1559 24.31 8.44 32.75
1560-2079 6.00 1.24 7.23
>2080 2.78 0.24 3.02
Total 71.26 28.74 100.00
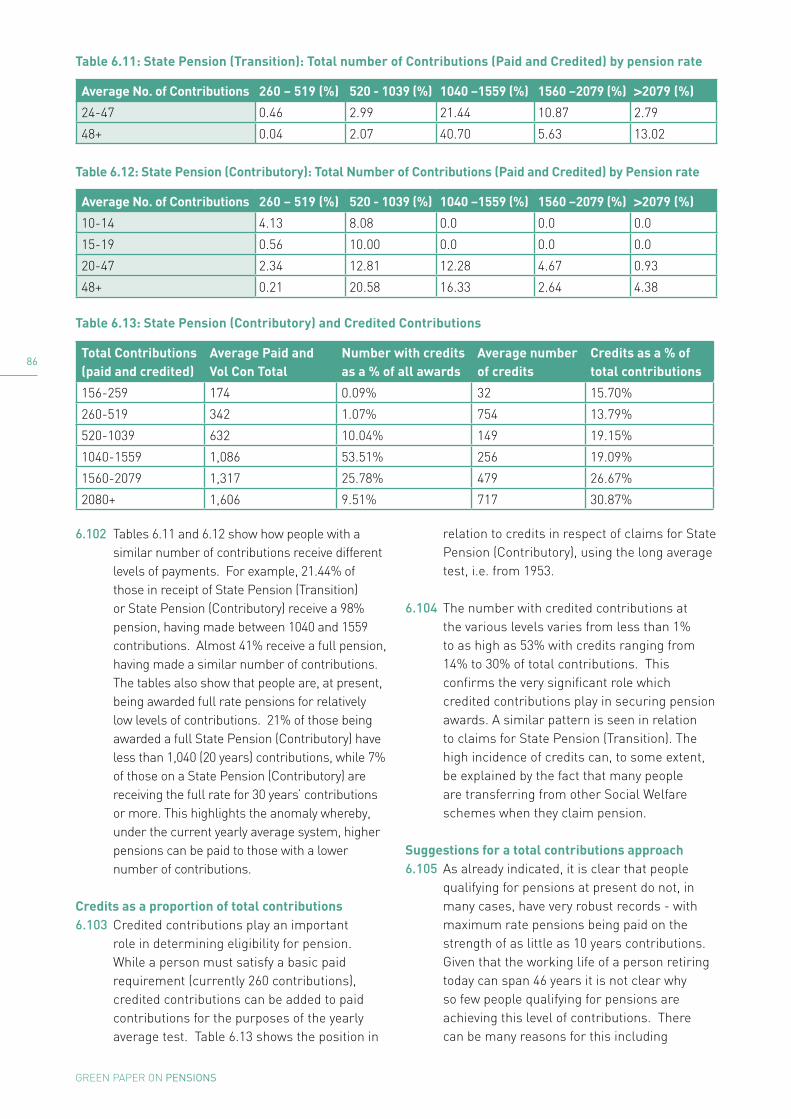
��
GREEN PAPER ON Pensions
6.102 Tables 6.11 and 6.12 show how people with a similar number of contributions receive different levels of payments. For example, 21.44% of those in receipt of State Pension (Transition) or State Pension (Contributory) receive a 98% pension, having made between 1040 and 1559 contributions. Almost 41% receive a full pension, having made a similar number of contributions. The tables also show that people are, at present, being awarded full rate pensions for relatively low levels of contributions. 21% of those being awarded a full State Pension (Contributory) have less than 1,040 (20 years) contributions, while 7% of those on a State Pension (Contributory) are receiving the full rate for 30 years’ contributions or more. This highlights the anomaly whereby, under the current yearly average system, higher pensions can be paid to those with a lower number of contributions.
Credits as a proportion of total contributions6.103 Credited contributions play an important
role in determining eligibility for pension. While a person must satisfy a basic paid requirement (currently 260 contributions), credited contributions can be added to paid contributions for the purposes of the yearly average test. Table 6.13 shows the position in
relation to credits in respect of claims for State Pension (Contributory), using the long average test, i.e. from 1953.
6.104 The number with credited contributions at the various levels varies from less than 1% to as high as 53% with credits ranging from 14% to 30% of total contributions. This confirms the very significant role which credited contributions play in securing pension awards. A similar pattern is seen in relation to claims for State Pension (Transition). The high incidence of credits can, to some extent, be explained by the fact that many people are transferring from other Social Welfare schemes when they claim pension.
Suggestions for a total contributions approach6.105 As already indicated, it is clear that people
qualifying for pensions at present do not, in many cases, have very robust records - with maximum rate pensions being paid on the strength of as little as 10 years contributions. Given that the working life of a person retiring today can span 46 years it is not clear why so few people qualifying for pensions are achieving this level of contributions. There can be many reasons for this including
Table 6.11: State Pension (Transition): Total number of Contributions (Paid and Credited) by pension rate
Average No. of Contributions 260 – 519 (%) 520 - 1039 (%) 1040 –1559 (%) 1560 –2079 (%) >2079 (%)
24-47 0.46 2.99 21.44 10.87 2.79
48+ 0.04 2.07 40.70 5.63 13.02
Table 6.12: State Pension (Contributory): Total Number of Contributions (Paid and Credited) by Pension rate
Average No. of Contributions 260 – 519 (%) 520 - 1039 (%) 1040 –1559 (%) 1560 –2079 (%) >2079 (%)
10-14 4.13 8.08 0.0 0.0 0.0
15-19 0.56 10.00 0.0 0.0 0.0
20-47 2.34 12.81 12.28 4.67 0.93
48+ 0.21 20.58 16.33 2.64 4.38
Table 6.13: State Pension (Contributory) and Credited Contributions
Total Contributions(paid and credited)
Average Paid and Vol Con Total
Number with credits as a % of all awards
Average number of credits
Credits as a % of total contributions
156-259 174 0.09% 32 15.70%
260-519 342 1.07% 754 13.79%
520-1039 632 10.04% 149 19.15%
1040-1559 1,086 53.51% 256 19.09%
1560-2079 1,317 25.78% 479 26.67%
2080+ 1,606 9.51% 717 30.87%

��
GREEN PAPER ON Pensions
absence from the State and periods spent working full-time in the home. The fact that social insurance coverage was less than comprehensive until relatively recently could also be an important factor.
6.106 However, with increased workforce participation and a comprehensive system of social insurance which has now been in place for almost 20 years, the insurance records of those who are still contributing should show an improvement on existing pensioners. This suggests that the number of contributions required in a total contributions approach should be based on the potential of current contributors rather than the level of contribution achieved by those qualifying for pension today. The comprehensiveness of the social insurance system, the existence of voluntary contributions, the Homemaker’s Scheme and the facility for awarding credited contributions to employees in times of unemployment or illness all mean that, unless a person goes abroad or operates in the informal economy, s/he will have the potential to achieve a 100% insurance record.
6.107 With people starting full-time permanent work at any time from 16 years of age to 25 years of age, it should be possible to achieve a contribution record of anything from 40 to 50 years. However, the number of younger people at work has been falling because of greater involvement in education. In the circumstances, allowing for those who attend third level education, it is probably reasonable to assume that most people will enter the workforce at about 20 to 23 years of age. That would give a potential record of about 42 to 45 years at retirement age. Allowing for some intermittent/part-time employment and possibly a short time abroad it is considered that a target of 40 years would not be unreasonable to set for a maximum pension. This would be in line with the requirements of many pension systems in the EU and would also be in line with the service requirements of many occupational pension schemes. This requirement could be kept under review as longevity improves and/or working after normal retirement age becomes more prevalent.
6.108 It would also be necessary to set some minimum level of paid contribution to qualify for a pension. Again, such a requirement is not unusual in the context of other pension schemes. As already indicated, legislation enacted in 1997 provides for a minimum paid requirement of 520 contributions from 2012 and in the context of our comprehensive social insurance system as it now exists, this seems a reasonable target. However, as indicated at paragraph 6.100, this situation will require monitoring.
Role of Credits6.109 When a person is in insurable employment, PRSI
deductions are made from his/her earnings each week and recorded on his/her behalf. However, if an employee is absent from work due to illness, unemployment or early retirement PRSI deductions may not be made but the person may be eligible for credits. Credits are similar to the contributions paid as an employee and protect a person’s future entitlement to Social Welfare benefits and pensions as they ensure that the social insurance record remains unbroken during periods of, for example, illness or unemployment.
6.110 To qualify for credits, a person must have worked and paid at least one PRSI contribution at PRSI class A, B, C, D, E, H, or P and have paid or credited contributions in either of the last two complete tax years. If there is a gap of more than two complete tax years in a person’s social insurance record, s/he will need to work and pay PRSI contributions for a further 26 weeks before becoming eligible for credits. Credits are usually awarded at the same rate as the last paid PRSI contribution.
6.111 Subject to the qualifying conditions outlined above, credits are automatically awarded when an employee claims Jobseeker’s Benefit; Illness Benefit; Maternity Benefit; Adoptive Benefit; Health & Safety Benefit; Invalidity Pension; or State Pension (Transition). People in receipt of Jobseeker’s Allowance; Pre-Retirement Allowance; Injury Benefit or Carer’s Allowance may be entitled to credits. Those participating in a Back to Education Programme or on courses run by FÁS, CERT, Bord Iascaigh Mhara (BIM) or Teagasc may also be eligible for credits. Certain people

��
GREEN PAPER ON Pensions
not on a Social Welfare scheme may also be entitled to credits.
6.112 When a person first starts work, Pre-Entry Credits are given from the beginning of that income tax year up to the date the work begins and for the previous two income tax years. These credits are normally only given once but if someone is a student s/he may be given these credits again on commencing full-time employment. These Student Credits may be given to cover periods in full-time education subject to certain qualifying conditions.
6.113 The extent to which credits can be used to support qualification for a pension is an important issue. The Working Group which reviewed Credited Contributions found that some 12.5% of claimants for the State Pension (Contributory) would have no entitlement to this pension if credits were not reckonable. Furthermore, the existence of credits enabled a significant number of claimants to secure a higher payment than their paid contributions alone would have entitled them to.
6.114 There are at least two ways in which the issues associated with credits can be approached. Firstly, credits could continue to be treated as they are today with an unlimited number allowed for qualification once the basic paid requirement is satisfied. Another view would be that there should be more emphasis placed on paid/employment contributions in the qualifying conditions, with restrictions placed on the amount of credits which can be used. This approach would be broadly consistent with the situation in some other EU countries where the qualifying conditions for pensions are being tightened to encourage longer working amongst older workers through measures such as increasing the contribution requirement for full pensions and raising State Pension age.
6.115 It is suggested, in the context of a change to credits in the Homemaker’s Scheme, that up to 20 years, or 1,040 credited contributions, should be allowed for someone who leaves the workforce to undertake caring duties. As already indicated this is, by international standards, quite a long time for which to award credits in respect of caring duties. Most other
countries generally only take account of the first 3 to 4 years, possibly until a child enters pre-school care. If it were decided to limit the role of credits in the context of pension qualification and 20 years were retained as the benchmark for Homemaker’s Credits then, in equity, it would also have to apply to other situations where credits are awarded.
6.116 As an alternative the value of credited contributions could be reduced so that when a person’s total contribution record is being assessed the credits would not be of the same value as paid contributions. The objective would be to ensure that qualification for pension was, to the greatest extent possible, based on the use of paid contributions. For example, this could mean that one paid contribution would equal two credited contributions.
6.117 The review of credited contributions referred to did not propose that the value of credits should be reduced as outlined above. However, it did suggest that if the restrictions were to be imposed it should be to
“limit the extent to which people can qualify based on credited contributions”98.
6.118 Adopting such an approach could strike a reasonable balance between recognising periods outside the paid workforce and at the same time emphasise the need to maximise the paid element in the contribution conditions required for pension purposes. The suggestion of placing a cap on the total number of credited contributions which could be used in establishing entitlement to a pension would be in keeping with this approach. In the past, concerns in relation to limiting the use of credited contributions focused on the position of long-term Social Welfare recipients and the impact it could have on their pension entitlements, in particular those qualifying for Invalidity Pension. However, from 2006, recipients of Invalidity Pension are automatically transferred to State Pension (Contributory) at 66 years of age so limiting the use of credits in a pensions context would have no impact.
98 Department of Social, Community and Family Affairs (1999:14) ReviewofCreditedContributions

��
GREEN PAPER ON Pensions
Rate Structures which could be considered6.119 There are currently four rate bands for the
State Pension (Contributory), i.e. 50%, 75%, 98% and 100% and two for State Pension (Transition), i.e. 100% and 98%. As already suggested, in a total contributions context, there would be a need for a more gradual increase in the rates paid as the number of contributions achieved increased. The following tables outline a couple of approaches that might be considered for a system of total contributions. One model requires a minimum of 10 years paid contributions for a basic payment with an overall requirement of 40 years (paid/credited) for a full rate. A maximum of 20 years credits can be utilised. Therefore, a person would require 40 years’ contributions, of which at least 20 years would be paid, for a maximum rate pension. The second model requires a higher contribution level for a minimum payment and also sees a greater emphasis on the necessity for paid contributions at each rate band. In this regard it is again worth mentioning the concerns in relation to the paid contribution element in pension claims currently being received, with 13% having less than 520 contributions i.e. the
new benchmark which will apply from 2012 under legislation passed in 1997.
6.120 A central consideration in determining what
may constitute an appropriate banding structure is the cost implications for the Exchequer and the Social Insurance Fund. This is particularly important in the context of an ageing society. The relative costs of different models, two of which are presented here, will be very sensitive to the distribution of persons within the various bands - i.e. the variation within the pensioner population in terms of the number of paid and/or credited contributions which they hold. Further consideration in relation to this issue will be needed before a suitable structure could be decided upon.
6.121 In any system of total contributions and a more comprehensive rate structure, it would be important to ensure that claimants can derive the maximum benefit possible from the contributions made. At present, contributions are only counted up to the end of the last complete contribution year before a person reaches pension age which means that, depending on their birth date and when
Table 6.14: Minimum Paid of 520 with credits limited to 20 years
Rate of Payment* Contributions Required Of which paid contributions
50% 520 (10 years) 520
65% 780 (15 years) 520
80% 1,040 (20 years) 520
85% 1,300 (25 years) 520
90% 1,560 (30 years) 520
95% 1,820 (35 years) 780
100% 2,080 (40 years) 1,040
* The bands in-between those shown here could be directly proportional.
Table 6.15: Paid requirement increases in line with rate
Rate of Payment* Contributions Required Of which paid contributions
50% 1,040 (20 years) 520
65% 1,352 (26 years) 676
80% 1,664 (32 years) 832
85% 1,768 (34 years) 884
90% 1,872 (36 years) 936
95% 1,976 (38 years) 988
100% 2,080 (40 years) 1,040
* The bands in-between those shown here could be directly proportional.

�0
GREEN PAPER ON Pensions
they left employment, up to 52 contributions may not be counted in assessing eligibility for pension. This has very little impact, if any, in an averaging environment but additional contributions could have an affect on the final rate of payment where total contributions are involved. Accordingly, arrangements would have to be made to ensure that all contributions made are reckonable for pensions purposes. Suggestions are also made elsewhere in the report in relation to allowing contributions to continue after normal retirement age to afford people the opportunity to improve on their positions and to encourage longer working
Implementation6.122 As is evident from the various tables presented
in this section, a change to a system of qualification based on total contributions, allied with a more comprehensive rate structure would be a more equitable and transparent way of awarding pensions. In deciding on an appropriate structure and, in particular the contributions for maximum and minimum pensions, it is also considered that this should have regard to the potential people now have to make social insurance contributions, rather than the less than complete records we see from existing pensioners and older workers. The former would suggest a requirement of up to 40 years’ contributions but, as is clear from the records of those qualifying for pension today, this could not be introduced without causing serious disadvantage. The alternative would be a much reduced contribution requirement but the result of this would be to qualify almost all claimants for a full rate pension. Apart from the additional cost involved, both immediate and long-term, this would not be in keeping with one of the objectives of the system which would be to ensure a close link between the level of contributions made and the benefits accruing.
6.123 Having considered all the implications of introducing a total contributions approach, it may well be considered that it might be prudent to postpone such a development for the present. The records of those qualifying for pension could continue to be monitored and a decision made on implementation when it was
considered that people’s records were more in tune with the requirements of a system based on total contributions.
Reform E – Miscellaneous Issues relating to Social Welfare Pensions including indexing, the existence of two contributory pension schemes, the role of the Living Alone Increase, social insurance for spouses of farmers/self-employed
Indexing of Social Welfare Pensions6.124 Social Welfare pensions are adjusted
annually at budget time having regard to commitments or targets set by Government, available resources and economic conditions. Certainly, in recent years, this system has served pensioners well with increases in pensions which are ahead of both inflation and earnings. Over the last 10 years, pensions have increased by 119%, or 57% in real terms. This improvement in incomes is very apparent in poverty statistics based on the nationally agreed measure of consistent poverty, but it has not always been reflected in poverty statistics based on relative incomes because of other movements in the economy (reduced taxes and improved workforce participation). (See discussion in Chapter 4).
6.125 The National Pensions Policy Initiative (NPPI) suggested that contributory pensions should be set at a level of 34% of Gross Average Industrial Earnings (GAIE) and, while Government has never committed itself to this target, it has been taken account of in various commitments in Social Partnership Agreements and Programmes for Government. The most recent increases in pensions have actually brought pensions over this threshold and they now stand at about 35% of GAIE.
6.126 In the course of discussions on the preparation of the Green Paper, some have suggested that there should be a more formal indexing arrangement for pensions based on various percentages of GAIE or poverty thresholds.

�1
GREEN PAPER ON Pensions
6.127 In relation to the latter, a target pension rate which was linked to 60% of household median income would tie in with the EU poverty monitoring process and ensure, on an ongoing basis, retirement incomes which cleared the EU poverty thresholds. From the point of view of social equity, such measurements take account of changes in living standards generally, such as increased labour force participation, tax changes etc. However, the income definitions underlying the risk of poverty are complicated and subject to change, which could cause confusion in the monitoring process.
6.128 On the other hand, earnings data are easily understood and available quickly. While household income rose more quickly than earnings in the 1990s and early 2000s, this trend could be reversed if, for instance, unemployment rose, tax rates increased or, indeed, tax bands did not keep pace with inflation. Pensions linked to a household income measure could then decline in relation to earnings. In considering this aspect of the pensions system, the National Pensions Review considered that:
“first pillar pension targets should continue to use GAIE as a reference, as the median household income is too volatile year on year…”
6.129 Accordingly, it would appear that if a formal indexing arrangement were to be considered, then it should be based on some measure of earnings. In this regard, two suggestions have been made - 40% of GAIE and 50% of GAIE. At current levels, these would translate into pension rates of approximately €240 per week and €300 per week respectively at an additional cost of €720 million and €2 billion per annum99. In the longer-term, indexing pensions along these lines has implications for the sustainability of the system. The deficit in the Social Insurance Fund is projected to reach 6.4% of GNP under present policies by 2061 and this rises to 7.7% of GNP with indexing to 40% of GAIE, and 10% of GNP using 50% of GAIE as the benchmark.
99 This does not take account of potential knock-on effects on other Social Welfare payment rates.
6.130 As can be seen from Table 4.9 in Chapter 4, the various targets which have influenced pension policy in recent years (34% of GAIE, pension of €200 per week) would ensure (assuming that household incomes track earnings) that poverty measures based on relative incomes (as measured by the CSO) are exceeded. However, because the EU uses different equivalence scales, the poverty threshold is higher. Accordingly, if it was considered appropriate to benchmark pensions against EU poverty measures then a pension of 40% of GAIE would be required. The higher rate of pension suggested, 50% of GAIE, would exceed all poverty thresholds and provide a pension for those of average earnings, without supplementary pension coverage, which would be in keeping with targets suggested in the National Pensions Policy Initiative (1998) and reaffirmed in the National Pensions Review.
Two Contributory Pension Schemes6.131 There are two main contributory pension
schemes, State Pension (Contributory) and State Pension (Transition). The reasons for this are historical and relate to the qualifying age for Social Welfare which, up until the early 1970s, was 70 years of age. The Retirement Pension (the former name of the State Pension (Transition)) was introduced at that time to bridge the gap for employees who had to retire at 65. The qualifying age for Social Welfare pensions was subsequently reduced over a number of years to 66, which basically left the Retirement Pension effective for just one year. At this stage, there is a reasonable case to be made for reforming the system to provide for just one scheme.
6.132 While there are good arguments on cost grounds, particularly in the context of the future ageing of the population, for setting 66 years of age as the retirement age for Social Welfare pension purposes, it means that the Social Welfare pension system remains out of step with the current realities of the workplace. The standard retirement age for most employments is 65 years of age. Additional income tax age-related allowances are also applied at that age. In the circumstances, it could also be argued that the Social Welfare system should follow normal societal practice. Indeed, the Final Report of

��
GREEN PAPER ON Pensions
the National Pensions Board considered that “a standard qualifying age of 65 for retirement and old age pensions should be introduced”.
6.133 However, the Board regarded this as a low priority due to cost and the potential interaction with the other recommendations of its report, particularly in regard to the level of pensions. The estimated cost of standardising the payments at age 65 is about €156 million but this could also bring pressure for non-contributory pensions, higher rate qualified adult allowances, Household Benefits, and other supports to be paid from age 65 also. In the context of the demographic pressures we face, and the need to encourage longer working amongst older people, any downward movement in pension age would not be an appropriate course of action. Indeed, it may be necessary to consider raising pension age at some stage, as discussed in Chapter 14.
Social Welfare Pensions and Longer Working6.134 Social Welfare pensions can play a part in
encouraging longer working amongst older people. For instance, the retirement condition associated with the State Pension (Transition) could be removed or incentives offered to allow higher rates to be paid where people decide to defer claiming. In addition, employment after normal retirement age could be made fully insurable so that workers with deficient insurance records can improve these by remaining in work. However, measures such as these can only play a small role in encouraging longer working. Significant changes in the expectations of employees in relation to early retirement and employers seeking to retain older workers by creating the workplace conditions which will make this an attractive proposition are key in this area. These matters are discussed in more detail in Chapter 14.
The Living Alone Increase and Poverty 6.135 Pensions provided under the Social Welfare
system are standard rate payments with a number of additional allowances or increases paid to different categories of pensioners. These increases include payments for adult dependants, through what is known as the increase for a qualified adult, the living alone increase and an allowance for those who are 80 years of age and over.
6.136 There have been ongoing developments in relation to the qualified adult payments and there is a commitment to increase these to the level of the State Pension (Non-Contributory) over the next three years. However, there has been little or no movement in relation to other additional payments with policy for many years focused on improving the personal rates of payment. The increase for living alone has remained at its present level (€7.70 per week) since 1996, and while the allowance for those over 80 years of age was increased to €10 per week in Budget 2006, this was the first such increase since 1996.
6.137 Since 1996, including increases granted in Budget 2007, the rate of contributory pensions has increased by about 119%, or 57% in real terms. At the same time, rates of payment for all schemes payable to people over 66 years of age were standardised at the State Pension (Contributory) rate, so some groups such as widows and widowers will have seen even greater increases in payments.
6.138 Until relatively recently, although pensions were increasing faster than both prices and wages, household incomes were growing even faster, with the result that the relative income position of older people continued to deteriorate. However, the growth in household income has slowed while pension increases have remained ahead of prices and wages and this is starting to manifest itself in an improving relative income position for older people.
6.139 In 2005, just over 20% of those aged 65 and over were at risk of poverty, representing a significant decline on the 27% recorded one year previously. Over the same period, the rates for persons under 65 remained relatively unchanged. At an overall level, 18.5% of the population were at risk of poverty, compared with 19.4% in 2004.
6.140 However, the poverty risk for older people is not uniform with particular groups having higher risks. Those who live alone have the highest risk of poverty. In 2004, 35.7% of this group were at risk of poverty and this declined to 28.8% in 2005. In the past, it would have been generally accepted that older women

��
GREEN PAPER ON Pensions
had a higher risk of poverty than older men. However, more recent results from the EU-SILC survey for 2005 show very little difference, with risk of poverty at 20.3% for older men and 19.9% for older women. Also, there is no great divergence in risk when the ages of older people are examined. EU-SILC 2004 found that those aged 65 to 74 had a poverty risk of 27.9% against 26.2% for those aged 75 and over.
6.141 If the objective of the Social Welfare pensions system is to alleviate the poverty risk for older people, it would appear that more use could be made of instruments such as the Living Alone Increase to alleviate the risk of poverty for the more vulnerable groups of older people. (One disadvantage to this approach, however, is that it may act as a disincentive to older people moving in with family members.)
6.142 The Living Alone Increase is an additional payment of €7.70 per week to people who are in receipt of certain Social Welfare type payments and who live alone. Recipients are mainly those receiving pensions who are over 66 years of age but it is also available to those under that age receiving a number of long-term sickness payments.
6.143 As already indicated, the payment was last increased in 1996 and, at that time, the Living Alone Increase represented 8% of the personal rate for the contributory pensioners. Had the increase kept pace with the increase in pensions since then it would now be worth about €16.75 per week.
6.144 The number of people in receipt of the Living Alone Increase is as follows:
Table 6.16: Recipients of Living Alone Increase
Recipients aged 66 years and over
Widow/er’s Contributory Pension 44,637
Widow/er’s Non-Contributory Pension 6,694
Deserted Wife’s Benefit 462
Deserted Wife’s Allowance 260
State Pension (Contributory) 27,374
State Pension (Non-Contributory) 25,296
State Pension (Transition) 19,822
Blind Pension 405
Total 124,950
Recipients aged under 66
Invalidity Pension 10,611
Disability Allowance 15,713
Death Benefit Pension 206
Total 26,530
Total Recipients of Living Alone Increase
151,480
Source: Department of Social and Family Affairs
6.145 The annual cost of the increase is approximately €61 million. If the 1996 relationship between the Living Alone Increase and the maximum rate of the contributory pension was maintained, the cost would rise to €134 million.
Social Insurance Coverage for Spouses working on family farms/business6.146 As outlined in Chapter 5 in relation to
entitlements for qualified adults and the means testing of such payments, the question of PRSI cover for spouses assisting in family businesses or farms has been raised on numerous occasions, particularly by the farming community. While provisions introduced in Budget 2007 for the direct payment of qualified adult increases to spouses/partners will deal with some issues in this area, the result of means testing of the payments is that many fail to qualify for any support from the Social Welfare system. In such circumstances, it has been suggested that the PRSI system needs to be examined to provide a personal entitlement for such people. In this regard, it should be mentioned that those in question do have access to the Voluntary Contribution Scheme which will maintain pension entitlements for a person leaving standard employment to work on a farm/business.

��
GREEN PAPER ON Pensions
6.147 The provision in the Social Welfare code whereby employment in the service of a husband or wife is not allowed for social insurance coverage is a long-standing provision. It mirrors similar exclusions under employment protection legislation. The provisions recognise the practical difficulties of establishing the nature of a genuine employment relationship in such circumstances.
6.148 There is, however, scope within the legislation to provide for spouses who work together in a family business to be covered for social insurance purposes. Under current Social Welfare legislation provisions, there are three different scenarios to be considered:
l First, where spouses are actively engaged in a commercial enterprise as a business partnership, they are treated as individual self-employed contributors and are liable to social insurance contributions once each of them has individual reckonable income of €3,174 per annum. These contributions enable them to build up an insurance record in their own right and to receive accruing benefits;
l Second, where a family business is incorporated as a limited company, spouses involved in the business can each establish a PRSI record either as employees or as self-employed contributors - depending on whether a contract of service exists or not. Employees are liable to PRSI Class A contributions once earnings are in excess of €38 per week and self-employed workers pay class S contributions through the PAYE system each week providing their annual emoluments are in excess of €3,174 in the year;
l Third, a person employed under a contract of service, that is, as an employee, directly by his or her spouse is viewed as an "excepted" contributor under Social Welfare legislation. He or she will not be liable for PRSI contributions and will not be able to accrue entitlement to social insurance benefits on the basis of this employment. This exception applies to both men and women in family employments and recognises the practical difficulties in establishing the nature of a
genuine contract of employment in such circumstances.
6.149 Thus, where formal employment or partnership relationships are intended between spouses or assisting relatives, the legislation provides the scope necessary, as outlined above, to allow parties to enter into arrangements that will enable them to gain access to social insurance coverage. Arguments have been made that these provisions are discriminatory. However, the legislation applies equally to men and women. Nor is it in breach of the EU equality legislation as EU Directive 86/613/EEC leaves it to individual Member States to decide on the appropriate level of social security cover for assisting spouses through the accrual of their own rights or through derived rights.
6.150 An inter-departmental group (2002) considering the insurability of farm spouses concluded that the greatest scope for resolving the issue was for the couples concerned to conduct their business arrangements as a partnership. The social partnership group on Developing a Fully Inclusive Social Insurance Model (FISIM) (2005), which included members from trade unions, employers and the farming pillar, in noting the significance of the partnership option to enable farm spouses to build a social insurance record in their own right, recommended that more information on the tax and Social Welfare implications of working together in a partnership should be made available through a joint information leaflet published between the Department of Social and Family Affairs and the Revenue Commissioners.
6.151 A number of other options have been put forward to provide individual pension coverage for spouses. These include (1) optional co-insurance of spouses, (2) provision to enable those who have a shortfall in contributions at pension age to buy additional contributions and (3) amnesties for unpaid contributions.
6.152 These are suggestions which give rise to very fundamental issues of principle for the social insurance system. As with any insurance scheme, the member of an insurance scheme must fulfil a minimum number of conditions

��
GREEN PAPER ON Pensions
to enjoy the benefits of that scheme. The legislation is crafted to make persons who are in insurable employment or self-employment and have reckonable earnings or income in excess of a minimum threshold liable for social insurance contributions. Liability for social insurance contributions is based on a person’s employment or self-employment status. There is no provision in legislation to facilitate the payment of contributions that were not due in the first place; therefore, PRSI payments which are not properly due cannot be accepted.
6.153 Any departure from these principles could have wider implications. Certainly, it would be hard to refuse similar facilities to, for instance, an employee whose social insurance record was inadequate when she/he reached retirement or an employee in the State sector whose social insurance status was changed from a full rate contributor to a modified rate contributor and who alleges that she/he was not made aware of the voluntary contribution facility which they could have used to maintain their contributory pension entitlements. The latter is an issue frequently raised by former employees of the semi-state sector. Accordingly, changes in this area would need to be approached with great caution because of the implications for the financing of the Social Insurance Fund.
Reform F – Approaches to address sustainability
6.154 As outlined in paragraph 6.2, there is a significant projected rise in the cost of the Social Welfare pension system arising from demographic change, improvements in social insurance coverage (which will see more people qualifying) and ongoing improvements in pension rates. One response to this has been the creation of the National Pensions Reserve Fund which will be available from 2025 to partly offset the additional costs. It will be a matter for the Government to decide how best to deal with the costs issue, having regard to economic conditions and other demands on Government finances generally in the future. In a Social Welfare context, if it were decided
that offsetting measures should be taken within the Social Welfare system itself, such measures could involve, for example, one, or a combination, of the following options, which are further discussed below.
l Introduce an indexing arrangement which would limit the growth in pension costs;
l Increase social insurance contributions;
l Defer payments by increasing the Social Welfare pension age;
l Extend means testing to all pension payments.
6.155 As with all reform approaches in this chapter, and elsewhere, there is a tension between financial and economic sustainability on the one hand and social sustainability on the other. The position chosen and the decisions made at any point in time will depend on social and economic factors and will be a matter for determination by the Government of the day.
a) Index pensions to growth in Consumer Price Index
6.156 In some EU countries, there are formal arrangements in place by which pensions are increased each year. Traditionally, such pensions are earnings related and have been indexed in line with earnings growth. However, in order to limit increasing costs, the indexing arrangements in some cases are being changed from an earnings basis to a mixed or demographically adjusted basis. Sweden, Italy and Germany have built in mechanisms to their pension systems to offset increases in life expectancy by providing lower pension benefits and/or late retirement.
6.157 While there is no formal indexation policy in Ireland, the State pension has broadly, over the long term, increased in line with earnings which normally rise faster than prices. Therefore, if the Social Welfare pension is indexed to earnings, its cost may grow more rapidly than if indexed to prices. If indexed to prices, however, it will fall in value relative to the average standard of living in society, which is set by earnings. The following table, based on results from the recently completed actuarial review of the Social Insurance Fund, illustrates the position of the fund using both earnings and prices indexation. The Social

��
GREEN PAPER ON Pensions
Insurance Fund balance refers to income less expenditure in the fund. It can be seen that the fund remains more or less in balance under price indexation.
6.158 The downside of indexing pensions to prices is that, in relative terms, the value of pensions falls with obvious implications for the poverty risk faced by older people. It is projected that, under price indexation, the value of Social Welfare pensions would fall from a current level of about 35% of gross average industrial earnings to some 15% by 2061. Clearly, the sustainability tensions discussed earlier are evidenced here.
b) Increase social insurance contributions 6.159 On the basis of current policies, income to the
Social Insurance Fund will equal or slightly exceed outgoings up to 2010. From 2011 onwards, outgoings will exceed income with the shortfall growing continuously both in real terms and as a percentage of GNP. For most of its history, the Social Insurance Fund has been financed by employees, employers, the Exchequer and more recently the self-employed. In recent years, the Fund has been in surplus. By the end of 2005, this surplus stood at €2.4 billion and, at end 2006, is estimated to have been approximately €3 billion. (This is a relatively small amount in terms of overall social insurance expenditure.)
6.160 Current contribution rates are projected to be adequate to meet outgoings from the Fund until about 2010. In the period 2008 to 2017, an increase of 5% in contribution rates is projected to be adequate to meet benefit outgoings whereas this increases to 138% in the period 2048 –2057. Over the entire projection period an increase of 74% in contribution rates would be required to meet benefit payments.
c) Defer payments by increasing Social Welfare pension age
6.161 Increasing retirement ages can play a very significant role in reducing the effects of the demographic changes which the country will face in the years ahead. In some EU countries, raising both effective and statutory retirement ages are key reforms in helping to make pension systems sustainable in the years ahead. In relation to the former, the average exit age from the labour force in Ireland was 64.1 years in 2005, compared to the EU25 rate of 60.9 years.
6.162 While the position here is more favourable in this regard than in other EU countries, nevertheless, further improvements in the situation can make a significant improvement to the financing of pension costs in the future. A gradual increase in Social Welfare pension age to 70 years of age (see Chapter 14) can reduce overall costs. While the savings would take some time to build up, they are potentially quite significant in the longer term with a projected saving of 1.6% of GNP in 2056.
6.163 The issues surrounding longer working from both the employee and employer perspective, the barriers workers face in choosing to defer retirement and the contribution the Social Welfare system can make to encouraging people to defer pension are discussed in full in Chapter 14.
d) Reduce benefits by extending means testing to all pension payments
6.164 This approach would be considered to be a radical change in the way eligibility for pensions is decided. If implemented, it is envisaged that it would apply to new claimants for pensions at a future date. While it would be a significant change in current policy, it has a rationale, as set out below, and it represents one extreme of the range of possible reforms from universal pensions (Reform B) which was discussed earlier.
Table 6.17: Social Insurance Fund Balance as a % of GNP
Type of indexation 2006 2016 2031 2051 2061
Earnings +0.4% -0.5% -2.7% -6.3% -6.4%
Prices +0.4% +0.5% +0.1% -0.9% -0.3%

��
GREEN PAPER ON Pensions
6.165 As already outlined, Government policy has for many years involved shifting Social Welfare supports from means tested payments to payments based on social insurance contributions. The latter are neutral in terms of other income sources and therefore are not affected by any supplementary pension income, or assets, a retired person might have. While this policy contributes to the process of improving older people’s income, it has also added to the growth in costs as it means that more people are qualifying for payments and at higher rates. The link with social insurance rates is discussed at (b) above.
6.166 In order to contain costs, consideration could be given to a change of policy in this area, with the intention of ensuring that resources are directed to those who are most in need. The extent of the savings which would accrue would depend on the decisions in relation to an acceptable minimum income level for older people. Currently, about 35% of contributory pensioners have a supplementary pension but coverage in the current workforce (55%) would undoubtedly be affected by the prospect of being means-tested. In addition, all incomes and savings/assets would be means tested, with considerable effect. The introduction of a system of means-testing would, in effect, involve abolishing the concept of social insurance pensions.
6.167 There is no doubt that introducing means testing for a group of pensioners would improve the exchequer position in the future. However, savings achieved would be at the expense of an increased income poverty risk for older people as overall retirement incomes would fall through a combination of reduced Social Welfare and voluntary supplementary pension provision. Means testing would affect the incentives for those in employment to save for retirement as, for many low to middle income people, there would seem no point in saving and this would lead to lower voluntary supplementary pension coverage. This latter point was a major issue in the context of the pension reforms planned in the UK.
Conclusion6.168 All the possible reforms (A to F) discussed in
this chapter, which are not mutually exclusive (with the possible exception of some type of universal pension), indicate the challenges that arise for the Social Welfare system both on the benefit and financing sides. The challenge for a future framework is to strike an appropriate balance that takes account of all aspects of pensions delivery. This is the approach envisaged in the guidelines adopted by the Economic Policy Committee and the Social Protection Committee of the EU in relation to pensions strategies in Member States.
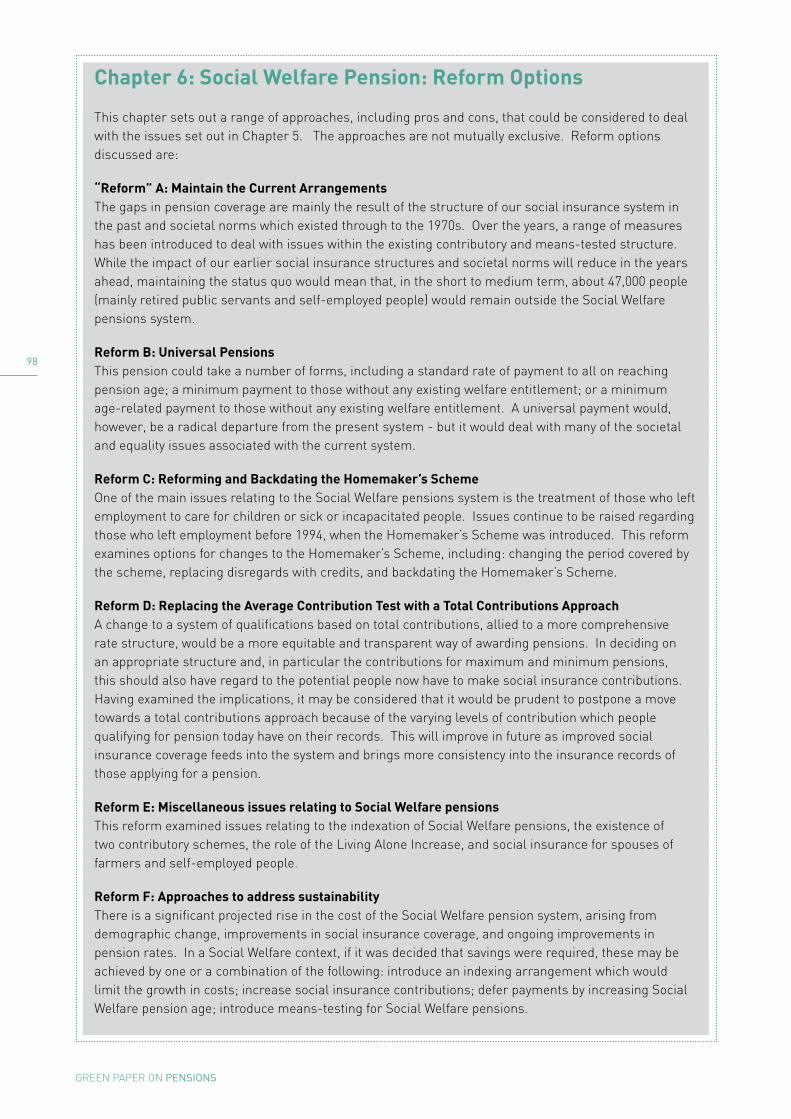
��
GREEN PAPER ON Pensions
Chapter 6: Social Welfare Pension: Reform Options
This chapter sets out a range of approaches, including pros and cons, that could be considered to deal with the issues set out in Chapter 5. The approaches are not mutually exclusive. Reform options discussed are:
“Reform” A: Maintain the Current ArrangementsThe gaps in pension coverage are mainly the result of the structure of our social insurance system in the past and societal norms which existed through to the 1970s. Over the years, a range of measures has been introduced to deal with issues within the existing contributory and means-tested structure. While the impact of our earlier social insurance structures and societal norms will reduce in the years ahead, maintaining the status quo would mean that, in the short to medium term, about 47,000 people (mainly retired public servants and self-employed people) would remain outside the Social Welfare pensions system.
Reform B: universal PensionsThis pension could take a number of forms, including a standard rate of payment to all on reaching pension age; a minimum payment to those without any existing welfare entitlement; or a minimum age-related payment to those without any existing welfare entitlement. A universal payment would, however, be a radical departure from the present system - but it would deal with many of the societal and equality issues associated with the current system.
Reform C: Reforming and Backdating the Homemaker’s SchemeOne of the main issues relating to the Social Welfare pensions system is the treatment of those who left employment to care for children or sick or incapacitated people. Issues continue to be raised regarding those who left employment before 1994, when the Homemaker’s Scheme was introduced. This reform examines options for changes to the Homemaker’s Scheme, including: changing the period covered by the scheme, replacing disregards with credits, and backdating the Homemaker’s Scheme.
Reform D: Replacing the Average Contribution Test with a Total Contributions ApproachA change to a system of qualifications based on total contributions, allied to a more comprehensive rate structure, would be a more equitable and transparent way of awarding pensions. In deciding on an appropriate structure and, in particular the contributions for maximum and minimum pensions, this should also have regard to the potential people now have to make social insurance contributions. Having examined the implications, it may be considered that it would be prudent to postpone a move towards a total contributions approach because of the varying levels of contribution which people qualifying for pension today have on their records. This will improve in future as improved social insurance coverage feeds into the system and brings more consistency into the insurance records of those applying for a pension.
Reform E: Miscellaneous issues relating to Social Welfare pensionsThis reform examined issues relating to the indexation of Social Welfare pensions, the existence of two contributory schemes, the role of the Living Alone Increase, and social insurance for spouses of farmers and self-employed people.
Reform F: Approaches to address sustainabilityThere is a significant projected rise in the cost of the Social Welfare pension system, arising from demographic change, improvements in social insurance coverage, and ongoing improvements in pension rates. In a Social Welfare context, if it was decided that savings were required, these may be achieved by one or a combination of the following: introduce an indexing arrangement which would limit the growth in costs; increase social insurance contributions; defer payments by increasing Social Welfare pension age; introduce means-testing for Social Welfare pensions.

��
GREEN PAPER ON Pensions
Questions for consideration
In view of the issues and challenges facing the Social Welfare pensions system and the approaches to reform discussed in this chapter, the key questions include:
1. In the light of the reforms to the Social Welfare system undertaken in the 1970s, 80s and 90s which will, in future, see most people qualifying for contributory pensions, are there implications for people who are at present not receiving support through the Social Welfare pension system?
2. Is the introduction of a universal pension arrangement a desirable and feasible option?
3. If universal provisions are not considered appropriate then what groups, if any, currently outside the Social Welfare pensions system should be targeted for action?
4. Policy in relation to pensions has, for many years, concentrated on improving the position of all pensioners. Is this the most appropriate way of improving pensioner incomes or should there be a more targeted approach using measures such as the Living Alone Increase?
5. If the basis of qualification for contributory pensions was changed from average contributions made, to one based on total contributions, what would be an appropriate level of contribution a person should be required to have to receive a full pension?
6. Should a formal indexing arrangement linking pensions to some level of prices, earnings or risk of poverty threshold be introduced? How would a formal indexation mechanism be operated having regard to the overall budgetary and economic position?
7. Given the issues raised in this chapter, in Chapter 3, and in the Green Paper in general in relation to the long-term affordability of existing arrangements, how can the challenge of the growing cost of Social Welfare pensions be addressed?


CHAPTER 07
suPPlemenTary Pensions -inCenTiVes for
reTiremenT saVings

10�
GREEN PAPER ON Pensions
Introduction
7.1 This section focuses on the tax regime for supplementary pension provision including a description of the current tax relief arrangements. It also deals with issues such as value for money and equity of the current arrangements and the challenges of various options for change.
7.2 The State encourages individuals to supplement the Social Welfare pension with private pension arrangements by offering tax reliefs on private pension provision. These tax relief arrangements have helped a significant proportion of the workforce to provide for supplementary pensions for their retirement. It is estimated that over half of those in employment are covered by supplementary pension arrangements.
7.3 Tax relief takes the form of relief on amounts contributed to the pension schemes and on the amount of profits and gains generated by the investments held by the schemes. Benefits payable on or after retirement are taxable subject to an entitlement to take a tax-free lump-sum cash benefit. Contributions to pension investments are tax relieved on the way in (subject to limits) and are allowed to grow tax free in the pension fund in the expectation that the pension benefit stream will be taxed on the way out100. These tax arrangements are known as the EET system of pension taxation, i.e. exempt contribution, exempt fund growth and taxable benefits. Fourteen out of the fifteen “old” EU Member States operate either an EET system or ETT system (exempt contribution, taxed fund growth and taxable benefits) and the EET approach is the preferred system from the point of view of the European Commission.
7.4 One view of the EET tax arrangements is that they represent a deferral of income which is subject to taxation when pension benefits are taken. On the other hand, a generous proportion of the benefits are allowed to be taken as a tax-free “lump sum” while contributions by individuals to pension funds are relieved at their marginal tax rate (in many cases the top rate
100 Contributions to approved pension schemes by employers and employees are also exempt from PRSI
of tax). Their lower levels of pension income as compared with pre-retirement income often mean that pensions income is taxed at a lower rate of tax. These can be viewed as additional tax benefits to investment in supplementary pension provision.
The Private Pension System
7.5 The private pension system comprises occupational pension schemes and personal pension arrangements. These occupational schemes are generally provided on a voluntary basis by employers for their employees— in the sense that there is no legal requirement for an employer to establish a scheme — and are funded either jointly by employers and employees or by the employer alone.
7.6 In the past, the most common form of
occupational pension scheme was a defined benefit scheme. Under this type of scheme the pension and other benefits to be paid to members and/or their dependants are specified in the scheme rules and are generally linked to final salary. The aim of such schemes is to provide an earnings-related addition to the Social Welfare pension so as to enable scheme members to maintain in retirement a standard of living linked to their pre-retirement situation.
7.7 More and more occupational pension schemes are now defined contribution schemes. Under these schemes, the individual member’s benefit is determined solely by reference to the contributions paid into the scheme and the investment return earned on those contributions. A specified proportion of earnings is contributed to the fund by the employer and employee or employer alone and the value of the pension annuity at the end of the day depends, among other things, on (a) fund performance (b) interest rates at the time the pension annuity is purchased and (c) pension fund charges. In these schemes, in contrast to defined benefit type schemes, the scheme member takes the risk of poor investment performance by the fund. Statutory rules in relation to tax relief restrict the maximum benefits payable, under both defined benefit and defined contribution schemes, to a pension of two thirds of pre-retirement earnings taking

10�
GREEN PAPER ON Pensions
into account any benefits paid as lump sums, subject to an overall pension fund cap of €5 million (indexed from 2007) introduced in the 2006 Budget and Finance Act.
7.8 Personal pension arrangements consist essentially of Retirement Annuity Contracts (RACs) used by the self-employed and more recently Personal Retirement Savings Accounts (PRSAs) which were designed, among other things, to suit the needs of groups with low occupational coverage, such as women, low paid/part time workers and workers in sectors where occupational schemes are not traditionally offered. These contracts and accounts operate like defined contribution schemes in that the risk of underperformance lies solely with the individual taking out the contract or account.
7.9 In order to qualify for tax relief on contributions and fund investments, all private pension fund arrangements, whether occupational schemes, RACs or PRSAs, must have Revenue approval. Occupational pension schemes also encompass small self-administered pension schemes (SSASs). SSASs are typically single member schemes, with the member also normally being the owner of a business and a trustee of the scheme. Special Revenue rules apply in relation to their approval, operation and supervision.
Principal Features of Pensions Tax Arrangements
7.10 The principal features of the current pensions tax regime relate to contributions, the growth in pension funds and pension benefits. The details of each are set out in turn below for Occupational Pension Schemes, RACs and PRSAs.
Occupational Pension Schemes7.11 Employee Contributions to occupational pension
schemes are deductible for income tax and PRSI (including health levy) purposes and are tax relieved at the individual’s marginal income tax rate. Age related percentage limits apply to contributions as follows:
Table 7.1: Contribution Limits
Age Limit as % of remuneration
Under 30 15%
30-39 20%
40-49 25%
50-54 30%
55-59 35%
60 or over 40%
7.12 In addition, tax relievable contributions are subject to an earnings cap of €262,382 per annum for 2007 with the result that the maximum annual tax relieved employee contribution for 2007 is limited to €104,953 i.e. €262,382 x 40% for an employee aged 60 or over. The earnings cap is a single cap that applies across all pension contributions by or in respect of an individual including contributions to occupational pension schemes, additional voluntary contributions, retirement annuity contracts and personal retirement savings accounts. It does not, however, encompass employer contributions to occupational schemes on behalf of an employee – see paragraph 7.13 following.
7.13 Employer Contributions on behalf of employees are tax deductible in computing the profits for tax purposes of the employing business. Employer contributions are specifically exempted from being charged as remuneration of the employees concerned in the form of benefits-in-kind. One result of the tax exempt treatment of these benefits to employees is that the age and earnings-related restrictions on tax relief for pension contributions mentioned above do not apply.
7.14 Pension Fund: The investment income and capital gains of a pension scheme are exempt from income tax and capital gains tax.
7.15 Pension benefits arising from the pension fund at “normal retirement age” — any time between ages 60 and 70 — are taxable in the hands of the individual at his/her marginal tax rate with the exception of any benefit taken as a tax-free lump sum. The tax-free lump sum is limited to 1.5 times final salary or in certain cases 25% of the value of the individual’s pension fund (subject to the limits introduced in the 2006 Budget

10�
GREEN PAPER ON Pensions
and Finance Act – see 7.24 below). Certain pension scheme members have the option of investing their matured fund (or part of it) in an Approved Retirement Fund or Approved Minimum Retirement Fund (see paragraphs 7.53 - 7.66).
Personal pension arrangements7.16 The two main products in the personal pensions
area are Retirement Annuity Contracts (RACs) and Personal Retirement Savings Accounts (PRSAs) and these are explained below.
7.17 RACs are insurance policies taken out by an individual with an insurance company. In character, they are, effectively, defined contribution schemes:
l Contributions: All contributions are paid by the individual with usually no corresponding employer contribution. Contributions are deductible for income tax purposes and are tax relieved at the person’s marginal income tax rate. The same age-related percentage limits apply to tax-relieved contributions as apply in relation to employees’ contributions to occupational schemes;
l Tax-relieved contributions are also, in addition to the age-related percentage limits, subject to an annual net relevant earnings cap which for 2007 stands at €262,382. However, part of a contribution not allowed in one year may be carried forward and relief is allowed in subsequent years subject to the annual contribution limits and earnings cap;
l Pension Fund: the investment income and capital gains of investments used to back RACs are exempt from income tax and capital gains tax;
l Pension benefits from an RAC on maturity are taxable in the hands of the individual at his/her marginal tax rate with the exception of a tax-free “lump sum” of 25% of the value of the fund. The remainder may be used to purchase an annuity or to invest in an Approved Retirement Fund or Approved Minimum Retirement Fund (see paragraph 7.53 on “Flexible Options – Approved Retirement Funds”). Unlike occupational pension schemes, the concept of “normal retirement age” does not apply and benefits may be taken at any age between 60 and 75, whether the individual has actually retired from work or not.
Personal Retirement Savings Accounts (PRSAs)7.18 PRSAs are a relatively new type of pension
vehicle introduced in 2002 as a flexible low-cost portable pension product which can be used for long-term retirement provision by everyone – employees, self-employed or unemployed. PRSAs are mainly designed to act as a vehicle for retirement savings for those who are not members of occupational pension schemes. The tax treatment of PRSAs is similar to that given to RACs. In effect, a PRSA is a contract between an individual and a PRSA provider (insurer, credit institution or investment firm) in the form of an account that holds units in investment funds managed by PRSA providers. The PRSA contributor is the beneficial owner of the PRSA assets — unlike occupational schemes where the scheme trustees hold the assets on behalf of the scheme member(s):
l Contributions are deductible for income tax and PRSI purposes and are tax relieved at the individual’s marginal income tax rate. Age-related percentage limits apply to contributions as per those outlined above in relation to occupational schemes and RACs;
l Tax-relieved contributions are subject to an earnings cap of €262,382 for 2007;
l Employers may also contribute - but are not obliged to - and, unlike the position for occupational pension schemes, such contributions are treated as benefits-in-kind (BIK) and included within the age-related percentage limits and within the overall €262,382 earnings cap for 2007, for the purposes of tax relief. Employer contributions which, together with employee contributions, exceed these limits result in an unrelieved BIK charge on the employee in respect of that excess;
l Pension Fund: the investment income and capital gains of a PRSA are exempt from income tax and capital gains tax;
l Pension Benefits: under a PRSA may, with some exceptions, be taken from age 60 to age 75. As with RACs, 25% of the fund can be taken as a tax free “lump sum” with the remainder used to provide a pension or invested in an Approved Retirement Fund or Approved Minimum Retirement Fund.

10�
GREEN PAPER ON Pensions
Differences in the tax relief arrangements for pension contributions7.19 There are a number of differences in the tax
treatment of pension contributions across the various pensions products. This is notwithstanding that some changes made in recent years were intended to standardise tax relief.
7.20 Application of the age-related and earnings cap limits: The wider range of age-related percentage limits, currently 15% to 40% of remuneration / net relevant earnings, and the earnings cap applying to contributions were first introduced in relation to RACs in 1999. The same limits were applied to PRSAs when they were introduced in 2002 and also to employee contributions to occupational schemes in Finance Act 2002. However, the age-related percentage limits and the earnings cap do not apply to employer contributions to occupational pension schemes on behalf of an employee.
7.21 The narrower application of the age-related percentage limits and earnings cap in the case of occupational pension schemes as compared with PRSAs is the result of the specific exemption from a benefit-in-kind (BIK) charge of employer contributions to such schemes - an exemption which does not apply to employer contributions to PRSAs.
7.22 The limits and cap apply to all contributions to RACs as employer contributions are not a feature of such contracts. Therefore, whilst there is a clear limit on tax-relieved contributions to RACs and PRSAs, that limit does not operate in relation to occupational pension schemes.
7.23 Prior to the 2006 Budget and Finance Act changes (see paragraph 7.24 below), which introduced a restriction on the capital value of a pension fund that can be built up with tax relieved contributions, the sole “control” in relation to occupational pension schemes was the statutory maximum benefit of two-thirds final remuneration that could be funded. For the majority of employees, the new pension fund limit and the maximum benefit rule is not an issue as the level of pension funding in defined contribution schemes is unlikely to be sufficient to provide a benefit of two-thirds final salary
or a fund near €5 million. Before the 2006 changes, however, the maximum benefits limit was defective in relation to certain categories of high-earning “employees” in the absence of an absolute monetary cap on:
l the salary figure on which the two-thirds maximum could be based, or
l the size of the fund to deliver pension benefits.
7.24 Changes were introduced in the Budget and
Finance Act 2006 curbing the use of tax relief for pension provision by high-earners. The measures introduced included placing a cap of €5 million (indexed from 2007) on the maximum value of a pension fund that could be funded out of tax-relieved contributions. A cap of 25% of the maximum tax-relieved pension fund was also introduced on the amount that could be taken as a tax-free lump sum.
7.25 The various tax reliefs and rules relating to them make the tax incentive system for supplementary pension provision appear complex and difficult to understand. There may be a case for further simplifying these arrangements, where possible.
Current Rules for Funding Pension Benefits
7.26 Under current rules, the maximum benefit that an individual can receive from an occupational pension scheme at normal retirement age is a pension of two-thirds of final remuneration. The rules envisage this accruing over a period of 40 years’ service with the same employer at the rate of 1/60th of final remuneration for each year of service – this is known as “the strict 1/60th basis”. However, it is possible to qualify for this maximum benefit over a shorter period under what is known as the “uplifted scale”. Under this approach an individual can, starting not less than 10 years from normal retirement age, fund for the maximum benefit of two-thirds of final remuneration.
7.27 Part of the maximum pension benefit can also be commuted into a tax-free lump sum. The maximum lump-sum benefit that can be achieved at normal retirement age by

10�
GREEN PAPER ON Pensions
an employee is one and a half times final remuneration i.e. 3/80ths of final remuneration for each year of service over a 40 year period. Late entrants can commute part of their pension at a higher rate than this but, in that regard, the maximum lump sum commutation of one and a half times final remuneration can only be provided where the employee has 20 years’ service with his or her current employer.
7.28 Practically all occupational pension schemes set up in the last 15 years have been defined contribution schemes with no specific “benefit promise” in terms of a guaranteed level of pension. Pension benefits are unlikely to come any where near the two-thirds maximum of final remuneration for the vast majority of scheme members. The exception, in this regard, relates to certain categories of employees, i.e. proprietary directors and top executives. These employees are able to negotiate their level of “final remuneration”. Given the ability to adjust the remuneration component of the maximum benefit limit, the two–thirds rule was ineffective and never likely to be breached.
7.29 The limits put in place in the 2006 Budget and Finance Act on the maximum value of tax-relieved pension funds and tax free lump sum are designed to limit the cost to the Exchequer and to control the ability of high earning individuals in the categories mentioned to fund for their pensions.
Cost of Tax Reliefs
7.30 As part of the work on the Green Paper on Pensions, a review was carried out of the current regime of incentives for supplementary pension provision with a view to developing more comprehensive and reliable estimates of the cost of reliefs in this area. The review was carried out by an informal working group made up of officials of the Department of Finance, the Revenue Commissioners, the Department of Social and Family Affairs and the Pensions Board.
7.31 The working group examined, among other things, the current reliefs and incentives for investment in supplementary pensions and the data available on which to base reliable estimates of the costs in revenue foregone to the Exchequer. In particular, the availability of more reliable data for 2006 on contributions by employers and employees to pension schemes arising from the employers’ P35 initiative (see paragraph 7.35 below) was important in this regard.
7.32 The total estimated cost of tax and PRSI (including health levy) relief for 2006 is €2.9 billion. A breakdown of this figure is set out in table 7.2 hereunder:
7.33 The breakdown and make-up of the estimated cost of reliefs set out in table 7.2 differ from previous presentations of costs in this area in the following respects:
Table 7.2: Estimate of the cost of tax and PRSI reliefs for private pension provision 2006
Estimated costs €million
Employees’ Contributions to approved Superannuation Schemes 540 a
Employers’ Contributions to approved Superannuation Schemes 120 b
Estimated cost of exemption of employers’ contributions from employee BIK 510 c
Exemption of investment income and gains of approved Superannuation Funds 1,200 d
Retirement Annuity Contracts (RACs) 380 e
Personal Retirement Savings Accounts (PRSAs) 120 f
Estimated cost of tax relief on “tax-free” lump sum payments 130 g
Estimated cost of PRSI and Health Levy relief on employee and employer contributions 220 h
Gross cost of tax relief 3,220
Estimated tax yield from payment of pension benefits 320 j
Net cost of tax relief 2,900
See Appendix C for footnotes to table 7.2

10�
GREEN PAPER ON Pensions
l The estimated 2006 costs of tax relief on employee and employer contributions to approved pension schemes are based on the aggregate data of such contributions obtained from employers’ P35 returns for 2006. Previous estimates of costs in this area tended to over-estimate the level of pension contributions on behalf of employees and, in particular, by employers which also resulted in an over-estimate of the cost of tax relief involved.
l The investment income and gains of pension funds are exempt from income tax and capital gains tax and an estimate of the cost of this exemption is included in table 7.2. Previous estimates of the cost of tax relief for pension funds also included a notional charge to tax of the net cash flow income of pension funds (contributions less benefit pay-outs). The rationale for this notional charge was linked to the assumption for tax costing purposes that pension funds are separate taxable entities. However, since the (net) contributions income to which the notional charge applied has historically been exempt from tax in the hands of employees and employers, it is considered that the charge should not be ascribed to this income in the hands of the pension funds. No associated cost is therefore included as part of the cost of tax relief for pension funds in table 7.2.
l Estimates of the cost of benefit-in-kind (BIK) exemption of employers’ contributions, the estimated cost of tax relief on lump sum payments, the cost of PRSI and health levy relief on employee and employer contributions and a tentative estimate of the tax yield from the payment of pension benefits have not been included in previous presentations of the Exchequer costs of supplementary pension provision but are included in the estimates of the 2006 cost in table 7.2.
7.34 The information imparted by the costing of tax and other reliefs in the pensions area as detailed above is, however, inherently limited. It may suggest a significant notional loss against an equally significant assumed yield in the counterfactual situation of tax reliefs for supplementary pension provision not being available. However, where tax relief
arrangements are of such significance, as in this instance, the removal of the reliefs would represent a fundamental adjustment to the current balance of the tax system and would have very significant implications in terms, among other things, of the economic and behavioural impacts which would ensue. These impacts would be difficult to model in advance. For these reasons, the real informational content of these costings of tax reliefs is limited and should be treated with some caution.
Employers P35 Initiative7.35 While individuals are obliged to provide
details annually in Form 11 to the Revenue Commissioners of their contributions to personal pension schemes such as RACs and PRSAs, in order to avail of tax relief on those contributions, employers have not been required until recently to provide details of the employer or employee contributions to the pension schemes operated by them. Provisions were included in Finance Act 2004 to improve data quality and transparency without over-burdening taxpayers. The Revenue Commissioners sought additional information on pension contributions by employees and employers to occupational pension schemes as well as to RACs and PRSAs in the P35 returns to be filed by employers from 2006 onwards. Revenue have extracted this data from the P35 returns for 2005 and 2006. While Revenue have concerns about the quality and reliability of the data for 2005, the data for 2006 are significantly more reliable at the aggregate level as the P35 returns for that year were filed via the Revenue Online System (ROS). Work is underway in Revenue to correct any flaws in the data insofar as they can be identified, with priority being given to the more substantial errors which occurred in the 2005 returns. The new P35 data is intended to yield additional information regarding the overall cost of tax relief on pension contributions. As the data is aggregated at employer level, however, it does not provide a basis for analysis at individual employee level.
Value for Money
7.36 In assessing whether tax incentives for private pension provision provide value for money, one

10�
GREEN PAPER ON Pensions
must consider their effectiveness (achieving the objective) as well as their efficiency (achieving the objective at the lowest cost). As outlined earlier, the role of private pension provision in Ireland is, inter alia, to supplement the pensions provided through the Social Welfare system to ensure that income in retirement is more closely related to the income received by a person when they were employed. The State encourages and promotes membership of occupational and personal pension schemes through a combination of a tax incentive regime and through regulation to safeguard entitlements.
7.37 It is also necessary to look at the equity of tax relief. It is generally agreed that the object of tax relief must be to incentivise and support those less able to make adequate pension provision and not necessarily to subsidise those who are in the strongest position to do so.
7.38 The present taxation treatment of supplementary pensions is long-standing. It has encouraged a significant portion of the labour market to fund private supplementary pensions. It is considered that well over half of those in employment (about 2.1 million people in the second quarter of this year) are currently covered by pension arrangements beyond the State pension and, while this proportion has increased modestly, the absolute numbers covered have been increasing relatively rapidly in recent years. The Quarterly National Household Survey (QNHS) for the 4th quarter of 2005 (published by the CSO) shows that pension coverage for all persons in employment between the ages of 20 and 69 had increased to 55% in Quarter 4 of 2005 representing an increase of nearly 7.5 % on the 51.2% recorded in the first quarter of 2002. This has also occurred in the context of a growing labour force.
7.39 For the group aged between 30 and 65, the coverage level in Q4 of 2005 is estimated (per the QNHS) at close to 62%. This compares to the 70% target which NPPI recommended should be met sometime after 2013.
7.40 Increasing pension coverage considerably has
proved difficult, notwithstanding the tax incentives on offer. There are several reasons for this including inertia, the profile of many of those entering the workforce in recent years, education
and awareness, marketing, regulation, the existence of other forms of retirement provision (e.g. ownership of rental property or business) and the capacity of individuals to make the contributions required. With people marrying later and facing significant mortgage costs, and also child care, education and other costs throughout these years, the capacity of many individuals to divert the levels of income required into a pension product may be limited. A combination of these factors is undoubtedly at work.
7.41 Notwithstanding these factors, it is still the case that the absolute numbers of those with supplementary pension provision increased in the period 1995 to 2004 from over a half-million to one million supported by the current incentives.
Considerations of Equity
7.42 The case is made that tax relief for pension provision is not “vertically equitable” i.e. that the better off are benefiting most and that more support should be directed towards those on lower incomes.
7.43 In this regard, comparisons have been drawn in this debate between the levels of expenditure on Social Welfare pension payments and pensions related tax relief in any given year. However, these are not like-for-like comparisons. In the first instance, the “expenditures” are targeted at different populations for different purposes.
7.44 Social Welfare pension expenditure represents the liability of the State to provide an income to those who have already retired. The tax relief arrangements for voluntary private pension provision represent an effort by the State to encourage people currently at work to provide future income for themselves by establishing or contributing to a pension fund.
7.45 There is no data available to the Revenue Commissioners (for reasons already explained) which would provide a breakdown across income levels of the tax relief to members of occupational pension schemes. Such information is available, however, in respect of tax relief allowed for contributions to Retirement Annuity Contracts (RACs) for the tax year 2003. The breakdown across income levels

10�
GREEN PAPER ON Pensions
for tax relief on contributions to RACs is detailed in the table at Appendix D.
7.46 There have been calls for the incentives to be better targeted in a cost-effective manner that enhances the attractiveness of private pension provision to lower income groups. Some proposals suggest that this could be achieved through a form of a “matching contribution” which would be the same for all taxpayers and which could also be availed of by those who do not have access to tax relief at any given time due to unemployment or non-participation in the workforce. Another option is to consider moving towards a system of tapered matching contributions to private pensions. However, even under such a matching arrangement, the take-up issues of the current regime may continue. Depending on the structure of the matching contribution, the additional costs could be considerable and would have to have regard to the sustainability issues raised elsewhere in the Green Paper.
7.47 Other proposals suggest that tax relief at the top tax rate for higher earners be reduced and used to pay for greater tax relief for those on lower incomes as a means of incentivising supplementary pension provision among lower income groups. Such proposals would need to be considered in the context of tax as well as pension policy. While such a move would add to the progressivity of the tax system, it would also have a negative effect overall on pension coverage by discouraging higher income earners from pension investment without necessarily guaranteeing an increase in coverage at lower income levels.
7.48 The Pensions Incentive Tax Credits scheme introduced in the 2006 Finance Act is an example of an attempt to bring greater equity into the system for incentivising private pension coverage. This scheme provides an incentive for eligible SSIA holders on lower incomes to reinvest all or part of their net SSIA proceeds, after maturity, into an approved pension product (including Additional Voluntary Contributions (AVCs), RACs and PRSAs).
7.49 The incentives under the scheme involve a tax credit of €1 for every €3 of SSIA proceeds reinvested, up to a maximum of €2,500 credit (i.e. €7,500 invested). There is also an additional
tax credit available under the scheme relating to the exit tax payable on the investment return accrued in the matured SSIA. The amount of this additional credit is based on the proportion of funds transferred to an approved pension product from the SSIA on maturity. Where an SSIA holder avails of the Pensions Incentive Tax Credits scheme, it is not possible to claim any further tax relief for the amounts invested under the scheme.
7.50 Take-up of the scheme, the final date for availing of which was 31 July 2007, was low with about 1% of all holders of matured SSIAs availing of the scheme (although, among other conditions, only account holders whose gross income was less than €50,000 in the tax year before the year in which their SSIA matured would have qualified for the scheme in the first instance).
7.51 The potential reasons for the low take-up of the scheme include:
(i) SSIA holders may already have made decisions, before the introduction of the incentive, about what they were going to do with their matured funds, including alternative investments (e.g. property), house improvements, cars, holidays etc.
(ii) The recent CSO Quarterly National Household Survey for Q4 of 2005 indicated that less than a quarter (about 23%) of SSIA holders in employment aged between 20 and 69 had no pension arrangements. This would mean that the potential market for the Pensions Incentive Tax Credit scheme among SSIA holders may be smaller than might have been expected and that individuals not engaged in pension saving were less likely to have an SSIA account in the first place.
(iii) The incentive was specifically targeted at lower earners who may be less likely to be willing or in a position to invest in pensions.
(iv) Pension fund administrators appeared slow to register with the Revenue Commissioners in order to operate the scheme and there seemed to be delays among the administrators in setting up systems and in advertising the availability of the scheme.
(v) As a result, in part, of (iv) above there may have been a general ignorance among many SSIA holders about the existence of the scheme

110
GREEN PAPER ON Pensions
7.52 While the Pensions Incentive Tax Credits scheme meets the criteria of being simple and easy to understand (in concept, at least) as compared to tax relief, these features did not prove sufficient to ensure its success as a pension incentive measure.
Flexible Options - Approved Retirement Funds
7.53 Prior to the Finance Act 1999, any person taking a pension under a defined contribution scheme or an RAC was required to purchase an annuity with the pension fund moneys remaining after the drawdown of the appropriate tax-free lump sum. The Finance Act 1999 introduced significant changes which gave a considerable degree of control, flexibility and personal choice to certain categories of individual in relation to the drawing down of benefits from their pension plans. These choices include the options to purchase an annuity, receive the balance of the fund in cash (subject to tax, as appropriate), to invest in an Approved Retirement Fund (ARF) or Approved Minimum Retirement Fund (AMRF), as appropriate, or a combination of these.
7.54 ARFs and AMRFs are not pension schemes per se. They are investment options into which the proceeds of certain pension arrangements can be invested on retirement. Individuals are entitled to take their tax-free lump sum option as part of the election for an ARF. Beneficial ownership of the assets in an ARF/AMRF vests in the individual. The ARF/AMRF is managed by a Qualifying Fund Manager and tax is not payable on its investment income or capital gains while the funds are invested in it.
7.55 The option to have all or part of an individual’s accumulated pension fund placed in an ARF must be exercised not later than the date on which the annuity or pension would otherwise become payable. The option is open to a qualified person101 who is either over 75 years of age or who has a guaranteed pension income
101 Proprietary directors, self-employed individuals and certain employees/directors in non-pensionable employment represent the categories of individual who can exercise these options in relation to their pension plans.
(specified income) actually in payment for life of at least €12,700 per annum.
7.56 Where the minimum specified income test is not met, then an AMRF must be chosen into which the first €63,500 of the pension fund or the whole of the fund, if less than this amount, must be invested (alternatively an annuity can be purchased with the first €63,500 of the pension fund and the balance placed in an ARF). The capital in an AMRF is not available to an individual until he or she reaches 75 years though any income generated by the fund can be drawn down subject to tax. The purpose of an AMRF is to ensure a capital or income “safety net” for certain individuals throughout the period of their retirement.
7.57 Sums withdrawn from the ARF/AMRF are subject to tax at the individual’s marginal tax rate, other than when they are transferred to another ARF which is also beneficially owned by that individual. The 2006 Budget and Finance Act introduced an imputed or notional distribution of 3% of the value of the assets of an ARF (but not an AMRF) on 31 December each year, which notional amount will be taxed at the ARF owner’s marginal income tax rate.
7.58 The notional distribution from ARFs is being phased in over a three year period commencing in 2007. This measure was introduced because the internal review of tax relief for pensions provision undertaken by the Department of Finance and the Revenue Commissioners in 2005 found that the ARF option was largely not being used, as intended, to fund an income stream in retirement and, in certain cases, was being used to build up substantial funds in a tax-free environment over the long-term. The imputed distribution measure will encourage the use of ARFs as intended, as funds actually drawn down by ARF owners will be credited against the imputed distribution to arrive at a net imputed amount, if any.
7.59 Availability of ARF option to AVCs and PRSAs: While the flexible options for drawing down pension benefits described above are not available to members of defined contribution or defined benefit schemes (who are outside of the categories of individual described above) in respect of benefits derived from standard

111
GREEN PAPER ON Pensions
contributions to the schemes, the option is available in a limited fashion in respect of Additional Voluntary Contributions (AVCs) made by such members either to their main schemes or to separate AVC schemes.
7.60 The Pensions (Amendment) Act 2002 introduced Personal Retirement Savings Accounts (PRSAs) the aim of which was to create an attractive alternative pension product which is flexible, portable and user-friendly. The flexible options relating to the drawing down of pension benefits also apply to PRSAs i.e. the benefits of the PRSA can be paid into an ARF.
7.61 Further extension of the ARF option: It has been suggested that ARFs should be offered as an alternative to annuities to members of occupational pension schemes in respect of their main benefits from such schemes. There have also been calls for the existing arrangements for ARFs and AMRFs to be extended in other circumstances e.g. to allow for joint-life ARFs and to permit a surviving spouse to avail of the ARF option in circumstances where the beneficiary of a pension fund had indicated an intention to exercise that option but had died before the transaction could take place. These and other possible scenarios form part of the wider debate for the extension of the flexible options introduced in 1999.
7.62 The arguments in favour of an extension of the ARF option broadly surround the issues of a perceived lack of value in the current options (the cost of and value in annuities – dealt with in Chapter 11) and the question of equitable treatment of all pensioners.
7.63 The following arguments can be made in support of the case for extending the availability of the ARF/AMRF option:
l All members of a pension arrangement would be in a position to avail of an ARF/AMRF so it would create a level playing field and simplification for all pension provision;
l It may make retirement provision more attractive as more options would be available;
l The entire pension fund will not necessarily be used up with the requirement to purchase
an annuity thus providing more flexibility to the pension fund holder;
l DC scheme members would not be forced to select a current annuity rate which may appear to be poor value;
l The residual fund after death of a member can be passed to family members.
7.64 The following arguments can be made against a general extension of the ARF/AMRF option:-
l There would be costs in tax terms attaching to any extension of these options (which would have to be weighed against the above benefits);
l The investment risk attaching to ARFs/AMRFs will continue indefinitely and, as longevity can only be estimated, the funds of many retired individuals may be depleted prior to death. This could involve demands for income support;
l Ongoing reviews of ARF investments would be required, possibly on an annual basis, thus incurring more charges and more monitoring;
l A general extension of the ARF/AMRF option could reduce the liquidity and depth of the annuity market.
7.65 As part of the debate on extending the ARF option, the issue of reviewing the conditions currently in place to access an ARF arises. These conditions have not been reviewed since the introduction of the ARF option in 1999. A qualifying individual under 75 whose guaranteed income for life is under €12,700 must invest a minimum of €63,500 of their pension fund (or the value of the fund if less) in an AMRF until they reach age 75 or otherwise purchase an equivalent annuity. The argument is made that there is little correlation between these various requirements. For example, if €63,500 was used to purchase an annuity at current prices, it would not provide an annual income close to €12,700. One approach could involve increasing the current specified income limit in line with indexation while dispensing with the requirement regarding the alternative uses of the €63,500.
7.66 As already mentioned, ARFs/AMRFs are not pensions. Extending the ARF option is unlikely of itself to significantly improve pension

11�
GREEN PAPER ON Pensions
coverage or adequacy. On the coverage issue, anyone who does not already have supplementary pension provision can begin contributions to a PRSA or, where the individual is self-employed, to an RAC both of which pension products are eligible for the ARF option. Anyone currently in an occupational pension scheme and not eligible for the ARF option but wishing to make additional pension savings (e.g. who wants to improve the adequacy of their pension) can do so through contributions to a PRSA or an AVC both of which again qualify for the ARF option.
Options for Change
7.67 In its National Pensions Review report published by the Minister for Social and Family Affairs, the Pensions Board proposed changes to the taxation arrangements for voluntary private pension provision. In its report “Special Savings for Retirement”, the Pensions Board considered various forms of mandatory pension schemes, including a “soft” mandatory and “hybrid” scheme. These various options for change are detailed hereunder:
a) The Board recommended that the State incentive for personal contributions to Personal Retirement Savings Accounts (PRSAs) be granted by means of a matching contribution of €1 for each € 1 invested (subject to a maximum amount). The Board also recommended that PRSA contributors be allowed a limited access to their funds before the age of 45.
b) For other forms of supplementary pension provision, tax relief at the higher (41%) rate for all personal contributions was recommended whether through the current method of granting relief at source or by means of a refundable tax credit. As a contribution towards the cost of providing incentives to the lower paid at the same rate as top-rate payers, the Pension Board supported a cap on incomes for pension contribution and benefit purposes but only if the derived savings are used to improve incentives for lower rate taxpayers and non-taxpayers.
c) The Board recommended that incentives be introduced to encourage the proceeds of SSIAs to be saved for retirement. It recommended that these incentives be targeted at those who would not otherwise qualify for tax relief or who have not fully availed of their tax relief entitlement as follows:
(i) once –off increase in pension contribution limits for those who had not fully used their pension contribution allowances in the past
(ii) exemption from SSIA exit tax on transfer to pensions where no income tax relief is being claimed on the transferred amount.
d) The Pensions Board examined the following options, among others, for mandatory pension schemes (suggesting that the “hybrid” model was the most appropriate):
l a “soft” mandatory / automatic enrolment scheme with opt-out (9% contribution rate); and
l a “hybrid” model combining an increase in the State Pension to 40% of Gross Average Industrial Earnings (GAIE) and a mandatory supplementary system for those at work who are not making supplementary provision (15% contribution rate including 5% Exchequer contribution).
e) Although not an option “for change”, the
retention of tax relief arrangements on the current lines is also an option for consideration.
7.68 These various policy options are considered in the following paragraphs. In terms of the costs of these options, these must be put within the context of the significant sustainability challenges an ageing population already poses. In addition, the estimated costs for each of the various options for change are presented on a stand-alone basis and not as a package which would involve a different and altogether more complex costing exercise.

11�
GREEN PAPER ON Pensions
(a) A matching contribution from the Exchequer for each € paid by way of personal contribution to PRSAs
7.69 This proposal is based on the success of the structure of the SSIA scheme and on the premise that people find this incentive easier to understand and more transparent than the current regime of tax reliefs albeit with a much higher rate of Exchequer contribution than for SSIAs. The Pensions Board model is very specific in relation to the matching contribution it has suggested in the National Pensions Review. However, this should not exclude consideration of other models on this general theme in the context of the Green Paper consultation process. For instance, an alternative suggestion could involve the use of tapered matching contributions which could have the effect of reducing the overall cost of such a measure and providing a more targeted approach to supplementary pension incentives. The design of any such scheme would, of course, require very careful consideration.
7.70 PRSA contributions, under the proposed €1 for €1 scheme, would come from after-tax income (individual contributors would receive no tax or PRSI relief). The proposal suggests that employer contributions to PRSAs (where made) would continue to be treated as an allowable expense for tax purposes but employers would lose the PRSI saving they currently make on such contributions.
7.71 While an incentive of this nature may be easier to understand than the current system of tax relief, its success in tempting people without private pension cover to invest will depend, not only on their understanding of the value of the concession relative to the value of the existing tax and PRSI relief incentive, but also on being convinced of the economic value of investing in a pension in the first instance having regard to their own circumstances.
7.72 There are a number of advantages to this approach. Firstly, a direct Exchequer contribution of €1 for every personal contribution of €1 to a PRSA would be considerably greater in financial effect than the equivalent relief under the existing relief incentives for a standard (20%) rate taxpayer in respect of tax, PRSI and health levy.
A matching contribution equating to the value of 20% income tax relief, 4% employee PRSI relief, 10.75% employer PRSI relief and 2% health levy would amount to just over 58 cent102.
7.73 Secondly, it would be more equitable insofar as an Exchequer contribution of €1 would be lower than the monetary equivalent of the various reliefs paid as a direct contribution for the higher rate tax payer. In these cases, the income tax, employer PRSI relief and the health levy relief would equate to a direct payment of slightly over €1.16103.
7.74 Thirdly, at €1 for €1, the proposed incentive represents a much better incentive than tax relief for the standard rate tax payer. However, it remains uncertain as to whether it would be sufficiently attractive to improve pension coverage rates among those on lower incomes. The proposal makes reference to the incentive being subject to a cap but does not specify the level of the cap.
7.75 However, the proposal also has the following disadvantages:
a) If the intention is that a matching €1 contribution is made by the Exchequer for every €1 personal contribution made to a PRSA and that this would replace the existing tax relief incentive for investment in this product, then PRSAs will not be as attractive a vehicle for pension investment as compared with other products for those currently without pension cover whose rising income may eventually fall to be taxed at the higher tax rate. This could significantly reduce the attractiveness of PRSAs in the longer term.
b) Age-related concessions currently given by way of graduated increases in tax relief related to the age of the contributor will be lost to this scheme in the absence of a workable alternative.
102 The sum of these various percentage reliefs - 36.75% - divided by the difference between that sum and 100. (Source: National Pensions Review p.74)
103 Many higher rate taxpayers will not be receiving PRSI relief on their pension contributions as their earnings would exceed the PRSI income ceiling. This example therefore excludes employee PRSI relief.

11�
GREEN PAPER ON Pensions
c) Removal of the relief on employer PRSI attaching to employee contributions may add to labour costs.
d) In the absence of a general move from tax relief to direct subsidy in terms of incentivising private pension coverage, this proposal would add another layer of administrative complexity to the system of supplementary pension administration.
7.76 The cost to the Exchequer (and ultimately the taxpayer) of the proposed incentive would depend on the take-up among those currently without private pension arrangements and the extent to which the incentive encouraged those at the standard tax rate to switch from the current tax relief incentive regime to the direct subsidy incentive. Any costing on this basis is bound to be tentative. The estimated average gross earnings for 2007 of all income earners earning between €15,000 and €60,000 per annum (based on Revenue Commissioners’ estimated data projected from actual data for the tax year 2003) is about €33,000. On the working assumption that 25% of those currently without supplementary pension cover (close to 240,000 income earners) contributed 5% of gross annual earnings averaging €33,000 to PRSAs to take advantage of the proposed incentive, the cost to the Exchequer on a matching € for € basis would be about €400m in a full year. This would increase by a further €160m per annum for each 10% increase in coverage and would also vary depending on the accuracy of the assumptions regarding income, contribution rate and increased coverage rates. However, as indicated at 7.69, other, and less costly, models of matching contributions could be considered.
(b) Increase the level of tax relief to the higher (41%) rate for personal contributions to all forms of supplementary pension provision
7.77 This proposal assumes that those on lower incomes without supplementary pension arrangements do not invest in pensions not because they do not have the funds to do so or because it is complex but because the perceived return on the investment at the current level of (tax) incentive is insufficient. The success or failure of this proposal, in terms of increasing
pension coverage further towards the National Pension Policy Initiative targets, would depend on the reliability of this assumption. It would also depend on the relative merits for new contributors to supplementary pensions of this proposed incentive as compared with the proposed matching contribution incentive for PRSAs.
7.78 For those taxpayers whose income is below the exemption thresholds for income tax or who pay tax at the standard rate and are already investing in supplementary pensions, this incentive would be seen as improving the equity of the current tax relief system. However, this would carry some “deadweight” cost (i.e. the cost of giving the additional incentive relief to those who are already investing in pensions). No overall breakdown is available of the tax-status (e.g. higher rate, standard rate or exempt) of those already contributing to supplementary pension arrangements. The level of cost would also depend on the extent to which lower rate taxpayers currently contributing to supplementary pension arrangements other than PRSAs switched or were able to switch to PRSAs to avail of the proposed €1 for €1 matching credit proposal which is the other part of this Pensions Board proposal.
7.79 If an assumption were made, for example, that only 20% of those contributing to supplementary pension arrangements paid income tax below the top rate and that only 10% of those were tax exempt, then the additional cost of providing relief at 41% to those existing tax-exempt and standard rate pension contributors is estimated at about €80m in a full year. The cost would be greater if an equally valid assumption were made that the proportion of existing contributors paying tax below the top rate is higher than 20%. (Among the general population of taxpayers, the Revenue Commissioners indicate that some 38% are tax exempt, while 42% pay at the standard income tax rate or less and about 20% pay tax at a higher rate than the standard tax rate).
7.80 In terms of the cost of any additional take-up of this incentive, this can only be illustrative. If 10% of those currently without supplementary pension cover and earning the projected average industrial wage for 2007 of €33,000 per annum

11�
GREEN PAPER ON Pensions
commenced to invest 5% of their earnings in a pension as a result of higher tax relief, the cost to the Exchequer would be about €65 million in a full year in income tax foregone. This cost would be in addition to the €80 million cost referred to at paragraph 7.79 above.
7.81 There would be additional costs and challenges insofar as the proposed changes gave rise to “refundable tax credits” payable to individuals’ pension funds where those individuals would be due a net refund.
7.82 The Pensions Board’s recommendation for relief at the higher tax rate is accompanied with a statement supporting “a cap on incomes for pension contribution and benefit purposes but only if the derived savings are used to improve incentives for lower rate taxpayers and non-taxpayers”. The level of any cap for these purposes is not specified.
(c) Encourage the saving of SSIA proceeds for retirement purposes
7.83 The Pensions Incentive Tax Credits scheme was introduced in the Finance Act 2006 for the purpose of encouraging SSIA holders on low incomes to invest some or all of their matured SSIA funds into approved pension products. See paragraphs 7.48 to 7.52 above in relation to the “Pension Incentive Tax Credit scheme”.
d) Mandatory pension schemes7.84 The Pensions Board considered a number of
options relating to mandatory supplementary pension schemes, including “hard” mandatory, “soft” (opt-out) mandatory and a “hybrid” scheme. The principles agreed by the Pension Board at the outset of its examination of these various options specified that “changes must not damage existing pension provision or worsen the existing position of any pension scheme”. Accordingly, the estimated Exchequer costs of introducing the various options (below) are based, among other things, on the mandatory options applying to those currently in the labour force who do not have supplementary cover. The wider economic costs of the mandatory options are dealt with separately in the Green Paper.
7.85 The soft mandatory scheme considered by the Pensions Board has the following features:
(a) Eligibility All those beginning employment on or after the date of introduction of the scheme who do not become members of occupational schemes immediately on beginning employment. There would be no obligation for those who are self-employed to join, but those who wished could. Those in employment at the date of introduction of the scheme would also have the option of joining.
(b) Employee contribution
5% of income
(c) Employer contribution
2% of income
(d) Exchequer contribution
2% of income, to a maximum contribution of €750 p.a.
(e) Opt-out Contributors could cease contributions after three months’ contributions had been made. No immediate refund of contributions would be allowed in the first year. Where a refund is given, employer and Exchequer contributions are returned.All employees who would be eligible to join on beginning employment would be allowed to recommence contributions at any time on one month’s notice.
(f) Access to funds
Contributors would be allowed to access 25% of their funds tax-free on one occasion before or at retirement.
7.86 The costs of a “soft” mandatory system depend on the take-up. As an illustration of the potential cost, if it were assumed that 100,000 joined the scheme on earnings at the projected average industrial wage for 2007 of €33,000, then the cost in a full year in terms of:
l direct Exchequer contributions to the scheme;
l the tax foregone on employers contributions (including BIK tax foregone); and
l the cost of exemption of the investment income and capital gains of the pension fund

11�
GREEN PAPER ON Pensions
is estimated at €95 million. This cost would rise if the numbers joining the scheme rose beyond 100,000 all other things being equal. (These estimates assume no “opt-outs” from the scheme).
7.87 The “soft” mandatory proposal includes access to pension funds before retirement as a feature. The long-term nature of pension savings is cited as a reason why many choose not to save for retirement or fail to avail of the tax supports for pension savings. There is a view that if individuals were allowed to access some of their pensions savings, the remaining amount that they would save for retirement would nonetheless be greater than it would otherwise have been, i.e. than if they had not saved at all.
7.88 The following arguments are put forward in support of access to pension funds:-
l The commitment required to pension savings would be viewed as less onerous and people could begin and continue pension saving in the knowledge that if their circumstances changed in the future they could access at least part of their assets;
l From an individual’s point of view, an access facility would make savings more efficient as there would be less need to separate retirement savings from other shorter term savings;
l There is a view that the advantage of this facility is more to do with perception than actual usage, and that the positive effects in terms of saving would outweigh the negative effects of actual withdrawals.
7.89 Access to funds is seen to have the following drawbacks:-
l The risk is that many individuals who are already contributing towards a pension will take advantage of this facility with the effect of reducing their retirement provision: this would be an issue particularly for those in compulsory schemes;
l There is a trade-off which may not be acceptable between coverage – new savers attracted by more flexible arrangements – and adequacy – existing savers reducing what may already be inadequate pension provision;
l Given the possibility of undermining the adequacy of existing pension savings,
any change in this area would need to be justified on the basis that it would lead to a net increase in pensions savings. This is an unlikely scenario;
l Depending on the taxation treatment of withdrawals and the impact of access arrangements, there could be additional costs to the Exchequer.
7.90 The “hybrid” mandatory scheme considered by the Pensions Board has the following features:
Eligibility All employees and self-employed
Eligible income
All earned income between 125% and 500% of the increased State pension (between approximately €15,000 and €60,000 as at June 2006)
Benefit type Defined contribution
Contribution rate
15% of eligible income
Exchequer contribution
5% (included in the 15% above). This would be in lieu of any employer and employee PRSI relief and of any employee tax relief on contributions
Pre-retirement access
None
7.91 In order to assess the cost of the mandatory supplementary element of the hybrid scheme, the following assumptions have been made:
l That the annual earnings on which contributions, including the Exchequer contribution, would be made would be in the range €15,000 to €60,000 and that the average gross earnings of relevant income earners in this range is €28,500 per annum for 2007 ( based on results of the CSO’s latest EU-SILC survey – Survey of Income and Living Conditions);
l The Exchequer contribution (5%) would be in lieu of PRSI relief on employer/employee contributions and in lieu of employee tax relief on contributions which would be paid out of after-tax income;
l No mention is made about tax relief on employers’ contributions to the scheme and it is assumed that such contributions would be considered a business expense and a tax cost to the Exchequer under the proposed scheme;

11�
GREEN PAPER ON Pensions
l That the scheme would be mandatory for those currently without supplementary pension coverage.
7.92 The cost to the Exchequer on the basis set out above (in addition to the cost of higher Social Welfare pensions under this proposal) in terms of its direct contributions to the scheme, the tax foregone on employers contributions (including BIK tax foregone) and the cost of exemption of investment growth on contributions to pension funds is estimated at about €1.4 billion104 in a full year. The full year cost of the “hybrid” scheme if fully operational and including the cost of higher Social Welfare pensions (about €1.1 billion) together with the cost of the mandatory supplementary scheme is estimated at €2.5 billion. The cost of higher Social Welfare pensions excludes the effects of claims for increases in all other Social Welfare weekly schemes. Such a cost would have to be funded from relatively lower spending elsewhere or from higher taxes with consequent impacts on growth and employment. This would pose significant problems and difficult policy decisions within the wider Government Sector. The estimated costs for either the “soft” or “hybrid” mandatory scheme would be additional to the Exchequer costs in terms of tax and PRSI relief under the existing scheme of incentives for supplementary pension provision.
7.93 Reports prepared by the Pensions Board have highlighted significant issues around the economic and financial sustainability of mandatory pension systems. The ESRI have estimated that the “hybrid” mandatory scheme considered by the Board would have the impact
104 This cost assumes that the rates of contribution to the mandatory scheme would apply to the full earnings of those currently without supplementary pension cover and required to join the scheme. The Pensions Board had envisaged that the first €15,000 of income of contributors under the scheme would be disregarded for the purposes of pension contributions (replacement income for earnings up to €15,000 being taken care of by the Social Welfare pension). As this would mean a lower effective rate of contribution to the scheme, the cost to the Exchequer on this basis would be lower than €1.4 billion in a full year. There could, however, be practical difficulties in implementing the scheme on this basis so that €1.4 billion may be considered a more prudent estimate.
of reducing real GDP by close to 0.3% in the first year and by about 0.6% in the second year.
7.94 An obvious practical disadvantage of a mandatory supplementary (direct subvention) scheme existing side by side with the current (tax relief) incentive scheme is that it will place additional cost and administrative burdens on employers, employees and the Revenue Commissioners. For employers, payroll systems currently cater for employees with supplementary pension arrangements under the existing (tax relief) scheme by ignoring pension contributions from gross pay for tax and PRSI purposes. Under a mandatory scheme as described under either option above, payroll systems will either have to be adjusted to tax pension contributions for mandatory scheme members or a reliable alternative system would have to be put in place to capture the tax and PRSI due on such contributions. A move in the latter direction would also increase compliance and administrative burdens on employees and the Revenue Commissioners.

11�
GREEN PAPER ON Pensions
Supplementary Pensions – Incentives for Retirement Saving
This Chapter details the current tax arrangements for investment in supplementary pensions. These arrangements involve tax relief on amounts contributed by employers and employees to approved pension schemes and on the investment income and capital gains of the pension funds. Pension benefits payable on or after retirement are taxable subject to an entitlement to a tax-free lump-sum cash benefit.
The Chapter also discusses issues surrounding the estimated cost of these tax incentives. It also discusses value for money and equity issues relating to the current tax relief arrangements. In this context, the potential factors militating against an improvement in supplementary pension coverage are outlined, notwithstanding the tax incentives on offer. The arguments made for tax incentives to be better targeted for those on lower incomes in a cost effective way are considered.
Changes made since 1999 introduced more flexibility and control for certain individuals in relation to their pension arrangements, including the option of investing pension funds in an Approved Retirement Fund (ARF). The Chapter considers the case being made for a general extension of the availability of these flexible options including the arguments for and against such an extension.
Finally, the Chapter discusses various options for change to the existing tax incentive regime and for some forms of mandatory pension schemes for those without supplementary pensions which were previously raised by the Pensions Board. The advantages and disadvantages of these various options are considered, including estimates of the costs involved.
Questions for consideration
1. Can tax incentives be better targeted to encourage improved coverage in a cost-effective way?
2. Should the over-riding principle be coverage or equity and should incentives be offered at the marginal, standard or a hybrid rate?
3. Should pension arrangements (e.g. the ARF option) differentiate between individuals or be open to all on the same basis? Where is the proper balance to be struck between the competing calls for equitable treatment of all pensioners, appropriate protection for vulnerable pensioners and the costs involved?

CHAPTER 08
Possible aPProaChes To Pensions deVeloPmenT

1�0
GREEN PAPER ON Pensions
Introduction
8.1 This chapter sets out a number of approaches any of which could, in combination with elements selected from the options discussed previously in this document or others which might emerge over time, provide the framework within which pensions policy might be developed in Ireland. They are presented for illustrative purposes and to encourage the national pensions debate.
8.2 These approaches include issues raised in previously published reports. Decisions on the adoption and implementation of any particular approach would have to take full account of its likely impact on the economy and of the need to maintain budgetary stability in the light of the analysis presented in Chapter 3. The public finance and economic impacts of mandatory or soft-mandatory approaches merit particular consideration, as do the complexity of the design of such systems and their interaction with existing pension provision. Reports prepared by the Pensions Board have highlighted significant issues around the economic and financial sustainability of such systems.
8.3 In addition to the options discussed in previous chapters for improvement of pension coverage and adequacy, various other options have been suggested by interested parties and advisory bodies. These suggestions vary, but they generally involve some combination of an increase in first pillar provision, an increase in incentives, or the introduction of an additional layer of pension provision, for example in the context of a mandatory arrangement. They may also deal with changes in retirement age. While it would not be possible to deal with every variation suggested, it is useful to consider particular models drawing from the National Pensions Review and from the Report on Special Savings for Retirement.
8.4 In that context, the models for supplementary pension reforms dealt with below are based on either enhancing the existing system of voluntary provision or on introducing mandatory or soft mandatory options. As an alternative to reforms based on supplementary pensions, a rise in the social insurance pension combined
with an increase in the statutory retirement age is also considered (see paragraphs 8.15-8.23 below).
8.5 These four approaches (voluntary, mandatory, soft mandatory and enhanced Social Welfare) need to be compared to the current system across a range of criteria. The Pensions Board set out in the NPR, among other things, criteria to be considered when assessing whether a particular pension system (first and second pillar) would be suitable for Ireland. The main criteria that facilitate comparisons of the five approaches are coverage, adequacy, cost, competitiveness, continuity, modernisation, and redistribution. These criteria apply both to the level of pensions provided under the system and to the means of delivery. Of course, in making policy, Government must also take into account overall economic sustainability and the social impacts of policy changes in the context of the wider needs of the people of our country.
8.6 For illustrative purposes, the five broad
approaches are compared by reference to the NPR criteria in the following analysis. The criteria are as follows:
Coverage – whether or not the system is likely to improve the extent to which individuals have pension coverage.
Adequacy – whether or not the system would improve the replacement incomes provided.
Cost – Cost can be divided among any combination of employer, employee/individual and the taxpayer. The division of cost has impacts on other areas such as pay structures, employment, competitiveness and the overall allocation of tax revenue. A related issue is sustainability, i.e. the progress of cost over time and its affordability.
Competitiveness – how a system being considered is likely to impact on individual employer competitiveness or on output and employment in the economy as a whole.
Continuity – how similar the system being examined is to the current system and whether any changes can be easily integrated. Any change has the potential to cause changeover costs and make the resulting benefits more complex and so

1�1
GREEN PAPER ON Pensions
impact on cost and simplicity, and possibly create anomalies of coverage or adequacy.
Modernisation - the EU defines modernisation of a pension system as how well it facilitates labour mobility and flexibility.
Redistribution – this considers how closely benefits provided match contributions made. Usually, first pillar pensions are deliberately redistributive, whereas second pillar arrangements do not aim for redistribution.
A) The current system
8.7 Before moving on to consider new systems or combinations of systems for retirement provision, it is useful to provide some assessment of the status quo.
Coverage8.8 Coverage of the social insurance part of the
current system is high. While supplementary coverage has been rising, there are groups within the population and labour force that remain difficult to reach.
Adequacy8.9 The current system is providing a much
improved level of State pension. Coverage levels for supplementary pensions are quite high among the labour force. However, it is not clear that the current system provides adequate levels of either minimum or replacement incomes to current pensioners or that it would do so for future pensioners. The current Social Welfare pension offers a relatively low level of replacement income, for middle and higher earners at least, compared to systems in other countries – although contribution rates in Ireland are also low by international standards and countries with higher replacement rates very often have less well developed supplementary provision systems.
8.10 While, in addition to pension investments, the high level of income available to many Irish people in recent years can be expected to have given rise to a significant increase in savings and investment levels, which may offset, for some groups and to some extent, the need for traditional pension cover, there is nonetheless
a view that people in Ireland are “under-saving” relative to what might be required to meet their future expectations. Coverage of particular groups is low (e.g. for certain sectors, part-time workers, low income workers and women). While DB schemes may be providing adequate funds to meet future expectations for those who remain in such schemes, they form a reducing proportion of the total number of schemes. Contribution rates to PRSAs may not be adequate in light of the NPPI replacement income target and average contribution rates to DC occupational schemes are at or around the same level105.
Cost8.11 The analysis in Chapter 3 indicates that on
certain key assumptions, including that pensions and earnings track the growth in national productivity over time, public pension expenditure would rise from 5% of GDP (6% of GNP) at present to 13% of GDP by 2050 (15% of GNP), at a time when other age related costs would also be increasing. Of that increase, over two-thirds is attributable to the Social Welfare component, with the Public Service pension element accounting for the balance. This rise, the equivalent of €12 billion in 2007 present value terms, would lead to a deterioration of 6.1 percentage points of GDP in the 2007 General Government Balance.
Competitiveness8.12 Countervailing measures would be required
to address the projected funding gap. As an indicator of scale, if this was done through higher taxation rather than other policy adjustments, it is estimated that an adjustment of the scale required could lead to a fall in both output and employment of up to 6% over the medium term and would reduce Ireland’s attractiveness as an investment location.
Modernisation8.13 Female and part time workers have lower
than average supplementary coverage. People with breaks in their careers, particularly in respect of DB scheme employments, are likely to have lower benefits compared to those with continuous careers.
105 IAPF Benefits Survey 2002

1��
GREEN PAPER ON Pensions
Redistribution8.14 The ‘Value for Money’ (i.e. retirement benefits
compared to contributions paid over a lifetime) offered by the social insurance system to low earners is far higher than for high earners. While some redistribution happens within DB schemes (usually in favour of higher earners), supplementary pensions are otherwise based directly on contributions (less charges) and tax reliefs.
B) Delivering improved adequacy through enhanced Social Welfare benefits
8.15 There is a fundamental choice to be considered in addressing the question of pension adequacy between, on the one hand, concentrating largely on enhanced Social Welfare payments and, on the other, focusing mainly on measures to encourage greater personal savings through supplementary pensions. In recent years, there has been both substantial improvements in the level of Social Welfare pensions and significant Exchequer support for the second pillar. However, for illustrative purposes, the following paragraphs examine the impact of a phased increase in the level of Social Welfare pensions as compared with average industrial earnings106, combined with a gradual increase in the statutory retirement age – say, for example, one year for each decades’ birth cohort starting in 2016; this would mean that people born between 1991 and 2000 would have a retirement age of 70. No direct reforms to supplementary pensions are proposed in this scenario, although occupational schemes are likely to adapt to the increased State pension age.
Coverage8.16 Coverage of the social insurance system is
almost complete, apart from the legacy issues described in Chapter 5. In particular, the social insurance system offers full access to low income workers and also takes account of time spent out of the labour market for caring purposes. Enhancement of the current rate of Social Welfare provision would not be expected to have significant implications for first pillar
106 The National Pension Review considered the option of increasing the State pension to 50% of Average Industrial Earnings
coverage (unless it led to increased inward migration), although it is likely that a significant improvement in Social Welfare pension levels would result in a reduced commitment on the part of some individuals to voluntary second pillar provision.
Adequacy8.17 Depending on the level of improvement, an
enhanced social insurance pension could meet the replacement income needs of middle earners and provide minimum incomes to all in receipt of social insurance pensions that are well above the levels needed to avoid poverty. Invalidity/illness and unemployment claims would increase as the retirement age is extended, since people aged 65-69 would be eligible for those benefits. Poverty monitoring for this age group could still be required depending on the level of Social Welfare payments to recipients of working age. The approach would also have implications for the level and qualifying age for non-contributory pensions. The statutory age for non-contributory pensions should ideally track the contributory pension age to prevent early retirement via this route.
Additional Cost8.18 The cost of increasing the social insurance
pension is high, although this would be reduced to some extent by the suggested increase in retirement age as levels of dependency peak. While the cost of Social Welfare pensions increases in line with the rise in the old age population, the increase in the retirement age would be designed to mirror the change in life expectancy and counterbalance the costs of ageing107. As all Social Welfare scheme recipients tend to receive rate rises at roughly the same level, there may be additional non-pension Social Welfare costs arising from this proposal.
8.19 There are good reasons, however, why pensioners should be treated differently from working age Social Welfare recipients, including pensioners’ lack of opportunities for supplementing their
107 The deficit in the Social Insurance Fund at current benefit and contribution levels is projected at 6.4% of GNP by 2061 (5.3% with an increase in retirement age); for a 50% pension, the deficit is projected at 10.0% (8.3% with an increase in the retirement age). Source: Mercer (2007)

1��
GREEN PAPER ON Pensions
incomes and the ‘poverty traps’ that exist for working age welfare recipients. Moreover, the fact that future pensioners are partially paying for their higher benefits through the increased retirement age may strengthen the argument for higher pensions compared to other Social Welfare incomes. Depending on the level of the Social Welfare payment, some individuals might have more than 50% of their income replaced by the State pension, which would be greater than the NPPI/NPR replacement income target.
Continuity8.20 While there are some issues regarding
integration of benefits for DB scheme members, the proposal would otherwise complement the existing pension system. It is likely that supplementary coverage would fall somewhat as people anticipate the higher level of Social Welfare pension when planning their retirement income needs. In the modelling for the NPR, which was based on a benefit level of €300 per week in 2007 terms, it was assumed that contributions to supplementary pensions would fall for those earning less than approximately 2½ times the current State pension.
Modernisation8.21 Social insurance fully supports labour mobility
between employers and all types of employment, since practically everyone currently entering the labour market is insurable for pension benefits. The main advantage of social insurance pensions from a modernisation perspective is that periods of time spent outside the labour market on caring duties are taken into account at pension age. This is of particular importance for women’s entitlements.
Redistribution8.22 The current system of social insurance is
progressively redistributive. Higher pensions increase the level of redistribution within the system, assuming that the current structure of contributions still applies. However, the increase in the retirement age may prove to be regressive to the extent that people in lower paid employments may have lower than average life expectancy.
Competitiveness8.23 To the extent that any increases in the Social
Welfare pension beyond current levels are not
offset by an increased retirement age, this would exacerbate the macroeconomic cost, sustainability and competitiveness position outlined in respect of the status quo position at paragraphs 8.7-8.14 above.
C) Enhancement in respect of voluntary pension provision
8.24 The proposals for enhancements to the voluntary pension system set out in the National Pensions Review were:
l The State incentive for PRSA personal contributions should be granted by means of a matching contribution of €1 for each €1 invested rather than through tax relief, subject to a maximum amount;
l Tax relief for other forms of supplementary pension provision should be allowed at the higher rate for all personal contributions. This should apply through the current method of granting relief at source or through a method of refundable tax credit, where appropriate;
l The point of sale regulation of Standard PRSAs should be reduced by eliminating the requirement to prepare a fact-finding questionnaire in such cases;
l As a contribution towards the cost of providing incentives to the lower paid at the same rate as top rate taxpayers, a cap should be imposed on incomes for pension contribution and benefit purposes, but only if the derived savings are used to improve incentives for the lower rate and non-taxpayers.
8.25 As referred to in paragraph 7.69, another option is to consider moving towards a system of tapered matching contributions to private pensions. This could have the potential of increasing pension awareness, as consumers may more readily understand the value of matching contributions. It could also achieve greater redistribution of resources.
Coverage8.26 In any purely voluntary system, an increase in
coverage would depend on the success of the new incentives, since the system would still be organised on a voluntary basis. As the proposed

1��
GREEN PAPER ON Pensions
incentives would be targeted at middle and lower earners, an increase in coverage would be expected given lower coverage levels at these income levels.
Adequacy8.27 The NPR incentives would be designed mainly
to improve pension coverage. Adequacy would be determined largely by the contribution rates of scheme members and PRSA holders. External factors such as investment returns, annuity rates and life expectancy also affect pension adequacy, but the contribution rate would be, to some extent, within the control of the scheme member. If the reformed tax incentives encourage scheme members to increase their contribution rates, then pension adequacy would improve. The evidence on contribution rates for existing PRSA holders suggests that many may not be making adequate pension contributions (by reference to the NPPI replacement income target).
Additional Cost8.28 The cost of the various incentives is determined
by their success in improving pension coverage and adequacy in the labour force. Two aspects to the additional cost need to be distinguished. Firstly, there may be a ‘deadweight cost’ of enhancing incentives for those who already have pension coverage. This would be an inefficient use of resources for individuals and Government. Where costs are incurred for new members to pension schemes, and in respect of existing members who are ’under-pensioned’, the additional cost is well targeted, but efficiency depends on the extent to which those individuals would have been adequately provided for in retirement via other savings or investments.
8.29 It should be noted that, in this scenario, the direct cost of the additional incentives falls on Government and therefore on taxpayers, rather than on employees taking up the incentive (who gain in the long run) or on employers108.
108 Employers are also encouraged to contribute to PRSAs, though the main requirement is that access to a PRSA is provided and subsequent employer contributions are voluntary.
Competitiveness8.30 As the direct cost burden, in this scenario,
falls on Government, the effect on economic competitiveness would be indirect: additional Government incentives have to be financed and this means either that service provision is reduced or tax revenues must increase, with impacts on competitiveness.
Continuity8.31 As all the enhancements to pensions are
proposed within the existing PRSA model, the proposals would be straightforward to implement within the existing pensions framework. However, a considerable number of issues would need to be worked through regarding the interaction of these proposals with existing tax rules. Other implementation issues to be considered include whether the collection of contributions could be improved and whether the matching contribution could be further targeted at lower and middle earners.
Modernisation8.32 Most of the incentives are based on the
PRSA model, which facilitates the mobility of individuals between employers, self-employment and periods out of the labour force. UK research109 has highlighted the importance of the ability to move personal accounts between employers, as it increases a sense of ownership, encourages membership among people who frequently change jobs and overcomes the difficulty in tracking pension rights from different jobs. The lower income incentives are particularly valuable for part time workers and workers in sectors with low occupational coverage (sectors where women are traditionally overrepresented). Refundable tax credits would encourage pension coverage for low income workers but would present administrative challenges and costs.
Redistribution8.33 Redistribution is not foreseen in any of the three
proposed supplementary systems, though the availability of tax incentives for all could be considered more equitable than the current system of tax relief.
109 Hall S, Pettigrew N and Harvey P, ‘Public attitudes to personal accounts; Report of a qualitative study’, 2006 for the Department for Work and Pensions.

125
Green PaPer on Pensions
D) Soft mandatory pensions
8.34 The so-called “soft mandatory” approach to pensions involves mandatory introduction of and access to a pension arrangement, but individuals could opt-out of the scheme after a period (this is the ‘soft’ aspect). The version of the soft mandatory arrangement presented in ‘Special Savings for retirement’ has the following characteristics (as outlined previously in Chapter 7):
(a) eligibility all those beginning employment on or after the date of introduction of the scheme who do not become members of occupational schemes immediately on beginning employment. There would be no obligation for those who are self-employed to join, but those who wished could. Those in employment at the date of introduction of the scheme would also have the option of joining.
(b) employee contribution
5% of income
(c) employer contribution
2% of income
(d) exchequer contribution
2% of income, to a maximum contribution of €750 p.a.
(e) opt-out Contributors could cease contributions after three months’ contributions had been made. no immediate refund of contributions would be allowed in the first year. Where a refund is given, employer and exchequer contributions are returned.all employees who would be eligible to join on beginning employment would be allowed to recommence contributions at any time on one month’s notice.
(f) access to funds
Contributors would be allowed to access 25% of their funds tax-free on one occasion before or at retirement.
Coverage8.35 If inertia is the main reason underlying pension
non-coverage at present, coverage rates should rise if people are automatically enrolled into a
new scheme. The extent of a rise in coverage could be determined by the scheme’s design. However the disincentive effects of higher contribution rates also need to be considered. The following factors could be seen as incentives for a soft mandatory scheme: (i) the length of time before de-enrolment is possible; (ii) whether employers contribute or not; (iii) the volume of the tax support and how it is delivered; (iv) ease of transferability on changing jobs and (v) whether access to funds is possible.
8.36 Difficulties with such schemes include whether workers (particularly young people) have enough information to make decisions in their long term interest, and whether people would take contribution holidays for home purchasing or other reasons. This is more likely to happen early in a person’s career, whereas early contributions have the greatest impact on final pension fund values.
Adequacy8.37 Pension adequacy would be determined by the
contribution rate to the scheme. The contribution rate should ideally be set at a level which allows the individual to have an adequate pension on retirement110. This of course would require higher contributions than part-provision. There is also a danger that even if the contribution rates mandated are insufficient to allow for adequate replacement income on retirement, they may nonetheless become a de facto benchmark for pension contributions. The proposed UK soft mandatory system is designed to deliver 45% replacement rates for lifetime median earners who start saving at around age 30.
Additional Cost8.38 The cost of the scheme would depend on its
design and on take-up. assuming that the scheme was made available in respect of individuals who are not currently enrolled in an occupational scheme, there could be very significant exchequer costs, which would build up as enrolment increased. an illustration of the potential costs is contained in paragraph 7.86. There would be large up front Government support costs as people are enrolled, but these costs could fall as people opt out of the scheme.
110 The nPPI report set a replacement income target of 50% of gross pre-retirement income

1��
GREEN PAPER ON Pensions
Competitiveness8.39 If there are mandatory employer contributions
to the scheme, economic and financial sustainability issues could arise, though not to the same extent as for a fully mandatory system. These could still be very significant. It might be useful in this regard to quote from analysis of the economic impact of mandatory pension provision provided in the context of the Report on Special Savings for Retirement: “...mandatory pension contributions can negatively impact on the labour market with repercussions in terms of national competitiveness and overall economic growth”, albeit that one objective of a mandatory system, with appropriate design and delivery, would be to increase the overall level of savings.
Continuity8.40 Continuity with the existing system would
depend on whether contribution collection and investment of funds collected through the soft mandatory scheme is centralised or not. If contributions were to be collected and invested by the State, this would represent a substantial move away from the existing model. There would be significant transition and ongoing costs in establishing State collection, monitoring and investment mechanisms. However, if the system is organised through private investment/insurance companies, PRSAs could be accommodated. There would be significant compliance and enforcement costs regardless of how the system is organised. Integration with existing provision is likely to be fairly straightforward, since most current scheme members could be expected to be better off in their current arrangements, but the interaction of current incentive arrangements with these new arrangements would have to be carefully considered to avoid unintended consequences – for example a move by employers or employees out of (potentially better from the employee point of view) existing systems and into the new arrangement.
Modernisation8.41 If the soft mandatory scheme is organised as
a single entity, transferability is unlikely to be an issue (except, perhaps, where cross-border movement is concerned). There may be issues to be addressed if the scheme is organised based on employer relationships, though for
DC arrangements transfers between employer schemes are relatively uncomplicated.
Redistribution8.42 Redistribution is not foreseen in any of the three
proposed supplementary systems.
E) Mandatory pensions
8.43 The mandatory proposal option outlined in ‘Special Savings for Retirement’ has social insurance and mandatory savings elements. An increase in the Social Welfare pension was included in order to benefit existing pensioners and people outside the labour market or on low incomes. The supplementary part of the scheme design has the following characteristics:
Eligibility All employees and self employed
Eligible income
All earned income between 125% and 500% of the increased State pension (between approximately €15,000 and €60,000 as at June 2006).
Benefit type Defined contribution
Contribution rate
15% of eligible income
Exchequer contribution
5% (included in the 15% above). This would be in lieu of any employer and employee PRSI relief and of any employee tax relief on contributions.
Pre-retirement access
None
Coverage8.44 Notwithstanding progress made in recent years
on pension coverage, the Pensions Board noted that only a mandatory system is guaranteed to achieve the sort of coverage and adequacy benchmarks recommended by NPPI/NPR. People could only opt out if they were members of an existing certified scheme or prove that they had substantial resources otherwise. Pension coverage is expected to rise by around 28 percentage points in a fully mandatory system, based on a minimum qualifying income of €15,000. The final coverage rate would be 80% of those at work (i.e., 20% of the working population have income below the qualifying

1��
GREEN PAPER ON Pensions
income - around two-thirds of them are women). This compares to the NPPI target of 70% coverage of workers aged between 30 and 65 from 2013 onwards: the level already achieved is about 62% of this age cohort.
Adequacy8.45 The incomes provided by the proposed system
would be higher for those within the income band than as recommended in the NPR/NPPI. A social insurance pension level of 34% of AIE was recommended in previous reports. The replacement income target (Social Welfare and supplementary pension combined) set by NPPI is 50% of gross pre-retirement income.
Additional Costs8.46 There are costs for employers, employees and
Government in respect of (i) the higher Social Welfare pension and (ii) mandatory pension contributions to the proposed supplementary scheme. These substantial additional costs would require adjustments in expenditure and/or tax policies, with knock-on impacts on competitiveness.
8.47 Unless employer and employee social insurance contributions are increased, the higher Social Welfare pension would have to be funded by Government. This part of the mandatory scheme cost would increase in line with the rise in the old age population111. The cost of the supplementary scheme could be broken down between employers, employees and Government. There should be no deadweight cost provided that members of existing pension schemes are excluded from coverage, though it is difficult to see how this could be maintained over time. The cost of the supplementary scheme would rise in line with membership and earnings.
Competitiveness8.48 Any compulsory addition to employer costs would
impact on the viability of small companies and on international competitiveness to varying degrees. Any increase in the Social Welfare pension would need to be partially funded by employers and general taxation, which has competitiveness implications. This portion of the cost rises in line
111 Mercer – Social Insurance Fund deficit rises from 6.4% of GNP to 7.7% of GNP based on a 40% of GAIE pension in 2061
with the old age population, so it becomes more significant over time. Mandatory pensions savings could also be viewed as a tax on labour and could have a negative effect on labour demand and supply. Any gains arising from the improved pension position of individuals in employment would have to be offset against these negative implications.
Continuity8.49 If contributions were to be collected and invested
by the State, this would represent a substantial move away from the existing model. There would be significant transition and ongoing costs in setting up State collection, monitoring and investment mechanisms. However, if the system was organised through private investment/insurance companies, PRSAs could fit into the framework, although the readiness of the private system for the challenge would have to be carefully considered. Integration with existing pension coverage is likely to be the most complex part of the mandatory scheme design. Mandatory pensions could also be unpopular with people obliged to contribute. It would therefore be necessary to check that those eligible (and possibly their employers, depending on the scheme implemented) are making the correct contributions and that these are being passed on in good time to the appropriate place: the size and cost of this regulatory challenge could be very significant. All mandatory models would require some authority to oversee the collection and allocation of contributions and the administration and communication of entitlements.
Modernisation8.50 If the mandatory scheme is organised as a
single entity, transferability is unlikely to be an issue. There may be issues to be addressed if the scheme is organised based on employer relationships, though for DC schemes, transfers are relatively uncomplicated. The proposed lower earnings limit for contributions would exclude predominantly women and part time workers from coverage.
Redistribution8.51 Redistribution is not foreseen in any of the three
proposed supplementary systems.

1��
GREEN PAPER ON Pensions
Trade offs in the supplementary pension debate
8.52 The proposals presented by the Pensions Board in the NPR and in ‘Special Savings for Retirement’ were based on a detailed analysis of the relative merits of different approaches. Some of the key issues considered were the effectiveness of the current system, the advantages and limitations of improving voluntary provision and whether and how to move to a mandatory system. Some issues need to be balanced against others in such an analysis, e.g. while mandatory pensions improve coverage, any mandatory addition to employer costs could damage competitiveness. Some of the issues that need to be considered in evaluating different approaches to supplementary provision include:
Voluntary Mandatory
Competitiveness Coverage
Freedom of choice Compulsory saving
Personal responsibility
Government has to deal with consequences
Good coverage for many
Some coverage for all who need it
Builds on existing base
Current system has yet to meet NPPI targets
Private sector expertise and capacity
May involve lower costs, depending on how collection and investment is organised
8.53 A different set of issues need to be borne in
mind when considering if increased pensions should be provided through social insurance or through supplementary provision. Social insurance provides a high level of social protection, especially to low income workers and in respect of care periods. This level of social protection is very expensive, and it is not clear under current funding arrangements who would have to pay the additional costs. On the other hand, the administration charges for social insurance are low and do not increase with increased levels of benefit. Supplementary provision is funded, with contributions from
employees, employers and the State (through tax incentives) for most occupational schemes. However, workers in many sectors have quite low coverage, and people outside the labour market have no coverage. A summary of some key issues to be considered is set out below.
Trade offs in the supplementary112 vs. social insurance pension debate
Supplementary Social insurance
Labour market coverage for all who need it
Coverage for all at work, including low income workers and care periods
Benefits mostly linked to contributions
Progressive
Fully funded PAYG, apart from NPRF
Poverty, coverage and adequacy monitoring needed
SW deals with adequacy up to middle income levels
Clear roles for employees, employers and the State
Unclear who will pay the costs of ageing
Costs depend on degree of private sector involvement and compulsion
Low costs to pensioners and employees; costs not affected by reforms
Strategic considerations
8.54 The approaches to pensions development set out in this chapter are not meant to be prescriptive, and aspects of any or all could be combined. A decision to adopt any particular approach would need to recognise that it would take effect over a long period and that an early and complete commitment to any one approach would restrict the options in relation to other proposals later on. It would be useful, perhaps, to allow time for more evidence on performance
112 On the basis that the NPPI targets for the combined supplementary and Social Welfare system are met.
1��
GREEN PAPER ON Pensions
of soft mandatory schemes elsewhere to emerge, particularly from New Zealand113.
8.55 The most cautious policy response to improving supplementary coverage would be a progressive process across the approaches presented here, by first implementing voluntary incentives, then soft mandatory pensions with hard mandatory being the final option if all else fails. When moving between pension systems, it is important to ensure that members of existing pensions who are better off under their current arrangements are able to retain their existing arrangements.
8.56 Moving from voluntary to soft mandatory pensions, this integration process would be relatively straightforward, since existing scheme members are likely to be better off in their current arrangements. However, new entrants to the soft mandatory scheme may decide not to progress to better supplementary arrangements since they may consider that they are ‘covered’ for pensions.
8.57 In moving from voluntary or soft mandatory pensions to mandatory pensions, the integration tests may be more difficult to apply. Contributions and/or benefits may be marginally better or worse in the new scheme, and this is especially likely for people currently in DC schemes or in PRSAs, given current contribution levels. This may result in large numbers of existing DC/PRSA members being transferred to the mandatory scheme. It may also result in companies closing their occupational schemes or PRSA contributors terminating their accounts due to administrative complexity. This was a particular concern in the development of the UK White Paper, and a simple self-certification procedure was proposed to protect existing coverage.
8.58 Adopting voluntary enhancements and
subsequently moving to mandatory pensions would increase the number of people at the margins of the benefits or contributions test required for integration. It may also result in large numbers of DC members and PRSA holders having ‘small pots’ that are difficult to integrate into the new system. Even if funds
113 The New Zealand ‘Kiwisaver’ soft mandatory scheme was introduced on 1 July 2007.
can easily be transferred into the new pension, it is possible that this may not be in the long term interest of scheme members. Flexibility in relation to contribution levels or benefits (e.g. ARFs are available for PRSA holders – it is less likely that mandatory pensions would have this option) may be a desirable feature for some employees, and the marginal system of tax relief may provide better rewards for earnings progression than the new system. It may be possible that compulsory saving would force some well informed scheme members into situations that they would not have chosen for themselves.
8.59 The effect of layers of pension reforms on pensioners’ incomes also needs to be borne in mind. This is particularly evident in the UK system, where an average pensioner can be drawing income from three or more different sources. Moreover, it is clear from the discussion in the previous three paragraphs that pension reform would, at the very least, have to be designed with great care to ensure as smooth an interaction as possible between different generations of provision arrangements and to avoid unintended consequences arising from such interaction. Appropriate consultation arrangements and examination of experience in other systems could help offset these risks.

1�0
GREEN PAPER ON Pensions
Possible Approaches to Pensions Development
The chapter looks at possible approaches, any of which could, in combination with elements selected from the options discussed previously or others which might emerge over time, provide the framework within which pensions policy might be developed in Ireland. They are presented for illustrative purposes and to encourage the national pensions debate.
In that context, the models for supplementary pension reforms discussed are based on either enhancing the existing system of voluntary provision or on introducing mandatory or soft mandatory approaches. As an alternative to reforms based on supplementary pensions, a rise in the social insurance pension combined with an increase in the statutory retirement age is also considered.
These four approaches (voluntary, mandatory, soft mandatory and enhanced Social Welfare) need to be compared to the current system across a range of criteria. The main criteria that facilitate comparisons of the five approaches are coverage, adequacy, cost, competitiveness, modernisation and redistribution. These criteria apply both to the level of pensions provided under the system and to the means of delivery.
Decisions on the adoption and implementation of any particular approach would have to take full account of its likely impact on the economy and of the need to maintain budgetary stability in the light of the analysis presented in Chapter 3. A decision to adopt any particular approach would need to recognise that it would take effect over a long period and that an early and complete commitment to any one approach could restrict the options in relation to other proposals later on.
Questions for Consideration
1. In light of the discussion in this Chapter, and giving consideration to the sustainability concerns raised in Chapter 3, is the current system of retirement provision, based on a combination of State provision through the social insurance system, and voluntary provision through occupational and other supplementary pension arrangements, appropriate? If the current system requires to be enhanced, should higher pensions be provided through social insurance or through supplementary provision or both?
2. If an enhanced supplementary pension approach to coverage and adequacy is preferred, should it be addressed through changes in the current voluntary system, or by way of soft mandatory or mandatory provision?
3. Can either a “soft” or “hybrid” mandatory pension scheme be designed to ensure that it would not operate to the detriment of the existing voluntary pension arrangements, for example by encouraging movement out of existing systems (which may be potentially
better from the member’s point of view) into any new mandatory arrangement?
4. How can the extra costs of enhanced provision be financed? Are improvements in pension coverage and adequacy through enhancement of the social insurance system and/or the introduction of a system of soft mandatory or mandatory pensions provision outweighed by the likely costs and economic impacts?
5. Is the introduction of either a “soft” or “hybrid” mandatory scheme a desirable option given the economic, financial and competitiveness implications of such systems?

CHAPTER 09
issues regarding defined benefiT and
defined ConTribuTion Pension sChemes

1��
GREEN PAPER ON Pensions
Introduction 9.1 Almost all pension schemes in Ireland
are either defined benefit (DB) or defined contribution (DC). This Chapter defines these schemes and the newer ‘hybrid’ schemes. A number of issues in relation to DB and DC schemes are also considered.
9.2 This chapter discusses the following issues in particular:
l Defined Benefit Schemes in Pension Provision;
l Integration/Pensionable Salary;
l Adequacy of Defined Contribution; and
l Guarantees and Security.
Definitions of Pension Schemes
Defined Benefit9.3 A defined benefit (DB) scheme fixes the
benefit in advance – usually as a proportion of the member’s earnings when they retire. For instance, a DB scheme might provide a retirement pension of 1% of earnings for each year an employee was in that scheme. If an employee retired after 40 years, that employee would receive a pension of 40% of their pre-retirement earnings.
9.4 In a DB scheme, it is not possible to know in advance how much the scheme is going to cost. The benefits are fixed and the contributions must be adjusted from time to time to make sure that the correct amount is being accumulated to provide for them. It is usual in a DB scheme for the member’s contribution rate to be fixed and for the employer rate to increase or reduce as needed, though in some DB schemes both employer and employee contribution rates change from time to time.
Main Features of a DB Scheme9.5 The following are the main features of a DB
pension scheme:
l Contribution rates vary, depending on the outcomes of the regular actuarial reviews;
l Members can predict the benefits they will receive as a proportion of their earnings just before retirement;
l The higher the investment return achieved by the scheme, the lower the contribution rate will be. On the other hand, if investment returns are poor, contribution rates have to be increased to provide for the agreed benefits;
l The cost of buying a pension at retirement affects the contribution rate; and
l Schemes are best suited to those who stay until retirement, particularly those who experience above average salary growth. Those who leave before retirement can receive much lower benefits.
Defined Contribution Schemes9.6 A defined contribution (DC) scheme has a set
contribution for both the employee and the employer. For example in many DC schemes, the employer and the employee will each contribute 5% of the employee’s earnings, or 10% in total.
9.7 These contributions are invested on behalf of each scheme member. The retirement benefits for each member depend on how much money has been built up by retirement and so it is not possible to know in advance what pension benefits a member will receive.
Main features of a DC scheme9.8 The following are the main features of a DC
pension scheme:
l Contribution rates are fixed in advance – employers know what they have committed to;
l Members will not normally know until very close to retirement what their benefits will be;
l The higher the investment return achieved by the scheme before retirement, the better the pension benefits will be. On the other hand, if investment returns are poor, especially in the years just before retirement, retirement benefits will be lower than expected;
l In a DC scheme, the member builds up a fund by retirement age which is used to buy a retirement pension. The cost of the pension is unknown in advance, and it is to the member’s advantage if the cost is low, but detrimental if pension cost at retirement is high;
l If a member’s earnings increase rapidly throughout their working life, and especially

1��
GREEN PAPER ON Pensions
towards the end, their DC benefits may be low relative to their earnings just before retirement; and
l Contributions are usually allocated uniformly across all members as a percentage of pensionable earnings – there is no discrimination between those who stay until retirement and those who leave early.
Definition of a Hybrid Pension Scheme9.9 A hybrid pension scheme is one which is neither
a full DB nor a full DC scheme, but has some of the characteristics of each. There are many possible types of hybrid schemes.
9.10 In a DC scheme, the member generally bears the full risk (of paying higher costs or receiving reduced benefits) if investment is not as good as expected. In a DB scheme, the employer usually takes that risk and pays higher contributions in order to maintain the agreed level of benefits. In hybrid schemes, the risk is shared between the employer and employees.
9.11 Under the Towards 2016 social partnership agreement, the Pensions Board was asked to research benefit design options in the occupational pensions area. The Board has produced a ‘Guide to Hybrid Pension Schemes’ which deals with hybrid schemes in a comprehensive manner. The reader should refer to this guide for more details.
Issues for Defined Benefit and Defined Contribution Pension Schemes
Issues for Defined Benefit Schemes9.12 There are a number of issues which arise which
are particularly related to the nature of DB schemes.
These issues include:
l The impact of the funding standard on DB (See Chapter 10 for full details on the funding standard);
l The decline of DB schemes. While the number of DB schemes is remaining constant, the majority of new schemes are DC;
l The integration of DB pensions with Social Welfare pensions.
Issues for Defined Contribution Schemes9.13 As defined contribution pension schemes are
still relatively immature (i.e. have experienced relatively few retirements), a number of issues may arise in due course. However, the main current issue which relates to DC schemes is the adequacy of the pension benefit payable on retirement. The National Pensions Review, published in 2006, and more recent studies have shown that the majority of public and private DB schemes will provide benefits that are adequate (in terms of the NPPI targets) for those with long service. However, because of inadequate contribution levels, the majority of DC scheme members are unlikely to have a retirement income equal to or greater than the NPPI target.
Issues common to both Defined Benefit and Defined Contribution9.14 While there are issues that are exclusive to DB
and DC, there are also a number of issues that are common to both. These include:
l The demand for guarantees; and
l Security for pension scheme members.
These issues will be addressed later in this chapter.

1��
GREEN PAPER ON Pensions
9.15 In 2006, the total workforce was just over 2.1 million. According to figures provided by the Pensions Board, the breakdown of occupational pension coverage between public service Defined Benefit, private sector Defined Benefit and Defined Contribution was approximately 33% each and accounted for a total of some 778,400 members.114
DB’s declining percentage of coverage9.16 Defined benefit (DB) schemes are an important
part of Irish pension provision, with 68% of members belonging to such schemes (including the public sector). Members of DB schemes outnumber members of defined contribution (DC) schemes by a ratio of approximately 2:1. However, this ratio is down from 4.5:1 in 1996.
9.17 Defined benefit scheme membership is split evenly between (non-commercial) public sector and private sector workers, with approximately 250,000 DB members in each sector. However, it should be noted that the issues arising for private sector and public sector DB members are very different. Public sector schemes are considered in detail in Chapter 13, while this chapter concentrates, for the most part, on issues relevant to the private sector.
114 Includes public sector schemes
9.18 While membership of defined benefit schemes continues to increase slowly, it forms a declining percentage of total coverage. The increase is almost entirely due to increases in membership of existing schemes: the only new defined benefit schemes appear to be as a result of restructuring existing schemes, or occasional single member arrangements. Despite the increase in membership, there are concerns about the future of defined benefit provision in the private sector in Ireland.
9.19 Similarly, the number of DB schemes in the OECD area is decreasing, while there has been a corresponding increase in DC115. This is part of an overall trend for sponsors of DB schemes to reduce risk through reducing the level, or changing the nature, of benefits offered to employees. There is also evidence of benefit reductions, or increases in member contributions for existing members of DB schemes, indicating a willingness on the part of some sponsors to continue to provide such pensions if members contribute more to the cost.
9.20 It should also be noted that DC schemes can provide certain advantages. These include that the benefits may be more easily transferred
115 OECD, “Pensions Market in Focus”, Issue 3, October 2006
Defined Benefit Schemes in Pension Provision
Table 9.1: DB/DC Breakdown of Irish Occupational Pension Schemes
Defined Benefit Schemes115 Defined Contribution Schemes Ratio of DB:DC
No. of Schemes No. of Members No. of Schemes No. of Members
31 Dec 1996 2,290 412,641 48,261 88,759 4.5:1
31 Dec 1997 2,315 418,918 53,135 100,551 4:1
31 Dec 1998 2,069 413,618 61,896 120,580 3.5:1
31 Dec 1999 2,060 424,795 70,478 144,425 3:1
31 Dec 2000 2,027 449,111 84,321 180,690 2.5:1
31 Dec 2001 1,956 455,627 95,975 214,871 2:1
31 Dec 2002 1,901 471,841 105,863 237,491 2:1
31 Dec 2003 1,693 483,031 110,972^ 241,302 2:1
31 Dec 2004 1,583 500,633 86,486^ 225,772 2:1
31 Dec 2005 1,478 499,885 82,841 234,814 2:1
31 Dec 2006 1,411 542,362 92,075 255,008 2:1
^ The reduction in DC membership in 2004 was as a result of a review of the Pensions Board register and the deletion of some schemes.

1��
GREEN PAPER ON Pensions
between employers, individuals may benefit from high investment returns, and may have greater control over investment options. DC also offers better value for early leavers in comparison to early leavers under DB. Finally, the benefits under DC are more transparent, which may foster greater understanding of and interest in pensions for the individual.
International Drivers9.21 The reasons that have been given for the decline
of defined benefit schemes as a proportion of voluntary pension provision are diverse, depending on the perspective of the various stakeholders involved, but include:
l Risk aversion by employers: Volatile financial markets, the cost of funding retirement benefits and an increased awareness by employers of risk distribution as a result of developments such as international accounting standards may have resulted in lower contributions to pension funding and less appetite for long-term pension liabilities.
l Regulation: Strict legal, funding and solvency laws and regulation of the type of assets in a pension plan; variations in tax laws, and family law changes in the context of marital breakdown mean that the management of DB pensions has become increasingly complex.
l New economy: Workers tend to be more mobile, less likely to stay with one employer throughout their careers, and more likely to have flexible working arrangements. Defined contribution schemes are more attractive for those who stay for a short time, have flexible working patterns or who want more control over asset allocations.
l Rational Worker: Internationally, a combination of weak wage growth and prosperous capital markets can lead to a preference for DC over DB by workers. Differences in union participation rates and in investment climates can be key influences in this regard.
Implications9.22 While there are some benefits derived from
moving to a DC environment, there are increasing concerns that the proportionate change from DB to DC provision is leading to:
l Retirement benefits that are too low, given that contribution rates for DC schemes tend to be lower than for DB (the latest IAPF Benefits survey found that the average contribution rate for DC schemes was 11% compared to 16% for DB schemes);
l A change in the allocation of risks from employers to employees, e.g. investment, longevity risks.
9.23 Options to address risks and improve outcomes in a DC world include:
l Educating individuals to ensure that they are aware of their responsibility to plan for their retirement, e.g. National Pensions Awareness Campaign;
l Trustees providing individuals with adequate and up-to-date information about investment decisions;
l Increasing contributions.
9.24 There are limits to what education can achieve if a part of the population is resistant to the idea of planning for retirement. This has resulted in the consideration of alternatives to voluntary provision internationally. This issue was considered in Chapter 8.
9.25 The funding of DB schemes, including the impact of the funding standard and FRS17, are dealt with in detail in the next chapter. The next section deals with an issue primarily of concern to DB schemes, i.e., integration.
Integration/Pensionable Salary
Introduction9.26 An integrated scheme is a scheme, usually
defined benefit, where the contribution and benefits are calculated net of the State retirement benefit. A frequent criticism of these schemes is that if State retirement benefits increase rapidly in the years before retirement, the benefits paid by the scheme, particularly for the lower paid, can be lower than expected.
Background and definition9.27 The majority of private sector defined benefit
occupational pension schemes in Ireland are integrated with benefits payable under the Social Welfare system. A typical benefit from

1��
GREEN PAPER ON Pensions
such a scheme would be: (Number of years’ service) multiplied by (Final earnings less 150% of State benefit) divided by 60.
9.28 Suppose a retiring member had 40 years’ service, and final earnings of €30,000 and the State benefit is €10,884, the benefit would be:
l 40 times (€30,000 less 150% of €10,884 (i.e. 16,326)) divided by 60, which results in a pension of €9,116 p.a. from the scheme.
9.29 It should be noted that integrated schemes do not use the actual State benefit entitlement of each member, but use a standard allowance, usually the single person’s maximum benefit.
9.30 The rationale for integrated schemes is an intention to make retirement schemes as efficient as possible, i.e. to take account of total income after retirement, and to allow for the fact that almost all members are likely to qualify for a State pension to which the employee and the employer have contributed.
9.31 The effect of integration is that higher earners receive a proportionately higher overall pension than lower earners. Indeed, in the above example, anyone earning less than €16,326 p.a. will receive no pension at all (except for 120% of own contributions if the scheme was contributory). Correspondingly, as contributions will be calculated on the same basis as benefits, lower earners also pay proportionately smaller contributions.
Criticisms9.32 A considerable drawback of the integrated
scheme design is that where the State pension increases faster than an individual’s earnings in the years before retirement, the pension paid to that person from the scheme will be less than expected. If the individual is earning close to 150% of the State benefit, they could end up with a relatively small pension.
9.33 The problem described above is specific to the experience of recent years where the Social Welfare pension has increased faster than earnings. The result of these increases has been lower than expected payments from the scheme. This has resulted in reduced costs for sponsoring employers, though any savings have
in practice been more than offset by increased costs as a result of lower interest rates, investment losses and longevity increases.
Possible solutions9.34 Under current legislation, the value of pension
benefits from a defined benefit scheme must represent at least 120% of the value of member contributions. This provides some security for members against the effects of integration. However, in many cases this provision does not have any effect.
9.35 A number of solutions have been proposed:
l Some have called for integration to be prohibited or limited. The drawback would be that this solution would result in immediate considerable additional contribution costs for such schemes, and is likely to result in reduced member benefits or in some cases, scheme closure;
l Other proposed solutions would restrict the right of schemes to reduce the benefits in the three years before retirement, or forbid any reduction in pensionable salary as a result of the operation of integration.
9.36 The current situation has resulted in a windfall saving to sponsors of integrated schemes as the increased Social Welfare payments have reduced the benefits the schemes were expecting to pay.
Defined Contribution
Adequacy9.37 As discussed in paragraphs 4.47 to 4.52, the
issue which relates mainly to DC schemes is the adequacy of the pension benefit payable on retirement. Members of DC schemes may not know, until very near to retirement, what the level of benefit will be. This raises the question of how to ensure the member’s pension can provide an adequate living standard in retirement.
9.38 While many factors feed in to whether people in DC arrangements will attain the NPPI/NPR replacement income target on retirement, the contribution rate is the main option available to the individual employee to improve his or her retirement income. For occupational

1��
GREEN PAPER ON Pensions
scheme members, AVCs and PRSAs can be used to increase their likelihood of meeting the replacement income target.
9.39 The Society of Actuaries in Ireland translated the NPPI/NPR target into a set of required contribution rates at various income levels and ages for DC/PRSA contributors. These required rates reflect the position at May 2006. The rates shown are those required to provide for a combined total of personal and Social Welfare pension of 50% of pay. For those on pay at or below twice the rate of Social Welfare pension, no contribution is required as the Social Welfare pension alone will amount to at least 50% of pay.
Table 9.2: Society of Actuaries in Ireland recommended contribution rates as of May 2006 (for half-salary pension116)
Age you start saving
Annual salary 25 30 35 40 45
€20,000* 0% 0% 0% 0% 0%
€30,000 6% 7% 9% 11% 14%
€40,000 9% 11% 13% 17% 22%
€50,000 11% 13% 16% 20% 26%
€60,000 12% 14% 18% 22% 29%
Source: Society of Actuaries in Ireland, ‘How much do you need to save for a pension?’, May 2006
* The half-salary pension is being provided by the Social Welfare pension.
9.40 Statistical sources on contribution rates of DC scheme members and on AVC contributions by occupational scheme members are limited. While PRSA members account for a small, but growing, share of DC scheme members, it is possible to broadly estimate the numbers of PRSA holders who are currently undersaving for retirement based on the NPPI/NPR 50% replacement income target.
9.41 The Society of Actuaries in Ireland recommend that a 25 year-old on a salary of €30,000 should be contributing 6% of salary to fund a half salary pension. However, the data from Table 9.3 suggest that only 27.8% of those aged 23-27 earning between €25,000 and €34,999 are meeting the Society’s recommendations, which highlights the scope of the adequacy problem facing people. However, the table also shows that the proportion meeting the recommended contribution rate is higher in the lower age groups which may be a positive indicator for the future. It is important that these data are monitored over time as trends in PRSA long-term savings and policy lapses become more apparent.
9.42 Based on these figures, 79.5% of PRSA holders aged 23-47 earning over €25,000 are undersaving for retirement based on the NPPI/NPR replacement income target117.While further analysis by CSO shows that people in older age categories tend to have much higher contribution rates (people aged 55-69 have
116 Including the Social Welfare pension.117 Some of this group could be AVC contributors via PRSAs, and the PRSA savings would represent only part of their
occupational pension118 The collection of Personal Public Service (PPS) Numbers for PRSA contributors in the Pensions Board’s regulatory
framework allows for data matching against information on employment and earnings held by Revenue/DSFA. The data matching is carried out by CSO under the confidentiality provisions of the Statistics Act 1993. While there are some timing mismatches between the Pensions Board and Revenue/DSFA data, the results are based on the actual recorded information on contributions and earnings in both sources, which improves their accuracy. The analysis covers some 42,109 active PRSA contributors.
Table 9.3: PRSA 2005 - % meeting SAI recommendations
Percentage meeting SAI contribution rates by age in 2005
Income 2004 23-27 28-32 33-37 38-42 43-47 Total
€25,000-€34,999 27.8 29.5 22.3 19.1 17.4 25.2
€35,000-€44,999 17.3 17.6 16.2 14.3 10.6 16.0
€45,000-€54,999 19.5 14.9 15.8 16.8 9.8 15.3
€55,000-€64,999 12.0 16.4 12.7 11.8 8.4 12.8
Total (€25,000 +) 24.5 23.3 18.8 16.7 13.4 20.5
Source: Pensions Board PRSA register and Revenue/DSFA earnings data, matched by CSO118

1��
GREEN PAPER ON Pensions
an average contribution rate of 17.4%), the Society of Actuaries analysis shows the value of early contributions to pensions.
9.43 Table 9.4 illustrates the importance of
increasing pension coverage for all. With regard to gender differences, it should be noted that:
l Women tend to live longer than men, so women face higher annuity costs;
l Women generally earn less than men, as their careers are more likely to have different patterns, with women more likely to take career breaks or job-share or work part-time as they juggle caring responsibilities; and
l The structure of families has changed dramatically in recent years, with women not marrying at the same rate and marriage break-ups increasing.
9.44 Women are more vulnerable to poverty, especially in later years. Given their longer life expectancy, that can make for a longer, but poorer retirement.
Conclusion9.45 The main conclusion to be drawn from
the tables above is that contributions to PRSAs are not high enough across most categories of contributors in order to achieve a half-salary pension. However, as Table 9.3 shows, the pattern by age may provide some encouragement about the level of savings by younger contributors. The data in Table 9.4 also reinforce the case for women and young people
to take up the savings habit at an early interval to take away some of the financial pressures that may be faced later. As the proportion of people’s lives spent in retirement increases, the need for adequate provision is essential to ensure a good quality of life. The level of contribution into a DC scheme or PRSA is an essential factor in this regard.
Guarantees and Security
9.46 In relation to both DB and DC, the safety and security of pension funds is an issue. The next section deals with the issues of guarantees and security of pension funds.
Guarantees
Introduction9.47 People save to provide for the future. In
allocating assets towards a long-term target, the acceptable level of risk and return will vary, depending on the objective. For example, maintaining cash in a current account will be low risk but will have a low yield compared to investment in shares which has potentially higher rewards but also a higher risk of losing the value of the investment. This is true for all investment decisions, including when saving for retirement, although the risk in relation to retirement savings is often not fully appreciated by many individuals who may expect a secure
Table 9.4: Contribution rates and incomes/contributions for 42,109 active PRSA contributors in 2005 matched with DSFA 2004 incomes, by age group and gender
Sex All contributors
Contribution rates Income and contributors Contribution rates
Age on 31/12/2005
Male % contribution
Female % contribution
Incomea
Individual contribution a
%
15-19 4.7 4.9 280,607 13,730 4.9
20-24 5.4 4.3 78,990,526 3,958,949 5.0
25-34 7.5 6.6 565,295,224 40,611,764 7.2
35-44 10.6 9.7 431,390,655 44,887,797 10.4
45-54 16.0 13.0 278,435,969 43,106,710 15.5
55-69 17.7 14.8 129,689,814 22,565,541 17.4
70+ 28.8 30.2 1,466,309 423,622 28.9
All 11.2 8.4 1,485,549,104 155,568,113 10.5

1��
GREEN PAPER ON Pensions
investment and a high return on their life savings.
9.48 When considering guarantees, there is no such thing as a pure guarantee for a future pension promise. No matter how strong a pension promise is guaranteed, that guarantee is subject to a number of conditions. In essence, the promise can only be paid if there are sufficient funds to provide that level of promise. While there may be low-risk guarantees and high-risk guarantees, all guarantees are conditional to some degree.
Bearing the risks of pension provision9.49 If money is being invested in order to provide
for retirement, there can be no certainty about the eventual pension benefit as a percentage of income at retirement. The major unknowns are:
(a) The rate of investment return that will be received, including the return on contributions made in the future. This is especially true of the return that will be earned in real terms, i.e. net of inflation;
(b) For how long a retirement income must be provided;
(c) The level of earnings at or near retirement.
9.50 These unknowns or risks cannot be eliminated by the person, as there is no way of knowing in advance what the outcome will be. From the point of view of someone saving for his/her retirement, the risks can only be reduced if some third party bears these risks. The most common example of this in pension savings is a defined benefit pension scheme, where the above risks are in the normal course of events underwritten by the employer contributions.
9.51 If these risks are removed or reduced, people may be more willing to make retirement savings, though it is by no means certain. In the National Pensions Review, the view was expressed that, if supplementary pension schemes were made mandatory, it would be appropriate to provide investment guarantees of some type for participants. This would provide some form of protection to savers from potential investment losses they would be effectively forced to incur.
9.52 Without such a guarantee, it is unlikely that a mandatory scheme would be welcomed. It is also likely that the presence of a guarantee could be a driver for increasing pension coverage in the context of voluntary provision. There is also a view that, no matter what the system of pension provision, people are entitled to some form of guarantee. Against these views, it is worth stating that no-one, including the State, can give a long-term absolute guarantee. Furthermore, any type of guarantee has a significant cost attached to it. State guarantees would also transfer unknown and unquantified risks onto the Exchequer and future taxpayers.
9.53 The remainder of this section considers only guarantees of pre-retirement investment returns.
What types of guarantee?9.54 The following are among the types of
guarantees that could be provided:
(a) The accumulated fund at retirement will be no less than the total contributions, or than the total contributions accumulated at a specified rate of return;
(b) The accumulated fund at retirement (or income per annum thereafter) will have a minimum value in real (inflation adjusted) terms;
(c) The investment return in any particular year will be no less than a specified amount.
How much?9.55 Guarantees cost money, because in some
circumstances those with guarantees receive more than the value of assets that have been accumulated for them. The cost of this guarantee could be met in the following ways:
(a) By an annual charge expressed as a percentage of accumulated assets;
(b) By a charge which is only made in years of high investment returns;
(c) By the Exchequer from general taxation.

1�0
GREEN PAPER ON Pensions
9.56 The appropriate level of charge is determined not only by the value of the guarantee being provided, but by changing investment circumstances, especially expected future interest rates and expected market volatility. This means that the cost of providing a set guarantee may vary over time.
How?9.57 As referred to above, guarantees may be
provided either in the context of voluntary pensions, as an incentive for participation, or under a mandatory system, in order to make the obligatory participation more acceptable. In either case, the following points can be made:
l A guarantee can be underwritten by the Exchequer or directly by private sector providers;
l If the Exchequer underwrites the guarantee, it may choose to reinsure its obligations through the private sector. Alternatively, it may provide the guarantee on an unfunded basis, or accumulate any charges towards future claims;
l The existence of a guarantee may encourage those covered by it to make riskier investment choices. Were a guarantee provided, it would probably necessitate significant restrictions on investment choices. Were the Exchequer providing the investment guarantees, and as a result imposing significant investment restrictions, it might be simpler if the Exchequer undertook both the investment management and the provision of guarantees.
Considerations l The main argument in favour of providing
guarantees is that the lack of such guarantees is a deterrent to pension saving. However, there is no evidence to date that lack of such guarantees is indeed a deterrent. This may be because those who have no supplementary pensions savings may not be aware of the risks in investment and so may not have considered the issue;
l Some level of investment risk protection may be necessary to make a mandatory pension system acceptable;
l If guarantees are provided through the private sector, the question of capacity may arise. According to the projections prepared for the Pension Board’s report on Special
Savings for Retirement, the amount of pensions savings under a mandatory system could be as high as 4.3% of GNP which equates to over €6 billion in 2006 terms;
l Charges for investment protection may sometimes appear high and unjustifiable. During sustained periods of good investment returns such as occurred during the 1990s, there would be little or no perceived need for investment guarantees, and the awareness of the value of the guarantee may be low. It might therefore be difficult to explain the justification for the charges being deducted in respect of those guarantees;
l The existence of an Exchequer-backed guarantee on mandatory pensions may make voluntary supplementary arrangements unattractive and thereby endanger their continuation. This would contradict the objective in the SSR report of encouraging existing provision to continue;
l Were guarantees to be provided by the Exchequer without any charge, this would represent a transfer from general taxation to members of pension schemes;
l In times of poor investment returns, an investment guarantee (depending on its terms) would represent an economically significant transfer to scheme members. The design of a guarantee should reflect this possibility;
l From the point of view of the State, consideration needs to be given as to the appropriateness of any State expenditure on guarantees. There is an argument that State intervention in this area may crowd out what others would do anyway. State activity may be more justified in concentrating on regulating the market (e.g. issue of charges). Finally, any State guarantee would have to be tempered by its ability to pay.
Holders of small Standard PRSAs should have their benefits underwritten by the State9.58 A suggestion examined by the Pensions Board
in the National Pensions Review was that holders of small Standard PRSAs should have their benefit underwritten by the State so that they would be guaranteed a retirement income of, for example, €1 for every €15 of contributions made. (The proceeds of the PRSA would be paid to the State in return for which the contributor would receive an

1�1
GREEN PAPER ON Pensions
enhanced Social Welfare pension.) A subset of the suggestion was that voluntary additional contributions would be paid to the State by the PRSA holder which would provide extra Social Welfare pensions at retirement.
9.59 There may be difficulties with this suggestion as the State would be very vulnerable to the investment strategy followed by the Standard PRSA provider and the individual PRSA saver would have a strong incentive to choose higher risk investments, albeit within a default investment strategy or a pooled fund arrangement, in the knowledge that if such investments failed to perform, the State guarantee would be activated.
9.60 In relation to the subset of the suggestion, even if there were no State guarantee involved, the State would be left to bear the very substantial life expectancy risk following the saver’s exit from the labour force, while the savings provider would have had the benefit flowing from selling the product in the first place and maintaining the investment account prior to the saver’s retirement.
9.61 The ratio of 1:15 in the NPR was used to illustrate the possibility of a State guarantee of retirement income. Were this suggestion to be considered further, detailed examination of both mortality and investment returns would be needed in order to determine a conversion factor. There would also be important issues to be considered in relation to how these suggestions would operate in practice. One main effect of the suggestions would be to provide certain Standard PRSA holders with the option of a guaranteed annuity rate at retirement. On this basis, the suggestions would need to be considered in conjunction with Chapter 11.
Security for pension scheme members
9.62 Security of pension benefit, as it relates to DC, is concerned with the security of what was expected from the investment. This relates to the point on investment guarantees discussed in the previous sections. This section examines
arrangements that provide additional security to defined benefit scheme members in the event there is a shortfall in the assets of the scheme relative to the liabilities.
Overview9.63 From time to time, a defined benefit scheme
may have a shortfall, i.e. the value of the assets of the scheme may be less than the calculated value of the future benefits of the scheme. In the normal course of events, this is not a particular problem for the scheme, and a shortfall from time to time is a result of the funding approach adopted in most Irish defined benefit pension schemes. Usually, the shortfall is made up by additional contributions into the scheme.
9.64 However, a shortfall becomes important in two circumstances:
l Where future contributions are not sufficient to cover the shortfall and there is no agreement to make additional contributions and/or reduce benefits appropriately; or
l Where the scheme is being wound up and there is an uncovered shortfall.
9.65 In general, Irish employers do not have a legal obligation to provide pensions (with the exception of the construction industry). In those cases where employers provide a defined benefit pension, the employer has no legal liability for any shortfalls that might arise from time to time. The security of the benefits of members of defined benefit schemes therefore depends on the assets already accumulated in the pension fund and on the willingness of the employer to continue to make contributions.
9.66 In some countries, there are mechanisms to provide additional security for scheme members in the event that the scheme has an unmanageable asset shortfall. These mechanisms include:
l Obligations on employers to make contributions and/or to take responsibility for fund shortfalls;
l Insurance or similar arrangements to meet part or all of any shortfalls that may arise.

1��
GREEN PAPER ON Pensions
Employer obligation9.67 A debt on the employer would make any
shortfall in funding the legal responsibility of the employer. It therefore acts as an additional level of security for scheme members over and above the assets of the scheme.
9.68 As normally understood, the debt is activated at any time when a scheme is wound up and/or when a sponsoring employer goes into liquidation. The employer is liable for any difference between the liabilities of the scheme (calculated on a prescribed basis) and the assets of the scheme. In the event of liquidation, the amount of this difference is treated as a creditor. Because the amount of the debt depends on a prescribed basis for calculating the scheme obligations, the security provided depends on how demanding this basis is.
9.69 The advantages of introducing such a concept are:
l Security for members is better than with a funding standard alone;
l The debt acts as a disincentive for solvent employers to wind up underfunded schemes;
l Where schemes do not meet the Funding Standard, the existence of the debt allows longer term and therefore less demanding funding plans to be put in place; and
l There is no immediate cost to employers.
9.70 Among the potential disadvantages are:
l In many cases where the employer is in liquidation, particularly for smaller companies, there may be little or no assets available once the claims of preferred and secured creditors have been satisfied. The net benefit of this provision may therefore be small unless the scheme is ranked as a preferred creditor;
l It is likely to be opposed by those whose rights in liquidation would be affected;
l The existence of a potential debt might in some cases affect the ability of the sponsoring employer to raise funds. However, the introduction of FRS17 in company accounts may have this effect in any event;
l This may be seen as penalising employers who have voluntarily undertaken to sponsor defined benefit schemes vis-à-vis those
who have less valuable or no occupational pension arrangements;
l There is a risk that the introduction of this measure would prompt the wind-up of some underfunded schemes before it took effect; and
l There may be some concern that, in the event of a debt on the employer, some scheme trustees may be more likely to follow more aggressive investment policies in the belief that any shortfalls would be covered by the employer.
9.71 The Funding Standard Expert Group of the Pensions Board recommended against the introduction of such a debt on employers in 2004. They saw it as introducing a retrospective cost on employers and feared that it would undermine the voluntary basis on which defined benefit schemes were set up. On the other hand, a view exists that a debt on a solvent employer should be part and parcel of any decision relating to the statutory order of priority on wind-up that would affect pensioners’ rights.
9.72 This issue was considered again in the Pensions Board’s review of the Funding Standard in 2005, and views were invited on this topic as part of a consultation process. All replies recognised the additional security that a mandatory debt would provide for scheme members, though some questioned whether this would be significant and would be worth the drawbacks. Some responses stated that the advantages to members outweighed the disadvantages, while others had the view that the effect of the introduction of a debt would further weaken defined benefit pension provision. After consideration of this issue, including the submissions made as part of the consultation process, the Board did not recommend the introduction of a mandatory employer debt.
Insurance or similar arrangements9.73 In some jurisdictions, there are arrangements
whereby, in the event of a scheme shortfall not being met by the sponsoring employer, some other arrangement makes up at least part of the shortfall. The most well-known of these arrangements are:
l The Pension Protection Fund in the U.K., which became operational in April 2005,
1��
GREEN PAPER ON Pensions
is a scheme which covers defined benefit shortfalls up to statutory maxima. The fund takes over responsibility for scheme liabilities and assets in the event that the employer is unable to meet the shortfall. It is funded by a risk-based levy on defined benefit schemes;
l The Pension Benefit Guarantee Corporation (PBGC) in the U.S.A. which is similar to the U.K. arrangement and takes responsibilities for scheme benefits (to a maximum) in the event that the employer is unable to meet the shortfall or that meeting it would endanger the viability of the employer. The PBGC is currently experiencing large deficits;
l The German Pensions-Sicherungs-Verein (PSV), through which book reserve and unfunded support funds plans must be insured against bankruptcy of the employer through a mutual insurance corporation. The insurance covers benefits in payment and vested entitlements for active workers, subject to certain exclusions and limits. Shortfalls are funded by a levy on participating employers related to their pension liabilities, and not linked to risk of insolvency.
9.74 Pension protection can be achieved in a number of ways, for instance:
l By setting up a fund, i.e. a quasi-insurance company, which builds up funds from charges imposed on pension schemes and uses these funds to meet the shortfalls as they arise;
l By imposing a levy on remaining schemes in the event of a scheme failing with a shortfall;
l By meeting shortfalls from the Exchequer, i.e. from general taxation.
9.75 Meeting any funding requirements from the Exchequer represents a fundamentally different approach to the other approaches listed. If shortfalls are met from general taxation, at least part of the cost is being paid by those who cannot benefit from the scheme because they are not members of qualifying pension schemes. The other approaches attempt to fund this protection from the group of people who can potentially benefit from the protection offered by the arrangement. However, even if costs are met by pension schemes, there is still
an argument that better funded schemes, those least likely to need or to avail of the protection, pay for a benefit for less well-funded schemes.
9.76 Where pension schemes are being charged for the protection scheme, there are a number of advantages in building up a fund rather than applying a levy only when the need has arisen:
l A levy to accumulate a fund will be more predictable and will smooth out the pension. A levy after the event is more likely to arise when many schemes are encountering funding difficulties of their own;
l An ongoing levy is a more predictable expense for pension schemes.
9.77 It would not be practical to introduce a pension protection arrangement for defined benefit schemes without some change to the structure of pension schemes. At present, employers have no obligation to meet any funding shortfalls in the schemes they sponsor, though the great majority of sponsoring employers do cover shortfalls when they arise. Were a pension protection arrangement introduced, there would be an incentive for unscrupulous employers to refuse to cover any shortfalls in order to pass them on to the protection scheme. It would seem to be a necessary condition that the protection would only apply where the employer was unable to make up any shortfall: however, this would be a fundamental change to the basis of Irish pensions.
9.78 Where shortfalls are to be met by a charge on other pension schemes, before or after the event, it must be decided how to allocate this cost among the eligible schemes. Possible approaches include:
l A per member charge;
l A proportion of assets;
l A proportion of eligible liabilities;
l A risk-related levy;
l Some combination of the above or other criteria.
9.79 There is an obvious logic to the concept of levying charges only on eligible schemes, on a basis proportionate to their eligibility. If this charge is related in some way to the perceived risk of claim, it will partly meet the argument that well-funded secure schemes

1��
GREEN PAPER ON Pensions
are paying for schemes that cannot meet their obligations, and may also act as an incentive to reduce the risk of shortfall. On the other hand, if vulnerable schemes are charged more, it may increase the likelihood of such schemes themselves failing. Furthermore, it is very difficult to calculate an appropriate rate of charge, even where the principle of relative charging has been accepted. The design and administration of a risk-related levy is a considerable technical challenge, and will represent a significant cost.
9.80 A pension protection fund must invest the scheme charges made in order to accumulate a fund to meet shortfalls as they arise. The investment of these assets is fundamentally different from the investment of the assets of pension schemes, and presents significant challenges.
9.81 A pension protection fund is most likely to be called upon to meet shortfalls in times of poor investment returns, especially if combined with low interest rates. The assets of the fund would therefore ideally be invested in order to gain value during those periods when scheme assets are likely to be losing value. This issue would require considerable further work, but the following observations can be made:
l The fund assets are likely to include a high proportion of bonds or similar instruments matched to the typical liability profile of eligible schemes, particularly those considered at higher risk of failure;
l The fund is likely to consider equity put options or derivatives whose value would move in the opposite direction to the equity market indices;
l Because the likelihood of scheme failure is a function of scheme investment strategy, the protection fund strategy should be modified in the event of movement in typical scheme investment;
l The introduction of a pension protection arrangement, irrespective of its design or funding, may reduce the incentive of scheme trustees and/or sponsoring employers to avoid scheme failure, in the expectation that there are now alternative safety mechanisms for scheme members. Pension regulations may need to be reviewed in order to ensure
that the protection fund is suitably protected. Such a review might incorporate:
- Investment policy; - Payment of contributions; - Employer obligations; - Treatment of surpluses; - Benefit improvements; - Discretionary pension increases.
9.82 In summary, the advantage of a pension protection scheme is the improved security provided for scheme members, especially those who have not yet retired. It is arguable that the result would be to bring scheme benefit security more into line with what many members assume it already is.
9.83 A pension protection scheme involves the transfer of resources to schemes with a shortfall. The principal difficulty is to decide who should provide these resources – taxpayers, members of other pension schemes, sponsoring employers, or some other group. By definition, they will be provided by those who do not benefit from the pension protection in the short term.
9.84 The technical difficulties of a pension protection arrangement, other than one paid for from general taxation, must not be underestimated. International experience has shown that it is difficult to calculate appropriate charges, and that the technical management of a pension protection system is demanding and expensive.
Judgment of the Court of Justice on Protection of employees in the event of the Insolvency of their employer9.85 Council Directive (80/987/EEC), which refers to
the protection of employees in the event of the insolvency of their employer, was introduced in 1980. A Judgment of the Court of Justice (Case C-278/05) was made in relation to this directive in January 2007. The background and findings of the Court are set out in the box below, which is an extract from a press release of the EU Commission (No 08/07), copy at Appendix E.
9.86 In the light of this Judgment, the EU Commission is undertaking a detailed examination of the relevant legislation in each member state, in the context of an overall examination of the directive. It is understood

1��
GREEN PAPER ON Pensions
Judgment of the Court of Justice in Case C-278/05
Carol Marilyn Robins and Others v Secretary of State for Work and Pensions.Ms Robins and 835 other claimants are former employees of the company, ASW Limited, which went into liquidation in April 2003. They were members of final-salary pension schemes funded by ASW. The schemes were terminated in July 2002 and are in the process of being wound up. According to actuarial valuations, there will be insufficient assets to cover all the benefits of all members, and the benefits of non-pensioners will therefore be reduced.
Under the legislation in force in the United Kingdom, the claimants will not receive all the benefits to which they were entitled. Two of the claimants will receive only 20% and 49% respectively of those benefits.
Taking the view that the United Kingdom legislation did not provide them with the level of protection called for by the directive, the claimants brought an action against the Government of the United Kingdom for compensation for the loss suffered. Hearing the case, the High Court has referred three questions to the Court for a preliminary ruling: (i) are the Member States required to fund themselves the rights to old-age benefits and if so to fund them in full? (ii) is the United Kingdom legislation compatible with the directive? and (iii) what is the liability of the Member State in the case of incorrect transposition of the directive?
The funding of rights to benefits by the Member States themselves The Court finds that the directive does not oblige the Member States themselves to fund the rights to old-age benefits. Inasmuch as it states in a general manner that the Member States ‘shall ensure that the necessary measures are taken’, the directive leaves the Member States some latitude as to the means to be adopted to ensure protection. A Member State may therefore impose, for example, an obligation on employers to insure or provide for the setting up of a guarantee institution in respect of which it will lay down the detailed rules for funding, rather than provide for funding by the public authorities.
Furthermore, the Court considers that the directive cannot be interpreted as demanding a full guarantee of the rights in question. In so far as it does no more than prescribe in general terms the adoption of the measures necessary to ‘protect the interests’ of the persons concerned, the directive gives the Member States, in relation to the level of protection, considerable latitude which excludes an obligation to guarantee in full.
that this will take account of the requirements of EU Directive 2003/41/EC on the activities and supervision of the institutions for occupational retirement provisions (IORPs Directive). The Commission plans to discuss the issues arising with Member States during 2007. Ireland welcomes this approach.
Conclusion9.87 While defined benefit and defined contribution
arrangements are currently the most popular
supplementary pension arrangements, the development of alternative hybrid models is gaining momentum.
9.88 In addition, this chapter highlights issues of particular concern in terms of DB and DC schemes and offers some options in relation to these issues. It should be read in conjunction with other relevant chapters, e.g. the funding standard chapter.
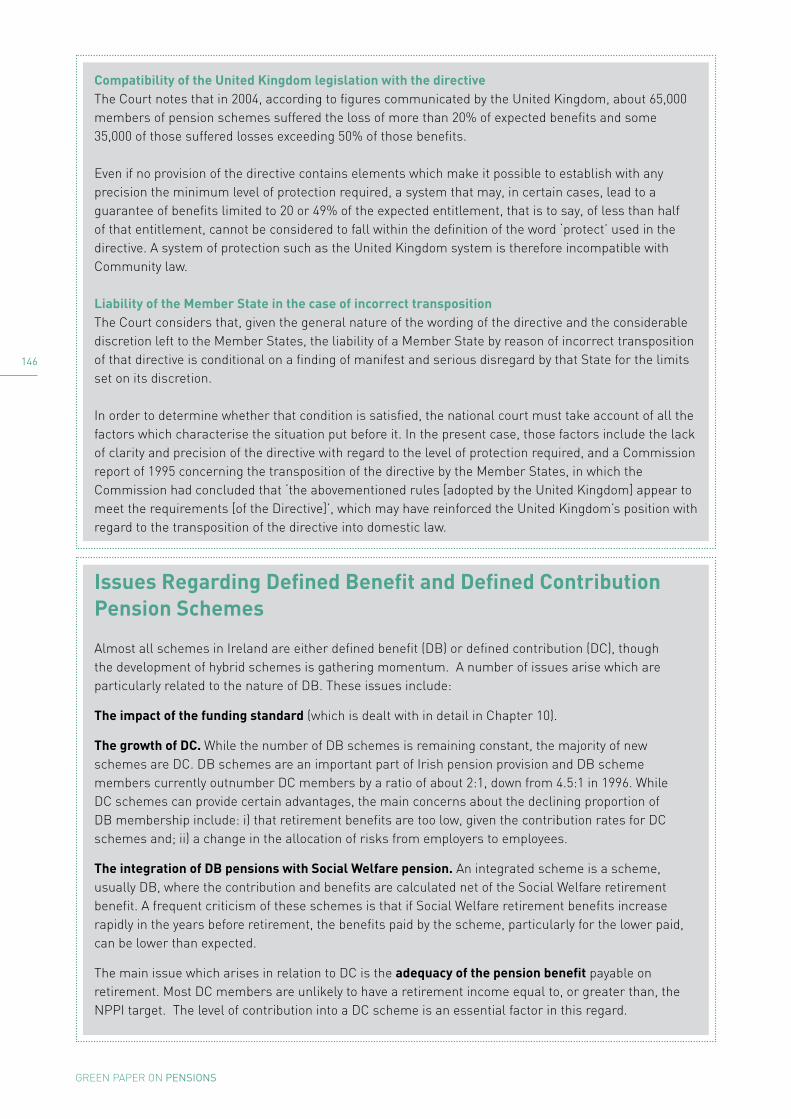
1��
GREEN PAPER ON Pensions
Compatibility of the united Kingdom legislation with the directive The Court notes that in 2004, according to figures communicated by the United Kingdom, about 65,000 members of pension schemes suffered the loss of more than 20% of expected benefits and some 35,000 of those suffered losses exceeding 50% of those benefits.
Even if no provision of the directive contains elements which make it possible to establish with any precision the minimum level of protection required, a system that may, in certain cases, lead to a guarantee of benefits limited to 20 or 49% of the expected entitlement, that is to say, of less than half of that entitlement, cannot be considered to fall within the definition of the word ‘protect’ used in the directive. A system of protection such as the United Kingdom system is therefore incompatible with Community law.
Liability of the Member State in the case of incorrect transposition The Court considers that, given the general nature of the wording of the directive and the considerable discretion left to the Member States, the liability of a Member State by reason of incorrect transposition of that directive is conditional on a finding of manifest and serious disregard by that State for the limits set on its discretion.
In order to determine whether that condition is satisfied, the national court must take account of all the factors which characterise the situation put before it. In the present case, those factors include the lack of clarity and precision of the directive with regard to the level of protection required, and a Commission report of 1995 concerning the transposition of the directive by the Member States, in which the Commission had concluded that ‘the abovementioned rules [adopted by the United Kingdom] appear to meet the requirements [of the Directive]’, which may have reinforced the United Kingdom’s position with regard to the transposition of the directive into domestic law.
Issues Regarding Defined Benefit and Defined Contribution Pension Schemes
Almost all schemes in Ireland are either defined benefit (DB) or defined contribution (DC), though the development of hybrid schemes is gathering momentum. A number of issues arise which are particularly related to the nature of DB. These issues include:
The impact of the funding standard (which is dealt with in detail in Chapter 10).
The growth of DC. While the number of DB schemes is remaining constant, the majority of new schemes are DC. DB schemes are an important part of Irish pension provision and DB scheme members currently outnumber DC members by a ratio of about 2:1, down from 4.5:1 in 1996. While DC schemes can provide certain advantages, the main concerns about the declining proportion of DB membership include: i) that retirement benefits are too low, given the contribution rates for DC schemes and; ii) a change in the allocation of risks from employers to employees.
The integration of DB pensions with Social Welfare pension. An integrated scheme is a scheme, usually DB, where the contribution and benefits are calculated net of the Social Welfare retirement benefit. A frequent criticism of these schemes is that if Social Welfare retirement benefits increase rapidly in the years before retirement, the benefits paid by the scheme, particularly for the lower paid, can be lower than expected.
The main issue which arises in relation to DC is the adequacy of the pension benefit payable on retirement. Most DC members are unlikely to have a retirement income equal to, or greater than, the NPPI target. The level of contribution into a DC scheme is an essential factor in this regard.

1��
GREEN PAPER ON Pensions
Issues that are common to both DB and DC include:
Guarantees. People save to provide for the future. In allocating assets towards a long-term target, the acceptable level of risk and return will vary, depending on the objective. However no-one, including the State, can give long term absolute guarantees.
The security of the pensions benefit. Security of pension benefit as it relates to DC is concerned with the security of what was expected from the investment.
From time to time, a DB scheme may have a shortfall, i.e. the value of the assets of the scheme may be less than the calculated value of the future benefits of the scheme. Usually the shortfall is made up by additional contributions into the scheme. A shortfall becomes important in two circumstances; where future contributions are not sufficient to cover the shortfall and where the scheme is being wound up and there is an uncovered shortfall.
In Ireland, the security of benefits of members of DB schemes depends on the assets already accumulated in the pension fund, and on the willingness of the employer to continue to make contributions.
In some countries, there are mechanisms to provide additional security for scheme members in the event that the scheme has an unmanageable asset shortfall, including obligations on employers to make contributions and/or to take responsibility for fund shortfalls and insurance or similar arrangements to meet part or all of any shortfalls that may arise.
Questions for consideration
1. Are there problems with the current integration arrangements for DB schemes?
If so, what are the possible solutions?
a. prohibit integration?
b. restrict a reduction in pensionable pay in the last, say, 3 or 5 years?
c. have a different integration formula for lower earners, as is the case in the public sector?
2. How can we ensure that savers understand that the level of contributions, the length of time the contributions will be made, and the return on investments will influence the level of benefits in a DC scheme?
3. What would be considered appropriate security of pension benefits? Does this exist at present?
4. Are people sufficiently aware of the trade-off between risk and the return on investments, i.e. usually the higher the potential return, the greater the risk?
5. What could be done to enhance guarantees of pension benefit? Do guarantees justify the associated costs and risks?
6. In some countries, there are arrangements to meet at least part of a shortfall in the event of a scheme shortfall. Some of these arrangements include the Pension Protection Fund in the UK, the Pension Benefit Guarantee Corporation (PBGC) in the USA and the German Pensions-Sicherungs-Verein. These arrangements can run into considerable difficulties, with the experience of the PBGC, which is currently experiencing large deficits, being a particular case in point. Having considered the discussion, would you be in favour of any of these arrangements, having regard to the pros and cons outlined in this chapter?


CHAPTER 10
The funding sTandard

1�0
GREEN PAPER ON Pensions
Introduction
10.1 The funding standard was introduced in 1991 in order to set out the minimum assets that a defined benefit scheme must hold and what steps must be taken if the assets of the scheme fall below this minimum.
10.2 Before 2000, very few schemes failed the funding standard because of high investment returns and low revaluation liabilities. However, between 2000 and 2004, many schemes failed the standard. There has been an improvement in the situation, reflecting the progress of equity markets since 2003. At the end of 2006, 427 schemes, representing 28% of funded defined benefit schemes, did not meet the funding standard. Of those schemes that did not meet the standard, about 196 have a funding plan in place to restore funding within 3 years. The remainder are funding over a longer period or in some cases are still negotiating a solution.
10.3 There is now a divergence of views about the standard: some believe that the numbers of schemes failing the standard is a sign that the standard is too high: others believe that the standard is appropriate or even too low, and that schemes’ failure to meet the standard is a result of increases in longevity and lower expected future yields.
10.4 This chapter is set out as follows:
l The history of the funding standard;
l The current funding standard;
l The impact of recent economic/financial developments;
l Changes to the funding standard;
l Current situation;
l Options;
l Criteria for change.
History of the Funding Standard
10.5 The funding standard had its origins in the First Report of the National Pensions Board119, which recommended that such a statutory funding standard should be introduced. The Pensions
119 First Report of the National Pensions Board, Dublin, 1987
Board has supervised the operation of the funding standard since its implementation and it has been a key element of the framework of member protection introduced by the 1990 Pensions Act.
10.6 The funding standard set out in the Act is a wind-up standard, which means that it obliges schemes to aim to hold assets that would be enough, if the scheme wound up, to meet the scheme’s accrued liabilities. This would normally involve the scheme arranging for an insurance company to take over payment of benefits for pensioners, and paying a transfer value to another pension arrangement for people who had not retired. Under the original 1990 Act, a scheme not holding sufficient assets must plan to build up the scheme’s funding to the required level within a period of no longer than 3½ years (subsequently changed to 3 years).
The Current Funding Standard
10.7 The operation of the current funding standard comprises:
(a) Preparation of an Actuarial Funding Certificate (AFC), which compares the assets of the scheme with the liabilities, calculated on a specified basis; and
(b) If the AFC shows a shortfall, the preparation of a funding proposal, designed to eliminate the shortfall over an agreed period.
Actuarial Funding Certificate:10.8 Section 42 of the Pensions Act 1990 (as
amended) generally requires that trustees of funded defined benefit pension schemes must submit an AFC at regular intervals to the Pensions Board. In the AFC, the scheme’s actuary certifies whether the scheme does or does not satisfy the funding standard at the effective date of the AFC.
10.9 The funding standard is satisfied if, broadly, in the actuary’s opinion, the scheme’s assets at the AFC effective date were more than the sum of:
l The transfer values to which the members would be entitled to; and
l The estimated expenses of winding up the scheme.

1�1
GREEN PAPER ON Pensions
10.10 Although the trustees can choose the effective date of the AFC, the period between successive AFCs prepared and submitted to the Board must be no longer than 3 years. AFCs must be submitted to the Board within nine months of their effective date.
10.11 In the intervals between AFCs, the trustee annual report must state whether the actuary could certify that, on a specified date, the scheme would have satisfied the funding standard. If the actuary cannot make such a statement, the trustees must notify the Board, and a revised AFC must be submitted to the Board within 12 months of the last day of the reporting period, with an effective date that falls during that 12 month period.
Calculating the Liabilities10.12 The detailed rules for determining the funding
standard benefit for each member derive from the rules for calculating transfer values, laid down in an Actuarial Standards of Practice, PEN 2 and PEN 3, issued by the Society of Actuaries in Ireland. Under section 7A of the Pensions Act, these practice standards cannot be changed by the Society without the consent of the Minister for Social and Family Affairs.
10.13 In summary, the rules are as follows:
l The liability for pensioners should be determined by reference to the estimated actual cost of annuity purchase; and
l The transfer values determined for non-pensioners should be worked out assuming prescribed future investment returns. There are also prescribed assumptions for future price inflation, statutory increases in deferred pensions and earnings-linked pension increases.
10.14 The value placed on the scheme’s liabilities must reflect statutory and/or any guaranteed increases to benefit both in deferment and while in payment.
10.15 Actuarial standards also require the actuary to make the scheme trustees or sponsoring employer aware of any differences between the statutory funding standard and the approach used by the actuary in framing his or her advice to the trustees about the scheme’s ongoing funding position. The
guidance provides that the ‘financial and other assumptions’ that the actuary should have regard to when certifying an AFC ‘should comprehend a prudent view of the future without taking into account every conceivable unfavourable development’.
Funding Standard Assets10.16 The assets included in the funding standard
are usually those shown in the annual accounts at the date of calculation. However, for the purposes of the funding standard certain self-investment (e.g. shares in or loans to the employer) must be excluded.
The Funding Proposal10.17 If an AFC indicates that, in the actuary’s
opinion, the scheme does not satisfy the funding standard on the relevant effective date, the trustees must submit a funding proposal to the Board along with the AFC. This must set out a contribution plan that the actuary can certify as being such that he or she reasonably expects to be enough to allow the scheme to satisfy the funding standard within the period of the proposal. The funding period is generally, under the legislation, no longer than 3 years though, under measures introduced in 2003, the Board may allow a longer period.
10.18 If the trustees of a scheme do not submit an AFC, or, where necessary, a funding proposal, under Section 50 of the Act the Board may require a reduction in the scheme benefits to a level that will satisfy the funding standard though this has not happened to date.
Impact on Funding of Recent Economic/Financial Developments Funding Irish Defined Benefit Plans 10.19 The funding standard does not determine
the cost of a defined benefit scheme. This cost is determined by the benefits provided by the scheme, the investment returns earned and the experience of the scheme. What the funding standard may do is require contributions to be made to the scheme sooner than they would otherwise have been

1��
GREEN PAPER ON Pensions
made. This would happen where a scheme failed the standard and the contributions under the funding proposal were higher than the long term funding rate for the scheme.
10.20 Irrespective of the funding standard, the cost of funding defined benefit schemes has increased significantly since the introduction of the Pensions Act in 1990. The following is an attempt to identify the drivers of increased funding requirements for DB plans over the last 20 years, and also looks at the interaction of this cost with the funding standard and with FRS17.
10.21 The cost of providing the promised benefit in a DB scheme depends on the benefit structure that is in place and a number of unknown factors, usually including:
l The actual salary of the member at retirement;
l The rate of price inflation during the course of the pension payment (if payments are inflation linked);
l Demographics, i.e., how long will the member live while in retirement, and if there is a spouse’s pension, how long the spouse will live, and;
l The level of investment returns achieved on the Fund prior to benefit payments falling due.
10.22 In order to place a value on the magnitude of a pension plan’s liabilities it is necessary to make assumptions about the future unknown experience of the plan.
1990s Environment10.23 Between 1980 and 1999, average pension
managed fund returns were of the order of 20% per annum and periods of poor performance were unusual and relatively short-lived. When coupled with far higher long-term interest rates than is the case currently this led, in the main, to a very healthy environment for pension plans. Figure 10.1 below illustrates this point.
10.24 Other factors also contributed to a benign situation. In particular:-
l The typical actuarial funding assumption for (male) pensioner life expectancy was 14.6 years at age 65 (compared to a typical assumption of 20.2 years today). The cost of a typical annuity for a 65 year old male in 1980 was €833 per €100 per annum of pension (compared to approximately €2,500 per €100 per annum today);
l There was a concept of funding minimum commitments on wind-up, but invariably there were huge discontinuance surpluses since there was no preservation/revaluation of deferred benefits and there was a much lower annuity cost, and;
l During this time, pension funds existed in a more subjective financial environment. In particular corporate pension accounting rules were less prescriptive than modern standards and typical practice was to use ‘long-term’ funding assumptions and smooth asset returns. Arguably less attention was paid to financial risk partially because pension schemes tended to be
-20-10
0102030405060
-20-10
0102030405060
-20.0%
-10.0%
0.0%
10.0%
20.0%
30.0%
40.0%
50.0%
60.0%
1980 1981 1982 1983 1984 1985 1986 1987 1988 1989 1990 1991 1992 1993 1994 1995 1996 1997 1998 1999
1-year returns CPI inflation Gift Yield
Figure 10.1: Average Pension Managed Fund Returns (1980 - 1999)

1��
GREEN PAPER ON Pensions
immature and typically were small relative to their sponsoring employers.
10.25 Table 10.1 below details the outcome of a typical actuarial review in 1990. It shows the recommended contribution rate at various ages for each year’s accrual of a standard benefit promise.
Table 10.1 – recommended contribution rate
Age 35 Age 45 Age 55
No pension indexation 8.4% 10.1% 12.1%
Consumer Price Index (CPI) linked pensions increases
12.2% 14.7% 17.7%
The calculations show the contribution rate recommended to fund a 1/60th plan (with 50% spouse’s pension). Key assumptions are:- 9% interest rate to capitalise future benefit outgo, 5% CPI inflation, 7% salary increases and PA (90) mortality. (Estimates of life expectancy are based on mortality tables and the PA (90) table was intended to estimate the mortality of pensioners in insured schemes in 1990).
Environment Since 200010.26 Among the factors that have changed in
the interim include significant asset losses between the years 2000-2003. Funds decreased by an average of 25% in total. This was at a time when growth over the three years was expected to be around 25%, which leaves a differential of 50% in effect. Coupled with a sharp decline in long-term interest
rates, this left many funds in a difficult financial position. While returns since 2003 onwards have been much better, pension plans are still in “catch-up” over the full period since 2000 and are struggling with further declines in interest rates. Figure 10.2 illustrates this point.
10.27 Other factors have increased the pressure on pension funds. In particular:
l The typical current actuarial funding assumption for (male) pensioner life expectancy at age 65 of 20.2 years represents an increase in life expectancy of around 38% relative to the typical assumption 15-20 years ago;
l Pension funds have acquired much higher commitments on wind-up. Full preservation of pension rights on leaving service (with statutory revaluation of benefits) became a legislative feature in 2002. Schemes were also faced with much higher annuity costs when demonstrating pension protection for retired members. As an example, due to low interest rates and higher longevity, it cost around €2,500 per €100 per annum of a typical 65 year old’s pension in 2006 compared to €833 per €100 per annum of pension in 1980. So in 26 years the cost of purchasing a pension has tripled; and
l Pension funds were also operating in a more regulated financial environment. Features included:
-20.0%
-15.0%
-10.0%
-5.0%
0.0%
5.0%
10.0%
15.0%
20.0%
1-year returns CPI inflation Gift Yield
-20-15-10
-505
101520
-20-15-10
-505
101520
2000 2001 2002 2003 2004 2005 2006
Figure 10.2: Average Pension Managed Fund Returns (2000 - 2006)
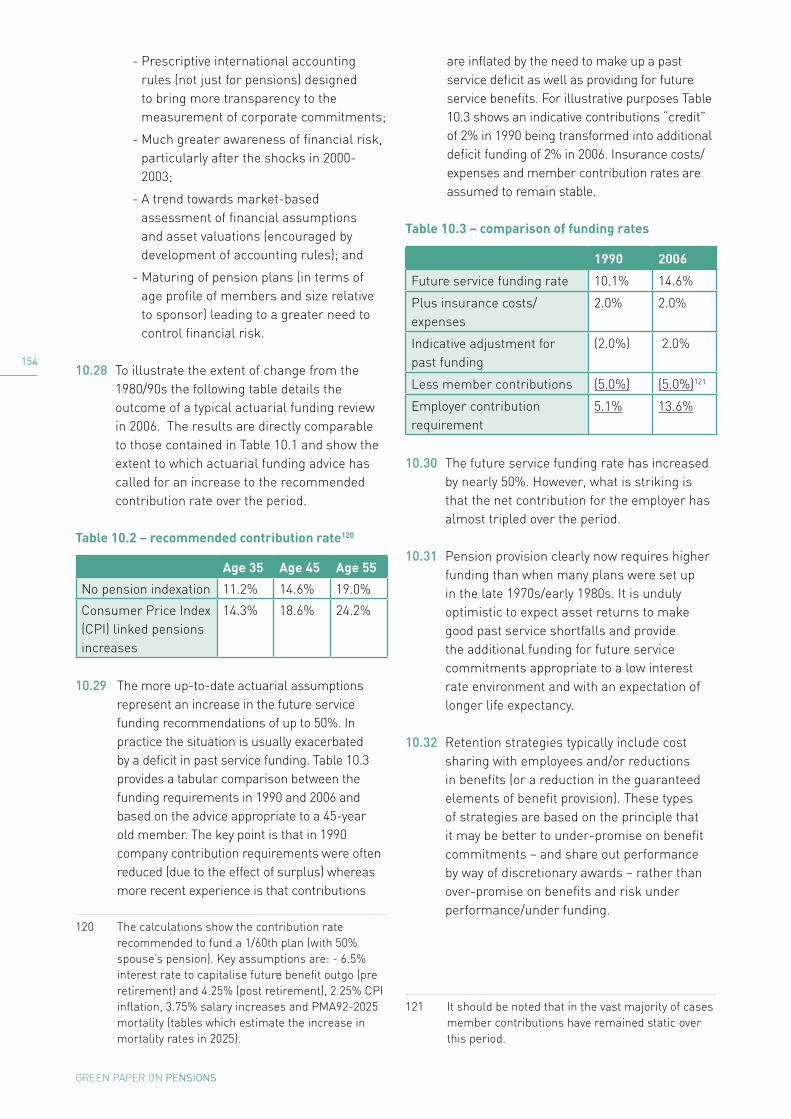
1��
GREEN PAPER ON Pensions
- Prescriptive international accounting rules (not just for pensions) designed to bring more transparency to the measurement of corporate commitments;
- Much greater awareness of financial risk, particularly after the shocks in 2000-2003;
- A trend towards market-based assessment of financial assumptions and asset valuations (encouraged by development of accounting rules); and
- Maturing of pension plans (in terms of age profile of members and size relative to sponsor) leading to a greater need to control financial risk.
10.28 To illustrate the extent of change from the 1980/90s the following table details the outcome of a typical actuarial funding review in 2006. The results are directly comparable to those contained in Table 10.1 and show the extent to which actuarial funding advice has called for an increase to the recommended contribution rate over the period.
Table 10.2 – recommended contribution rate120
Age 35 Age 45 Age 55
No pension indexation 11.2% 14.6% 19.0%
Consumer Price Index (CPI) linked pensions increases
14.3% 18.6% 24.2%
10.29 The more up-to-date actuarial assumptions represent an increase in the future service funding recommendations of up to 50%. In practice the situation is usually exacerbated by a deficit in past service funding. Table 10.3 provides a tabular comparison between the funding requirements in 1990 and 2006 and based on the advice appropriate to a 45-year old member. The key point is that in 1990 company contribution requirements were often reduced (due to the effect of surplus) whereas more recent experience is that contributions
120 The calculations show the contribution rate recommended to fund a 1/60th plan (with 50% spouse’s pension). Key assumptions are: - 6.5% interest rate to capitalise future benefit outgo (pre retirement) and 4.25% (post retirement), 2.25% CPI inflation, 3.75% salary increases and PMA92-2025 mortality (tables which estimate the increase in mortality rates in 2025).
are inflated by the need to make up a past service deficit as well as providing for future service benefits. For illustrative purposes Table 10.3 shows an indicative contributions “credit” of 2% in 1990 being transformed into additional deficit funding of 2% in 2006. Insurance costs/expenses and member contribution rates are assumed to remain stable.
Table 10.3 – comparison of funding rates121
1990 2006
Future service funding rate 10.1% 14.6%
Plus insurance costs/expenses
2.0% 2.0%
Indicative adjustment for past funding
(2.0%) 2.0%
Less member contributions (5.0%) (5.0%)121
Employer contribution requirement
5.1% 13.6%
10.30 The future service funding rate has increased by nearly 50%. However, what is striking is that the net contribution for the employer has almost tripled over the period.
10.31 Pension provision clearly now requires higher funding than when many plans were set up in the late 1970s/early 1980s. It is unduly optimistic to expect asset returns to make good past service shortfalls and provide the additional funding for future service commitments appropriate to a low interest rate environment and with an expectation of longer life expectancy.
10.32 Retention strategies typically include cost sharing with employees and/or reductions in benefits (or a reduction in the guaranteed elements of benefit provision). These types of strategies are based on the principle that it may be better to under-promise on benefit commitments – and share out performance by way of discretionary awards – rather than over-promise on benefits and risk under performance/under funding.
121 It should be noted that in the vast majority of cases member contributions have remained static over this period.

1��
GREEN PAPER ON Pensions
10.33 There are also signs of a much greater awareness and appreciation of pension fund investment risk. This is evidenced by:
l Some commentators noting the emergence of a reduction in equity weightings;
l Newly launched financial products designed to match the duration of bond portfolios with the duration of liabilities;
l Derivative based strategies to achieve further risk control; and
l More evidence of pension fund risks being measured and controlled in line with other business risks.
10.34 The funding standard has now been in place for over fifteen years. Until 2000, few schemes had any difficulty meeting the Standard. However, a number of factors, in particular economic and financial developments, have had an adverse impact on scheme funding over the last seven years. This situation has changed recently, with a marked improvement in the returns on investment for schemes.
Value of Assets10.35 Typical investment performance of Irish
pension funds between 2000 and 2003 meant that a number of schemes were having problems in ensuring they met the funding standard. However, at February 2007, taking a ten year period, the average investment performance for schemes was around 9% per annum. It is clear that taking the longer term view, most schemes have achieved investment returns slightly above those originally anticipated.
10.36 The funding position of many schemes was affected because scheme surpluses generated in the 1990s were often used to reduce contributions, to provide increases in pensions, to enhance early retirement benefits and/or to increase other benefits.
Liabilities10.37 Liabilities are based primarily on interest
rates and mortality assumptions. Interest rates have fallen since the funding standard was introduced, which has increased liabilities irrespective of other changes. Over the same period, expected longevity has also increased, adding further to liabilities.
Movement between liability categories10.38 Due to the closure of some schemes to new
entrants, the general maturing of schemes, and less frequent annuity purchase, the balance of the liabilities in many schemes has moved from active members towards deferred members and particularly pensioners. Because the funding standard is relatively more expensive for pensioners than for active and deferred members, a shift towards pensioners has resulted in an increase in liabilities as assessed by the funding standard.
Changes to the Funding Standard, 1990 to Present
10.39 Since the introduction of the funding standard, the following regulatory and actuarial issues have affected its impact on schemes:
l The funding standard requires schemes to provide limited revaluation on post-1991 service where the member leaves the scheme or the scheme is wound up. As a result, the funding standard liability for such post-1991 benefits is higher than for benefits without revaluation. In the years immediately after the standard was originally introduced, post-1991 service comprised only a small proportion of total service. However, the passage of time has increased this proportion, and as a result has increased the impact of the funding standard;
l The funding standard specifically requires a scheme to hold the actuarial value of benefits for each member. This actuarial value is defined in a guidance note issued by the Society of Actuaries in Ireland. Originally, the actuarial value could vary scheme by scheme, but successive versions of the guidance note have made the method and basis of the calculation more and more specific. The result for many schemes has been an increase in the scheme’s funding standard obligations; and
l In the original 1990 Act, schemes did not have to provide revaluation on pre-1991 benefits. However, since 2002, these benefits must be revalued. Although the impact of this change is not significant

1��
GREEN PAPER ON Pensions
for many schemes, it has nonetheless further increased the burden of the funding standard on some schemes.
Short-term funding measures10.40 In April 2003, as a result of recommendations
by the Pensions Board, the Minister for Social and Family Affairs amended the Pensions Act to allow the Board to respond, on a case-by-case basis, where schemes find themselves with funding difficulties wholly or mainly as a result of falls in global equity markets. This change allowed scheme trustees apply to the Board for an extension of the usual period of 3½ years within which schemes must plan to meet the funding standard. The maximum extension the Board is willing to consider is usually 10 years from the date of the funding proposal.
10.41 Applications for an extension could only be made if certain conditions were satisfied. The most important of these was that the scheme actuary must certify that the failure to meet the funding standard was wholly or mainly a result of the fall in investment markets. In granting such applications, the Board must be satisfied that it is necessary or appropriate and not contrary to the interests of the members of the scheme for the scheme to be allowed a longer period to satisfy the funding standard.
10.42 The 2003 changes were intended to be a short term response to the difficulties that defined benefit schemes were encountering. The Minister for Social and Family Affairs also asked the Board to review the operation of the funding standard with a view to making recommendations for longer term changes, if required. The results of this review were published in December, 2004.
In its report, the Board made a number of
recommendations, of which those directly relevant to the standard were:
(a) The funding standard should be
substantially unchanged, except for some modification of the calculation for pre-retirement members;
(b) The facility to restore funding over periods longer than 3½ years should be made
permanent, and the grounds on which these longer periods are available should be widened.
10.43 In making these recommendations, the Board was seeking to balance the objectives of preserving defined benefit provision and protecting the accrued benefits of scheme members. The Board was of the view that the extended funding recovery period introduced in the 2002 Act had already made a significant difference to the sustainability of defined benefit schemes. In paragraph 6.20 of its report, the Board explicitly recognised that the proposed further changes would not make a significant difference to schemes which were having difficulty meeting the standard in late 2004.
10.44 The above recommendations were implemented through legislation and changes to actuarial guidance in 2005. At the same time, the maximum period between AFCs was reduced from 3½ years to 3 years in line with the requirements of the IORPs Directive.
Current situation
10.45 Since Spring 2003, scheme assets have enjoyed high investment returns. At the end of February 2007, the typical asset return for the last 10 years, i.e. including the losses between 2000 and 2003, has been over 9% per annum.
10.46 However, a scheme’s ability to meet the funding standard depends not only on asset returns, but also on the liability calculation. The two most important determining factors in liability calculations are expected future longevity and long term bond yields. Normal bond yields have increased somewhat from their lowest point, but are still very low by recent historical standards.
10.47 At the end of 2006, 427 schemes, representing 28% of funded defined benefit schemes, did not meet the funding standard. Of those schemes that did not meet the standard, about 196 have a funding plan in place to restore funding within 3 years. The remainder are funding over a longer period or in some cases are still negotiating a solution.

1��
GREEN PAPER ON Pensions
10.48 The 40 largest funded defined benefit schemes have in total 165,361 active members. Of these, eight schemes representing slightly more than 16,000 members do not meet the funding standard.
Impact of the Funding Standard10.49 The rationale that exists behind the funding
standard is that pension promises should be backed by sufficient assets to ensure delivery. In order to achieve this, the Pensions Board has the power to require benefits in a scheme to be reduced where funding falls short of regulatory requirements.
10.50 The test under the funding standard is that assets (at a point) should meet wind-up liabilities as defined under Section 48 of the Pensions Act 1990, (as amended), including:
l The expenses of winding up the plan (usually estimated at around 2% of liabilities);
l The purchase of annuities for pensioners122; and
l Provision for statutory transfer payments for employees/deferred members.
10.51 The funding standard primarily poses a challenge for more mature plans, especially where the benefits are funded using financial assumptions at the ‘optimistic’ end of typical practice (and reliant on out-performance by equities relative to bonds). Arguably, such an approach runs the risk of “over-promising on benefits and under-performing on assets”.
10.52 On the other hand, the current situation where there can be up to 10 years to resolve funding difficulties already provides a high level of flexibility. Further flexibility could be given by removing pension indexation, but if this occurred it should, arguably, be accompanied by a more robust valuation basis for non-pensioner liabilities.
122 The legislation provides scope to use a ‘substituted’ fixed pension increase rate for CPI linked pensions rather than being required to assess the minimum liability on the basis of securing a more expensive annuity with open-ended CPI linked pension increases.
FRS1710.53 Employers in their annual accounts are
required by Financial Report Standards (FRSs) to show the amount of their pension commitments (liabilities) compared to the amount of the scheme assets (fund) and to disclose the net difference, whether a deficit or a surplus, in their balance sheet. The particular international accounting standard by which most Irish companies determine the effect of a pension scheme on their accounts is FRS17. What follows is a look at the impact of FRS17 on the funding of DB pension schemes.
10.54 At its core FRS17 seeks that corporate pension expense should be assessed in an objective, transparent and comparable manner. It seeks to ensure that investors should be able to make judgements on the scale of the benefit obligations and the ability of corporations to meet the cost involved and also manage the risk.
10.55 FRS17 has its own prescribed methodology covering assumptions, actuarial method and the treatment of past service costs. The standard is based on a “fair value” accounting model and regards liabilities as debt-like commitments and requires that they should be capitalised using a market-related fixed interest rate.
10.56 Current debate surrounding the assumptions made and methodologies adopted by FRS17 includes the suitability of using a corporate bond rate to capitalise benefit commitments (current approach) or a risk-free discount rate. Other arguments include the question as to whether the methodologies should continue to include an allowance for future salary increases and if there should be a credit for anticipated equity return in the profit and loss account.
10.57 The following tables seek to show the relative magnitude of pension liabilities calculated on typical actuarial funding bases (both in 1990 and currently) compared with corresponding calculations under the funding standard and FRS 17. The essential point is that the relativity of the different valuation results is heavily influenced by the maturity of any

1��
GREEN PAPER ON Pensions
particular plan and, for this reason, a range of 4 different plan profiles is shown ranging from a “Young plan” – 100% employees aged 35 – up to an “Ultra-mature plan” – 10% employees aged 55 and 90% pensioners aged 65. Table 10.4 shows the make up of these and the two in-between plan profiles.
10.58 For the purpose of these examples, the following assumptions were made:
l Salary is €40,000 and the members were assumed to have joined the company at the age of 25; and
l Pensioners are assumed to be in receipt of pensions of €20,000 per annum.
Table 10.4 – scheme examples
Employees age Pensioners
35 45 55 65
Young plan 100% - - -
Mid plan 15% 50% 15% 20%
Mature plan - 20% 30% 50%
Ultra-mature plan
- - 10% 90%
10.59 Table 10.5 shows the results assuming no obligation to provide pension escalation. It shows the impact of the change in typical actuarial funding assumptions between 1990 and 2006 leading to an increase in liability valuation in the order of 50% over this period – reflecting a reduction in long term interest rates and allowance for increased longevity.
10.60 Of critical importance in terms of understanding the impact of the funding standard is to note that the standard is lower than typical long-term funding aspirations for all but the most mature plan. FRS 17 liabilities are also far higher than both typical long-term funding objectives and Funding Standard liabilities for younger plans. Arguably, the long-term funding valuations are understated for the most mature plans, since many trustees of such schemes would choose an annuity valuation approach in any event. This analysis may undermine the argument that the annuity obligation in the funding standard is the culprit in causing funding pressures for DB plans and that it should be weakened.
10.61 Table 10.6 is similar to Table 10.5 but shows the results for plans with CPI linked pension increases. This table shows the relative Funding Standard and FRS 17 results (similar pattern to Table 10.5) and also the impact of removing any allowance for pension indexation from the Funding Standard. This latter analysis serves to illustrate the extent to which increased funding freedom could be afforded to pension plans with guaranteed pension increase rules in the event that the Funding Standard was modified to remove the statutory obligation to fund this aspect of the benefits.
Summary of Funding Overview10.62 It is clear from the section above that the
funding standard is not the key influence driving pension costs and defined benefit closure. Rather the key influences are increases in underlying pension costs and the impact of FRS17.
10.63 Any change to the funding standard would need to have regard to what happens on the ground in a wind-up situation. Options could include considering “debt on employer” legislation or a central protection fund or reconsidering the order of priority on wind-up, which were discussed in Chapter 9.
Consequences of a wind-up Standard10.64 The funding standard as a wind-up standard
obliges schemes to aim to hold assets that would be enough if the scheme wound up to meet the scheme’s accrued liabilities. One further issue which may be raised in discussing the implications of the current standard is the priority given to pensioners and non-pensioners (i.e. employees and former members who have not reached pension age and whose entitlements are represented by deferred pensions payable on attainment of retirement age).
10.65 The current legislation gives priority (having made allowance for expenses and any voluntary member contributions) to the cost of securing pensioner liabilities by means of annuity purchase. Such priority extends to all elements of a pensioner’s benefit expectation - including the cost of securing future pension increases where these are guaranteed under
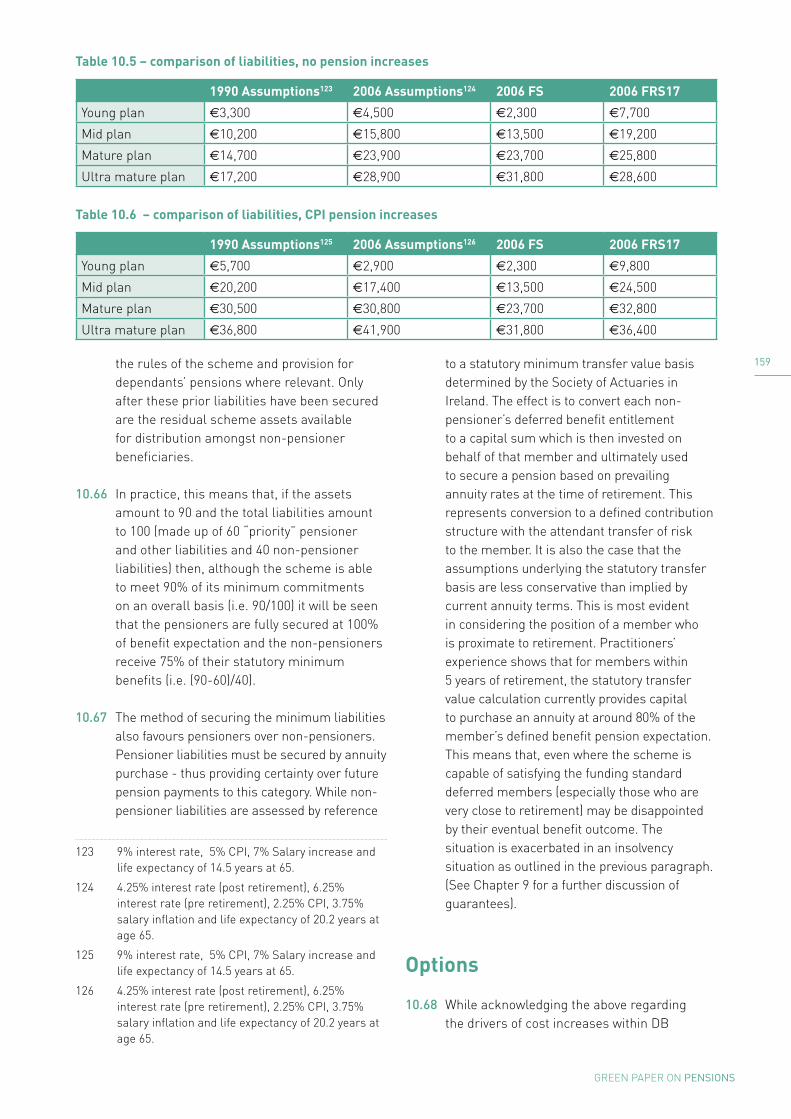
1��
GREEN PAPER ON Pensions
the rules of the scheme and provision for dependants’ pensions where relevant. Only after these prior liabilities have been secured are the residual scheme assets available for distribution amongst non-pensioner beneficiaries. 123 124 125 126
10.66 In practice, this means that, if the assets amount to 90 and the total liabilities amount to 100 (made up of 60 “priority” pensioner and other liabilities and 40 non-pensioner liabilities) then, although the scheme is able to meet 90% of its minimum commitments on an overall basis (i.e. 90/100) it will be seen that the pensioners are fully secured at 100% of benefit expectation and the non-pensioners receive 75% of their statutory minimum benefits (i.e. (90-60)/40).
10.67 The method of securing the minimum liabilities also favours pensioners over non-pensioners. Pensioner liabilities must be secured by annuity purchase - thus providing certainty over future pension payments to this category. While non-pensioner liabilities are assessed by reference
123 9% interest rate, 5% CPI, 7% Salary increase and life expectancy of 14.5 years at 65.
124 4.25% interest rate (post retirement), 6.25% interest rate (pre retirement), 2.25% CPI, 3.75% salary inflation and life expectancy of 20.2 years at age 65.
125 9% interest rate, 5% CPI, 7% Salary increase and life expectancy of 14.5 years at 65.
126 4.25% interest rate (post retirement), 6.25% interest rate (pre retirement), 2.25% CPI, 3.75% salary inflation and life expectancy of 20.2 years at age 65.
to a statutory minimum transfer value basis determined by the Society of Actuaries in Ireland. The effect is to convert each non-pensioner’s deferred benefit entitlement to a capital sum which is then invested on behalf of that member and ultimately used to secure a pension based on prevailing annuity rates at the time of retirement. This represents conversion to a defined contribution structure with the attendant transfer of risk to the member. It is also the case that the assumptions underlying the statutory transfer basis are less conservative than implied by current annuity terms. This is most evident in considering the position of a member who is proximate to retirement. Practitioners’ experience shows that for members within 5 years of retirement, the statutory transfer value calculation currently provides capital to purchase an annuity at around 80% of the member’s defined benefit pension expectation. This means that, even where the scheme is capable of satisfying the funding standard deferred members (especially those who are very close to retirement) may be disappointed by their eventual benefit outcome. The situation is exacerbated in an insolvency situation as outlined in the previous paragraph. (See Chapter 9 for a further discussion of guarantees).
Options
10.68 While acknowledging the above regarding the drivers of cost increases within DB
Table 10.5 – comparison of liabilities, no pension increases
1990 Assumptions123 2006 Assumptions124 2006 FS 2006 FRS17
Young plan €3,300 €4,500 €2,300 €7,700
Mid plan €10,200 €15,800 €13,500 €19,200
Mature plan €14,700 €23,900 €23,700 €25,800
Ultra mature plan €17,200 €28,900 €31,800 €28,600
Table 10.6 – comparison of liabilities, CPI pension increases
1990 Assumptions125 2006 Assumptions126 2006 FS 2006 FRS17
Young plan €5,700 €2,900 €2,300 €9,800
Mid plan €20,200 €17,400 €13,500 €24,500
Mature plan €30,500 €30,800 €23,700 €32,800
Ultra mature plan €36,800 €41,900 €31,800 €36,400

1�0
GREEN PAPER ON Pensions
schemes and the implications of a wind-up standard, opinion is divided about whether the funding standard should be changed, and also whether any change to the standard would make any significant difference to the sustainability of defined benefit arrangements. A number of approaches to the standard have been suggested and considered.
10.69 The three most practical options for consideration are:
Option 1 – make no change to the funding standard.
Option 2 – base the funding standard on long term expected returns, but leave the current wind-up entitlements unchanged.
A variation of this scheme has been suggested, which is
Option 2.1 – change the funding standard for
large defined benefit scheme members.
Option 3 – change the wind-up entitlements for defined benefit scheme members. This would result in the funding standard being reduced.
Option 1 - Make no change to the funding standard
10.70 The first option is to leave the funding standard unchanged. The justification for this proposal would be the view that the current standard achieves an appropriate balance between reasonable funding and member security given the current level of defined benefit provision. There would also be a view that the problem for defined benefit schemes is not the funding standard, but the affordability of the benefits provided, and that any change to the standard will have no effect on the contribution rate or sustainability of the great majority of schemes.
10.71 Additional comments that can be made about the current standard are:
l There is a view that the entitlement of pensioners to the annuity cost of their benefits is unsustainable given the increasing cost of annuities and increasing life expectancy. The present obligation
allied to the present pensioner priority means that pre-retirement members are effectively providing security for such members;
l Many believe that the present funding standard is unsustainable and must be changed, and that the current standard is inappropriate for employer-sponsored arrangements. In particular, they say that the standard obliges employers to tie up capital inaccessibly in pension funds rather than being able to retain it productively in their business;
l The funding standard is intended to be a balance between the sustainability of the scheme and the security of members’ benefits. It seems almost certain that the security of these benefits is already considerably less than many members assume: any further reduction should not be made without a genuine public discussion;
l The EU Directive on the activities and supervision of institutions for occupational retirement provision (IORPs) states in Article 15 that technical provisions (i.e. liability amounts) must be sufficient for ‘pensions… already in payment… to continue to be paid’. This can be read to require an annuity based standard;
l Although wind-ups of defined benefit schemes have been rare in recent years, they are likely to become more common, not least because of the increasing cost of the scheme benefits irrespective of the funding standard and the effects of FRS17. It is therefore not appropriate to lessen the security of members’ benefits to ease a standard which is not going to be the primary cause of scheme closures. In the event of such a wind-up, it would be difficult to justify why members are receiving less than they would have, had the standard not been changed.
Option 2 - Base the funding standard on long term expected returns, but leave the current wind-up entitlements unchanged
10.72 Under this option, the rate of return used in the funding standard calculation would not be the current combination of pre-

1�1
GREEN PAPER ON Pensions
retirement equity and fixed rate returns and post-retirement fixed interest returns, but instead would be an estimate of the long-term investment return. In the event of a scheme winding-up, the entitlements of members would be exactly as under current legislation and guidance: pensioners would be entitled to the annuity purchase price of a replacement pension, and the transfer values of other members would also be based on current rather than estimated long-term bond rates.
10.73 Were this option implemented, there would be no obligation on a scheme to fund beyond the funding standard even if the cost of providing benefits on wind-up were known to be higher.
10.74 There is a wide range of possible rates that could be used with this standard. The most conservative would be an assumed long-term bond rate. The current professional guidance by the Society of Actuaries in Ireland sets a long-term assumption rate of 4.5%. Alternatively, a higher rate of return assumption could be used for all calculations – 7% is one rate that has been suggested. Such a rate would reduce funding standard liabilities by over 20% in most cases and by more in some.
10.75 In current conditions, the effect of this change would be to reduce the funding standard liabilities for all schemes, and therefore there would be a reduction in contribution rates for some schemes.
10.76 It would be important to be aware that in different circumstances, the effect of this approach could be to set the funding standard higher than it would be if current rates were used. It is reasonable to expect that some of the time, expected long-term returns would be lower than current returns. A funding standard should be as stable as possible in all predictable conditions, so this approach should be adopted only if this aspect is acceptable.
10.77 The adoption of this funding standard would have a number of effects on transfer values:
(a) For any particular member, the amount of a transfer value payable immediately would differ from the funding standard liability for that member. The payment of a large
number of transfers (or a single transfer value that represented a significant proportion of scheme liabilities) would have a considerable impact on the funding status of the scheme;
(b) Because immediate transfer values would differ from the funding standard calculations, it would no longer be appropriate to adjust the transfer values to reflect the funding standard of the scheme, although some adjustment (albeit considerably more complex) might be required.
10.78 This proposal separates the funding standard from the wind-up obligations in order to reflect the fact that scheme wind-ups are relatively rare. The funding standard is therefore based on the assumptions that typically underlie an ongoing valuation. It would be necessary to put in place regulations limiting the discretion allowed to schemes in choosing these assumptions. It is the Pension Board’s experience that without such regulations, the range of potential assumptions and valuation results would be very wide.
10.79 The current and any alternative standard has advantages and disadvantages, and these must be considered before finalising a recommendation. Among the comments that can be made about this option are:
l Because scheme wind-ups are rare, many consider that a funding standard based on annuity wind-up costs is inappropriate: the standard should instead be based on the expected long-term cost to the scheme. This option is one such standard;
l Some hold the view that the Irish annuity market is inappropriate as a basis for a funding standard. However, changing the funding standard while retaining the obligation to buy annuities in the event of a wind-up is believed by some to be a reasonable compromise between scheme sustainability and pensioner protection;
l If the funding standard for pensioners is lower than the wind-up entitlement then the security of pre-retirement members is affected and also becomes much more

1��
GREEN PAPER ON Pensions
volatile and less predictable;
l Separating the funding standard from the wind-up values risks giving a misleading impression of the financial position of the scheme on wind-up, even if there is an obligation to disclose the estimated wind-up position. This model was used in other countries, but was changed as a result of problems that arose as a result of specific scheme wind-ups, where member benefits turned out to be less than members were expecting;
l If the pensioner standard is less than the annuity cost, this creates a significant incentive to schemes to pay pensions from the fund rather than buy annuities. This is often not an appropriate strategy for smaller funds, and results in the financial health of the scheme being significantly dependent on the longevity of specific individuals. Note that in the U.K. smaller schemes are obliged to buy annuities rather than pay pensions from the fund;
l Although recent wind-ups of defined benefit schemes have been rare, they are expected to become more common. Some are of the view that this is therefore not a good time to break the link between the standard and wind-up entitlements;
l One practical issue that might arise were this funding standard adopted would be that pension schemes would not be able to invest to match their funding standard liabilities. Any scheme that wished to eliminate the risk of failing the funding standard would be unable to do so.
Option 2.1 - Change the funding standard for large defined benefit scheme members
10.80 It has been proposed that the funding standard for larger schemes only should be based on a long-term valuation approach. The two reasons suggested for this proposal have been:
l There is a view that, in the event of a large scheme’s sponsoring employer going bankrupt or abandoning the scheme, the scheme would in practice be run off as a closed scheme. This, it is suggested, would occur either because the trustees would aim to achieve better returns or because the annuity market would not have
the capacity to absorb a large number of pensions in payment; and
l Some are of the view that larger employers are more likely to survive longer and continue their scheme sponsorship.
10.81 This approach would need a definition of ‘large’. There is no one correct answer, but it is unlikely to encompass schemes with less than 100 pensions in payment. This would include less than 15% of defined benefit schemes, though obviously a considerable proportion of scheme membership.
10.82 For the schemes concerned, this approach is identical to option 2, discussed above. A number of additional points relevant to this specific proposal are:
l A number of large long-established schemes have failed the funding standard and are causes of special concern. Note that large schemes do not appear in general to be more at risk of failing the standard than average;
l There are differences of opinion about the capacity of the annuity market to absorb large tranches of pensions; and
l It is not certain that trustees would be willing to run off closed schemes as described above because of possible personal liability in the event of subsequent shortfalls.
Option 3 - Change the wind-up entitlements for defined benefit scheme members
10.83 Because the funding standard is based on members’ entitlements on wind-up, the funding standard can be reduced by reducing the value of these wind-up benefits. Such a reduction could be either (a) a reduction in the value of pension benefits, or (b) of pre-retirement benefits or both.
(a) Under this option, the entitlement of pensioners under a wind-up would not be the current annuity replacement cost, but a calculated value of their benefits. The funding standard would then reflect the fact that pensioner entitlements on retirement would be lower. If the pensioner funding standard is not to be based on

1��
GREEN PAPER ON Pensions
annuity rates, someone else must be given responsibility for setting the rates. Under this approach, if a scheme wound up, the amount provided to pensioners would not be enough to replace the income that they were receiving from the scheme before the wind-up.
(b) The wind-up benefits of pre-retirement benefits represent the actuarial value of the deferred benefits, allowing for statutory revaluation of those benefits until retirement. A reduction in these wind-up benefits would be achieved by a change in the prescribed basis for the actuarial value. Such a change would reduce the likelihood that the value could be invested to provide benefits equal to those that would have been provided by the scheme.
10.84 Schemes that fail the funding standard are considerably more likely to have pensions in payment than other schemes. A change to pensioner benefits is therefore more likely to achieve the objective of reducing the impact of the funding standard.
10.85 The impact of this change to the standard clearly depends on the terms of reference for the new pensioner standard, and there is a wide range of potential difference. If the only difference between the new and current standard was the elimination of some margins, there would be little practical effect. On the other hand, if the new standard prescribed significantly higher mortality and/or rates of return, the difference would be considerable.
10.86 As before, there are arguments that can be made for or against this option.
l Many consider that annuities are over-priced as a result of profit and lack of competition in the market and that it is not reasonable to link pensioner entitlements to such an arbitrary measure. On the other hand, there are those who believe that annuity costs other than index-linked annuities, are still a reasonable measure of the economic cost of providing pensions;
l A separate view expressed has been that, even if annuity rates reflect a fair price for a guaranteed lifetime payment, this level of guarantee is inappropriate and not economically viable for a voluntary employer-sponsored arrangement;
l The current standard, allied to the current conditions in the annuity market, result in the pre-retirement and especially active members of the scheme carrying the entire financial risk of shortfall, because they are last in the order of priority. Increasingly, it is possible that younger members would be better off as members of defined contribution schemes, even where the average contribution rate is lower: in such schemes at least they would be assured that the contributions made for and by them would be used only to provide their own benefits. Any funding standard that risks discouraging active membership is unstable in the medium term;
l The view has also been expressed that the entitlements of pensioners on wind-up to a replacement annuity should not be changed as they are the most vulnerable members of the pension scheme, are almost certainly dependent on their income from the pension scheme and in many cases, are not in a position to replace any lost income.
10.87 Were this approach to the funding standard adopted, there are a number of practical issues to be considered:
l One suggestion is that in the event of a scheme winding up with a surplus, this surplus should first be used to top-up pensioner benefits to the annuity buy-out value;
l It has been suggested that, in the event of a wind-up where pensioners are receiving less than the annuity cost of their benefits, they be allowed the option of taking their benefits as ARFs. Note that paying benefits as ARFs rather than pensions does not affect the funding standard or the solvency of a scheme: this is determined by the amount of the benefit rather than the form in which it is paid;
l If a scheme was wound-up having previously purchased annuities from an insurer for some pensioners, the question

1��
GREEN PAPER ON Pensions
would arise as to whether there should be claw-back of some of the value, as the pensioners’ entitlement would be less than the then value of the policies. It is very unlikely that the insurance company would be willing (or, under the terms of the annuity contract, obliged) to return any part of the value of the policy.
Criteria for change
10.88 It is appropriate in any consideration of a change to the funding standard to set out criteria against which such changes (or the retention of the current standard) should be judged. Among these criteria would be:
l Protection of member interests – the Pensions Act 1990 was enacted in response to a number of high profile cases where pension promises were made to employees but it turned out that there were not sufficient assets to provide for these promises. The funding standard is intended to provide security for scheme members in the event of scheme wind-up;
l Supporting defined benefit provision – there is general agreement that defined benefit is the most suitable form of occupational
provision from the employees’ point of view. The funding standard should not needlessly endanger defined benefit provision;
l Effectiveness – if the funding standard is reduced in order to encourage or protect defined benefit schemes, we should be confident that the proposed change will actually achieve its objectives in order to justify the consequent lessening of member protection;
l Simplicity – some potential changes to the standard could involve considerable regulatory change and additional compliance obligations on defined benefit schemes. The cost of such changes could in themselves add to the burdens on defined benefit provision.
Current Status of the Funding Standard Review
10.89 The Pensions Board has been asked by the Minister for Social and Family Affairs to examine the operation of the funding standard and plans to submit a report to the Minister in 2007. The views expressed in this Green Paper are also relevant to this process and will be examined by the Minister.
The Funding Standard
The funding standard was introduced in 1991 in order to set out the minimum assets that a defined benefit scheme must hold and what steps must be taken if the assets of the scheme fall below this minimum. Before 2000, very few schemes failed the funding standard because of high investment returns and low revaluation liabilities. However, between 2000 and 2004, many schemes failed the standard due to a fall in investment returns and a sharp decline in long-term interest rates. There has been an improvement in the situation recently, reflecting the progress of equity markets since 2003. There is now a divergence of views about the standard: some believe that the number of schemes failing the standard is a sign that the standard is too high: others believe that the standard is appropriate or even too low, and that schemes’ failure to meet the standard is a result of increases in longevity and lower expected future yields.
The operation of the current funding standard comprises two elements: (i) the preparation of an Actuarial Funding Certificate (AFC), which compares assets of the scheme with the liabilities, calculated on a specified basis, and, (ii) if the AFC shows a shortfall, the preparation of a funding proposal, designed to eliminate the shortfall over an agreed period.

1��
GREEN PAPER ON Pensions
The funding standard does not determine the cost of a DB scheme. This cost is determined by the benefits provided by the scheme, the investment returns earned and the experience of the scheme in terms of the actual salary of the member at retirement; the rate of price inflation during the course of pension payment (if payments are inflation linked); demographics, i.e. how long will the member live while in retirement and, if there is a spouse’s pension, how long the spouse will live and the fact that pension funds have acquired much higher commitments on wind-up. Schemes are also faced with higher annuity costs. The cost is also determined by the impact of the FRS17 accounting standard (which obliges employers to show the amount of their pension commitments (liabilities) compared to the amount of the scheme assets (fund) and to disclose the net difference in their annual accounts). The funding standard as a wind-up standard obliges schemes to aim to hold assets that would be enough if the scheme wound up to meet the scheme’s accrued liabilities. There is an issue in relation to the priority given to pensioners and non-pensioners in a wind-up situation.
Options include:
1. Make no change to the funding standard;2. Base the funding standard on long-term expected returns, but leave the current wind-up
entitlements unchanged;2.1 A variation of this scheme has been suggested which is to change the funding standard for large
DB scheme members; and3. Change the wind-up entitlements for DB scheme members. This would result in the funding
standard being reduced.
Finally, the Pensions Board has been asked by the Minister for Social and Family Affairs to examine the operation of the funding standard and plans to submit a report to the Minister in 2007.
Questions for consideration1. Are there any particular difficulties with
the funding standard? If so, what are these difficulties and what implications do they have in your opinion?
2. Should the funding standard be based on long-term expected returns, but leaving the current wind-up entitlements unchanged?
3. Should the link between the funding standard and wind-up entitlements be broken?
4. Should the funding standard remain unchanged?
5. Should the benefit entitlements underlying the funding standard be reduced in value, thereby reducing member entitlements in the event of a wind-up happening, as compared with the current standard?
6. Should the funding standard be changed for large DB schemes only?


CHAPTER 11
annuiTies and relaTed issues

1��
GREEN PAPER ON Pensions
Introduction
11.1 An annuity is a contract sold by an insurance company that provides guaranteed payments at specified intervals for the duration of the purchaser’s lifetime in exchange for an up-front cash lump sum. Upon retirement, the bulk or all of the lump sum is used by the individual to enter into a contract with an insurance company. Variations on this basic model are common but the essence of any arrangement is that the purchaser of the annuity converts his/her savings into a guaranteed income for life.
11.2 Annuity contracts are a well-established feature of the pensions landscape and are likely to remain so. Notwithstanding their advantages, there has been considerable discussion as to whether the market for annuities is operating efficiently and effectively. A perception that annuities are very costly and other factors, including the operation of the Funding Standard (FS) for defined benefit schemes, which is linked to the cost of annuities, have led to proposals for the State to play a more active role in this area. Calls have also been made to extend the availability of certain alternatives to purchasing an annuity.
11.3 This chapter considers the factors affecting the price of annuities. It also examines the role of annuities in the supplementary pension system, the advantages and disadvantages of the alternatives and the issue of ‘annuity purchase’ whereby schemes pay pensions directly from the resources of the fund. It also considers suggestions for a role for the State in the provision of annuities and ways in which the operation of the annuity market may be made more effective.
Annuities – what they are and how they operate
11.4 Pension annuities provide a secure means of converting pension savings into pension income and avoid the danger that pensioners could exhaust their pension savings in their lifetime.
11.5 The longevity and investment risks for those purchasing annuities are ‘pooled’. In essence, this means that people who live longer can expect to receive more than the capital used to purchase the annuity while the capital of those who die shortly after purchasing an annuity effectively enhances the returns for those who live longer. Annuities come in a wide range of types: they may be fixed or escalating with a fixed rate of increase or index linked and may cover single or joint life. In addition, a guaranteed period may be purchased – for example, an annuity may be guaranteed payable for a minimum period in any event i.e. whether the annuitant survives the minimum period or not. Around 90% of annuities sold in Ireland are either level or have fixed increases. The purchase of an annuity is a once-off decision. The terms of the contract are fixed at the moment of the agreement between the purchaser and the company providing the product.
11.6 The price of an annuity depends among other things on the particular type of product sought. Clearly, an annuity income which is guaranteed to rise in line with inflation will always cost more than an annuity which delivers an unchanging stream of income. The same is true of an annuity that covers two lives as opposed to a single life. Price also depends to a significant extent on bond rates and on the life expectancy of the purchaser at the time of concluding the contract. On average, women live longer. Therefore, women (and younger retirees) will always receive less by way of an income in any given period from any given volume of savings than men and older retirees. As in any market situation, there may be some degree of price variation between providers at any point in time.
11.7 Purchasers of annuities include:
(i) holders of personal pensions who do not wish, or are not eligible to take their retirement funds in cash or invest in Approved Retirement Funds (ARFs);
(ii) trustees of defined contribution (DC) schemes when scheme members retire (retiring members of defined contribution

1��
GREEN PAPER ON Pensions
schemes are allowed to take a tax free lump sum of up to 1.5 times pay subject to a (current) limit of €1.29m - most opt to take the maximum lump sum; members are obliged to use the balance of their pension fund to purchase an annuity;
(iii) trustees of defined benefit (DB) schemes who do not wish to carry post-retirement life expectancy risk in relation to individual pensioners.
Is the annuity market working well?
11.8 In keeping with the Government’s aim of encouraging people to plan properly for their retirement, it is important that the annuity market serves its customers as effectively and efficiently as possible.
11.9 Under Towards 2016, the Government agreed to engage with employers and trade unions in a process to be supported by appropriate expertise, and taking account of the reports of the Pensions Board, and of the operation of the annuity market, in the context of its formulation of a comprehensive approach to future pensions policy. As part of this process, an independent study of the Irish annuity market was commissioned, to evaluate its efficiency and effectiveness. The material presented in this chapter is consistent with what were expected to be the main findings of the consultant’s report.
The role of annuities in the overall provision of pensions
11.10 Annuities play an important part in the overall system of pension provision. It is estimated that over 52,000127 people are currently in receipt of annuity-based pensions and that approximately 239,000128 people are in defined contribution occupational pension schemes leading to the purchase of an annuity contract.
127 Source : Annual Returns to the Financial Regulator (2005)
128 Source : Life Strategies 2006
In addition, some 311,000129 people who have either personal pensions or PRSAs may also choose to purchase an annuity. In a report commissioned in the context of the National Pensions Review130, it was noted that total annuity premia amounted to some €230m in 2004.
11.11 Despite their significant role, annuities are not the preferred vehicle for securing a financially stable retirement for some. This may reflect the fact that the actual cost of purchasing an annuity has increased substantially over the last decade and, more recently, the availability of alternatives such as Approved Retirement Funds. There have been two significant factors behind the rising cost of annuities: increased longevity and declining interest rates.
11.11 As has already been noted, the price of an annuity depends to a significant extent on the assumed life expectancy of the purchaser. Rising life expectancy will increase the cost of securing a lifetime income. This factor alone has added around 20% to the purchase price of an annuity contract since the mid 1980s.
11.13 It is important to distinguish between the factors which have pushed up the price of annuity contracts. The longevity factor represents a long-term structural change. Improvements in life expectancy have in the past been consistently underpredicted. Further longevity-related increases in the cost of the annuity contract are widely believed to be likely. The interest rate factor is perhaps more of a cyclical phenomenon. However, while changes in long-term interest rates affect the nominal price of the annuity contract, they do not necessarily affect its real price. This is because long-term interest rates are supposed to reflect future inflation rates. To the extent that this is true, reduced annuity amounts should be offset by the fact that fixed annuities should maintain their real value for longer. However, this may not always be perceived by the purchaser of the contract
129 Source :Life Strategies 2006
130 A report on possible State involvement in second pillar provision was commissioned from Hewitt Associates Limited as part of the National Pensions Review.

1�0
GREEN PAPER ON Pensions
and when this is so, falling interest rates will diminish the attractions of the annuity contract.131
11.14 Increased life expectancy and the decline in bond rates have combined to create a perception that annuities have become increasingly poor value for money. Even if this perception is not perhaps well founded in reality – increased longevity means that the income stream will be enjoyed for additional years and a low-inflation environment means that the value of the income stream is not eroded as quickly by inflation as it would have been in the past – it is possible that these factors are combining to reduce the appeal of annuities.
Alternatives to annuities
11.15 In recent years, the State has facilitated the development of additional approaches to pension provision. Until 1999, all pension scheme members with an accumulated pension fund were allowed to take a tax free lump sum and were then obliged, as a condition of the tax relief they had received, to use the balance of the fund to purchase an annuity. The Finance Act 1999 removed this obligation in the case of proprietary directors, the self employed and certain others and introduced new retirement options for these groups. These options allowed those retirees to cash in their accumulated savings immediately (subject to tax as appropriate) or to invest in an Approved Retirement Fund (ARF) or an Approved Minimum Retirement Fund (AMRF).
11.16 The Finance Act 2000 extended the new retirement option to employees’ additional
131 Research presented in a Consultative Document – “Modernising Annuities “ – which was produced by the Department of Work and Pensions in the UK in 2002 showed that lower inflation can actually help to maintain the real value of retirement incomes. The report also showed that over the period in question (1986-2001) even though nominal annuity rates had fallen in the UK , the investment growth of pension funds had tended to more than compensate for falling annuity rates. This experience of course relates to one particular period and may not always be the reality.
voluntary contribution funds. Similar options were made available to holders of PRSAs, which were introduced in 2002.
11.17 There is considerable scope for variation on
the investment content of an ARF. An ARF can be invested in a variety of ways including in cash, in shares or held with a life company. It can be used to provide an income during retirement or it can be held and passed on to dependants.
11.18 These flexible options are not generally available to members of defined contribution schemes (except to proprietary directors). Such members are still obliged to use the balance of any fund to purchase an annuity. The undoubted advantages of annuities and the risks attendant on the alternatives notwithstanding, there is evidence of some demand for broadening the access to the ARF vehicle. The relevant report132 included in the National Pensions Review noted that the annuity market in Ireland has not grown in recent years and attributed this primarily to the introduction of ARFs.
11.19 In choosing between annuities and such other forms of pension provision such as ARFs, where such choice is available, factors other than price come into play. One such factor is control. Once the purchase price is handed over to the insurance company, the individual generally has no further access to his/her pension savings and none can be passed on to the individual’s estate. If given the option, it is possible that many members of defined contribution schemes would choose to take their retirement fund in the form of a cash lump sum or invest in alternatives.
11.20 However, to retain the retirement fund as a lump sum may be to overlook the many advantages for the individual which a guaranteed stream of income can provide over time. An annuity ensures an income regardless of how long the purchaser lives, thereby reducing the need for any subsequent income support from the State. Alternatives to annuitisation may involve the adoption of complex investment and withdrawal
132 Hewitt Associates Report on Possible State Involvement in Second Pillar Provision

1�1
GREEN PAPER ON Pensions
strategies, taking account of matters such as life expectancy. Over time, this could become very onerous, particularly as a pensioner increases in age. There is also the possibility of outliving one’s pension assets. Pensioners may also find that their income falls – for example, if the investment performance of their fund has been poor, or if annuity rates have fallen. In such circumstances, a pensioner may find, if he/she eventually decide to buy an annuity, that it yields a lower income than if he/she had bought one sooner. Other factors include the perception of life expectancy, which can tend to be underestimated by individuals, and returns from ARFs, which may be overestimated. The alternatives may be particularly unsuited to holders of small pension funds in view of their likely inability to cope with fluctuations in income and capital deriving from investment performance.
Annuity Purchase
11.21 Traditionally, larger defined benefit occupational pension schemes have paid pensions directly from the resources of the fund while smaller schemes purchased annuities from a life office. The reason for this was that larger schemes were better placed to take on the longevity risk - the more members there were in a scheme, the more likely it was that the longevity experience would average out. Some schemes may also have had a particular mortality experience that could be factored in when calculating the liability (for example, due to the type of work being carried out by the members).
11.22 Towards the end of the 1990’s, schemes,
irrespective of their size, became more likely to pay pensions directly from the fund. This arose for a number of reasons. Firstly, when interest rates were low, annuities were perceived to be “expensive”. Schemes were also more likely to factor in that they were achieving investment returns of the order of 20% per annum and would have considered that purchasing an annuity yielding 5%-6% per annum did not make financial sense. Furthermore, there was a certain lack of clarity about how scheme liabilities should
be calculated for the purposes of the Funding Standard and schemes would not necessarily have valued the liabilities by reference to the market annuity price.
11.23 Pensions Board data based on a survey undertaken in 2004, showed that out of 226 schemes surveyed, only 28 were not paying pensions directly from scheme resources. Those 28 schemes either purchased annuities from life offices or did not have any members who had reached retirement age.
11.24 However, according to industry sources, the
situation may be changing somewhat as interest rates have risen. Although annuity prices have not fallen, they have stabilised. There appears to be some evidence that schemes are becoming more likely to begin purchasing annuities again, although larger schemes are always more likely to pay pensions directly.
Future of the annuity market
11.25 While it is not possible to say with certainty, there are reasons to believe that annuities may continue to play a central role in the pensions market. An ageing population with an interest in the maintenance of pre-retirement living standards in retirement can be expected to present a strong incentive for the financial services industry to meet that demand with competitively priced products suited to consumer’s needs. Factors likely to support such growth include:
l A projected large increase in the number reaching retirement – the number reaching age 65 is projected to increase by around 100% over the next 20 years;
l An increase in the proportion of those reaching retirement who have individual pension funds;
l A steady growth in the number of older pensioners; annuities may be seen as relatively attractive to older pensioners (but penalty for delaying);
l A decline in the proportion of persons reaching 65 with only DB benefits.

1��
GREEN PAPER ON Pensions
The role of the State in relation to annuities
11.26 The State is already heavily involved in annuities through its regulatory role and through the generous tax concessions afforded to individuals in accumulating their retirement savings. There has been some discussion as to whether the State should seek to become more directly involved in the annuity market. This issue has arisen for a number of reasons, one of which has no direct link to annuities as such. Rather, it arises from the impact of the Funding Standard (FS) on the financial position of defined benefit schemes.
11.27 The rationale behind the FS is to ensure that a pension promise is backed by sufficient assets, which the FS tests periodically. If the pension scheme fails this test, a plan to return the scheme to a required level of funding is drawn up and submitted to the Pensions Board for approval.
11.28 In assessing the liability of the scheme in respect of accumulated pension rights, the scheme actuary is required to use the market cost of purchasing annuities to meet those liabilities.
11.29 As set out in Chapter 10, economic and financial developments and the exceptional fall in global equity markets in 2000-2002, have had an adverse impact on the value of the assets controlled by a number of defined benefit schemes in recent years. Falling asset values mean that in the event of a wind-up, scheme trustees have a reduced volume of assets available for conversion into annuities. This immediately places pressure on schemes’ ability to meet the FS. On the other side of the equation, annuity costs have risen primarily because of the longevity and interest rate trends discussed above. As the FS assesses schemes’ ability to purchase annuities, the rising cost of annuities puts further pressure on the wind-up position of the scheme. This double impact from lower asset values and increased liabilities pushed some defined benefit schemes into a situation where they would be likely to fail the FS.
11.30 Responses to this development included calls for the FS to be relaxed and suggestions that the establishment of a State Annuity Fund could help address the situation. The Pensions Board in their December 2004 report “Review of the Funding Standard” reviewed the Standard and examined possible alternatives. The Pensions Board recommended that the current Standard be continued. The Board also recommended that the introduction of a State Annuity Fund, which would be available to schemes that are wound up, be explored thoroughly because of potential beneficial effects on the FS. The Report by the Board in December 2004 contained arguments for and against the establishment of a State Annuity Fund and these are reproduced at Appendix G.
11.31 The FS is currently being reviewed again by the Pensions Board. A relevant factor will be the impact that rising bond yields and the upturn in international financial markets have had on typical asset values since the last review was undertaken. Since the beginning of 2006, bond yields have risen from about 3.7% to about 4.6% currently. This, in combination with continued strong asset returns, has begun to ease the funding position of schemes.
11.32 It is important to recognise that the FS does not determine the cost of a defined benefit scheme. The cost is a function of the benefits provided by the scheme, the investment return and the actual experience of the scheme members – salary increases, the numbers who remain until retirement, the cost of providing pensions etc. The key cost drivers are investment returns, long-term interest rates and significantly increased longevity. A change to the FS will assist defined benefit schemes only if contribution rates reduce as a result of the change. It has been estimated by the Pensions Board that the contribution rate is influenced by the FS in less than 15% of defined benefit schemes. Even in these cases, the contribution rate is likely to be determined in many instances not by reference to the FS, but by FRS17, an international accounting standard which dictates how pension costs and liabilities must be treated in the accounts of public companies.

1��
GREEN PAPER ON Pensions
11.33 Given the range of factors impacting on the funding liabilities of defined benefit schemes, the extent to which a State Annuity Fund could actually make a difference may be open to question.
11.34 Chapter 9 of the National Pensions Review (NPR) published in January 2006 dealt with possible state involvement in second pillar provision. As noted above, a report was also commissioned on this topic and was included as an appendix to the NPR. An issue considered in both reports was the possibility of the State becoming directly involved in the annuity market. A broad proposition explored was whether the State could, on a cost-neutral basis, provide cheaper annuities than those currently available from private sector suppliers.
11.35 Two separate proposals were put forward in this regard:-
(i) the State would provide annuities to members of DB schemes in the case of involuntary wind–up; and
(ii) the State would provide annuities to holders of small pension funds.
11.36 A third and related proposal was whether the holders of small PRSAs and similar funds could enhance their State pension rather than purchase an annuity from a commercial provider.
11.37 The report concluded that the introduction of such supports was unlikely to have any significant impact on increasing pension coverage or adequacy.
11.38 Advantages and disadvantages of the two proposals at paragraph 11.35 above are considered further below.
Advantages l a potential saving in administration costs
and no requirement for profit margins;
l the State’s life expectancy assumptions would not be as expensive as those made by commercial insurers;
l future investment returns that the State could anticipate could be higher than the bond returns assumed by insurers;
l the State already has a major role in paying pensions;
l there would be no requirement for solvency margins, that is to maintain a reserve, (which commercial insurers are obliged to maintain to provide security for policyholders);
l the State would be incurring extra risk, but would not need to charge for it, as the quantum would be small in relation to the life expectancy risk already borne in regard to public service and Social Welfare pensions.
11.39 In summary, the case made that the State could provide ‘cheaper’ annuities than the private sector is based on the assumption that the State has greater investment freedom, that it would be more “realistic” in its assumptions, it would have no need to make a profit, that it is more efficient in terms of administration, or that it does not require as much capital as the private sector.
Disadvantages11.40 If any annuity scheme were to be structured
on a self-financing basis, there may be difficulties with many of the assumptions made in its favour, viz:
l there is no basis for the contention that the State’s life expectancy assumptions should be any less cautious than those of the market generally;
l annuity prices reflect low interest rates and increased longevity. They also reflect a certain attitude to risk. These issues would face any annuity provider, including the State. In order to assume higher investment returns than the private sector, the State would have to invest in a higher risk portfolio than the private sector. While such investments have historically delivered a higher return, in the long run, there can be no certainty that this will always be the case. Further, even within a long-run period where equities may be expected to outperform bonds, there may well be periods, sometimes quite protracted, where this will not be so. In recent times, there has been ample evidence of significant stock market

1��
GREEN PAPER ON Pensions
volatility. In the context of the pressure on the State to manage its budgets in an annual framework, it would be risky to envisage returns that could be based on a rate higher than bonds;
l the administrative costs would be significant. For instance, the State would have to make appropriate arrangements to handle annuities and would either employ a private sector contractor (who would have to have similar margins to that obtaining in that sector at present) or work through a public service body (in which case, it would be necessary to recruit expensive actuarial, financial and economic expertise);
l being operated under the auspices of the State, it would be unrealistic to assume that the Fund would not be subject to intense pressure to pay pension increases (even where they were not guaranteed under the original scheme);
l it would be difficult to contain the availability of a State Annuity to any original target group. If any such arrangement was introduced as a social protection measure, there would likely be calls for its further extension and moves to generalise such a measure. As well as assuming more risk, this would dilute the social targeting implicit in the original measure;
l a State Annuity in competition with the private sector could raise State aid issues133;
l the ability of the State to enter a private market on favourable terms may be contested by existing service providers. On the other hand, if a State Annuity Fund was established on terms which were significantly more attractive from the risk standpoint than existing providers, there is a possibility that the private sector would be incentivised to transfer their risk to the Exchequer;
133 Article 87 of the EC Treaty prohibits State aids to undertakings unless the approval of the European Commission has been obtained or unless the aid in question has been exempted from the obligation to give prior notification to the Commission. The concept of State aid covers any use of State resources, including the giving of a State guarantee or a decision by the State not to take a profit from a State undertaking which a private investor would have taken.
l finally, the State already bears much of the “longevity risk” in the economy through its role in relation to State pensions, public service pensions, healthcare and social services etc. A State Annuity Fund would increase this exposure.
11.41 A related proposal examined in the NPR was that holders of small PRSAs and similar funds could enhance their State pension rather than purchase an annuity from a commercial provider.
11.42 It was contended that the proposal could be implemented on a cost neutral basis and would be likely to provide good value in comparison to commercial annuities because:
(i) it would provide certainty of real income increase, whereas no provider currently offers an annuity fully linked to inflation or to Social Welfare pension increases; there is also a perception that index-linked annuities are very expensive;
(ii) annuities for small annual amounts are likely to be relatively poor value because of administration charges – in contrast, it is contended that the marginal cost to the State of administering the additional benefit would be effectively close to zero.
11.43 However, the concerns expressed about investment and longevity risks also apply here, albeit to a lesser extent. As with the proposals above, there would also be concerns about its legality under EU law.
11.44 If it were to be decided to establish a State
Annuity Fund, the following questions would need to be addressed:
l Eligibility
l Funded
l Investment Risk
Eligibility11.45 Since a benefit would be conferred, because
the State is presumably absorbing investment risk, operational expenses, longevity risk or some combination of these, the issue arises as to the extent to which such a benefit should apply. Possible limits on eligibility could include a maximum annuity income of 30% of the average industrial wage, or a maximum
1��
GREEN PAPER ON Pensions
investment (lump sum) of €200,000. In reality, it could prove difficult to operate an annuity option that was available only to a certain group or in specified circumstances. Depending on the level of implied subsidy and/or risk taking by the State, it seems inevitable that any restrictions on eligibility would be strongly tested. This potential difficulty was noted in the relevant report commissioned as part of the NPR: “It would in reality be difficult to contain a more favourable SAF annuity option to a small defined group or specified circumstances, such as the involuntary wind up of funded defined benefit schemes. If it were to spread to all potential purchasers of annuities it would eventually remove virtually all commercial annuity providers from the marketplace.”
Funded11.46 If operated on a pay as you go basis, no ability
would exist to track either how cost or risk neutral the operation of the fund would be over time. Even if notionally funded, receipts and expenditures would be basic prerequisites to establishing costs, as would estimates of the evolution and expected value of liabilities. Even though funding would not be obligatory, funding and funded status would be very important inputs in order to establish cost neutrality.
Investment Risk 11.47 Cost depends on many factors, including on
the amounts involved and on eligibility. If the proposed fund were universal, in a steady state environment where the State’s offer was attractive, some 35,000 individuals per annum on average could invest lump sums (based on a labour force of 2 million with 70% participation and a 40 year working life). Assuming an average lump sum of €50,000, this would amount to annualised investment of €1.75 billion (of the same order as the National Pensions Reserve Fund), and a total eventual fund size in the €20 – 30 billion range. If the fund were invested in equities, there would be a significant probability (approximately 25%) of a loss in any one-year of operation, and a probability of 15% that such a loss would exceed €2 billion.
Conclusion
11.48 When investment and longevity risks are fully factored in, it may not be possible for the State to offer annuities at rates that are much better than those currently available from commercial insurers. It has been suggested that the State should take a different view of market and longevity risk than private providers, but it is not clear that this would be appropriate, especially given the State’s broad exposure to longevity risk within the economy.
11.49 The establishment of a State Annuity Fund was originally proposed in a comparatively narrow context to deal with situations of involuntary wind-up of defined benefit schemes or to address particular groups of clients. Calls for State annuity provision have broadened beyond this context. The arguments for the State to become directly involved in the provision of annuities and the broader implications of any intervention by the State deserve attention and critical examination. However, there is no evidence to suggest that there is any fundamental failure in the annuities market or that annuities are significantly overpriced. The difficulty of confining any particular arrangement to any original target group must also be recognised.

1��
GREEN PAPER ON Pensions
Annuities and Related Issues This Chapter considers the operation of the annuity market, the factors determining the price of annuities and the role of annuities in the supplementary pension system.
Annuities provide a secure means of converting pension savings into pension income and avoid the danger that pensioners could exhaust their pension savings before dying. Despite their advantages, there has been debate as to whether the market for annuities is operating efficiently and effectively.
There are reasons to expect that demand for annuities will grow in the future, though this is highly sensitive to policy developments, particularly in relation to any extension of the option to invest in an Approved Retirement Fund (ARF). Certain groups are required to use their retirement funds to buy an annuity while others are allowed the option to convert their pension savings into an ARF. There have been calls for more flexibility in relation to the options available to those obliged to purchase an annuity.
In choosing between an ARF and an annuity, many factors need to be considered including price, charges, control and risks. Many would likely prefer to retain control over their funds by means of an ARF rather than buying an annuity. However with an ARF there is the risk of outliving one’s pension assets since life expectancy generally tends to be underestimated by individuals. Prospective returns from ARFs may also be overestimated. ARFs may be particularly unsuited to holders of small pension funds in view of their likely inability to cope with fluctuations in income and capital deriving from investment performance.
The Chapter also outlines the role of annuities in relation to defined benefit occupational pension schemes and considers suggestions that the State should become a provider of annuities in certain circumstances. It cautions that the broader implications of a ‘State Annuity’ deserve careful attention and critical examination and questions whether it would be appropriate in view of the State’s existing exposure to longevity risk within the economy. Finally, some questions are raised in relation to the State’s potential role in improving the functioning of the market for both providers and purchasers of annuities.
Questions for consideration
1. Do annuities offer value for money?
2. Should DC holders continue to be compelled to buy an annuity at the precise moment of retirement or should they be allowed some flexibility in timing? Should PRSA and other personal fund holders continue to be allowed to avoid annuitisation and to continue to hold their retirement funds until death?
3. Should the State be more involved in the annuity market and, if so, in what way? Is it appropriate that the State takes on the additional risk involved in the form of a State Annuity Fund?
4. What measures could be introduced to assist individuals to recognise annuity terms that they may find satisfactory?
For example:
l Are there steps which could be taken to better inform customers in relation to the comparative cost of annuities?
l Should providers be obliged to inform a prospective purchaser that their annuity can be bought from a different provider?
l Should measures be introduced to encourage people to look at alternatives to fixed single life annuities?
5. How can the market for annuities be encouraged to diversify and become more competitive? Can measures be taken to encourage new entrants to enter the market?
6. In what ways can employers and trade unions be more proactive? Can more information be provided about annuities and the options available when employees are coming up to the point of retirement?

CHAPTER 12
The role of regulaTion

1��
GREEN PAPER ON Pensions
Introduction
12.1 The first half of this chapter discusses pension regulation and the role of regulation in:
l Providing confidence and security;
l Supervision of pensions:
l structures,
l objectives, and
l role of the State;
l Governance, disclosure and the particular regulatory needs of different pension scheme designs;
l The provision of information on pensions; and
l The move to risk-based supervision.
The second half of the chapter discusses the issues of charges on pension products.
Role of Regulation
Confidence and security – State role12.2 The main reason the State establishes
systems of regulation in any area of activity is to provide confidence and stability in that system. The State may also intervene where markets are not operating efficiently (including protecting consumers from unequal relationships).
12.3 In pensions systems, the providers of products have much more knowledge of the products than consumers. One aspect of regulation is to ensure that the providers give sufficient information to the consumers in order to make the balance more equal and to allow consumers to make informed choices. As pensions saving involves providers investing other people’s money on their behalf, it is important that those people can be confident that the system is secure, and more to the point, that their own savings are secure.
12.4 The State ensures that sufficient levels of confidence and security exist in the pensions system by intervening through legislation or other means to ensure standards are put in place and monitored. While the State is responsible for putting legislation in
place which sets the standards, it normally establishes a separate body to monitor those standards.
Supervision of pensions: structures12.5 Regulatory objectives are not achieved merely
through legislation/regulation but through the existence of a regulatory agency with the powers to detect breaches and enforce obligations. The following are the agencies responsible for various aspects of pension supervision:
Authority Responsibility
Revenue Commissioners
All taxation issues, including maximum benefits and some investment aspects of ARFs and small self-administered schemes
Financial Regulator
RACs, buy-out bonds and annuities
Pensions Board Most Pensions Act aspects of occupational pensions and PRSAs
Equality Tribunal
Equality provisions of the Pensions Act
12.6 The distinction should be noted between the regulation of pension schemes and pension scheme assets. Many pension schemes and ARFs invest in financial products such as insurance policies or investment products. These products are usually supervised by the Financial Regulator, but are not themselves pension vehicles.
12.7 Where pension savers believe that their pension savings have been mismanaged in some respect, there are two statutory ombudsman systems in place. For annuities, most RACs, and buy-out bonds, the Financial Services Ombudsman has jurisdiction, and for occupational pensions and PRSAs, it is the Pensions Ombudsman. Note that for ARFs, any issues would be followed up through the appropriate channel relevant to the underlying investment.
12.8 The ombudsman system can generally be used only where the pension saver has suffered financial loss because of maladministration.

1��
GREEN PAPER ON Pensions
Supervision of pensions: role and objectives
12.9 There are a number of reasons why the State should have a role in the regulation of the pensions system. Firstly, there are significant amounts invested in Irish pensions - an estimated €90 billion. This amount is effectively made up of the savings of individuals for provision of income in retirement. As these savings are of paramount importance to these individuals, it is right that they should be protected insofar as is possible. Furthermore, modern-day consumers expect that the State provides for effective regulation in many areas of consumer activity.
12.10 There are a number of ways that the State achieves this - such as ensuring tax reliefs are only granted where pension schemes are set up under trust. This ensures that practically all occupational pension schemes are established under trust and therefore the assets are separated from those of the sponsoring employer. Schemes must also produce annual reports and benefit statements for members within prescribed timescales. PRSAs are individual contracts between individuals and the providers. The PRSA product must be jointly approved by the Pensions Board and the Revenue Commissioners before it can be marketed. A Standard PRSA is also subject to a maximum level of charges.
12.11 Secondly, the State encourages individuals to take out supplementary pension provision. Therefore, it is in the State’s interest to ensure confidence and security in the system.
12.12 Thirdly, the State invests significant amounts in the supplementary pensions system, both through the tax reliefs it grants and the provision it makes for its own employees. It is understandable that the State wants to ensure that controls are put in place to ensure that it is spending its money in an appropriate manner. This is largely achieved through putting rules in place as to how tax reliefs can be availed of. The State limits the amount of contributions that can be paid by individuals,
the size of funds that can accumulate and the benefits that can be paid.
12.13 Finally, the EU Pensions Directive (IORPs Directive) requires that schemes adhere to certain standards and requirements and that the State has effective means of ensuring that these are complied with.
Regulatory objectives
12.14 The following are the objectives of the regulation of all pensions:
l To ensure that savers receive the benefits to which they are entitled under the terms of their pension arrangement;
l To give those saving for retirement enough information to assess the adequacy of their pension provision;
l To ensure that monies contributed for retirement savings are not misappropriated and are properly accounted for;
l Where savers have investment choices under defined contribution arrangements, to provide enough information to make investment decisions;
l To ensure that tax reliefs available for pensions are used to provide appropriate pension benefits and are not abused;
l To provide pension savers (or trustees acting on their behalf) with enough information to decide whether or not to use that vehicle for retirement saving, particularly in respect of value for money; and
l To provide pension savers with the information they need to make specific decisions, for instance at retirement or on leaving employment.
12.15 The above objectives apply to all pension savings. There are additional objectives for group pension arrangements, where the savings of individuals are being looked after by trustees. These additional objectives are:
l For defined benefit arrangements, to ensure that the scheme is being funded at a rate that is appropriate to the benefits promised;

1�0
GREEN PAPER ON Pensions
l To make sure that the investments of the scheme are appropriate to the objectives and expectations of the scheme and its members; and
l To prevent discrimination in scheme access or provision.
12.16 There are some objectives which are specific to PRSAs as follows:
l Employers to provide access to PRSAs to ‘excluded employees’ who do not have access to other occupational retirement schemes;
l To impose a cap on charges on standard PRSAs.
12.17 Not all of the above objectives are as relevant to all forms of pension provision, or even within the same classes. For example:
l The amount of information provided to investors in ARFs varies considerably depending on whether the provider is a life insurance company or not;
l There are significant differences between the information provided to PRSA and RAC holders both at the point of initial investment and thereafter; and
l Whereas individual retirement savers have the opportunity to choose between competing providers of pension savings products, members of occupational schemes may be obliged to join arrangements.
12.18 The above examples are not intended to be exhaustive.
Regulation and pension scheme governance
12.19 At the end of 2005, there were over 93,000 active occupational pension schemes registered with the Pensions Board. In addition, there are over 53,000 frozen schemes (where contributions are not currently being paid but benefits are still held within the scheme).
12.20 As schemes are set up on a trust basis, there are trustees whose duty it is, under trust law,
to act in the best interests of the members of the scheme. This is a common law duty and can be enforced by members in the courts. Furthermore, the Pensions Act places further obligations on trustees. Any breach of these requirements is a criminal offence and the Pensions Board can, and does, prosecute such breaches.
12.21 Many of the duties of trustees are designed to ensure a proper level of governance of schemes. In particular, they provide that information is given to members, contributions are invested in a timely manner, proper records are kept, members can have a say in running the scheme and annual reports are prepared.
12.22 Trusteeship works particularly well in large schemes with professional trustees, trustees made up of members of the scheme representing employees and the employer or a combination of the two. These types of trustee arrangements tend to have formal processes and procedures in place, particularly around the structuring of meetings. Larger schemes also tend to have the resources to arrange for training and can obtain external advice where necessary. Even in such arrangements, the role of a trustee is becoming much more complex and time consuming and can be quite onerous for a non-professional trustee.
12.23 In medium and small sized schemes, the role of trustee is often taken on by the employer. This is not normally due to any particular desire of the employer to be trustee but more likely, particularly in smaller schemes, because that is the standard procedure of the provider selling the scheme. In most of these arrangements, the employer delegates the day to day administration of the scheme to a pension provider, broker or consultant. If the firm carrying out the day to day administration of the scheme fails to deliver, it may result in the trustees breaching the requirements of the legislation. In such a situation, the only recourse under the legislation is a criminal prosecution of the trustees. The Pensions Board has no power, at present, to take any action against the firm that caused the breach.

1�1
GREEN PAPER ON Pensions
12.24 In November 2006, the Pensions Board submitted a report134 to the Minister for Social and Family Affairs which looks at the issue of trusteeship and makes recommendations regarding these issues, with particular emphasis on trustee training and education and making administration firms more accountable. The key recommendations made in the report include:
l Pension scheme administrators should be registered and supervised;
l Service level agreements between trustees and administrators should be made compulsory. Guidance on the appropriate content of service level agreements should be introduced;
l Employers should automatically arrange trustee training for all trustees within six months of their appointment and at least every two years thereafter;
l The potential of new means of trustee training such as ‘e-learning’ should be explored;
l The trustee annual report should state what training has been received by trustees during the year;
l Trustee trainers should be encouraged to hold regional courses;
l The Pensions Board should have the power to appoint a trustee or authorise an administrator to carry out wind-up procedures, where appropriate; and
l Each scheme should have a copy of the Pensions Board’s trustee handbook, and a ‘trustee checklist’ should be appended to the next edition of the handbook.
12.25 Preparation for the implementation of these recommendations will be initiated in 2007, including the usual regulatory impact analysis undertaken in advance of legislative changes being examined.
134 Pensions Board (2006) Report of the Pensions Board to the Minister for Social and Family Affairs on Trusteeship
Regulation and disclosure of information
12.26 The number of schemes in existence, as outlined above, creates particular regulatory challenges. To date, emphasis has been placed on ensuring disclosure of information to scheme members to allow members to monitor the well-being of their own schemes. Initially, there was widespread non-compliance with the disclosure requirements but this has improved in recent years. While there are still some issues regarding information being produced on time it is, for the most part, being produced.
12.27 The effectiveness of provision of information to scheme members as a regulatory tool is debatable. For example, the preparation of trustee annual reports and audited accounts is a good discipline on the scheme but members only have to be notified that these are available on request.
12.28 Benefit statements must be provided to members on at least an annual basis and these give members information on the value of their benefits within the scheme. The provision of simpler and more understandable information to individuals may mean some trade offs in terms of loss of absolute accuracy and detail, but would be beneficial given that the shorter and clearer a document is, the more likely individuals are to read and understand it.
Regulation and different types of pension scheme
12.29 There are a small number of occupational pensions schemes that account for a large proportion of the total membership of all schemes. At the end of 2006, 134 occupational pension schemes had a total of 496,390 active members. Therefore, a very small proportion of the total number of schemes account for over two thirds of the total active membership. Concentrating resources on these schemes ensures an enhanced level of protection and security for the majority of members.

1��
GREEN PAPER ON Pensions
12.30 The vast majority of occupational pension schemes registered with the Pensions Board are schemes that only have one active member. There are over 70,000 active schemes that are designed only for one member. There are a further 11,000 schemes that currently only have one member. Almost all of these schemes are arrangements for proprietors and directors. Life offices also offer these schemes. Indeed, almost all new scheme registrations in recent years have been in this category. This is primarily a result of an increase in the attractiveness of pension arrangements for such individuals following the introduction of Approved Retirement Funds (ARFs) and the facility for one-member-only schemes to borrow.
12.31 From a regulatory point of view, these types of scheme have less need for a regulatory focus. This is because the individual members of these schemes have full control over the choice of firm to manage their investments and also as to how those monies are invested.
12.32 The remaining schemes, which are in the small to medium size category, are administered either by pension providers (insurance companies or banks) or brokers and consultancy firms. By concentrating regulatory resources and focus on these firms, rather than the individual schemes, the Pensions Board can target its resources where it can secure the most impact. Any issues that occur on any one scheme administered by a firm are likely to occur across all schemes administered by that firm. Therefore, improvements made as a result of the examination of one scheme can benefit all other schemes without need for individual examination of these.
PRSA Regulation
12.33 The legislative framework for PRSAs means that a proactive approach is adopted by the Pensions Board from the start when a provider is being assessed to produce, market and sell PRSA products. Thereafter, the role of the Board is one of a reactive supervisor to any individual issues that may arise that lead to a requisite enquiry. The approval process to become a PRSA Provider
is extremely detailed and is underpinned by the requirements that the provider must demonstrate its capability to carry on the business of producing, marketing and selling the product. When these capabilities have been demonstrated, the Board is in a position, jointly with the Revenue Commissioners, to approve the PRSA product. Regular reports are also submitted by providers in respect of their contracts sold and related assets.
12.34 A number of submissions to the National Pensions Review called for a reduction in the amount of regulation to which PRSAs are subject. Among the specific points made were:
l PRSA sales are subject to considerably more regulation than many non-pension investments, such as property or many banking or insurance contracts. The amount of this regulation does not seem to bear any relationship to the perceived risk of loss or misselling;
l PRSAs are subject to considerably more regulation, point of sale disclosure obligations and product supervision than any other pension product. In particular, it is notable that PRSAs are the only pension vehicle subject to product approval. Although this should result in a lower level of sales regulation, the opposite is actually the case.
12.35 In addition, it has been suggested that the PRSA fact-finding questionnaire at point of sale should be eliminated.
12.36 The administration and sales of PRSAs
are subject to regulation by the Pensions Board, the Revenue Commissioners and the Financial Regulator. The Board has a statutory responsibility for approving the product design and materials for supervising the ongoing compliance with the Pensions Act and for gathering data. The Revenue Commissioners also approve the product jointly with the Board, and are entitled to collect data from providers. The Financial Regulator has a statutory responsibility for supervising the sale of the products.
12.37 As set out in the National Pensions Review, PRSA providers have cited the regulatory burden as a significant contributory factor

1��
GREEN PAPER ON Pensions
to the low take-up of PRSAs to date. They say that potential savers find the compliance requirements discouraging. Intermediaries also find that the regulatory requirements make these products uneconomic to sell, especially for smaller contributions, which is where the PRSA was meant to be especially relevant.
12.38 The primary advantage of reduced regulation would be in the indirect incentive thereby provided for intermediaries and providers to make additional marketing and distribution efforts to sell PRSAs. This is consistent with the general view that pensions need to be sold - there is unlikely to be a significant self-motivated demand for pension savings products.
12.39 As well as providing additional incentives to those selling these products, a reduction in regulation would make the process less off-putting for those who are considering setting up a PRSA.
12.40 However, PRSA regulation undeniably reduces the possibility of someone starting or continuing a PRSA where it is unsuitable or not appropriate for their particular circumstances. Although this possibility may be small, any reduction in regulation will increase it. However, the Pensions Board do not see this risk as significant. Overall, a balance has to be maintained that is reasonable.
Regulation - raising awareness
12.41 Information on pensions is essential to fulfill three main objectives, i.e.:
i) To heighten pension awareness with a view to increasing pension coverage and to encourage those with pension provision to address the adequacy of that provision.
ii) To safeguard the rights of scheme members, whereby members must obtain information on their own personal entitlements to exercise the rights under the Pensions Acts to monitor the administration and financial soundness of their scheme.
iii) To ensure that households have sufficient information to make appropriate financial decisions, particularly to adapt their protection under defined contribution plans in the light of the shift from defined benefit provision.
Pension Awareness12.42 An independent survey conducted at end-
2005 for the Pensions Board confirmed that pension awareness is at a high level, with 87% of the respondents believing that the Social Welfare pension would not meet their needs in retirement. Reasons given as key barriers to starting a pension for most young people are the perceived lack of affordability, prioritisation of expenditure on more immediate commodities (e.g. house/holiday/car), perception of being too young to start a pension and lack of understanding about pensions.
12.43 The Government currently allocates €1 million towards the National Pensions Awareness Campaign, overseen by a project team which includes representatives from the Board, the Department of Social and Family Affairs, providers and the social partners. The periods with the most intense activity are National Pensions Action Week and up to the end-of-year tax deadline in October.
12.44 In previous years, pension providers have also financially contributed towards a nationwide distribution of National Pensions Action Week information and carried out their own direct advertising and promotions and in-branch activity on pensions. In general, providers are investing more in developing business by targeting groups such as women to increase pension coverage.
12.45 The primary objective of recent National Pensions Awareness Campaigns has been to drive action by those with no pension, with the focus on specific sectors identified by the CSO as having low levels of pension penetration, particularly 25-35 year olds, women, hospitality/farming/rural community and international workers. The 2007 campaign also highlights the need for those with pension provision to address the adequacy issue and encourages SSIA holders to make pension provision a priority this year.

1��
GREEN PAPER ON Pensions
Safeguarding rights12.46 The Pensions Board continues to promote
the security of occupational pension schemes and confidence in the system by providing clear, authoritative guidance to trustees and pension practitioners on how to comply with the Pensions Act and on good practice generally in relation to scheme administration. Examples of this work include free information booklets to reflect legislative changes and the Board’s information and enquiry service which deals with enquiries or complaints received from scheme members and their dependants, prospective members, trustees, trade unions, employers and company employees with human resource pay and industrial relations functions. Enquiries, including technical queries, are also received from pension practitioners, professional bodies and media representatives. A full list of the Board’s current information booklets, as well as a list of guidance available from other organisations in relation to pensions, is contained in Appendix H.
12.47 In order to support them for their role, trustees are a particular focus for the Board’s information activities. In addition to existing written guidance, including the trustee handbook and codes of practice, it is envisaged that an e-learning guide for trustees, and other supports, will now be developed, following completion of the review of trusteeship by the Board in late 2006.
Information for decision-making by the individual12.48 Every year, 250,000 people access the
Pensions Board website, particularly the on-line pension calculator and checklist. The Financial Regulator has also initiated “Pensions Made Easy” publications.
12.49 The Board, the Financial Regulator, the Consumer Strategy Group and many other agencies, as part of the National Steering Group for Financial Education, are working to progress the formal inclusion of financial planning in the Irish educational system, including retirement planning.
12.50 The Board recently reached an agreement with FÁS and Fáilte Ireland to include a pensions element in their training process, and with the National Federation of Recruitment Agencies to
support the provision of pensions information among their members.
Information for decision-making by the policy-maker12.51 There is an ongoing need to improve the
capacity for evidence-based decision making. While progress has been made, in common with other areas of Government policy, the availability of detailed pension information continues to be an issue for policy makers.A number of steps are currently underway to improve this position with a view to improving both policy and regulatory outcomes. EU Regulation No. 2056/2002 and other demands will ensure that the need to develop the information base available will continue to be a priority over the next few years.
Options for the future regarding information and awareness12.52 One of the key means of increasing coverage,
improving adequacy and enhancing security is the provision of information to inform, educate and guide. Much work is already being done in this regard by the range of stakeholders involved in pensions. However, in order to bridge the behavioural gap between awareness and action, more may need to be done.
12.53 Attention needs to be given to the role of institutions beyond Government in increasing information and awareness and the possibilities for developing these relationships through joint initiatives. The social partners have a particularly important role to play in this regard, given their close relationships with the target groups.
12.54 It may be appropriate to examine the inclusion of financial planning in the school curriculum, and also support for new research to develop our understanding of behavioural finance and pensions risks at third level.
12.55 Pension providers and financial institutions may have a particular part to play. Some options suggested by the EU in relation to consumer information include:
l Simplifying information for customers and focusing on key characteristics of the product;

1��
GREEN PAPER ON Pensions
l Better identifying the risk profile of the client and segment clients;
l Monitoring by authorities of publicity for financial products;
l Improving financial advice provided by intermediaries (including enhancing technical preparation of financial advisors where relevant);
l Obliging intermediaries to keep proof of advice provided and to improve after sale service;
l Knowing the rules, particularly where complex products mean that households may not fully understand all of the risks and costs of these products.
12.56 Finally, individuals themselves have a responsibility to seek the information that is available to them, to examine this information carefully, to be proactive about seeking such additional information as they consider to be necessary and to act to ensure that they are making prudent provision for their future, in so far as they can.
Pensions Legislation
12.57 The pensions area is complex and continues to evolve. Therefore, different regulatory issues and questions of policy emerge. The Pensions Act 1990 is the legislative foundation for pensions policy in Ireland. It is usually amended each year to deal with various regulatory issues that emerge.
12.58 Two issues currently being debated are trusteeship and commutation.
Trusteeship12.59 The great majority of trustees rely on
professional providers – typically insurance companies or consultancy firms – to administer their pension schemes and to fulfil the trustees’ compliance obligations under the Pensions Act. Inevitably, many trustees do not have a detailed knowledge of these obligations, and are therefore not in a position to judge whether their provider is fulfilling them on their behalf. The report by the Pensions Board on trusteeship has recommended that providers of pension administration services should be
directly regulated by the Pensions Board and this will be considered by the Minister for Social and Family Affairs.
Commutation12.60 Commutation applies to most private sector
defined benefit schemes. On retirement, scheme members may be entitled under the rules of the scheme to surrender part of their pension in return for a tax-free lump sum. A commutation factor is applied which determines the amount of pension that can be converted into a lump sum. Often this means that for every €1 of pension surrendered, €9 of tax-free cash is paid. There are no statutory provisions or guidelines in place as to the appropriate commutation factor to use. Scheme rules allow the trustees discretion to decide the factor with or without actuarial advice or specify the rate. In some cases, the commutation factor which translates a pension payment into a lump sum is valued at less than the market cost of buying the pension. In other words, the lump sum paid to a member as a tax-free benefit is less than the market cost of the pension it replaces. Where this occurs, the saving to the pension scheme would fall back into the assets of the scheme, with the result that the scheme’s surplus would be slightly increased or, where the scheme was in deficit, the deficit reduced.
12.61 However, from the scheme’s point of view, it can be argued that it is not reasonable to compare this with the market cost of the pensions, as typically a scheme will value its pensions at a different rate than the market cost. Furthermore, whether or not an individual is better off financially in taking the tax-free cash option in lieu of pension is a function of the individual’s tax position, the return the individual could get with the lump sum and how long the individual will live in retirement.
12.62 That said, it is clear the members are not always aware of the value issue and that schemes generally end up in a better financial position if members take the tax-free cash option.
12.63 One option would be to set the rules around the commutation factors that should be offered by schemes. These would be complex and

1��
GREEN PAPER ON Pensions
schemes could ultimately decide not to offer commutation to members. Another method of dealing with the issue may be for the Pensions Board to issue guidelines to trustees on the issues of the use of commutation factors which would form best practice. There should also be better disclosure to members of the issues they need to consider when deciding whether or not to commute pension. This could be achieved with amendments to the current disclosure regulations.
Operational Review
12.64 As can be seen from the sections above, regulation of occupational pension schemes involves monitoring of a very large number of schemes in a complex and fast moving environment in order to fulfil a range of specific objectives.
12.65 In order to ensure that the Pensions Board is equipped to provide the appropriate level of supervision for the occupational pensions system, during 2006/2007 the Pensions Board has been carrying out an operational review. The essential aim of the exercise is to review the principles and practices of the Board’s supervisory and related activities and to make recommendations designed to maximise its effectiveness and efficiency in the future. The review takes account of the additional regulatory responsibilities the Board has as a result of changes in legislation, many of which have been driven by the implementation of the IORPs Directive.
12.66 It focuses on a move towards a risk-based approach which is in keeping with international norms in the regulatory area and is essential in ensuring that the Board is structured and skilled to ensure confidence and stability in the occupational pension system as far as possible, subject to additional necessary resources being made available.
Charges and pension products
Types of charges12.67 Funded supplementary pension arrangements
are subject to both explicit and implicit charges, depending on the nature of the arrangement and services required.
12.68 Explicit charges made by third party providers to funded supplementary pension arrangements include:
l Fees, plus VAT, charged by the service provider to the arrangement itself and/or to the sponsoring entity;
l Contract charges, levied within individual contract arrangements, such as retirement annuities, PRSAs, Buy Out Bonds, and insured occupational pension schemes contracts. Typically the provider is a life assurance company. These ‘inside the contract’ charges can take a number of different forms:
l A contribution charge, deducted by the provider before investment of the contribution;
l A monetary charge, deducted by the provider before investment of a contribution, or deducted from the accumulated fund, or added to the contribution payable;
l A fund based charge, typically expressed as a percentage of the fund, e.g. 1% per annum. This is deducted within the fund before the setting of the unit price or fund value.
12.69 Implicit charges135 are additional to explicit charges and include:
l Investment trading costs;
l Margins in risk benefit premiums charged by insurers, in relation to anticipated future mortality and morbidity rates.
135 Charges which may not be directly visible to the sponsoring entity or member, but which, for example reduce the investment return provided to an arrangement before explicit charges are applied or increase the “wholesale” cost of a product or service, before other explicit charges, are added.

1��
GREEN PAPER ON Pensions
12.70 Employers may also incur own costs (i.e. not third party) in operating funded supplementary pension arrangements in relation to:
l Deduction and submission of employee contributions to occupational pension scheme trustees or a PRSA provider; under the Pensions Act 1990, the employer can not make any deduction from such contributions before submission to the trustees or PRSA provider, as the case may be;
l Providing from the employer’s own resources of various administration services for an occupational pension scheme established by the employer, e.g. record keeping, disclosure of information, etc;
l Providing information and advice to employees in relation to an occupational pension scheme or PRSA arrangement;
l Making annual returns of certain information to Revenue136 in relation to contributions paid to occupational pension schemes, PRSAs and retirement annuities.
Disclosure and visibility of charges12.71 Explicit fees charged by a third party provider
to a sponsoring entity or trustees of a pension arrangement are obviously disclosed and entirely visible.
12.72 In relation to explicit charges, there is a statutory requirement137 to disclose to the relevant individual at the point of sale, the contract charges (and any associated sales remuneration) in relation to the following:
l PRSAs;
l Retirement annuities and associated risk benefit policies;
l Annuities (issued to individuals, rather than to trustees).
12.73 However, policies issued by life assurance companies to the trustees of occupational
136 Through the P35 return, in accordance with Section 897A, Taxes Consolidation Act 1997
137 Under the Pensions Act and related regulations in relation to PRSAs, and under the Life Assurance (Provision of Information) Regulations, 2001 in relation to retirement annuities, buy out bonds and individual annuities.
pension schemes are specifically excluded from the disclosure requirements of the Life Assurance (Provision of Information) Regulations 2001 and hence trustees effecting such policies are not entitled to the same level of disclosure of contract charges and sales remuneration as individual contract holders.
Statutory control of charges12.74 Only PRSAs are currently subject to statutory
control (under the Pensions Act 1990) over the type and quantum of explicit charges which can be made to a PRSA contract:
l No charges expressed in cash terms can be made to a PRSA, Standard or non Standard;
l The maximum charge on each Standard PRSA contribution received is 5% per annum;
l The maximum Standard PRSA fund charge is 1% per annum;
l No ‘initial’ charge can be made to a transfer value received into a PRSA, Standard or non Standard. This is taken to mean no contribution charge can be made to such a transfer value;
l No charge can be made to a PRSA, Standard or non Standard, on termination of the PRSA and/or payment of a transfer value from a PRSA;
l No charge can be made to a PRSA on suspension, variation or recommencement of contributions to a PRSA, Standard or non Standard.
12.75 Charges made to other forms of funded supplementary pension arrangements are not currently subject to any form of statutory control.
Level of charges12.76 Apart from PRSAs, there is no readily
available central source of information on the level of explicit third party charges made to funded supplementary pension arrangements for various services.
12.77 Previous reviews and reports on pension coverage undertaken by the Pensions Board have concentrated on macro issues related to increasing pension coverage and none

1��
GREEN PAPER ON Pensions
specifically attempted to quantify the level and impact of charges currently levied on different types of funded supplementary pension arrangements.
12.78 The absence of such information make its difficult to:
l Know whether funded supplementary pension arrangements are getting value for money for the services they are buying;
l Compare the cost of one type of arrangement with another;
l Compare charges with those made on similar arrangements in other jurisdictions;
l Determine accurately the savings in charges which could be obtained by an auto enrolment or outright compulsory approach to funded supplementary pension provision.
12.79 In relation to PRSAs, the maximum explicit charge on Standard PRSAs can be compared with the revised138 UK stakeholder maximum explicit charge of 1.5% per annum of the fund for the first 10 years, reducing to 1% per annum thereafter, as follows:
138 With effect for new contracts from 6th April 2005 onwards; for contracts issued before that date the maximum charge remains at 1% pa, with no contribution charge
Table 12.1 Maximum Standard PRSA charges vs uK Stakeholder chargesReduction in yield (RIy)139140
Investment term (yrs)
RIy of maximum Standard PRSA charge
RIy of maximum uK Stakeholder product
Projected 140 PRSA fund as % of uK Stakeholder fund
5 3.0% pa 1.5% pa 96.2%
10 2.0% pa 1.5% pa 97.6%
15 1.6% pa 1.2% pa 96.9%
20 1.5% pa 1.1% pa 96.6%
25 1.3% pa 1.1% pa 96.4%
12.80 The contribution charge (max 5%) allowed on the Standard PRSA, when amortised over shorter investment terms, significantly increases the impact of charges over such periods.
12.81 The contribution charge is not a feature of the UK Stakeholder product and hence its charge levels do not vary by investment term, except where the fund charges reduces after the first 10 years to 1% per annum.
12.82 The contribution charge structure in the Standard PRSA allows PRSA providers to recover their PRSA set up costs over a shorter term than would be possible if the only charge allowed was a fund charge. It can be argued that allowing Standard PRSA providers to recover their set up costs over a short period reduces the cost to long term contributors, as the provider only charges for the cost of capital involved in setting up the PRSA for a shorter period. If the cost of capital involved in setting up the PRSA could only be recovered over a much longer period, the PRSA provider
139 A way of expressing the impact of product charges, in terms of an annualised reduction in investment return over a specific period. For example, if a product achieves a gross investment return of 6% pa over a period, and its RIY is 1.5% pa over that period, the actual return achieved by the product holder over that period is 4.5% pa. The RIY charge can be looked on as a ‘hurdle’ rate of investment return which must first be achieved before the product holder earns a positive return on contributions paid over that period.
140 Assuming a 6% pa gross investment return, and a regular monthly contribution throughout.

1��
GREEN PAPER ON Pensions
would have to charge more, in product charges, for the use of its capital over the longer period.
12.83 Over the investment terms of 15 to 25 years, the maximum charge on the Standard PRSA is marginally more expensive than the maximum charge under the UK stakeholder product. Of course, in this regard, the different scale of the Irish and UK markets must be borne in mind.
12.84 However in considering the above table of RIYs over different terms, it should be noted that it is assumed that a regular monthly contribution will be paid throughout the term shown. Experience would indicate that this is highly unlikely to happen, particularly for employees contributing to a Standard PRSA through an employer designation scheme, where payment of contributions is linked to continuing employment with that employer.
12.85 Persistency rates for UK group personal pensions (linked to employer), published by the FSA in the UK, suggest that less than 50% are still contributing after 4 years.141 There is no reason to suppose that it would be materially different here for Standard PRSA employer designation schemes.
12.86 If a Standard PRSA holder contributed for, say, 5 years and then takes a transfer value to an occupational pension scheme, the RIY suffered in the Standard PRSA over the 5 year period would be 3.0% per annum, compared to 1.5% per annum under the UK stakeholder product. This may be compounded in some cases by a further initial charge levied on the PRSA transfer value by the occupational pension scheme to which it is paid.
12.87 However Standard PRSA contributors who contribute for a relatively short period but then leave their funds in that PRSA, or transfer to another Standard PRSA without charge, would achieve the lower Standard PRSA charges shown over time.
141 FSA (2006) Survey of Persistency of Life and Pensions Policies, October 2006
12.88 Based on international experience, it is likely that the range of charges between different types of arrangements varies as follows:
12.89 Individual contracts are typically more expensive to deliver and service than group occupational pension schemes. A significant cost element of individual contract set up costs is the initial sales and distribution cost. For example, the current typical commission paid to an intermediary by a life company in the first year of an individual pension contract might be circa 25% of the first year’s contribution, with ongoing renewal commission in the range of 2%-4% of each contribution paid. In addition, or as an alternative, some intermediaries may also be entitled to a ‘fund based’ commission, typically circa 0.5% per annum of the ongoing value of the policy.
12.90 One Standard PRSA provider currently offers intermediaries various sales remuneration options including one offering a fund based commission payment of 0.55% per annum, for monthly contributions between €150 and €600 per month. In the case of a 20 year contribution term, Table 12.1 above shows the projected total Standard PRSA charges as being equivalent to a reduction in yield of 1.5% per annum over that period. Therefore in such a case, it would appear that sales remuneration costs accounts for over one third of total product charges over this period.
12.91 This indicates the significant proportion of individual contract charges which can be accounted for by sales remuneration, i.e. the cost of paying for a face to face meeting, and advice, to ‘persuade’ an individual or employer to start an individual pension contract.
Large occupational pension schemes
Small occupational pension schemes
Individual contracts
Charge level, as a % of accumulated fund

1�0
GREEN PAPER ON Pensions
Implicit charges12.92 While explicit charges can often be the focus
of examination of charges, implicit charges related to investment of funds can also be a significant and hidden cost to pension arrangements.
12.93 The First Report of the UK Pensions Commission142 assumed implicit costs of circa 0.5% per annum on average across all asset classes, i.e. the difference between the gross or ‘wholesale’ market return and the net return achieved by the pension arrangement, before deduction of explicit costs.
Impact of charges12.94 Charge levels on funded supplementary
pension arrangements can impact in a number of different ways:
l For defined contribution arrangements, high charges reduce the retirement fund that would otherwise be accumulated for the individual at retirement for a particular contribution level, than if charges were lower. If we take an assumed current typical charge level of 1.5% per annum, this table shows the projected increase in accumulated fund over various contribution terms resulting from a reduction of 0.5% per annum and 1% per annum respectively in the charge level throughout:
Table 12.2 % Increase in defined contribution accumulated fund143
Contribution term Charges reduced by
0.50% pa 1.00% pa
10 + 3% + 6%
15 + 4% + 9%
20 + 6% + 12%
25 + 8% + 16%
30 + 9% + 20%
142 First Report of the UK Pensions Commission, (2004) Chapter 6, page 216.
143 Assuming a fixed monthly contribution over the term shown, based on a 6% pa pre-charge investment return, and assuming a starting charge level of 1.5% pa.
12.95 For example, a regular contributor over 25 years would have an 8% greater retirement fund if the charge level were reduced by 0.5% per annum throughout, and have a 16% greater retirement fund if the charge level were reduced by 1% per annum throughout.
l For defined benefit arrangements, higher charges increase the cost of providing the promised benefit;
l A perception of high charges can act as a disincentive to employers and individuals alike to start and contribute to a voluntary pension arrangement.
Bundled charges12.96 Bundled services and products, like life
assurance pension policies, carry bundled charges. While components of the explicit charges may be identifiable as between, say, the contribution charge and the fund charge under an individual contract, what is not known is how much is being charged for each of the bundled services being provided, e.g. how much of the charge relates to set up costs, ongoing administration and compliance costs, investment management costs, etc., where such services are provided.
12.97 In the absence of such information, it is therefore difficult to identify:
l which specific services cost the most;
l whether charges for specific services are reasonable or competitive.
12.98 Labels attached to bundled product charges may be misleading, in this regard. For example:
l individual pension policies, including PRSAs, carry a fund charge which is sometimes referred to as a ‘fund management’ charge. This could typically be 1% per annum or more. This might appear to the uninitiated as the cost of investment management. In fact investment management might itself cost as little as 0.1– 0.3% per annum, with the balance of the ‘fund management’ charge being a margin for the life company covering one or more of its other services such as distribution and sales remuneration, administration, as well as its profit margin, etc.

1�1
GREEN PAPER ON Pensions
l Some unit linked funds publish a ‘Bid’ and ‘Offer’ unit price, with a typical spread being 3%–5%. Units are purchased at the Offer Price and encashed at the Bid Price. However this spread is in fact just a mark up or contribution charge for the benefit of the provider and has nothing to do with the buying and selling values of the underlying securities of the fund in question. The costs of buying and selling the fund’s underlying assets are taken into account separately by valuing the assets on a “bid” or selling basis when there is a net outflow of contributions from the fund and on an “offer” or buying basis when there is a net inflow of contributions into the fund in question.
Drivers of costs12.99 What are the key drivers of the cost of
services provided to funded supplementary pension arrangements? Without any detailed knowledge of the empirical level of charges made for different services provided to such pension arrangements in Ireland, it is difficult to pin point whether any particular factor or factors is driving up costs for funded supplementary pension arrangements. For example, some argue that increased regulation and compliance requirements are driving up the cost of providing this service to pension arrangements, and hence charge levels. However even if this could be proven, it is impossible to know whether this is a material factor in driving up charges made to pension arrangements without knowing how much of total charges are related specifically to the cost of regulation and compliance.
12.100 It is more likely, for example, that distribution and sales remuneration costs are far more significant than ongoing regulation and compliance costs, as the example of the Standard PRSA charges showed earlier. However without detailed information and facts, it is simply not possible to identify the key cost drivers for all types of arrangements.
12.101 The UK Pensions Commission concluded in its Second Report of 2005 that two key cost drivers in the UK, in relation to the cost of selling individual pension contracts in the UK, were:
l set-up costs, including the cost of sales remuneration; and
l costs resulting from poor persistency. Lapsing of contracts or contributions leads to a proliferation of account set up and maintenance costs. Contract providers build in an allowance in their charges for the costs created by lack of persistency, e.g. the administration costs of having to maintain many individual accounts with low balances and no or irregular ongoing contributions.
12.102 The UK Report also concluded that “ongoing maintenance costs and fund management costs are by contrast smaller elements of the total cost in relation to individual stakeholder contracts.”144
12.103 The UK Report illustrated a particular example of a 40 year old median earner contributing to an individual contract (under a small employer arrangement) and suggested that of the total 1.3% per annum expected charge over the contribution period, the split was as follows:
Table 12.3 uK Stakeholder Source of Costs Example
Charge % of total charge
Up front costs, including sales remuneration, advice etc.
0.42% pa 32%
Lack of persistency costs 0.50% pa 39%
Ongoing costs, administration etc.
0.28% pa 21%
Fund management 0.10% pa 8%
Total 1.30% pa 100%
Competition12.104 Active competition in the marketplace for the
provision of services to funded supplementary pension arrangements should, if information on charges is readily and widely available in an understandable format to potential purchasers, lead to downward pressure on the costs of services provided to funded supplementary pension arrangements. Without detailed information on current
144 Second Report of the UK Pensions Commission, (2005) Chapter 6, Page 111.

1��
GREEN PAPER ON Pensions
charge levels, it’s not possible to state if this is or is not the case in the Irish funded supplementary pensions marketplace.
12.105 A small number of life assurance companies are dominant providers of products and services to the funded supplementary pension market, particularly for smaller occupational pension schemes and individual contracts.
12.106 This dominance has arisen due to a combination of factors:
l Consolidation in the life assurance industry has concentrated market share into 3 main entities which now account for about two-thirds of the life company pensions market;
l Life companies have a number of actual and de facto monopolies in the provision of certain products and services to the pensions marketplace, such as retirement annuities, annuities, PRSAs and Buy Out Bonds;
l Only some life assurance companies have the minimum threshold level of resources, such as human knowledge and systems, necessary to provide and administer certain specialised products and services required by the funded supplementary pension market. Therefore these companies are in a dominant position in relation to certain types of products, e.g. group public sector AVCs;
l There has been only one significant new entrant to the domestic Irish life assurance market over the past decade;
l Cross border life companies have shown no interest to date in selling pension business here. This may be for a number of reasons:
l The relatively small size of the Irish life assurance and pensions market, relative to other European markets;
l Lack of distribution capability in the Irish market. Many of these companies sell through captive distribution channels in their “home” markets and would have little experience of or appetite for establishing the capability to sell through Irish independent intermediaries;
l The perceived complexity of local sales and marketing requirements;
l A Revenue reporting and taxation regime for policyholders effecting ‘foreign policies’145 which does not apply to policies effected with domestic life companies;
l The most likely cross border life companies to operate here are UK life companies which typically issue policies in Sterling rather than in Euro.
12.107Life companies in Ireland transact the majority of their pension business through independent intermediaries. The latest available statistics146 suggest that life companies obtain about two thirds of their new annual premium pension business through such intermediaries.
12.108 Where life companies conduct such a significant proportion of pension business through intermediaries, the question of sales remuneration and its impact on insured funded supplementary pension product charges is relevant. The higher sales remuneration terms become, the higher the associated charges that must be made in insured products subject to such sales remuneration terms.
12.109 Life companies members of the Irish Insurance Federation maintained a voluntary agreement on maximum sales remuneration terms from the mid 1980s until 1998, when the agreement was struck down by the Competition Authority as being anti-competitive.
12.110 The current situation therefore is that there is no limit on sales remuneration terms payable in connection with the arranging of pension policies.
12.111 A concern in such a situation is that life companies might have a direct incentive to compete for insured pension business by paying higher levels of sales remuneration to intermediaries arranging policies as part of funded supplementary pension arrangements,
145 i.e. a policy effected with a life company not established here or operating here through a Branch. (Section 730H, Taxes Consolidation Act 1997)
146 IIF Factfile, 2006 in respect of year 2005

1��
GREEN PAPER ON Pensions
which in turn will be reflected in higher product charges for such arrangements.
12.112 This concern is further compounded by the current lack of any statutory obligation to disclose product charges and sales remuneration terms for policies issued by life assurance companies to the trustees of occupational pension schemes.
12.113 There is some evidence to suggest that some life companies have maintained, and even increased, their new business product margins over the last 5 years, compared to a continuing reduction in net interest margins experienced by most retail banks arising from greater competition for mortgage and deposit business. This suggests that the impact of competition for consumer’s business is possibly not as strong in the domestic life assurance market as it may be for mortgages and deposits. Competition in the domestic life assurance market for pension business may be more focused on competition for the intermediary’s business, which can result in higher charges for the consumer.
12.114There are also a relatively small number of providers of advisory and administration services to medium to large self administered occupational pension schemes. For example, a small (<5) number of employee benefit consultancy firms are believed to control some 90% of the larger end of the employee benefit consultancy market.
Control over charges12.115 Standard PRSAs are the only pension product
currently subject to statutory control over maximum explicit charges. Any consideration of the imposition of statutory maximum explicit charges on providers of services to other funded supplementary pension arrangements, in a voluntary regime, must take account of the following:
l Where would the maximum charge level be set? If set too low, it could cause some commercial providers to pull out completely from certain unprofitable sectors of the marketplace. If set too high, it might have little effect;
l A maximum charge level might quickly become the minimum charge level for large sections of the market. There is
some evidence of this happening in relation to Standard PRSA charges where most PRSA providers are taking the maximum Standard PRSA charge allowed (i.e. 5% + 1% per annum) as their standard ‘retail’ charge, with ‘discounts’ to this maximum charge being given only for certain more profitable types of business, e.g. larger contribution sizes, schemes with a certain minimum number of members and/or total contribution level, etc.;
l How practical would it be to attempt to impose price control over a wide range of providers of disparate services to funded supplementary pension arrangements, in a voluntary regime? While it might be technically possible to impose obligations on trustees of funded occupational pension schemes in relation to the maximum price they should pay for bundled services (e.g. follow the price control approach adopted for Standard PRSAs), there is no guarantee that commercial providers would be willing or able to provide such products, within such a maximum charge, to all types of schemes;
l Any attempt to impose maximum charges on bundled services, such as policies issued by life assurance companies, would cause anomalies in the marketplace if similar controls were not to be applied to all other products and services provided on an unbundled basis. For example, an insured Director’s Pension Plan for a proprietary director might be subject to maximum charges but not a Small Self Administered Pension Scheme, etc.;
l Who would police maximum charges on a wide range of funded supplementary pension providers and products?
l Service and product providers are subject to the same inflationary pressures on their costs as other participants in the economy. It may be hard to justify imposing price control over one sector of the economy but not over others. For example, why should an auditor be subject to a maximum charge for auditing a pension scheme, but not for auditing a company?

1��
GREEN PAPER ON Pensions
12.116 It is not at all certain that it would be feasible to extend maximum charge controls to all product and services providers to funded supplementary pension arrangements in a voluntary regime, even if such a course of action were thought desirable. Imposing an obligation on providers for greater disclosure of charges in a meaningful way may bring more immediate benefits to employers and members alike.
Compulsion12.117 There is evidence from other jurisdictions
that auto enrolment or compulsion can, depending on the precise nature of the arrangement, reduce charges associated with funded supplementary pension arrangements through a combination of factors:
l Reduced distribution costs; employers and individuals do not have to be ‘persuaded’ to set up or join the arrangement in question. Lower or no sales remuneration is therefore required;
l Reduced or no advice costs; simplified compulsory products and arrangements don’t require the provision of individual regulated advice to employers and individuals. This again reduces the sales remuneration required to provide this advice;
l Higher contribution levels, where a minimum contribution level is set as a percentage of individual’s earnings and/or the employer is also required to contribute. Contribution levels in such a case are likely to be higher on average than apply currently to Standard PRSA under employer designation schemes. Fixed costs absorb a proportionately lower percentage of higher contributions;
l Economies of scale through bulk purchase of certain services, such as investment management, administration, contribution collection, etc.;
l Elimination or substantial reduction of low persistency costs: if membership of a centralised arrangement is compulsory, contribution membership is not broken on moving from one job to another.
12.118How low charges could be taken would depend on the structure of such an auto
enrolment or compulsory arrangement. The UK Pensions Commission in its second Report has specified a target annual management charge of 0.3% per annum for its proposed auto-enrolment National Pensions Savings Scheme.147 However the UK Government has since indicated148 that it considers this level of charge to be achievable over the ‘long term’ but in the short term a charge level of 0.5% per annum is achievable.
12.119 The Swedish compulsory supplementary Premium Pension Scheme currently has a fund charge on its default Premium Saving Fund (State managed) of 0.15% per annum, with an administration charge of 0.22% per annum, giving a total current charge for a contributor opting for the default fund of 0.37% per annum. This charge is also anticipated to reduce as the scheme grows in size of funds.
Issues for consideration12.120 There is a lack of detailed knowledge of
the cost of providing funded supplementary pension arrangements in a voluntary regime in Ireland. Without this detailed knowledge of current costs, it is not possible to state:
l whether the charges levied on these arrangements have been increasing or decreasing;
l whether such charges represent value for money;
l which particular service charges are material and which are not; and
l what initiatives, if any, could be undertaken to significantly reduce such charges.
12.121 Without this benchmark of current costs of delivering funded supplementary pension arrangements, it is also not possible to quantify the level of reduction in charges that might be achieved by an alternative auto enrolment or full compulsory funded supplementary pension arrangement. There is therefore an information deficit in relation to the charges of delivering funded supplementary pension arrangements to the marketplace.
147 Second Report of the UK Pensions Commission (2005) page 7
148 UK Department of Work and Pensions (2006), Personal Accounts, a new way to save

1��
GREEN PAPER ON Pensions
12.122 Consideration might be given to eliminating this information deficit by the Pensions Board gathering sufficient information from providers to funded supplementary pension arrangements to establish current benchmark charges for:
l various services provided to typical types of self administered funded occupational pension schemes; and
l typical individual contracts.
12.123 The establishment of such benchmark charges would aid the analysis of the potential reduction in charges which might be achieved by alternative auto enrolment and compulsory arrangements. In addition, consideration might be given to greater and more consistent disclosure of charges and sales remuneration of all bundled products and services provided to funded supplementary pension arrangements.
Options 12.124 The current voluntary approach to funded
supplementary pension arrangements can give rise to high charges in certain areas and circumstances, charges which can act as a deterrent to the objective of increasing supplementary pension coverage as follows:
l higher contribution levels are required, to achieve a particular benefit, or lower benefits are provided, than if charges were lower;
l high charges can act as a real or imagined barrier to the establishment of new arrangements and contracts;
l contract providers may use a more complex product design, which is more difficult for the consumer to understand, in order to disguise the impact of high charges;
l certain segments of the marketplace can only be serviced commercially at a prohibitive cost to the consumer.
12.125 In relation to controlling charges for supplementary pension arrangements, the main options are:
l the introduction of mandatory pensions, either through auto enrolment or outright compulsion;
l the imposition of maximum charges on certain funded supplementary pension arrangements, in particular on contract charges;
l continuation of current voluntary system but with more and better statutory disclosure of charges.
12.126 Each option has particular advantages and disadvantages. Auto enrolment or outright compulsion can potentially deliver the most significant and widespread reduction in charges for individual contributors through:
l no or reduced sales remuneration costs;
l no or reduced advice costs;
l reduced investment management costs, through bulking of investment funds and more use of passive investment management techniques;
l reduced administration costs, through economies of scale;
l reduced or elimination of costs associated with low persistency.
12.127 However:
l there would be significant initial costs in establishing such a scheme. A key issue would be who should pay for these initial establishment costs, and how and over what period would they be recovered?
l The existence of such an auto enrolment or compulsory scheme running along side existing voluntary supplementary arrangements could create complexity in the marketplace (e.g. would there be ‘contracting out’ for members of occupational pension schemes?) which might create a need for advice and additional administration systems to handle such co-existence. Both services would have to be paid for;
l If the auto enrolment or compulsory system allowed competing commercial providers within the one system (e.g. contributor could choose which commercial provider to manage his or her fund), international experience suggests that some of the anticipated cost savings would be reduced or lost altogether. For example, competing providers would likely incur sales, marketing and distribution

1��
GREEN PAPER ON Pensions
costs in an attempt to persuade contributors to pick their product within the auto enrolment or compulsory system. These costs would, of course, have to be passed back to the contributor in the form of higher charges.
12.128 The detailed design of the scheme would also dictate the type of charges which might be allowed under such a proposed scheme, e.g.:
l Fund based charge only;
l Combination of fund based and contribution charge (as currently applies to PRSAs);
l Flat monetary fees, which might apply to all accounts regardless of fund size or contribution level. (Such monetary fees are currently prohibited for PRSAs).
12.129 Each of these charging structures would have different impacts on contributors to such a scheme, with some contributors doing better under one type of charge than under another.
Conclusion
12.130 Any changes or developments in regulatory approach must have regard to the principles of Better Regulation, as outlined in the Government White Paper, “Regulating Better”. In particular, a process of Regulatory Impact Analysis would have to be completed to ensure that the implications of any changes are considered fully and that any regulation is balanced and proportionate.
12.131 Sight should not be lost of the fact that regulation must ultimately benefit individuals. As occupational pension provision is voluntary in Ireland, individuals will not benefit if regulation becomes a barrier to employers choosing to make retirement provision for their employees. Likewise, regulation should not discourage providers from the market as consumers should benefit from a competitive market. It is important, however, that there is sufficient transparency to allow consumers make informed choices and the issues previously outlined in relation to charges highlighted this.
12.132 The overall approach to pensions regulation continues to evolve to address proactively the challenges of a changing environment. This chapter outlines new directions in terms of the move to risk-based supervision, options for streamlining some aspects of regulation of PRSAs, while deepening other aspects of regulation including particular issues in relation to information and charges.

1��
GREEN PAPER ON Pensions
The Role of Regulation The main reason the State establishes systems of regulation in any area of activity is to provide confidence and stability in that system. The State may also intervene where markets are not operating efficiently. As pensions saving involves providers investing other people’s money on their behalf, it is important that those people can be confident that the system is secure and that their own savings are secure.
The State ensures that sufficient levels of confidence and security exist in the pensions system by intervening through legislation or other means to ensure standards are put in place and monitored. The State has established bodies to monitor those standards. This Chapter sets out the State’s regulatory objectives in relation to pensions. These include:
l ensuring that savers receive the benefits to which they are entitled;
l giving those saving enough information to assess the adequacy of their provision;
l ensuring that pension contributions are not misappropriated and are accounted for;
l ensuring that people have enough information to make investment decisions, where relevant;
l ensuring that tax reliefs are used appropriately;
l providing pension savers with enough information to decide whether or not to use that vehicle for retirement saving, particularly in respect of value for money;
l providing pension savers with the information needed to make specific decisions, for example, at retirement or on leaving employment.
The number of occupational pension schemes in existence creates particular regulatory challenges.
Information on pensions is essential to heighten pension awareness, safeguard the rights of scheme members and to ensure that people have sufficient information to make appropriate financial decisions.
The overall approach to pension regulation continues to evolve to address, proactively, challenges of a changing environment. In order to address these challenges, the Pensions Board is undertaking an operational review, with the intention of moving towards a risk-based approach. This will ensure that the Board is structured and skilled to ensure confidence and stability in the occupational pension system as far as possible.
Finally, the Chapter outlines options for streamlining some aspects of regulation of PRSAs, while deepening other aspects of regulation, in particular issues in relation to information and charges.

1��
GREEN PAPER ON Pensions
Charges
Funded supplementary pension arrangements are subject to both explicit and implicit charges, depending on the nature of the arrangement and services required. Employers may also incur their own costs in operating funded supplementary pension arrangements in relation to the deduction and submission of employee contributions, providing various administration services (e.g. record keeping), providing information and advice to employees and making annual returns of certain information to Revenue.
Only PRSAs are currently subject to statutory control over the type and level of explicit charges; there is no readily available central source of information on the level of explicit third party charges made to funded supplementary pension arrangements. This makes it difficult to compare different arrangements or know whether value for money is being received. For defined contribution arrangements, high charges can reduce the individual’s retirement fund. For defined benefit arrangements, higher charges increase the cost of providing the promised benefit. A perception of high charges can act as a disincentive to employers and individuals alike to start and contribute to a voluntary pension arrangement.
The key issue in relation to charges is the lack of detailed knowledge and the Chapter outlines options that may address this information deficit. Options are also outlined in relation to controlling charges for supplementary pension schemes.
There are impacts attached to each of these options and any change in the regulatory approach would need to have regard to the principles of better regulation and undergo a regulatory impact analysis.
Questions for consideration 1. Is the overall approach to the regulation of
pensions appropriate to ensure confidence and security in the system?
2. Are the regulatory objectives appropriate?
3. Is the level of regulation appropriate to the regulatory objectives we are trying to achieve?
4. Are there measures that could be taken to introduce transparency in relation to pension fund charges?

CHAPTER 13
PubliC serViCe Pensions

�00
GREEN PAPER ON Pensions
Introduction
13.1 This chapter outlines the defining features of public service149 pensions and the significant reforms that have been implemented in this area since the mid-1990s. It describes relevant work being undertaken by the Public Service Benchmarking Body and the Review Body on Higher Remuneration in the Public Sector. It also considers the rising cost of public service pension arrangements, the factors driving this increase and outlines possible options for consideration to offset this cost in the longer term.
13.2 A central theme of this Green Paper is the challenge to the sustainability of our pensions system in the 21st century presented by demographic trends. Policy on public service pensions cannot be developed in isolation from these trends or from developments in relation to occupational pension coverage for workers outside the public service. In this respect particular regard must be had to social policy, generally, including the development of strategies to deal with an ageing population.
13.3 The overall cost of public service pensions is set to rise considerably in the coming decades. It is important to note that significant measures have already been put in place most notably on foot of the Government’s 2004 public service reform package which followed on from the recommendations made by the Commission on Public Service Pensions. However, current indications are that a combination of factors will mean that the future cost will be greater than was anticipated by the Commission. As this rising cost forms part of the challenge to the sustainability of our pensions system, so too must options to address this cost form part of the debate on the arrangements necessary to ensure sustainability in the long term.
Public Service Pensions System
13.4 Public service pensions are an important part of the pensions landscape in Ireland, covering
149 For the purposes of this paper the term public service excludes commercial state bodies.
some 300,000 staff and some 90,000 pensioners. Pension schemes provide benefits on retirement for staff in the Civil Service, Local Authorities, Garda Síochána, the Defence Forces, the Health and Education Sectors and in non-commercial State Bodies. Employee coverage is close to 100% across the public service, with most new recruits, including atypical and part-time workers, having access to schemes.
13.5 Public service pension schemes are mainly statutory, set up by or under Acts of the Oireachtas, and virtually all are financed on a Pay As You Go basis, that is, as part of current expenditure, voted in the annual estimates. Schemes, in general, comprise a main superannuation scheme and an associated contributory spouses’ and children’s scheme. The main scheme may be contributory or non-contributory, but for staff recruited since April 1995, is generally contributory.
13.6 As a result of the Public Service Superannuation (Miscellaneous Provisions) Act 2004, the minimum age at which pension benefits are payable to most public servants appointed from 1 April 2004 is 65 years and, for most such staff, there is no compulsory retirement age. For most staff appointed before 1 April 2004, pension benefits are generally payable from age 60, and a compulsory retirement age of 65 applies. In a few areas, where the nature of the work places special demands e.g. Gardaí, Permanent Defence Forces and firefighters, arrangements for pension payment and retirement at an earlier age are in place.
13.7 The majority of public service pension schemes have a defined benefit / final salary structure. This means that retirement benefits – lump sum and pension - are calculated by the application of pre defined formulae to length of service and pay (pensionable remuneration) at retirement.
13.8 Maximum superannuation benefits (achievable after 40 years’ pensionable service), in general, consist of a retirement lump sum of 1½ times final pay and a pension of half final pay 150.
150 Pensions for staff who pay full PRSI are integrated with the State Pension (Contributory) (see paragraph 13.16 below).

�01
GREEN PAPER ON Pensions
13.9 Notional added years of pensionable service are granted to certain public servants recruited in professional, technical and specialist grades. These years are intended to compensate for the inability of individuals in such positions to qualify (by pension age) for a full pension based on 40 years’ service because of the essential requirements for appointment to the job e.g. specialist qualifications and/or length of required experience.
13.10 Most schemes provide members with an option to buy additional years of service, on an actuarial basis, to meet a shortfall in the maximum pensionable service of 40 years by normal retirement age. Additional Voluntary Contribution schemes, distinct from the main superannuation scheme (and offered by private sector providers), are available in some organisations to allow members to make extra contributions, within Revenue limits, toward additional retirement benefit.
13.11 The Public Sector Transfer Network enables an employee who transfers from one participating public sector employer to another to transfer the earlier service, and so be given credit in pension terms for that service, by the new employer. A similar network exists for the local government sector.
13.12 In general, there is no automatic entitlement to pension increases under the terms of public service pension schemes. A typical provision in a public service scheme would be that increases may be granted under the scheme as may be authorised from time to time by the Minister responsible, with the consent of the Minister for Finance. In the Civil Service, increases in pensions are awarded at the discretion of the Minister for Finance under Regulations made by him/her under Section 29 of the Pensions (Increase) Act 1964. The Act does not prescribe what form the increases should take or how they should be calculated.
13.13 In the Civil Service, for over 20 years, the application of the Minister’s discretion in this regard has been based on ‘full parity’. This followed an announcement in the 1984 Budget that, in the case of general pay increases, full parity would be implemented from 1 February
1984 onward. The Minister subsequently announced in the 1986 Budget that the Government had decided that full pension parity in relation to special increases would be introduced with effect from 1 July 1986. This commitment was made in the context of public service pay negotiations.
13.14 ‘Full parity’ means that, where increases paid to serving staff are being passed on to pensioners, the pension increases are effective from the same date as the increases being paid to serving staff. For the most part, general increases have been passed on to pensioners on the same basis as to serving staff and in the case of special pay increases some are passed on to pensioners, others are not, depending on the nature of the increase.
Public Service Pension Reform Process
(i) Contribution by public servants towards the cost of pension benefits13.15 Most public service occupational pension
schemes are contributory. A main scheme contribution of 5% applies to a number of groups, including teachers and local authority and health service personnel. The contribution rate for spouses and children’s benefits is, generally, 1.5%. Thus the combined pension contribution made by many public servants is 6.5%.
13.16 In 1995, the Government decided that established civil servants (and public servants generally) appointed on or after 6 April 1995 should be subject to the Class A rate of PRSI contribution and that their occupational and State pensions should be ‘integrated’. ‘Integration’ means that, in effect, the public service pension awarded on retirement is reduced by the amount of the State pension. At the same time, explicit pension contributions (approximately 5%) were introduced for new members of most schemes which had formerly been non-contributory and the pay scales of these new entrants were increased, effectively to match the contributions being levied.
�0�
GREEN PAPER ON Pensions
(ii) Reforms recommended by the Commission on Public Service Pensions13.17 The Commission on Public Service Pensions
was set up by Government in 1996, and deliberated for four years before producing its Final Report in 2000. Its membership was wide-ranging including employers, unions, academics, pension industry experts and civil servants working in the area. The Commission’s terms of reference asked it to examine public service pension arrangements by reference to several criteria, including present and future Exchequer costs, claims for improvements in terms, evolving work patterns and the operational needs of the services concerned.
Pension age, retirement age and standardisation13.18 The Commission’s Final Report found that
the pay as you go/ defined benefit structure of public service pensions should be retained. Beyond that however, it went on to recommend an extensive set of changes impacting on the cost, design and functioning of the system. The Government accepted the thrust of the Commission’s recommendations in 2001, and over the period since then, has progressively implemented individual Commission recommendations. This process is ongoing, though the major changes arising have already been put in place.
13.19 The most far-reaching reform recommended by the Commission was that the pension age for the generality of new entrants to the public service should rise from 60 to 65 years. As previously noted, this major cost-saving change was implemented in 2004 with the enactment of the Public Service Superannuation (Miscellaneous Provisions) Act. That legislation also exempted new entrants from the then public service norm of compulsory retirement at age 65.
13.20 In an important change complementing the raising of pension age, the 2004 Act also provided that standard public service pension terms, including normal accrual and the revised minimum pension age of 65 years, would henceforth apply to certain groups which had enjoyed more advantageous arrangements up to that point. This ‘standardisation’ affected, for example, new entrant teachers (who, if recruited prior to 2004, could retire on pension at age
55 subject to a minimum of 35 years’ service) and new entrant members of the Permanent Defence Forces for whom a minimum pension age was introduced.
13.21 For some categories of public service workers
(e.g. psychiatric nurses and officers in the Fire Service), ‘standardisation’ meant that the doubling of service after 20 years for pension purposes (effectively allowing a full pension to be obtained after 30 years’ service rather than the standard 40 years) would not apply to new entrants.
13.22 In summary the Act:-
1) increased by 10 years the minimum age at which pension may be paid to new entrant psychiatric nurses i.e. from 55 to 65;
2) increased by 10 years the minimum age at which pension may be paid to new entrant teachers i.e. from 55 (subject to 35 years’ service) to 65;
3) introduced a minimum age of 50 at which pension may be paid to new entrants to the Permanent Defence Forces (previously pensions were linked to length of service only and could be paid to staff retiring as young as their early 30’s (depending on rank and service));
4) increased by 5 years the minimum age at which pension may be paid to new entrants to the Garda Síochána and the Prison Service i.e. from 50 (subject to 30 years’ service) to 55;
5) increased the compulsory retirement age for new entrants to the Garda Síochána from 57 to 60, subject to health, fitness and capability conditions;
6) revoked ‘fast accrual’ terms from new entrant psychiatric nurses and fire officers (i.e. increased by 10 years the length of service required for full pension, from 30 to 40 years);
7) increased by 5 years the minimum age at which pension may be paid to all other new entrants to the public service i.e. from 60 to 65;
8) provided that all other new entrants to the public service would not be required to retire on grounds of age.

�0�
GREEN PAPER ON Pensions
Other reforms13.23 Having legislated on pension age in early 2004,
the Government announced in September of that year that, following discussions with ICTU, it had ratified an agreed approach to the remaining Commission recommendations. The key feature of the Government decision was the immediate authorisation for implementation of six key Commission recommendations which were directed at introducing flexibilities and generally modernising disparate features of pension provision. These were as follows:
l Cost-neutral early retirement: A facility which allows public servants to retire early (from age 50/55, as appropriate) with immediate payment of pension and lump sum, actuarially reduced to reflect the earlier payment.
l Revised integration formula: A new method of integrating social insurance and public service pensions to boost the retirement income of lower-paid staff.
l Integration ‘pro rata’: A more favourable integration method (‘pro rata’ integration as opposed to ‘full’ integration) applied in the calculation of pension entitlements for part-time public servants.
l Notional added years: Existing schemes replaced for new entrants by a single ‘transitional’ scheme (to be reviewed in 2015). The main impact of the change was to reduce maximum awards from 10 to 5 years.
l Compound interest rate: The rate on pension-related repayments, such as marriage gratuity, was reduced from 6% to 4%.
l Reckoning of allowances for pension purposes: Revised calculation based on ‘the best three consecutive years in the ten years preceding retirement’ (instead of being restricted to the last three years of service, only).
13.24 Five of these six reforms were implemented
in 2005 by means of Department of Finance circulars. Only the last mentioned (reckoning of allowances) is outstanding (it has been held up by technical difficulties but is expected to be put in place shortly).
13.25 As also provided for in the September 2004 Government decision, other Commission recommendations are currently being considered further, notably:
l Changes to Spouses' and Children's Pension Schemes (including benefits for non-spousal partners). A management/union Working Group established to examine the feasibility of implementing the proposed changes completed its final report in July 2007. The report will be submitted to the Minister for Finance / Government in due course.
l Introduction of SPEARS (a single AVC-type scheme for the public service) – an agenda for a management/union Working Group is under discussion with ICTU.
13.26 As agreed by Government, a small number of recommendations are not under active consideration. These include a proposal for the introduction of an additional explicit 1% pension contribution and an alternative system of increasing pensions based on an average of pay increases in the public service as a whole which, the Commission recommended, should be guaranteed by means of legislation.
(iii) Effect of reforms to date – summary13.27 The extent of the reduction in public service
occupational pension benefits arising from changes made in 1995 and 2004 depends on the area of the public service and on the individual circumstances of each employee. The effect of the reforms might best be shown by a hypothetical example; assuming in all three cases (shown beneath) that the person retiring has 40 years’ reckonable service and a final pensionable remuneration of €50,000:-
Pre 1995 civil servant:
Pension €25,000 payable at age 60
Post 1995 civil servant:
Pension €14,000 payable at age 60 (plus State pension of €11,000 - rounded for purposes of example)
Post 2004 civil servant:
Pension €14,000 payable at age 65 (plus State pension of €11,000)

�0�
GREEN PAPER ON Pensions
(iv) Cost savings from the Commission and related reforms
13.28 When fully realized around mid-century, it is expected that net annual savings of some €350 million (in constant 2007 pay terms) will flow from the reforms put in place by Government following the Commission’s report. The bulk of these savings flow from the pension age increase, and to a lesser degree ‘standardization’ (curtailment of special fast-accrual terms), which, as already noted, were legislated for in 2004.
13.29 The process of reform leading to these savings has been characterized by a spirit of partnership given effect, in particular, through extensive union involvement in various advisory Working Groups established under the Programme for Prosperity and Fairness and subsequently.
Future Outlook for Public Service Pensions
13.30 Demographic and budgetary realities are central to the changes introduced on foot of the Commission’s report. These reforms, collectively, constitute a significant reshaping of the public service pension system in Ireland and combine measures designed to curb cost escalation, along with a range of modernising initiatives which serve to enhance flexibility, fairness and choice.
13.31 The completion of this reform programme and the task of securing its smooth operation throughout the public service are key policy objectives. However, vigilance will be needed towards emerging trends which could impact significantly on the affordability or functioning of public service occupational pensions. Relevant developments in this regard could arise on any of several fronts, including demography, mortality, migration, economic growth and taxation policy. Future pay rates and the structure of future pay increases will also be a crucial factor for so long as a system of ‘pay parity’ exists.
13.32 Furthermore, policy on public service pensions must have constant regard to developments
in relation to both the State pension and occupational pension provision for workers outside the public service. For example, if policy were to move in the direction of a mandatory or quasi-mandatory pension system (which may involve the payment of contributions significantly in excess of the levels that are generally payable at present in the private sector) there is likely to be pressure for the public service to ‘share the pain’, either in the form of a curtailment in benefits or increased contributions.
13.33 Cost containment is crucial and a continuing process of examination and implementation of well founded changes is vital to the proper management of future public service pensions expenditure and its budgetary impact.
Main reasons for projected increase in public service pension costs13.34 At the time of the Commission on Public
Service Pensions (which used projections as of 1997) expenditure on public service pensions was projected to remain relatively fixed as a proportion of GNP from 1997 to 2007 and then to increase steadily from 1.6% to 2.4% by around 2027; thereafter the projection was for the outgo to gradually fall to around 1.8% of GNP by 2050.
13.35 Estimates of the future cost of public service
pensions have since been revised. The projected bill in 2027 is now forecast to be 2.6%, somewhat higher than the 2.4% forecast in 1997. Furthermore, the likely post 2027 position now looks very different. Whereas in 1997 the share of GNP absorbed by public service pensions was expected to decline post 2027, it is now expected to rise and to reach 3.0% by around 2050, over 60% in excess of the previously expected level. This change is mainly due to the increase of around 70,000 in public service numbers since the time of the Commission along with the impact of an assumed improvement in life expectancy.
Options for further changes to public service pensions13.36 The Government values public servants and is
committed to providing them with good quality pension arrangements. Such arrangements will continue to be a defining feature of

�0�
GREEN PAPER ON Pensions
employment in the public service. However, in common with the general population, public servants are living longer than in the past and this and other factors are increasing the cost of providing pensions. While the implementation of many of the Commission recommendations represented a significant element in the reform of the public service pension area, the process of modernising and restructuring the system must continue in light of demographic and budgetary realities which pose excessive future risk to the Exchequer. Ireland’s demographic profile, with one of Europe’s youngest populations means that any future changes can be timed to peak at the time of real need – towards mid-century. In light of this and the other factors mentioned above it is envisaged that any changes decided upon would be applied to future appointees to the public service only.
13.37 In this context the Government intends to research and consider a number of further possible options to address future challenges. These include:-
l raising the minimum public service pension age,
l increasing the rate of pension contributions,
l modifying the ‘pay parity’ basis for post-retirement increases in pensions,
l removal of fast accrual terms,
l abolition of certain notional added years arrangements,
l options for accounting for pension costs,
l a slower accrual rate in respect of retirement pension and lump sum,
l moving to calculation of pensions on the basis of ‘career average’ earnings.
13.38 The Government is not committed to implementing any or all of the options mentioned above. They are put forward in the context of a comprehensive debate on the factors shaping the development of our pensions system in the 21st century. Each would require very careful examination and consideration. Their industrial relations impact and their implications for other policies would also have to be considered, particularly in relation to the recruitment and retention of staff and for public service pay determination.
Also, the extent of savings realised from such measures would depend on the precise nature of the changes adopted and the groups to whom the changes were applied.
The Link Between Pensions and Pay Determination: The Benchmarking Body and Review Body 13.39 In addition to the link between pay and
pensions formed by the application of ‘pay parity’ (see paragraph 13.14) public service pension issues have formed a significant part of the pay determination process.
The Benchmarking Body and Review Body13.40 At present, the Public Service Benchmarking
Body and the Review Body on Higher Remuneration in the Public Sector are carrying out reviews of the appropriate levels of remuneration of the categories of public service grades coming within their respective remits. The terms of reference of the Benchmarking Body state that: “the Body should have regard to the differences between the public service and the private sector and between the various public service groups within its remit in working conditions, the organization of work, perquisites, and conditions of employment and other relevant benefits, including security of tenure and superannuation benefits”.
13.41 The Review Body on Higher Remuneration in the Public Sector, which deals with the pay of top public servants above the level of those covered by benchmarking, said in its June 2005 interim report that “It seems to us that the relevance of superannuation arrangements in the public service as a component of overall remuneration has assumed a greater importance than was the case at the time of the last general review”.
13.42 The Department of Finance in its submission to the Benchmarking Body pressed the Body to give particular attention to this aspect of its mandate. The submission dealt very extensively with the pensions issue.

�0�
GREEN PAPER ON Pensions
13.43 The Benchmarking Body and the Review Body have engaged consultants to carry out an assessment of public service pension benefits relative to those of comparable jobs in the private sector. The two bodies are due to report in the second half of 2007.
13.44 If it is found that the pension benefits of public servants at some or all levels are of greater value than those generally available to private sector comparators, the Body or Bodies will presumably apply appropriate discounts in arriving at the recommended pay rates for the relevant public service grades. This will modify the level of increase in future pension costs for
the grades affected both in respect of serving and future staff and, because of the pay parity arrangement, in respect of existing pensioners from those grades.
13.45 If the value of public service pensions is reduced by the implementation of further changes, as outlined in paragraph 13.37 above, the extent to which public service pay rates should be discounted on foot of pension benefits is likely to be reduced in the future as the proportion of serving staff affected by the changes in pension arrangements increases. The same effect will arise if the relative average value of private sector pensions increases over time.
Public Service PensionsThis Chapter details the defining features of public service pensions and the significant reforms that have been implemented in this area in recent years. It shows that pension coverage is close to 100% across the public service and that most public service pension schemes are contributory, pay as you go, defined benefit schemes.
It gives details on the programme of reform which was based largely on the recommendations of the Commission on Public Service Pensions. The key cost containment aspect in this programme was the raising in 2004 of the minimum pension age for new entrants to the public service from 60 to 65. The mandatory retirement age of 65 years was abolished for most new entrants at this time also.
The Chapter also considers the cost of public service pensions, which are set to rise significantly in the medium-term (mainly because of increases in the number of public servants and improved life expectancy), notwithstanding implementation of the reform programme.
The Chapter outlines a number of further reform options which the Government intends to research and consider in respect of future appointees to the public service to address demographic and other developments since the Commission reported in 2000. These include:
l raising the minimum public service pension age
l increasing the rate of pension contributions
l modifying the ‘pay parity’ basis for post-retirement increases in pensions
l removal of fast accrual terms
l abolition of certain notional added years arrangements
l options for accounting for pension costs
l a slower accrual rate in respect of retirement pension and lump sum
l moving to calculation of pensions on the basis of ‘career average’ earnings.
At present, the Public Service Benchmarking Body and the Review Body on Higher Remuneration in the Public Sector are carrying out reviews of the appropriate levels of remuneration of the categories of public service grades coming within their respective remits. The terms of reference of the Benchmarking Body state that:
“the Body should have regard to the differences between the public service and the private sector and between the various public service groups within its remit in working conditions, the organization of work, perquisites, and conditions of employment and other relevant benefits, including security of tenure and superannuation benefits”.

�0�
GREEN PAPER ON Pensions
Questions for Consideration
1. How should the cost of funding public service pensions be met?
2. Which individual reform options offer the most realistic potential?


CHAPTER 14
Work fleXibiliTy in older age -
a neW aPProaCh To reTiremenT

�10
GREEN PAPER ON Pensions
Introduction
14.1 With people living longer and fitter lives, the costs of pensions increasing, and younger workers seeking to increase their current living standards, growing numbers of people want to work, or feel a need to work, beyond the State pension age. As our concept of retirement shifts to become less age-related and more active, our systems and structures may also need to adapt. In addition, sustainability considerations may mean that the idea of increasing retirement age should play a central role in our pensions strategy.
14.2 This chapter examines issues for Government, individuals and employers, in relation to retirement age and work flexibility.
Policy Context
14.3 Government policy is to facilitate those who wish to extend their working lives. The European Union’s Lisbon Strategy, endorsed by the Government, has an overall goal of making the EU the most dynamic and competitive knowledge-based economy in the world, with more and better jobs and greater social inclusion. Part of the Lisbon Strategy is focused on increasing workforce participation by older workers, and the National Reform Programme has specific initiatives in relation to labour supply and active ageing.
14.4 The average exit age from the labour force in Ireland was 64.1 years in 2005, compared to the EU25 rate of 60.9 years. Older workers’ participation has contributed significantly to increases in the labour force, with employment rates in the 55 to 64 years old category rising by over 10% in the past ten years due to greater labour demand. This rise is driven less by a delay in retirement than by an increase in the movement of the formerly non-employed into jobs. The increase was mainly due to women entering jobs from home duties but men entering from unemployment also played a significant role. Nevertheless, the overall effect is that older people now have the opportunity to work longer and are choosing to do so.
14.5 The current employment rate for older workers (aged 55-64) in Ireland is over 53% (CSO-QNHS, Q1 2007). The EU25 employment rate for older workers is 42.5% (2005), with the EU target for 2010 at 50%. Nevertheless, there may be scope for further increases in the employment rate for this age group in Ireland as the overall employment rate is at 68.6% and the population in the 55-64 age bracket will increase significantly in years to come.
14.6 Lower employment rates in the 55-64 category may reflect the fact that many older workers move out of the labour force directly from full-time employment. Among males, much of this movement out of the labour force is due to illness. Older women’s lack of participation is almost entirely due to family-related reasons.
14.7 In a recent review undertaken by the IMF (IMF (2005) “Who Saves in Ireland”), it was noted that Ireland already has strong incentives to keep older people in the workforce, that the effective retirement age is one of the highest among advanced economies and that pension age in the public service has recently been increased (see Chapter 13). The compulsory retirement age for most new entrants to the public service has also been removed since 2004. Non-contributory pensioners can earn additional income through employment while retaining their State pension entitlements, following the introduction of a specific weekly earnings disregard in 2006. To address the increasing number of older workers exiting the labour market early through disability benefits, an Employment Retention Grant Scheme and a new wage subsidy scheme have been introduced. In addition, direct and indirect discrimination at work is prohibited by equality legislation.
14.8 Notwithstanding that, the OECD151 has
commented that population ageing in Ireland could have a profound socio-economic impact if Ireland’s potential labour supply is not mobilised more effectively. As pressure builds on the cost of Social Welfare pension provision, the need for greater private pension saving will grow if income adequacy in retirement is to be maintained for all. Policies
151 OECD (2006) ‘Ageing and Employment Policies: Ireland’

�11
GREEN PAPER ON Pensions
that delay retirement, particularly when flanked by other policies to provide alternative sources of income in retirement, allow fiscal goals to be achieved with less pressure to reduce retirement incomes, underlining the desirability of measures that encourage people to work longer.
Environmental Changes
14.9 Life expectancy for men and women in Ireland is increasing and this is a very welcome development. However, as this Green Paper has made clear, increasing life expectancy/longevity brings with it very specific challenges for pensions policy. The longer a person lives, the longer that person will draw a pension, and the higher it costs to provide this pension. The implication of the shift in the ratio between the length of working lives and overall life expectancy is that the cost of funding retirement rises significantly for all concerned.
The individual’s perspective14.10 There are, naturally, a range of viewpoints on
retirement age held by individuals. Among the most important are:
l Many employees look forward to their retirement, and oppose anything that would interfere with their right or ability to retire at the retirement age they have expected;
l The less well-off have lower life expectancies than the better off, and men have lower life expectancies than women. Any increase in retirement age will therefore have a disproportionate impact on the less well-off and on men;
l The State Pension (Contributory) is understood by many to be an entitlement based on many years of PRSI contributions. Any increase in the retirement age therefore might be taken as a breach of this entitlement;
l On the other hand, there are many people who wish to continue working beyond retirement age, and see it as unfair that they can be forced to leave employment without compensation simply because they reach a specific age;
l There are some occupations, especially manual occupations, where the ability to
operate effectively reduces with age. Any increase in retirement age would leave people in those occupations vulnerable;
l For those who have not accumulated sufficient retirement savings by retirement age, further employment may be the only practical means of achieving an acceptable standard of living in retirement; and
l There are a considerable number of obstacles, structural and financial placed in the way of those who wish to work beyond current retirement ages.
The employers’ perspective14.11 Employers may have a number of concerns
about any increase in the retirement age or removal of compulsory retirement:
l In some manual occupations, the ability to operate effectively falls rapidly with age. In the absence of compulsory retirement, or if retirement age was increased significantly, it would be necessary to lay off those employees no longer able to meet the demands of their work. This would be very difficult for both employees and employers;
l The cost of providing health and life insurance benefits, and general insurance for employees increases considerably with age. Raising or removing retirement ages could result in higher costs for employers; and
l In many organisations, retirements provide promotion opportunities for younger employees, which are an important incentive and reduce employee turnover. Higher retirement ages or no compulsory retirement would necessitate a rethink of the promotion structure of such organisations.
14.12 It should also be noted, however, that many employers value the experience and loyalty displayed by older members of their workforce and seek to retain such members of staff beyond normal retirement age, where possible. This is particularly true in the relationship with clients and customers.
14.13 The next section examines whether barriers exists within the work environment, both from a regulatory and attitudinal point of view, that prevent older people remaining in the workforce.
�1�
GREEN PAPER ON Pensions
Barriers to older persons working longer Employment and Equality law14.14 There is nothing in employment or equality law
that imposes a compulsory retirement age. Indeed, some recent measures have improved the possibilities for people to work into older age if they wish.
14.15 An upper age limit of 66 years for bringing claims under the Unfair Dismissals Acts, 1977 to 2005, was removed by the Equality Act, 2004. There is still an upper age limit of 66 years in respect of claims for statutory redundancy payments, but its removal is proposed in the Protection of Employment (Exceptional Collective Redundancies) Bill, 2007.
14.16 In January 2006, the Labour Relations Commission prepared a Code of Practice on access to part-time working, the Industrial Relations Act 1990 Code of Practice on Access to Part-Time Working (Declaration) Order 2006 (S.I. No. 8 of 2006). The preamble to the Code of Practice indicates that widening access to part-time work can have a role to play in increasing the participation of older people in the workforce.
14.17 The Employment Equality Acts 1998 and 2004 protect against discrimination on the grounds of age, and against discrimination on other grounds, in relation to access to employment.
14.18 However, in many employments, in both the private and public sectors, a “normal retirement age”, at or below 65 years of age, is in place. The purpose of such provisions is to give flexibility to employers and employees, having due regard to the nature of the work being performed. Such retirement age limits are not contrary to legislation such as the Unfair Dismissal Acts or the Employment Equality Acts. For example, Section 34(4) of the Employment Equality Act, 1998, reads as follows:
“Without prejudice to subsection (3), it shall not constitute discrimination on the age ground to fix different ages for the retirement (whether voluntarily or compulsorily) of employees or any class or description of employees.”
14.19 Upper age limits on employment have recently been relaxed somewhat in the public service. The Public Service Superannuation (Miscellaneous Provisions) Act 2004, which covers new entrants to the public service on or after 1 April 2004, removed the compulsory retirement age for new entrants to the public service (see Chapter 13), with the exception of certain posts in the Permanent Defence Forces, the Garda Siochána, the Prison Service and the Fire Service. The Act, however, did not affect the terms of public service employees recruited before 1 April 2004, and retirement at 65 remains obligatory for most of these. Section 8 of the Civil Service Regulation (Amendment) Act 2005, provided, with effect from 6 October, 2005, for the recruitment of persons over 65 years to the Civil Service on the condition that the person can be defined as a “new entrant” to the Civil Service.
Cultural Barriers in organisations and society14.20 While the average exit age from the labour
force in Ireland is one of the highest in the European Union, there is nevertheless a culture of retiring before the age of 65. It may be that a mandatory retirement age in many employments has reinforced the tendency. On the other hand, a strong cultural disposition towards retirement before 65 is likely to have been ameliorated by the fall in unemployment levels and an increasing reliance on foreign workers in many sectors of the economy. In any event, the average exit age from the labour force now exceeds 64 years, as indicated at paragraph 14.4 above.
14.21 There is a view that a change of mindset needs to be promoted among both employers and employees to encourage older workers to remain in employment. The social partners would have a significant role to play in bringing this about.
14.22 As outlined above, employers’ attitudes towards older workers are not always positive. Surveys152 have indicated that many employers consider that older people have inappropriate
152 Survey undertaken by Public and Corporate Economic Consultants (PACEC, 2001) as cited in OECD (2006) ‘Ageing and Employment Policies: Ireland’ ; NESF (2003) ‘ESRI Survey of Employer Perceptions on Older Workers’

�1�
GREEN PAPER ON Pensions
skills, are less productive, less flexible, less ambitious and take more sick leave than younger people. However, against that, many employers view older workers as being loyal, reliable and rich in experience.
14.23 Labour force development measures are, as outlined below, addressing the issue. In addition, cultural barriers could probably be usefully counter-balanced by setting retirement age limits and pension structures so as to facilitate a choice by older people to remain longer in employment.
Structural barriers14.24 Early retirement arrangements arise from
time to time due to specific circumstances in particular employments or firms. These arrangements are not necessarily a barrier to people working longer. Indeed, with appropriate retirement age limits and pension structures in place, early retirement arrangements could facilitate a move to a more desirable or appropriate job for an individual in mid or late career.
14.25 Specific working periods are a feature of many pension arrangements. It appears that entitlement to a “full” pension after a set period, usually forty years in Ireland, needs to remain a feature of pension schemes if they are to continue to appeal to the consumer. Options to defer pension and have it paid later at a higher rate appear a useful way of facilitating individuals to choose to stay longer in work. Arrangements for pension contributions could also offer a range of options during the deferral period.
14.26 Many individuals spend extended periods out of paid employment or working on a part-time basis. These people may have inadequate pension contributions on retirement, or may be less likely to join a pension scheme than those working full time for a whole career. Flexibilities in the pension system, such as voluntary contribution options and deferral of pension payments, are likely to be helpful in this situation.
14.27 Flexibility in working hours, particularly through the availability of part-time work, can have a part to play in increasing the
participation of older people in the workplace. Options such as a gradual move to retirement may also have a positive role to play. Employers are being encouraged to adopt more flexible working arrangements which would facilitate older workers to remain in or return to the workforce.
Restrictions in the State Pensions System and work related issues14.28 In relation to retirement, and as outlined in
Chapter 6, the existing Social Welfare pensions structure may be considered restrictive in a number of ways:
l There is a requirement for people to retire and give up employment in order to claim pension at the normal retirement age of 65 years of age;
l There is no facility available for people who have reached 65/66 years of age with a less than complete insurance record to improve on their record through further employment and qualify for a better pension; and
l there is no provision within the system to allow for someone who must/wants to retire earlier than the normal retirement age.
14.29 More flexibility may thus be needed in the Social Welfare pension system in order to align its criteria with a changed environment.
Overcoming Barriers to Working Longer
Policy Developments14.30 Over the years, many barriers to workforce
participation, particularly female participation, have been removed. Policies to facilitate female participation, as well as to combat both youth unemployment and long-term unemployment, have been successfully developed and implemented.
14.31 More recently, the social partnership agreement, Towards 2016, indicates (Section 32.2.6) that, in the context of changing demographic patterns, a key objective for the Government and social partners is to maximise the opportunities for older people to participate in education, employment and other aspects of economic and social life:

�1�
GREEN PAPER ON Pensions
“The continued participation of older people in the labour market will be encouraged and facilitated to meet the challenge of an ageing society. A cultural mindset change will be promoted among both employers and employees to encourage older workers to remain in employment. Promotion of training and upskilling of employees, particularly for low-skilled/older workers, will take place to enhance employability in the context of the impact of globalisation. The preventive process will be extended to those aged 55-64 to facilitate unemployed older workers remaining attached to the labour market. Training and advisory services, including those provided by FÁS, will assist older people who wish to return to the workplace.”
Labour Force Development measures14.32 It is important that a distinction is made
between efforts to encourage people to work up to the age of 65 and initiatives to allow people to continue working beyond retirement age. Labour market measures are primarily aimed at the pre-retirement age group. The primary objective of labour market measures in this area is to try to encourage people to remain in employment up to the age of 65.
14.33 The Preventive Process, whereby those on the Live Register for more than 3 months are referred to FÁS to assist progress towards employment, training or active labour market programmes, was extended in July 2006 to the 55-64 year old category. This complements the phasing out of the Pre-Retirement Allowance (PRETA), where older workers could receive financial support but were not required to be available for work.
14.34 The Disability Scheme, a new wage subsidy scheme introduced in 2005, encourages employers in the private sector, through financial support, to employ people with a disability. Older workers who are claiming Disability Benefit can avail of this scheme. The increase with age in claims of disability benefits and invalidity pensions could be examined to determine the issues underlining early withdrawal from the labour market.
14.35 Guidelines could also be developed to improve working conditions for older workers.
Guidelines for improving working conditions for older workers were originally suggested by the OECD (2006) in “Ageing and Employment Policies - Ireland”. The OECD suggested that the Government and social partners should issue guidelines and proposals for developing innovative work arrangements and job design and improving the work environment for older workers. Germany’s new ‘Quality of Work’153 initiative which promotes improved working conditions in light of demographic changes was cited as a good example. Another example is ‘Managing Age: A Guide to Good Employment Practice’, published in February 2007 for the CIPD UK and Trades Union Congress (TUC) by Middlesex University and Centre for Research. The Guide focuses on the older workforce and outlines:
l HR approaches that are consistent with employment law regulations;
l means of developing good practice to meet new legal requirements;
l the business case for employing people of all ages;
l guidance on good people management; and
l principles to support and sustain business success.
14.36 One of the more effective ways to raise long-term economic performance is to boost the skills of workers. The promotion of training amongst older workers has been undertaken to a lesser degree than amongst younger workers. Research shows that effective skill development is best started at an early age. It is therefore important to ensure that education and training opportunities are available over a worker’s career, so as to reduce the need for later interventions which are less effective. At the same time, however, the availability of training to older workers is now also being stepped up.
14.37 A substantial increase in funding has been provided to the FÁS Competency Development Programme and its Workplace Basic Education Fund, as well as to the Skillnets Training Networks Programme, to enhance in-company training and basic skills development
153 http://www.inga.de/Inga/Zentralredaktion/PDF/English/old-and-young-pdf,property=pdf,bereich=inga,sprach=de;rwb=true.pdf

�1�
GREEN PAPER ON Pensions
programmes. This approach will assist in the adaptability of workers, and particularly older workers, operating in a rapidly-changing globalised economy, enabling them to transfer to new jobs more easily or to move up the value chain in terms of quality of job.
14.38 Consideration also needs to be given to how people could be encouraged to continue to earn at older ages or after they take formal retirement. For example, this may be part-time work in their own area of experience (increasingly common among self-employed professional people) or it may result from retraining or commencement of a new career, perhaps working shorter hours and/or at lower rates of pay.
14.39 Attention might also be given to the alignment of policies to support any change in retirement age, including policies to:
l Continue to create the conditions for economic growth and competitiveness so that there are sufficient employment opportunities for all, to support our economic capacity and to ensure that everyone has the opportunity to work and save for their retirement;
l Narrow health inequalities, through initiatives such as the National Action Plan for Social Inclusion, so that all socio-economic groups enjoy life expectancy increases and better health;
l Adapt HR processes and practices, e.g. recruitment, performance management and career progression, and where necessary employment law, and provide guidance to employers and employees in this regard;
l Intervene early to retrain workers – identified by the National Economic and Social Forum Report in 2003 as the most cost-effective method to prolong labour market participation. This will also assist in increasing the quality of the workforce;
l Improve overall skills and training among workers at all stages of their careers, enabling all workers to maximise their career options; and
l Support cultural changes necessary through:
l Effective supports, including reviewing perceived barriers to the employment of
older people such as insurance costs, considering financial incentives for employers to hire post-retirement age workers (e.g. reduced social insurance contributions for older workers) and occupational health initiatives;
l Communication of the employment rights and responsibilities, the attractions and demands of staying at work and communicating the business case for employers of employing older workers in terms of minimising cost pressures, flexibility, broadening the available labour pool, reducing absenteeism and turnover, etc., and understanding of diverse customer base.
Pensions and the Eu
14.40 Before discussing possible options for change in relation to the retirement age, it is important to consider the debate which is ongoing within the EU in relation to pensions. Several European Councils have highlighted the challenge of an ageing population and its implications for the maintenance of adequate and sustainable pensions.
14.41 The Laeken Council in December 2001 launched what is known as the open method of coordination on pensions. This approach to policy making and information sharing is based on eleven common objectives under three headings: (i) safeguarding the capacity of pensions systems to meet their social objectives; (ii) maintaining their financial sustainability; and (iii) meeting changing societal needs.
14.42 The concerns at EU level are to ensure that pension systems provide retired people with a securely financed adequate income that does not destabilise public finances or impose an excessive burden on future generations. At the same time, pensions systems should maintain fairness and solidarity and respond to the changing needs of individuals and society.
14.43 Since the 1950s, life expectancy has increased by 8-10 years in European countries while, over the same period, male labour force
�1�
GREEN PAPER ON Pensions
participation at the age of 60-64 has dropped from close to 80% to around 30%. In countries such as Austria, Belgium, France and the Netherlands, participation rates for older men have dropped to 20% or lower. During this time, the statutory age of entitlement to public old-age pensions has not changed significantly. In most Member States, a rapid fall in the employment rate occurs at around 55 years of age. The Lisbon Council set a target to increase the average EU employment rate among older women and men (55-64) to 50% by 2010 and Ireland has achieved this target.
14.44 There has been some discussion with regard to a general rise in retirement ages and some countries have taken action in this regard. However, for many countries, the focus is on measures which will raise the effective retirement age and initiatives being implemented include:
l tightening the conditions for early retirement;
l increasing the contribution levels required for full pensions;
l introducing a strong actuarial link between contributions and benefits;
l providing for flexibility in the retirement age;
l creating incentives for workers who want to remain in the labour market after age 65;
l facilitating a gradual move into retirement through changed working arrangements.
Retirement Age Options
Deferring the Social Welfare Pension 14.45 The State has direct control over the age at
which State benefits are paid. Any change has an indirect effect on supplementary benefits.
14.46 Some countries operate a system whereby there is flexibility in the age at which State pensions will be paid. However, in drawing down a pension earlier than the statutory age, a person may incur an ongoing penalty in terms of the rate of payment they receive. This might involve a 5 to 10% reduction for each additional year pension is received. For example, a person taking pension at age 60
would see his/her rate of payment reduced on a permanent basis by between 25% and 50%. In this way, the link between contributions and benefits is strengthened.
14.47 If such a measure was being considered in Ireland, we would need to take account of the relationship between such a pension and other Social Welfare payments. For instance, a reduction of 25% in a person’s State Pension (Contributory) would bring recipients below the current Supplementary Welfare Allowance rate of €185.80 per week which would, subject to other means, make them eligible for a top-up and other supplementary payments. The reduced rate of payment could also be below other scheme payments such as Invalidity Pension which, it appears, already supports a degree of early retirement.
14.48 In any event, the early retirement rate in Ireland is not as high as in other countries and work force participation rates for older people have reached the target set by the European Council. It is important that this trend is maintained and this suggests that there should be no downward move in the normal retirement age for Social Welfare purposes.
14.49 While workforce participation for older workers is above the EU average, research suggests, nevertheless, that early retirement is common in this country. On examination of a sample of people who had already retired, it was found that two thirds had left employment before age 65. The most common reason, which accounted for one-third of early retirements, was illness or disability. Access to a voluntary redundancy package or pensions, which made early retirement affordable, accounted for the second highest proportion of early retirements, i.e. 27%. The research also found a preference for early retirement amongst those still at work, with 37% indicating that they would like to retire as soon as possible154.
154 Older People’s Preferences for Employment and Retirement in Ireland (Fahey and Russell) - Paper presented to conference on Employment and Retirement among the over 55s; Patterns, Preferences and Issues, NCAOP Sept 2001.

�1�
GREEN PAPER ON Pensions
14.50 Given the absence of any formal support for early retirement in the Social Welfare system, it appears early retirement is already well supported through occupational schemes. In the circumstances, again, there does not seem to be any need for the Social Welfare system to further supplement this process by paying pensions before age 65.
14.51 In the Public Service, the trend is to raise retirement ages. Recommendations of the Commission on Public Service Pensions sought to raise the retirement age for public servants to 65, although this was not a unanimous view. However, the Public Service Superannuation (Miscellaneous Provisions) Act 2004 increased minimum retirement ages for most new entrants to the public service to 65 years of age. That said, there will be people for whom retirement before age 65 is a necessity due to, for example, redundancy late in life or ill health.
14.52 Allowing people to postpone retirement and to improve their Social Welfare benefits through further employment would be more in keeping with EU policy in this area. An example of a model, already in use in Finland, involves a worker being able to claim pension anytime after 60 years of age. However, the pension is permanently reduced by 0.5% per month between age 65 and the age that the pension is claimed. A person claiming pension at 60 years of age, for example, suffers a permanent reduction of 30% in the pension paid. Similarly a person who postpones retirement until after 65 years of age receives a higher payment with an additional 1% paid for each month by which retirement is postponed. Similar arrangements now exist in the UK with an option to take a lump sum instead of an enhanced pension. The objective of these systems is to link the overall cost of pension, the length of time over which the pension is claimed and estimated life expectancy.
14.53 If such a model could be combined with allowing those with reduced entitlements to count contributions made after age 65/66 so that they could improve their position, it would deal with most of the criticism relating to the inflexibility of the existing Social Welfare pensions system and contribute to
the incentives available for people to remain in employment after normal retirement. It would be important that the overall cost of pensions did not increase. However, it is difficult to see how an increase in costs could be avoided for those with reduced entitlement working to improve their position.
14.54 For those with full entitlement deferring payment, the scheme would need to be actuarially based to take account of Irish conditions including life expectancy of Irish people and the overall cost of pension provision for the individual.
14.55 An insured person deferring his/her pension from age 65 would expect a higher pension because the pension would be payable for a shorter period and there would have been a “loss” of income over the deferred period. The same factors should be applied to increases for qualified adult allowances. The following table sets out the possible rates which could be applied if pension were deferred beyond age 65, with age 70 being the latest age to which deferral could be made.
Table 14.1: Deferred Pension - Possible Rates (%)
Deferral to age
Male Female Average (unisex)
66 109.8 109.3 109.6
67 120.8 119.6 120.2
68 133.1 131.0 132.1
69 146.6 143.8 145.2
70 161.8 158.0 159.9
14.56 Assuming that insured persons would retain the right to take a pension at age 65/66, three distinct situations where “deferral” could arise are as follows:
l Where the necessary contribution record is not established by age 65/66;
l Where deferral results in the insured person qualifying for a higher rate of pension by making additional contributions. This would be very common if the qualifying period was significantly extended;
l Where the insured person simply wishes to defer income. As the deferred pension should be calculated on an actuarial basis this would be cost neutral. There may be

�1�
GREEN PAPER ON Pensions
some slight selection on health grounds but the financial impact should be small.
Retirement age and the Social Welfare pension
14.57 The previous discussion examined the implications of allowing flexibility in relation to the State retirement age, particularly in relation to deferring the Social Welfare pension. In broad terms, however, the options regarding the retirement age for Social Welfare pensions are as follows:
i) Leave the retirement age as it is, with no incentives introduced to encourage employees to remain in the labour force post-retirement age;
ii) Remove barriers to working longer, including the requirement whereby a person reaching 65 years of age must first retire for a period before being able to work and retain a portion of their pensions, possibly subject to a limited number of exemptions for specific occupations;
iii) Incentivise those who wish to remain in the labour force after retirement age. Incentives could include a larger pension (on an actuarial basis) if deferred over a number of years and could also seek to increase arrangements for workers to draw down part of their pension, while working part-time;
iv) Increase the retirement age incrementally: a) over a number of years, in line with some
other countries; b) in line with life expectancy for different
age cohorts.
v) Increase the retirement age for younger people;
vi) Lower pension payout. While this is an option that some countries are pursuing, it would seem counter to Government policy in relation to the goals of State Pension which include poverty alleviation and a minimum income guarantee.
Social Welfare Pensions: Raising the Age for All14.58 The National Pensions Review (2006)
considered the question of an increase in the State retirement age. The primary argument in favour of increasing retirement age is financial. A further argument in favour of such an increase is on grounds of inter-generational equity, the principle whereby each generation should enjoy the same proportion of adult life spent contributing taxes to support Social Welfare pensions and spent receiving Social Welfare pensions.
14.59 This principle arises in the context of increasing life expectancy for people aged 65 years and over for whom, as a consequence, the proportion of adult life spent in retirement would increase and the proportion spent in employment would fall unless the retirement age were to be increased. Although the financial argument is strong and the principle of inter-generational equity is clear, there are nevertheless some obstacles which would have to be overcome and issues to be examined further if the State retirement age were to be increased.
14.60 Among the possible obstacles is the view that Social Welfare pensions are a contract between contributors and the State which should not be changed unilaterally. Another is that there could be opposition on health grounds to people being required to work longer. Finally, there could be a knock-on effect on the benefits provided by occupational pension schemes, in practice if not in law, particularly in relation to integrated defined benefit schemes.
14.61 The fact that average life expectancy is lower for those on lower incomes means that any given increase in the retirement age would be proportionately more unfavourable for the less well-off. Most lower earners would be wholly dependent on the first pillar pension, whereas higher earners, who also have longer working lives than lower earners, are more likely to have other resources to allow them retirement flexibility. Another issue is that, for savings to ensue, those below the raised pension age would have to continue to be gainfully employed, not having recourse to other Social Welfare benefits. Finally, competition for employment would be increased for those not yet eligible

�1�
GREEN PAPER ON Pensions
for the Social Welfare pension. This could have some effect on unemployment and earnings.
Social Welfare Pensions: Raising the Age for younger People14.62 The Actuarial Review of the Social Insurance
Fund (SIF) presents a number of methods for phasing in retirement age increases, which attempt to track the improvement in life expectancy that are expected for younger age groups over time.
14.63 The first method is an increase in the retirement age of one year in every decade, phased in from 2014-2015. Each one year increase would be phased in over two years, to smooth the transition between each increase. The retirement age increases proposed under this model are:
Table 14.2 – Retirement age increases by calendar year
Calendar year Retirement age – option AUp to 2013 652014-2015 65 – 662016-2023 662024-2025 66 - 672026-2033 672034-2035 67- 682036-2043 682044-2045 68 – 692046-2053 692054-2055 69 – 702056+ 70
14.64 The second method proposed is based on the year of birth of pensioners when they reach retirement age. Two different approaches were examined in the Review, with ‘Option C’ pushing back the effective year of introduction by ten years compared to ‘Option B’, i.e. people born in each decade can retire a year earlier under ‘Option C’.
14.65 The Review includes an increase in labour force participation at each increase in retirement age and also includes additional SIF expenditure in relation to unemployment, illness and invalidity claims by people aged 65-69 arising from the increase in retirement age.
14.66 The savings from the increase in retirement age are presented in terms of the reduction in the projected deficit155 (benefits less contributions) of the SIF over time. It is clear that increasing the retirement age has the potential to contain, to some degree, the extent in the projected rise in benefit expenditure. Under Options A and B, which are based on almost identical retirement ages, the projected shortfall falls to 5.3% of GNP in 2061 from 6.4% in the absence of any reforms. Savings are phased in more slowly under Option C, with a deficit of 5.5% of GNP projected in 2061.
155 Benefits are indexed in line with earnings while contribution rates are assumed to be as for the current system.
Table 14.3 – Entry cohort methods of increasing the retirement age
year of birth Retirement age – option B, phased from 2016 Retirement age – option C, phased from 2026Up to 1950 65 651951 to 1960 66 651961 to 1970 67 661971 to 1980 68 671981 to 1990 69 681991 to 2000 70 69
Table 14.4 – Approximate effect of gradually higher retirement age on projected deficit of the Social Insurance Fund (% of GNP)
2021 2031 2041 2051 2061No change 1.1 2.7 4.6 6.3 6.4Option A 1.0 2.3 3.8 5.1 5.3Option B 1.0 2.3 3.8 5.1 5.3Option C 1.1 2.5 4.0 5.4 5.550% pension 2.5 4.8 7.4 9.9 10.0Option B1 2.3 4.2 6.1 7.9 8.3

��0
GREEN PAPER ON Pensions
14.67 The Social Welfare reforms presented in the UK pensions White Paper combined an effective pension increase (restoration of earnings indexation) with an increase in the retirement age. The SIF Review includes projections of a pensions increase to 50% of GAIE, or c. €300 in 2007 terms. This adds substantially to the proposed deficit in the SIF over time, with an eventual increase of 3.6% (to 10% of GNP) by 2061. Combining the pension increase with Option B limits the increase in SIF expenditure somewhat, and results in a final deficit level of 8.3% (‘Option B1’).
14.68 It is common for any changes to the retirement age to be announced clearly and introduced gradually, so that a higher retirement age applies only to those born more recently. A balance will need to be achieved between maintaining the stability of the Social Welfare pension system, supporting the voluntary nature of occupational pension provision and intergenerational fairness.
14.69 Increasing the retirement age for the Social Welfare pension is one of the most efficient ways to provide an appropriate basic retirement pension, as it allows the State to target resources towards those who need it most.
Retirement age and occupational schemes
14.70 In relation to occupational pension schemes, it has been suggested that members of occupational pensions should have the option (but not the obligation) to remain in employment beyond the retirement age of their schemes and continue to accrue additional pension entitlements. Some employees, especially in manual occupations, would not be physically able to work beyond the age of 65. Were the mandatory retirement age raised or removed, there might be employees who wished to continue working but were not capable of doing so, and assessment procedures would have to be invoked by employers.
14.71 However, the purpose of this proposal is that such employees could use the additional
period of employment to accrue further pension if their entitlements at normal retirement would not be adequate. A further development of this proposal is to allow employees the option of part-time working combined with partial drawdown of any pension entitlements.
14.72 While provisions for early retirement can exist, the majority of occupational pension schemes have a normal retirement age of 65, with a relatively small proportion having a retirement age of 60 to 64, and a very small number allowing earlier retirement for specified professions. Some of these schemes have provision for late retirement, almost always relying on the consent of the employer. The increase in life expectancy has affected the provision of supplementary pensions as set out in the following paragraphs.
14.73 For members of defined contribution schemes or contributors to Personal Retirement Savings Accounts and Retirement Annuity Contracts, the effect of the increase in life expectancy is to reduce their retirement benefits because the amount they save will purchase less pension. Interest rate changes and the low returns on equities has meant that it has not been easy to distinguish the effect of improved life expectancy separately from other factors. However, the changes in life expectancy over the last 10 years would have on their own caused a fall of approximately 10% in retirement incomes.
14.74 The effect on defined benefit schemes has been more complex. Again, it has been obscured by investment losses and interest rate falls of recent years. However, the underlying result has been an increase in benefit costs. This has been more than 10% because not alone have actuarial valuations reflected the increases seen to date, but they also reflect the belief that mortality is likely to continue to improve at a faster rate than was previously expected.
14.75 In many defined benefit schemes, the cost of the improvement in mortality has been met wholly by the employer. However, because of this increasing cost, a number of these schemes have been closed to new entrants,

��1
GREEN PAPER ON Pensions
who may have a defined contribution scheme instead. At least part of the effect of the mortality changes has therefore been borne by employees with shorter service, whose benefits at retirement in the replacement scheme will be less valuable. In other defined benefit schemes, members may also (in some schemes with the members’ agreement) have had their contribution rates increased, and in some cases, benefits may also have been reduced.
14.76 The impact of mortality improvements will be increased because people are joining the workforce later. Thus, the cost of a longer retirement has to be financed during a shorter working life.
14.77 The suggested change to allow optional later retirement could be implemented by prohibiting the imposition by employers of any mandatory retirement age, or by prohibiting any mandatory retirement age less than, say, 68 or 70 except for a small number of occupations. This would allow employees more flexibility in meeting their retirement savings needs, and would also have the beneficial effect of allowing those who wish to continue working to do so.
14.78 In relation to the interaction of occupational pension scheme provision and the taxation system, some changes could be considered to incentivise working later including:
l Adjusting age-limits on pension contribution tax reliefs;
l Increasing the flexibility of the tax rules to permit an older worker to draw a partial occupational pension while continuing to work for the same employer where the scheme rules allow. (Currently, an employee who reaches normal retirement age and continues in service can either elect to defer receipt of pension benefits or choose to commence benefits - taking the tax-free lump sum and/or the full pension immediately – and continue working); and
l Review the minimum age of 50 for early retirement.
14.79 Finally, in order to ensure adequate replacement incomes for people in retirement,
at whatever age that may be, supplementary pension coverage will need to increase further and allow people easier access to more flexible products through which they can prepare for retirement.
Conclusion
14.80 Enhancement to the Social Welfare system can make some contribution to encouraging longer working amongst older people and a number of ways in which this can be done have been outlined in this chapter. However, it must be stressed that these measures cannot, on their own, deal with the question of increasing employment amongst older people or provide sufficient incentive to people to remain in employment after “normal” retirement age. Generally speaking, workers do not, in most cases, have any choice when it comes to retirement. Most employments have a compulsory retirement age at 65 and some flexibility may need to be introduced here to allow people to benefit from the measures suggested. The attitudes of employers and, indeed, employees will be crucial.
14.81 In relation to overall policy objectives, mobilising the labour supply of older people will be an important strategy to cope with the challenges Ireland faces as a result of population ageing.
14.82 Lower pensions, higher saving, higher public expenditure or longer working lives are the four key policy options available, with sustainability, adequacy of retirement incomes and increased coverage of private pensions the priority goals.
14.83 Compared to the past, people now tend to start working life later because of longer education, and tend to retire earlier and live longer, healthier lives. For all these reasons, pensions are more costly per person and people contribute for fewer years per year of retirement.
14.84 In light of the above, retirement age needs to:
l Be appropriate to make it possible to provide an adequate pension;

���
GREEN PAPER ON Pensions
l Rise in a rational way as life expectancy increases;
l Enable labour-market flexibility, allowing people attractive choices to generate income and to phase the move from full-time work to full retirement. This could involve:
l winding-down – where people can work part-time and take part of their pension;
l stepping down –where they might take a less demanding role that still uses their skills, and;
l drawing down – where someone retires and takes their pension but later returns to work and starts another pension.
14.85 To further facilitate the employment of older workers, a range of options may be considered, as follows:
l Providing for flexibility in the retirement age;
l Creating incentives for workers who want to remain in the labour force after the age of 65;
l Facilitating a gradual move to retirement through changed working arrangements;
l Increasing the contributions required for full pensions and/or the qualification period for benefits; and
l Tightening the conditions for early retirement.
14.85 Given that Ireland is seen to be in a position of strength relative to other developed economies in terms of retirement age, properly designed, imaginative incentives which allow a flexible approach to employment in later years may bring the results needed. Such an approach could contribute to the reduction of costs of pensions, reduce inactivity levels and, for the individual, broaden ways to maintain a decent standard of living into older age by accessing good quality work.
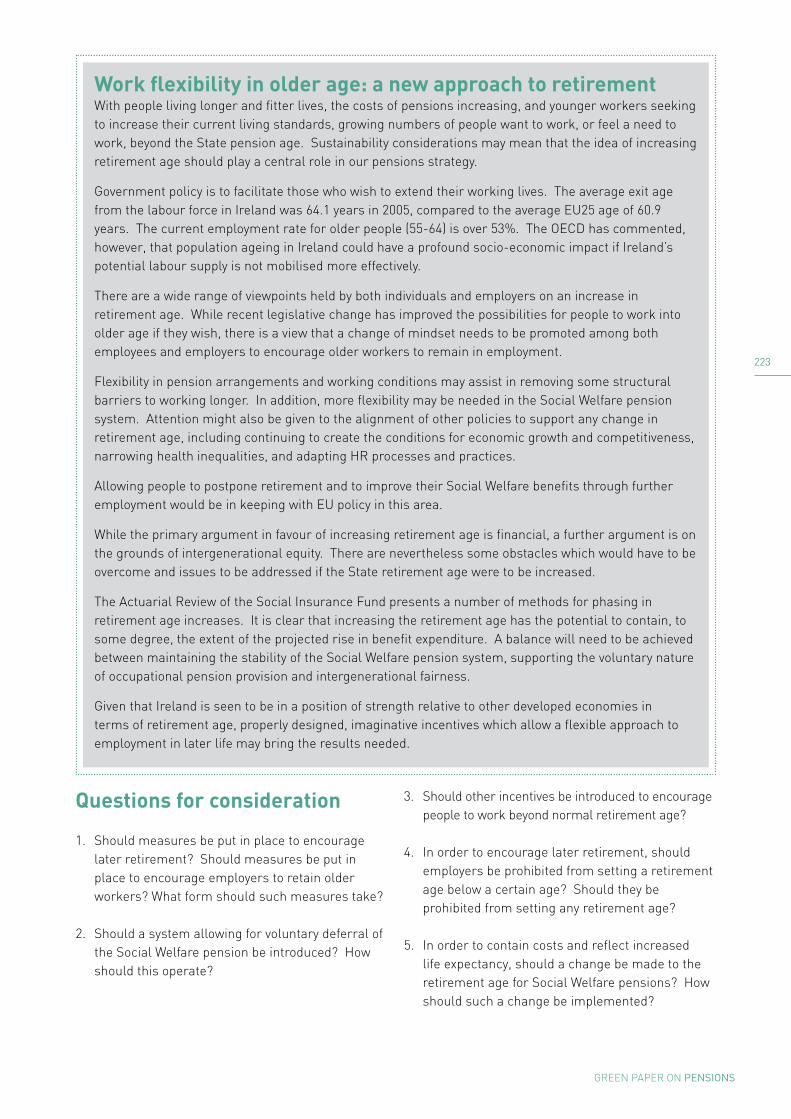
���
GREEN PAPER ON Pensions
Work flexibility in older age: a new approach to retirementWith people living longer and fitter lives, the costs of pensions increasing, and younger workers seeking to increase their current living standards, growing numbers of people want to work, or feel a need to work, beyond the State pension age. Sustainability considerations may mean that the idea of increasing retirement age should play a central role in our pensions strategy.
Government policy is to facilitate those who wish to extend their working lives. The average exit age from the labour force in Ireland was 64.1 years in 2005, compared to the average EU25 age of 60.9 years. The current employment rate for older people (55-64) is over 53%. The OECD has commented, however, that population ageing in Ireland could have a profound socio-economic impact if Ireland’s potential labour supply is not mobilised more effectively.
There are a wide range of viewpoints held by both individuals and employers on an increase in retirement age. While recent legislative change has improved the possibilities for people to work into older age if they wish, there is a view that a change of mindset needs to be promoted among both employees and employers to encourage older workers to remain in employment.
Flexibility in pension arrangements and working conditions may assist in removing some structural barriers to working longer. In addition, more flexibility may be needed in the Social Welfare pension system. Attention might also be given to the alignment of other policies to support any change in retirement age, including continuing to create the conditions for economic growth and competitiveness, narrowing health inequalities, and adapting HR processes and practices.
Allowing people to postpone retirement and to improve their Social Welfare benefits through further employment would be in keeping with EU policy in this area.
While the primary argument in favour of increasing retirement age is financial, a further argument is on the grounds of intergenerational equity. There are nevertheless some obstacles which would have to be overcome and issues to be addressed if the State retirement age were to be increased.
The Actuarial Review of the Social Insurance Fund presents a number of methods for phasing in retirement age increases. It is clear that increasing the retirement age has the potential to contain, to some degree, the extent of the projected rise in benefit expenditure. A balance will need to be achieved between maintaining the stability of the Social Welfare pension system, supporting the voluntary nature of occupational pension provision and intergenerational fairness.
Given that Ireland is seen to be in a position of strength relative to other developed economies in terms of retirement age, properly designed, imaginative incentives which allow a flexible approach to employment in later life may bring the results needed.
Questions for consideration
1. Should measures be put in place to encourage later retirement? Should measures be put in place to encourage employers to retain older workers? What form should such measures take?
2. Should a system allowing for voluntary deferral of the Social Welfare pension be introduced? How should this operate?
3. Should other incentives be introduced to encourage people to work beyond normal retirement age?
4. In order to encourage later retirement, should employers be prohibited from setting a retirement age below a certain age? Should they be prohibited from setting any retirement age?
5. In order to contain costs and reflect increased life expectancy, should a change be made to the retirement age for Social Welfare pensions? How should such a change be implemented?


APPENDICES

���
GREEN PAPER ON Pensions
International Pension Systems
This appendix provides examples of how pensions systems are organised in different countries. Generally speaking, these examples are intended to illustrate the different types of system which can apply: defined benefit earnings-related payments through the state system, mandatory private pensions, and a basic state pension with no incentives for private provision. The case of the Netherlands is also included - a system which combines a statutory scheme and a voluntary occupational system which has achieved almost 100% coverage through the use of industry-wide schemes.
Germany
The main element of the German pension system is a state-run earnings-related pension funded by social insurance contributions and federal state subsidies. The contribution rate is 19.5% and approximately 80% of the employed population are covered. Voluntary company pension schemes cover about 50% of men (and fewer women) and, along with individual supplementary pension schemes, are tax-incentivised up to a specified cap. In 2003, benefits from the state system contributed 66% of total income of people over 65, old age pensions insurance contributed 21% (7% from occupational schemes) with various forms of third pillar provision contributing 7%.
In order to limit the future cost of state pensions, reforms to the German system have sought to raise retirement ages, reduce replacement rates provided by the state system and bridge the resultant gap by encouraging more supplementary/private provision.
Sweden
The Swedish state pension system has been reformed extensively in recent years and now comprises three elements - a notional defined
contribution scheme based on contributions of 16% of earnings, an individual defined contribution account with 2.5% of earnings contributed, and a guaranteed minimum pension for those whose earnings-related pension is relatively low or who have no such pension.
The first part of the system is a pay as you go scheme but “notional” contributions are made to an individual account and this is annuitised at retirement based on total “contributions”, using a flexible indexation system based on wage growth and cohort-specific life expectancy calculations. The objective is to keep pension costs in balance and sustainable at current contribution levels. However, it is accepted that this may not always be possible and, as an added safeguard, Sweden has created a reserve fund and also has a “brake” that can be activated when necessary to temporarily suspend indexation.
Benefits accruing under the funded part of the system are based on investment performance of the individual accounts. The income test for the guaranteed pension is based only on the level of the earnings-related pension being received, but it is subject to a residency test (40 years for a maximum payment).
Occupational pensions are also available in Sweden and cover around 90% of workers. The schemes are regulated by collective agreements between employees and employers with the four largest schemes accounting for 80% of workers. These schemes provide a supplementary income of about 10% of final salary.
Australia
The Australian state pension (Age Pension) is a non-contributory, flat rate pension payable to people whose income and assets are below a certain level. Men aged 65 and women aged 62 (to be increased to 65) can qualify provided they have lived in Australia for at least 10 years. The pension is price-indexed but there is a commitment to maintain benefit for a single pensioner at 25% of average earnings.
APPENDIX A (CHAPTER 1)

���
GREEN PAPER ON Pensions
Since 1992, Australia has a mandatory supplementary pensions system which operates through the private sector. Employers are required to contribute 9% of salary (up from 3% on implementation) with incentives for employees to contribute a further 2-3%. It is planned to gradually raise employer contributions to 12%.
The main achievement of the Australian system is the coverage rate it has achieved with 92% of employees covered (50% of self-employed). Concerns about the system centre round the impact it has had on defined benefit provision (almost all DB schemes closed to new members), the adequacy of the contributions being made to schemes and the extent of “lost” accounts in the system. In relation to the latter, many members fail to roll together or consolidate accounts on changing jobs with the result that there are an estimated 5.4 million “lost” accounts containing AD 8.2 billion in assets.156
New Zealand
New Zealand has a flat rate, universal pension (New Zealand Superannuation) alongside tax neutral occupational and private pensions. The pension is paid to people from age 65 who meet the residency requirements (10 years resident in New Zealand from age 20 with 5 years since age 50). Rates vary depending on status (married or single). Currently, the rate for a single person living alone is $263.90 (€140.21) per week. When wages increase, New Zealand Superannuation is adjusted so that it stays between 65% to 72.5% of average ordinary time earnings after tax (gross earnings less overtime)157. While the system is also one of the least generous public pensions systems in the OECD, the level of the pension provided is generally above the 60% median income threshold which means that New Zealand pensioners have a low poverty risk.
Occupational pensions are available but membership is small and declining. There are no tax incentives and no limits on what a person can save for pension. New Zealand introduced a “soft mandatory” scheme called KiwiSaver in July 2007 to encourage retirement saving.
156 Presentation by Senator Nick Sherry on Australian Pensions Reform to the Minister for Social and Family Affairs.
157 www.sorted.org.nz
Membership is voluntary and open to all New Zealand residents aged up to 65. From 1 July 2007, those aged 18 years or over starting a new job will be automatically enrolled in KiwiSaver. Other people can choose to opt in. Contributions can range from 4% to 8% of salary.
There is a range of membership benefits to encourage people to start saving, including a $1,000 tax-free kick-start and subsidised scheme fees. Regular savings over a period of 5 years can also help to qualify a person for a house deposit subsidy.
Netherlands158
The AOW is the Netherlands’ statutory old age pension scheme. It provides all residents of the Netherlands at the age of 65 with a flat-rate pension benefit that, in principle, guarantees 70% of the net minimum wage. There is no means test for the eligibility of benefits; other forms of income have no effect on the AOW benefit.
All residents of the Netherlands between the ages of 15 and 65 are insured for the AOW. No distinction is made between men and women, between civil servants, employees, self-employed or people working in the home. During the period of insurance, entitlement is accrued in 2% steps for every insured year. This leads to a 100% entitlement to the relevant pension benefit on reaching the age of 65, provided there are no gaps in the period of insurance. A gap occurs when a person resides outside the Netherlands. People who are not entitled to the full AOW benefit and who have, together with other sources of income, a total income below the subsistence level (i.e. less than 70% of the legal minimum wage) are entitled to receive social assistance.
Although there is no obligation for employers to make pension commitments to their employees, the vast majority of those employed in the Netherlands (over 90%) participate in an occupational pension scheme. Occupational pensions are subject to negotiation between the social partners and have to be financed by capital funding. A pension scheme is part of the employment conditions laid down in an agreement (which may be a collective agreement).
158 Ministry of Social Affairs and Employment, Netherlands http://internationalezaken.szw.nl/index.cfm?fuseaction=dsp_rubriek&rubriek_id=13017

���
GREEN PAPER ON Pensions
Characteristically, final salary schemes and average pay schemes promise a yearly replacement rate of 1.75% to 2% of the final salary or average career salary (including first pillar benefits). If the collective labour agreement lasts for 35 to 40 years, the total pension benefit will be around 70% of the final salary, including first pillar benefits. Occupational pension schemes are considered supplementary to the AOW state pension. The AOW benefit is therefore a factor included in most calculations of second pillar pension schemes in order to arrive at the 70% aim referred to above. This is known as the AOW franchise.
As of January 1st 2002, some 93% of all active members were participating in a defined benefit scheme, of which 1/3 were in a career average pay scheme and 2/3 in a final salary scheme. Usually, the way contributions are divided among social partners varies from one pension scheme to another. According to Statistics Netherlands (CBS), the average employer contribution amounts to approximately 78% of all contributions.

���
GREEN PAPER ON Pensions
APPENDIX B (CHAPTER 5)
The Social Welfare Pension System in Ireland: Development and Cost
History of the Social Welfare Pensions System
B.1 The first Old Age Pension was introduced in 1908. The pension was means-tested and is now known as State Pension (Non-Contributory). The system of widows’ and orphans’ pensions was first introduced in 1935.
B.2 Before 1953, coverage for social-insurance-type benefits was provided through three different types of contributions:
l National Health Insurance - provided cover for Sickness Benefit, Maternity Benefit and Disablement Benefit;
l Widow's and Orphan's Insurance - provided cover for Contributory Widow's and Orphan's Pensions;
l Unemployment Insurance - provided cover for Unemployment Benefit.
B.3 These schemes were administered by a range of Government Departments and bodies. The Department of Social Welfare was established in 1947 to bring all the various Social Welfare schemes together and a unified system of social insurance came into effect in 1953.
B.4 The Old Age Contributory Pension (now known as State Pension (Contributory159) was introduced in 1961 and at that time was payable at age 70. This was the first significant addition to the range of contingencies covered since the
159 The main legislative provisions relating to the State Pension (Contributory) are contained in Chapter 15, (Sections 108 to 113) of Part II of the Social Welfare (Consolidation) Act 2005, as amended, and Chapter 7 (Articles 59 to 67) of Part II of the Social Welfare (Consolidated Claims, Payments & Control) Regulations 2007 (S.I. 142 of 2007) as amended.
various social insurance codes were brought together into a new unified system of social insurance in 1953.
B.5 To qualify for this pension, claimants needed 156 paid contributions, had to be under 60 years of age at entry into insurance, and had to satisfy a yearly average test. There have been changes to each of these conditions over the intervening years but the basic principles on which qualification is based (entry into social insurance, a basic paid requirement and an average contributions test) remain the same.
B.6 The Retirement Pension, now known as State Pension (Transition)160, was introduced in 1970 for people who retired at age 65 and was designed to bridge the gap between retirement and qualification for the Old Age Contributory Pension, which at the time was 70 years of age. Accordingly, a key qualifying condition is that a person must be retired161. Changes in Social Welfare pension age, which saw it fall from aged 70 to aged 66, mean that this retirement condition now only applies for one year.
B.7 Contributions paid before 1953 had very limited scope in terms of the specific circumstances they covered and this was reflected in the rate at which contributions were set. With the introduction of the Old Age Contributory Pension in 1961, the rate of social insurance contribution was increased to include an element towards the funding of the new pension scheme. Contributions paid before 1961 did not include such an element. However, it was decided to count all contributions paid under
160 The main legislative provisions relating to the State Pension (Transition) are contained in Chapter 16 (Sections 114 to 117) of Part II of the Social Welfare (Consolidation) Act 2005, as amended, and Chapter 8 (Articles 68 to 75) of Part II of the Social Welfare (Consolidated Claims, Payments & Control) Regulations 2007 (S.I. 142 of 2007) as amended.
161 Retirement is defined as being in employment that is insurable at class J PRSI (i.e. earning less than €38.09 per week) or self-employed with earnings of less than €3,174.35 per annum.

��0
GREEN PAPER ON Pensions
the unified scheme (1953) towards qualification for the new pension. If only contributions containing a pension element (i.e., those paid since 1961) were allowed, then ten years would have had to pass from the date of introduction of Old Age Contributory Pension before anyone would have qualified.
B.8 The unified system of social insurance introduced in 1953 has been significantly improved over time. Improvements have been made in the scope of application of the system, the contingencies covered and the range of pensions and benefits paid:
l 1961: Introduction of Old Age Contributory Pension. Prior to this date, the social insurance system did not provide any cover for old age, although the means-tested, Old Age Non-Contributory Pension had been in existence since 1908;
l 1970: Introduction of Retirement Pension;
l 1970: Introduction of Invalidity Pension for people who are permanently incapable of work because of illness or incapacity;
l 1973: Introduction of Deserted Wife's Benefit (now closed to new applicants);
l 1991: Pro-rata pensions for people with 'mixed insurance' records were introduced;
l 1994: Introduction of Widower's Contributory Pension;
l 1994: Introduction of the Homemaker’s Scheme to protect the pension entitlements of those who take time out of the paid workforce to care for children or incapacitated adults;
l 2000: Introduction of Carer's Benefit. Carer's Allowance, a means-tested payment, was introduced in 1990 and was the first payment made directly to carers.
Types of Pension Schemes Available and Qualifying Conditions
B.9 There are two main strands of age-related pensions under the Social Welfare system - these are contributory pensions, which are based on social insurance and non-contributory pensions which are means-tested. As part of
a general review of the Social Welfare system initiated by Minister for Social and Family Affairs in 2006, and following consultations with various interest groups and representative organisations, it was decided to rename schemes to eliminate the concept of old age from the Social Welfare system.
B.10 Accordingly, pension schemes were re-named as follows:
l Retirement Pension became State Pension (Transition);
l Old Age Contributory Pension became State Pension (Contributory);
l Old Age (Non-Contributory) Pension became State Pension (Non-Contributory). In addition, non-contributory pensions for those over 66 have been standardised into the new State Pension (Non-Contributory). This change involved abolishing Blind Pension, Widow(er)'s Non-Contributory Pension, One Parent Family Payment, Deserted Wife's Allowance and Prisoner's Wife's Allowance for those aged 66 or over. These schemes remain in operation for those under 66.
B.11 The schemes mentioned above, namely State Pension (Transition), State Pension (Contributory) and State Pension (Non-Contributory), account for the majority of Social Welfare pension recipients aged 65/66. However, there is a significant number of older people receiving the Widow/er’s Contributory Pension. This pension is not age-related and a widow or widower can qualify on either his/her own or a spouse’s social insurance record.
Qualifying Conditions
State Pension (Contributory) and State Pension (Transition)B.12 The qualifying conditions for the two main
contributory schemes are broadly similar though a key requirement for the State Pension (Transition) is a retirement condition which derives from the reason for the introduction of the payment in the first place, i.e. to bridge the gap between retirement at 65 and the standard Social Welfare pension age.

��1
GREEN PAPER ON Pensions
B.13 To qualify for State Pension (Contributory)/State Pension (Transition), a person must:
l enter social insurance before reaching age 56 for State Pension (Contributory) and age 55 for State Pension (Transition);
l pay at least 260 social insurance contributions at the appropriate rate. From 6 April 2012, a minimum of 520 paid contributions will be required. This increase in the contribution requirement from 2012 was provided for in legislation in 1997;
l achieve a yearly average of at least 10 contributions paid/credited from 1953 or from the date of entry into social insurance, if later. A minimum yearly average of 24 is required for State Pension (Transition);
l a person's social insurance record can also be averaged from 1979, but only to qualify for a full rate pension, which in both cases, requires an average of 48 contributions.
Rate of paymentl The rate of payment is comprised of a personal
rate plus increases for a qualified adult162 and child(ren)163. People aged 80 or over receive an additional increase. Increases are also paid if a person lives alone and/or on certain specified islands. A means-tested Fuel Allowance may also be payable. The personal rate at which any contributory pension is paid is governed by the yearly average contributions and various percentages of the standard maximum rate are paid according to the general level of contribution. The present structure is as follows:
162 A spouse or partner who is wholly or mainly maintained by the pensioner. This is defined as not having an income in his/her own right above a specified limit, currently €100 per week. A lower rate of increase is paid where the qualified adult has an income of between €100 and €280 per week and there is a higher payment for qualified adults over age 66.
163 who are under 18 and normally live with the pensioner; between 18 and 22 and in full-time education. If there is no increase for a qualified adult then half-rate is payable. If the pensioner is getting an Irish pension in addition to an EU or Bi-lateral pension only one qualified child increase is paid and this is usually paid by the country where the pensioner resides.
Average Contributions and Rate of Payment of State Pension (Contributory) and State Pension (Transition)
Average annual contributions % of full rate paid
48+ 100
20-47* 98
15-19 75
10-14 50
* The minimum requirement for State Pension (Transition) is an average of 24.
Improvements to the Qualifying ConditionsB.15 The current qualifying conditions represent
a significant improvement on the original conditions in that it is now easier to qualify for a pension. The requirements for minimum pensions have been eased, with the average contributions needed reduced from 20 to 10 in 1997, and a number of special pensions have also been introduced which, as far as possible, and having regard to the contributory principle underlying entitlement, provide recognition for different types of social insurance contribution that people have made and deal with a number of perceived anomalies in the system.
Mixed Insurance Pro-Rata State Pension (Contributory)B.16This pension was introduced in 1991 for
people with ‘mixed insurance’ records i.e. a combination of full and modified164 rate contributions and so benefits those who have worked in both the private and public sectors. They may qualify for a pension based on the number of full-rate contributions as a proportion of their total contributions, i.e. full and modified rate.
B.17 The qualifying conditions are similar to those for a standard State Pension (Contributory) but people who reach pension age on or after 6 April 2012 can make up the 520 contribution requirement by way of 520 full-
164 Modified rate contributions refer to PRSI paid at classes B, C and D (PRSI was introduced in April 1979), contributions paid prior to April 1979 in respect of permanent and pensionable Civil and Public servants and modified rate voluntary contributions. PRSI contributions at classes J and K and pre 1979 employment contributions which provide cover for Occupational Injuries Benefit only are not reckonable for pension purposes.
���
GREEN PAPER ON Pensions
rate contributions or with a combination of full and modified rate contributions, of which a minimum of 260 full-rate contributions is required. Both full and modified rate contributions are taken into account when calculating the yearly average number of contributions but the actual rate paid depends on the balance between modified contributions in a person’s overall record in accordance with the following formula.
B.18 The rate of pension is calculated as follows:
Step 1: The notional pension is calculated. Notional pension is the pension that would be paid if all social insurance contributions, both full and modified rate, were treated as full-rate contributions. The full and modified rate contributions are therefore added together and the total is then divided by the number of years to get the yearly average.
Step 2: The following formula is then used: (A x B)/C
A = the notional rate of pension i.e. the rate
(personal plus increase for a qualified adult, if applicable) which would be payable if all contributions, both full and modified rate, were treated as full rate contributions.
B = the number of full rate contribution. C = the total number of contributions (full and
modified rate)
Eu or Bilateral Agreement (BA) pro-rata State Pension (Contributory) B.19 This pension is based on a combination of full-
rate Irish social insurance contributions and reckonable social insurance in EU countries or a country with which Ireland has a Bilateral Social Security Agreement165.
B.20 The EU pension scheme is governed by Council Regulation (EEC) No 1408/71 and No 574/72, as amended. Bilateral Agreement pensions
165 Australia, Canada, New Zealand, USA, Quebec, Austria, Switzerland (largely superceded by EU regulations), UK (in respect of the Isle of Man & Channel Islands)
are governed by formal agreements with the relevant countries which are contained in statutory instruments. The qualifying conditions and the manner in which the payment is calculated are broadly similar to those applying to the mixed rate pension but there is some flexibility with regard to where contributions can be made. A person can enter social insurance in Ireland or in any of the other countries governed by the EU or Bi-Lateral Agreements and the requirement to have 260 contributions paid can be satisfied in any EU or Bilateral country.
B.21 The pension is a pro-rata payment based on the proportion of Irish social insurance contributions to the total number of contributions paid and/or credited over a person’s working career i.e. the total number of contributions made in Ireland and other relevant countries. The calculation is similar to that outlined in paragraph B.18.
Special Partial State Pension (Contributory)B.22This special partial pension was introduced
in October 1988 for people who did not qualify for contributory pension due to gaps in their insurance record arising from the operation of the income limit166 on social insurance contributions which applied in some cases until 1974. The qualifying conditions are similar to those for a standard contributory pension but a minimum yearly average of only 5 contributions is required. In order to qualify, a person must have re-entered full-rate insurable employment on 1 April 1974. Payment is at 25% of the full rate.
Special Self-employed PensionB.23 This pension was introduced in 1999 for self-
employed people who were over age 56 on 6 April 1988 when compulsory social insurance for the self-employed was introduced and who could not therefore satisfy the condition of having entered social insurance at least 10 years before pension age. To qualify, a person must have been age 56 or over on 6 April 1988 (when compulsory social insurance for the self-employed was introduced),
166 Prior to 1 April 1974 non-manual employees were not liable for social insurance contributions if their earnings were over a prescribed limit. This limit was abolished on 1 April 1974 but many people had gaps in their insurance record due to its operation.

���
GREEN PAPER ON Pensions
started paying social insurance contributions as a self-employed person on or after 6 April 1988 and have at least 260 full-rate social insurance contributions paid on a compulsory basis since first starting to pay social insurance contributions as a self-employed person. The personal rate, and increases for a qualified adult and qualified child(ren), are paid at 50% of the standard maximum rate. Increases for living alone, age 80 and fuel allowance are payable at the standard rate.
Pre-1953 PensionB.24 A special contributory pension was introduced
in 2000 for any person who became insurably employed prior to 1953 and who did not qualify for a pension or qualified for one (contributory or non-contributory) at a lower rate. To qualify for this pension, a person must have become an employed contributor under the National Health Insurance Acts prior to 1953167 and have paid at least 260 full-rate (or 5 years’) contributions168. The 260 can all have been paid before 1953 or as a combination of pre and post-1953 contributions . The pension is paid at the same rate as the special self-employed pension.
The Homemaker’s SchemeB.25 The Homemaker’s Scheme was introduced in
1994 with the intention of protecting the pension rights of people who take time out of the paid workforce to care for children or sick/older people. People who give up employment for a period of time to care often find it difficult to qualify for a pension in their own right or only qualify for a reduced rate pension because of the gaps in their social insurance record. Under the scheme, time periods spent performing such care work are disregarded when calculating the average number of social insurance contributions a person has accumulated for pension purposes.
Conditions of the Homemaker’s SchemeB.26 The Homemaker’s Scheme makes it easier for
homemakers to qualify for the State Pension
167 For men, social insurance contributions paid prior to 5 January 1953 are regarded as paid prior to 1953. The equivalent date for women is 6 July 1953.
168 Every 2 contributions paid prior to 1953 are counted as 3, and any odd contribution is counted as 2. This provision dates from the introduction of Old Age Contributory Pension in 1961.
(Contributory) on reaching age 66. One of the qualifying conditions for the State Pension (Contributory) is that a person has a minimum yearly average number of social insurance contributions (paid or credited) from the time they enter social insurance until they reach pension age. For those registered as homemakers, the gap in their social insurance record is ignored when working out the yearly average of PRSI contributions for the State Pension (Contributory). This arrangement applies to breaks from employment taken after April 1994.
B.27 To benefit from the Homemaker’s scheme, a person must have worked and paid PRSI previously (or will do so in the future) at PRSI class A, E, H or S. The scheme will not of itself qualify a person for a pension. The standard qualifying conditions, which require a person to enter insurance 10 years before pension age, pay a minimum of 260 contributions at the appropriate rate and achieve a yearly average of at least 10 contributions from the time they enter insurance until they reach pension age must also be satisfied.
B.28 To be eligible for the Homemaker’s Scheme, a person must:
l Permanently live in the State;
l Be aged under 66;
l Have started insurable employment or self-employment (on or after age 16 and before age 56);
l Not work full-time (earnings must be less than €38 gross per week);
l Live with the person being looked after or if not living with the caree satisfy certain conditions;
l The person being cared for must not already be receiving full-time care and attention within their own home from anyone else.
B.29 The caree must either be a child under the age of 12 (initially the scheme only applied to children aged under 6) or an incapacitated child or adult in need of full-time care and attention. The caree must need:
l Continuous supervision for reasons of health and personal safety;
l Continuous supervision and frequent help during the day to meet their normal personal needs.

���
GREEN PAPER ON Pensions
State Pension (Non-Contributory)169
B.30 This scheme was introduced in September 2006 and incorporates all non-contributory pension schemes for people age 66 or over. It is a means-tested scheme for people who do not qualify for a State Pension (Contributory) and completely replaced the Old Age Non-Contributory Pension scheme. It also replaced Widow(er)’s Non-Contributory Pension, Deserted Wife’s Allowance, Lone Parent’s Allowance, Prisoner’s Wife’s Allowance, Blind Pension and One-Parent Family Payment for people over 66.
Qualifying Conditions for State Pension (Non-Contributory)B.31 The qualifying conditions require a person to be
aged 66 years or over and habitually resident in the State and satisfy a means test. The means assessment takes into account cash income which the pensioner and spouse/partner may have (e.g. earnings from employment, self-employment, an occupational pension, a pension from a foreign social security institution), the value of capital (e.g. savings, investments, cash in hand) and any property excluding the main residence. In common with other Social Welfare assistance schemes, if married or cohabiting, the means is taken as half the joint means of the pensioner and spouse/partner.
Most recent improvements in the means testB.32 The basic income disregarded has increased
from €7.60 per week to €30 per week in Budgets 2006 and 2007. In addition, up to €20,000 in capital is also disregarded. Overall, a single person with no other means could have up to €40,000 in capital and qualify for a pension at maximum rate, and €80,000 in the case of a pensioner couple. A specific earnings disregard of €200 per week has also been introduced in the two Budgets referred to so that additional income from employment can be earned without losing pension entitlements.
169 The main legislative provisions relating to State Pension (Non-Contributory) are contained in The Social Welfare (Consolidation) Act 2005 as amended by sections 16, 17, 18, 19 and 24 of the Social Welfare Law Reform and Pensions Act 2006; Tables 1 and 2 of Schedule 3 of the Social Welfare (Consolidation) Act 2005 as amended; Chapter 6 of Part III of the Social Welfare (Consolidated Claims, Payments & Control) Regulations 2007 (S.I. 142 of 1994) (as amended).
Rate of PaymentB.33 The rate of payment is determined by the
means assessed and can range from €200 per week to as low as €2.50. Qualified adult allowances are not paid where the spouse or partner is over 66 as, generally speaking, both members of a couple will qualify for a personal payment.
Coverage of Social Welfare Pension Schemes
B.34 The table on the following page sets out the coverage of Social Welfare pension schemes for those who are 66 years of age and over.
B.35 Population and migration estimates from the CSO put the number of people in the country who are 65 years of age and over at 470,600 in 2006. There are approximately 30,000 people aged 65 in the country so about 440,000 people resident in the State are aged 66 and over.
B.36 As can be seen from the table on the following page, at the end of December 2005, there were approximately 438,000 people aged over 66 in receipt of a Social Welfare payment, either in their own right or as a qualified adult on their spouse’s or partner’s payment. This includes some 45,000 people receiving Social Welfare payments abroad. This means that approximately 393,000 people, or 89% of older people resident in this country, aged 66 years and over are receiving support through the Social Welfare system. That leaves approximately 47,000 people outside the system. These are mainly former self-employed people and public servants and their spouses or partners.

���
GREEN PAPER ON Pensions
Recipients of Social Welfare Schemes aged 66 and over in 2005
Scheme No. Male Recipients
No. Female Recipients
Total No. Recipients
No. Male Qualified Adult Allowances
No. Female Qualified Adult Allowances
Total No. Qualified Adult Allowances
Old Age Contributory Pension
79,632 44,979 124,611 1,850 16,646 18,496
Retirement Pension
63,544 23,503 87,047 1,555 13,990 15,545
Old Age Non-Contributory Pension
35,520 48,934 84,454 110 1,000 1,110
Widow(er)’s Contributory Pension
5,270 70,010 75,280 N/A N/A N/A
Widow(er)’s Non-Contributory Pension
123 12,132 12,255 N/A N/A N/A
Deserted Wives Benefit
N/A 1,038 1,038 N/A N/A N/A
Deserted Wives Allowance
N/A 599 599 N/A N/A N/A
Invalidity Pension 5,537 5,458 10,995 49 442 491
Carer’s Allowance
505 2,444 2,949 N/A N/A N/A
Blind Person’s Pension
219 310 529 1 4 5
Disablement Pension
1,990 291 2,281 N/A N/A N/A
Death Benefit 5 327 332 N/A N/A N/A
Supplementary Welfare Allowance
169 96 265
Total 192,514 210,121 402,635 3,565 32,082 35,647
Source: DSFA Statistical Information on Social Welfare Services 2005
Notes: 1. Scheme names as they applied at 31 Dec 20052. N/A not applicable 3. The breakdown by gender regarding QAA is estimated. It has been assumed that 90% of QAAs over 66 are
female. 4. Disablement Pension may be combined with another payment so it is possible that there is a small amount
of double counting in the table.

���
GREEN PAPER ON Pensions
Trends in CoverageB.37 Apart from the fact that, overall, more people
are qualifying for Social Welfare pensions, as illustrated in the following table, the main trend to note is the change in the balance of payments between contributory and non-contributory pensions. In 1996, 57% of payments being made under the schemes in question were contributory-based and this had risen to 72% by the end of 2005. This trend will continue in the years ahead as improved social insurance coverage, the Homemaker’s Scheme and increased workforce participation have more of an impact on pension claims. Ultimately, the means-tested schemes will have a relatively minor role in the overall pension system though recent improvements in the means test may, in the short to medium term, lead to an increase in non-contributory payments.
Cost of Main Social Welfare Pensions System
B.38 Total Social Welfare expenditure in 2005 was €12,168 million, an increase of 7.8% over 2004. Expenditure was equivalent to 9% of GNP. State pension related payments accounted for about 24 % of the overall total, representing an increase of 8% on 2004. This does not represent the total figure of payments made to older people in 2005 as there is a significant number of older people who receive payments such as Widow(er)s and Invalidity Pensions170.
170 From 2006 Invalidity Pensioners are automatically transferred to State Pension (Contributory) at age 66.
In addition, non-contributory pensions for those over 66 have been standardised into the new State Pension (Non-Contributory). This change involved abolishing Blind Pension, Widow(er)’s Non-Contributory Pension, One Parent Family Payment, Deserted Wife’s Allowance and Prisoner’s Wife’s Allowance for those aged 66 or over. The migration of Invalidity Pensions along with the standardisation of non-contributory payments will lead to an increase in total expenditure on older people expressed as a percentage of overall expenditure on Social Welfare with a consequent increase in the percentage of GNP. The only remaining schemes where significant numbers of older people receive payment are Widow(er)s Contributory Pensions and Carer’s Allowance.
B.39 Non-cash payments are also made to older people via household benefits, free travel scheme and the Medical Card and these play an important role in increasing the overall level of supports which the State provides for older people. Payment of household benefits is made to those aged 70 and over on a universal basis and many people aged between 66 and 70 also receive payments. Free travel is available to all aged 66 or over. Payment of household benefits, free travel and fuel allowance amounted to approximately €383171 million in 2005 .
171 Includes costs for those under 66 years of age.
Percentage of Recipients by type of pension , 1996-2005
year State Pension (Contributory) %
State Pension (Transition) %
State Pension (Non-Contributory) %
1996 28.4 29.1 42.5
1997 29.1 29.8 41.1
1998 29.5 31.0 39.5
1999 30.7 31.8 37.5
2000 33.8 30.1 36.0
2001 35.9 30.4 33.7
2002 38.1 30.1 31.8
2003 39.7 30.1 30.2
2004 40.5 30.4 29.1
2005 41.5 30.3 28.1

���
GREEN PAPER ON Pensions
Developments in 2007172
B.40 Apart from increases in payment rates, that
main development in 2007 is in relation to the payment of qualified adult increases. Since 2002 couples have been able, on a voluntary basis, to opt to have the qualified adult portion of the pension paid directly to the spouse or partner. The Social Welfare and Pensions Act 2007 provides that the qualified adult portion of the pension is to be paid directly to the spouse or partner or to such other person as the spouse or partner decides. This measure took effect from 24th September 2007 for new pension claims made on or after that date.
172 Statistical Information on Social Welfare Services 2005
Expenditure by State Pension Type, 1996 to 2005173
year State Pension (Contributory)
State Pension (Transition)
State Pension (Non-Contributory)
Total
€000 €000 €000 €000
1996 406,637 388,130 393,992 1,118,760
1997 412,643 426,854 402,247 1,241,744
1998 460,995 463,489 424,586 1,348,620
1999 498,084 511,543 439,359 1,448,985
2000 577,365 594,239 456,230 1,627,834
2001 716,474 697,349 490,718 1,904,541
2002 868,529 803,413 537,308 2,209,250
2003 946,902 898,981 565,006 2,410,889
2004 1,050,348 983,706 599,988 2,634,042
2005 1,152,894 1,059,992 631,299 2,844,185
���
GREEN PAPER ON Pensions
APPENDIX C (CHAPTER 7)
Footnotes to table 7.2 - Estimate of the cost of tax and PRSI reliefs for private pension provision 2006
a Employee contributions to occupational pension schemes are deductible for income tax purposes at the employees’ marginal income tax rates. The 2006 cost estimate for this relief is based on figures of €1.426 billion for employee contributions to pension schemes in 2006 - per P35 returns for that year and an assumed average marginal tax rate of 38%. An average marginal tax rate of 38% is used on the basis that contributors to pension schemes are tax liable at higher marginal rates.
b Employer contributions on behalf of employees to occupational pension schemes are deductible in computing profits for tax purposes. Employer contributions of €1.338 billion to pension schemes in 2006 – per P35 returns relieved for tax liable companies paying tax at 12.5% and 10%.
c Employer contributions to occupational pension schemes on behalf of employees are specifically exempt from being charged as remuneration of the employees concerned in the form of benefits-in-kind (BIK). The estimated cost of the BIK exemption represents employer contributions of €1.338 billion at an average marginal tax rate of 38%.
d The investment income and gains on pension fund assets are exempt from income tax and capital gains tax. The estimated average value of pension fund assets under management in Ireland in 2006 is estimated at €80 billion. The estimated long-run rate of return for the purpose of the tax cost is assumed to be 7.5% at an assumed tax rate of 20%.
e 2006 cost estimate based on actual figures for 2005 received from Revenue.
f Individual contributions to PRSAs in 2006 amounted to over €300m -per reports to the Pensions Board- while contributions by employers to PRSAs in the same year amounted to about €30m. Cost of tax relief = €300m*38% + €30m* 12.5% = €118 m, rounded up to €120m.
g This figure is derived from an amalgam of sources. An estimated figure of €300m is used to represent the value of lump sum payments made from public sector schemes. The tax foregone on this amount at 30% is €90m (a lower marginal tax rate of 30% is used compared to 38% used for the other costings on the basis that an individual’s tax liability on retirement benefits would be lower than on the same individual’s pre-retirement income). Revenue’s methodology is used for estimating the value of lump sums paid from private sector schemes (total estimated private sector contributions €2.240 billion X 47% - being the estimated % paid out in pension benefits X 13% - being the % of benefits paid out as lump sums X 30% average marginal tax rate) which gives an estimated figure of tax foregone amounting to about €40m. Total tax foregone figure is thus about €130m.
h Figures from the Department of Social and Family Affairs representing the estimated cost of employer and employee PRSI and Health Levy relief on pensions contributions.
j According to the Revenue Commissioners, income tax statistics do not distinguish between the amounts of tax that arise from pension income and from other sources of income. Revenue can, however, separately identify taxpayers in receipt of Social Welfare pensions and other sources of income. The total estimated income tax from this source for 2005 based on the combined income of taxpayers from Social Welfare pensions173 and other
173 In the case of Social Welfare pensions, if there is no other income in addition to the SW pension income the existing exemption limits or tax credits can be expected to ensure that there is no tax to be paid on the Social Welfare income itself.

���
GREEN PAPER ON Pensions
sources is estimated at €300m. (This estimate has been increased to €320m for 2006) The income from “other sources” of these taxpayers would not be confined to other pension income and cannot be separately identified so that the estimate would be over-stated on that account. On the other hand, the private pension income of taxpayers with no Social Welfare pension or an entitlement thereto is not separately identifiable and the tax on this income, if included, would also impact on the estimate. The €320m figure is therefore a tentative one.

��0
GREEN PAPER ON Pensions
APPENDIX D (CHAPTER 7)Retirement Annuity Contracts - by range of Gross Income (2003)
Range of gross income
Totals
From z To z Number of cases
Amount of deductionz
Reduction in taxz
Gross tax*z
Reduction in tax as % of Gross Tax %
- 9,000 1,311 2,258,341 141,112 1,220,083 11.6
9,000 10,000 396 520,767 56,739 145,733 38.9
10,000 12,000 960 1,390,966 182,028 325,681 55.9
12,000 15,000 2,117 3,294,103 476,424 1,123,382 42.4
15,000 17,000 1,839 2,916,457 440,441 1,433,123 30.7
17,000 20,000 3,562 5,982,637 1,057,797 3,925,339 26.9
20,000 25,000 7,437 13,264,657 2,509,060 11,424,694 22.0
25,000 27,000 3,456 6,636,168 1,288,242 6,761,114 19.1
27,000 30,000 5,185 10,416,281 2,236,258 12,281,820 18.2
30,000 35,000 8,760 19,577,391 5,322,680 28,319,511 18.8
35,000 40,000 8,310 21,125,491 6,176,678 35,540,978 17.4
40,000 50,000 14,146 42,851,406 13,602,269 83,706,273 16.2
50,000 60,000 11,495 43,082,859 13,969,983 95,014,387 14.7
60,000 75,000 11,870 57,063,627 21,767,071 139,128,001 15.6
75,000 100,000 9,855 69,066,748 28,384,806 179,694,549 15.8
100,000 150,000 7,164 90,203,134 37,714,062 221,977,076 17.0
150,000 200,000 2,978 61,979,607 25,965,403 151,200,057 17.2
200,000 250,000 1,699 46,772,306 19,609,506 116,963,786 16.8
Over 250,000 3,885 183,042,333 76,815,851 558,543,348 13.8
Totals 106,425 681,445,279 257,716, 410 1, 648, 728, 935 15.6
* “Gross tax” means the tax that would be due before relief is allowed for retirement annuity deductions

��1
GREEN PAPER ON Pensions
APPENDIX E (CHAPTER 9)
PRESS RELEASE No 08/07 25 January 2007 Judgment of the Court of Justice in Case C-278/05
Carol Marilyn Robins and Others v Secretary of State for Work and Pensions
THE MEMBER STATES ARE NOT REQuIRED TO FINANCE RIGHTS TO OLD-AGE BENEFITS uNDER SuPPLEMENTARy PENSION SCHEMES THEMSELVES IN THE EVENT OF THE EMPLOyER’S INSOLVENCy
Nevertheless, a level of protection of those rights such as that afforded by the United Kingdom system is inadequate
In accordance with a directive on the protection of workers in the event of the employer’s insolvency,1 the Member States are to ensure that the necessary measures are taken to protect the interests of employees and former employees in the event of the employer’s insolvency in respect of rights conferring on them immediate or prospective entitlement to old-age benefits under supplementary occupational pension schemes. Ms Robins and 835 other claimants are former employees of the company ASW Limited, which went into liquidation in April 2003. They were members of final-salary pension schemes funded by ASW.
The schemes were terminated in July 2002 and are in the process of being wound up. According to actuarial valuations, there will be insufficient assets to cover all the benefits of all members, and the benefits of non-pensioners will therefore be reduced.
Under the legislation in force in the United Kingdom, the claimants will not receive all the benefits to which they were entitled. Two of the claimants will receive only 20% and 49% respectively of those benefits. Taking the view that the United Kingdom legislation did not provide them with the level of protection called for by the directive, the claimants brought an action against the Government of the United Kingdom for compensation for the loss suffered. Hearing the case, the High Court has referred three questions to the Court for a preliminary ruling: (i) are the Member States required to fund themselves the rights to old-age benefits and if so to fund them in full? (ii) is the United Kingdom legislation compatible with the directive? and (iii) what is the liability of the Member State in the case of incorrect transposition of the directive?
1 Council Directive 80/987/EEC of 20 October 1980 on the approximation of the laws of the Member States relating to the protection of employees in the event of the insolvency of their employer (OJ 1980 L 283, p. 23).

���
GREEN PAPER ON Pensions
The funding of rights to benefits by the Member States themselves The Court finds that the directive does not oblige the Member States themselves to fund the rights to old-age benefits. Inasmuch as it states in a general manner that the Member States ‘shall ensure that the necessary measures are taken’, the directive leaves the Member States some latitude as to the means to be adopted to ensure protection. A Member State may therefore impose, for example, an obligation on employers to insure or provide for the setting up of a guarantee institution in respect of which it will lay down the detailed rules for funding, rather than provide for funding by the public authorities.
Furthermore, the Court considers that the directive cannot be interpreted as demanding a full guarantee of the rights in question. In so far as it does no more than prescribe in general terms the adoption of the measures necessary to ‘protect the interests’ of the persons concerned, the directive gives the Member States, in relation to the level of protection, considerable latitude which excludes an obligation to guarantee in full.
Compatibility of the united Kingdom legislation with the directive The Court notes that in 2004, according to figures communicated by the United Kingdom, about 65 000 members of pension schemes suffered the loss of more than 20% of expected benefits and some 35000 of those suffered losses exceeding 50% of those benefits.
Even if no provision of the directive contains elements which make it possible to establish with any precision the minimum level of protection required, a system that may, in certain cases, lead to a guarantee of benefits limited to 20 or 49% of the expected entitlement, that is to say, of less than half of that entitlement, cannot be considered to fall within the definition of the word ‘protect’ used in the directive. A system of protection such as the united Kingdom system is therefore incompatible with Community law.
Liability of the Member State in the case of incorrect transposition The Court considers that, given the general nature of the wording of the directive and the considerable discretion left to the Member States, the liability of a Member State by reason of incorrect transposition of
that directive is conditional on a finding of manifest and serious disregard by that State for the limits set on its discretion.
In order to determine whether that condition is satisfied, the national court must take account of all the factors which characterise the situation put before it. In the present case, those factors include the lack of clarity and precision of the directive with regard to the level of protection required, and a Commission report of 1995 concerning the transposition of the directive by the Member States, in which the Commission had concluded that ‘the abovementioned rules [adopted by the United Kingdom] appear to meet the requirements [of the Directive]’, which may have reinforced the United Kingdom’s position with regard to the transposition of the directive into domestic law.

���
GREEN PAPER ON Pensions
Terms of reference of annuity study
The analysis was to provide quantitative and qualitative information on:
l how annuity prices are set;
l the factors determining annuity prices in Ireland (e.g. investments, risk preference, profit, regulation, mortality assumptions, market competition and other drivers);
l the size and scope of the annuity market in Ireland, including market competitors, products and pricing;
l the availability of annuity products to match consumer needs;
l how efficient is the annuity market and what are the key influences in this regard: is there a market failure?; are there barriers to entry by firms from outside or within Ireland?; are there monopolies or quasi-monopolies in the market or particular segments?; are the distribution channels for annuity products operating efficiently?
l the capacity of the annuity market, e.g. to absorb the buyout of a large portfolio of pensions, the likely competitive impact of buyouts, and the potential impact on prices (higher or lower?);
l a comparison of the annuity market in Ireland and in the U.K and in other relevant markets;
l the likely future of the annuity market in Ireland.
The methodology proposed for this project was to be addressed in proposals submitted, including a detailed outline of the work programme, having regard to the specifications contained in the request for proposals.
APPENDIX F (CHAPTER 11)

���
GREEN PAPER ON Pensions
Extract from the Review of the Funding Standard by the Pensions Board - Report to the Minister for Social and Family Affairs, December 2004
State Annuity Fund7.36 Because the Funding Standard for pensioner
scheme members is based on the cost of commercially available annuities, the level of the Funding Standard for many schemes has increased as annuity costs have increased. This has led to consideration of alternative approaches to providing pensioner security. There was considerable interest in and discussion of the possibility of a State Annuity Fund, and the possible advantages and disadvantages, on an initial examination only, are set out below.
7.37 A State Annuity Fund would be intended to provide pensioner insurance at less cost than it is available from commercial insurers. In summary, such a fund would work as follows:
(a) The fund would take responsibility for the payment of pensioners, including pension increases where appropriate. In exchange, the fund would receive a lump sum from the assets of the scheme;
(b) The fund would base its costs on assumed long-term rates of return and on mortality rates closer to those typically used in ongoing valuation calculations than to those underlying annuity rates. There would be allowance for administration costs but not for profit, solvency or risk margins; and
(c) Where a scheme was wound up with a shortfall, this fund would not make good any of the shortfall. The normal wind-up priority rules would apply, and the fund would provide pensions only in respect of the funds paid to it.
7.38 Arguments in favour of a State Annuity Fund include:
(a) The benefits of such a fund would be that it would not incur the margins that commercial insurers include on their charges. The savings could potentially arise from a number of sources:
(i) Although the fund charges would include appropriate allowance for administration costs, there would be no margins for profit or solvency or other contingencies.
(ii) The mortality rates assumed by the fund might be less cautious than a commercial insurer, as the fund would only be seeking to break-even.
(b) Although such a fund would only be available to schemes that are wound up, the existence of the fund would allow the Funding Standard for pensioners to be lowered. The standard would be based not on the commercial insurance cost, but on the charge made by the fund in the event of a wind-up; and
(c) It is noted that the State bears a considerable longevity risk in respect of Social Welfare and public service pensions, so that the real additional quantum of risk represented by an annuity fund as described would not be significant.
7.39 Arguments against a State Annuity Fund include:
(a) In the absence of any detailed examination of the subject, it remains to be proven that pensioner insurance would be provided at less cost by the State Annuity Fund than by commercial insurers. Annuity prices reflect low interest rates and greater longevity and the State cannot hope to avoid the impact of such developments. In addition, if the State were to establish such a Fund, the Fund would have to take responsibility for the payment of pensioners out into the future and, inevitably, it would have to incur real
APPENDIX G (CHAPTER 11)

���
GREEN PAPER ON Pensions
extra costs in acquiring pensions-related expertise hitherto confined to the private sector;
(b) Being operated under the auspices of the State, it would be unrealistic to assume that the Fund would not be subject to intense pressure to pay pension increases (even where they were not guaranteed under the original scheme) and to make good shortfalls in pension funds of companies involuntarily wound up. It would be exceedingly difficult for such pressure to be resisted;
(c) It should not be assumed that the Fund could be confined to members of defined benefit schemes connected with involuntarily-wound up companies, especially if the members involved were found to be in a more favourable position than members of other DB schemes, let alone, of course, members of DC schemes and PRSA holders. Demands for parity of protection from the State against the vagaries of the pension marketplace (involving some form of State guarantee, perhaps) would be inevitable and, on grounds of equity, could well be difficult to resist, at potentially very substantial cost to the Exchequer. In addition, State involvement in the annuities business, through the Fund, could well be mirrored by a corresponding disengagement on the private sector’s part over time, on the basis of the latter’s perception that the State would play an ever-increasing part in the area. This would have substantive consequences for both the State and the pensions industry generally;
(d) The contention that the real additional
quantum of risk represented by an Annuity Fund would not be significant requires to be proven. Already, the cost to the State of a partial pre-funding of Social Welfare and public service pensions is extremely significant at 1% of GNP per annum, i.e. about 10% of Social Welfare expenditure at present. The cost to the State of an Annuity Fund, even on the scale envisaged by its proponents, let alone any extensions on the lines suggested in paragraph 7.38, could only be a tangible addition to the burden already borne by the Exchequer; and
(e) There is concern that the expedient of establishing a State Annuity Fund is being proposed in the comparatively narrow context of devising a viable Funding Standard for defined benefit schemes. Insufficient regard is being paid to the possible consequences for the wider pensions area, for example, or the Exchequer, which through very sizeable tax foregone on an annual basis (estimated to be of the order of at least €2.5 billion at present), already provides a very significant degree of support for the sector. All the implications of the initiative would need to be explored fully before a proposal for action were submitted for approval to relevant Departments, the Government and the Oireachtas.
7.40 The Board recommends that the implications of the establishment of a State Annuity Fund should be considered thoroughly taking account, inter alia, of the advantages and disadvantages set out above. Such an examination would enable the Board to consider the proposition further in the medium term.

���
GREEN PAPER ON Pensions
Pensions Board Publications The following publications are available fromThe Pensions Board,Verschoyle House,28/30 Lower Mount Street,Dublin 2.Telephone: (01) 613 1900Fax: (01) 631 8602Email: [email protected]: www.pensionsboard.ie
Free Publicationsl The Pensions Board – an introduction to the Board
and its functions*l Women & Pensionsl What are my pension options?l What happens to my pension if I leave?l Pensions Checklist**l PRSAs – Employers’ Obligationsl PRSAs – A Consumer Guidel What do you know about your pension scheme?*l A guide to your scheme’s annual reportl So you’re a pension scheme trustee?*l What happens when your pension scheme is
wound up or a merger/acquisition takes place?l A brief guide to the Pension Provisions of the
Family Law Actsl Integration – A Brief Guide*l Annuities – A Brief Guide*l Selecting Member Trusteesl Equal Pension Treatment *Also available in Irish. **Also available online in Arabic, Chinese, French, Irish, Polish, Russian and Spanish
Subscription Services
Legislation Service**Subscribers to this service receive a non-statutory consolidated text of the Pensions Acts, and the Regulations. During 2006 the Board conducted a review of the production of the Legislation Service in order to identify the most efficient and expedient method of delivery of this service to its customers. The outcome of this review is that the Legislation Service is now provided by an external service provider, in an online format.
Guidance Notes**The Board makes available by subscription detailed guidance notes on the various parts of the Pensions Acts and Regulations, especially in those areas which override the trust deed and rules of the scheme. Subscribers to the service receive updates to take account of any legislative changes. A review of the method of delivery of this service was also conducted by the Board in 2006, which included a consultation process with its customers. The outcome of this review will see the provision of guidance being delivered in a range of formats to include guidelines, frequently asked questions, booklets and made available free of charge and on the Board’s website www.pensionsboard.ie. This new procedure will be introduced during 2007.
Trustee Handbook**The Pensions Board launched a second edition of the Trustee Handbook and Codes of Practice in 2004. It contains comprehensive guidance for trustees on all aspects of their responsibilities for compliance with the Pensions Acts, as amended, and on good practice in relation to scheme administration.
** Available by subscription only.
APPENDIX H (CHAPTER 12)

���
GREEN PAPER ON Pensions
Guidance from Other SourcesThere is a comprehensive Revenue Commissioners pensions manual which is available on diskette from the Financial Services (Pensions) Business (FSPB) formerly known as the Retirement Benefits District. This manual consolidates the Revenue practice notes on the tax treatment of occupational pension schemes and PRSAs.
Furthermore, “A Guide to Personal Retirement Savings Accounts” prepared in consultation with the Board has been published by the Revenue Commissioners and is available on their website (www.revenue.ie). This guide outlines the tax treatment of PRSAs.
Professional guidance is provided by the Society of Actuaries in Ireland to its members on the application of the funding standard and a number of other aspects of pensions legislation and regulation. The Pensions Acts provide for a statutory underpinning of the Society of Actuaries professional guidance notes in certain areas relevant to the Pensions Acts. Professional Guidance Regulations (S.I. 603 of 2005) were introduced in 2005 to ensure that the Minister’s consent is required to alter particular guidance issued by the Society of Actuaries in Ireland.
The professional accountancy bodies also provide supplementary guidance to their members on the content and audit of pension scheme annual accounts, in accordance with the disclosure of information requirements.

���
GREEN PAPER ON Pensions
AMRF Approved Minimum Retirement Fund
ARF Approved Retirement Fund
AFC Actuarial Funding Certificate
AVCs Additional Voluntary Contributions
BIK Benefits-in-kind
CPI Consumer Price Index
CSO Central Statistics Office
CSW Commission on Social Welfare
DB Defined Benefit
DC Defined Contribution
DSFA Department of Social & Family Affairs
ECJ European Court of Justice
EET Exempt Contribution, Exempt Fund Growth and Taxable Benefits (a system of pension taxation)
ETT Exempt Contribution, Taxed Fund Growth and Taxable Benefits (another system of pension taxation)
EPC Economic Policy Committee
EUSILC European Union Survey on Income and Living Conditions
ESRI Economic and Social Research Institute
FRS17 Financial Report Standard 17 (an accounting standard)
FS Funding Standard
FSA Financial Services Authority (UK)
GAIE Gross Average Industrial Earnings
GDP Gross Domestic Product
GNP Gross National Product
HSE Health Service Executive
IAPF Irish Association of Pension Funds
IIF Irish Insurance Federation
IORPS Institutions for Occupational Retirement Provision (an EU Pensions Directive)
IMF International Monetary Fund
NPPI National Pensions Policy Initiative
NPR National Pensions Review
NPRF National Pensions Reserve Fund
OACP Old Age Contributory Pension (now called State Pension (Contributory))
OECD Organisation for Economic Cooperation & Development
OMC Open Method of Co-ordination (E.U.)
OPS Occupational Pension Scheme
PAYG Pay As You Go
PPSN Personal Public Service Number
PSR Pensioner Support Ratio
PBGC Pension Benefit Guarantee Corporation (U.S.A.)
PRSA Personal Retirement Savings Account
PRSI Pay Related Social Insurance
PSV Pensions-Sicherungs-Verein (Germany)
QAA Qualified Adult Allowance
QNHS Quarterly National Household Survey
RAC Retirement Annuity Contract
RIY Reduction in Yield
SAF State Annuity Fund
SAI Society of Actuaries in Ireland
SPC State Pension (Contributory) – formerly Old Age Contributory Pension
SPNC State Pension (Non-Contributory) – formerly Old Age Non-Contributory Pension
SPT State Pension (Transition) – formerly Retirement Pension
SSAS Small Self-administered pension Schemes
SSIA Special Savings Incentive Accounts
TPFR Total Period Fertility Rate
UN United Nations
ACRONyMS

���
GREEN PAPER ON Pensions
Barrett, A. and Bergin, A. (2005) Assessing Age-Related Pressures on the Public Finances 2005 – 2050. Budget Perspectives 2006
Central Statistics Office (2007) Quarterly National Household Survey Quarter 4, 2006
Central Statistics Office (2006) Population and Migration Estimates 2006
Central Statistics Office (2006) Quarterly National Household Survey Quarter 4, 2005 – Module on Pension Provision
Central Statistics Office (2006) Vital Statistics Quarter 3, 2005
Central Statistics Office (2005) Marriages 2002
Central Statistics Office EU Survey on Income and Living Conditions (EU-SILC) 2003, 2004, 2005 Central Statistics Office (2004) Population and Labour Force Projections for 2006 - 2036
Central Statistics Office Census 2002, 2006
Central Statistics Office (2002) Quarterly National Household Survey Quarter 1, 2002 – Module on Pensions
Commission on Public Service Pensions (2000) Final Report
Commission on Social Welfare (1986) Report of the Commission on Social Welfare
Commission on the Status of Women (1993) Second Commission on the Status of Women – Report to Government
Department for Work and Pensions (2006) Personal Accounts, A New Way to Save. Department for Work and Pensions, UK
Department for Work and Pensions (2002) Modernising Annuities – Consultative Document. Department for Work and Pensions, UK Department of Social and Family Affairs (2006) Statistical Information on Social Welfare Services 2005
Department of Social and Family Affairs (2000) Review of the Qualifying Conditions for the Old Age (Contributory) and Retirement Pensions
Department of Social and Family Affairs (1998) Review of Carer’s Allowance
Department of Social, Community and Family Affairs (2002) Actuarial Review of the Financial Condition of the Social Insurance Fund as at 31 December 2000
Department of Social, Community and Family Affairs (1994) Review of Credited Contributions
Department of Social Welfare (1996) Social Insurance in Ireland
Department of Social Welfare (1992) Report of the Review Group on the Treatment of Households in the Social Welfare Code
Department of the Taoiseach (2006) Towards 2016: Ten-Year Framework Social Partnership Agreement 2006 - 2015
Department of the Taoiseach (1998) Partnership 2000
Economic Policy Committee & European Commission (2006) The impact of ageing on public expenditure: projections for the EU25 Member States on pensions, health care, long-term care, education and unemployment transfers (2004 – 2050)
Economic Policy Committee & European Commission (2005) The 2005 EPC Budgetary Projections Exercise: Agreed Underlying Assumptions and Projection Methodologies
Equality Authority (2002) Implementing Equality for Older People
BIBLIOGRAPHy

��0
GREEN PAPER ON Pensions
European Commission (2007) Economic Assessment of the Stability Programme of Ireland (Update of December 2006)
European Commission (2006) Adequate and Sustainable Pensions: Synthesis Report 2006
European Commission (2006) The long-term sustainability of public finances in the European Union. European Economy No. 4, 2006
European Council (2007) Council Opinion on the Updated Stability Programme of Ireland, 2006 – 2009
Fahey & Russell (2001) ‘Older People’s Preferences for Employment and Retirement in Ireland’ – Paper presented to Conference on Employment and Retirement among the over 55s (‘Patterns, Preferences and Issues’, National Council on Ageing and Older People, September 2001)
FSA (2006) Survey of Persistency of Life and Pensions Policies
Goodbody Economic Consultants (2007) The Economic Implications of Demographic Change
Government of Ireland (1996) Report of the Expert Working Group on the Integration of the Tax and Social Welfare Systems
Hall, S., Pettigrew, N. & Harvey, P. (2006) Public Attitudes to Personal Accounts: Report of a Qualitative Study. For the Department for Work and Pensions, UK
Healy, J. (2004) Fuel poverty and policy: Ireland in the EU context. Combat Poverty Agency
Hughes, G. and Whelan, B. (1996) Occupational and Personal Pension Coverage 1995, Economic and Social Research Institute
Irish Association of Pension Funds (2002) Benefits Survey
IMF (2005) Who Saves in Ireland?
Life Strategies (2006) ‘The Pensions Gap – Two Years On’, Irish Insurance Federation Conference, November 2006
Mercer Human Resource Consulting (2007) Actuarial Review of the Social Insurance Fund 2005
Middlesex University & Centre for Research (2007) Managing Age: A Guide to Good Employment Practice CIPD UK & Trades Union Congress (TUC)
National Pensions Board (1993) Developing the National Pensions System: Final Report of the National Pensions Board
National Pensions Board (1987) First Report of the National Pensions Board. Dublin
NESF (2003) ESRI Survey of Employer Perceptions on Older Workers
OECD, ‘Pension Market in Focus’, Issue 3, October 2006
OECD (2006) Ageing and Employment Policies: Ireland
OECD (2005) Pensions at a Glance: Public Policies Across OECD Countries
Review Body on Higher Remuneration in the Public Sector (2005) Interim Report
The Pensions Board Guide to Hybrid Pension Schemes
The Pensions Board (2006) Report of The Pensions Board to the Minister for Social and Family Affairs on Trusteeship
The Pensions Board (2006) Special Savings for Retirement: Report on Mandatory Pension System
The Pensions Board (2005) National Pensions Review Report
The Pensions Board (2004) Review of the Funding Standard
The Pensions Board (1998) Securing Retirement Income – National Pensions Policy Initiative
UK Pensions Commission (2005) Second Report of the UK Pensions Commission
UK Pensions Commission (2004) First Report of the UK Pensions Commission

��1
GREEN PAPER ON Pensions
Zaidi, A., Marin, B. & Fuchs, M. (2006) Pension Policy in the EU25 and its possible impact on Elderly Poverty. European Centre for Social Welfare Policy and Research

���
GREEN PAPER ON Pensions

���
GREEN PAPER ON Pensions

���
GREEN PAPER ON Pensions

Green PaPer on PensionsGr
een Pa
Per
on
Pen
sions
ww
w.p
ensi
onsg
reen
pape
r.ie design_w
ww
.redd
og
.ie


![Team 3 - USF Going Green White Paper Project[1] PDF](https://img.pdfslide.tips/doc/110x75/543e0110afaf9fac0a8b4b3d/team-3-usf-going-green-white-paper-project1-pdf.jpg)