Embed Size (px)
Citation preview
Urban and Rural Dimensions of Income
Inequality in Vietnam
Thi Cam Van Cao International University of Japan Takahiro Akita International University of Japan
April 2008
Graduate School of International Relations
International University of Japan
http://gsir.iuj.ac.jp/
GSIR WORKING PAPERS
Economic Development & Policy Series EDP08-2
GSIR Working Papers
Economic Development & Policy Series EDP08-2
Urban and Rural Dimensions of Income Inequality in Vietnam
Thi Cam Van Cao and Takahiro Akita International Development Program, Graduate School of International Relations
International University of Japan
Abstract
This study analyzes urban and rural inequalities in Vietnam by applying two
techniques of inequality decomposition by population groups and income sources
based on two data sets from the nationwide household surveys in 2002 and 2004. It is
found that within-sector inequalities in income distribution are substantially higher
than that in expenditure distribution because expenditure level is more dependent on
location characteristics of a household, while the determinants of income level seems
to stay in other characteristics such as education and occupations of household
members. Income inequality within the urban sector is higher than that in the rural
sector because urban income mainly comes from wage employment and non-farm
self-employment, which are more unequal than agricultural income. Interestingly,
wage employment appears to be an equalizing income source in both urban and rural
areas. Agricultural income is undeniably an inequality-equalizing source. Therefore,
much of income inequality stays in the distribution of sources other than wage and
agriculture. Based on the review of current policies related to income distribution and
decomposition analysis, the paper suggests that income diversification, development
of private sector, encouraging rural-urban migration and trade liberalization would be
appropriate for increasing income level while restraining increasing inequality.
Keywords: Income Inequality, Urban and Rural Dimensions, Theil
Decomposition Analysis, Gini Decomposition Analysis, Vietnam,
Asia
JEL classification: O15, O18
GSIR working papers are preliminary research documents, published by
the Graduate School of International Relations. To facilitate prompt
distribution, they have not been formally reviewed and edited. They are
circulated in order to stimulate discussion and critical comment and may
be revised. The views and interpretations expressed in these papers are
those of the author(s). It is expected that most working papers will be
published in some other form.
1
Urban and Rural Dimensions of Income Inequality in Vietnam*
Thi Cam Van Cao and Takahiro Akita International Development Program, Graduate School of International Relations
International University of Japan
1. Introduction
Since the beginning of this century, the Vietnamese economy has sustained high
economic growth rates while markedly reducing poverty during its transition to a
market-oriented economy. Since 2002, the GDP growth rate has been consistently
above 7% and has accelerated from 7.0% in 2002 to 8.4% in 2005 (World Bank,
2006a). The industrial sector has shown the strongest growth at above 10% annually,
followed by the services sector with annual growth at 8%, while the agricultural
sector has maintained an average annual growth rate of 3.5-4.0% per year (World
Bank, 2006b). Strong growth in all three sectors has had a positive impact on poverty
reduction, which is one of the most important policy goals of the Vietnamese
government. According to Fritzen and Brassard (2005), the poverty headcount ratio
consistently declined from 58% in 1993 to 29% in 2002.
One of the key achievements has been the development of a vibrant business sector
that has served as one of the factors in bringing about rapid poverty alleviation in
Vietnam. A sizeable and growing business sector enables a larger part of the
population to take part in more economically productive activities and, thus, raise
income levels and living standards. Especially, with the promulgation of private
ownership and official encouragement of private investment, private enterprises have
expanded notably, and they currently provide wage employment to 21% of the total
labor workforce (World Bank, 2006a).
In addition to increasing income levels, the more important implication in the rapid
expansion business sector is that it has led to a marked increase in the demand for
labor. This has translated into two types of mobility: a geographical move from rural
to urban areas, and an occupational move from the agricultural labor force to
* We are grateful to the Japan Society for the Promotion of Science (Grant-in-Aid for Scientific
Research No. 18530216) for its financial support. We are also grateful to Jesse Szeto for his helpful
comments.
2
non-farm self-employment and wage employment. These types of changes in the
labor force are inevitable in a rapidly growing and industrializing economy as the
population shifts from the informal structures of the agricultural sector to the formal
structures of modern industries. However, it is critical to take into account the
distributional effects that accompany such economic shifts and labor mobility, as
Vietnam has begun to grapple with increasing inequalities between the rural and
urban sectors, and between different geographic regions of the country (Fritzen,
2002).
Fritzen and Brassard (2005) states that the increase in inequality in Vietnam during
1993-1998 was due to a widening gap between the urban and rural sectors, which is
consistent with many other studies (Glewwe, Gragnolati and Zaman, 2000; Helbergs,
2003). However, increases in inequality in the subsequent period (1998-2002) were
mainly attributable to inequalities within each sector, as opposed to between them.
According to Fritzen and Brassard (2005), the change in the cause of inequality is
primarily due to increasing returns to human capital and regular wage employment
among households within the same sector, either urban or rural.
Wage employment is a direct result of the aforementioned occupational move, and
the increase in wage employment has contributed to poverty reduction in Vietnam.
According to World Bank (2006b), in 2004, earnings from wage employment was the
single most important factor contributing to income growth of the poor: wages
accounted for nearly half of all income growth of the lowest income quintile between
2002 and 2004. However, it is unclear whether wage employment has positive or
negative effects on income distribution. This is due to the fact that while wage
employment provides additional income opportunities for the poor, it arguably
provides even more income opportunities for the rich. In certain scenarios, as the
economy develops, the gap in wages between low-skilled and high-skilled
employment widens, and wage employment may indeed contribute to income
inequality.
There are a large number of studies on inequality in Vietnam, however, most of them
tend to use household expenditure. There are few studies that use household income
and, thus, few studies conducted from the perspective of income-generating sources.
3
In addition, at the time of this study, most studies utilized household survey data
from either 1992-93 or 1997-98; few used the household survey data from 2002 and
/or 2004 as the main data source.
This study analyzes income inequality both between and within the urban and rural
sectors. The urban-rural disparity is examined by dividing the population into two
subgroups according to location: urban areas or rural areas. Income inequalities
within each sector are examined by disaggregating household income into different
income sources to measure the contribution of each source to overall inequality. The
study contributes to existing literature in the following ways. (1) It mainly utilizes
household income data, which is supplemented by household expenditure data as
necessary. (2) It decomposes inequality by income sources in both urban and rural
sectors. In this respect, this paper builds upon the study by Gallup (2002), which is
one of the few comprehensive studies on income sources in Vietnam. (3) It provides
an update of inequality analysis in Vietnam based on the latest available data from
2004.
The rest of this paper is organized as follows. Section 2 briefly reviews the existing
literature on inequality between and within urban and rural sectors as well as
different income sources in Vietnam. Section 3 reviews economic reforms and
policies related to inequality in Vietnam since 1986. Section 4 presents two
techniques to decompose inequality measures by population groups and by income
sources. The data sets of Vietnam‟s household surveys used in the study are also
explained in section 4. Section 5 presents the decomposition results and a discussion
of the results. Finally, section 6 provides concluding remarks and policy
implications.
2. Literature Review
The Vietnam Living Standard Surveys have been conducted in consistence with
Living Standards Measurement Study household surveys, which are designed by the
World Bank to measure and understand poverty in developing countries. There have
been four rounds of such household surveys in Vietnam since 1992: the Vietnam
Living Standard Survey (VLSS) of 1992-93 and 1997-98, and the Vietnam
Household Living Standard Survey (VHLSS) of 2002 and 2004. The VHLSS‟s are
4
similar to the VLSS‟s except that most of the modules are simplified and the smallest
geographic unit is each of the 61 provinces; in contrast, the VLSS‟s control for seven
regions only.
The four household surveys provide good-quality data to measure and understand
multiple aspects of household welfare and behavior and serve as valuable data sets
for studying Vietnam‟s growth, poverty and inequality in a manner that is consistent
with studies of other developing and transitional economies. Since the time when
these data sets have been made available, a large number of studies on income
inequality in Vietnam have been conducted. This section reviews a number of those
studies that utilize the data sets and focus on spatial inequality, mainly urban-rural
disparity, and the sources of income in Vietnam. At the time of this study, most other
studies had been mainly based on the first three rounds of the surveys.
Using the first three rounds of the household surveys, VLSS 1992-93, VLSS 1997-98
and VHLSS 2002, many studies analyze the trend of inequality in Vietnam and come
to the same conclusion that inequality in Vietnam is relatively low but is gradually
increasing. Vietnam is a relatively egalitarian society when compared to other
developing countries in the region. According to the World Bank (2004a), from 1990
to 2002, the Gini coefficients of some developing countries in Southeast Asia were
quite high: 0.45 in Malaysia, 0.48 in the Philippines, 0.48 in Singapore, and 0.52 in
Thailand. In contrast, the Gini coefficient remained at approximately 0.37 in Vietnam,
which is similar to Indonesia, Lao PDR and Cambodia. However, it is clear from
statistical evidence that the Gini coefficient and real GDP per capita are strongly
correlated at early stages of economic development. This suggests that as real GDP
per capita increases, inequality would increase as well in Vietnam.
UNU-WIDER (World Institute for Development Economics Research of the United
Nations University) reports that the Gini coefficient in Vietnam increased gradually
from 0.34 in 1993 to 0.37 in 1998, and the World Development Indicator reports that
the coefficient was 0.38 in 2002. The highest Gini coefficients (0.36 in 1993 and
1998 and 0.38 in 2002) were recorded in the South East region, which includes Ho
Chi Minh City, the most developed urban area. The Red River Delta region, which
includes Hanoi, the capital and the second most developed city, and the Central
5
Highlands region recorded a significant increase in inequality from 0.32 in 1993 to
0.36 in 2002 (World Bank, 2004a). Other measures of inequality also indicate a
similar increasing trend over this same period. The expenditure ratio of the richest to
the poorest quintile increased from 5.0 in 1993 to 5.5 in 1998 and to 6.0 in 2002
(World Bank, 2004a). This is clear evidence of an increasing gap between the rich
and the poor. When households were disaggregated into decile groups, the ratios in
expenditure of the richest and poorest groups more than doubled: 10.6 in 1996, 12.0
in 1999, and 12.5 in 2002 (Scott and Truong, 2004).
Based on the VLSS data sets and applying different methodologies, a number of
studies have investigated various aspects of inequalities between and within the
urban and rural sectors in Vietnam. All of the studies conclude that from 1993 to
1998, increasing inequality in Vietnam is mainly due to the increasing gap between
the urban and rural sectors. Glewwe, Gragnolati and Zaman (2000) decomposed
inequality into the urban and rural sectors and reported that between-sector inequality
increased rapidly: while it accounted for 21% of total inequality in 1993, by 1998, it
accounted for 32% of total inequality. Fritzen and Brassard (2005) indicated that
between-sector inequality had increased relatively more slowly after 1998 as it
accounted for 35% of total inequality by 2002.
Using VLSS 1992-93 and 1997-98, Helbergs (2003) used a regression-based method
to decompose inequality into sub-groups based on household characteristics and
examined the marginal effect of location while holding other household
characteristics constant. According to Helbergs (2003), increasing levels of
inequality during Vietnam‟s reform period appear to be the result of rising spatial
inequality as well as increasing returns to higher education - interestingly, only these
two factors are significant drivers of inequality during this period. In particular,
regional and urban factors together comprised 25% of overall inequality, which is
larger than any other group of household characteristics.
Nguyen, Albrecht, Wroman and Westbrook (2006) found that the differences
between urban and rural endowments were the primary factors for the urban-rural
gap at the bottom quintile of the distribution; in contrast, the differences in returns to
those endowments accounted for much of the gap at the top quintile of the
6
distribution. In other words, poor urban households are better off than their rural
counterparts because they posses better initial endowments; while inequality among
richer households was due primarily to the difference between urban and rural
returns to their endowments.
The period under study from 1993 to 1998 in Nguyen, Albrecht, Wroman and
Westbrook (2006) coincided with the increased marketization associated with
economic reforms in Vietnam in the 1990s. Therefore, they concluded somewhat
prematurely that their results provided evidence of urban-biased policies, which
enabled urban households to take better advantage of the reforms. In 1993, the
urban-rural gap was mainly due to the fact that urban households were much better
endowed initially than rural households. By 1998, this gap had widened due not only
to better initial endowments but also because urban households were able to obtain
higher returns to their endowments.
Nguyen and Tran (2006) examined income gaps between urban and rural sectors at
each quintile, focusing on how urban and rural households were affected by trade
liberalization. The paper used the VLSS data sets from 1992-93 and 1997-98; during
this period, trade liberalization was one of the major reforms undertaken by the
Vietnamese economy. The paper concluded that trade liberalization in fact did bring
about significant efficiency gains for the whole economy, but these gains were not
distributed equally and were biased against rural and poor households in general. The
study explained this phenomenon by noting that because urban households buy more
imported goods than their rural counterparts, therefore, they are in a better position to
benefit from trade liberalization. Other studies also examined the effect of trade
liberalization on income disparity between households in urban and rural sectors and
came to a similar conclusion that urban households gained more than rural
households from this policy. (Nguyen, Tran, Ghosh and Whalley, 2005; Jensen and
Finn Tarp, 2005)
Although existing literature provides a rather comprehensive analysis on the
urban-rural gap and inequality from the perspective of population subgroups, there
are few studies on inequality from the perspective of income-generating sources in
Vietnam. This is due to the fact that most inequality studies of Vietnam tend to use
7
expenditure or consumption data. The existing literature about income sources in
Vietnam does not directly address the issues of inequality and the decomposition of
inequality by income sources. However, it is possible to list some references for
better understanding the various sources of income in Vietnam.
Gallup (2002), using the VLSS data sets from 1992-93 and 1997-98, evaluated the
contribution of wage employment to inequality and income growth. The study
examined various aspects of the Vietnamese labor market in the 1990s, including
labor force participation and unemployment, the composition of employment, wage
growth, regional wage differences, the number of hours worked, and wage
employment patterns. One of the most noteworthy findings is that Ho Chi Minh City
and Hanoi, the two cities with the largest populations, together comprise fully 25%
of all wage jobs in Vietnam, while accounting for only 8% of the country‟s
population. The distribution of wages appeared to equalize to some extent during the
1990s when the wages of the poor grew at 14% per year, which is higher than the
wage growth experienced by the middle class and the rich (both at 10% per year).
The measures of all inequality indices also show that during 1993-1998 overall wage
inequality in Vietnam decreased, despite the fact that wages grew rapidly.
Gallup (2002) measured the contribution of wages to overall income inequality. He
found out that wage employment contributed a roughly similar amount to overall
income inequality as other non-agricultural employment (mainly, household
enterprise and remittances). Besides, agricultural income reduced overall inequality
because inequality between agricultural households was much lower than inequality
between non-agricultural households, and agricultural income had a lower
correlation with other income sources.
While wage income studies normally focus on urban areas, studies of rural income
mainly focus on the issue of income diversification. Income diversification in rural
households usually refers to the growing importance of non-crop or non-farm income,
which includes both off-farm wage labor and non-farm self-employment. Income
diversification in Vietnam has been examined in van de Walle and Cratty (2004),
which examined off-farm income diversification, and in Minot, Epprecht, Tran and
Le (2006), which examined income diversification in the Northern Uplands region of
8
Vietnam. Van de Walle and Cratty (2004) found a clear association between rural
diversification and standards of living. Diversification in income sources helps
reduce poverty, thus increasing standards of living. The cross-sectional data
suggested a strong association between poverty and a lack of diversification into
wage and self-employment activities. If a household takes part in some types of
off-farm activities, it is less likely to remain poor. In contrast, households that depend
on farming activities as the sole source of income are nationally the poorest
household type in rural Vietnam.
Minot, Epprecht, Tran and Le (2006) conducted comprehensive research on income
diversification and poverty in the Northern Uplands in Vietnam. The study
considered the contribution of each income source to income growth in the region.
Income diversification can be decomposed into two changes. The first is the shift
from farm-only agricultural activities to higher-value agricultural activities such as
livestock, fisheries, and forestry, which represents 16 percent of the growth in overall
income. The second is the shift from agricultural activities to non-farm enterprises
and wage labor, which represents 27 percent of the overall growth in income.
In addition to wage income and agricultural income, non-farm self-employment has
become a substantial income source for households in both rural and urban areas.
According to Vilverberg and Haughton (2004), non-farm self-employment currently
serves as an important source of employment and income due to the fact that the
Vietnamese economy and labor market have not fully developed. Demand for labor
in formal sectors (wage employment) is not as high as in a developed economy, and a
large number of workers are not equipped with the education and the skills necessary
to work in the formal sectors. As a result, non-farm self-employment becomes the
only option for such a household member to generate additional income aside from
agricultural activities. Thus, non-farm self-employment serves as a bridge between
informal employment in the agricultural sector to formal employment in the
industrial sector – it provides an attractive alternative to farming, but it is less
remunerative than most wage-paying jobs.
3. Overview of Policies on Income Distribution
This section provides a brief overview of government policies and programs in
9
Vietnam that are related to inequality in the distribution of income and social welfare.
It is standard knowledge that the urban and rural sectors have different characteristics
in terms of income levels and distribution. As in the case of Vietnam, while rural
policy-makers focus on eradicating hunger and reducing poverty, urban
policy-makers focus mainly on reducing the income gap between those with different
educational levels, housing situations, employment status, etc. National
policy-makers, in their turn, must consider the entire country‟s development as well
as balanced development between the urban and rural sectors. In some cases, policies
that were intended to promote development throughout the whole in practice turned
out to be urban-biased. This is difficult to avoid since economic activities in most
countries, particularly in developing countries, tend to concentrate in urban areas,
and urban incomes increase more rapidly than rural incomes.
The current national development strategy, which serves as the national development
policy framework for the entire country, is the Socio-Economic Development
Strategy for 2001-2010 (SED 2001-2010). The strategy emphasizes building “focal
economic zones”, which have higher-than-average growth rates; these, in turn, will
contribute significantly to the growth of the entire country, including poorer regions.
Under this framework, some regions will be given a higher priority in public
investment and will thus develop more rapidly than other regions. This strategy sets
distinct goals and targets for the development of each of the different regions: urban,
lowland rural, mid-land and mountain rural, and offshore and island regions. Urban
regions are targeted for rapid industrialization and modernization, in order to develop
strong industrial and services sectors while also pioneering a knowledge-based
economy. In contrast, rural regions are targeted to promote income diversification.
SED 2001-2010 is the basis for the Comprehensive Poverty Reduction and Growth
Strategy (CPRGS), approved in 2002, which places the highest priority in promoting
rapid and sustainable economic growth while ensuring social progress and equity.
For both rural and urban areas, the CPRGS emphasizes creating income generation
opportunities for the poor. For rural areas, it emphasizes agricultural diversification.
For urban areas, it emphasizes poverty alleviation, particularly among the
unemployed, low income, the homeless, and those without equal access to services.
10
Though the national development policy framework ostensibly aims for a balanced
regional development, in reality, the policy seems to have an urban bias. Based on
the national framework, a number of policies directly affect the income distribution
or the income gap between rural and urban areas. While agricultural development
policies have been successful to some extent in raising the income of rural areas and
reducing urban-rural disparity, other policies have actually been biased towards the
urban sector.
According to Oshima (1998), agricultural reforms have significant impact on income
distribution. The land reform in Vietnam was promulgated through Decree No. 10
(Resolution 10) in April 1988, the New Land Law in 1987, and the Amended Land
Law in 1993, all of which significantly changed the agricultural management system.
Under the reform‟s guidelines, rural households became the basic decision-making
units in agricultural production. Agricultural decollectivization increased households‟
ability to make their own production choices, which provided strong incentives for
10 million rural households to make long-term investments and expand agricultural
production. The reform enabled the agricultural sector to grow rapidly at an annual
growth rate of 4% during the past ten years, which is higher than the average
agricultural growth rates of developing countries in the same period (Fritzen and
Brassard, 2005).
In price liberalization, the government ceased controls on the prices, abolished
compulsory sales of agricultural products to the state and thus allowed farmers to
dispose of their output on free markets. Farmers had freedom to commercialize their
products and free access to essential goods. The price reform has reduced the
transaction cost for farmers, which helps reduce inequality between urban and rural
areas.
In order to increase the income levels of the rural poor, many national programs have
focused on income generation opportunities for the poor, with particular emphasis on
employment generation and credit access. The Program on Provision of Credit to the
Poor aims at improving credit access for the poor. The Agricultural and Rural
Development Bank, set up in 2000 as one of the four largest commercial banks in
Vietnam, mainly provides credit in rural areas. The Government also established the
11
Bank for Social Policy in 2003, which is modeled after the operations of the Vietnam
Bank for the Poor. All of these policies are aimed at increasing income opportunities
and generating employment outside of the agricultural sector for labors in rural areas.
Fiscal policies appeared to be urban-biased as urban areas and selected regions have
received a disproportionate share of public expenditures whereas rural areas have in
contrast shouldered a relatively higher tax burden. For example, large-scale
infrastructure investments funded through the government‟s master Public
Investment Program (PIP) is biased towards more densely populated lowland and
urban areas. Three sub-regions comprised of the three large cities and suburbs of
Hanoi, Da Nang, and Ho Chi Minh City located in the Northern, Central and
Southern regions, respectively, are designated as “focal economic zones” based on
SED 2001-2010.
Furthermore, there is evidence that rural poor households bear a disproportionate
share of the tax burden (Fritzen and Brassard, 2005). While direct income taxes such
as personal income tax and the real estate tax are generally borne by rich urban
households, these actually account for a relatively small share of the government‟s
budget revenues. In contrast, the various taxes, fees and contributions levied on rural
residents account for a large share of their household income.
The widening disparity between the urban and rural sectors may be attributed to
restrictions on labor mobility between the two sectors. According to World Bank
(2004b), the annual rate of urbanization of Vietnam is expected to remain 3 percent,
the urban population share is forecasted to rise to 45% by 2020, and Vietnam will be
one of the least urbanized East Asian countries. The household registration system
and other barriers to employment and social services discourage rural residents from
migrating to urban areas for alternate employment that would yield higher returns to
their labor. Unregistered migrants from rural areas usually have unstable jobs and
have limited access to social services, or must pay more for these services. As
industrial development concentrates in urban areas, urban residents have a higher
chance of finding employment in the formal sector, and thus, earning higher income.
In contrast, rural residents find it difficult to look for higher-paying employment
within the rural area itself. Therefore, the gap between urban and rural areas will
12
inevitably increase.
Another urban-biased policy is trade liberalization. Trade liberalization usually
favors manufacturing activities, which are mainly located in urban areas. This is true
in all developing and developed countries. In Vietnam, the effective rate of protection
for the agricultural sector is about 13 percent, which is far lower than the 80 percent
effective rate of protection for the manufacturing sector (Weeks, Nguyen, Rathin and
Joseph, 2003). This large difference is typically due to a development strategy
seeking to foster industrialization. In Vietnam, trade liberalization is pursued in
parallel with industrialization, especially in export-oriented industries; thus, it
protects industrial sectors more than agricultural sectors. Exporters of manufactured
goods receive preferential tax treatment such as exemption from the value-added tax
and special sales tax as well as a low tax rate on profits. In contrast, agricultural
exporters do not receive such preferential tax treatment even when they export
agricultural products.
In addition to trade liberalization, foreign direct investment policies also appear to
have an urban bias. In general, foreign investment tends to flow to urban areas where
the infrastructure and skills are more developed and the likelihood of a high return to
investment is higher. Thus, in addition to a better initial endowment of infrastructure
and higher-skilled workers, urban areas receive more investment and a more rapid
increase in income than rural areas.
4. Methodology and Data
4.1 Methodology
4.1.1 Inequality Measures
There are various inequality indices to measure income distribution in a population.
A desirable inequality index needs to satisfy four basic properties: (1) anonymity –
the index is unaffected by who earns the income but is based on the distribution of
income among all individuals; (2) income homogeneity or mean independence – the
index remains the same if all individuals‟ income is changed by the same proportion;
(3) population independence – the index remains the same if the number of recipients
at each income level is changed by the same proportion; and (4) the Pigou-Dalton
13
principle – a transfer from a richer to a poorer person that does not reverse their
relative income ranks reduces the value of the index. (Shorrocks, 1980).
In this paper, two generalized entropy class of inequality measures and the Gini
coefficient are chosen as they satisfy the four desirable properties.
Let us define the following terms:
n is the total number of households in the population;
iy is the per capita income of household i (i=1, 2, …, n); and
i
iyY is total income of all households.
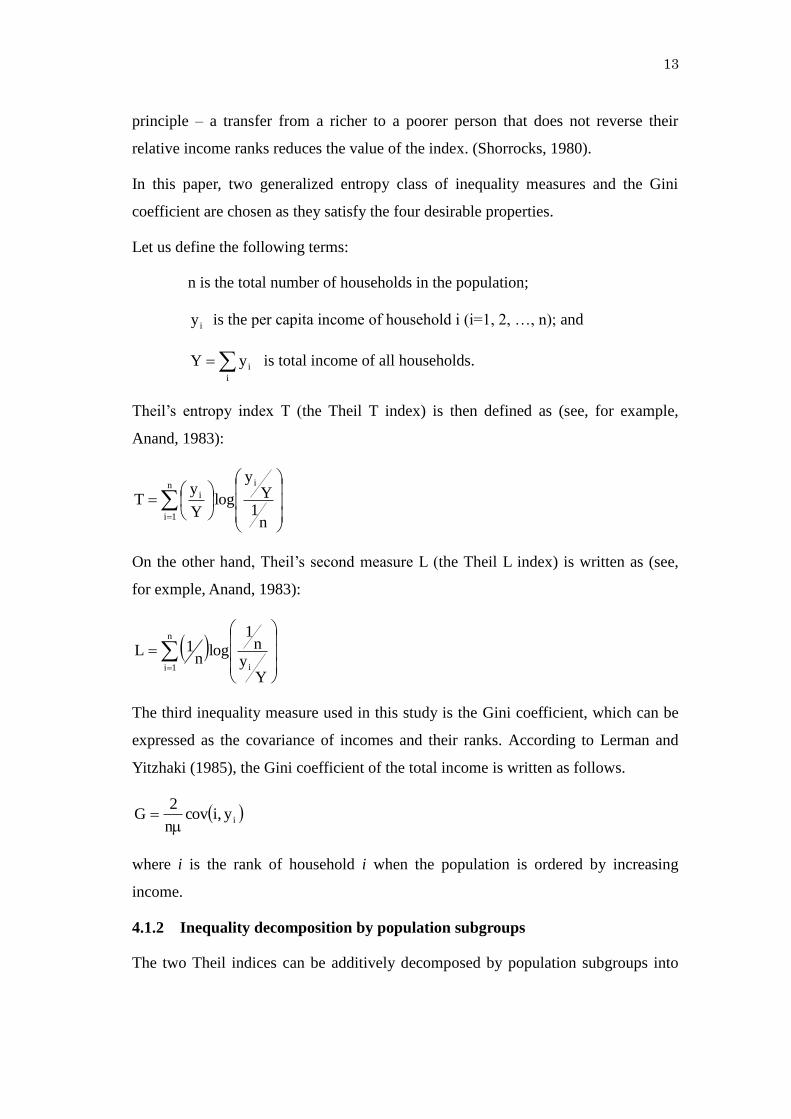
Theil‟s entropy index T (the Theil T index) is then defined as (see, for example,
Anand, 1983):
n
1i
i
i
n1
Yy
logY
yT
On the other hand, Theil‟s second measure L (the Theil L index) is written as (see,
for exmple, Anand, 1983):
n
1i i
Yy
n1
logn
1L
The third inequality measure used in this study is the Gini coefficient, which can be
expressed as the covariance of incomes and their ranks. According to Lerman and
Yitzhaki (1985), the Gini coefficient of the total income is written as follows.
iy,icovn
2G
where i is the rank of household i when the population is ordered by increasing
income.
4.1.2 Inequality decomposition by population subgroups
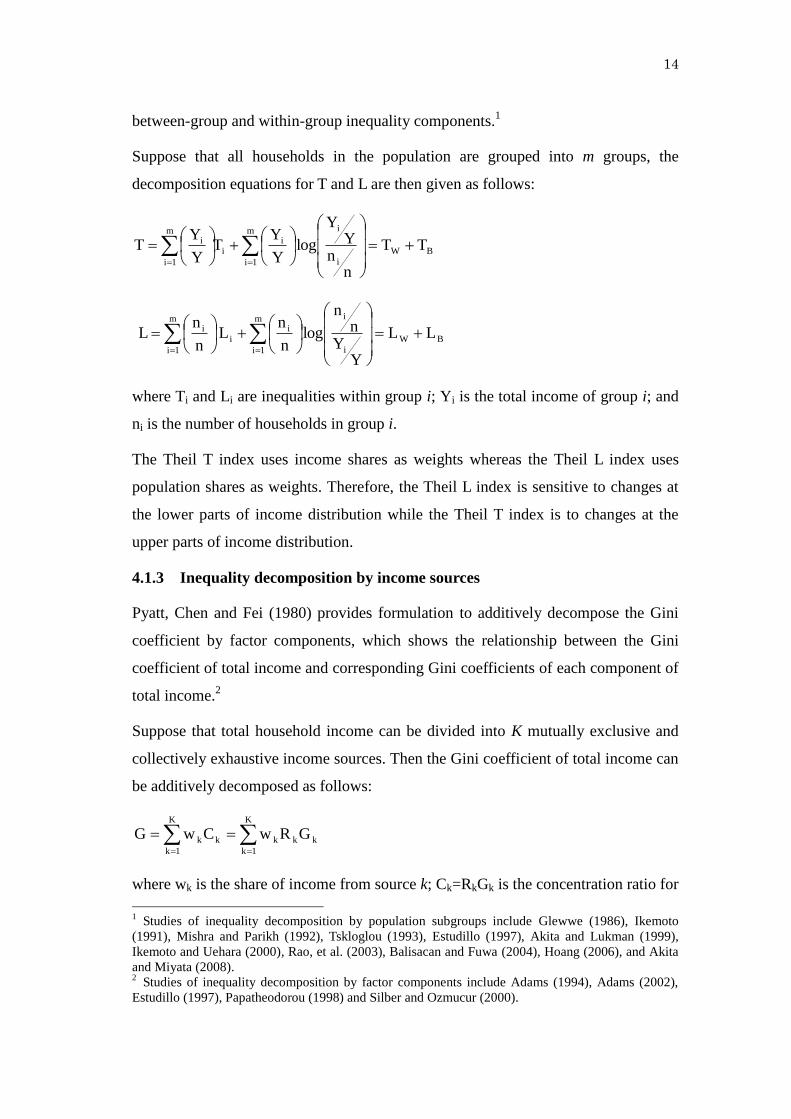
The two Theil indices can be additively decomposed by population subgroups into
14
between-group and within-group inequality components.1
Suppose that all households in the population are grouped into m groups, the
decomposition equations for T and L are then given as follows:
BW
m
1i i
i
ii
m
1i
i TT
nn
YY
logY
YT
Y
YT
BW
m
1i i
i
ii
m
1i
i LL
YY
nn
logn
nL
n
n L
where Ti and Li are inequalities within group i; Yi is the total income of group i; and
ni is the number of households in group i.
The Theil T index uses income shares as weights whereas the Theil L index uses
population shares as weights. Therefore, the Theil L index is sensitive to changes at
the lower parts of income distribution while the Theil T index is to changes at the
upper parts of income distribution.
4.1.3 Inequality decomposition by income sources
Pyatt, Chen and Fei (1980) provides formulation to additively decompose the Gini
coefficient by factor components, which shows the relationship between the Gini
coefficient of total income and corresponding Gini coefficients of each component of
total income.2
Suppose that total household income can be divided into K mutually exclusive and
collectively exhaustive income sources. Then the Gini coefficient of total income can
be additively decomposed as follows:
K
1k
K
1k
kkkkk GRwCwG
where wk is the share of income from source k; Ck=RkGk is the concentration ratio for
1 Studies of inequality decomposition by population subgroups include Glewwe (1986), Ikemoto
(1991), Mishra and Parikh (1992), Tskloglou (1993), Estudillo (1997), Akita and Lukman (1999),
Ikemoto and Uehara (2000), Rao, et al. (2003), Balisacan and Fuwa (2004), Hoang (2006), and Akita
and Miyata (2008). 2 Studies of inequality decomposition by factor components include Adams (1994), Adams (2002),
Estudillo (1997), Papatheodorou (1998) and Silber and Ozmucur (2000).
15
income source k; Gk is the Gini coefficient for income source k, and Rk is the rank
correlation ratio for income source k.
Inequality decomposition by income sources enables one to measure the contribution
of each income source to the overall income inequality. Based on the decomposition
result, it becomes possible to investigate (i) whether inequality from an income
source serves to increase or decrease overall inequality, and (ii) how much of the
overall inequality is due to a particular income source.
If gk is defined as the relative concentration ratio of the kth income source in overall
inequality, i.e., G
Cg k
k , then the above equation can be written as follows,
K
1k
kkgw1 . If gk>1, the kth income source is considered to be
inequality-increasing; if gk<1, the kth income source is considered to be
inequality-decreasing or inequality-equalizing.
Factor inequality weight, calculated by G
RGwgw kkk
kk , shows the proportion of
total inequality accounted for by income source k. As can be seen in the formula, the
contribution to total inequality by an income source depends on three components:
its share in total income, its own Gini coefficient, and its rank correlation ratio.
4.2 Data
This study uses data sets from the Vietnam Household Living Standard Surveys in
2002 and 2004 (VHLSS 2002, 2004), which cover 30,000 households and 9,000
households, respectively. The data sets satisfy standards for quality of inequality
measurements suggested by Deininger and Squire (1996). Those standards are (i)
households or individuals as units of observation; (ii) comprehensive coverage of
national population, and (iii) comprehensive measurement of income or expenditure.
As argued in Deaton (1997), expenditure data seems to be preferred to income data
to measure the inequality of household welfare because of data quality – the
information collected about expenditure data is more accurate and reliable than
information on income data. VHLSS 2002 and 2004, however, strictly followed the
designs and procedures required in Living Standards Measurement Study (LSMS)
16
household surveys of the World Bank (described in Grosh and Glewwe, 1996) and
collected a wide range of income information. The coverage is so comprehensive that
the data collected on household income is considered to be of high quality. Therefore,
it is possible to utilize data on household income to measure household living
standards and welfare with a high degree of confidence.
Using income data may be more efficient than expenditure data to measure market
returns to household factor endowments. Because household income normally
consists of expenditures and savings, market returns to factor endowments in the
form of savings are also considered. In this paper, income data is firstly used to
measure inequality in income distribution among households in urban and rural areas,
and then, it is used to investigate the inequalities of various income sources and their
contribution to overall inequality. Expenditure data are used to calculate comparable
inequality indices. The differences between the inequality indices that are based on
income or on expenditure will be discussed in order to provide a better understanding
of the indices themselves.
In this study, income data or expenditure data means per capita annual household
income or per capita annual household expenditure, respectively. As for income data,
annual household income is the total income earned by the household as a whole
with income contributed by all household members in the past 12 months from the
time of the survey. Income from a particular source is the total income that a
household earns in a year from that source. Per capita annual household income as
well as per capita annual household income from a particular source is calculated by
dividing the total income by the number of household members (household size).
Similar calculation is applied to expenditure data.
There are four categories of income source. First, wage income is defined as income
from wages and/or the salaries of household members in formal sector jobs. This is
the total of all money received as wages, bonuses and in-kind payments from various
forms of allowances for primary and any secondary jobs. In the surveys, wages are
the only income source that is recorded on an individual level. Second, agricultural
income consists of both farm and non-farm agricultural production activities, the
latter of which includes forestry, fishing, aquaculture, and the processing of crops
17
produced by the household. In the surveys, agricultural income is calculated by
subtracting total expenditure from total revenue of all agricultural activities
conducted by the household. Third, non-farm self-employment income is income
from self-employed activities in non-farm, non-forestry and non-aquaculture
businesses, which are usually conducted in the form of household enterprises. Finally,
other income covered all remaining income, which may include educational
subsidies, health subsidies, rental income from a house or land, and other incoming
moneys such as domestic or overseas remittances, various kinds of social allowances,
interests from savings, coupons, income from leasing a workshop, machinery, etc.
5 Results and Discussions
5.1 Inequality decomposition by population groups
This section investigates the disparity between urban and rural sectors based on both
per capita household income and per capita household expenditure, both of which are
usually considered standard measures of household welfare. One hypothesis about
these different income concepts is that total inequality of income is higher than that
of expenditure, though the between-sector component of income-based inequality is
lower than that of expenditure-based inequality. (Deininger and Squire, 1996;
Shorrocks and Wan, 2005)
Table 1 shows the mean per capita household income and expenditure in the urban
and rural sectors for 2002 and 2004. The ratio of mean income values between the
urban and rural sectors reflects urban-rural disparity. On average, an individual in
urban areas earns and consumes twice as much as an individual in rural areas. In
2004, both ratios of income and expenditure show that urban income was as much as
1.94 times higher than rural income, whereas in 2002, the income ratio was 1.93 and
the expenditure ratio was 1.98. With regards to income, urban households earn more
than rural households because they have better initial endowments and they receive
higher returns to household endowments such as education and experience. With
regards to expenditure, rural households consume less than their urban counterparts
because the cost of living is lower in rural areas, and the consumption of
home-produced goods may sometimes not be counted as expenditure for rural
households. As an example, urban households generally spend more on education
18
and housing: in urban areas, a household has to pay 2.4 times higher than a rural
household for education and 3.4 times higher for housing, electricity, water and
garbage collection. These comparisons do not even take into account the fact that
rural households usually have more members than urban households: a rural
household has on average 4.5 members while an urban household has on average 4.2
members (VHLSS 2004).
Table 1
However, in the context of other developing countries in Southeast Asia and East
Asia, a ratio of urban-rural mean per capita expenditure of less than 2.0 is relatively
low. The comparable ratio is 2.16 in Indonesia in 2002 (Akita and Miyata, 2008),
2.17 in the Philippines in 1991 (Estudillo, 1997), 2.47 in China in 1995, and 2.09 in
Thailand in 1981 (Eastwood and Lipton, 2000). All these ratios were calculated
based on expenditure data. This may serve as evidence that the urban-rural disparity
in Vietnam is not as severe as other countries at comparable levels of development.
Table 2 presents inequality decomposition of two Theil indices in the urban and rural
sectors in 2002 and 2004. The following are several observations that can be drawn
from the table and additional data as illustrated by tables 3, 4 and 5.
Table 2
Firstly, it is notable that all indices for inequality within the urban sector are
correspondingly higher than inequality indices within the rural sector. For example,
the Theil L indices for per capita household income within the urban and rural
sectors were 0.25 and 0.22, respectively in 2004. The difference was much larger
upon examining inequality in per capita household expenditure: the urban and rural
sectors‟ Theil L indices were recorded at nearly 0.20 and 0.15, respectively. These
results are consistent with the generalized observation that developing countries‟
urban sectors have higher income or expenditure inequality than their respective rural
sectors (Kuznets, 1955; Estudillo, 1997; Akita and Miyata, 2008). However, the
difference is comparatively smaller than other Asian countries3.
3 Theil L indices for the urban and rural sectors in Indonesia in 2002 were 0.258 and 0.124,
respectively (Akita and Miyata, 2002); similarly, Theil L indices in the Phillipines in 1991 were 0.17
and 0.11, respectively (Estudillo, 1997)
19
Secondly, it is instructive to note the different changes in the two inequality measures.
The Theil L index based on per capita income increased slightly from 0.259 in 2002
to 0.274 in 2004; in contrast, the Theil T index appeared to have remained constant at
0.30 in both years. This difference may relate to the sensitivity of each index to
income changes at different income groups of the distribution. The Theil L index,
using population shares as weights, is less sensitive to income changes at the top of
the distribution than the Theil T index, which uses income shares as weights and thus,
is more sensitive to income changes among higher income levels. Therefore, there is
a possibility that inequality in distribution of per capita household income within
poor people increased while that within rich people decreased. As measured based on
per capita expenditure, the Theil L index appeared to have remained constant at
0.208 while the Theil T index had a slight decrease from 0.235 in 2002 to 0.228 in
2004. This again may be attributed to a decrease in inequality in expenditure within
higher income levels, which actually offsets the increase in inequality within lower
income levels.
Thirdly, as can be seen from table 2, inequality in the distribution of per capita
household income was higher than inequality in the distribution of per capita
household expenditure. For example, the Theil L index based on per capita
household income was 0.259 and 0.274 in 2002 and 2004, respectively, and the Theil
L index based on per capita household expenditure was lower at approximately 0.21
in both years. Sub-group Theil L indices for the urban and rural sectors also indicate
the same pattern: income-based indices were always higher than expenditure-based
indices. This appears to be consistent with Deininger and Squire (1996), who state
that the expenditure distribution tends to be significantly and systematically more
equitable than income distribution.
Finally, we consider the between-sector component of inequality. The data show that
the contribution of the between-sector component to income-based inequality was
much lower than to expenditure-based inequality. In 2004, the between-sector
component accounted for approximately 16% of income-based inequality but as high
as 22% for expenditure-based inequality. As can be seen in table 2, between-sector
inequalities based on both income measures were almost the same, at 0.045 in 2004,
as measured by the Theil L index. Therefore, the difference in the between-sector
20
component‟s contribution is completely attributable to the difference in the
within-sector component. The within-sector component of income inequality as
measured by The Theil L index was 0.228 in 2004, while the comparable measure of
expenditure inequality was only 0.162.
Table 3 presents the inequality decomposition by income deciles and reveals the
reason why the Theil L index had a slight increase while the Theil T index remained
constant in 2002 and 2004. Deciles are determined by dividing the whole population,
consisting of 9185 households, into ten groups, each of which contains ten percent of
the population, and orders them from the poorest to the richest groups according to
per capita household income level. During these two years, inequality within the
highest income group (decile 10) decreased substantially from 0.107 to 0.094 and
from 0.147 to 0.116 as measured by the Theil L and Theil T indices, respectively. The
Theil T index is weighted by income shares, which are as large as over 30% for the
highest income group (decile 10). Thus, the decrease in inequality within this group
caused the Theil T index to remain almost constant even though the between-group
component had increased.
Table 3
Table 4 presents per capita household income, per capita household expenditure, and
household savings by ten deciles. Per capita income varies over a larger range than
per capita expenditure. Firstly, the ratio between the top and bottom deciles of the per
capita income groups is higher than the same ratio of the per capita expenditure
groups. On average, a member in a household of the top decile earns as much as 13
times higher than a member in a household of the bottom, but he/she consumes
approximately 7 times. Secondly, the percentage shares of income and expenditure of
each decile also indicate that the variation in the distribution of per capita income is
larger. The income share of the poorest households is smaller than their expenditure
share, which were 2.5% and 3.7%, respectively, in 2004. Lower income households
have to spend relatively more of their income for survival purposes, and they may
even have to borrow money to maintain their minimum consumption for survival. In
contrast, the income share of the richest households is much larger than their
expenditure share, which were 31.5% and 24.6%, respectively, in 2004. The
21
difference in income and expenditure shares is much larger for the higher income
households because they save more than lower income households. The richest
households contribute 45% to total household savings; a member in a household of
the top decile saves as much as 45 times higher than a member in a household of the
bottom.
Table 4
Table 5 presents per capita household income, per capita household expenditure and
household savings of ten deciles in the urban and rural sectors. Urban deciles are
obtained by dividing the urban population, consisting of 2,248 households, into ten
groups based on per capita household income, and similarly, rural deciles are
obtained by dividing the rural population, consisting of 6,937 households, into ten
groups based on per capita household income.
Table 5
Within the urban sector, the ratio of mean income between the richest households to
the poorest households was over 12, whereas the same ratio based on mean
expenditure was half of that. Income shares range from 2.5% for the poorest group to
29.7% for the richest group, while expenditure shares range from 3.5% for the
poorest group to 23% for the richest group. The distribution of both income and
expenditure was more equal in the rural than in the urban sector, which signifies that
inequality within the rural sector is lower than that within the urban sector.
There is an unexpected observation regarding household savings in the urban sector
– the mean savings of the lowest income urban households (decile 1) was higher than
that of the four higher income groups (deciles 2, 3, 4 and 5). In contrast, the savings
of the lowest income rural households was extremely low, accounting for only 0.1%
of total savings; this can be attributed to the extremely weak economic conditions of
those households. Most of them experienced hunger and barely had enough income
for survival; thus, a low savings rate is reasonable for this group. Apart from these
two contrary results, household savings in the urban and rural sectors reflected the
savings level of the country as a whole, in which high income households accounted
for a majority of total savings, thus accounting for why income inequality is higher
than expenditure inequality.
22
5.2 Inequality decomposition by income sources
Household income, as described in sub-section 4.2, consists of four main sources:
wage income, agricultural income, non-farm self-employment income, and other
income. This sub-section evaluates the contribution of each source to total income
and to overall inequality.
5.2.1 Sources of household income
Table 6 presents summary statistics of four sources of household income in 2002 and
2004. Wage income roughly equaled income from agricultural activities, and both
had relatively high means among the four income sources. All of the income sources
were positively correlated to total income at the 1% significance level. Wage
employment and agricultural activities appeared to be the most important sources of
income, but their effect on changes in total income was less than other income.
Table 6
Table 7 presents four sources of household income in the urban and rural sectors
separately. There are notable differences between the two sectors. In the urban sector,
wage income was the largest source of income and was approximately as much as
five times larger than agricultural income; in contrast, wage income was equal to
only half of agricultural income in the rural sector. The per capita income of an urban
household was about twice as much as that of a rural household. However, the
urban-rural ratio of per capita income varies across income sources. Per capita
income from wage employment or non-farm self employment in urban areas was
more than three times higher than in rural areas. On the other hand, per capita income
from agriculture in urban areas is only one-third of that in rural areas.
Table 7
The characteristics of these four sources of income can be further examined by
looking at the different income groups. Figure 1 plots the shares of each income
source in the ten income groups in the urban sector in 2004, and Figure 2 does the
same for the rural sector. Because the results for 2002 are very similar, they are
omitted.
Figures 1 and 2
23
In the urban sector, except for the poorest income group, wage income appears to be
the most important source of income, and its share varied across income groups from
35% to 43%. For middle income groups (deciles from 4 through 7) in the urban
sector, non-farm self-employment income was the second most important income
source. This indicates that non-farm self-employment is a relatively important source
of income for middle-income households. The share of agricultural income decreases
across income groups.
Agricultural income was the most important income source in the rural sector,
though its share decreased consistently and significantly across income groups: from
65% for the highest income group to 30% for the lowest income group. Except for
the two richest groups (deciles 9 and 10), the second most important income source
for rural households was wage income, which accounted for roughly 25% of total
income. It is interesting to note that the shares of non-farm self-employment income
and other income increase across income groups.
The four income sources for the richest group (decile 10) indicate a different pattern
from those in the other deciles. The share of other income was significantly higher
than the average in either the urban sector or the rural sector, which was almost the
same as that of wage income in the urban sector and that of agricultural income in
the rural sector. Thus, rich households‟ income was relatively more dependent upon
rental income from houses and land, interest, shares, coupons, and loans.
On the other hand, for the poorest income group (decile 1) in the urban sector, the
share of wage income was lower than that of agricultural income, indicating that
poorest households depend mainly on agricultural income even in urban areas.
Relatively high share of other income for the poorest income group indicates that
urban poor households may have income from other sources such as income and
support from charitable organizations, associations, firms, and government subsidies
including educational and health subsidies.
5.2.2 The Gini Decomposition by income sources
Table 8 shows the decomposition of the Gini coefficient by four income sources.
Consistent with the above results, wage income contributed the largest share to total
income (28%), followed by agricultural income (27%). Wage income had a relatively
24
high Gini coefficient and rank correlation ratio, which were 0.72 and 0.59,
respectively, in 2004. This resulted in a relative concentration ratio larger than unity,
and wage income served to increase overall inequality. On the other hand,
agricultural income served to decrease overall inequality as its relative concentration
ratio was less than unity due to a low Gini coefficient and low rank correlation ratio.
Table 8
Factor inequality weight is calculated as the product of income share of each source
and its relative concentration ratio and represents the contribution to overall
inequality of each income source. Wage income contributed a slightly larger share to
overall inequality than its share in total income at 29% of overall inequality.
Agricultural income contributed roughly the same share to total income, but because
the relative concentration ratio was much lower than unity, agricultural income
contributed the least to overall inequality at 11% of overall inequality.
Non-farm self-employment income contributed about 21% to total income but up to
28% to overall inequality in 2004. It appears to be the most unequally-distributed
source as its Gini coefficient was as high as 0.83. Other income increased its share to
total income significantly from 18% in 2002 to 24% in 2004. It had a relatively high
Gini coefficient and rank correlation ratio, and thus served to increase overall
inequality. Its contribution to overall inequality was 32%, which was in fact the
largest among four income sources in 2004.
The results of the decomposition of a separate Gini coefficient for the urban and rural
sectors are presented in table 9. There are clearly different patterns for each income
source within the same sector, both urban and rural. Wage income contributed the
largest share to total income in the urban sector, accounting for 42% in 2002 and
37% in 2004, while it accounted for about 23% in the rural sector, which was the
second largest share after agricultural income. Both the Gini coefficient and rank
correlation ratio of wage income within the sectors were lower than those calculated
for the whole population. Thus, its relative concentration ratios were also lower at
0.89 and 0.87 in 2004 in the urban and rural sectors, respectively, which were both
less than unity; therefore, wage income served to decrease overall inequality within
each sector. However, because of its large contribution to total income in the urban
25
sector, wage inequality accounted for 33% of urban income inequality in 2004. In the
rural sector, wage income accounted for 20% of rural inequality in 2004, which was
smaller than the other sources of income.
Table 9
The contribution of agricultural income is in direct contrast. In the urban sector,
agricultural income was highly unequally distributed with a Gini coefficient nearly
0.9. However, its share in total income was minor at less than 10%; therefore, it
contributed little to overall inequality. On the other hand, in the rural sector,
agricultural income was the most equally distributed with a Gini coefficient of 0.52.
As an income source, agricultural income served to decrease overall inequality, but
because its share in total rural income was as high as over 40%, agricultural income
contributed a lot to overall inequality within the rural sector: 30% in 2002 and 28%
in 2004.
Non-farm self-employment appeared to be neutral to income inequality in the urban
sector because its relative concentration ratio was almost equal to unity. However,
non-farm self-employment contributed to the increase in overall inequality in the
rural sector as it was the most unequally distributed income source: its Gini
coefficient was 0.85, and it was highly correlated with total income with a rank
correlation ratio at over 0.6. In this transitional period in Vietnam, many rural
residents do not have enough skills to work in the formal sector, which is also
relatively undeveloped in the rural sector. Thus, non-farm self-employment is a
feasible choice for rural residents to escape from relatively low income agricultural
work.
Finally, other income served to increase overall inequality in both urban and rural
sectors, as its relative concentration ratio was much larger than unity. Its contribution
to overall inequality was the largest in 2004, at 37% in the urban sector and 29% in
the rural sector.
6 Conclusions
This paper has attempted to utilize income data as a measurement of living standards
for Vietnamese households in order to investigate the level of urban-rural disparity
26
and to examine urban and rural inequalities from the perspective of various income
sources. The study is conducted based on large data sets from nationwide
comprehensive household surveys – the Vietnam Household Living Standards
Surveys of 2002 and 2004.
Since the dramatic reform promulgated by doi moi starting in 1986, Vietnam has
experienced problems associated with urban-biased policies in public finance,
restrictions in labor mobility and trade liberalization that have contributed to the
development of the urban sector at the expense of the rural sector. These are similar
to the urban-biased policies implemented in China, which have had the consequence
of severe urban-rural disparity and wage inequality throughout the country (Yang,
1999; Yang and Zhou, 1999). However, certain government policies that promoted
agricultural reforms such as land decollectivization and price liberalization have
contributed to ameliorate the disparity in income growth between the urban and rural
sectors in Vietnam. In addition, the increasing importance of wage employment has
not only reduced poverty but has also reduced inequalities within each sector, as
confirmed by the main findings in this study.
This study is different from many other studies on inequality in Vietnam in that it
uses household income data, and it concludes that income-based inequality is higher
than expenditure-based inequality, both for the population as a whole and for urban
and rural sectors separately. This is due to the fact that household income varies over
a wider range than expenditures, and household savings is indisputably higher in the
top income group.
If expenditure data were used as in previous studies, more than 20% of overall
inequality can be attributed to the difference in per capita household expenditure
between the urban and rural sectors. However, only 16% of overall inequality in per
capita household income would have originated from differences in income levels
between the two sectors. On the other hand, within-sector inequalities based on
income data are substantially higher than that based on expenditure data. The
difference reveals that while the gap in expenditure level may be more attributable to
the location characteristics of a household, urban versus rural, the gap in income
level seems to be due to differences in other characteristics such as education and the
27
occupations of household members within each sector.
On average, an individual in urban areas earns and consumes twice as much as an
individual in rural areas. With regards to income, urban households earn more than
rural households because they have better initial endowments and they receive higher
returns to household endowments such as education and experience. With regards to
expenditure, rural households consume less than their urban counterparts because the
cost of living is lower in rural areas, and the consumption of home-produced goods
may sometimes not be counted as expenditure for rural households. However, in the
context of other developing countries in Southeast Asia and East Asia, a ratio of
urban-rural mean per capita expenditure of 2.0 is relatively low, indicating that the
urban-rural disparity in Vietnam is not as severe as other countries at comparable
levels of development.
According to the decomposition analysis by income sources, the contribution of
wage income to total is only a little higher than its share in total income. Within the
urban sector and the rural sector, wage income even serve to reduce overall
inequality as its contribution to total inequality is smaller than its share in total
income. The occupations that account for wage employment in Vietnam is currently
quite homogeneous, so wage differentials across occupations are not currently
significant. In addition, state-owned enterprises provide a large share of wage
employment both in the urban and rural sectors, and wages in state-owned
enterprises are relatively equally distributed. Therefore, it is reasonable that wage
income currently serves to ameliorate overall income inequality.
In the rural sector, agricultural income contributes the largest share to total income
and decreases overall inequality in that sector. The decreasing share of agricultural
income implies that inequality within the rural sector will increase in the future. In
addition, the increase in the shares of non-farm self-employment and other income to
total income will lead to increasing inequality in the rural sector, as they are
inequality increasing sources of income.
Based on the analysis of the inequality decompositions, it is possible to suggest
policies for the Vietnamese government to address the problem of inequality in the
country. In rural areas, income diversification appears to be an effective way to help
28
poor households out of hunger and poverty. Government policies that provide access
to credit for the poor, education and job training opportunities for formal sector
employment, and entrepreneurial support to start household businesses all serve to
increase income opportunities for low income groups in the rural sector.
The continued development of the business sector, especially private enterprises, will
definitely generate more employment opportunities and thus increase incomes.
Household businesses in rural areas can potentially provide employment to large
numbers of rural workers and thus increase income for the poor rural household. In
urban areas, the development of high-skilled jobs will increase the gap in wage
income. Therefore, it is necessary to have appropriate policies to provide as many
urban residents as possible with the skills and experience to serve in these jobs.
Encouraging migration from rural to urban areas, especially to industrial zones and
export manufacturing zones located in the suburbs of big cities, would help increase
income levels for rural areas. Rural migrants to urban centers are usually members of
low income households that lack employment and/or agricultural land. Therefore,
when these migrants are employed in the urban sector, their remittances to their rural
households will help increase the income of the poorer rural households.
It is also clear that trade liberalization and the integration of the Vietnamese economy
to the world economy have different distributional effects on urban and rural
households. It is imperative that governmental policies recognize this and
compensate those groups mostly in rural areas that are negatively affected by trade
liberalization.
With these and other distributional policies, it is possible for Vietnam to navigate the
transition to a modern, industrial economy with lower rates of income and
expenditure inequalities than its peer countries in East Asia and Southeast Asia.
References
Adams, R. H. (1994), „Non-Farm Income Inequality in Rural Pakistan: A
Decomposition Analysis‟, Journal of Development Studies 3 (1): 110-33.
Adams, R. H. (2002), „Non-farm Income, Inequality, and Land in Rural Egypt‟,
Economic Development and Cultural Change 50: 339–63.
29
Akita, T., and R. A. Lukman (1999), „Spatial Patterns of Expenditure Inequalities in
Indonesia: 1987, 1990, and 1993‟, Bulletin of Indonesian Economic Studies
35 (2): 65-88.
Akita, T., R. A. Lukman and Y. Yamada (1999), „Inequality in the Distribution of
Household Expenditure in Indonesia: A Theil Decomposition Analysis‟, The
Developing Economies 37 (2): 197–221.
Akita, T., and S. Miyata (2008), „Urbanization, Educational Expansion, and
Expenditure Inequality in Indonesia in 1996, 1999, and 2002‟, Journal of the
Asia Pacific Economy 13(2): 147-167.
Anand, S. (1983), Inequality and Poverty in Malaysia: Measurement and
Decomposition, A World Bank Research Publication, Oxford University Press,
London.
Balisacan, Arsenio M. and Fuwa, Nobuhiko (2004) „Changes in Spatial Income
Inequality in the Philippines‟, UNU/WIDER Research Paper No. 2004/X,
Helsinki.
Deaton, A. (1997), The Analysis of Household Surveys: a Microeconomic Approach
to Development Policy, Johns Hopkins University Press, London.
Deininger, K., and L. Squire (1996), „A New Data Set Measuring Income Inequality‟,
The World Bank Economic Review 10 (3): 565-91.
Eastwood, R., and M. Lipton (2000), „Rural-Urban Dimension of Inequality Change‟
UNU-WIDER Working Paper (No. 200), World Institutes for Development
Economics Research United Nation University, Helsinki, Finland.
Estudillo, J. (1997), „Income Inequality in the Philippines, 1961-91‟, The Developing
Economies 35 (1): 68-95.
Fritzen, S. (2002), „Growth, Inequality and the Future of Poverty Reduction in
Vietnam‟, Journal of Asian Economics 13: 635-57.
Fritzen, S. and C. Brassard (2005), Vietnam Inequality Report 2005: Assessment and
Policy Choices, Mekong Economics Ltd. Synthesis Paper of the “DFID
Drivers of Inequality in Vietnam” Project.
Gallup, J. (2002), „The Wage Labor Market and Inequality in Vietnam in the 1990s‟,
World Bank Policy Research Working Paper (No. 2896), The World Bank,
Washington, D.C.
Glewwe, Paul (1986) „The Distribution of Income in Sri Lanka in 1969–70 and
1980–81: a Decomposition Analysis‟, Journal of Development Economics
24(2): 255–74.
Glewwe, P., M. Gragnolati and H. Zaman (2000), „Who Gained from Vietnam‟s
Boom in the 1990‟s? An Analysis of Poverty and Inequality Trends‟, World
Bank Policy Research Working Paper (No. 2275), The World Bank,
Washington, D.C.
Grosh, M. and P. Glewwe (1996), „A Guide to Living Standards Surveys and Their
Data Sets‟ Living Standard Measurement Study Working Paper (No. 120),
The World Bank, Washington, D.C.
30
Heltberg, R. (2003), „Inequality in Vietnam: A Regression-based Decomposition‟,
paper presented at the UNU-WIDER Conference on Inequality, Poverty and
Human Well-Being, Helsinki.
Hoang, H. (2006), Theil Decomposition Analysis of the Inequality in Vietnam: 1993,
1998 and 2002. Unpublished master‟s thesis, International University of
Japan, Japan.
Ikemoto, Y. (1991), Income Distribution in Thailand: Its Changes, Causes and
Structure, I.D.E Occasional Papers Series No. 25, Institute of Developing
Countries, Tokyo.
Ikemoto, Y., and M. Uehara (2000), „Income Inequality and Kuznets‟ Hypothesis in
Thailand‟, Asian Economic Journal 14 (4): 421-43.
Jensen, H. T., and F. Tarp (2005), „Trade Liberalization and Spatial Inequality: a
Methodological Innovation in a Vietnamese Perspective‟, Review of
Development Economics 9 (1): 69–86.
Kuznets, S. (1955), „Economic Growth and Income Inequality‟, American Economic
Review 45: 1-28.
Lerman, R., and S. Yitzhaki (1985) „Income Inequality Effects by Income Source: A
New Approach and Applications to the United States‟, The Review of
Economics and Statistics 67: 151-6.
Minot, N., M. Epprecht, T. T. A. Tran and Q. T. Le, (2006), „Income Diversification
and Poverty in the Northern Uplands of Vietnam‟, International Food Policy
Research Institute Research Report (No. 145), IFPRI, Washington, D.C.
Minot, N., B. Baulch and M. Epprecht (2006), „Poverty and Inequality in Vietnam:
Spatial Patterns and Geographic Determinants‟, International Food Policy
Research Institute Research Report (No. 148), IFPRI, Washington, D.C.
Mishra, Padmaja and Parikh, Ashok (1992) „Household Consumer Expenditure
Inequalities in India: a Decomposition Analysis‟, Review of Income and
Wealth 38(2): 225-236.
Nguyen, B., J. Albrecht, S. Wroman, and M. Westbrook (2006), „A Quantile
Regression Decomposition of Urban-Rural Inequality in Vietnam‟, ADB
Working Paper (No. 2006.2), Asian Development Bank, Manila, Philippines.
Nguyen, C., and K. D. Tran (2006), „The Impact of Trade Liberalization on
Household Welfare in Vietnam‟, MPIA Working Paper (No. 2006-02),
MIMAP-Vietnam Project, International Development Research Centre,
Canada.
Nguyen, C., K. D. Tran, M. Ghosh, and J. Whalley (2005), „Adjustment Costs in
Labour Markets and the Distributional Effects of Trade Liberalization:
Analytics and Calculations for Vietnam‟, Journal of Policy Modeling 27:
1009–24.
Oshima, H. T. (1998), „Income Distribution Policies in East Asia‟, The Developing
Economies 36 (4):359-86.
Papatheodorou, C. (1998), „Inequality in Greece: An Analysis by Income Source‟,
31
Distributional Paper (No. 39), Suntory and Toyota International Centres for
Economics and Related Disciplines, London School of Economics, London.
Pyatt, G., C. Chen, and J. Fei (1980), „The Distribution of Income by Factor
Components‟, Quarterly Journal of Economics 95 (3): 451-73.
Rao, V.V. Bhanoji, Banerjee, D.S. and Mukhopadhaya, Pudarik (2003) „Earnings
Inequality in Singapore‟, Journal of the Asian Pacific Economy 8(2):
210-228.
Scott, S., and C. Truong (2004), Behind the Numbers: Social Mobility, Regional
Disparities, and New Trajectories of Development in Rural Vietnam. In P.
Taylor (Eds.), Social Inequality in Vietnam and the Challenges to Reform.
Institute of Southeast Asian Studies, Singapore.
Shorrocks, A. F. (1980), „The Class of Additively Decomposable Inequality
Measures‟, Econometrica 48 (3): 613-26.
Shorrocks, A. F., and G. Wan (2005), „Spatial Decomposition of Inequality‟, Journal
of Economic Geography 5: 59-81.
Silber, J., and S. Ozmucur (2000), „Decomposition of Income Inequality Evidence
from Turkey‟, Topics in Middle Eastern and North African Economies,
Electronic Journal No. 2, Middle East Economic Association and Loyola
University Chicago.
Tsakloglou, Panos (1993) „Aspects of Inequality in Greece: Measurement,
Decomposition and Intertemporal Change, 1974, 1982‟, Journal of
Development Economics 40(1): 53–74.
van de Walle, D., and D. Cratty (2004), „Is the Emerging Non-farm Market Economy
the Route out of Poverty in Vietnam?‟, The Economics of Transition 12 (2):
237-74.
Vijverberg, W., and J. Haughton (2004), „Household enterprises in Vietnam: Survival,
growth, and living standards‟, In Glewwe, P., N. Agrawal, and D. Dollar
(Eds.), Economic Growth, Poverty and Household Welfare: Policy Lessons
from Vietnam, World Bank Regional and Sectoral Studies, The World Bank,
Washington, D.C.
Weeks, J., T. Nguyen, R. Rathin and L. Joseph (2003), „Seeking Equity with Growth‟,
The Macroeconomic of Poverty Reduction: The Case Study of Vietnam,
United Nation Development Program.
World Bank. (2004a). Vietnam Development Report 2004 – Poverty. Retrieved
October 20, 2006, from the World Bank Web site:
http://www.worldbank.org/reference/
World Bank. (2004b). Urbanization Dynamics and Policy Frameworks in Developing
East Asia. Retrieved December, 20, 2006 from
http://siteresources.worldbank.org/INTEAPREGTOPURBDEV/Resources/Ur
banization-Dynamics-2004.pdf
World Bank (2006a). Vietnam Development Report 2006 – Business. Retrieved
October 20, 2006, from the World Bank Web site:
http://www.worldbank.org/reference/
32
World Bank (2006b), „Taking Stock - An Update on Vietnam's Economic
Developments and Reforms‟, Mid-Year Consultative Group Meeting for
Vietnam, Nha Trang, June 9 – 10, 2006, World Bank Vietnam.
Yang, D. T. (1999), „Urban-Biased Policies and Rising Income Inequality in China‟,
American Economic Review 89 (2): 306-10.
Yang, D. T. and H. Zhou (1999), „Rural--Urban Disparity and Sectoral Labour
Allocation in China‟, Journal of Development Studies 35 (3): 105-134.
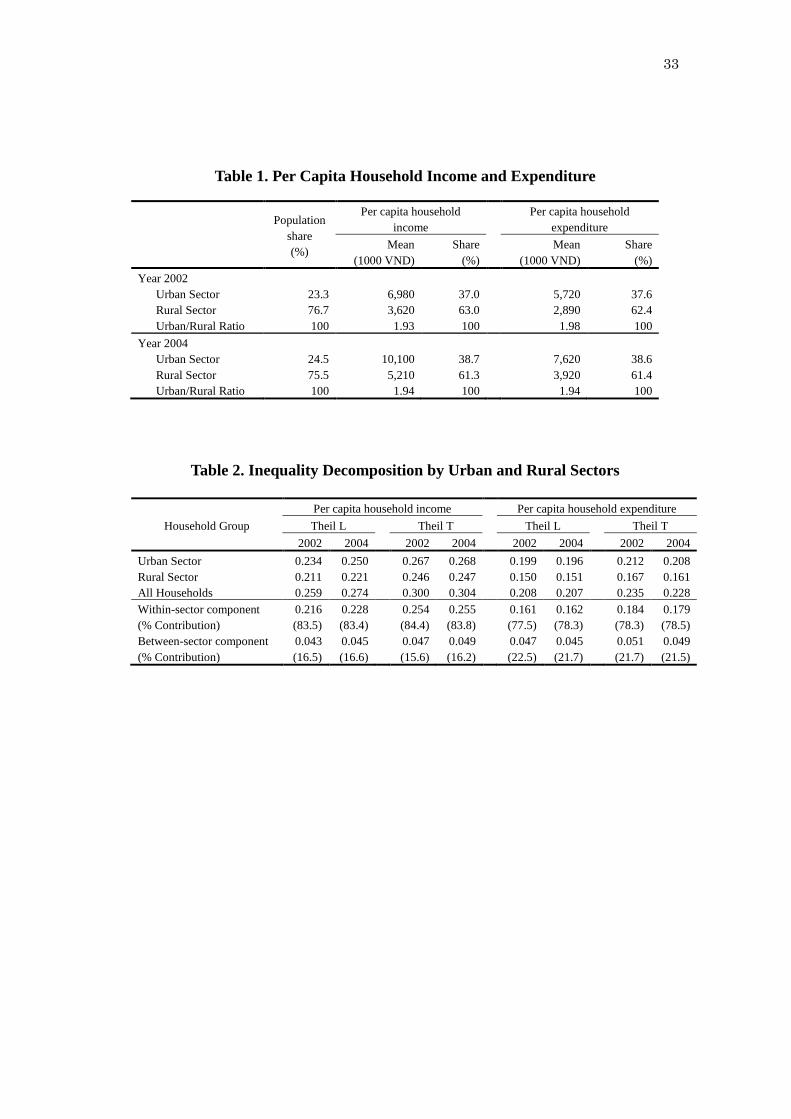
33
Table 1. Per Capita Household Income and Expenditure
Population
share
(%)
Per capita household
income
Per capita household
expenditure
Mean
(1000 VND)
Share
(%)
Mean
(1000 VND)
Share
(%)
Year 2002
Urban Sector 23.3 6,980 37.0 5,720 37.6
Rural Sector 76.7 3,620 63.0 2,890 62.4
Urban/Rural Ratio 100 1.93 100 1.98 100
Year 2004
Urban Sector 24.5 10,100 38.7 7,620 38.6
Rural Sector 75.5 5,210 61.3 3,920 61.4
Urban/Rural Ratio 100 1.94 100 1.94 100
Table 2. Inequality Decomposition by Urban and Rural Sectors
Household Group
Per capita household income Per capita household expenditure
Theil L Theil T Theil L Theil T
2002 2004 2002 2004 2002 2004 2002 2004
Urban Sector 0.234 0.250 0.267 0.268 0.199 0.196 0.212 0.208
Rural Sector 0.211 0.221 0.246 0.247 0.150 0.151 0.167 0.161
All Households 0.259 0.274 0.300 0.304 0.208 0.207 0.235 0.228
Within-sector component 0.216 0.228 0.254 0.255 0.161 0.162 0.184 0.179
(% Contribution) (83.5) (83.4) (84.4) (83.8) (77.5) (78.3) (78.3) (78.5)
Between-sector component 0.043 0.045 0.047 0.049 0.047 0.045 0.051 0.049
(% Contribution) (16.5) (16.6) (15.6) (16.2) (22.5) (21.7) (21.7) (21.5)
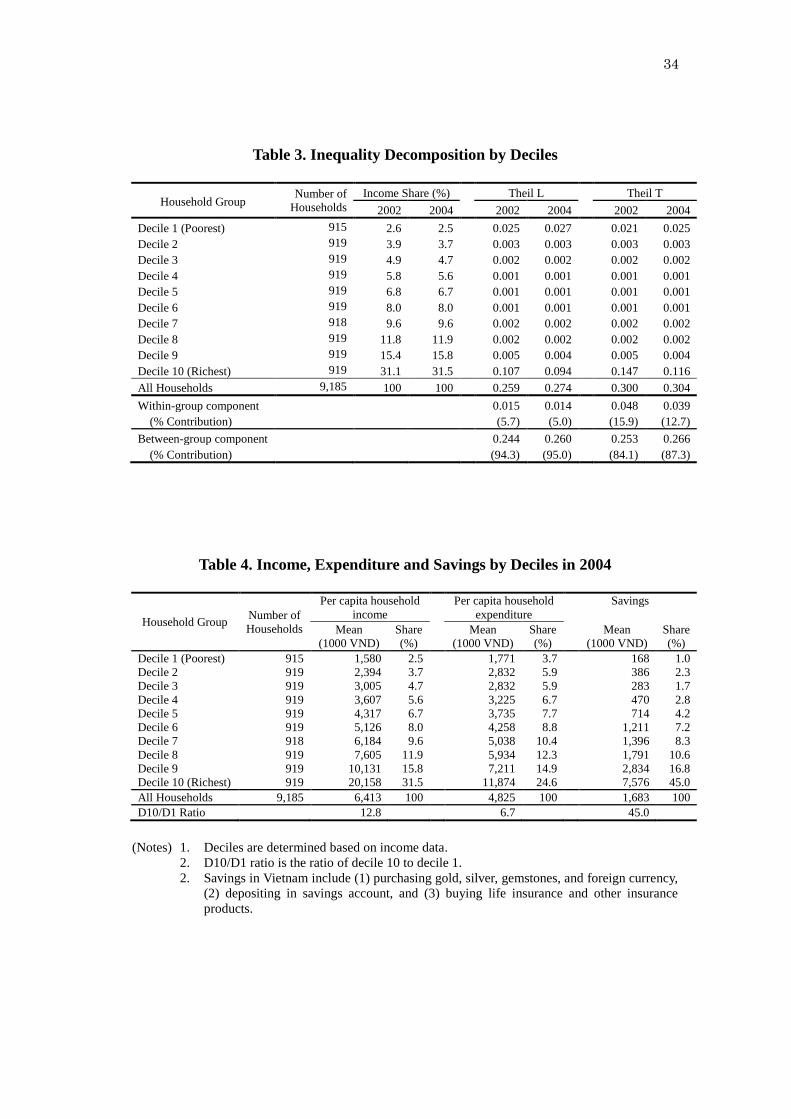
34
Table 3. Inequality Decomposition by Deciles
Household Group Number of
Households
Income Share (%) Theil L Theil T
2002 2004 2002 2004 2002 2004
Decile 1 (Poorest) 915 2.6 2.5 0.025 0.027 0.021 0.025
Decile 2 919 3.9 3.7 0.003 0.003 0.003 0.003
Decile 3 919 4.9 4.7 0.002 0.002 0.002 0.002
Decile 4 919 5.8 5.6 0.001 0.001 0.001 0.001
Decile 5 919 6.8 6.7 0.001 0.001 0.001 0.001
Decile 6 919 8.0 8.0 0.001 0.001 0.001 0.001
Decile 7 918 9.6 9.6 0.002 0.002 0.002 0.002
Decile 8 919 11.8 11.9 0.002 0.002 0.002 0.002
Decile 9 919 15.4 15.8 0.005 0.004 0.005 0.004
Decile 10 (Richest) 919 31.1 31.5 0.107 0.094 0.147 0.116
All Households 9,185 100 100 0.259 0.274 0.300 0.304
Within-group component 0.015 0.014 0.048 0.039
(% Contribution) (5.7) (5.0) (15.9) (12.7)
Between-group component 0.244 0.260 0.253 0.266
(% Contribution) (94.3) (95.0) (84.1) (87.3)
Table 4. Income, Expenditure and Savings by Deciles in 2004
Household Group Number of
Households
Per capita household
income
Per capita household
expenditure
Savings
Mean
(1000 VND)
Share
(%)
Mean
(1000 VND)
Share
(%)
Mean
(1000 VND)
Share
(%)
Decile 1 (Poorest) 915 1,580 2.5 1,771 3.7 168 1.0
Decile 2 919 2,394 3.7 2,832 5.9 386 2.3
Decile 3 919 3,005 4.7 2,832 5.9 283 1.7
Decile 4 919 3,607 5.6 3,225 6.7 470 2.8
Decile 5 919 4,317 6.7 3,735 7.7 714 4.2
Decile 6 919 5,126 8.0 4,258 8.8 1,211 7.2
Decile 7 918 6,184 9.6 5,038 10.4 1,396 8.3
Decile 8 919 7,605 11.9 5,934 12.3 1,791 10.6
Decile 9 919 10,131 15.8 7,211 14.9 2,834 16.8
Decile 10 (Richest) 919 20,158 31.5 11,874 24.6 7,576 45.0
All Households 9,185 6,413 100 4,825 100 1,683 100
D10/D1 Ratio 12.8 6.7 45.0
(Notes) 1. Deciles are determined based on income data.
2. D10/D1 ratio is the ratio of decile 10 to decile 1.
2. Savings in Vietnam include (1) purchasing gold, silver, gemstones, and foreign currency,
(2) depositing in savings account, and (3) buying life insurance and other insurance
products.
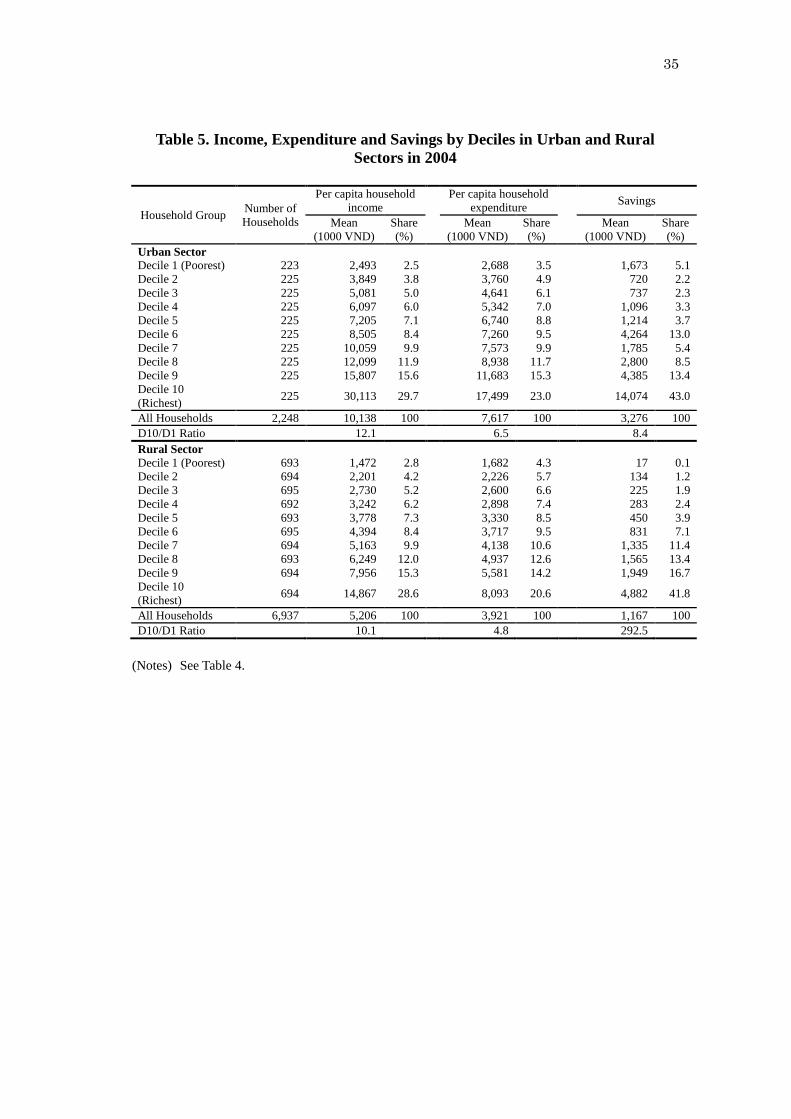
35
Table 5. Income, Expenditure and Savings by Deciles in Urban and Rural
Sectors in 2004
Household Group Number of
Households
Per capita household
income
Per capita household
expenditure Savings
Mean
(1000 VND)
Share
(%)
Mean
(1000 VND)
Share
(%)
Mean
(1000 VND)
Share
(%)
Urban Sector
Decile 1 (Poorest) 223 2,493 2.5 2,688 3.5 1,673 5.1
Decile 2 225 3,849 3.8 3,760 4.9 720 2.2
Decile 3 225 5,081 5.0 4,641 6.1 737 2.3
Decile 4 225 6,097 6.0 5,342 7.0 1,096 3.3
Decile 5 225 7,205 7.1 6,740 8.8 1,214 3.7
Decile 6 225 8,505 8.4 7,260 9.5 4,264 13.0
Decile 7 225 10,059 9.9 7,573 9.9 1,785 5.4
Decile 8 225 12,099 11.9 8,938 11.7 2,800 8.5
Decile 9 225 15,807 15.6 11,683 15.3 4,385 13.4
Decile 10
(Richest) 225 30,113 29.7 17,499 23.0 14,074 43.0
All Households 2,248 10,138 100 7,617 100 3,276 100
D10/D1 Ratio 12.1 6.5 8.4
Rural Sector
Decile 1 (Poorest) 693 1,472 2.8 1,682 4.3 17 0.1
Decile 2 694 2,201 4.2 2,226 5.7 134 1.2
Decile 3 695 2,730 5.2 2,600 6.6 225 1.9
Decile 4 692 3,242 6.2 2,898 7.4 283 2.4
Decile 5 693 3,778 7.3 3,330 8.5 450 3.9
Decile 6 695 4,394 8.4 3,717 9.5 831 7.1
Decile 7 694 5,163 9.9 4,138 10.6 1,335 11.4
Decile 8 693 6,249 12.0 4,937 12.6 1,565 13.4
Decile 9 694 7,956 15.3 5,581 14.2 1,949 16.7
Decile 10
(Richest) 694 14,867 28.6 8,093 20.6 4,882 41.8
All Households 6,937 5,206 100 3,921 100 1,167 100
D10/D1 Ratio 10.1 4.8 292.5
(Notes) See Table 4.
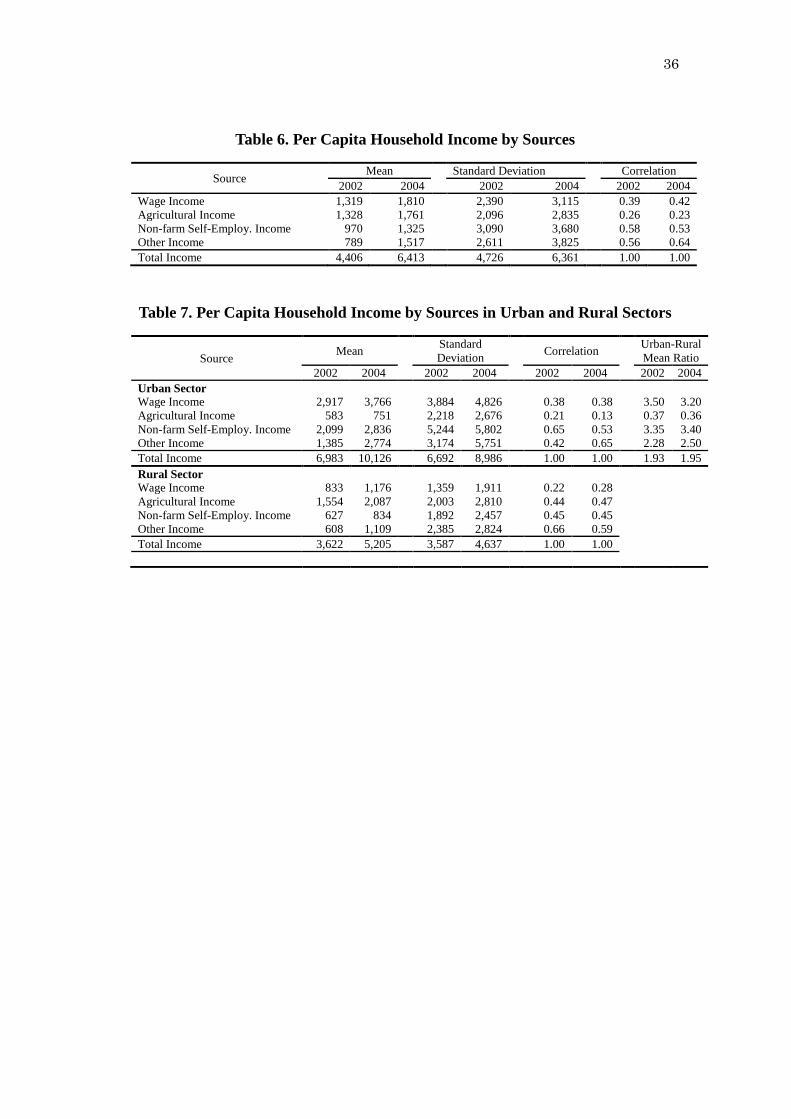
36
Table 6. Per Capita Household Income by Sources
Source Mean Standard Deviation Correlation
2002 2004 2002 2004 2002 2004
Wage Income 1,319 1,810 2,390 3,115 0.39 0.42
Agricultural Income 1,328 1,761 2,096 2,835 0.26 0.23
Non-farm Self-Employ. Income 970 1,325 3,090 3,680 0.58 0.53
Other Income 789 1,517 2,611 3,825 0.56 0.64
Total Income 4,406 6,413 4,726 6,361 1.00 1.00
Table 7. Per Capita Household Income by Sources in Urban and Rural Sectors
Source Mean
Standard
Deviation Correlation
Urban-Rural
Mean Ratio
2002 2004 2002 2004 2002 2004 2002 2004
Urban Sector
Wage Income 2,917 3,766 3,884 4,826 0.38 0.38 3.50 3.20
Agricultural Income 583 751 2,218 2,676 0.21 0.13 0.37 0.36
Non-farm Self-Employ. Income 2,099 2,836 5,244 5,802 0.65 0.53 3.35 3.40
Other Income 1,385 2,774 3,174 5,751 0.42 0.65 2.28 2.50
Total Income 6,983 10,126 6,692 8,986 1.00 1.00 1.93 1.95
Rural Sector
Wage Income 833 1,176 1,359 1,911 0.22 0.28
Agricultural Income 1,554 2,087 2,003 2,810 0.44 0.47
Non-farm Self-Employ. Income 627 834 1,892 2,457 0.45 0.45
Other Income 608 1,109 2,385 2,824 0.66 0.59
Total Income 3,622 5,205 3,587 4,637 1.00 1.00
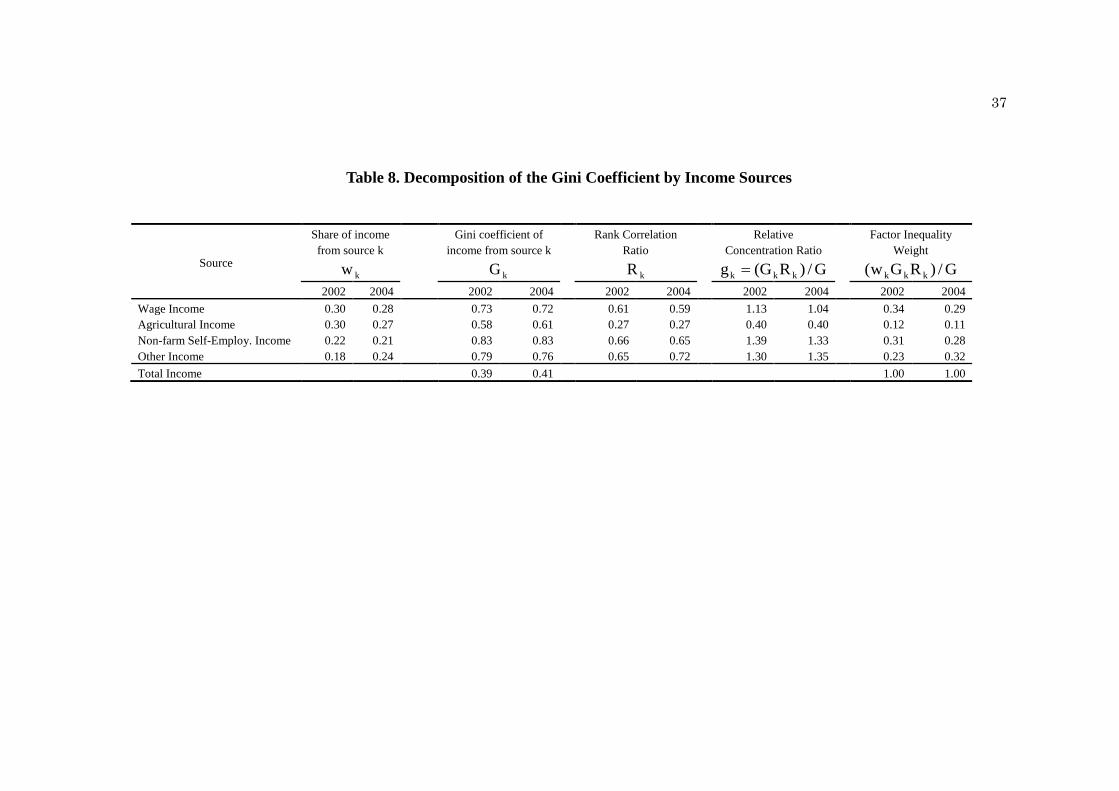
37
Table 8. Decomposition of the Gini Coefficient by Income Sources
Source
Share of income
from source k
Gini coefficient of
income from source k
Rank Correlation
Ratio
Relative
Concentration Ratio
Factor Inequality
Weight
kw
kG
kR
G/)RG(g kkk G/)RGw( kkk
2002 2004 2002 2004 2002 2004 2002 2004 2002 2004
Wage Income 0.30 0.28 0.73 0.72 0.61 0.59 1.13 1.04 0.34 0.29
Agricultural Income 0.30 0.27 0.58 0.61 0.27 0.27 0.40 0.40 0.12 0.11
Non-farm Self-Employ. Income 0.22 0.21 0.83 0.83 0.66 0.65 1.39 1.33 0.31 0.28
Other Income 0.18 0.24 0.79 0.76 0.65 0.72 1.30 1.35 0.23 0.32
Total Income 0.39 0.41 1.00 1.00
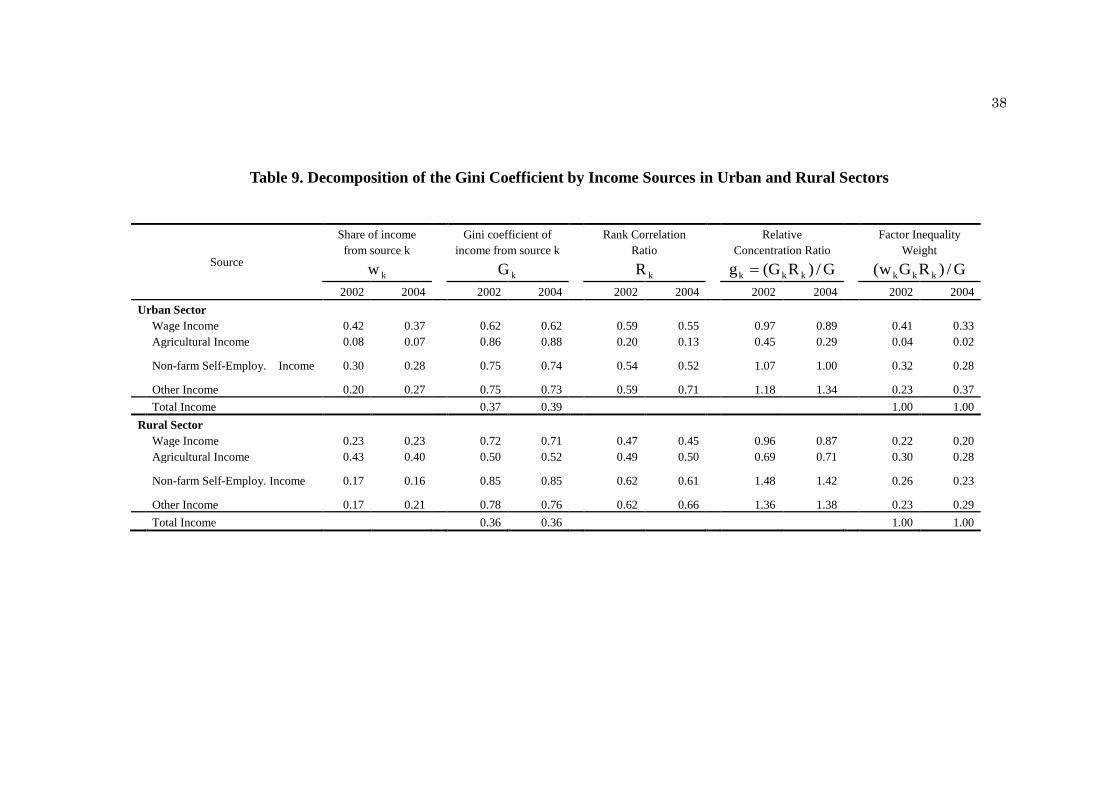
38
Table 9. Decomposition of the Gini Coefficient by Income Sources in Urban and Rural Sectors
Source
Share of income
from source k
Gini coefficient of
income from source k
Rank Correlation
Ratio
Relative
Concentration Ratio
Factor Inequality
Weight
kw
kG
kR
G/)RG(g kkk G/)RGw( kkk
2002 2004 2002 2004 2002 2004 2002 2004 2002 2004
Urban Sector
Wage Income 0.42 0.37 0.62 0.62 0.59 0.55 0.97 0.89 0.41 0.33
Agricultural Income 0.08 0.07 0.86 0.88 0.20 0.13 0.45 0.29 0.04 0.02
Non-farm Self-Employ. Income 0.30 0.28 0.75 0.74 0.54 0.52 1.07 1.00 0.32 0.28
Other Income 0.20 0.27 0.75 0.73 0.59 0.71 1.18 1.34 0.23 0.37
Total Income 0.37 0.39 1.00 1.00
Rural Sector
Wage Income 0.23 0.23 0.72 0.71 0.47 0.45 0.96 0.87 0.22 0.20
Agricultural Income 0.43 0.40 0.50 0.52 0.49 0.50 0.69 0.71 0.30 0.28
Non-farm Self-Employ. Income 0.17 0.16 0.85 0.85 0.62 0.61 1.48 1.42 0.26 0.23
Other Income 0.17 0.21 0.78 0.76 0.62 0.66 1.36 1.38 0.23 0.29
Total Income 0.36 0.36 1.00 1.00
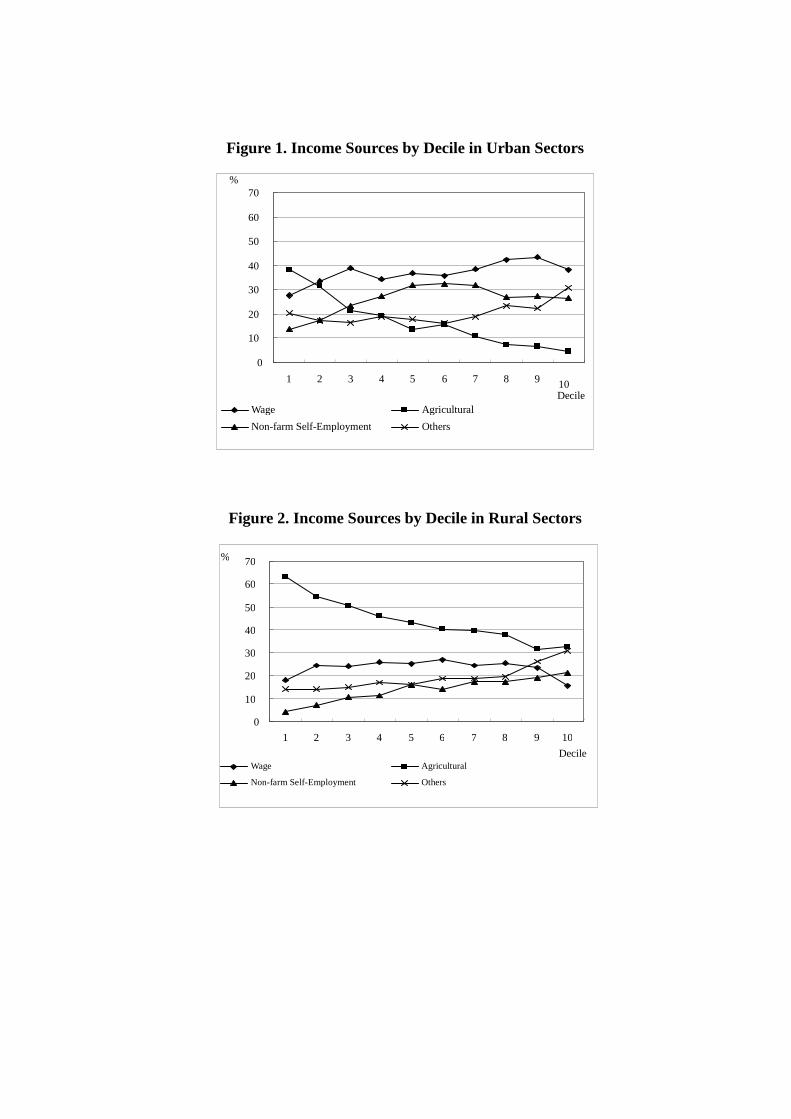
Figure 1. Income Sources by Decile in Urban Sectors
Figure 2. Income Sources by Decile in Rural Sectors
0
10
20
30
40
50
60
70
1 2 3 4 5 6 7 8 9
10 Decile
%
Wage Agricultural
Non-farm Self-Employment Others
0
10
20
30
40
50
60
70
1 2 3 4 5 6 7 8 9 10 Decile
%
Wage Agricultural Non-farm Self-Employment Others