Embed Size (px)
Citation preview
Highway Safety Investigation Manual for the
Oregon Department of Transportation
Prepared by Karen K. Dixon, Ph.D., P.E.
Associate Professor Oregon State University
Department of Civil, Construction, and Environmental Engineering 220 Owen Hall
Corvallis, Oregon 97331
and
Christopher M. Monsere, Ph.D., P.E. Assistant Professor
Portland State University Department of Civil and Environmental Engineering
Portland, Oregon 97207‐0751
for
Oregon Department of Transportation Traffic‐Roadway Section
355 Capitol NE, Salem, Oregon 97301
January 2011 revised 1.24.11

Page Intentionally Blank
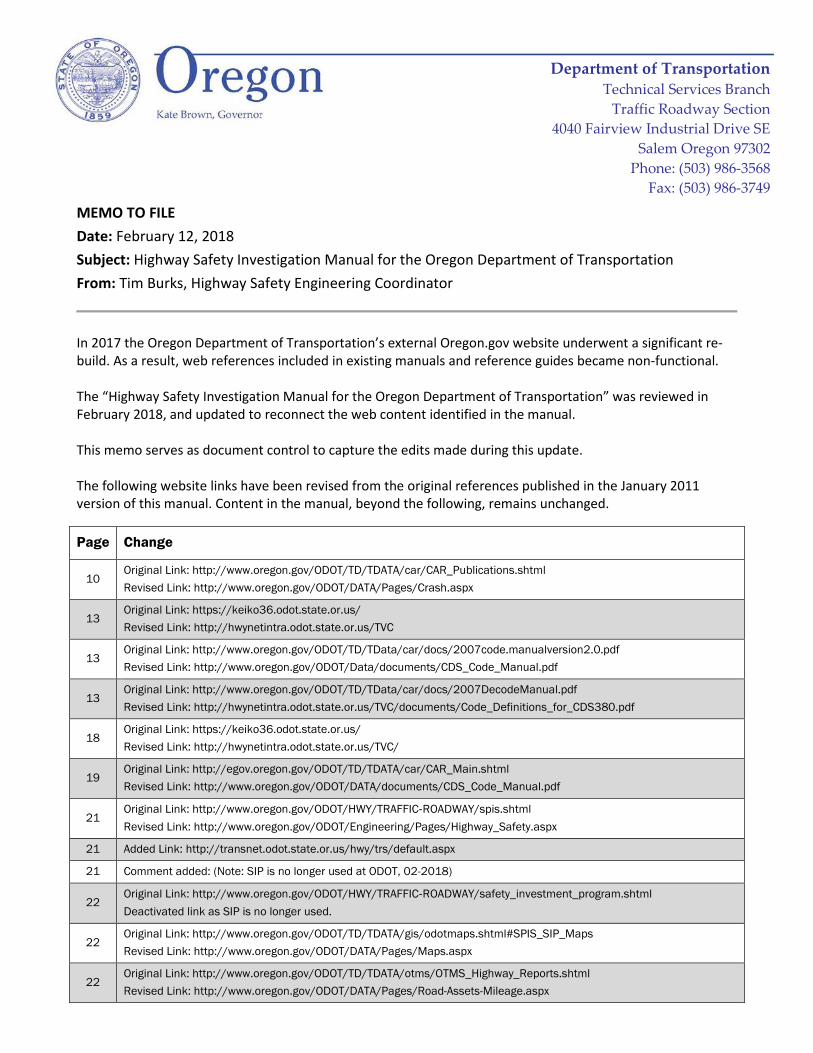
MEMO TO FILE Date: February 12, 2018 Subject: Highway Safety Investigation Manual for the Oregon Department of Transportation From: Tim Burks, Highway Safety Engineering Coordinator
In 2017 the Oregon Department of Transportation’s external Oregon.gov website underwent a significant re-build. As a result, web references included in existing manuals and reference guides became non-functional. The “Highway Safety Investigation Manual for the Oregon Department of Transportation” was reviewed in February 2018, and updated to reconnect the web content identified in the manual. This memo serves as document control to capture the edits made during this update. The following website links have been revised from the original references published in the January 2011 version of this manual. Content in the manual, beyond the following, remains unchanged.
Page Change
10 Original Link: http://www.oregon.gov/ODOT/TD/TDATA/car/CAR_Publications.shtml Revised Link: http://www.oregon.gov/ODOT/DATA/Pages/Crash.aspx
13 Original Link: https://keiko36.odot.state.or.us/ Revised Link: http://hwynetintra.odot.state.or.us/TVC
13 Original Link: http://www.oregon.gov/ODOT/TD/TData/car/docs/2007code.manualversion2.0.pdf Revised Link: http://www.oregon.gov/ODOT/Data/documents/CDS_Code_Manual.pdf
13 Original Link: http://www.oregon.gov/ODOT/TD/TData/car/docs/2007DecodeManual.pdf Revised Link: http://hwynetintra.odot.state.or.us/TVC/documents/Code_Definitions_for_CDS380.pdf
18 Original Link: https://keiko36.odot.state.or.us/ Revised Link: http://hwynetintra.odot.state.or.us/TVC/
19 Original Link: http://egov.oregon.gov/ODOT/TD/TDATA/car/CAR_Main.shtml Revised Link: http://www.oregon.gov/ODOT/DATA/documents/CDS_Code_Manual.pdf
21 Original Link: http://www.oregon.gov/ODOT/HWY/TRAFFIC‐ROADWAY/spis.shtml Revised Link: http://www.oregon.gov/ODOT/Engineering/Pages/Highway_Safety.aspx
21 Added Link: http://transnet.odot.state.or.us/hwy/trs/default.aspx
21 Comment added: (Note: SIP is no longer used at ODOT, 02-2018)
22 Original Link: http://www.oregon.gov/ODOT/HWY/TRAFFIC‐ROADWAY/safety_investment_program.shtml Deactivated link as SIP is no longer used.
22 Original Link: http://www.oregon.gov/ODOT/TD/TDATA/gis/odotmaps.shtml#SPIS_SIP_Maps Revised Link: http://www.oregon.gov/ODOT/DATA/Pages/Maps.aspx
22 Original Link: http://www.oregon.gov/ODOT/TD/TDATA/otms/OTMS_Highway_Reports.shtml Revised Link: http://www.oregon.gov/ODOT/DATA/Pages/Road-Assets-Mileage.aspx
Department of Transportation Technical Services Branch
Traffic Roadway Section 4040 Fairview Industrial Drive SE
Salem Oregon 97302 Phone: (503) 986-3568
Fax: (503) 986-3749
2018 Update to the Highway Safety Investigation Manual Page 2 of 2
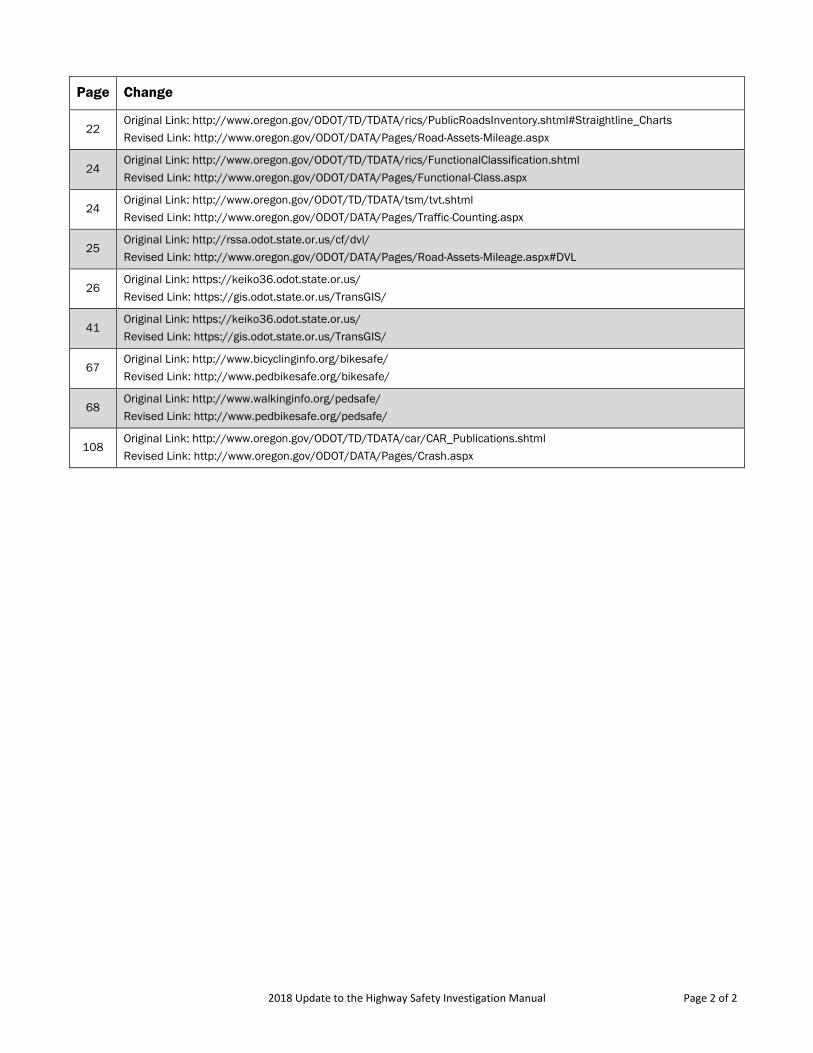
Page Change
22 Original Link: http://www.oregon.gov/ODOT/TD/TDATA/rics/PublicRoadsInventory.shtml#Straightline_Charts Revised Link: http://www.oregon.gov/ODOT/DATA/Pages/Road-Assets-Mileage.aspx
24 Original Link: http://www.oregon.gov/ODOT/TD/TDATA/rics/FunctionalClassification.shtml Revised Link: http://www.oregon.gov/ODOT/DATA/Pages/Functional-Class.aspx
24 Original Link: http://www.oregon.gov/ODOT/TD/TDATA/tsm/tvt.shtml Revised Link: http://www.oregon.gov/ODOT/DATA/Pages/Traffic-Counting.aspx
25 Original Link: http://rssa.odot.state.or.us/cf/dvl/ Revised Link: http://www.oregon.gov/ODOT/DATA/Pages/Road-Assets-Mileage.aspx#DVL
26 Original Link: https://keiko36.odot.state.or.us/ Revised Link: https://gis.odot.state.or.us/TransGIS/
41 Original Link: https://keiko36.odot.state.or.us/ Revised Link: https://gis.odot.state.or.us/TransGIS/
67 Original Link: http://www.bicyclinginfo.org/bikesafe/ Revised Link: http://www.pedbikesafe.org/bikesafe/
68 Original Link: http://www.walkinginfo.org/pedsafe/ Revised Link: http://www.pedbikesafe.org/pedsafe/
108 Original Link: http://www.oregon.gov/ODOT/TD/TDATA/car/CAR_Publications.shtml Revised Link: http://www.oregon.gov/ODOT/DATA/Pages/Crash.aspx
Highway Safety Investigation Manual Oregon Department of Transportation
January 24, 2011 i
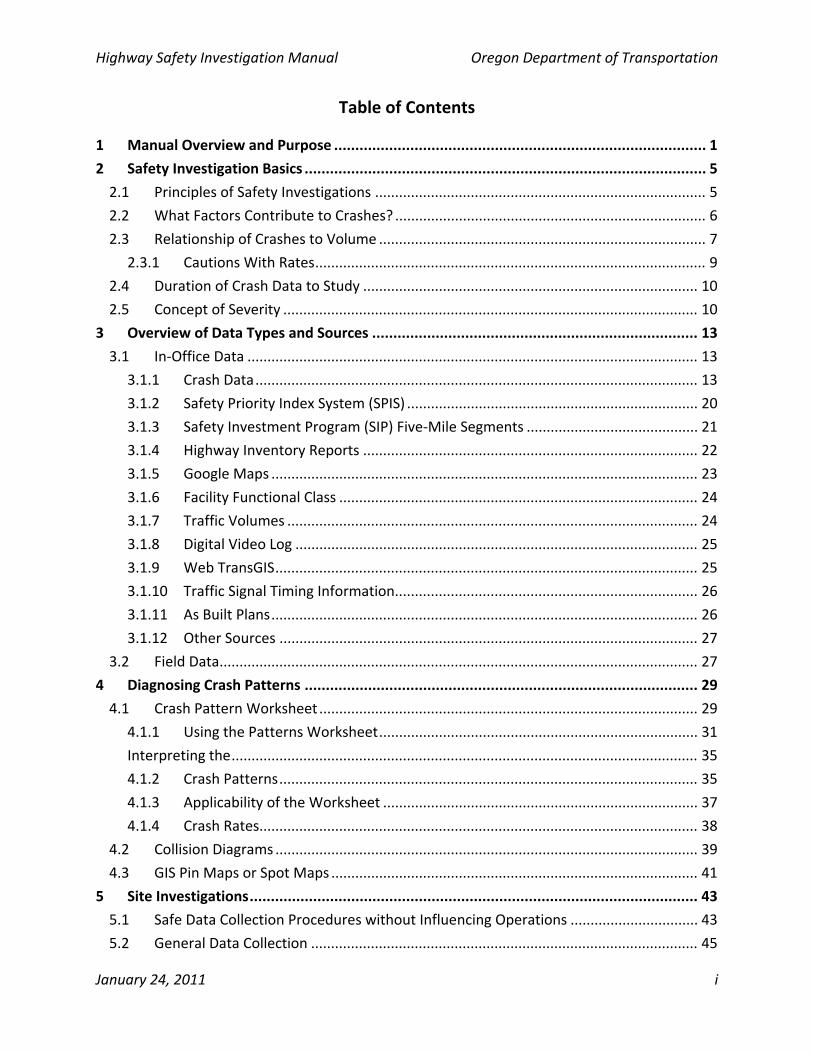
Table of Contents
1 Manual Overview and Purpose ........................................................................................ 1
2 Safety Investigation Basics ............................................................................................... 5
2.1 Principles of Safety Investigations ................................................................................... 5
2.2 What Factors Contribute to Crashes? .............................................................................. 6
2.3 Relationship of Crashes to Volume .................................................................................. 7
2.3.1 Cautions With Rates.................................................................................................. 9
2.4 Duration of Crash Data to Study .................................................................................... 10
2.5 Concept of Severity ........................................................................................................ 10
3 Overview of Data Types and Sources ............................................................................. 13
3.1 In‐Office Data ................................................................................................................. 13
3.1.1 Crash Data............................................................................................................... 13
3.1.2 Safety Priority Index System (SPIS) ......................................................................... 20
3.1.3 Safety Investment Program (SIP) Five‐Mile Segments ........................................... 21
3.1.4 Highway Inventory Reports .................................................................................... 22
3.1.5 Google Maps ........................................................................................................... 23
3.1.6 Facility Functional Class .......................................................................................... 24
3.1.7 Traffic Volumes ....................................................................................................... 24
3.1.8 Digital Video Log ..................................................................................................... 25
3.1.9 Web TransGIS.......................................................................................................... 25
3.1.10 Traffic Signal Timing Information............................................................................ 26
3.1.11 As Built Plans........................................................................................................... 26
3.1.12 Other Sources ......................................................................................................... 27
3.2 Field Data........................................................................................................................ 27
4 Diagnosing Crash Patterns ............................................................................................. 29
4.1 Crash Pattern Worksheet............................................................................................... 29
4.1.1 Using the Patterns Worksheet................................................................................ 31
Interpreting the..................................................................................................................... 35
4.1.2 Crash Patterns......................................................................................................... 35
4.1.3 Applicability of the Worksheet ............................................................................... 37
4.1.4 Crash Rates.............................................................................................................. 38
4.2 Collision Diagrams .......................................................................................................... 39
4.3 GIS Pin Maps or Spot Maps ............................................................................................ 41
5 Site Investigations.......................................................................................................... 43
5.1 Safe Data Collection Procedures without Influencing Operations ................................ 43
5.2 General Data Collection ................................................................................................. 45
Highway Safety Investigation Manual Oregon Department of Transportation
January 24, 2011 ii
5.3 Identifying Unique Site Features That Influence Appropriate Study Types................... 50
5.4 Identifying Appropriate Field Studies Specific to Crash Patterns .................................. 51
5.5 Performing Data Collection for Specific Field Studies.................................................... 52
6 Countermeasure Selection and Recommend Improvements Analysis ............................ 63
6.1 Principles of Countermeasure Selection........................................................................ 65
6.2 Identify Candidate Countermeasures ............................................................................ 66
6.2.1 Expected Effectiveness of Countermeasures ......................................................... 68
6.2.2 Selecting Appropriate Context................................................................................ 69
6.2.3 What To Do If the Countermeasure Does Not Have A CRF Value .......................... 70
6.3 Recommend Improvements........................................................................................... 70
6.3.1 Using The Benefit‐Cost Worksheet......................................................................... 71
6.3.2 Prioritization of Countermeasures and Projects .................................................... 73
6.3.3 Stating the Problem and Writing the Recommendation........................................ 75
7 Documentation and Implementation ............................................................................. 77
7.1 Documentation .............................................................................................................. 77
7.1.1 Investigations File ................................................................................................... 77
7.1.2 Highway Safety Investigations Report (HSIR) ......................................................... 77
7.2 Implementation.............................................................................................................. 79
8 References ..................................................................................................................... 81
9 Appendix A – Intersection Sight Distance Evaluation ..................................................... 83
9.1 Instructions for Evaluating Intersection Sight Distance................................................. 83
9.2 Intersection Sight Distance Example Problems ............................................................. 86
9.3 Intersection Sight Distance Worksheet........................................................................ 102
10 Appendix B – Worksheets ............................................................................................ 105
11 Appendix C – Case Studies ........................................................................................... 113
Highway Safety Investigation Manual Oregon Department of Transportation
January 24, 2011 iii
List of Tables
Table 1. General Site Investigation Items ..................................................................................... 46
Table 2. Common Field Studies for Unique Site or Operational Conditions ................................ 50
Table 3. Investigation and Diagnosis for Intersection Crashes..................................................... 53
Table 4. Investigation and Diagnosis for Mid‐Block Crashes ........................................................ 58
Table 5. Investigation and Diagnosis for Fixed‐Object and Run‐off‐Road Crashes ...................... 60
Table 6. Investigation and Diagnosis for Crashes Linked to Environmental Conditions .............. 61
Highway Safety Investigation Manual Oregon Department of Transportation
January 24, 2011 iv
List of Figures
Figure 1. Overview of Analysis Approach ....................................................................................... 3
Figure 2. Crash Causes .................................................................................................................... 7
Figure 3. Flowchart of Procedure to Collect Data ........................................................................ 14
Figure 4. Crash Database Schematic............................................................................................. 17
Figure 5. Sample SPIS Report ........................................................................................................ 21
Figure 6. Sample Interchange DIagram ........................................................................................ 23
Figure 7. TransGIS ......................................................................................................................... 26
Figure 8. Example Condition Diagram .......................................................................................... 28
Figure 9. Flowchart of Procedure to Analyze Crash Data ............................................................. 30
Figure 10. Crash Pattern WORKSHEET.......................................................................................... 34
Figure 11. Sample Collision Diagram ............................................................................................ 40
Figure 12. Sample GIS Map........................................................................................................... 42
Figure 13. Flowchart of Procedure for Site Investigations ........................................................... 44
Figure 14. Site Investigation form................................................................................................. 47
Figure 15. Roadway inventory checklist ....................................................................................... 48
Figure 16. Equipment checklist..................................................................................................... 49
Figure 17. Flowchart of Procedure to Identify Candidate Countermeasures .............................. 64
Figure 18. Flowchart of Procedure to Recommend Improvements............................................. 65
Figure 19. Screen Capture of FHWA CMF CLEARING HOUSE ....................................................... 67
Figure 20. Benefit/Cost Worksheet [Existing ODOT Worksheet] ................................................. 72
Figure 21. HSIR Screen Capture .................................................................................................... 80
Highway Safety Investigation Manual Oregon Department of Transportation
July 12, 2012 1
1 MANUAL OVERVIEW AND PURPOSE
Across the state, region, and nation highway safety investigators have developed a wide variety
of tools and techniques for highway safety investigation procedures. Analysis techniques can
range from systematic evaluation approaches such as the Oregon Department of
Transportation’s (ODOT’s) Safety Priority Index System (SPIS) down to specific localized safety
assessment strategies. It is important to develop consistent methods for safety evaluations
across Oregon to ensure that safety investigations are conducted in a similar manner. It is also
important to develop a screening process for proper highway safety investigations and
document the procedures used for this assessment.
The objective of this manual is to provide a resource to assist ODOT traffic investigators with
highway safety project screening and evaluations. Though the content of this manual is
targeted for use within ODOT, the procedures outlined could be easily adapted by local
jurisdictions for similar highway safety assessments. This manual, therefore, includes checklists
and analysis procedures suitable for a variety of field and office safety investigations and
assessments. This manual also includes information about the ODOT highway safety programs
and tools, linkage to current standards and resources where design and operations methods
are stipulated, a comprehensive procedure for safety investigation at both intersection and
highway segments, and countermeasure definition and guidance.
This manual assumes that a particular location (a segment of roadway or an intersection) has
already been identified for investigation by any of the following:
1) An investigation of a particular location (a segment of roadway or an intersection)
identified by the SPIS program or as part of a proposed project;
2) An investigation motivated by a citizen complaint or inquiry; or
3) An investigation initiated due to a fatal crash or crashes.
This manual is primarily directed at the first type of investigations (item 1).
Highway Safety Investigation Manual Oregon Department of Transportation
July 12, 2012 2
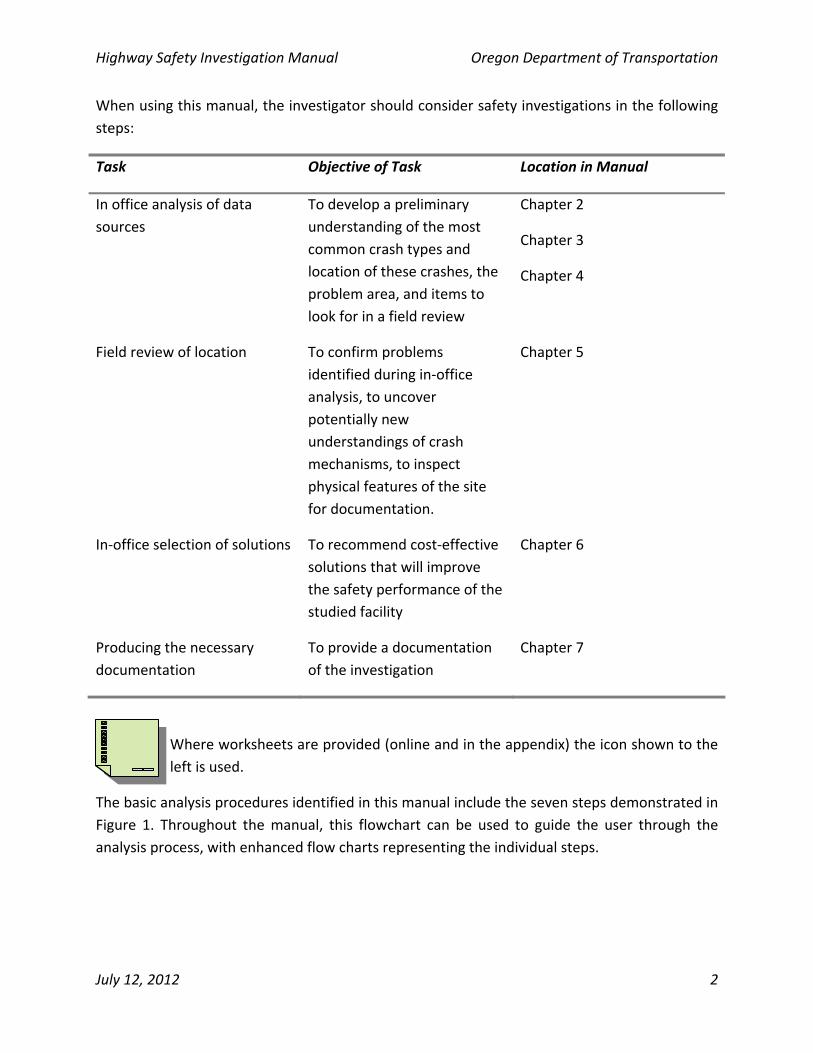
When using this manual, the investigator should consider safety investigations in the following
steps:
Task Objective of Task Location in Manual
In office analysis of data
sources
To develop a preliminary
understanding of the most
common crash types and
location of these crashes, the
problem area, and items to
look for in a field review
Chapter 2
Chapter 3
Chapter 4
Field review of location To confirm problems
identified during in‐office
analysis, to uncover
potentially new
understandings of crash
mechanisms, to inspect
physical features of the site
for documentation.
Chapter 5
In‐office selection of solutions To recommend cost‐effective
solutions that will improve
the safety performance of the
studied facility
Chapter 6
Producing the necessary
documentation
To provide a documentation
of the investigation
Chapter 7
Where worksheets are provided (online and in the appendix) the icon shown to the
left is used.
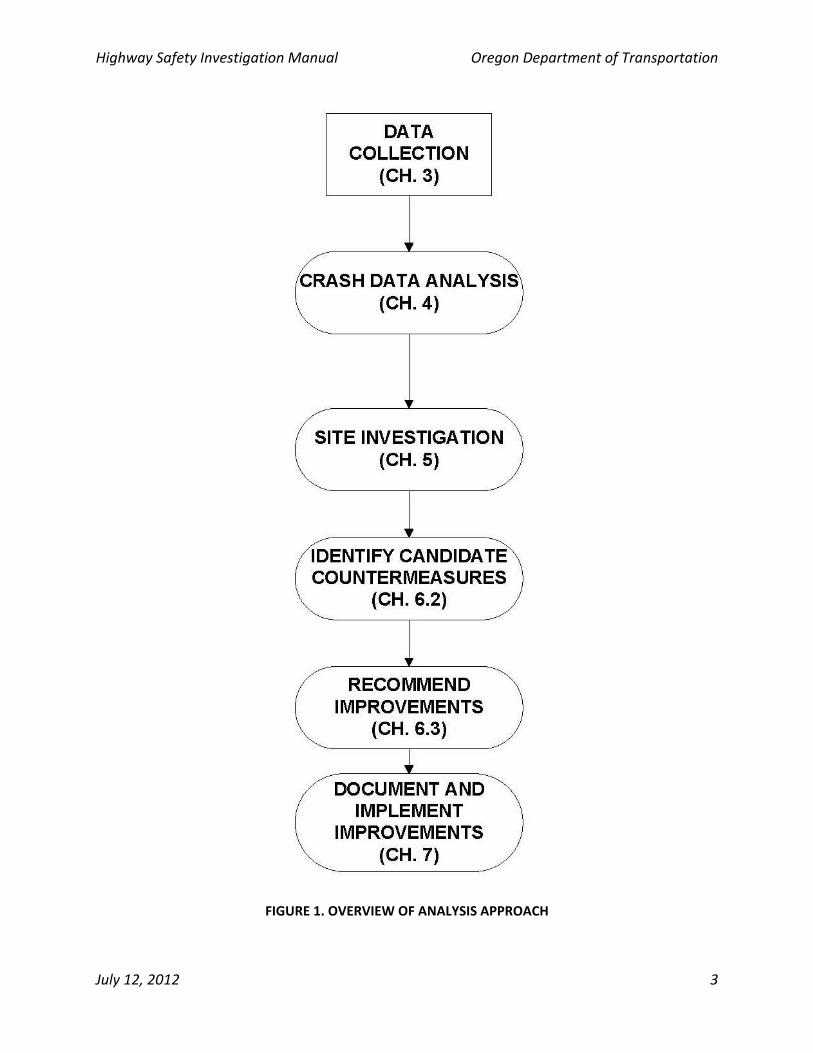
The basic analysis procedures identified in this manual include the seven steps demonstrated in
Figure 1. Throughout the manual, this flowchart can be used to guide the user through the
analysis process, with enhanced flow charts representing the individual steps.
Highway Safety Investigation Manual Oregon Department of Transportation
July 12, 2012 3
FIGURE 1. OVERVIEW OF ANALYSIS APPROACH

Highway Safety Investigation Manual Oregon Department of Transportation
July 12, 2012 4
Page Intentionally Blank
Highway Safety Investigation Manual Oregon Department of Transportation
July 12, 2012 5
2 SAFETY INVESTIGATION BASICS
The safety investigations process is a combination of scientific evaluation, the investigator’s
knowledge and experience, and good judgment. The investigator is essentially piecing together
many clues as to why crashes occurred without having the benefit of any actual first‐hand
knowledge. The investigator must glean clues from a detailed analysis of crash data and a
thorough investigation of field data. These clues can then be evaluated by the investigator to
identify preventable crashes. For these “target” crashes, the investigator can identify feasible
and effective countermeasures, make recommendations, and document the entire process.
This chapter provides a brief overview about basic philosophy and information needed for crash
assessments.
2.1 PRINCIPLES OF SAFETY INVESTIGATIONS
There are two principles that are useful to keep in mind when attempting to diagnose a crash
problem. First, crashes should be considered rare events. Even though there are about 41,000
reported crashes in Oregon per year, the vast majority of interactions between vehicles, users,
and the infrastructure do not result in crashes. For a crash to occur, a number of events have to
occur simultaneously. For example, if a rear‐end crash occurs at a signalized intersection, one
or more of the following events must have transpired: two vehicles approach traffic signal as
the indication turns red; driver in following vehicle following too closely or is inattentive;
braking (if any) is not sufficient to stop the trailing vehicle in time due to inattention or a slow
reaction, the driver in the lead vehicle then stops suddenly. If any one of these sequential
events leading up to a crash was altered in some way, the crash may have been avoided.
Clearly, a crash can happen even with a “perfectly” engineered, signed, and enforced facility.
If we take a longer view (years), some number of crashes can be expected. This long view can
be thought of the “expected crashes” or the “average over the long run.” These expected
crashes vary for different environments (a rural interstate or urban minor arterial) because
driver expectations, potential conflicts, traffic volumes, design standards, etc. are different. It
should be pointed out that the “expected crashes” concept does not mean that this number of
crashes is acceptable. This concept only reflects the recent safety performance (which can be
improved).
Second, we assume that most drivers, cyclists, and pedestrians would prefer to avoid a crash
and will do so in most situations; however, we know that errors will occur. While we might
expect some crashes to happen, if crashes exceed what we expect then something is most likely
correctable at our investigated location. Therefore, our investigative efforts are searching for a
Highway Safety Investigation Manual Oregon Department of Transportation
July 12, 2012 6
pattern of crashes that is out the ordinary. As a bonus, if these patterns can be detected, they
are the most reliable guide to the remedial action. How to do this is described in Chapter 4.
Once the pattern is found, the next step in the diagnostic effort is to try to determine what
might be “causing” these crashes to occur. Interpreting the crash pattern data, field
investigation, and other inputs to identify likely contributing causes and countermeasure
selection is discussed in Chapters 5 and 6.
2.2 WHAT FACTORS CONTRIBUTE TO CRASHES?
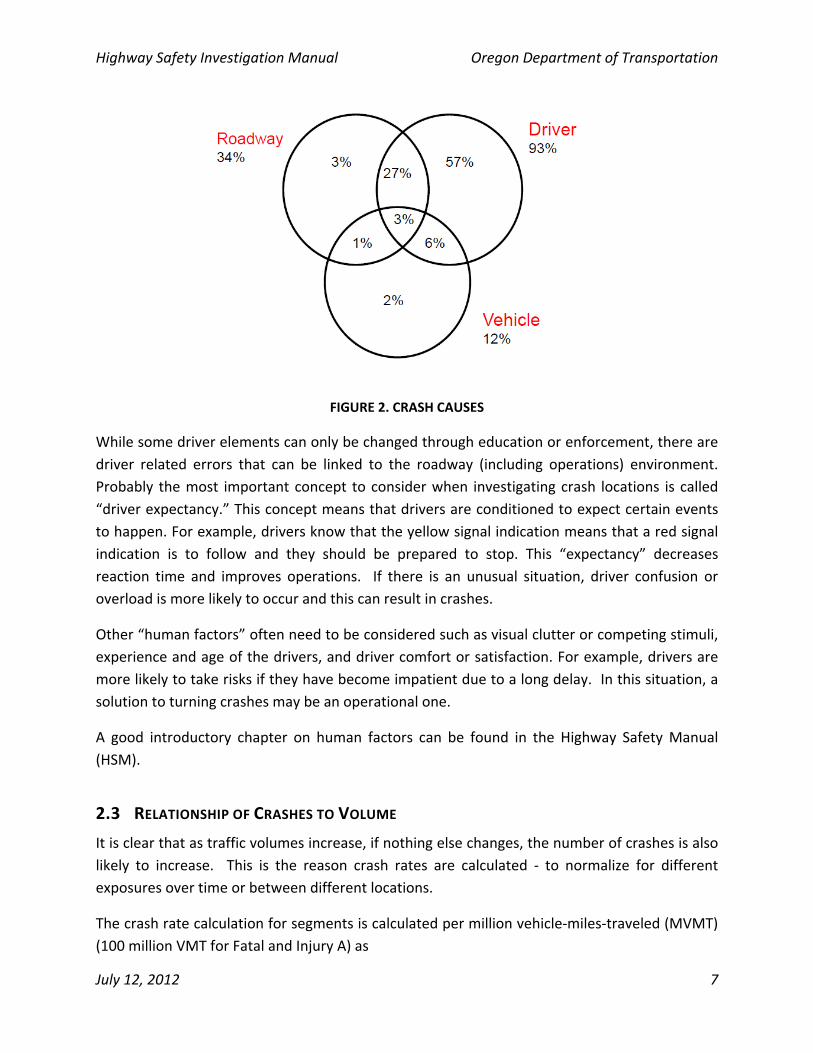
In a landmark study, Treat et al. (1979) performed an in‐depth study of crashes that happened
in Indiana. A team of experts defined the one event leading up to the crash that, had it not
happened, the crash would have been avoided. They assigned that one event to three
categories: driver, roadway, and vehicle. As one might expect, the study found that in almost all
crashes, there is likely a driver‐related component. There is also a strong overlap with the other
elements, particularly the roadway. Roadway defects or vehicle defects are only a small
percentage of the total. The results of their study have been closely replicated by a few other
authors.
This does not imply that driver errors are not preventable. On the contrary, the strong overlap
with the roadway causes means that our investigative efforts should focus on these driver
elements, also called “human factors.” If we recognize that driver abilities, behaviors, attitude,
speed, risk taking (i.e. alcohol use), fatigue, physical abilities (vision, ability to turn head), and
cognitive decisions or reactions are important contributing factors to collisions, we can better
identify engineering solutions that might improve the situation.
Highway Safety Investigation Manual Oregon Department of Transportation
July 12, 2012 7
FIGURE 2. CRASH CAUSES
While some driver elements can only be changed through education or enforcement, there are
driver related errors that can be linked to the roadway (including operations) environment.
Probably the most important concept to consider when investigating crash locations is called
“driver expectancy.” This concept means that drivers are conditioned to expect certain events
to happen. For example, drivers know that the yellow signal indication means that a red signal
indication is to follow and they should be prepared to stop. This “expectancy” decreases
reaction time and improves operations. If there is an unusual situation, driver confusion or
overload is more likely to occur and this can result in crashes.
Other “human factors” often need to be considered such as visual clutter or competing stimuli,
experience and age of the drivers, and driver comfort or satisfaction. For example, drivers are
more likely to take risks if they have become impatient due to a long delay. In this situation, a
solution to turning crashes may be an operational one.
A good introductory chapter on human factors can be found in the Highway Safety Manual
(HSM).
2.3 RELATIONSHIP OF CRASHES TO VOLUME
It is clear that as traffic volumes increase, if nothing else changes, the number of crashes is also
likely to increase. This is the reason crash rates are calculated ‐ to normalize for different
exposures over time or between different locations.
The crash rate calculation for segments is calculated per million vehicle‐miles‐traveled (MVMT)
(100 million VMT for Fatal and Injury A) as
Highway Safety Investigation Manual Oregon Department of Transportation
July 12, 2012 8
LDV
CRate
000,000,1* , where
C = number of crashes in study period
V = volume, in Average Daily Traffic (vehicles per day or vpd) [this value is usually for
both directions of travel]
D = number of days in study period
L = length of segment (miles).
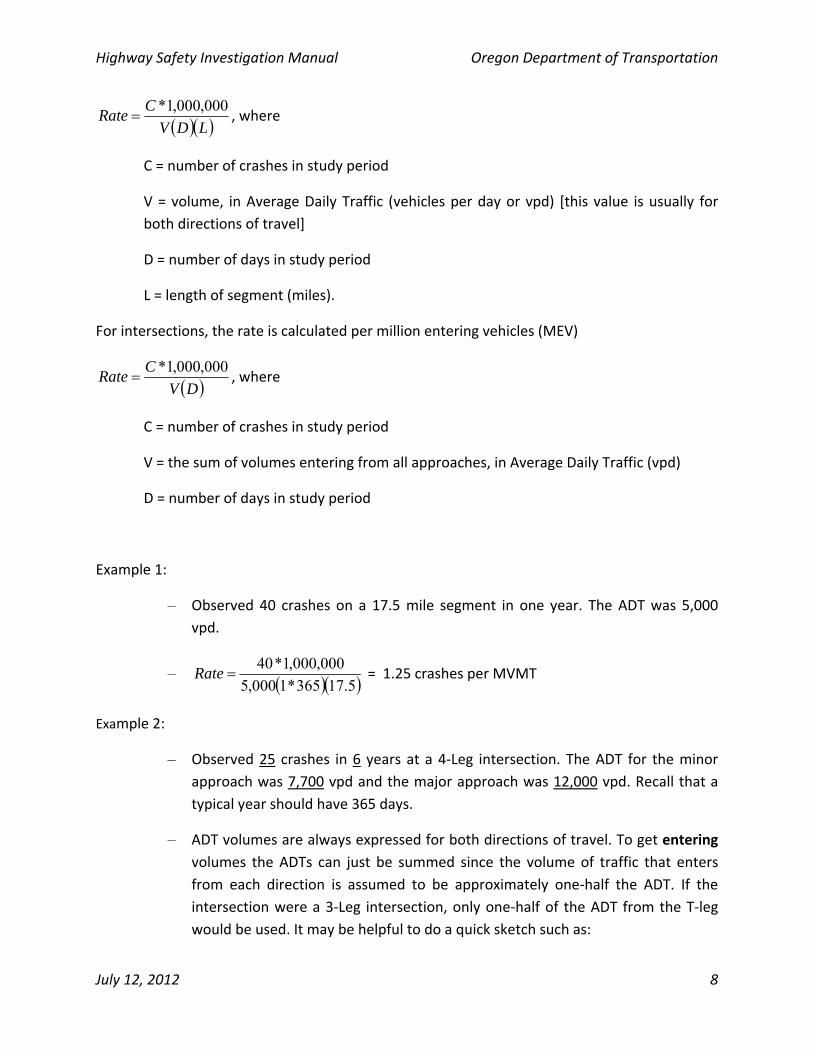
For intersections, the rate is calculated per million entering vehicles (MEV)
DV
CRate
000,000,1* , where
C = number of crashes in study period
V = the sum of volumes entering from all approaches, in Average Daily Traffic (vpd)
D = number of days in study period
Example 1:
– Observed 40 crashes on a 17.5 mile segment in one year. The ADT was 5,000
vpd.
– 5.17365*1000,5
000,000,1*40Rate = 1.25 crashes per MVMT
Example 2:
– Observed 25 crashes in 6 years at a 4‐Leg intersection. The ADT for the minor
approach was 7,700 vpd and the major approach was 12,000 vpd. Recall that a
typical year should have 365 days.
– ADT volumes are always expressed for both directions of travel. To get entering
volumes the ADTs can just be summed since the volume of traffic that enters
from each direction is assumed to be approximately one‐half the ADT. If the
intersection were a 3‐Leg intersection, only one‐half of the ADT from the T‐leg
would be used. It may be helpful to do a quick sketch such as:
Highway Safety Investigation Manual Oregon Department of Transportation
July 12, 2012 9
Major Approach
Minor Approach
– 365*6)700,7000,12(
000,000,1*25
Rate = 0.579 crashes per MEV
Example 3:
– Observed 20 crashes in 6 years at a 3‐Leg intersection. The ADT for the minor
approach was 5,100 vpd and the major approach was 10,500 vpd. Recall that a
typical year should have 365 days.
– ADT volumes are always expressed for both directions of travel. To get entering
volumes the ADTs can just be summed since the volume of traffic that enters
from each directions is approximately one‐half the ADT. Since the intersection is
a 3‐Leg intersection, only one‐half of the ADT from the T‐leg is used in the
exposure.
– 365*6])2/100,5[500,10(
000,000,1*20
Rate = 0.6998 crashes per MEV
(say 0.70 crashes per MEV)
2.3.1 CAUTIONS WITH RATES
Rates can be a useful calculation. One benefit is that they simply control for differences in
volume. They are most appropriate when comparing similar conditions or “apples to apples.”
However, rates are best used when comparing the same functional class, volume range,
intersection type, or other distinguishing features. The use of rates can lead to incorrect
conclusions if comparisons are made across widely different facilities. For example, one would
not compare a rural interstate crash rate to a rural principal arterial rate since they are different
facility types. To obtain average rates for a particular facility type, see the ODOT Crash Analysis
Highway Safety Investigation Manual Oregon Department of Transportation
July 12, 2012 10
and Reporting publication, “Crash Rate Book.” The 2008 Table IV and Table V are included in
Appendix B of this manual.
http://www.oregon.gov/ODOT/DATA/Pages/Crash.aspx
When comparing rates over time, it is important to remember that rates can change by
modifying the number of crashes (numerator) or the volume, duration, or segment length
(denominator). For example, a facility could be made “safer” if volumes increase but crash
counts do not (the rate would be lower). If no actual improvements have been made to the
facility, the road is not any safer in the physical sense, only the risk has changed.
There is some evidence that bicyclists and pedestrians have lower risk with increased bicycle
and pedestrian volumes. This is generally attributed to the “safety in numbers” concept. This
means that motor vehicle operators are more likely to expect these users (and drive
accordingly) if they routinely see more cyclists and pedestrians.
2.4 DURATION OF CRASH DATA TO STUDY
A common question in the investigation process is: How many years of crash data to use? If too
long a period is chosen, there is more likelihood that there will have been changes to site
conditions (volumes, drivers, reporting thresholds, periodic maintenance, etc.). If too short a
period is selected, there is likely not enough data to analyze and the crash patterns may not be
representative of the long term performance of the facility.
A general recommendation is to use 3 years of crash data for analysis. In some situations, 5
years may be appropriate if there is limited crash data to evaluate. The 5 year period may also
be appropriate if there was construction activity present during part of the study period or
other unique site conditions.
2.5 CONCEPT OF SEVERITY
The investigator should consider more than just total crashes in an investigation. There are a
number of good reasons to do this. First, collision patterns may differ across severity levels. By
considering severity separately a significant problem may be uncovered. Second, severe crashes
represent a greater cost to society and more effort and funding should be directed at mitigating
these crashes.
It is suggested to consider crashes in three severity groupings:
Highway Safety Investigation Manual Oregon Department of Transportation
July 12, 2012 11
o Fatal and Injury A crashes are a better representation of high‐energy collisions
than just fatal crashes. The difference in outcomes (between fatal and injury A)
can be a result of minor differences in the crash circumstances (e.g. difference of
inches in the point of collision impact, difference in driver age or experience).
Considering fatal and injury A crashes together increases the likelihood that
unusual severe crashes are detected. In addition, these crashes will almost
certainly have a police presence resulting in a better quality of crash data.
o Injury B and Injury C crashes are representative of lower‐level crashes and have
moderate societal cost.
o Property Damage Only (PDO) crashes are the least reliable in terms of data
quality. They are affected by changes in reporting threshold and are less likely to
have a police report. However, they are useful as an indicator of the total crash
problem. (It is estimated that only 50% of the property damage crashes in
Oregon are reported each year.)
The investigator should also consider that it is possible to decrease the severity of some crashes
while increasing the frequency of less severe crashes. For example installing a median barrier
will increase property damage crashes (vehicles will hit an object that was not there before) but
head‐on crashes will be virtually eliminated. This trade‐off in severity can be analyzed using the
benefit‐cost methodology presented in this manual.

Highway Safety Investigation Manual Oregon Department of Transportation
July 12, 2012 12
Page Intentionally Blank
Highway Safety Investigation Manual Oregon Department of Transportation
July 12, 2012 13
3 OVERVIEW OF DATA TYPES AND SOURCES
For a safety investigation the basic information that will need
to be collected includes:
Route numbers, ODOT internal highway number(s),
highway name, and milepoints;
Functional class of highway;
Rural, urban, or [suburban] character;
Current traffic volumes characteristics;
Crash data; and
Current configuration and design of the roadway
(number of lanes, type of pavement, shoulder types
and width, roadside features, pavement marking,
presence of traffic signal, etc.).
There will be different data elements needed for segments
and intersections. The basic data collection procedure is
identified in Figure 3.
3.1 IN‐OFFICE DATA
3.1.1 CRASH DATA
The crash data collected and complied by Oregon DOT Crash
Analysis and Reporting Unit (CAR) will be a key input in the
safety investigations process. The crash data are maintained for analysis and are easily accessible to the investigator via the Department’s internet. This resource is available by selecting the Crash Data System (CDS) icon at the following web site:
http://hwynetintra.odot.state.or.us/TVC
A full description of this data source is outside the scope of this manual, but there are some
key concepts that are highlighted in the following sections. The Crash Data System Code Manual descriptions are located at the following web sites:
http://www.oregon.gov/ODOT/Data/documents/CDS_Code_Manual.pdf http://hwynetintra.odot.state.or.us/TVC/documents/Code_Definitions_for_CDS380.pdf
Highway Safety Investigation Manual Oregon Department of Transportation
July 12, 2012 14
FIGURE 3. FLOWCHART OF PROCEDURE TO COLLECT DATA
3.1.1.1 CRASH REPORTING PROCESS
A reportable crash must occur on a public roadway and meet the minimum reporting
thresholds. Current Oregon law requires a citizen to report the crash to the Department of
Motor Vehicles (DMV) on an Oregon Traffic Accident and Insurance Report form within 72
hours if:
• Damage to the vehicle a person was driving was over $1,500; or
Highway Safety Investigation Manual Oregon Department of Transportation
July 12, 2012 15
• Damage to any vehicle was over $1,500 and any vehicle was towed from the scene as a
result of damages from the crash; or
• Injury or death resulted from the crash; or
• Damage to any one person's property other than a vehicle involved in the crash
exceeded $1,500.
These reporting “thresholds” change over time by legislative action and can affect the number
of property damage crashes that are reported. The most recent change occurred in 2004. The
previous reporting threshold was $1000 (since 9/1/1997).
If a police officer responds to the scene, he or she completes the Oregon Police Traffic Crash
Report. Police officers are not required to file a report unless they have completed an
investigation; however, they are more likely to prepare a report for the more severe crashes
(this varies by police department).
A citizen must file a report even if a police officer attended and completed his or her own
report. Both police and citizens submit their form to the DMV. After the crash reports are
assembled and processed for insurance verification and other driving records information, they
are sent to the Crash Analysis and Reporting (CAR) Unit for coding. Next, the crash coders in
CAR must weave together the citizen and any police reports (if submitted) into a composite
picture of the crash. There are often discrepancies in the information given by the police as well
as between the drivers that the CAR coders must sort out.
Because Oregon relies so heavily on citizen reports, there will be data issues despite the best
efforts of the CAR unit. First, it is important to note that not all crashes that occur will be
reported in the Oregon Statewide Crash Data System (CDS). There will be instances where an
investigator has evidence of a crash but it is not in the CDS. Sometimes, particularly in rural
areas where it is hard to accurately report locations, the location information will not be
correct. It is also worth noting that the precision of the milepost of the crash (to the hundred of
a mile) is not necessarily the precision of the actual crash location. This milepost is based on
interpretation of the CAR coders while referencing the highway inventory data. For example, if
a crash was reported to occur 200 feet north of Y Road which is at milepost 5.11, the crash
would be coded to milepost 5.15 (i.e. the precision implied by 2‐decimal milepost is only
related to the precision of the intersection location).
If an investigator finds an error, he or she should contact the CAR unit who can correct the
database. The phone number for the CAR unit is (503) 986‐4240.
Highway Safety Investigation Manual Oregon Department of Transportation
July 12, 2012 16
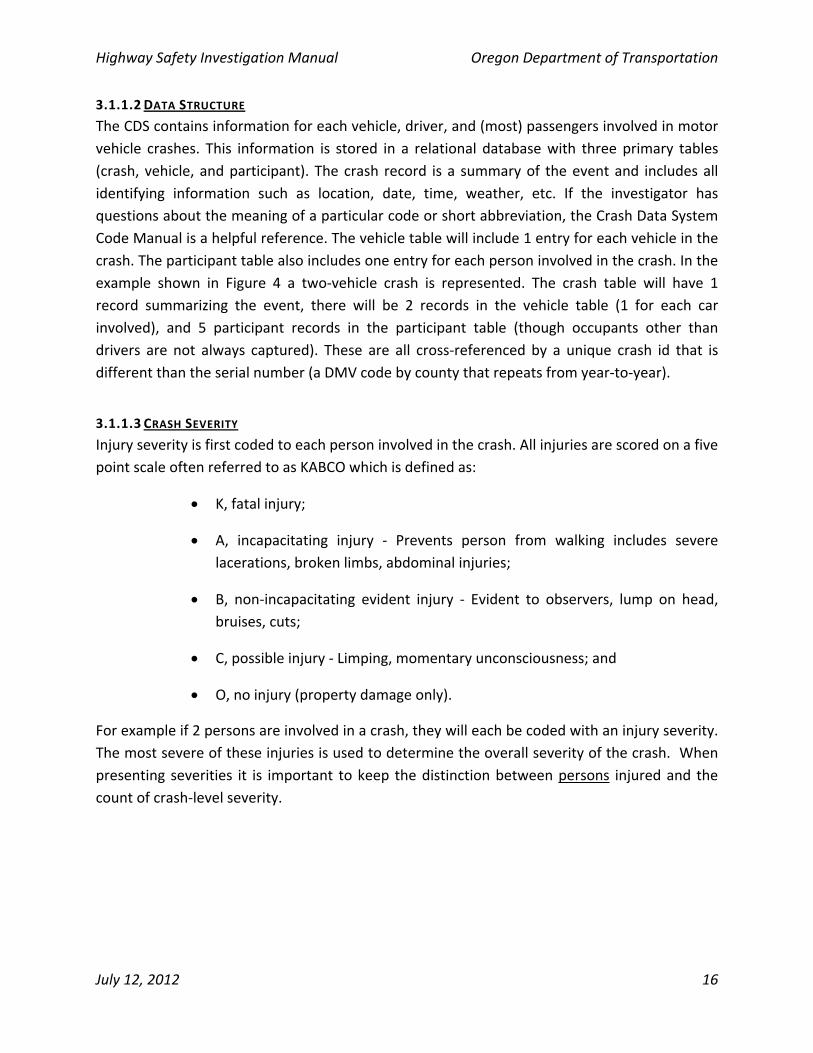
3.1.1.2 DATA STRUCTURE
The CDS contains information for each vehicle, driver, and (most) passengers involved in motor
vehicle crashes. This information is stored in a relational database with three primary tables
(crash, vehicle, and participant). The crash record is a summary of the event and includes all
identifying information such as location, date, time, weather, etc. If the investigator has
questions about the meaning of a particular code or short abbreviation, the Crash Data System
Code Manual is a helpful reference. The vehicle table will include 1 entry for each vehicle in the
crash. The participant table also includes one entry for each person involved in the crash. In the
example shown in Figure 4 a two‐vehicle crash is represented. The crash table will have 1
record summarizing the event, there will be 2 records in the vehicle table (1 for each car
involved), and 5 participant records in the participant table (though occupants other than
drivers are not always captured). These are all cross‐referenced by a unique crash id that is
different than the serial number (a DMV code by county that repeats from year‐to‐year).
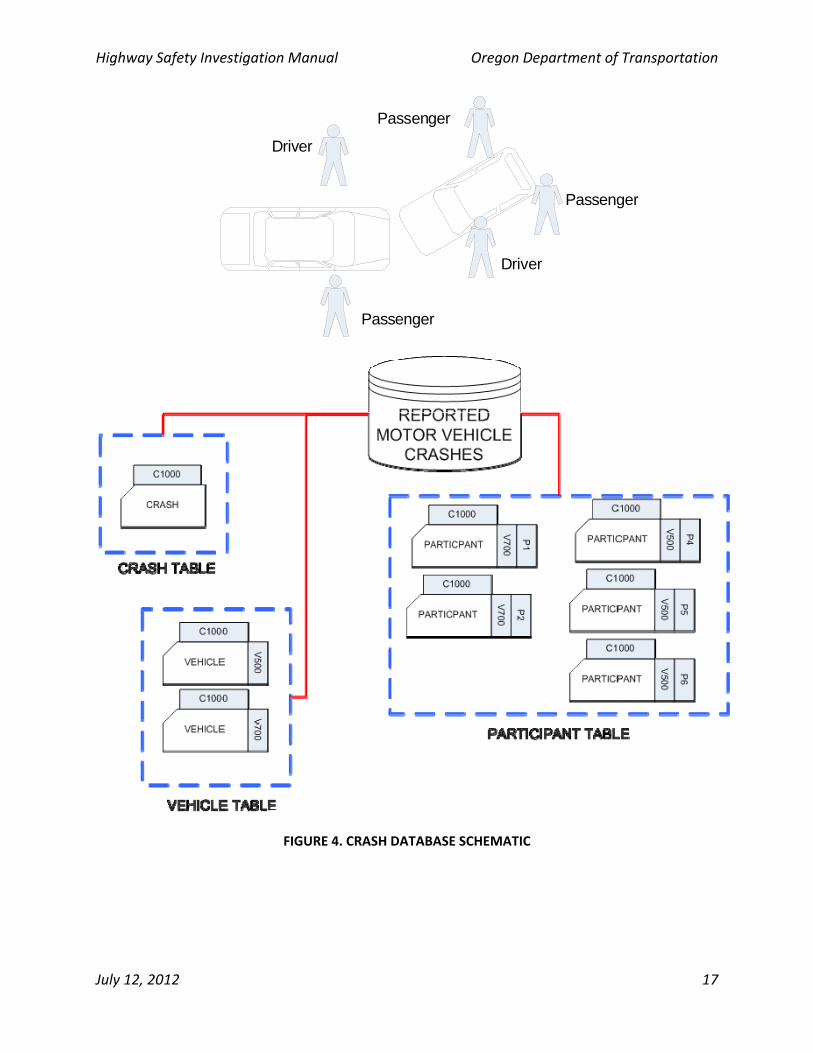
3.1.1.3 CRASH SEVERITY
Injury severity is first coded to each person involved in the crash. All injuries are scored on a five
point scale often referred to as KABCO which is defined as:
K, fatal injury;
A, incapacitating injury ‐ Prevents person from walking includes severe
lacerations, broken limbs, abdominal injuries;
B, non‐incapacitating evident injury ‐ Evident to observers, lump on head,
bruises, cuts;
C, possible injury ‐ Limping, momentary unconsciousness; and
O, no injury (property damage only).
For example if 2 persons are involved in a crash, they will each be coded with an injury severity.
The most severe of these injuries is used to determine the overall severity of the crash. When
presenting severities it is important to keep the distinction between persons injured and the
count of crash‐level severity.
Highway Safety Investigation Manual Oregon Department of Transportation
July 12, 2012 17
Driver
Passenger
Driver
Passenger
Passenger
FIGURE 4. CRASH DATABASE SCHEMATIC
Highway Safety Investigation Manual Oregon Department of Transportation
July 12, 2012 18
Example:
Vehicle 1: Driver with injury A; Passenger with injury A, Passenger with injury B
Vehicle 2: Driver with fatal injury; passenger with injury C
This crash was a fatal crash (the highest severity) but five people were injured (2 injury A, 1
injury B, 1 injury C, and 1 fatal).
It is important to be consistent in descriptions to limit confusion. Normally, the following syntax
should be used in text descriptions:
Fatal crashes (counting crashes)
Fatalities (counting persons fatally injured)
Severe injury crash (counting crashes)
Severe injuries (counting persons injured)
Using the example above, a fatal crash occurred but there were actually five injuries. Most
often, the investigator will be dealing with information at the crash‐level, not at the person‐
injury level.
One justification for the crash‐level approach in highway safety investigations is to not give
more weight to locations because of the number of vehicle occupants in particular crash.
3.1.1.4 ACCESSING THE CRASH DATA
These data can be accessed via the internal TransViewer website. The data are available in a
number of different formats that are helpful to the investigator. They are available in text and
Excel format.
Direction Report – Useful since it lists vehicle collisions by direction
PRC Report – A fairly detailed summary of the crash (including all vehicles)
Crash Graphing Tool (see reference below)
These are available in print out text form or downloaded in Excel format for further analysis
Select the CDS icon at http://hwynetintra.odot.state.or.us/TVC/
Highway Safety Investigation Manual Oregon Department of Transportation
July 12, 2012 19
A helpful Excel macro – the “Crash Graphing Tool” ‐ has been written that creates summaries of
the crash data for state highways from the “Direction (Vehicle) Report.” The use of this tool can
supplement the worksheets described in more detail in Chapter 4.
http://intranet.odot.state.or.us/tstrafmgt/crash_graphing_tool.htm
3.1.1.5 LOCATING CRASHES
Determining the location of a crash requires knowledge of ODOT’s highway inventory system
and nomenclature. State highway crashes are located using this nomenclature. To identify a
unique location, a combination of six elements is needed. These are:
– HWY_NO ‐ Three digit code representing state highway index number;
– RDWY_NO ‐ One digit code to identify roadway direction (add, non‐add);
– HWY_COMPNT_CD – One digit code characterizing the highway structure where
crash occurred (State Highway, Frontage Road, Couplet, Connection);
– RD_CON_NO – Connection number (if crash occurred on connection); The
connection number will need to be determined from the interchange diagrams
(see 3.1.4);
– MLGE_TYP_CD – Code for mileage portion of highway where crash occurred
(Regular, Temp., Spur, Overlapping); and
– MP_NO – Milepost of crash.
3.1.1.6 CRASH CODING MANUAL
An invaluable resource for the investigator will be the crash coding manual. This document
helps the investigator interpret the various codes about a particular crash. This document is
available on the CAR webpage:
http://www.oregon.gov/ODOT/DATA/documents/CDS_Code_Manual.pdf
3.1.1.7 FILED POLICE AND CITIZEN REPORTS
In some cases it may be helpful to obtain a copy of a police report which could include a
narrative and sketch. Unfortunately there is no automated manner in which this can be done at
this time, this requires a special request to CAR who must then request and obtain the report
from the DMV. If the crash is a fatal, a police/ODOT maintenance/ risk management report
may be available (TRS). These reports may trigger the need for an investigation.
Highway Safety Investigation Manual Oregon Department of Transportation
July 12, 2012 20
Citizen reports, due to confidentiality rules in Oregon Revised Statues 802.220(5), are not
generally available as part of any request.
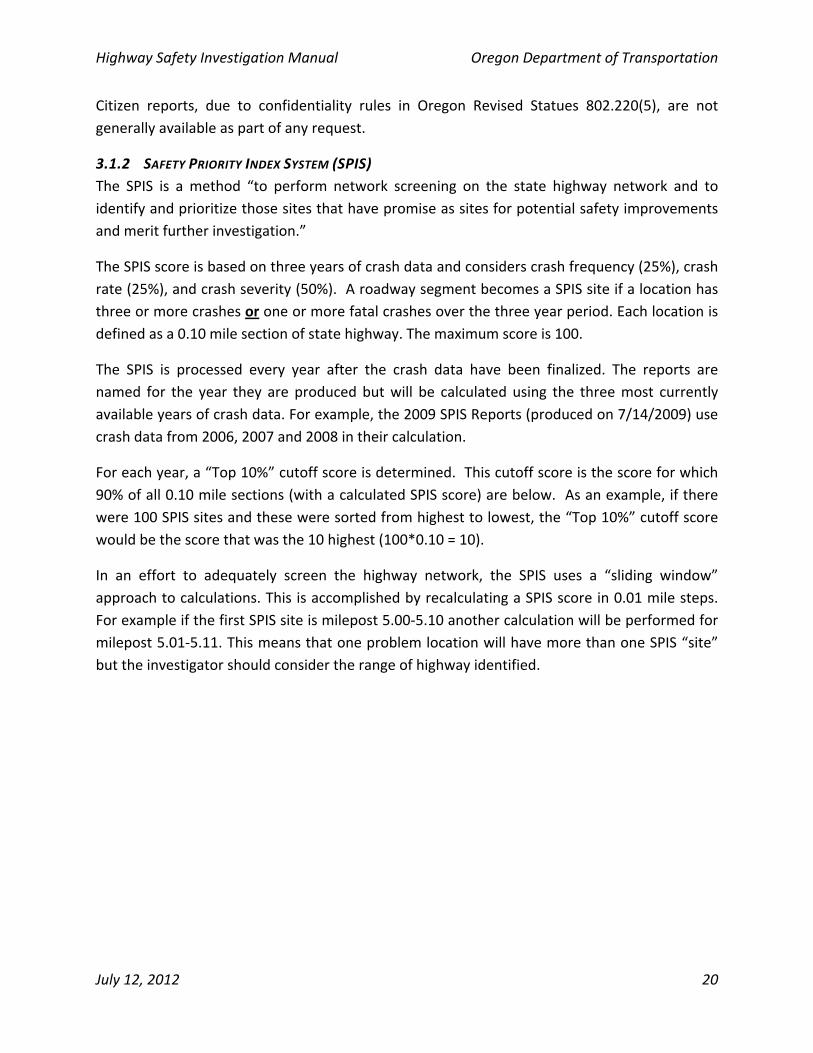
3.1.2 SAFETY PRIORITY INDEX SYSTEM (SPIS)
The SPIS is a method “to perform network screening on the state highway network and to
identify and prioritize those sites that have promise as sites for potential safety improvements
and merit further investigation.”
The SPIS score is based on three years of crash data and considers crash frequency (25%), crash
rate (25%), and crash severity (50%). A roadway segment becomes a SPIS site if a location has
three or more crashes or one or more fatal crashes over the three year period. Each location is
defined as a 0.10 mile section of state highway. The maximum score is 100.
The SPIS is processed every year after the crash data have been finalized. The reports are
named for the year they are produced but will be calculated using the three most currently
available years of crash data. For example, the 2009 SPIS Reports (produced on 7/14/2009) use
crash data from 2006, 2007 and 2008 in their calculation.
For each year, a “Top 10%” cutoff score is determined. This cutoff score is the score for which
90% of all 0.10 mile sections (with a calculated SPIS score) are below. As an example, if there
were 100 SPIS sites and these were sorted from highest to lowest, the “Top 10%” cutoff score
would be the score that was the 10 highest (100*0.10 = 10).
In an effort to adequately screen the highway network, the SPIS uses a “sliding window”
approach to calculations. This is accomplished by recalculating a SPIS score in 0.01 mile steps.
For example if the first SPIS site is milepost 5.00‐5.10 another calculation will be performed for
milepost 5.01‐5.11. This means that one problem location will have more than one SPIS “site”
but the investigator should consider the range of highway identified.
Highway Safety Investigation Manual Oregon Department of Transportation
July 12, 2012 21
FIGURE 5. SAMPLE SPIS REPORT
More information about current and past years SPIS reports is available on the TRS website
http://www.oregon.gov/ODOT/Engineering/Pages/Highway_Safety.aspx
3.1.3 SAFETY INVESTMENT PROGRAM (SIP) FIVE‐MILE SEGMENTS
The SIP five‐mile segments are another screening tool. Fixed five‐mile sections of the state highway system are categorized by the number of fatal and severe injury crashes (injury A) during a three year period. There is no sliding window used to develop the SIP segments. The following is the stratification for SIP categories:
Category 1: 0 (no) fatal or injury A (serious) crashes;
Category 2: 1 to 2 fatal or injury A crashes;
Category 3: 3 to 5 fatal or injury A crashes;
Category 4: 6 to 9 fatal or injury A crashes; and
http://transnet.odot.state.or.us/hwy/trs/default.aspx
(Note: SIP is no longer used at ODOT, 02-2018)
Highway Safety Investigation Manual Oregon Department of Transportation
July 12, 2012 22
Category 5: 10 or more fatal or injury A crashes.
The SIP category is used mainly when considering safety improvements on preservation projects. A spreadsheet listing 5‐mile categories by highway number is available on the TRS Safety Program website.
http://www.oregon.gov/ODOT/HWY/TRAFFIC‐ROADWAY/safety_investment_program.shtml
Maps are also available from the GIS Unit at:
http://www.oregon.gov/ODOT/DATA/Pages/Maps.aspx
3.1.4 HIGHWAY INVENTORY REPORTS
The ODOT Integrated Transportation Information System (ITIS) – soon to be ORTRANS ‐‐ is a
valuable resource for the location of intersections, other features, basic site geometry and
other information. Most of these data are routinely accessed by the “State Highway Inventory
Reports” interface. These reports are:
Highway Inventory Summary Report
Highway Inventory Detail Report
Lane Report
Vertical Grade Report
Horizontal Curve Report
Pavement Report
Capacity Report
Traffic Volumes and Vehicle Classification Report
Bikeway, Sidewalk & Crosswalk Report
These reports can be accessed in either web‐report or Excel versions. In some cases, the
investigator is primarily concerned about the location of intersections, ramps, or other facilities.
http://www.oregon.gov/ODOT/DATA/Pages/Road-Assets-Mileage.aspx
One helpful way to access this information is to use a “straightline chart” which is a linear,
graphical representation of much of the ITIS data. For complicated connections and
interchanges, the investigator will need to obtain an interchange diagram. These diagrams
provide an easy way to identify the complicated numbering of connections and ramps that
occur at interchanges. These are needed to extract the appropriate crashes.
http://www.oregon.gov/ODOT/DATA/Pages/Road-Assets-Mileage.aspx
Highway Safety Investigation Manual Oregon Department of Transportation
July 12, 2012 23
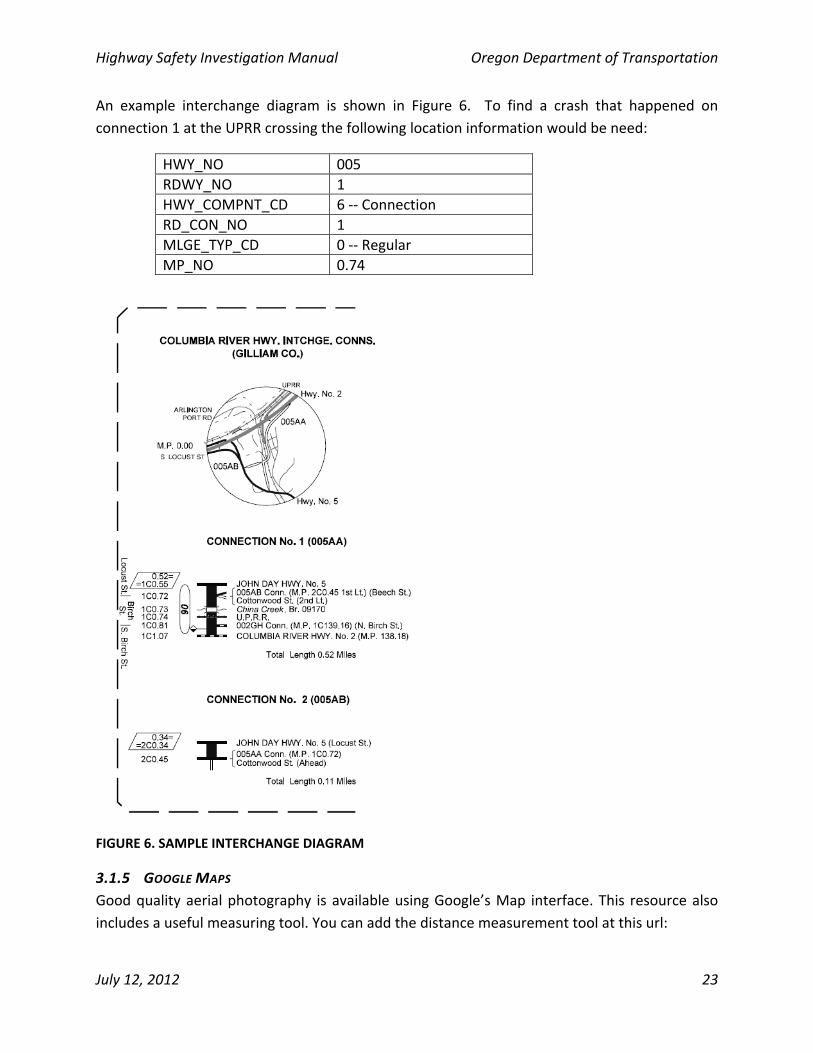
An example interchange diagram is shown in Figure 6. To find a crash that happened on
connection 1 at the UPRR crossing the following location information would be need:
HWY_NO 005
RDWY_NO 1
HWY_COMPNT_CD 6 ‐‐ Connection
RD_CON_NO 1
MLGE_TYP_CD 0 ‐‐ Regular
MP_NO 0.74
FIGURE 6. SAMPLE INTERCHANGE DIAGRAM
3.1.5 GOOGLE MAPS
Good quality aerial photography is available using Google’s Map interface. This resource also
includes a useful measuring tool. You can add the distance measurement tool at this url:
Highway Safety Investigation Manual Oregon Department of Transportation
July 12, 2012 24
http://maps.google.com/maps?showlabs=1&ftr=misc.distance.
A small ruler icon should appear in the lower left next to the scale bar. Click that ruler to use
the tool. If you have a Google account, you can save this option so that it appears on all maps
once you have signed in. In some cases, Microsoft’s Bing Maps has better resolution.
3.1.6 FACILITY FUNCTIONAL CLASS
The functional class of a highway segment is defined by the amount of traffic and type of access
(or service) that a facility provides. All facilities have both urban and rural classifications. The
highest class of facility is “Interstate” while the lowest class is “Local”. These classifications are
defined and maintained by the Road Inventory and Classification Services (RICS) unit of ODOT
and are periodically updated. Currently, the state highway system is classified as one the
following:
Rural interstate
Rural other principal arterial
Rural minor arterial
Rural major collector
Rural minor collector
Rural local
Urban interstate
Urban other freeways and expressway
Urban other principal arterial
Urban minor arterial
Urban collector
Urban local
By defining the functional class of a highway segment, the investigator will be able to draw
comparisons between the highway under investigation and all other similar highways. A current
list of all highways and their classification can be found at:
http://www.oregon.gov/ODOT/DATA/Pages/Functional-Class.aspx
3.1.7 TRAFFIC VOLUMES
Traffic volumes are a key input in the safety investigations process. Fortunately, the
Transportation Systems Monitoring (TSM) Unit collects and reports traffic volumes in an
accessible format. Volumes are available by highway and milepost on the TSM website:
http://www.oregon.gov/ODOT/DATA/Pages/Traffic-Counting.aspx
Highway Safety Investigation Manual Oregon Department of Transportation
July 12, 2012 25
3.1.8 DIGITAL VIDEO LOG
The Digital Video Log (DVL) is the online record of digital images from the driver’s perspective
for every 0.01 of mile. The recent video logs also include images that allow roadside features to
be viewed. The highway can be viewed in both increasing and decreasing mileposts. Past year
logs are also available. These past year logs can be helpful to review the location for
consistency. The DVL can be accessed internally at
http://www.oregon.gov/ODOT/DATA/Pages/Road-Assets-Mileage.aspx#DVL
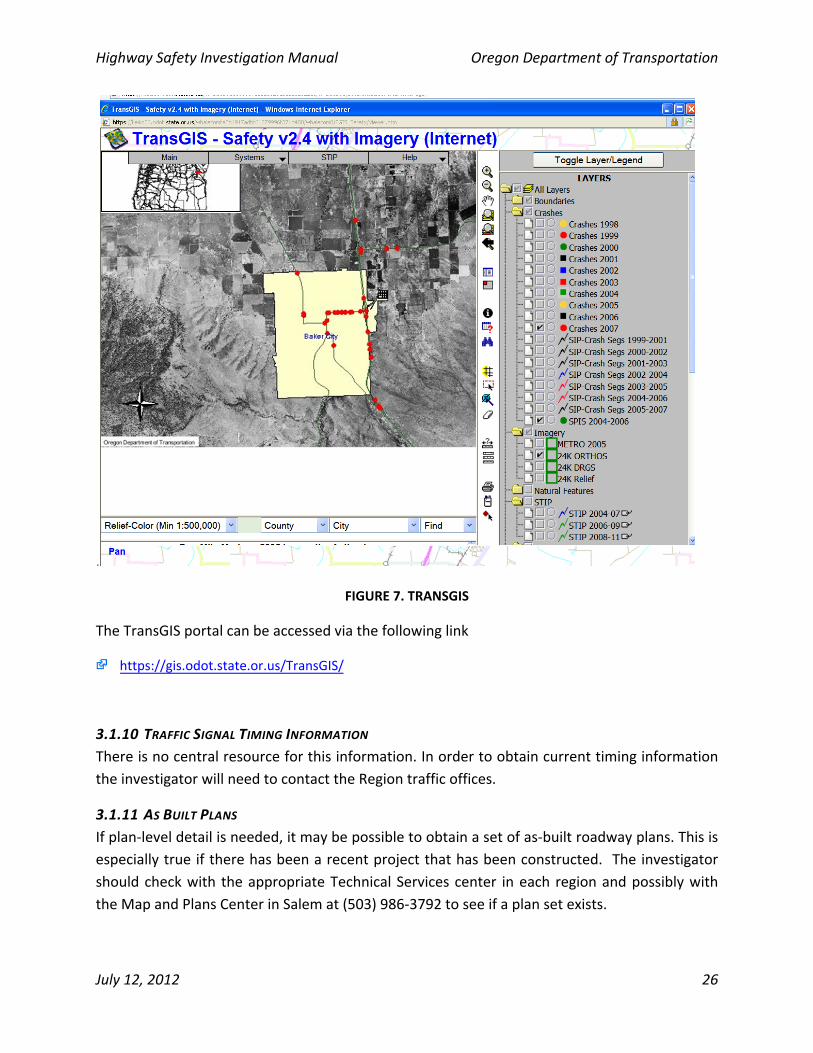
3.1.9 WEB TRANSGIS
Web TransGIS is an online mapping tool that provides access to many of the ODOT
management systems (bridge, congestion, pavement, safety) as well as customized interfaces
for other data (traffic, environmental, freight, railroad crossing, and others). The tool is
designed for all skill levels and has an easy to learn interface. Tutorials are also available. Figure
7 shows a screenshot of the TransGIS Safety interface. The main advantage of the tool is the
ability to display and interact with data and to see its spatial relationship to other features. In
addition, local city street networks, aerial photography, digital relief backgrounds and other
useful layers are available.
Highway Safety Investigation Manual Oregon Department of Transportation
July 12, 2012 26
.
FIGURE 7. TRANSGIS
The TransGIS portal can be accessed via the following link
https://gis.odot.state.or.us/TransGIS/
3.1.10 TRAFFIC SIGNAL TIMING INFORMATION
There is no central resource for this information. In order to obtain current timing information
the investigator will need to contact the Region traffic offices.
3.1.11 AS BUILT PLANS
If plan‐level detail is needed, it may be possible to obtain a set of as‐built roadway plans. This is
especially true if there has been a recent project that has been constructed. The investigator
should check with the appropriate Technical Services center in each region and possibly with
the Map and Plans Center in Salem at (503) 986‐3792 to see if a plan set exists.
Highway Safety Investigation Manual Oregon Department of Transportation
July 12, 2012 27
3.1.12 OTHER SOURCES
There are a variety of “other” data sources that may be useful for the investigator to obtain:
Recent and past newspaper or other media related to the location
Local police agency input and or reports
Maintenance records or input
Anecdotal information for “locals”
3.2 FIELD DATA
Though in‐office data is invaluable for determining historic trends and conditions at a site, a
safety assessment must include a site investigation (see Chapter 5 for more detail about site
investigations and companion data to collect). There is a wide variety of field data that may be
acquired during a site visit, but consistent documentation of site characteristics is critical.
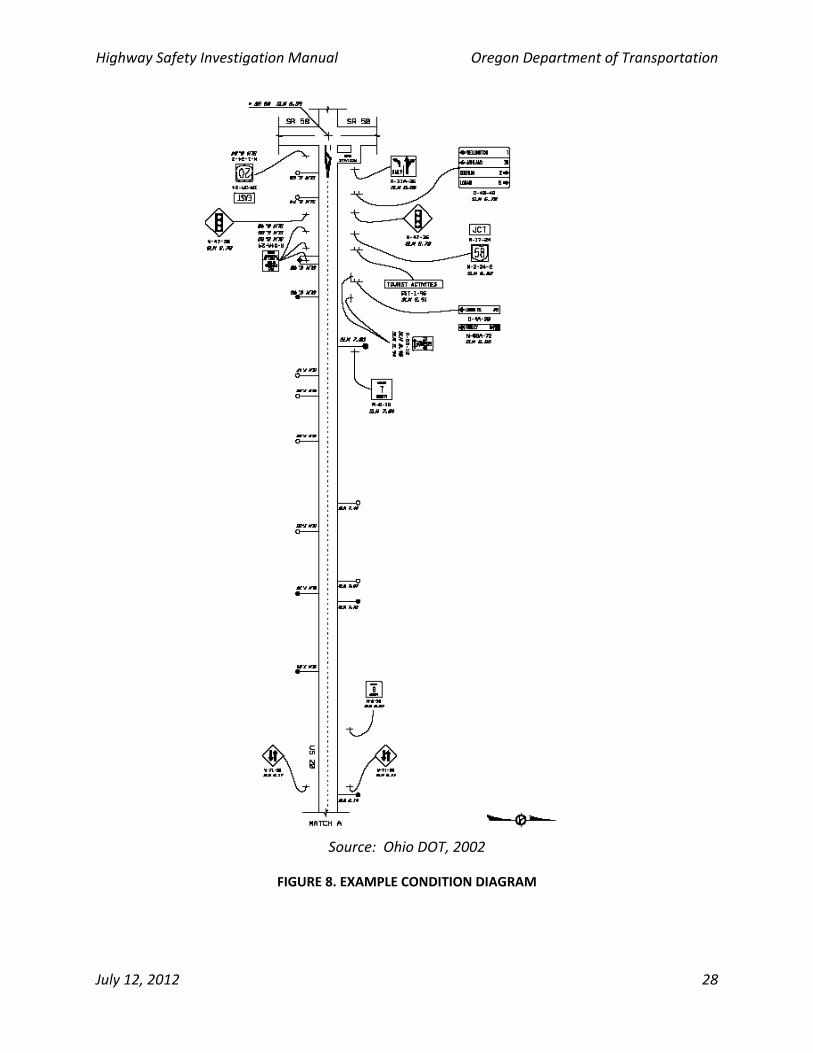
Chapter 5 addresses the various data elements that can and should be collected in the field;
however, a standard source for documenting the location, orientation, and placement of field
data is through the creation of a condition diagram (see Figure 8 for one example).
The condition diagram does not have to be drawn to scale, but should always include the
following basic information:
North Arrow;
Road Name;
Drawing of location complete with dimensions. This includes road, curb or shoulder,
sidewalks, ditches, walls, etc.;
Traffic control devices (marking, signage, signals) and their relative placement;
Adjacent land use;
Type of pavement;
Date of site visit; and
Site investigator name.
Highway Safety Investigation Manual Oregon Department of Transportation
July 12, 2012 28
Source: Ohio DOT, 2002
FIGURE 8. EXAMPLE CONDITION DIAGRAM
Highway Safety Investigation Manual Oregon Department of Transportation
July 12, 2012 29
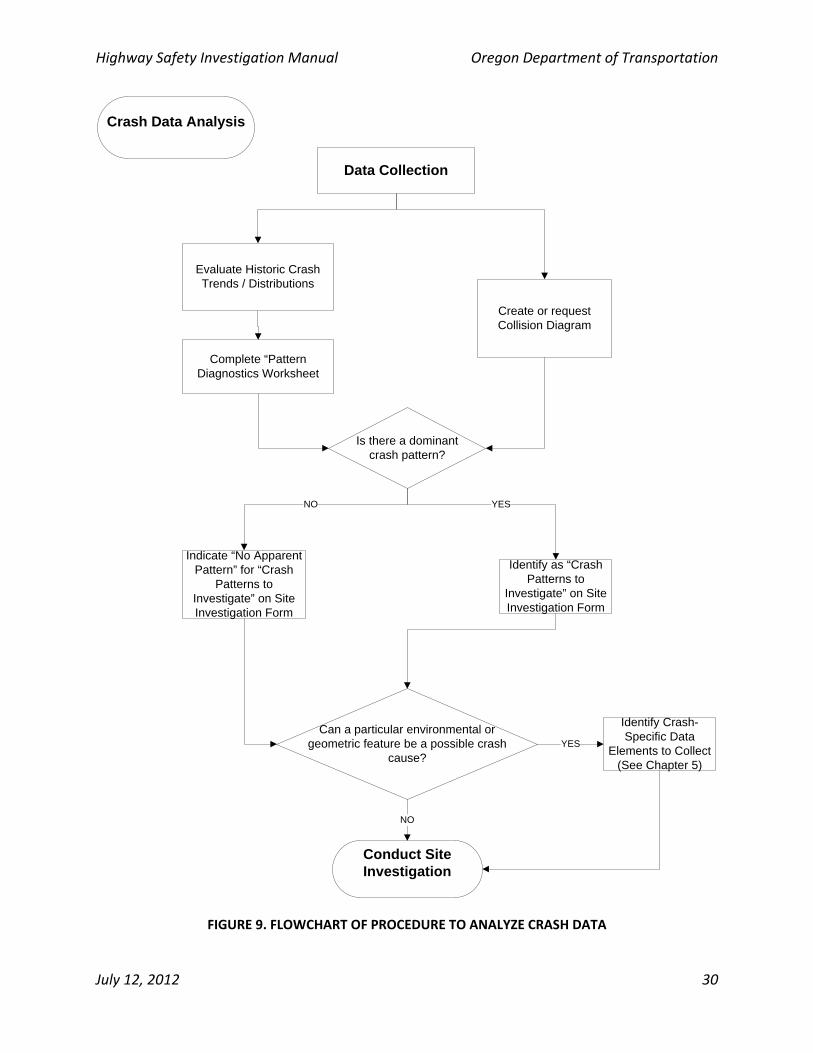
4 DIAGNOSING CRASH PATTERNS
The primary goal of a safety investigation is to diagnose the
safety problem at the selected location and recommend
improvements. These recommendations are based on a detailed
review of in‐office data, field reviews, and other input. This
investigation process has an element of detective work and
requires putting together information that is, at times,
incomplete. While crash data is not the only input to this
process, it is generally the starting point for investigations. As
stated in the safety investigations basics, our investigative
efforts are searching for a pattern of crashes that is “out of the
ordinary.” The purpose of this chapter is to document a
methodology that can be used to help uncover unusual crash
patterns. The general process for this crash data analysis is
demonstrated in the flowchart shown in Figure 9.
4.1 CRASH PATTERN WORKSHEET
To assist the investigator in diagnostic efforts, a
pattern diagnostic worksheet has been created. This
worksheet is based on the direct diagnostics work by
Kononov and Janson (2002). They argue that an
overrepresentation of one type of crash relative to other crash
types is a better indicator of possible improvements than a high
frequency relative to other locations. For example, a high
proportion of fixed‐object crashes relative to all crashes on a
highway segment might mean the location is a good candidate for shoulder rumble strips or
enhanced delineation.
The strength of this approach is that the investigator compares the location under investigation
to an average of similar locations. In doing this, the investigator can contrast the observed crash
patterns at the location to what is “typical.” Any unusual patterns are easily highlighted and can
be the basis for more investigation. Each parameter is tested separately. These unusual crash
types can also be explored in the field visits. The ability to contrast crash frequency, crash
severity, crash rates, and similar metrics creates a basis for justification resulting from
engineering judgment when a conventional crash rate analysis does not provide the same focus
as these alternative crash statistics.
Highway Safety Investigation Manual Oregon Department of Transportation
July 12, 2012 30
Data Collection
Create or request Collision Diagram
Evaluate Historic Crash Trends / Distributions
Complete “Pattern Diagnostics Worksheet
Is there a dominant crash pattern?
YES
Identify as “Crash Patterns to
Investigate” on Site Investigation Form
Indicate “No Apparent Pattern” for “Crash
Patterns to Investigate” on Site Investigation Form
NO
Can a particular environmental or geometric feature be a possible crash
cause?
NO
YES
Identify Crash-Specific Data
Elements to Collect (See Chapter 5)
Conduct Site Investigation
Crash Data Analysis
FIGURE 9. FLOWCHART OF PROCEDURE TO ANALYZE CRASH DATA
Highway Safety Investigation Manual Oregon Department of Transportation
July 12, 2012 31
To do this, a tabulation of typical distributions for various crash classifications has been
developed. These tabulations are developed separately for segments (by functional class) and
intersections (by urban/rural, configuration, and traffic control) for all highway crashes. The
worksheet already contains these distributions. These expected proportions were generated for
segments: by considering all state highway crashes for a five‐year period (2003‐2007) and for
intersections by randomly selecting intersections in each of the four categories (this work is
summarized in ODOT Research Report SPR 667).
The method calculates the probability that an observed percentage of a crash classification will
exceed the average percentage distribution for a similar facility. For example, say there have
been 20 rear‐end crashes out of 61 total crashes observed at a location that is a rural principal
arterial. The question for the investigator should be is it “normal” to have 32.8% (20/61) of the
total crashes be rear‐end?
The probability that this proportion is “typical” can be calculated assuming crashes are
Bernoulli trials with the following formula (for use in spreadsheet calculations presented later):
1
0
)1(!!
!1)(
x
i
ini
i ppiin
nxXP , where
x = the observed count of the crash type to test
n= total number of crash types at the location
p = the expected proportion of the crash types
In the above example, the observed percentage is 32.8% (20/61). All rural principal arterials had
18.9% rear‐end crashes. Thus the calculation determines how likely is 32.8% rear‐end crashes if
the average of all rural principal arterials is 18.9%. Using the formula, the probability of
observing these 20/61 rear‐ends crashes at a “normal” rural principal arterial section is:
120
0
61 007.0)189.01(189.0!!61
!611)(
i
ii
iixXP , or 0.7%
In other words, there is a very small chance that this proportion, 20/61, would be observed at a
“typical” location and so can this value (32.8%) is considered unusual.
4.1.1 USING THE PATTERNS WORKSHEET
Despite the perceived complexity, the crash pattern worksheet essentially compares the
proportions of various crash variables for the study location versus long‐run averages for similar
sites. For example, if the study site has 10% head‐on crashes while all other sites have an
Highway Safety Investigation Manual Oregon Department of Transportation
July 12, 2012 32
average of 3.8% head‐on crashes it will likely be flagged as “unusual.” The primary advantage of
the worksheet is the tabulation of these averages in a useable format and the fact that the
tabulations of the crash data has been completely automated for the investigator.
Investigators need only complete information on the sheet labeled “COVER” and “DATA ENTRY”
fields shaded yellow, then copy in the PRC crash data to use the patterns worksheets.
4.1.1.1 COVER SHEET
There will be 2 worksheets: one for segments and one for intersections. This form involves
many calculations and is intended as an electronic form. The general directions are below:
The header portion of the worksheet is the summary information that the investigator should
have readily on hand prior to completing the remainder of the worksheet.
The investigator should complete the information that defines the location for investigation on
the “COVER SHEET” tab. A critical selection to using the worksheets requires the investigator to
select the appropriate “Location Type” from the drop down selection. When “Segment” is
selected, a warning message will appear on the “PATTERNS_INTER” worksheet reminding the
investigator to use the “PATTERNS_SEG” worksheet. Next, the investigator should complete the
yellow‐shaded cells information in either the “SEGMENT and CRASH DATA MPs” or the
“INTERSECTION.” The selection here controls which of the expected proportions will populate
the worksheet.
4.1.1.2 DATA ENTRY
1. Crash data and other information is entered in the “DATA ENTRY” tab. Tabulation of the
crash data is automated. To enter the data complete these steps:
a. Download the PRC Report in Excel Format (must use Internet Explorer).
b. Copy the entire PRC report by selecting the entire sheet and using either CTRL‐C
or the COPY option in Excel.
c. Select the “PRC_RAWDATA” tab in the SIM Worksheet.
d. Move the Excel selection box to cell A1 in the "PRC RAWDATA" sheet.
e. Paste the PRC data in cell A1.
f. Return to the “DATA ENTRY” tab in the SIM Worksheet.
Highway Safety Investigation Manual Oregon Department of Transportation
July 12, 2012 33
g. Click the "Extract Raw Data" button to the right.
h. Answer the prompts and the PRC report will be summarized in pink cells below.
Note that the light Blue cells are sums.
2. Complete the cells in YELLOW (must be completed by investigator). Enter the date
range of the crash data (MM/DD/YYY). Enter the TRAFFIC VOL. ‐ MAJ ADT and TRAFFIC
VOL. ‐ MIN ADT for as many years as you have data. The counts will be averaged for use
in the rate calculations. If you do not know the volume, leave the cell blank. The three
most recent years of traffic volumes are needed for the crash rate calculation. This data
can be obtained where described as follows:
Segments: If the segment spans multiple AADT ranges, compute a weighted average
of the ADT. A weighted average of AADT can be calculated using the length and ADT
values. For example, if a 2 mile section has an ADT of 5,000 and a 1 mile section has
an ADT of 6,000 the weighted average is (2 x 5000 + 1 x6000)/ (2+1) = 5,333 ADT.
Intersections: Be sure to calculate the entering volume. Minor street volume may
be difficult to obtain and may require contacting the local jurisdictions.
3. If you are entering data manually, enter the counts of the observed crash data in the
PINK cells. There are checks listed in column I to make sure that you have entered the
proper counts.
4. Next, select the worksheet tab for the appropriate facility (either “PATTERNS_SEGS” for
segments or “PATTERNS_INTER” for intersections). NOTE – both tabs will be completed
automatically though only one will actually be relevant for your facility type.
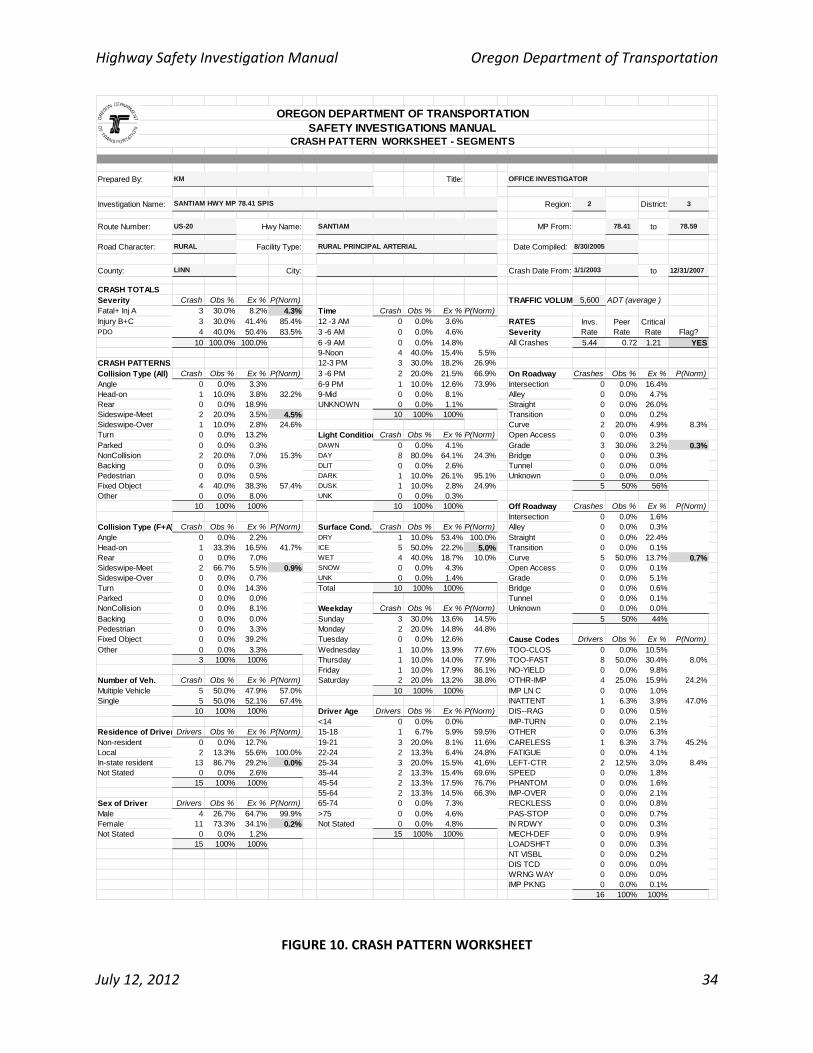
A sample of the PATTERNS_SEGS worksheet (from the Appendix Case Studies) is shown in
Figure 10.
Highway Safety Investigation Manual Oregon Department of Transportation
July 12, 2012 34
FIGURE 10. CRASH PATTERN WORKSHEET
Prepared By: Title:
Investigation Name: Region: 2 District: 3
Route Number: Hwy Name: MP From: 78.41 to 78.59
Road Character: Facility Type: Date Compiled:
County: City: Crash Date From: to 12/31/2007
CRASH TOTALSSeverity Crash Obs % Ex % P(Norm) TRAFFIC VOLUM 5,600 ADT (average )Fatal+ Inj A 3 30.0% 8.2% 4.3% Time Crash Obs % Ex % P(Norm)Injury B+C 3 30.0% 41.4% 85.4% 12 -3 AM 0 0.0% 3.6% RATESPDO 4 40.0% 50.4% 83.5% 3 -6 AM 0 0.0% 4.6% Severity
10 100.0% 100.0% 6 -9 AM 0 0.0% 14.8% All Crashes 5.44 0.72 1.21 YES9-Noon 4 40.0% 15.4% 5.5%
CRASH PATTERNS 12-3 PM 3 30.0% 18.2% 26.9%Collision Type (All) Crash Obs % Ex % P(Norm) 3 -6 PM 2 20.0% 21.5% 66.9% On Roadway Crashes Obs % Ex % P(Norm)Angle 0 0.0% 3.3% 6-9 PM 1 10.0% 12.6% 73.9% Intersection 0 0.0% 16.4%Head-on 1 10.0% 3.8% 32.2% 9-Mid 0 0.0% 8.1% Alley 0 0.0% 4.7%Rear 0 0.0% 18.9% UNKNOWN 0 0.0% 1.1% Straight 0 0.0% 26.0%Sideswipe-Meet 2 20.0% 3.5% 4.5% 10 100% 100% Transition 0 0.0% 0.2%Sideswipe-Over 1 10.0% 2.8% 24.6% Curve 2 20.0% 4.9% 8.3%Turn 0 0.0% 13.2% Light Condition Crash Obs % Ex % P(Norm) Open Access 0 0.0% 0.3%Parked 0 0.0% 0.3% DAWN 0 0.0% 4.1% Grade 3 30.0% 3.2% 0.3%NonCollision 2 20.0% 7.0% 15.3% DAY 8 80.0% 64.1% 24.3% Bridge 0 0.0% 0.3%Backing 0 0.0% 0.3% DLIT 0 0.0% 2.6% Tunnel 0 0.0% 0.0%Pedestrian 0 0.0% 0.5% DARK 1 10.0% 26.1% 95.1% Unknown 0 0.0% 0.0%Fixed Object 4 40.0% 38.3% 57.4% DUSK 1 10.0% 2.8% 24.9% 5 50% 56%Other 0 0.0% 8.0% UNK 0 0.0% 0.3%
10 100% 100% 10 100% 100% Off Roadway Crashes Obs % Ex % P(Norm)Intersection 0 0.0% 1.6%
Collision Type (F+A) Crash Obs % Ex % P(Norm) Surface Cond. Crash Obs % Ex % P(Norm) Alley 0 0.0% 0.3%Angle 0 0.0% 2.2% DRY 1 10.0% 53.4% 100.0% Straight 0 0.0% 22.4%Head-on 1 33.3% 16.5% 41.7% ICE 5 50.0% 22.2% 5.0% Transition 0 0.0% 0.1%Rear 0 0.0% 7.0% WET 4 40.0% 18.7% 10.0% Curve 5 50.0% 13.7% 0.7%Sideswipe-Meet 2 66.7% 5.5% 0.9% SNOW 0 0.0% 4.3% Open Access 0 0.0% 0.1%Sideswipe-Over 0 0.0% 0.7% UNK 0 0.0% 1.4% Grade 0 0.0% 5.1%Turn 0 0.0% 14.3% Total 10 100% 100% Bridge 0 0.0% 0.6%Parked 0 0.0% 0.0% Tunnel 0 0.0% 0.1%NonCollision 0 0.0% 8.1% Weekday Crash Obs % Ex % P(Norm) Unknown 0 0.0% 0.0%Backing 0 0.0% 0.0% Sunday 3 30.0% 13.6% 14.5% 5 50% 44%Pedestrian 0 0.0% 3.3% Monday 2 20.0% 14.8% 44.8%Fixed Object 0 0.0% 39.2% Tuesday 0 0.0% 12.6% Cause Codes Drivers Obs % Ex % P(Norm)Other 0 0.0% 3.3% Wednesday 1 10.0% 13.9% 77.6% TOO-CLOS 0 0.0% 10.5%
3 100% 100% Thursday 1 10.0% 14.0% 77.9% TOO-FAST 8 50.0% 30.4% 8.0%Friday 1 10.0% 17.9% 86.1% NO-YIELD 0 0.0% 9.8%
Number of Veh. Crash Obs % Ex % P(Norm) Saturday 2 20.0% 13.2% 38.8% OTHR-IMP 4 25.0% 15.9% 24.2%Multiple Vehicle 5 50.0% 47.9% 57.0% 10 100% 100% IMP LN C 0 0.0% 1.0%Single 5 50.0% 52.1% 67.4% INATTENT 1 6.3% 3.9% 47.0%
10 100% 100% Driver Age Drivers Obs % Ex % P(Norm) DIS--RAG 0 0.0% 0.5%<14 0 0.0% 0.0% IMP-TURN 0 0.0% 2.1%
Residence of Driver Drivers Obs % Ex % P(Norm) 15-18 1 6.7% 5.9% 59.5% OTHER 0 0.0% 6.3%Non-resident 0 0.0% 12.7% 19-21 3 20.0% 8.1% 11.6% CARELESS 1 6.3% 3.7% 45.2%Local 2 13.3% 55.6% 100.0% 22-24 2 13.3% 6.4% 24.8% FATIGUE 0 0.0% 4.1%In-state resident 13 86.7% 29.2% 0.0% 25-34 3 20.0% 15.5% 41.6% LEFT-CTR 2 12.5% 3.0% 8.4%Not Stated 0 0.0% 2.6% 35-44 2 13.3% 15.4% 69.6% SPEED 0 0.0% 1.8%
15 100% 100% 45-54 2 13.3% 17.5% 76.7% PHANTOM 0 0.0% 1.6%55-64 2 13.3% 14.5% 66.3% IMP-OVER 0 0.0% 2.1%
Sex of Driver Drivers Obs % Ex % P(Norm) 65-74 0 0.0% 7.3% RECKLESS 0 0.0% 0.8%Male 4 26.7% 64.7% 99.9% >75 0 0.0% 4.6% PAS-STOP 0 0.0% 0.7%Female 11 73.3% 34.1% 0.2% Not Stated 0 0.0% 4.8% IN RDWY 0 0.0% 0.3%Not Stated 0 0.0% 1.2% 15 100% 100% MECH-DEF 0 0.0% 0.9%
15 100% 100% LOADSHFT 0 0.0% 0.3%NT VISBL 0 0.0% 0.2%DIS TCD 0 0.0% 0.0%WRNG WAY 0 0.0% 0.0%IMP PKNG 0 0.0% 0.1%
16 100% 100%
Peer Rate
Critical Rate
Invs. Rate Flag?
SANTIAM HWY MP 78.41 SPIS
SAFETY INVESTIGATIONS MANUAL
RURAL
LINN
SANTIAM
1/1/2003
OREGON DEPARTMENT OF TRANSPORTATION
CRASH PATTERN WORKSHEET - SEGMENTS
RURAL PRINCIPAL ARTERIAL
OFFICE INVESTIGATORKM
8/30/2005
US-20
Highway Safety Investigation Manual Oregon Department of Transportation
July 12, 2012 35
4.1.2 INTERPRETING THE CRASH PATTERNS
The worksheets calculate the probability that the observed proportion is “normal” in the
P(Norm) column. A screen shot of the worksheet is shown in Figure 10 for segments.
Probabilities less than 5% (chosen as the threshold) are conditionally formatted bold and grey.
This threshold has been set based on experience but should not be considered an absolute
value. These crash parameters should be considered for further investigation.
In Figure 10, a number of different crash trends are highlighted in grey (PNorm is less than 5%)
as being potentially unusual:
• Fatal+ Inj A crashes • Collision types (all): Sideswipe‐Meet) • Collision types (Fatal and Inj A): Sideswipe‐Meet • In‐state resident drivers • Female drivers • Lighting: DUSK • Surface conditions: ICE • Curve –Off Roadway • Grade – On Roadway
The worksheet can also be used to examine patterns that are close, but are not less than the
5% threshold. These patterns could also be potentially useful to an investigator. In Figure 10,
these patterns are:
• Time period – 9‐AM Noon • Day of the Week: Sunday • Driver age groups: 19‐21; • Surface conditions: ICE and WET • Cause code: TOO FAST and LEFT of CENTER
A short description of the “clues” offered by overrepresentation of each category or pattern is
provided below. These are not meant to be exhaustive but rather illustrative of use of the
worksheet to interpret potential causes.
4.1.2.1 CRASH TOTALS BY SEVERITY
If one or more severity groupings are overrepresented, the investigator should look in‐depth at
these crash types.
Highway Safety Investigation Manual Oregon Department of Transportation
July 12, 2012 36
4.1.2.2 COLLISION TYPES (ALL AND FATAL AND INJURY A)
If one or more severity groupings are overrepresented, the investigator should look in‐depth at
these crash types. The collision type is often a good indication of crash contributing factors. In
many locations, there are not enough fatal and injury A crashes to test for overrepresentation
by type. Note that for Rural 3‐Leg Signalized and Urban 4‐Leg Unsignalized intersections, there
were insufficient Fatal and Injury A crashes to develop patterns by collision types.
4.1.2.3 NUMBER OF VEHICLES INVOLVED
Single vehicle crashes will be related to fixed‐object or non‐collision crash types, while multiple
vehicle crashes are head‐on or intersection‐related.
4.1.2.4 TIME OF DAY
These patterns normally follow traffic volumes (with a majority in the afternoon peak period (3‐
6 p.m.). If a particular time period is identified, the investigator could consider possible
relationships to congestion), significant traffic generators (e.g. a school), or perhaps sun‐glare
conditions.
4.1.2.5 LIGHT CONDITIONS
Typically, the investigator is interested in determining whether the crashes at the investigation
location are overrepresented in dark conditions. This may guide the investigator to conduct
further investigations or field studies related to lighting.
4.1.2.6 SURFACE CONDITIONS
The investigator may be primarily interested in identifying locations with an unusual amount of
wet or snow/ice crashes. An overrepresentation of wet crashes may indicate pavement friction
or drainage issues. An overrepresentation of snow/ice crashes may indicate a possible driver
awareness issue. The investigator should keep in mind that the proportions are for a statewide
average – locations with more winter weather may be different. Further field studies may be
needed.
4.1.2.7 DAY OF WEEK
Like the time‐of‐day summary, the investigator should consider possible relationships to key
traffic generators (e.g. recreational route, school). Patterns usually follow traffic volumes, so
Saturday or Sunday flagged time periods may indicate recreational or shopping generator
influences.
Highway Safety Investigation Manual Oregon Department of Transportation
July 12, 2012 37
4.1.2.8 AGE OF DRIVER
An overrepresented age group is likely related to a nearby traffic generator (e.g. school). The
investigator should consider the possible relationship to other causal factors if one age group is
overrepresented.
4.1.2.9 RESIDENCE OF DRIVER
The investigator may be primarily looking to determine if non‐local drivers were
overrepresented, indicating that driver expectancy or other unfamiliar situations might be
contributing factors to the crash patterns.
4.1.2.10 GENDER OF DRIVER
It is not likely that an overrepresentation by gender is useful for crash diagnostic purposes.
However, an overrepresentation may be related to a nearby traffic generator and could be
useful for non‐engineering countermeasures.
4.1.2.11 ROAD CHARACTERISTICS
This information is summarized separately for on‐road and off‐road crashes. The total between
on and off road adds to the total number of crashes. On or off roadway is defined by the
location of the harmful event. For example, if the crash involved a fixed‐object as the first
harmful event, the road characteristics will be considered off‐road. The characteristic refers to
the general location of the crash (e.g. curve, bridge, intersection, etc.). Overrepresented crash
types here would be a clue for the investigator about what crashes on the collision diagram
may need further review.
4.1.2.12 CAUSE
For each crash record, several possible crash contributing factors may be listed. A detailed list
of these potential causes is provided in the crash coding manual. These cause codes are
another indication of potential crash causations. These codes often are correlated with other
data already summarized (rear‐end crashes often get coded as “Too Closely” or “Too Fast”). The
proportions for these cause codes were generated considering all three possible codes for each
crash. For that reason, the total cause errors will not match the total crash counts.
4.1.3 LIMITATIONS OF THE PATTERNS WORKSHEET
Because this worksheet tests whether a particular distribution of crashes is different, crash
locations with a small number of crashes will not be easily tested with this worksheet. It is
recommended that a minimum of 10 crashes should be observed before using this worksheet.
Caution should also be used for pattern categories that have few crashes (for example if there
less than five fatal and injury A crashes, analysis of the patterns is not that useful).
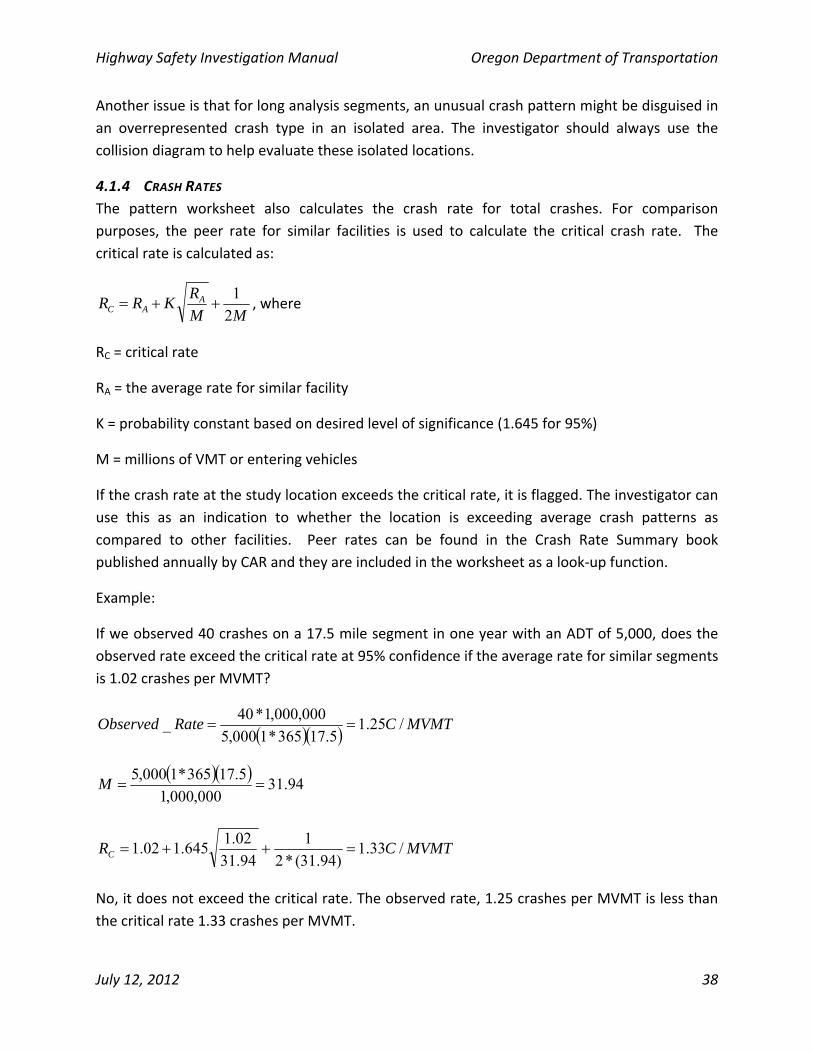
Highway Safety Investigation Manual Oregon Department of Transportation
July 12, 2012 38
Another issue is that for long analysis segments, an unusual crash pattern might be disguised in
an overrepresented crash type in an isolated area. The investigator should always use the
collision diagram to help evaluate these isolated locations.
4.1.4 CRASH RATES
The pattern worksheet also calculates the crash rate for total crashes. For comparison
purposes, the peer rate for similar facilities is used to calculate the critical crash rate. The
critical rate is calculated as:
MM
RKRR A
AC 2
1 , where
RC = critical rate
RA = the average rate for similar facility
K = probability constant based on desired level of significance (1.645 for 95%)
M = millions of VMT or entering vehicles
If the crash rate at the study location exceeds the critical rate, it is flagged. The investigator can
use this as an indication to whether the location is exceeding average crash patterns as
compared to other facilities. Peer rates can be found in the Crash Rate Summary book
published annually by CAR and they are included in the worksheet as a look‐up function.
Example:
If we observed 40 crashes on a 17.5 mile segment in one year with an ADT of 5,000, does the
observed rate exceed the critical rate at 95% confidence if the average rate for similar segments
is 1.02 crashes per MVMT?
MVMTCRateObserved /25.15.17365*1000,5
000,000,1*40_
94.31
000,000,1
5.17365*1000,5M
MVMTCRC /33.1)94.31(*2
1
94.31
02.1645.102.1
No, it does not exceed the critical rate. The observed rate, 1.25 crashes per MVMT is less than
the critical rate 1.33 crashes per MVMT.
Highway Safety Investigation Manual Oregon Department of Transportation
July 12, 2012 39
4.2 COLLISION DIAGRAMS
In addition to patterns of crash by type, it is also important to consider the spatial patterns of
the crashes. One common and easy way to do this is to construct a collision diagram. A collision
diagram is a schematic representation of all crashes occurring on a simple plan view at a given
location. A sample collision diagram for an intersection is shown in Figure 11.
Collision diagrams are generally not drawn to scale. Crashes are placed in the general location
of a crash and arranged in groups of various crash types. Arrows are used to show the paths of
vehicles and symbols are used to convey other information such as crash type, injury severity,
and other parameters. Each collision at the site is represented by a set of arrows ‐‐ one for each
vehicle or pedestrian involved. Text notations are used to indicate other information such as
the date and time, environmental conditions, and other parameters. In general, at least 3 years
of crash data should be used. It is also helpful to include a summary table on the diagram.
A collision diagram is useful because it is a graphical representation of crash patterns and this
format allows for easy interpretation. In the sample Figure 11, it is clear that the southbound
crashes are primarily rear‐end crashes and this trend does not occur on the other intersection
approaches.
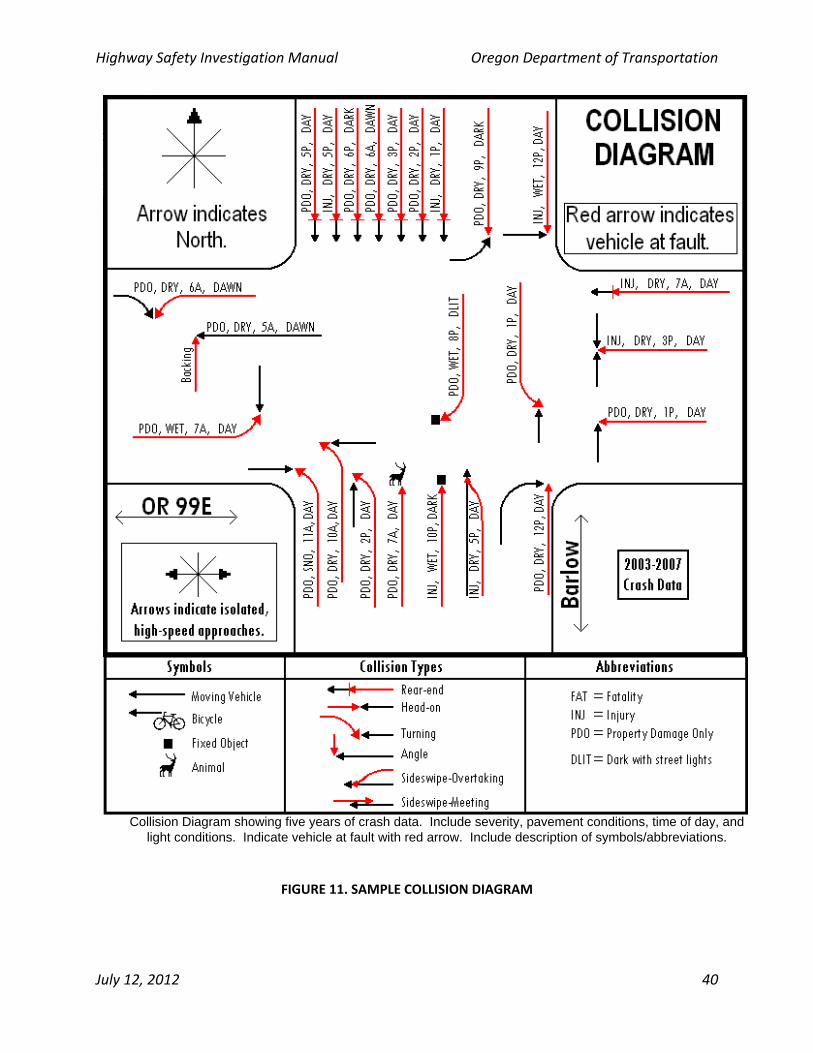
Highway Safety Investigation Manual Oregon Department of Transportation
July 12, 2012 40
Collision Diagram showing five years of crash data. Include severity, pavement conditions, time of day, and light conditions. Indicate vehicle at fault with red arrow. Include description of symbols/abbreviations.
FIGURE 11. SAMPLE COLLISION DIAGRAM
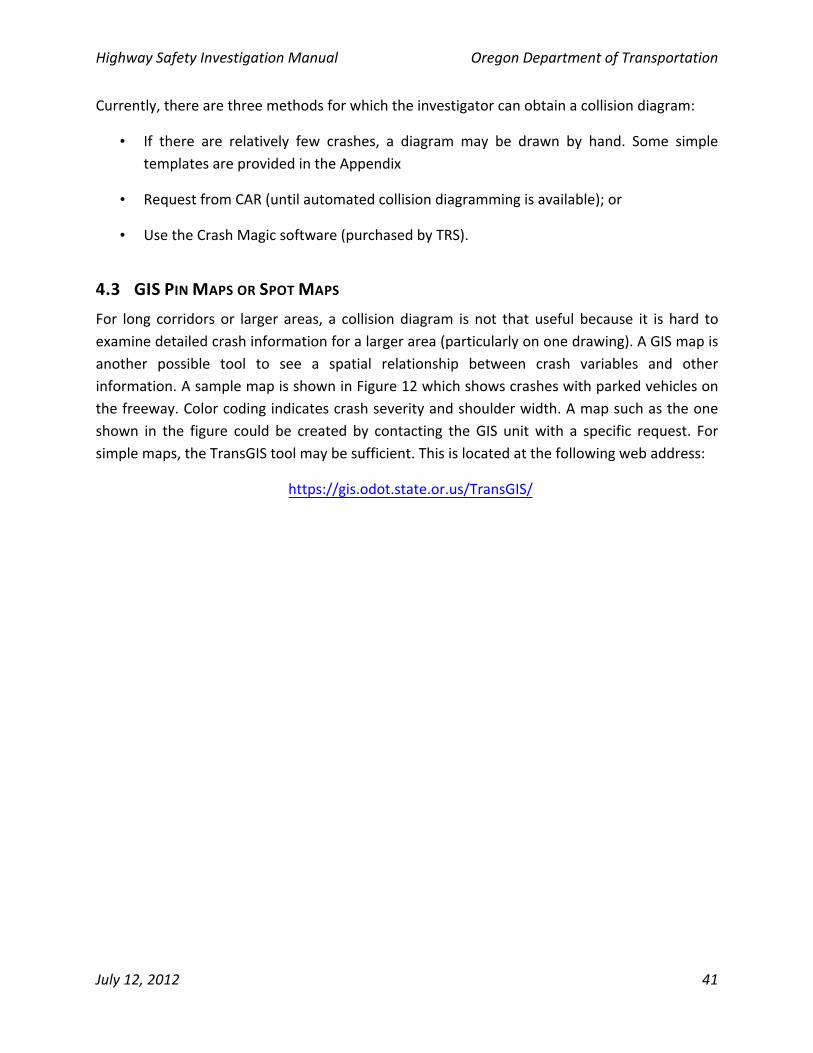
Highway Safety Investigation Manual Oregon Department of Transportation
July 12, 2012 41
Currently, there are three methods for which the investigator can obtain a collision diagram:
• If there are relatively few crashes, a diagram may be drawn by hand. Some simple
templates are provided in the Appendix
• Request from CAR (until automated collision diagramming is available); or
• Use the Crash Magic software (purchased by TRS).
4.3 GIS PIN MAPS OR SPOT MAPS
For long corridors or larger areas, a collision diagram is not that useful because it is hard to examine detailed crash information for a larger area (particularly on one drawing). A GIS map is
another possible tool to see a spatial relationship between crash variables and other information. A sample map is shown in Figure 12 which shows crashes with parked vehicles on
the freeway. Color coding indicates crash severity and shoulder width. A map such as the one
shown in the figure could be created by contacting the GIS unit with a specific request. For simple maps, the TransGIS tool may be sufficient. This is located at the following web address:
https://gis.odot.state.or.us/TransGIS/
Highway Safety Investigation Manual Oregon Department of Transportation
July 12, 2012 42
FIGURE 12. SAMPLE GIS MAP
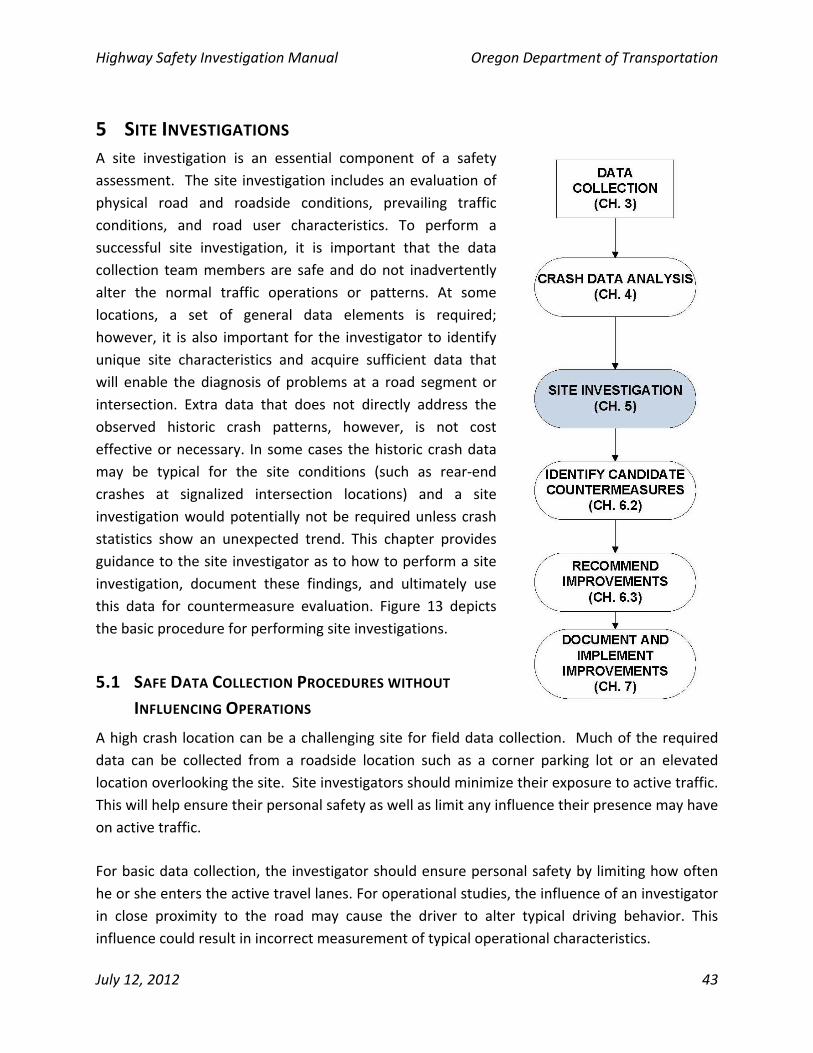
Highway Safety Investigation Manual Oregon Department of Transportation
July 12, 2012 43
5 SITE INVESTIGATIONS
A site investigation is an essential component of a safety
assessment. The site investigation includes an evaluation of
physical road and roadside conditions, prevailing traffic
conditions, and road user characteristics. To perform a
successful site investigation, it is important that the data
collection team members are safe and do not inadvertently
alter the normal traffic operations or patterns. At some
locations, a set of general data elements is required;
however, it is also important for the investigator to identify
unique site characteristics and acquire sufficient data that
will enable the diagnosis of problems at a road segment or
intersection. Extra data that does not directly address the
observed historic crash patterns, however, is not cost
effective or necessary. In some cases the historic crash data
may be typical for the site conditions (such as rear‐end
crashes at signalized intersection locations) and a site
investigation would potentially not be required unless crash
statistics show an unexpected trend. This chapter provides
guidance to the site investigator as to how to perform a site
investigation, document these findings, and ultimately use
this data for countermeasure evaluation. Figure 13 depicts
the basic procedure for performing site investigations.
5.1 SAFE DATA COLLECTION PROCEDURES WITHOUT
INFLUENCING OPERATIONS
A high crash location can be a challenging site for field data collection. Much of the required
data can be collected from a roadside location such as a corner parking lot or an elevated
location overlooking the site. Site investigators should minimize their exposure to active traffic.
This will help ensure their personal safety as well as limit any influence their presence may have
on active traffic.
For basic data collection, the investigator should ensure personal safety by limiting how often
he or she enters the active travel lanes. For operational studies, the influence of an investigator
in close proximity to the road may cause the driver to alter typical driving behavior. This
influence could result in incorrect measurement of typical operational characteristics.
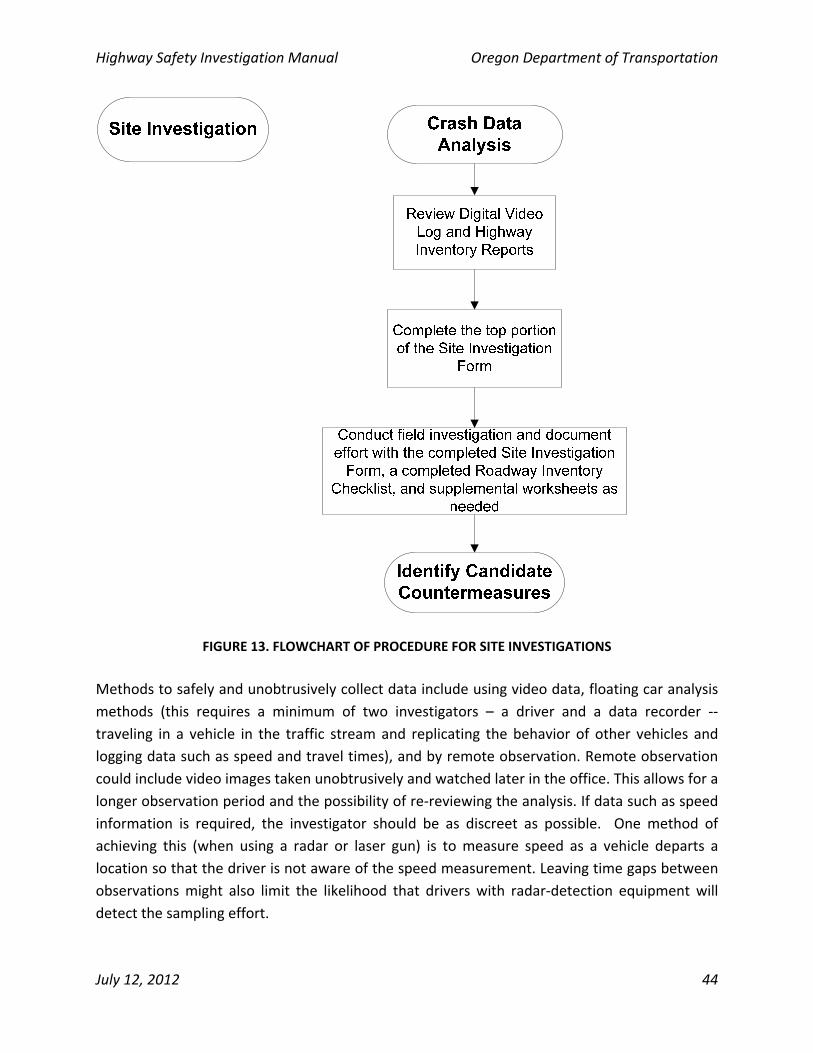
Highway Safety Investigation Manual Oregon Department of Transportation
July 12, 2012 44
FIGURE 13. FLOWCHART OF PROCEDURE FOR SITE INVESTIGATIONS
Methods to safely and unobtrusively collect data include using video data, floating car analysis
methods (this requires a minimum of two investigators – a driver and a data recorder ‐‐
traveling in a vehicle in the traffic stream and replicating the behavior of other vehicles and
logging data such as speed and travel times), and by remote observation. Remote observation
could include video images taken unobtrusively and watched later in the office. This allows for a
longer observation period and the possibility of re‐reviewing the analysis. If data such as speed
information is required, the investigator should be as discreet as possible. One method of
achieving this (when using a radar or laser gun) is to measure speed as a vehicle departs a
location so that the driver is not aware of the speed measurement. Leaving time gaps between
observations might also limit the likelihood that drivers with radar‐detection equipment will
detect the sampling effort.
Highway Safety Investigation Manual Oregon Department of Transportation
July 12, 2012 45
For some locations, it is necessary for an investigator to enter the active travel lanes to collect
distance measurements. When this is required, use a wheel measuring device and use caution
when entering the roadway.
5.2 GENERAL DATA COLLECTION
All site investigations should include collection of a basic set of information about the site. This
field data should be documented so that a record of the current conditions is available for
subsequent investigations. There are numerous site features that an investigator should
evaluate. Table 1 depicts a wide variety of site features and items available for inspection at
each site. As shown in Table 1, some site features, such as speed or visibility, may require more
extensive data collection. Upon arrival at a site, the investigator should develop a condition
diagram as reviewed in Chapter 3, Figure 8. This schematic documents road geometry
conditions, lane configurations, traffic control devices, and similar physical site characteristics.
To help investigators collect only essential data for their specific site analysis, this manual
includes data collection checklists and worksheets. For a basic site investigation, there are the
following three initial worksheets:
Site Investigation Form (see Figure 14)
Roadway Inventory Checklist (see Figure 15)
Equipment Checklist (see Figure 16)
Each of these forms fulfills a different role in initial site investigation. The Site Investigation
Form is a standard form for each investigation that summarizes the location, crash history,
observations, and recommendations. This form documents the site investigation process.
The Roadway Inventory Checklist catalogs the road features available at the specific site and
provides information that may be further used to help with unique or specialized field studies.
The site investigator should include digital photographs of the site with this form.
The final form is an Equipment Checklist so site investigators can easily verify that they have the
required data collection equipment prior to the site visit.
Full size copies of these forms are included in the Appendix.
Upon completion of the Roadway Inventory Checklist and the top portion of the Site
Investigation Form, the inspector can determine if any additional data requirements exist. The
following sections provide specific information about unique conditions or specific study types
appropriate for the site.
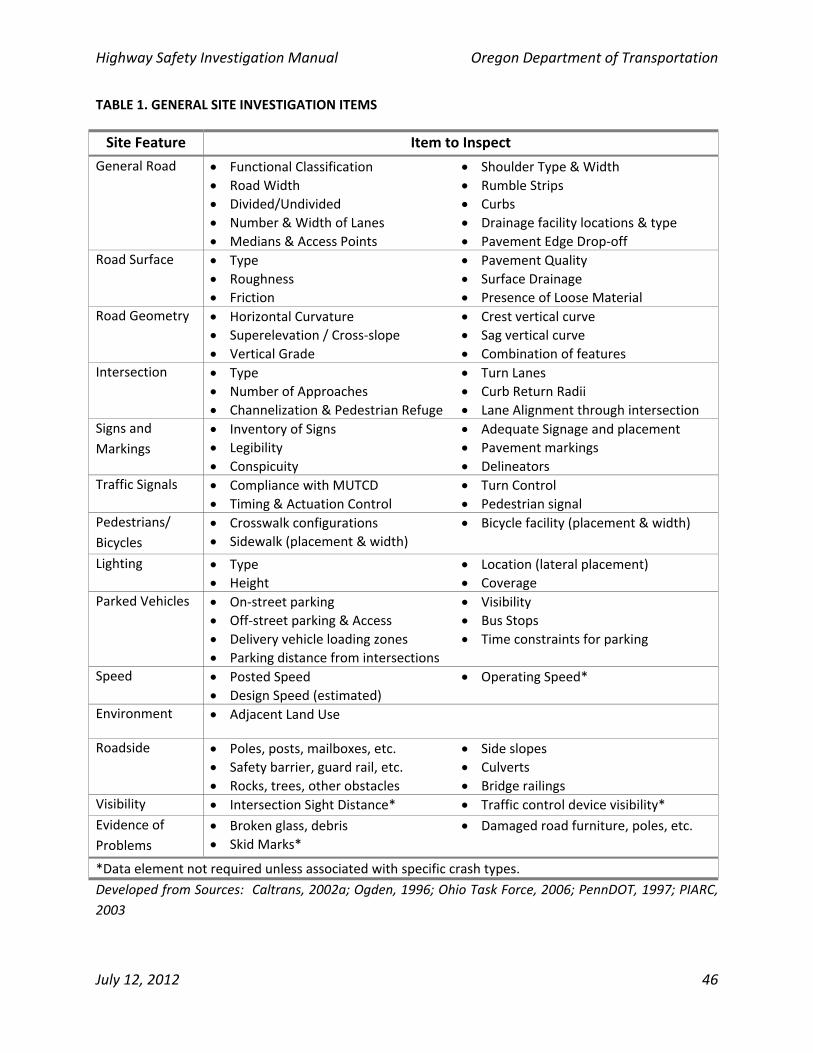
Highway Safety Investigation Manual Oregon Department of Transportation
July 12, 2012 46
TABLE 1. GENERAL SITE INVESTIGATION ITEMS
Site Feature Item to Inspect
General Road Functional Classification
Road Width
Divided/Undivided
Number & Width of Lanes
Medians & Access Points
Shoulder Type & Width
Rumble Strips
Curbs
Drainage facility locations & type
Pavement Edge Drop‐off Road Surface Type
Roughness
Friction
Pavement Quality
Surface Drainage
Presence of Loose Material Road Geometry Horizontal Curvature
Superelevation / Cross‐slope
Vertical Grade
Crest vertical curve
Sag vertical curve
Combination of features Intersection Type
Number of Approaches
Channelization & Pedestrian Refuge
Turn Lanes
Curb Return Radii
Lane Alignment through intersection Signs and
Markings
Inventory of Signs
Legibility
Conspicuity
Adequate Signage and placement
Pavement markings
Delineators Traffic Signals Compliance with MUTCD
Timing & Actuation Control
Turn Control
Pedestrian signal Pedestrians/
Bicycles
Crosswalk configurations
Sidewalk (placement & width)
Bicycle facility (placement & width)
Lighting Type
Height
Location (lateral placement)
Coverage Parked Vehicles On‐street parking
Off‐street parking & Access
Delivery vehicle loading zones
Parking distance from intersections
Visibility
Bus Stops
Time constraints for parking
Speed Posted Speed
Design Speed (estimated)
Operating Speed*
Environment Adjacent Land Use
Roadside Poles, posts, mailboxes, etc.
Safety barrier, guard rail, etc.
Rocks, trees, other obstacles
Side slopes
Culverts
Bridge railings Visibility Intersection Sight Distance* Traffic control device visibility*
Evidence of
Problems
Broken glass, debris
Skid Marks*
Damaged road furniture, poles, etc.
*Data element not required unless associated with specific crash types.
Developed from Sources: Caltrans, 2002a; Ogden, 1996; Ohio Task Force, 2006; PennDOT, 1997; PIARC,
2003
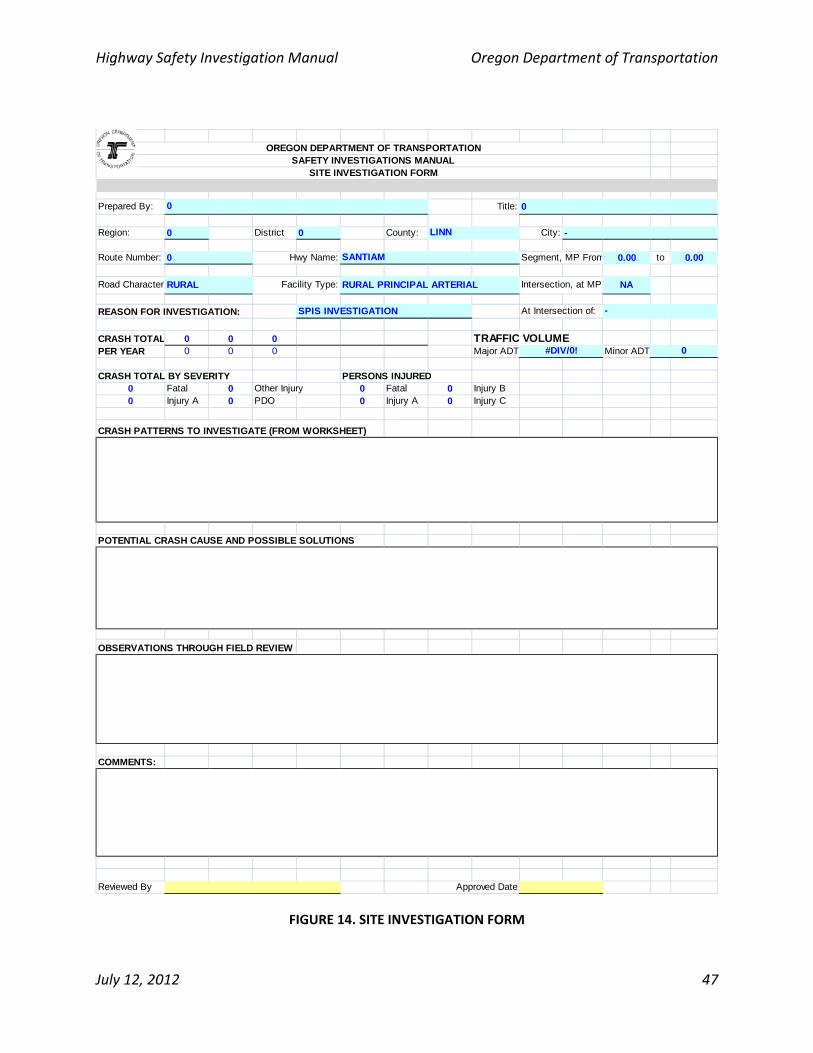
Highway Safety Investigation Manual Oregon Department of Transportation
July 12, 2012 47
Prepared By: Title: 0
Region: 0 District 0 County: City: -
Route Number: 0 Hwy Name: Segment, MP From 0.00 to 0.00
Road Character Facility Type: Intersection, at MP NA
REASON FOR INVESTIGATION: SPIS INVESTIGATION At Intersection of:
CRASH TOTAL 0 0 0 TRAFFIC VOLUMEPER YEAR 0 0 0 Major ADT Minor ADT
CRASH TOTAL BY SEVERITY PERSONS INJURED0 Fatal 0 Other Injury 0 Fatal 0 Injury B0 Injury A 0 PDO 0 Injury A 0 Injury C
CRASH PATTERNS TO INVESTIGATE (FROM WORKSHEET)
POTENTIAL CRASH CAUSE AND POSSIBLE SOLUTIONS
OBSERVATIONS THROUGH FIELD REVIEW
COMMENTS:
Reviewed By Approved Date
0
-
#DIV/0! 0
OREGON DEPARTMENT OF TRANSPORTATIONSAFETY INVESTIGATIONS MANUAL
SITE INVESTIGATION FORM
RURAL RURAL PRINCIPAL ARTERIAL
LINN
SANTIAM
FIGURE 14. SITE INVESTIGATION FORM
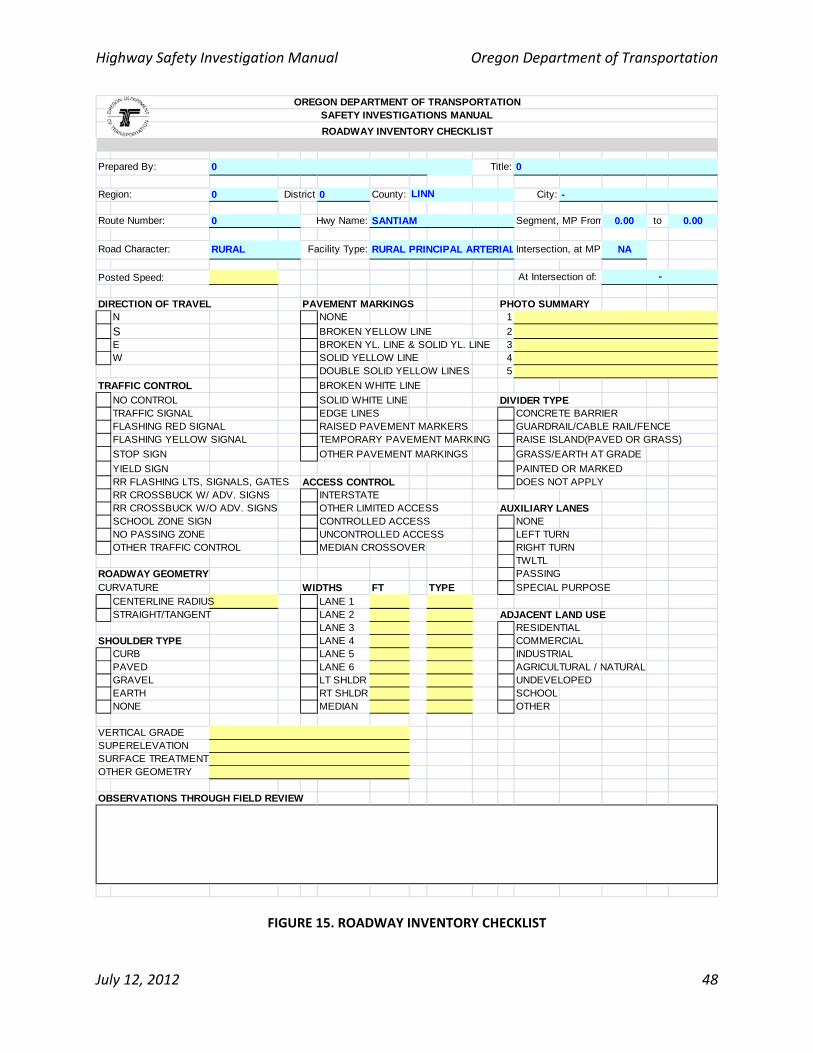
Highway Safety Investigation Manual Oregon Department of Transportation
July 12, 2012 48
Prepared By: 0 Title: 0
Region: 0 District 0 County: City: -
Route Number: 0 Hwy Name: SANTIAM Segment, MP From 0.00 to 0.00
Road Character: RURAL Facility Type: RURAL PRINCIPAL ARTERIALIntersection, at MP NA
Posted Speed: At Intersection of:
DIRECTION OF TRAVEL PAVEMENT MARKINGS PHOTO SUMMARYN NONE 1
S BROKEN YELLOW LINE 2E BROKEN YL. LINE & SOLID YL. LINE 3W SOLID YELLOW LINE 4
DOUBLE SOLID YELLOW LINES 5
TRAFFIC CONTROL BROKEN WHITE LINE
NO CONTROL SOLID WHITE LINE DIVIDER TYPETRAFFIC SIGNAL EDGE LINES CONCRETE BARRIERFLASHING RED SIGNAL RAISED PAVEMENT MARKERS GUARDRAIL/CABLE RAIL/FENCEFLASHING YELLOW SIGNAL TEMPORARY PAVEMENT MARKING RAISE ISLAND(PAVED OR GRASS)
STOP SIGN OTHER PAVEMENT MARKINGS GRASS/EARTH AT GRADE
YIELD SIGN PAINTED OR MARKEDRR FLASHING LTS, SIGNALS, GATES ACCESS CONTROL DOES NOT APPLYRR CROSSBUCK W/ ADV. SIGNS INTERSTATERR CROSSBUCK W/O ADV. SIGNS OTHER LIMITED ACCESS AUXILIARY LANESSCHOOL ZONE SIGN CONTROLLED ACCESS NONENO PASSING ZONE UNCONTROLLED ACCESS LEFT TURNOTHER TRAFFIC CONTROL MEDIAN CROSSOVER RIGHT TURN
TWLTLROADWAY GEOMETRY PASSINGCURVATURE WIDTHS FT TYPE SPECIAL PURPOSE
CENTERLINE RADIUS LANE 1STRAIGHT/TANGENT LANE 2 ADJACENT LAND USE
LANE 3 RESIDENTIALSHOULDER TYPE LANE 4 COMMERCIAL
CURB LANE 5 INDUSTRIALPAVED LANE 6 AGRICULTURAL / NATURALGRAVEL LT SHLDR UNDEVELOPEDEARTH RT SHLDR SCHOOLNONE MEDIAN OTHER
VERTICAL GRADESUPERELEVATIONSURFACE TREATMENTOTHER GEOMETRY
OBSERVATIONS THROUGH FIELD REVIEW
SAFETY INVESTIGATIONS MANUAL
-
LINN
OREGON DEPARTMENT OF TRANSPORTATION
ROADWAY INVENTORY CHECKLIST
FIGURE 15. ROADWAY INVENTORY CHECKLIST
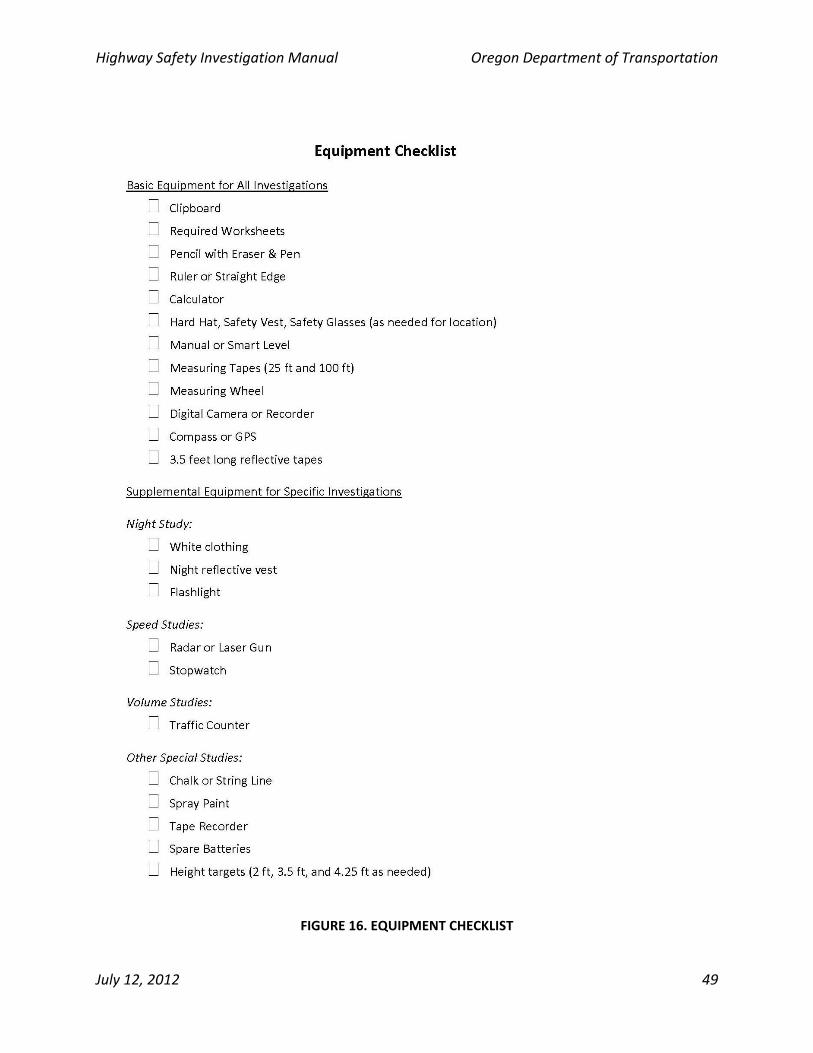
Highway Safety Investigation Manual Oregon Department of Transportation
July 12, 2012 49
FIGURE 16. EQUIPMENT CHECKLIST
Highway Safety Investigation Manual Oregon Department of Transportation
July 12, 2012 50
5.3 IDENTIFYING UNIQUE SITE FEATURES THAT INFLUENCE APPROPRIATE STUDY TYPES
The successful execution of a site investigation may require the investigator to identify unique
features or specific site influences at or near a high crash location. These features or influences
may, in some way, contribute to increased safety concerns. Examples of unique conditions
could include schools, high pedestrian businesses, or railroad crossings. Table 2 depicts some
common site‐specific studies that may be appropriate at study locations. Prior to visiting the
site, the investigator should attempt to identify any unique site influences. Many of these
conditions are apparent based on crash history information and aerial photography (acquired
during the office analysis phase of review). Once the investigator has evaluated potential site
conditions and identified supplemental field studies that may be needed, he or she will be
equipped with the necessary data collection information prior to visiting the site.
TABLE 2. COMMON FIELD STUDIES FOR UNIQUE SITE OR OPERATIONAL CONDITIONS
Study Type Summary of Study
General Studies Roadway Inventory Survey of the roadway physical features. Recommended for use in all
situations. Bicycle Investigates bicycle facility sight distances, traffic control devices, physical
dimensions, capacity, speeds, and volumes to assess level of safety. Pedestrian Uses pedestrian traffic control devices, physical dimensions, pedestrian
volumes, crossing delays, traffic control devices, and pedestrian related conflicts to assess level of safety.
Highway Lighting Identifies inconsistencies between the site and lighting design standards. Use when crash statistics identify darkness or nighttime as a contributor.
Sight Distance Assesses available sight distance at the location. Unique Site‐Specific Studies
School Crossing Uses pedestrian road crossing widths, traffic control device information, pedestrian volumes and delays to assess the safety of facilities surrounding schools. Accounts for level of understanding experienced by students.
Railroad Crossing Assesses safety of at‐grade crossings. Operational Studies
Traffic Control Device Uses signal warrant studies, stop‐yield sign studies, and law observance studies to assess safety of current and potential traffic control devices.
Volume For intersections, evaluate entering traffic volume, turning movement, pedestrian movement, and lane distribution information during the peak and non‐peak periods. For roadway segments, perform directional counts along with an analysis of vehicle classification.
Highway Safety Investigation Manual Oregon Department of Transportation
July 12, 2012 51
Study Type Summary of Study
Speed Analyze available sight distance at intersection approaches to determine the safe entering speed. Comparing these values with the location’s speed limits or the 85th percentile speed to determine current speed distributions. Speed studies particularly useful when high speeds or speed differentials may be contributors to crash statistics.
Travel Time and Delay
Estimate required time for traversing roadway segments and any encountered delays such as traffic signals. Use when congestion is a possible contributor to crash statistics.
Roadway and Intersection Capacity
Estimates the location’s ability to handle current or future traffic demands. Use when congestion is a possible contributor to crash statistics.
Conflict Studies Conflict analysis highlights evasive maneuvers taken by drivers at the site to avoid potential collisions. The number and types of evasive actions experienced may help provide insights into crash conditions and expected frequency. One common method for performing conflict studies is to video tape the road user interactions for later evaluation if needed.
Gap Studies Measures gaps between successive vehicles. Use to evaluate traffic mergers.
Traffic Lane Occupancy
Uses vehicle lengths, volumes, and speeds to evaluate facility operations. Use when congestion is a possible contributor to crash statistics.
Queue Length Measure of intersection approach performance. Use when congestion is a possible contributor to crash statistics
Road Surface, Environment, or Weather‐Related Studies
Roadway Serviceability
Evaluates pavement surface at site.
Skid Resistance Uses ASTM standards to determine whether sufficient traction is provided between road surface and tires. Use when crash statistics identify wet‐weather as a contributor.
Weather Related Checks for increased hazard during specific weather conditions. Examples are fog or ice.
Developed from Source: Caltrans, 2002a; FHWA, 1981; Graham & Glennon, 1975; Kilareski, et al., 1996;
PIARC, 2003; Wilson, 2003
5.4 IDENTIFYING APPROPRIATE FIELD STUDIES SPECIFIC TO CRASH PATTERNS
As demonstrated in Table 2, there are a wide variety of potential field studies that an
investigator may elect to perform at a given site. Supplemental information is helpful to select
appropriate study types. Selection of the applicable field studies can largely be determined
prior to the site visit. The investigation and diagnosis of crash patterns can be divided into the
four general categories:
Intersection Crashes (see Table 3),
Mid‐Block Crashes (see Table 4),
Fixed‐Object and Run‐off‐Road Crashes (see Table 5), and
Highway Safety Investigation Manual Oregon Department of Transportation
July 12, 2012 52
Environmental Condition‐Related Crashes (see Table 6).
Many of the candidate traffic studies can be performed using common sense, practical
experience, and standard traffic engineering studies from texts such as ITE’s Manual of
Transportation Engineering Studies. To successfully identify the applicable field studies, the
investigator should have some reasonable expectations about the probable cause of crash
patterns. For example, if a site has a disproportionate percent of a crash type at an
intersection, the investigator can refer to Table 3 to review the crash pattern, identify a
probable cause, determine what to document, and identify some general countermeasures that
may help to reduce crashes.
5.5 PERFORMING DATA COLLECTION FOR SPECIFIC FIELD STUDIES
Many data collection methods for site investigation are well documented and readily available
in current ODOT publications. For example, the Speed Zone Investigation Manual addresses
how to perform speed studies. As a result, this manual does not include detailed worksheets
for the majority of field studies; however, there are some unique situations that merit
investigation, but do not have readily available worksheets. One such unique condition is a
field evaluation of available intersection sight distance. This manual includes a set of
worksheets for assessment of this intersection sight distance condition. These intersection sight
distance worksheets apply only to intersection locations and should not be used for the
evaluation of sight distance at driveway locations. If an investigator suspects that a driveway
has poor sight distance, he or she should contact the Access Management Unit (AMU).
Appendix A of this manual includes the Intersection Sight Distance worksheet instructions,
example problems and forms. Appendix B contains additional forms developed for general
office and field assessments. Appendix C includes two case studies that demonstrate use of the
spreadsheet evaluation forms for performing an investigation and assessment of candidate
sites.
Highway Safety Investigation Manual Oregon Department of Transportation
July 12, 2012 53
TABLE 3. INVESTIGATION AND DIAGNOSIS FOR INTERSECTION CRASHES
Crash Pattern Probable Cause What to Document General Countermeasures
Right‐angle collisions at unsignalized intersections
Restricted sight distance
Large total intersection volume
High approach speed
Sun glare issues
Sight obstructions
Parking at corners
Visibility and placement of stop/yield signs
Visibility and placement of advanced warning signs
Lighting
Peak hour, 4‐hour, and 8‐hour traffic volumes
Pedestrian volumes
Upstream operating speeds for high‐speed approaches
Orientation to sunrise and sunset
Remove sight obstructions
Restrict parking near corners
Install stop signs or oversize and dual signs (if present already)
Install warning signs
Provide markings to supplement signs
Install hazard beacons
Install/improve street lighting
Reduce speed limit on approaches
Install signals
Install yield signs
Channelize intersection
Install signals
Re‐route through traffic
Reduce speed limit on approaches
Install rumble strips (non‐urban locations)
Highway Safety Investigation Manual Oregon Department of Transportation
July 12, 2012 54
Crash Pattern Probable Cause What to Document General Countermeasures
Right‐angle collisions at signalized intersections
Poor visibility of signals
Signal timing
Location and visibility of signal heads
Location and visibility of advanced warning signs
Signal timing and operating sequence
Install advanced warning devices
Install 12‐inch signal lenses
Install overhead signals
Install visors
Install back plates
Improve location of signal heads
Add additional signal heads
Reduce speed limit on approaches
Adjust/Extend amber or all‐red
Provide all‐red clearance phases
Add multi‐dial controller
Re‐time signals
Provide signalized progression
Install signal actuation
Provide protective movement phases
Check equipment malfunction Rear‐end collisions at unsignalized intersections
Pedestrian crossing
Driver not aware of intersection
Large volume of turning vehicles
Poor visibility
Location and visibility of crosswalks and stop bars
Location and visibility of stop/yield signs
Location and visibility of advance warning signs
Sight distance obstructions
Peak hour, 4‐hour, and 8‐hour traffic volumes
Pedestrian volumes
Upstream operating speeds for high‐speed approaches
Sight distance obstructions
Conspicuity of pavement marking and signs
Install/improve signing or marking of pedestrian crosswalks
Reduce number of crosswalks
Relocate crosswalk
Install/improve standard & advance warning signs
Reduce speed limit on approaches
Install hazard beacons
Create left‐ or right‐turn lanes
Prohibit turns
Increase curb radii
Remove sight obstructions
Prohibit parking
Review striping needs
Highway Safety Investigation Manual Oregon Department of Transportation
July 12, 2012 55
Crash Pattern Probable Cause What to Document General Countermeasures
Rear‐end collisions at signalized intersections
Poor visibility of signals
Signal timing
Pedestrian crossings
Unwarranted signals
Large volume of traffic or turning volumes
Location and visibility of signal heads
Location and visibility of advance warning signs
Signal timing and operating sequence
Location and visibility of crosswalks and stop bars
Peak hour, 4‐hour, and 8‐hour traffic volumes
Pedestrian volumes
Curb return geometry
Install/improve advance warning devices
Install overhead signals
Install 12‐inch signal lenses
Install back plates or visors
Relocate signals or signal heads
Add additional signal heads
Lengthen mast arms
Remove sight obstructions
Reduce speed limits on approaches
Adjust/Extend amber or all‐red phase
Provide progression through a set of signalized intersections (coordination)
Signal/loop malfunction
Need additional loops
Revise red/green timing
Install/improve signing or marking of pedestrian crosswalks
Reduce number of crosswalks
Provide pedestrian “WALK” phase
Create left‐ or right‐turn lanes
Prohibit turns
Add left turn phase
Increase curb radii
Remove signals
Highway Safety Investigation Manual Oregon Department of Transportation
July 12, 2012 56
Crash Pattern Probable Cause What to Document General Countermeasures
Left‐turn collisions at intersections
Large volume of traffic
or left turns
Restricted sight
distance
Number of lanes / lane width / lane
usage
Traffic signal timing and operating
sequence
Location and visibility of signs related
to lane usage or turning movements
Sight distance obstructions
Provide left‐turn signal phases
Prohibit left turns
Increase/add left turn lane and provide
left‐turn signal if warranted
Re‐route left‐turn traffic
Provide adequate channelization
Create one‐way streets
Install “STOP” signs
Adjust signal timing or install traffic signal
Improve approach visibility
Widen road
Adjust/Extend amber or all‐red
Prohibit parking
Reduce number of pedestrian crossings
Remove obstacles
Install warning signs
Reduce speed limit on approaches
Right‐turn collisions at
intersections
Short turning radii
Signal timing
Poor visibility
Number of lanes / lane width / lane
usage
Traffic signal timing and operating
sequence
Location and visibility of signs related
to lane usage or turning movements
Sight distance obstructions
Increase curb radii
Adjust signal timing or install traffic signal
Improve approach visibility
Widen road
Adjust/Extend amber or all‐red
Restrict right‐turn on red
Highway Safety Investigation Manual Oregon Department of Transportation
July 12, 2012 57
Crash Pattern Probable Cause What to Document General Countermeasures
Sideswipe collisions at
intersections
Roadway design
inadequate
Poor visibility
Number of lanes / lane widths / lane
usage
Location / description / measurement
of median
Shoulder type / width and condition
Location and visibility of advance
warning signs
Roadway type and condition
Improve pavement marking
Increase curb radii
Remove on‐street parking near
intersection
Install / Improve directional signing
Restrict driveway access near
intersection
Pedestrian crashes at intersections
Restricted sight
distance
Inadequate protection
for pedestrians
Inadequate signals
Improper signal phasing
Uncontrolled school
crossing area
Number of lanes, lane widths, lane
usage
Right turn on red
Sight distance obstructions
Location and operation of pedestrian
push buttons
Locations and measurements of
pedestrian refuge islands
Signal timing and sequence‐exclusive
pedestrian phase
Remove sight obstructions
Install pedestrian crossings
Improve/install pedestrian crossing signs
Restrict parking
Re‐route pedestrian paths
Add pedestrian refuge islands
Install pedestrian signals
Add pedestrian “WALK” phase
Change timing of pedestrian phase
Use school crossing guards
Collisions at railroad
crossings
Restricted sight
distance
Sight distance obstructions
Measure profile grade
Crossing hardware
Remove sight obstructions
Reduce grades
Install train actuated signals
Install stop signs
Install bus lanes
Install gates
Install advance warning signs
Developed from sources: Caltrans, 2002b; New York, 2000; Ohio, 2006; PennDOT, 1997; Wilson, 2003; ODOT Interviews.
Highway Safety Investigation Manual Oregon Department of Transportation
July 12, 2012 58
TABLE 4. INVESTIGATION AND DIAGNOSIS FOR MID‐BLOCK CRASHES
Crash Pattern Probable Cause What to Document General Countermeasures
Sideswipe collisions between vehicles traveling in opposite directions or head‐on collisions
Roadway design for traffic conditions
Insufficient passing zones
Two‐way left‐turn lanes
Number of lanes / lane widths / lane usage
Location / description / measurement of median
Shoulder type / width and condition
Location and visibility of advance warning signs
Roadway type and condition
Install/improve pavement markings
Channelize intersections
Create one‐way streets
Restrict parking
Install median divider / barrier
Widen lanes
Collisions between vehicles traveling in same direction such as sideswipes, turning or lane changing
Roadway design for traffic conditions
Insufficient passing zones
Passing on shoulders
Location and description of traffic islands
Pavement widths
Lane widths
Widen lanes
Channelize intersections
Add capacity (other program)
Right/left turn lane
Provide turning bays
Install advance route or street signs
Install/improve pavement lane lines
Restrict parking
Reduce speed limit Collisions with parked cars or cars being parked
Large parking turnovers
Roadway design inadequate for present conditions
Number of lanes / lane widths / lane usage
Parking configuration type
Prohibit parking or move off‐street
Change from angle to parallel parking
Re‐route through traffic
Create one‐way streets
Reduce speed limit
Widen lanes
Add back‐in angle parking
Highway Safety Investigation Manual Oregon Department of Transportation
July 12, 2012 59
Crash Pattern Probable Cause What to Document General Countermeasures
Collisions at driveways
Left‐turning vehicles
Right‐turning vehicles
Large volume of through traffic
Large volume of driveway traffic
Restricted sight distance
Number of lanes / lane widths / lane usage
Location and measurement of median openings
Location and description of driveway width and geometry, surface type, condition of driveway
Shoulder type, width and condition
Location and visibility of advance warning signs
Sight distance obstructions
Lighting
Confirm the driveway is an ODOT permitted driveway
Install raised median to limit access
Prohibit left‐turns
Install two‐way left turn
Provide right‐turn lanes
Restrict parking near driveways
Increase the width of the driveway
Widen through lanes
Increase curb radii
Provide acceleration or deceleration lanes
Move driveway to side street
Combine driveways where applicable
Construct a local service road
Re‐route through traffic
Add traffic signal
Signalize or channelize driveway
Remove sight obstructions
Install/improve street lighting
Reduce speed limit
Install hazard beacons Pedestrian crashes between intersections
Driver has inadequate warning of frequent mid‐block crossings
Pedestrians on roadway
Long distance to nearest crosswalk
Location and visibility of mid‐block crosswalks
Location and visibility of advance warning signs
Sight distance obstructions
Lighting
Shoulder type / width / condition
Presence and location of sidewalks
Prohibit parking
Install warning signs
Lower speed limit
Install pedestrian barriers in the median
Install sidewalks
Install pedestrian crosswalk
Install pedestrian actuated signals
Pedestrian crashes at driveway crossings
Sidewalk too close to travelway
Lane widths, curb width, landscape buffer width, and sidewalk width
On‐street parking
Move sidewalk laterally away from road
Restrict parking
Developed from sources: Caltrans, 2002b; New York, 2000; Ohio, 2006; PennDOT, 1997; Wilson, 2003; ODOT Interviews.
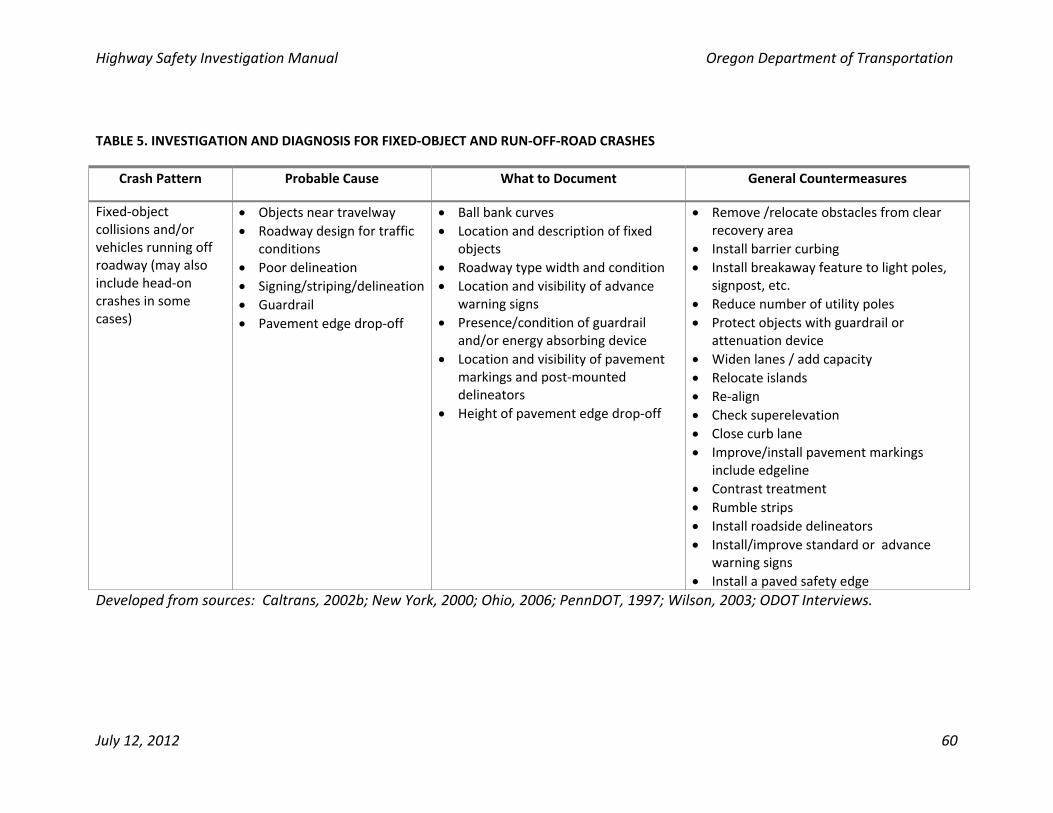
Highway Safety Investigation Manual Oregon Department of Transportation
July 12, 2012 60
TABLE 5. INVESTIGATION AND DIAGNOSIS FOR FIXED‐OBJECT AND RUN‐OFF‐ROAD CRASHES
Crash Pattern Probable Cause What to Document General Countermeasures
Fixed‐object collisions and/or vehicles running off roadway (may also include head‐on crashes in some cases)
Objects near travelway
Roadway design for traffic conditions
Poor delineation
Signing/striping/delineation
Guardrail
Pavement edge drop‐off
Ball bank curves
Location and description of fixed objects
Roadway type width and condition
Location and visibility of advance warning signs
Presence/condition of guardrail and/or energy absorbing device
Location and visibility of pavement markings and post‐mounted delineators
Height of pavement edge drop‐off
Remove /relocate obstacles from clear recovery area
Install barrier curbing
Install breakaway feature to light poles, signpost, etc.
Reduce number of utility poles
Protect objects with guardrail or attenuation device
Widen lanes / add capacity
Relocate islands
Re‐align
Check superelevation
Close curb lane
Improve/install pavement markings include edgeline
Contrast treatment
Rumble strips
Install roadside delineators
Install/improve standard or advance warning signs
Install a paved safety edge
Developed from sources: Caltrans, 2002b; New York, 2000; Ohio, 2006; PennDOT, 1997; Wilson, 2003; ODOT Interviews.
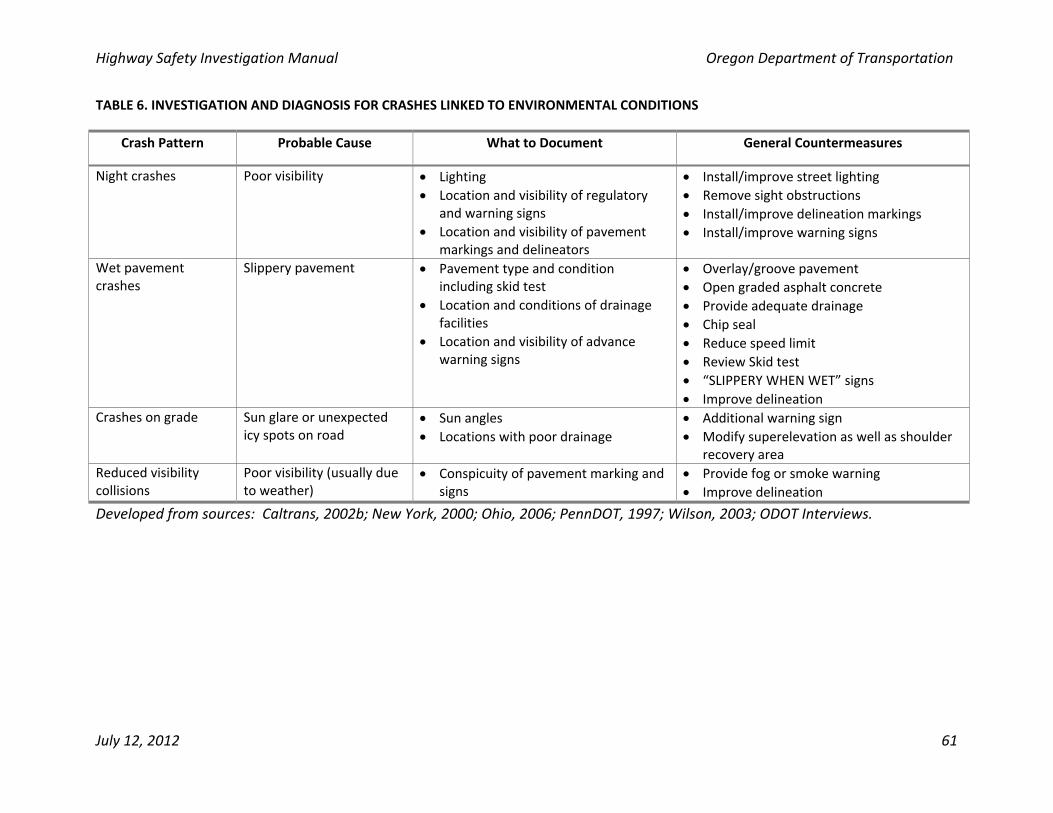
Highway Safety Investigation Manual Oregon Department of Transportation
July 12, 2012 61
TABLE 6. INVESTIGATION AND DIAGNOSIS FOR CRASHES LINKED TO ENVIRONMENTAL CONDITIONS
Crash Pattern Probable Cause What to Document General Countermeasures
Night crashes
Poor visibility
Lighting
Location and visibility of regulatory and warning signs
Location and visibility of pavement markings and delineators
Install/improve street lighting
Remove sight obstructions
Install/improve delineation markings
Install/improve warning signs
Wet pavement crashes
Slippery pavement
Pavement type and condition including skid test
Location and conditions of drainage facilities
Location and visibility of advance warning signs
Overlay/groove pavement
Open graded asphalt concrete
Provide adequate drainage
Chip seal
Reduce speed limit
Review Skid test
“SLIPPERY WHEN WET” signs
Improve delineation Crashes on grade Sun glare or unexpected
icy spots on road Sun angles
Locations with poor drainage
Additional warning sign
Modify superelevation as well as shoulder recovery area
Reduced visibility collisions
Poor visibility (usually due to weather)
Conspicuity of pavement marking and signs
Provide fog or smoke warning
Improve delineation
Developed from sources: Caltrans, 2002b; New York, 2000; Ohio, 2006; PennDOT, 1997; Wilson, 2003; ODOT Interviews.

Highway Safety Investigation Manual Oregon Department of Transportation
July 12, 2012 62
Page Intentionally Blank
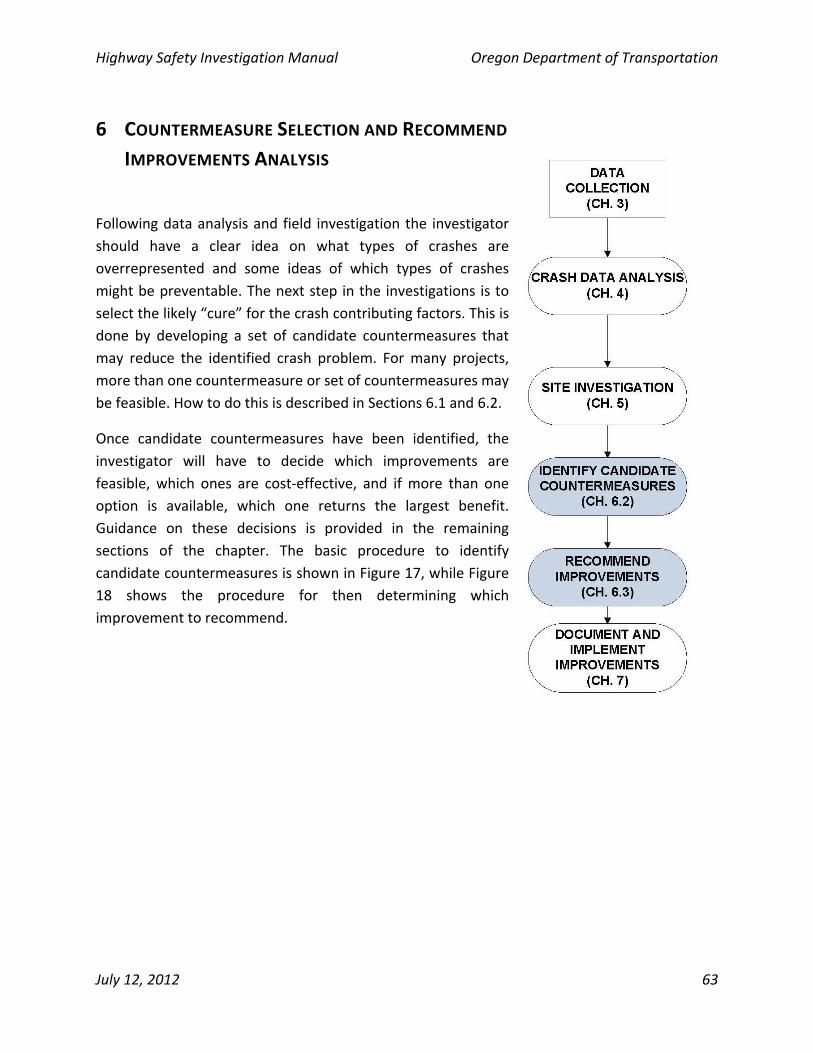
Highway Safety Investigation Manual Oregon Department of Transportation
July 12, 2012 63
6 COUNTERMEASURE SELECTION AND RECOMMEND
IMPROVEMENTS ANALYSIS
Following data analysis and field investigation the investigator
should have a clear idea on what types of crashes are
overrepresented and some ideas of which types of crashes
might be preventable. The next step in the investigations is to
select the likely “cure” for the crash contributing factors. This is
done by developing a set of candidate countermeasures that
may reduce the identified crash problem. For many projects,
more than one countermeasure or set of countermeasures may
be feasible. How to do this is described in Sections 6.1 and 6.2.
Once candidate countermeasures have been identified, the
investigator will have to decide which improvements are
feasible, which ones are cost‐effective, and if more than one
option is available, which one returns the largest benefit.
Guidance on these decisions is provided in the remaining
sections of the chapter. The basic procedure to identify
candidate countermeasures is shown in Figure 17, while Figure
18 shows the procedure for then determining which
improvement to recommend.
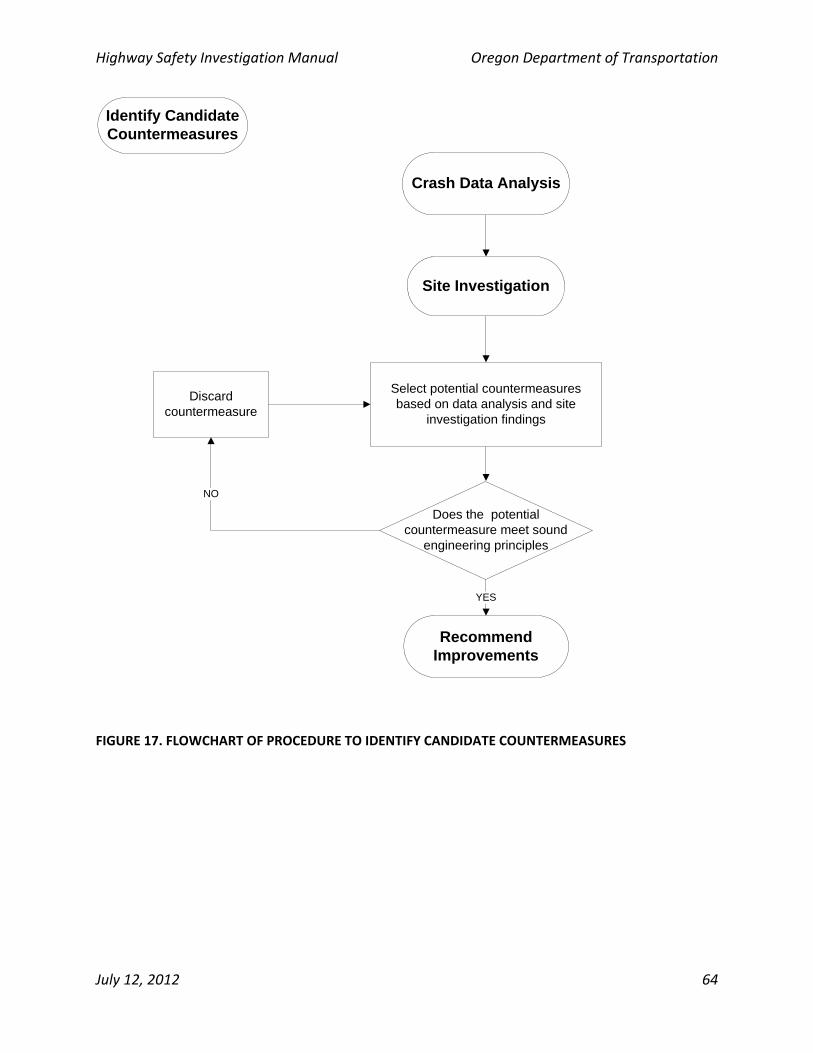
Highway Safety Investigation Manual Oregon Department of Transportation
July 12, 2012 64
Select potential countermeasures based on data analysis and site
investigation findings
Does the potential countermeasure meet sound
engineering principles
YES
NO
Discard countermeasure
Crash Data Analysis
Site Investigation
Recommend Improvements
Identify Candidate Countermeasures
FIGURE 17. FLOWCHART OF PROCEDURE TO IDENTIFY CANDIDATE COUNTERMEASURES
Highway Safety Investigation Manual Oregon Department of Transportation
July 12, 2012 65
FIGURE 18. FLOWCHART OF PROCEDURE TO RECOMMEND IMPROVEMENTS
6.1 PRINCIPLES OF COUNTERMEASURE SELECTION
A “countermeasure” can be defined as a modification, improvement, or action designed to
reduce crash frequency or severity. In the context of this manual, a countermeasure generally
refers to an engineering or operational improvement but there can also be educational,
enforcement, or emergency service related countermeasures.
A good countermeasure should reduce either the frequency or severity of dominant crash
types. The implemented countermeasure should not have any significant undesirable
consequences in traffic efficiency or environmental terms, though tradeoffs between safety and
other competing decision elements should be expected. The countermeasure should be cost‐
effective under most circumstances.
Highway Safety Investigation Manual Oregon Department of Transportation
July 12, 2012 66
All countermeasures should be based on sound engineering judgment and should conform to
applicable ODOT and FHWA policies and procedures.
6.2 IDENTIFY CANDIDATE COUNTERMEASURES
There are a growing number of very useful resources for the investigator to obtain
countermeasures and identify their expected effectiveness. For most investigations, the
investigator should use the FHWA’s Crash Modification Factor Clearinghouse located at the
following address:
http://cmfclearinghouse.org
The crash modification factor (CMF) is a multiplicative value that estimates the safety influence
of a specific countermeasure. Before using a CMF, the analyst should determine the base
conditions of the CMF and should only use a CMF for evaluation of similar base conditions. For
example, base conditions for a CMF where the countermeasure considers adding street lights
to a road segment may be based on locations without any available street lights. If the site
evaluated is a location that does have street lights but their spacing or intensity is in question,
the CMF with the “no lights” base condition could not be used for this assessment. CMF quality
can also vary. The FHWA web site uses a star rating system where more stars indicate a more
reliable CMF.
The identification of potential countermeasures involves mapping the correctable crash type to
a possible countermeasure. For example, if rear‐end crashes on a rural highway near an
intersection were identified as the correctable crash type, the investigator would need to
identify a countermeasure that might reduce these crash types.
This “mapping” can be done in a number of ways. There are published checklists or summary
tables that identify candidate countermeasures based on crash patterns and probable causes
[see Table 3, Table 4, Table 5, and Table 6 in Chapter 5].
Highway Safety Investigation Manual Oregon Department of Transportation
July 12, 2012 67
FIGURE 19. SCREEN CAPTURE OF FHWA CMF CLEARING HOUSE
There are other resources which may prove helpful, especially as additional countermeasures
are populated with crash modification or crash reduction factors:
Desktop Reference for Crash Reduction Factors, Publication No. FHWA‐SA‐07‐015
Highway Safety Manual, Part 4: Knowledge
NCHRP’s 500 Series
AASHTO’s Strategic Highway Safety Plan Guidebooks
For bicycle and pedestrian crashes there are two interactive tools developed by FHWA that
might prove useful (though there is limited information on percent effectiveness):
BIKESAFE: http://www.pedbikesafe.org/bikesafe/
Highway Safety Investigation Manual Oregon Department of Transportation
July 12, 2012 68
PEDSAFE: http://www.pedbikesafe.org/pedsafe/
6.2.1 EXPECTED EFFECTIVENESS OF COUNTERMEASURES
For each countermeasure, the most important information is the expected effectiveness (How
well will the countermeasure work?). The estimated reduction is key to estimating the cost‐effectiveness of countermeasure and severity trade‐offs. There are currently two common
terminologies:
Crash (accident) Modification Factor (CMF)
o A multiplicative factor representing the fraction of the total crashes expected
after the countermeasure
Crash (accident) reduction factor or CRF
o a percent reduction in the “before” crashes after implementing the
countermeasure
Currently, the Oregon DOT resources and terminology use “CRF” while the 2010 AASHTO
Highway Safety Manual uses the CMF terminology. In most cases, the values are
interchangeable using this simple conversion: CRF = (1‐CMF).
When multiple countermeasures are applied to a location, a simple formula is used to calculate
a composite CRF. This formula is given as
CRF = CRF1 +(1‐CRF1)CRF2+[(1‐CRF1)(1‐CRF2)CRF3…]
However, this formula is not based on a known interaction between CRFs and should be used
with caution. While mathematically an infinite number of CRFs could be applied to achieve a
total 100% reduction, as a practical matter, the investigator should use this formula sparingly.
In fact, most investigations will reveal one or at most 2 complementary countermeasures. The
order of the CRFs does not matter in the formula.
A composite CMF is not needed. CMFs can be multiplied together to determine a composite
effectiveness.
Example:
A location has 14 crashes per year. Two countermeasures have been selected with a CRF1 =
10%, CRF2 = 30% (or CMF1 = 0.90 and CMF2 = 0.70)
a) How many crashes were reduced?
b) How many crashes will occur per year after the countermeasure?
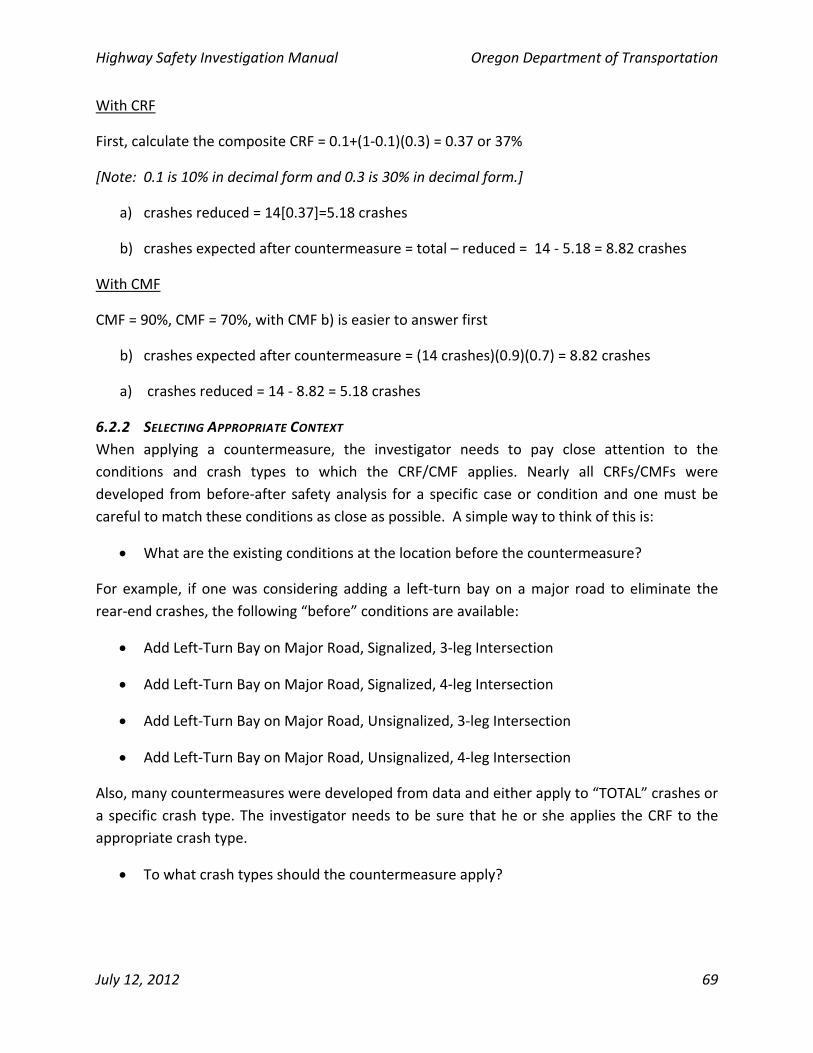
Highway Safety Investigation Manual Oregon Department of Transportation
July 12, 2012 69
With CRF
First, calculate the composite CRF = 0.1+(1‐0.1)(0.3) = 0.37 or 37%
[Note: 0.1 is 10% in decimal form and 0.3 is 30% in decimal form.]
a) crashes reduced = 14[0.37]=5.18 crashes
b) crashes expected after countermeasure = total – reduced = 14 ‐ 5.18 = 8.82 crashes
With CMF
CMF = 90%, CMF = 70%, with CMF b) is easier to answer first
b) crashes expected after countermeasure = (14 crashes)(0.9)(0.7) = 8.82 crashes
a) crashes reduced = 14 ‐ 8.82 = 5.18 crashes
6.2.2 SELECTING APPROPRIATE CONTEXT
When applying a countermeasure, the investigator needs to pay close attention to the
conditions and crash types to which the CRF/CMF applies. Nearly all CRFs/CMFs were
developed from before‐after safety analysis for a specific case or condition and one must be
careful to match these conditions as close as possible. A simple way to think of this is:
What are the existing conditions at the location before the countermeasure?
For example, if one was considering adding a left‐turn bay on a major road to eliminate the
rear‐end crashes, the following “before” conditions are available:
Add Left‐Turn Bay on Major Road, Signalized, 3‐leg Intersection
Add Left‐Turn Bay on Major Road, Signalized, 4‐leg Intersection
Add Left‐Turn Bay on Major Road, Unsignalized, 3‐leg Intersection
Add Left‐Turn Bay on Major Road, Unsignalized, 4‐leg Intersection
Also, many countermeasures were developed from data and either apply to “TOTAL” crashes or
a specific crash type. The investigator needs to be sure that he or she applies the CRF to the
appropriate crash type.
To what crash types should the countermeasure apply?
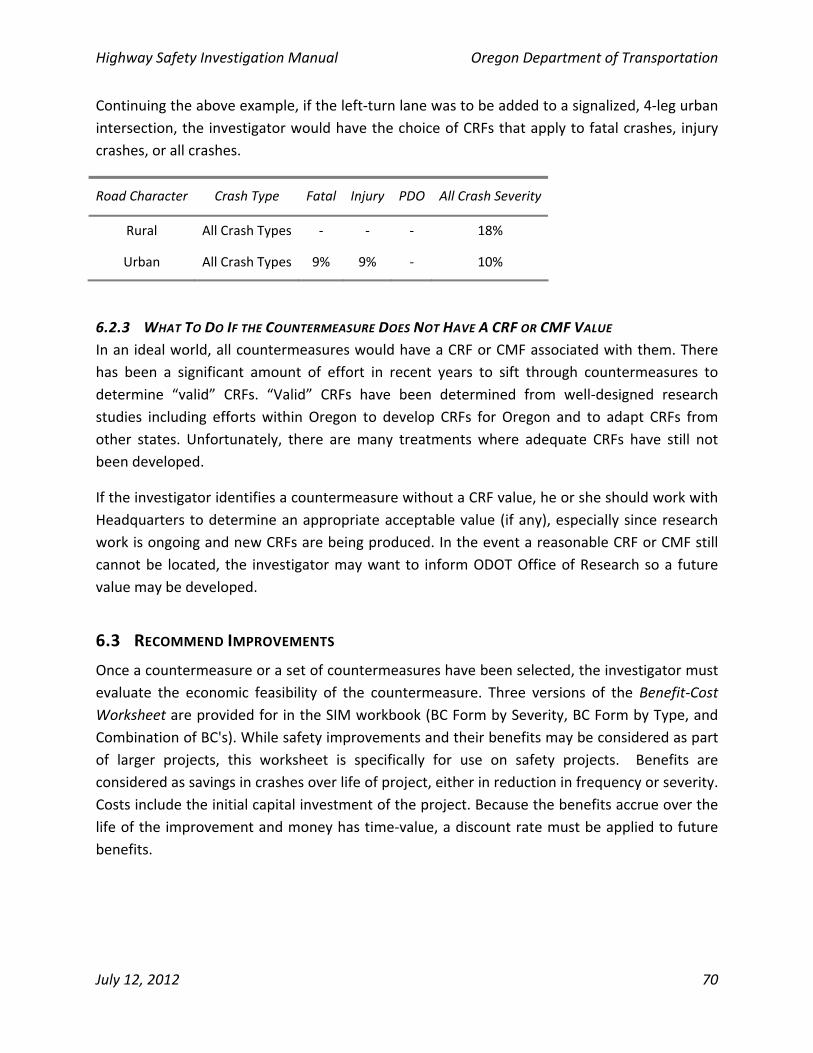
Highway Safety Investigation Manual Oregon Department of Transportation
July 12, 2012 70
Continuing the above example, if the left‐turn lane was to be added to a signalized, 4‐leg urban
intersection, the investigator would have the choice of CRFs that apply to fatal crashes, injury
crashes, or all crashes.
Road Character Crash Type Fatal Injury PDO All Crash Severity
Rural All Crash Types ‐ ‐ ‐ 18%
Urban All Crash Types 9% 9% ‐ 10%
6.2.3 WHAT TO DO IF THE COUNTERMEASURE DOES NOT HAVE A CRF OR CMF VALUE
In an ideal world, all countermeasures would have a CRF or CMF associated with them. There
has been a significant amount of effort in recent years to sift through countermeasures to
determine “valid” CRFs. “Valid” CRFs have been determined from well‐designed research
studies including efforts within Oregon to develop CRFs for Oregon and to adapt CRFs from
other states. Unfortunately, there are many treatments where adequate CRFs have still not
been developed.
If the investigator identifies a countermeasure without a CRF value, he or she should work with
Headquarters to determine an appropriate acceptable value (if any), especially since research
work is ongoing and new CRFs are being produced. In the event a reasonable CRF or CMF still
cannot be located, the investigator may want to inform ODOT Office of Research so a future
value may be developed.
6.3 RECOMMEND IMPROVEMENTS
Once a countermeasure or a set of countermeasures have been selected, the investigator must
evaluate the economic feasibility of the countermeasure. Three versions of the Benefit‐Cost
Worksheet are provided for in the SIM workbook (BC Form by Severity, BC Form by Type, and
Combination of BC's). While safety improvements and their benefits may be considered as part
of larger projects, this worksheet is specifically for use on safety projects. Benefits are
considered as savings in crashes over life of project, either in reduction in frequency or severity.
Costs include the initial capital investment of the project. Because the benefits accrue over the
life of the improvement and money has time‐value, a discount rate must be applied to future
benefits.
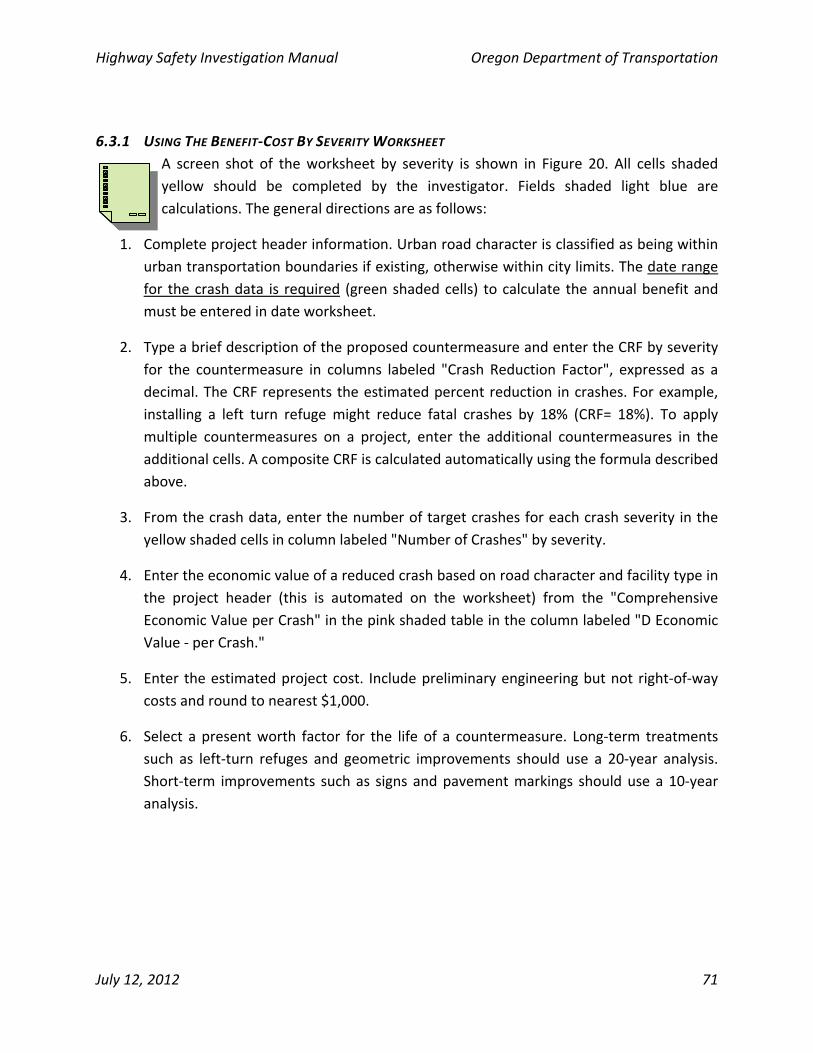
Highway Safety Investigation Manual Oregon Department of Transportation
July 12, 2012 71
6.3.1 USING THE BENEFIT‐COST BY SEVERITY WORKSHEET
A screen shot of the worksheet by severity is shown in Figure 20. All cells shaded
yellow should be completed by the investigator. Fields shaded light blue are
calculations. The general directions are as follows:
1. Complete project header information. Urban road character is classified as being within
urban transportation boundaries if existing, otherwise within city limits. The date range
for the crash data is required (green shaded cells) to calculate the annual benefit and
must be entered in date worksheet.
2. Type a brief description of the proposed countermeasure and enter the CRF by severity
for the countermeasure in columns labeled "Crash Reduction Factor", expressed as a
decimal. The CRF represents the estimated percent reduction in crashes. For example,
installing a left turn refuge might reduce fatal crashes by 18% (CRF= 18%). To apply
multiple countermeasures on a project, enter the additional countermeasures in the
additional cells. A composite CRF is calculated automatically using the formula described
above.
3. From the crash data, enter the number of target crashes for each crash severity in the
yellow shaded cells in column labeled "Number of Crashes" by severity.
4. Enter the economic value of a reduced crash based on road character and facility type in
the project header (this is automated on the worksheet) from the "Comprehensive
Economic Value per Crash" in the pink shaded table in the column labeled "D Economic
Value ‐ per Crash."
5. Enter the estimated project cost. Include preliminary engineering but not right‐of‐way
costs and round to nearest $1,000.
6. Select a present worth factor for the life of a countermeasure. Long‐term treatments
such as left‐turn refuges and geometric improvements should use a 20‐year analysis.
Short‐term improvements such as signs and pavement markings should use a 10‐year
analysis.
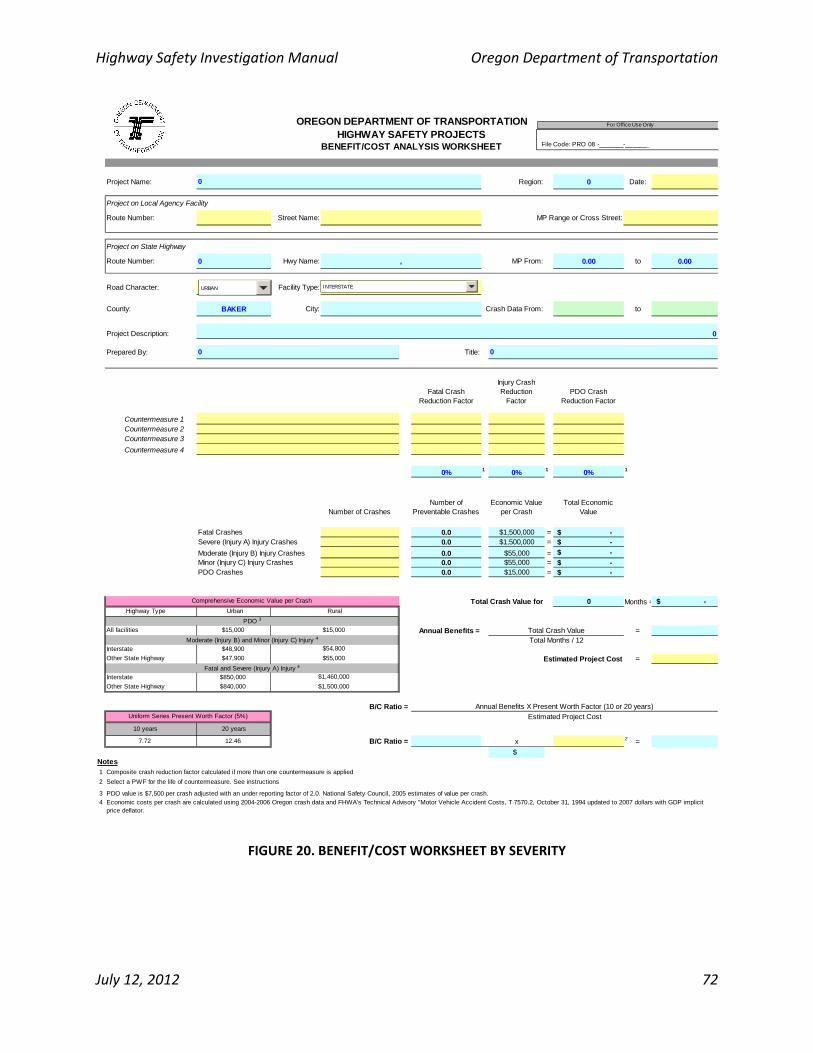
Highway Safety Investigation Manual Oregon Department of Transportation
July 12, 2012 72
Project Name: Region: 0 Date:
Project on Local Agency Facility
Route Number: Street Name: MP Range or Cross Street:
Project on State Highway
Route Number: 0 Hwy Name: , MP From: 0.00 to 0.00
Road Character: URBAN Facility Type:
County: BAKER City: Crash Data From: to
Project Description:
Prepared By: Title:
Fatal Crash Reduction Factor
Injury Crash Reduction
FactorPDO Crash
Reduction Factor
Countermeasure 1Countermeasure 2Countermeasure 3
Countermeasure 4
0% 1 0% 1 0% 1
Number of CrashesNumber of
Preventable CrashesEconomic Value
per CrashTotal Economic
Value
Fatal Crashes 0.0 $1,500,000 = -$ Severe (Injury A) Injury Crashes 0.0 $1,500,000 = -$
Moderate (Injury B) Injury Crashes 0.0 $55,000 = -$ Minor (Injury C) Injury Crashes 0.0 $55,000 = -$ PDO Crashes 0.0 $15,000 = -$
Total Crash Value for 0 Months = -$ Highway Type Urban
All facilities $15,000 Annual Benefits = =
Interstate $48,900
Other State Highway $47,900 Estimated Project Cost =
Interstate $850,000
Other State Highway $840,000
B/C Ratio =
10 years 20 years
7.72 12.46 B/C Ratio = x 2 =
$ Notes1 Composite crash reduction factor calculated if more than one countermeasure is applied
2 Select a PWF for the life of countermeasure. See instructions
3 PDO value is $7,500 per crash adjusted with an under reporting factor of 2.0. National Safety Council, 2005 estimates of value per crash.4
Estimated Project Cost
Fatal and Severe (Injury A) Injury 4
$1,460,000
$54,800
$55,000
Annual Benefits X Present Worth Factor (10 or 20 years)
Total Crash ValueTotal Months / 12
0
INTERSTATE
Economic costs per crash are calculated using 2004-2006 Oregon crash data and FHWA's Technical Advisory "Motor Vehicle Accident Costs, T 7570.2, October 31, 1994 updated to 2007 dollars with GDP implicit price deflator.
Uniform Series Present Worth Factor (5%)
00
$1,500,000
Comprehensive Economic Value per Crash
0
HIGHWAY SAFETY PROJECTSOREGON DEPARTMENT OF TRANSPORTATION
BENEFIT/COST ANALYSIS WORKSHEET
PDO 3
Moderate (Injury B) and Minor (Injury C) Injury 4
$15,000
Rural
File Code: PRO 08 -_______-_______
For Office Use Only
INTERSTATEURBAN
FIGURE 20. BENEFIT/COST WORKSHEET BY SEVERITY
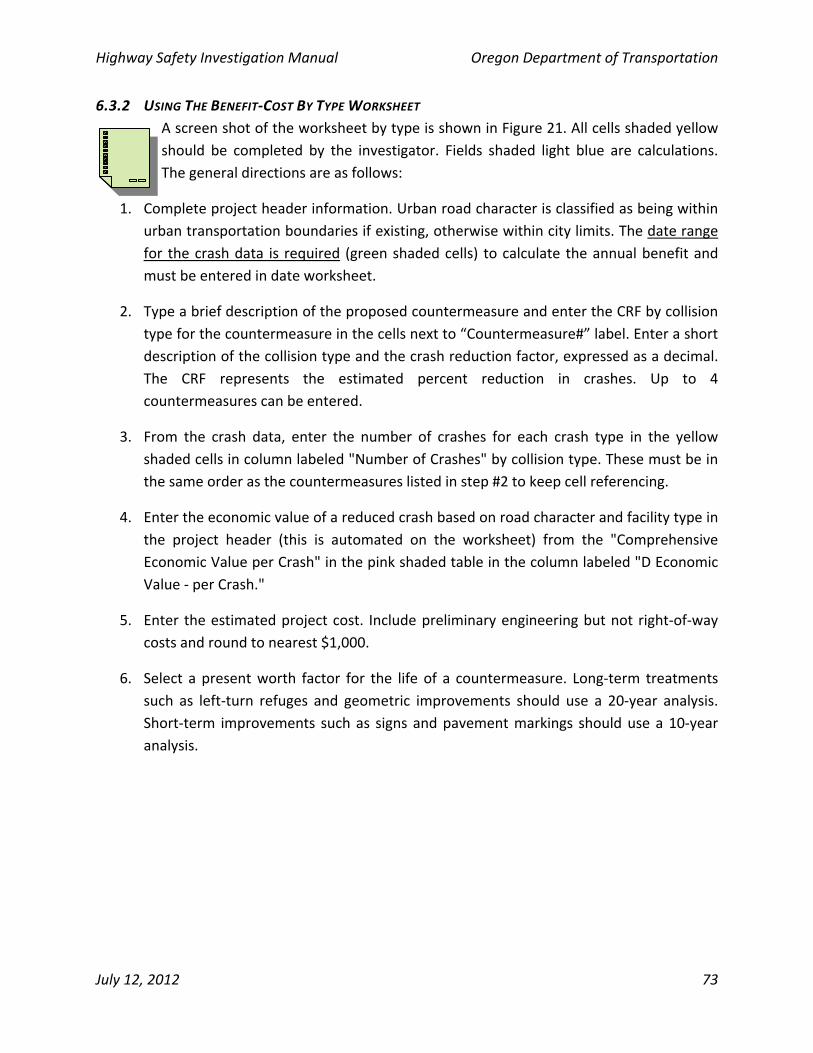
Highway Safety Investigation Manual Oregon Department of Transportation
July 12, 2012 73
6.3.2 USING THE BENEFIT‐COST BY TYPE WORKSHEET
A screen shot of the worksheet by type is shown in Figure 21. All cells shaded yellow
should be completed by the investigator. Fields shaded light blue are calculations.
The general directions are as follows:
1. Complete project header information. Urban road character is classified as being within
urban transportation boundaries if existing, otherwise within city limits. The date range
for the crash data is required (green shaded cells) to calculate the annual benefit and
must be entered in date worksheet.
2. Type a brief description of the proposed countermeasure and enter the CRF by collision
type for the countermeasure in the cells next to “Countermeasure#” label. Enter a short
description of the collision type and the crash reduction factor, expressed as a decimal.
The CRF represents the estimated percent reduction in crashes. Up to 4
countermeasures can be entered.
3. From the crash data, enter the number of crashes for each crash type in the yellow
shaded cells in column labeled "Number of Crashes" by collision type. These must be in
the same order as the countermeasures listed in step #2 to keep cell referencing.
4. Enter the economic value of a reduced crash based on road character and facility type in
the project header (this is automated on the worksheet) from the "Comprehensive
Economic Value per Crash" in the pink shaded table in the column labeled "D Economic
Value ‐ per Crash."
5. Enter the estimated project cost. Include preliminary engineering but not right‐of‐way
costs and round to nearest $1,000.
6. Select a present worth factor for the life of a countermeasure. Long‐term treatments
such as left‐turn refuges and geometric improvements should use a 20‐year analysis.
Short‐term improvements such as signs and pavement markings should use a 10‐year
analysis.
Highway Safety Investigation Manual Oregon Department of Transportation
July 12, 2012 74
Project Name: Region: 0 Date:
Project on Local Agency Facility
Route Number: Street Name: MP Range or Cross Street:
Project on State Highway
Route Number: 0 Hwy Name: , MP From: 0.00 to 0.00
Road Character: URBAN Facility Type:
County: BAKER City: Crash Data From: to
Project Description:
Prepared By: Title:
Crash Reduction Factor
Countermeasure 1Countermeasure 2Countermeasure 3
Countermeasure 4
Number of CrashesNumber of
Preventable CrashesEconomic Value
per CrashTotal Economic
Value
Collision TypeFatal and Severe - Fat & Inj A Crashes 0.0 $1,500,000 = -$
Mod and Minor - Injury B & C Crashes 0.0 $55,000 = -$ PDO Crashes 0.0 $15,000 = -$
Number of CrashesNumber of
Preventable CrashesEconomic Value
per CrashTotal Economic
Value
Collision TypeFatal and Severe - Fat & Inj A Crashes 0.0 $1,500,000 = -$
Mod and Minor - Injury B & C Crashes 0.0 $55,000 = -$ PDO Crashes 0.0 $15,000 = -$
Number of CrashesNumber of
Preventable CrashesEconomic Value
per CrashTotal Economic
Value
Collision TypeFatal and Severe - Fat & Inj A Crashes 0.0 $1,500,000 = -$
Mod and Minor - Injury B & C Crashes 0.0 $55,000 = -$ PDO Crashes 0.0 $15,000 = -$
Number of CrashesNumber of
Preventable CrashesEconomic Value
per CrashTotal Economic
Value
Collision TypeFatal and Severe - Fat & Inj A Crashes 0.0 $1,500,000 = -$
Mod and Minor - Injury B & C Crashes 0.0 $55,000 = -$ PDO Crashes 0.0 $15,000 = -$
Total Crash Value for 0 Months = -$ Highway Type Urban
All facilities $15,000 Annual Benefits = =
Interstate $48,900
Other State Highway $47,900 Estimated Project Cost =
Interstate $850,000
Other State Highway $840,000
B/C Ratio =
10 years 20 years
7.72 12.46 B/C Ratio = x 2 =
$ Notes1 Composite crash reduction factor calculated if more than one countermeasure is applied
2 Select a PWF for the life of countermeasure. See instructions
3 PDO value is $7,500 per crash adjusted with an under reporting factor of 2.0. National Safety Council, 2005 estimates of value per crash.4 Economic costs per crash are calculated using 2004-2006 Oregon crash data and FHWA's Technical Advisory "Motor Vehicle Accident Costs, T 7570.2, October 31, 1994 updated to 2007 dollars with GDP implicit
price deflator.
Uniform Series Present Worth Factor (5%)
$15,000
$55,000
Estimated Project Cost
$54,800
Total Crash ValueTotal Months / 12
Annual Benefits X Present Worth Factor (10 or 20 years)
Moderate (Injury B) and Minor (Injury C) Injury 4
Comprehensive Economic Value per Crash
0
Rural
PDO 3
HIGHWAY SAFETY PROJECTS
OTHER STATE HIGHWAY
Collision Type
0
00
Fatal and Severe (Injury A) Injury 4
$1,460,000
$1,500,000
OREGON DEPARTMENT OF TRANSPORTATION
BENEFIT/COST ANALYSIS WORKSHEETFile Code: PRO 08 -_______-_______
For Office Use Only
OTHER STATE HIGHWAYURBAN
FIGURE 21. BENEFIT/COST WORKSHEET BY TYPE
Highway Safety Investigation Manual Oregon Department of Transportation
July 12, 2012 75
6.3.3 USING THE BENEFIT‐COMBINATION FORM
If both the B/C by type and by severity are used in a project justification, the
combination of BC fom will combine these calculations for one composite B/C
calculation. All cells shaded yellow should be completed by the investigator. Fields
shaded light blue are calculations.
6.3.4 PRIORITIZATION OF COUNTERMEASURES AND PROJECTS
There are two possible situations that can be encountered for the investigator to consider.
First, a set of feasible countermeasures may exist for a particular location. Assuming only one
can be implemented (mutually exclusive projects) and they all meet budget constraints, the
easiest selection process is for the investigator to calculate the “Net Present Value” (NPV) for all
alternatives and select the solution with the highest NPV. The NPV can be calculated by
subtracting the value of benefits in the numerator from the cost in the denominator from the
benefit‐cost worksheet (Annual Benefits x Present Worth Factor – Present Worth Costs).
IMPORTANT ‐‐ Mutually exclusive projects should not be selected by comparing Benefit‐to‐Cost
(B/C) ratios. If the investigator wants to use a B/C, the incremental B/C ratio method should be
used. The NPV is a simpler and more straightforward approach for this assessment.
For independent projects with a budget constraint, a simple optimization selection process
should be employed.
6.3.5 STATING THE PROBLEM AND WRITING THE RECOMMENDATION
Clear identification of issues at an identified location can be critical for diagnosis and
determination of successful site recommendations. It is essential, therefore, to clearly identify
site issues and document these conditions for current and future assessment.
As a general rule, a location that is a candidate for a safety enhancement project will have a
specific set of identifiable countermeasures that may be applicable. These potential
recommendations can include iterative solutions. These recommendations are a culmination of
the investigations process. The final recommendation is the improvement or set of
improvements that should be implemented. These improvements have been identified by the
crash data analysis, field investigation, and were determined to be cost effective.
The text of the recommendation should be written such that there is a clear link established
between the identified crash or safety problem and the proposed solution.

Highway Safety Investigation Manual Oregon Department of Transportation
July 12, 2012 76
Page Intentionally Blank
Highway Safety Investigation Manual Oregon Department of Transportation
July 12, 2012 77
7 DOCUMENTATION AND IMPLEMENTATION
Documentation of the safety investigation and subsequent
recommendations is important for a number of reasons.
First, by properly documenting the evaluation and project
recommendations the implemented improvements can be
more easily evaluated for effectiveness. This
documentation will also allow ODOT to easily complete
and compile the federal reporting requirements for the
Highway Safety Improvement Program. Second, a well‐
organized investigations file and its summary document,
the Highway Safety Investigations Report (HSIR), serve as
important tools for improving safety considerations in
project discussions. Lastly, in the case of tort liability, the
file and summary report could prove useful in defending
the Department’s actions.
7.1 DOCUMENTATION
7.1.1 INVESTIGATIONS FILE
It is important to keep an organized file, both electronically
and paper‐based. All worksheets that are completed as
part of the investigations should be saved and named in a
systematic format.
7.1.2 HIGHWAY SAFETY INVESTIGATIONS REPORT (HSIR)
The purpose of the Highway Safety Investigations Report is to be the final summary of
the investigation process. The form is intended to also serve as a tracking mechanism
for corrective action. The investigator can call the file “complete” and enter a “close”
date after the recommendations have been implemented. Nearly all of the information
required for the report should have been obtained or analyzed as a part of the investigations
process. Figure 19 shows a screen capture of this form.
7.1.2.1 LOCATION INFORMATION
The first section of the report defines the location of the investigation. The information
required includes: Region; District; County; City (optional); Route Number; Hwy Name; Road
Highway Safety Investigation Manual Oregon Department of Transportation
July 12, 2012 78
Character; Facility Type; if the investigation is at an intersection, the intersection MP; if the
project is over a segment, the mileposts from and to.
7.1.2.2 SUMMARY
The summary area documents the investigator’s name and title, the type of investigation, and
whether or not a previous investigation was conducted. A space is given for a narrative
description of the problem that was identified by the investigations. The narrative should be
clear and concise and summarize the results of the diagnosis and field investigations. The
recommendation narrative should be written such that there is a clear link established between
the crash or safety problem identified and the proposed solution (see Section 6.3.3 in the
previous chapter). A possible recommendation is “NO WORK.”
The information requested in the recommendation summary is used primarily for reporting and
performance measurement purposes. The type of work recommended (maintenance, as part of
project, stand‐alone, quick‐hit, or no work) is needed. The improvement types are broad
categories required for the Federal reporting requirements. If more than one type of
improvement is proposed, the work that is the greatest percentage of the total project budget
should be entered.
For before‐after evaluations, it is important to clearly define the type of crashes and the
location that was being targeted. “Target” crashes are those crashes that the improvement is
expected to modify. For example, if the addition of a left‐turn lane was proposed for a rural
highway, target crashes would likely be rear‐end, turning, and possibly angle crash types. The
target crashes should be from the “collision type” categories in the existing condition summary.
The milepost range should define the area where the safety improvement was constructed. If
the location cannot be described simply by milepost, additional notes can be added about the
location.
Finally, be sure to place a “1” in cell T33, T34, T35, or T36 indicating with B/C form was used in
the analysis. The value from the appropriate B/C form will be transferred and shown on the
HSIR. If no B/C analysis was conducted be sure to indicate this.
7.1.2.3 APPROVALS
The approval section contains the date the investigator completed the form, who (if anyone)
reviewed and approved the investigation and recommendation, and their approval date.
Highway Safety Investigation Manual Oregon Department of Transportation
July 12, 2012 79
7.1.2.4 EXISTING CONDITIONS SUMMARY
This section summarizes the existing crash, volume, rates, SPIS and SIP category scores (for the
past three years) , geometry and operation data, and whether or not a field visit was conducted
for this particular investigation. Additional notes (of any kind) can be included in the notes field.
7.1.2.5 RECOMMENDATIONS TRACKING AND FOLLOW‐UP
The purpose of this section is to document the progress of implementing the recommended
solutions. If the recommendations were maintenance or quick‐hit, the date and person to
whom the request was sent to is documented. When the work is complete, that information is
verified and entered. If the recommendations are part of another project, the project key
number or project name should be included in the documentation.
7.2 IMPLEMENTATION
The corrective action can be performed in a number of ways:
1. Maintenance action – if the recommended improvement is relatively minor and low
cost, the work can be done as part of normal maintenance crew activities.
2. Quick‐hit safety improvement – a lower cost improvement that exceeds maintenance
budgets but can be funded from an allocation from the Highway Safety Engineering
Committee (HSEC).
3. Improvements as part of a larger project ‐ if a known STIP project will be undertaken
near the investigated section in the near future, it may be possible to integrate the
improvements. If the recommendation meets all requirements, the improvement can be
funded from safety funds.
4. Stand‐alone safety project – a stand‐alone STIP project funded from safety funds that
must meet all of the specified requirements.
To determine funding sources, refer to the Highway Safety Program Guide.
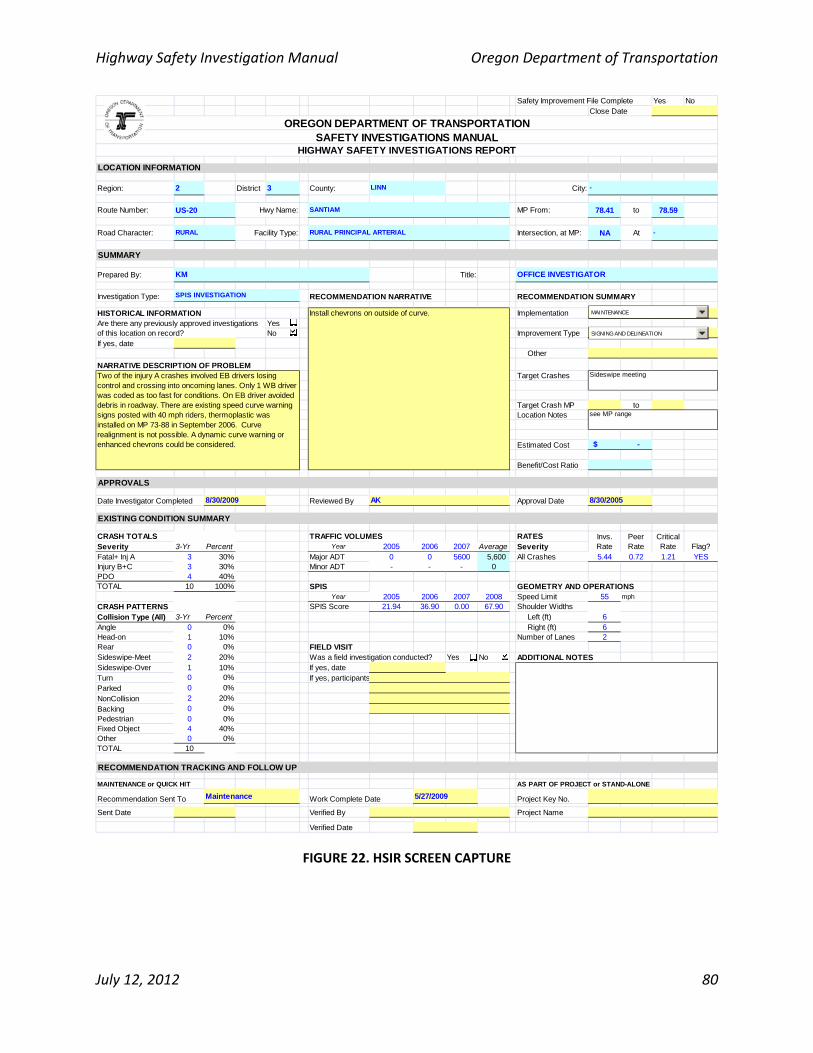
Highway Safety Investigation Manual Oregon Department of Transportation
July 12, 2012 80
Safety Improvement File Complete Yes No
LOCATION INFORMATION
Region: 2 District 3 County: City:
Route Number: US-20 Hwy Name: SANTIAM MP From: 78.41 to 78.59
Road Character: Facility Type: Intersection, at MP: NA At
SUMMARY
Prepared By: Title:
Investigation Type: SPIS INVESTIGATION RECOMMENDATION NARRATIVE RECOMMENDATION SUMMARY
HISTORICAL INFORMATION ImplementationYesNo Improvement Type
If yes, date Other
NARRATIVE DESCRIPTION OF PROBLEMTarget Crashes
Target Crash MP toLocation Notes
Estimated Cost
Benefit/Cost Ratio
APPROVALS
Date Investigator Completed Reviewed By Approval Date
EXISTING CONDITION SUMMARY
CRASH TOTALS TRAFFIC VOLUMES RATESSeverity 3-Yr Percent Year 2005 2006 2007 Average SeverityFatal+ Inj A 3 30% Major ADT 0 0 5600 5,600 All Crashes 5.44 0.72 1.21 YESInjury B+C 3 30% Minor ADT - - - 0PDO 4 40%TOTAL 10 100% SPIS GEOMETRY AND OPERATIONS
Year 2005 2006 2007 2008 Speed Limit 55 mph
CRASH PATTERNS SPIS Score 21.94 36.90 0.00 67.90 Shoulder WidthsCollision Type (All) 3-Yr Percent Left (ft) 6Angle 0 0% Right (ft) 6Head-on 1 10% Number of Lanes 2Rear 0 0% FIELD VISITSideswipe-Meet 2 20% Was a field investigation conducted? Yes No ADDITIONAL NOTESSideswipe-Over 1 10% If yes, dateTurn 0 0% If yes, participantsParked 0 0%
NonCollision 2 20%
Backing 0 0%Pedestrian 0 0%Fixed Object 4 40%Other 0 0%TOTAL 10
RECOMMENDATION TRACKING AND FOLLOW UP
MAINTENANCE or QUICK HIT AS PART OF PROJECT or STAND-ALONE
Work Complete Date Project Key No.
Sent Date Verified By Project Name
Verified Date
LINN
Are there any previously approved investigations of this location on record?
Two of the injury A crashes involved EB drivers losing control and crossing into oncoming lanes. Only 1 WB driver was coded as too fast for conditions. On EB driver avoided debris in roadway. There are existing speed curve warning signs posted with 40 mph riders, thermoplastic was installed on MP 73-88 in September 2006. Curve realignment is not possible. A dynamic curve warning or enhanced chevrons could be considered. -$
-
5/27/2009
SIGNING AND DELINEATION
OFFICE INVESTIGATOR
Sideswipe meeting
Install chevrons on outside of curve.
Invs. Rate
Peer Rate
Critical Rate Flag?
Close Date
see MP range
SAFETY INVESTIGATIONS MANUALOREGON DEPARTMENT OF TRANSPORTATION
8/30/2009
MAINTENANCE
RURAL
-
HIGHWAY SAFETY INVESTIGATIONS REPORT
RURAL PRINCIPAL ARTERIAL
KM
8/30/2005AK
Recommendation Sent To Maintenance
SIGNING AND DELINEATION
MAINTENANCE
FIGURE 22. HSIR SCREEN CAPTURE
Highway Safety Investigation Manual Oregon Department of Transportation
July 12, 2012 81
8 REFERENCES
California Department of Transportation (Caltrans). (2002a). Caltrans Traffic Safety
Investigator Training. Instructor Guide, Rev. 2.0. Funded by the California Office of
Traffic Safety.
Caltrans. (2002b). Caltrans Traffic Safety Investigator Training. Student Learning Guide, Rev.
2.0. Funded by the California Office of Traffic Safety.
Federal Highway Administration (FHWA). (1981). Highway Safety Improvement Program
(HSIP). Report No. FHWA‐TS‐81‐218. US Department of Transportation and Federal
Highway Administration, Washington, DC.
Graham, J. L., & Glennon, J. C (1975). Manual on Identification, Analysis and Correction of High
Accident Locations. Missouri State Highway Commission. Reprinted 1985 by Criterion
Press, Leawood KS.
Kilareski, W. P., Tarris, J., Torbic, D., & Steve, W. (1996). Pocket Guide for Accident Data
Collection, Publication 323. Prepared by the Pennsylvania Transportation Institute at
The Pennsylvania State University in cooperation with the Pennsylvania Department of
Transportation, Harrisburg, PA.
Kononov, J., & Janson, B. (2002). “Diagnostic Methodology for the Detection of Safety
Problems at Intersections,” Journal of the Transportation Research Board:
Transportation Research Record 1784, National Research Council, Washington, DC, pp.
51‐56.
New York State Department of Transportation. (2000). Safety Investigation Procedures Manual.
Accident Surveillance and Investigation Section of the Safety Program Management
Bureau, Albany, NY.
Ogden, K. W. (1996). Safer Roads. A Guide to Road Safety Engineering. Ashgate Publishing
Company. Burlington, VT.
Ohio Department of Transportation (OhioDOT). (2002). Safety Study Guidelines. Office of
Traffic Engineering, Columbus, OH.
Ohio Governor’s Task Force on Highway Safety. (accessed August 2006). Handbook of
Guidelines and Procedures. [Document also known as the Corridor Safety Manual].
Columbus, OH.
Highway Safety Investigation Manual Oregon Department of Transportation
July 12, 2012 82
Pennsylvania Department of Transportation (PennDOT). (1997). Collection of Perishable Crash
Data. Procedural Guidelines, Publication 159. Bureau of Highway Safety and Traffic
Engineering. Harrisburg, PA.
PIARC – World Road Association (PIARC). (2003). Road Safety Manual. PIARC Technical
Committee on Road Safety.
Treat, J. R., N. S. Tumbas, S. T. McDonald, D. Shinar, R. D. Hume, R. E. Mayer, R. L. Stansifer, and
N. J. Castellan. (1979). Tri‐Level study of the causes of traffic accidents: Final report‐
Executive summary. Bloomington, IN: Institute for Research in Public Safety.
Wilson, E. M. (2003). NCHRP Synthesis 321 – Roadway Safety Tools for Local Agencies, a
Synthesis of Highway Practice. Transportation Research Board, Washington, D.C.
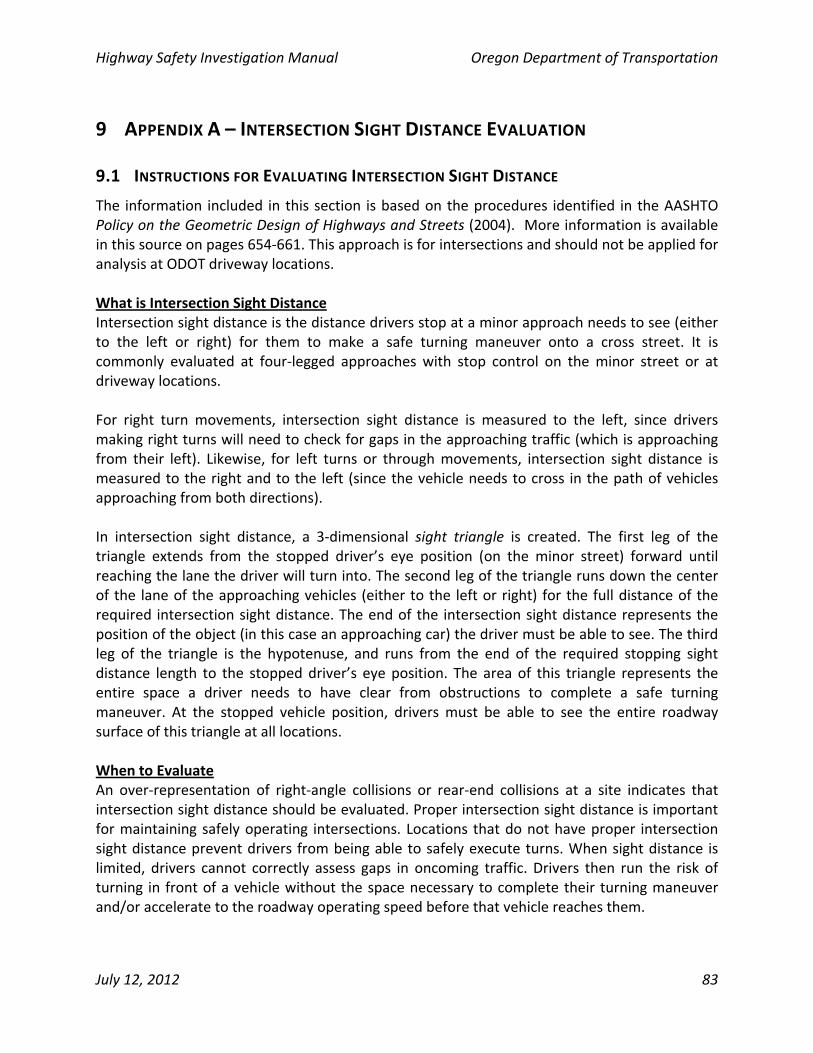
Highway Safety Investigation Manual Oregon Department of Transportation
July 12, 2012 83
9 APPENDIX A – INTERSECTION SIGHT DISTANCE EVALUATION
9.1 INSTRUCTIONS FOR EVALUATING INTERSECTION SIGHT DISTANCE
The information included in this section is based on the procedures identified in the AASHTO Policy on the Geometric Design of Highways and Streets (2004). More information is available in this source on pages 654‐661. This approach is for intersections and should not be applied for analysis at ODOT driveway locations. What is Intersection Sight Distance Intersection sight distance is the distance drivers stop at a minor approach needs to see (either to the left or right) for them to make a safe turning maneuver onto a cross street. It is commonly evaluated at four‐legged approaches with stop control on the minor street or at driveway locations. For right turn movements, intersection sight distance is measured to the left, since drivers making right turns will need to check for gaps in the approaching traffic (which is approaching from their left). Likewise, for left turns or through movements, intersection sight distance is measured to the right and to the left (since the vehicle needs to cross in the path of vehicles approaching from both directions). In intersection sight distance, a 3‐dimensional sight triangle is created. The first leg of the triangle extends from the stopped driver’s eye position (on the minor street) forward until reaching the lane the driver will turn into. The second leg of the triangle runs down the center of the lane of the approaching vehicles (either to the left or right) for the full distance of the required intersection sight distance. The end of the intersection sight distance represents the position of the object (in this case an approaching car) the driver must be able to see. The third leg of the triangle is the hypotenuse, and runs from the end of the required stopping sight distance length to the stopped driver’s eye position. The area of this triangle represents the entire space a driver needs to have clear from obstructions to complete a safe turning maneuver. At the stopped vehicle position, drivers must be able to see the entire roadway surface of this triangle at all locations. When to Evaluate An over‐representation of right‐angle collisions or rear‐end collisions at a site indicates that intersection sight distance should be evaluated. Proper intersection sight distance is important for maintaining safely operating intersections. Locations that do not have proper intersection sight distance prevent drivers from being able to safely execute turns. When sight distance is limited, drivers cannot correctly assess gaps in oncoming traffic. Drivers then run the risk of turning in front of a vehicle without the space necessary to complete their turning maneuver and/or accelerate to the roadway operating speed before that vehicle reaches them.
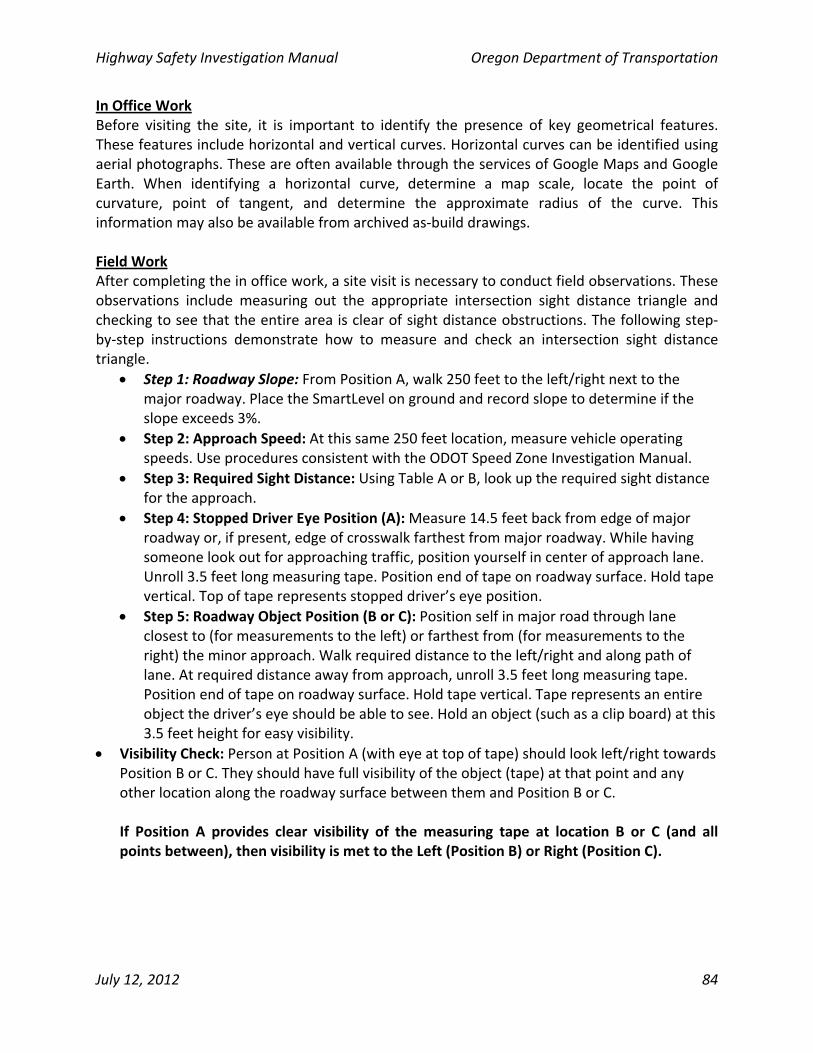
Highway Safety Investigation Manual Oregon Department of Transportation
July 12, 2012 84
In Office Work Before visiting the site, it is important to identify the presence of key geometrical features. These features include horizontal and vertical curves. Horizontal curves can be identified using aerial photographs. These are often available through the services of Google Maps and Google Earth. When identifying a horizontal curve, determine a map scale, locate the point of curvature, point of tangent, and determine the approximate radius of the curve. This information may also be available from archived as‐build drawings. Field Work After completing the in office work, a site visit is necessary to conduct field observations. These observations include measuring out the appropriate intersection sight distance triangle and checking to see that the entire area is clear of sight distance obstructions. The following step‐by‐step instructions demonstrate how to measure and check an intersection sight distance triangle.
Step 1: Roadway Slope: From Position A, walk 250 feet to the left/right next to the major roadway. Place the SmartLevel on ground and record slope to determine if the slope exceeds 3%.
Step 2: Approach Speed: At this same 250 feet location, measure vehicle operating speeds. Use procedures consistent with the ODOT Speed Zone Investigation Manual.
Step 3: Required Sight Distance: Using Table A or B, look up the required sight distance for the approach.
Step 4: Stopped Driver Eye Position (A): Measure 14.5 feet back from edge of major roadway or, if present, edge of crosswalk farthest from major roadway. While having someone look out for approaching traffic, position yourself in center of approach lane. Unroll 3.5 feet long measuring tape. Position end of tape on roadway surface. Hold tape vertical. Top of tape represents stopped driver’s eye position.
Step 5: Roadway Object Position (B or C): Position self in major road through lane closest to (for measurements to the left) or farthest from (for measurements to the right) the minor approach. Walk required distance to the left/right and along path of lane. At required distance away from approach, unroll 3.5 feet long measuring tape. Position end of tape on roadway surface. Hold tape vertical. Tape represents an entire object the driver’s eye should be able to see. Hold an object (such as a clip board) at this 3.5 feet height for easy visibility.
Visibility Check: Person at Position A (with eye at top of tape) should look left/right towards Position B or C. They should have full visibility of the object (tape) at that point and any other location along the roadway surface between them and Position B or C. If Position A provides clear visibility of the measuring tape at location B or C (and all points between), then visibility is met to the Left (Position B) or Right (Position C).
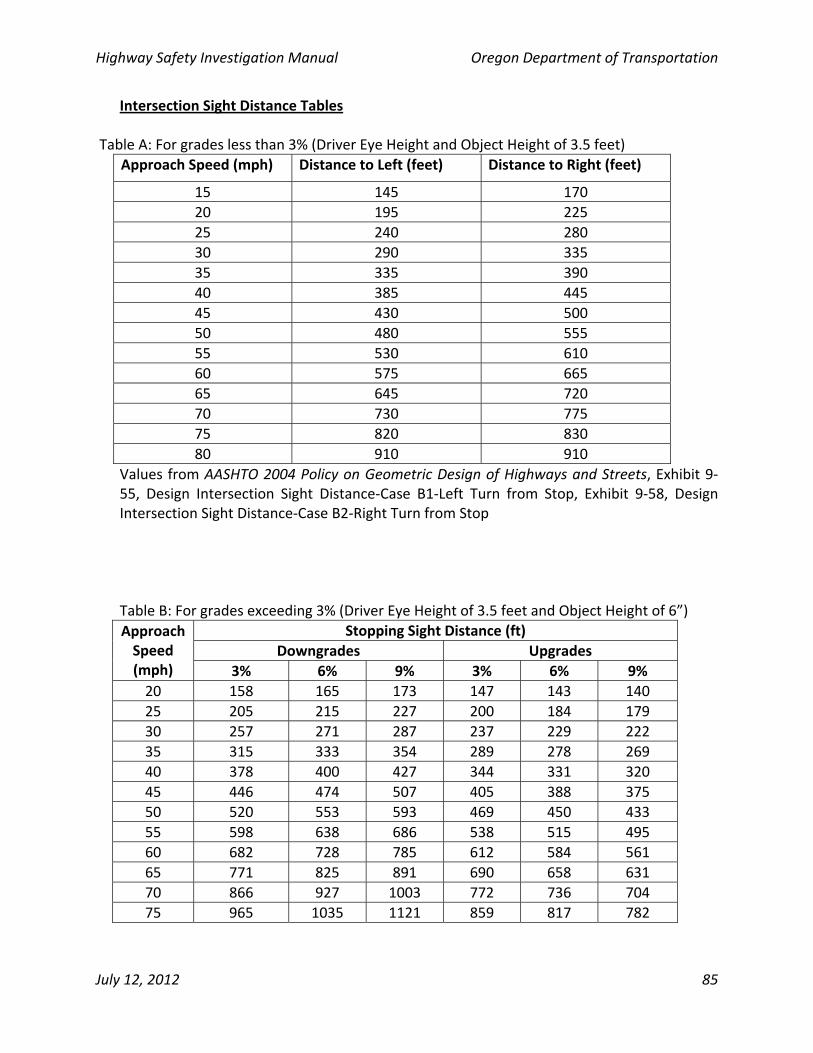
Highway Safety Investigation Manual Oregon Department of Transportation
July 12, 2012 85
Intersection Sight Distance Tables Table A: For grades less than 3% (Driver Eye Height and Object Height of 3.5 feet)
Approach Speed (mph) Distance to Left (feet) Distance to Right (feet)
15 145 170
20 195 225
25 240 280
30 290 335
35 335 390
40 385 445
45 430 500
50 480 555
55 530 610
60 575 665
65 645 720
70 730 775
75 820 830
80 910 910
Values from AASHTO 2004 Policy on Geometric Design of Highways and Streets, Exhibit 9‐55, Design Intersection Sight Distance‐Case B1‐Left Turn from Stop, Exhibit 9‐58, Design Intersection Sight Distance‐Case B2‐Right Turn from Stop Table B: For grades exceeding 3% (Driver Eye Height of 3.5 feet and Object Height of 6”)
Stopping Sight Distance (ft)
Downgrades Upgrades Approach Speed (mph) 3% 6% 9% 3% 6% 9%
20 158 165 173 147 143 140
25 205 215 227 200 184 179
30 257 271 287 237 229 222
35 315 333 354 289 278 269
40 378 400 427 344 331 320
45 446 474 507 405 388 375
50 520 553 593 469 450 433
55 598 638 686 538 515 495
60 682 728 785 612 584 561
65 771 825 891 690 658 631
70 866 927 1003 772 736 704
75 965 1035 1121 859 817 782
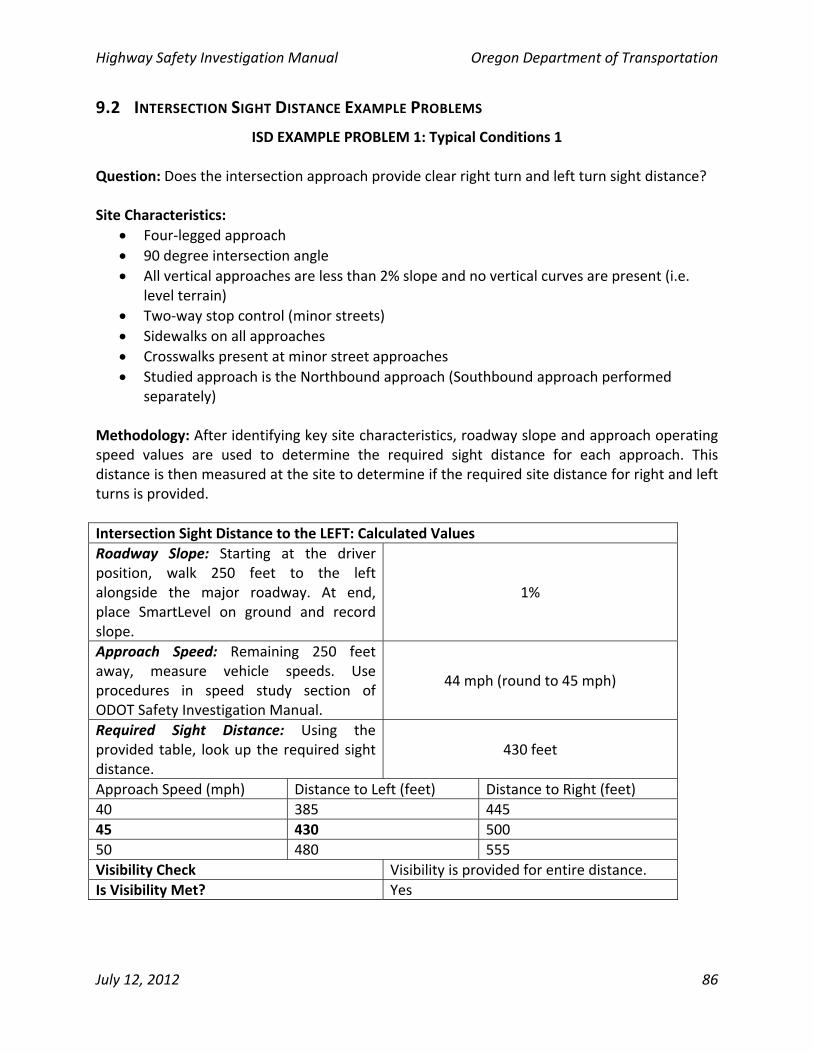
Highway Safety Investigation Manual Oregon Department of Transportation
July 12, 2012 86
9.2 INTERSECTION SIGHT DISTANCE EXAMPLE PROBLEMS
ISD EXAMPLE PROBLEM 1: Typical Conditions 1
Question: Does the intersection approach provide clear right turn and left turn sight distance? Site Characteristics:
Four‐legged approach
90 degree intersection angle
All vertical approaches are less than 2% slope and no vertical curves are present (i.e. level terrain)
Two‐way stop control (minor streets)
Sidewalks on all approaches
Crosswalks present at minor street approaches
Studied approach is the Northbound approach (Southbound approach performed separately)
Methodology: After identifying key site characteristics, roadway slope and approach operating speed values are used to determine the required sight distance for each approach. This distance is then measured at the site to determine if the required site distance for right and left turns is provided.
Intersection Sight Distance to the LEFT: Calculated Values
Roadway Slope: Starting at the driver position, walk 250 feet to the left alongside the major roadway. At end, place SmartLevel on ground and record slope.
1%
Approach Speed: Remaining 250 feet away, measure vehicle speeds. Use procedures in speed study section of ODOT Safety Investigation Manual.
44 mph (round to 45 mph)
Required Sight Distance: Using the provided table, look up the required sight distance.
430 feet
Approach Speed (mph) Distance to Left (feet) Distance to Right (feet)
40 385 445
45 430 500
50 480 555
Visibility Check Visibility is provided for entire distance.
Is Visibility Met? Yes

Highway Safety Investigation Manual Oregon Department of Transportation
July 12, 2012 87
Intersection Sight Distance to the RIGHT: Calculated Values
Roadway Slope: Starting at the driver position, walk 250 feet to the right alongside the major roadway. At end, place SmartLevel on ground and record slope..
1.5 %
Approach Speed: Remaining 250 feet away, measure vehicle speeds. Use procedures in speed study section of ODOT Safety Investigation Manual.
40 mph
Required Sight Distance: Using the provided table, look up the required sight distance.
445 feet
Approach Speed (mph) Distance to Left (feet) Distance to Right (feet)
35 335 390
40 385 445
45 430 500
Visibility Check Visibility is provided for entire distance.
Is Visibility Met? Yes
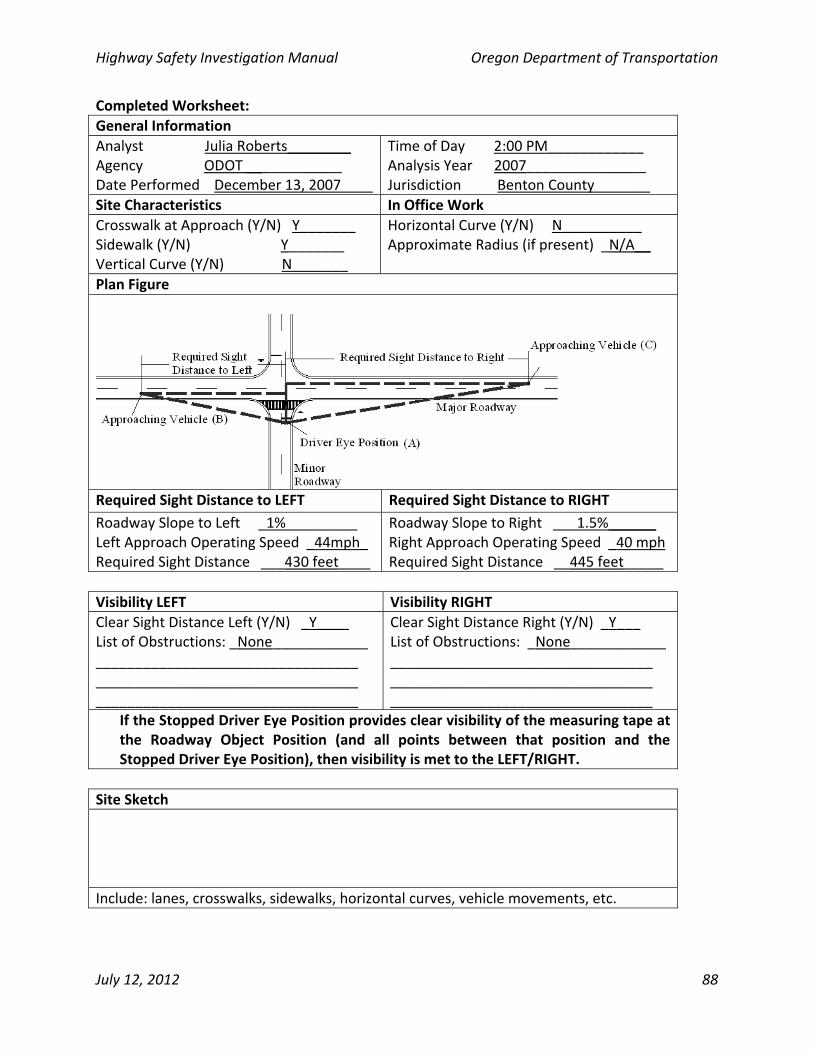
Highway Safety Investigation Manual Oregon Department of Transportation
July 12, 2012 88
Completed Worksheet:
General Information
Analyst Julia Roberts________ Agency ODOT ____________ Date Performed December 13, 2007____
Time of Day 2:00 PM____________ Analysis Year 2007_______________ Jurisdiction Benton County_______
Site Characteristics In Office Work
Crosswalk at Approach (Y/N) Y_______ Sidewalk (Y/N) Y_______ Vertical Curve (Y/N) N_______
Horizontal Curve (Y/N) N__________ Approximate Radius (if present) _N/A__
Plan Figure
Required Sight Distance to LEFT Required Sight Distance to RIGHT
Roadway Slope to Left _1%_________ Left Approach Operating Speed _44mph_ Required Sight Distance ___430 feet____
Roadway Slope to Right ___1.5%______ Right Approach Operating Speed _40 mph Required Sight Distance __445 feet_____
Visibility LEFT Visibility RIGHT
Clear Sight Distance Left (Y/N) _Y____ List of Obstructions: _None____________ _________________________________ _________________________________ _________________________________
Clear Sight Distance Right (Y/N) _Y___ List of Obstructions: _None____________ _________________________________ _________________________________ _________________________________
If the Stopped Driver Eye Position provides clear visibility of the measuring tape at the Roadway Object Position (and all points between that position and the Stopped Driver Eye Position), then visibility is met to the LEFT/RIGHT.
Site Sketch
Include: lanes, crosswalks, sidewalks, horizontal curves, vehicle movements, etc.
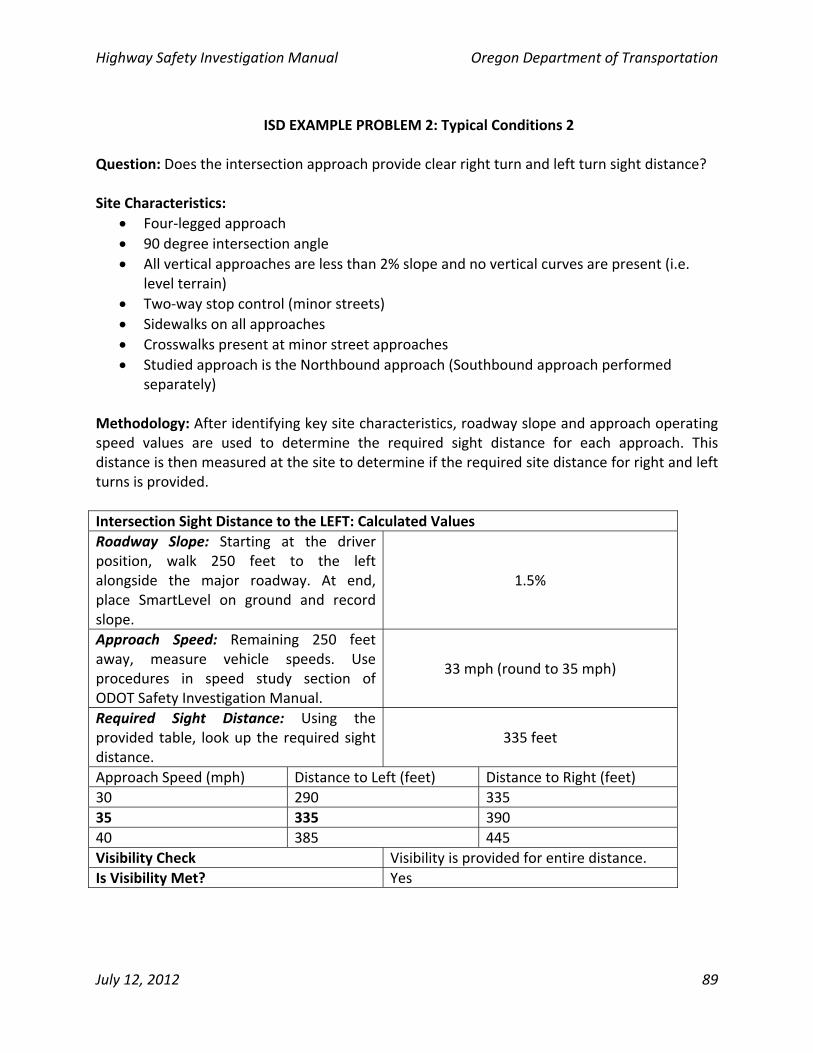
Highway Safety Investigation Manual Oregon Department of Transportation
July 12, 2012 89
ISD EXAMPLE PROBLEM 2: Typical Conditions 2
Question: Does the intersection approach provide clear right turn and left turn sight distance? Site Characteristics:
Four‐legged approach
90 degree intersection angle
All vertical approaches are less than 2% slope and no vertical curves are present (i.e. level terrain)
Two‐way stop control (minor streets)
Sidewalks on all approaches
Crosswalks present at minor street approaches
Studied approach is the Northbound approach (Southbound approach performed separately)
Methodology: After identifying key site characteristics, roadway slope and approach operating speed values are used to determine the required sight distance for each approach. This distance is then measured at the site to determine if the required site distance for right and left turns is provided.
Intersection Sight Distance to the LEFT: Calculated Values
Roadway Slope: Starting at the driver position, walk 250 feet to the left alongside the major roadway. At end, place SmartLevel on ground and record slope.
1.5%
Approach Speed: Remaining 250 feet away, measure vehicle speeds. Use procedures in speed study section of ODOT Safety Investigation Manual.
33 mph (round to 35 mph)
Required Sight Distance: Using the provided table, look up the required sight distance.
335 feet
Approach Speed (mph) Distance to Left (feet) Distance to Right (feet)
30 290 335
35 335 390
40 385 445
Visibility Check Visibility is provided for entire distance.
Is Visibility Met? Yes

Highway Safety Investigation Manual Oregon Department of Transportation
July 12, 2012 90
Intersection Sight Distance to the RIGHT: Calculated Values
Roadway Slope: Starting at the driver position, walk 250 feet to the right alongside the major roadway. At end, place SmartLevel on ground and record slope..
2 %
Approach Speed: Remaining 250 feet away, measure vehicle speeds. Use procedures in speed study section of ODOT Safety Investigation Manual.
35 mph
Required Sight Distance: Using the provided table, look up the required sight distance.
390 feet
Approach Speed (mph) Distance to Left (feet) Distance to Right (feet)
30 290 335
35 335 390
40 385 445
Visibility Check Fence is blocking portion of sight triangle
Is Visibility Met? No
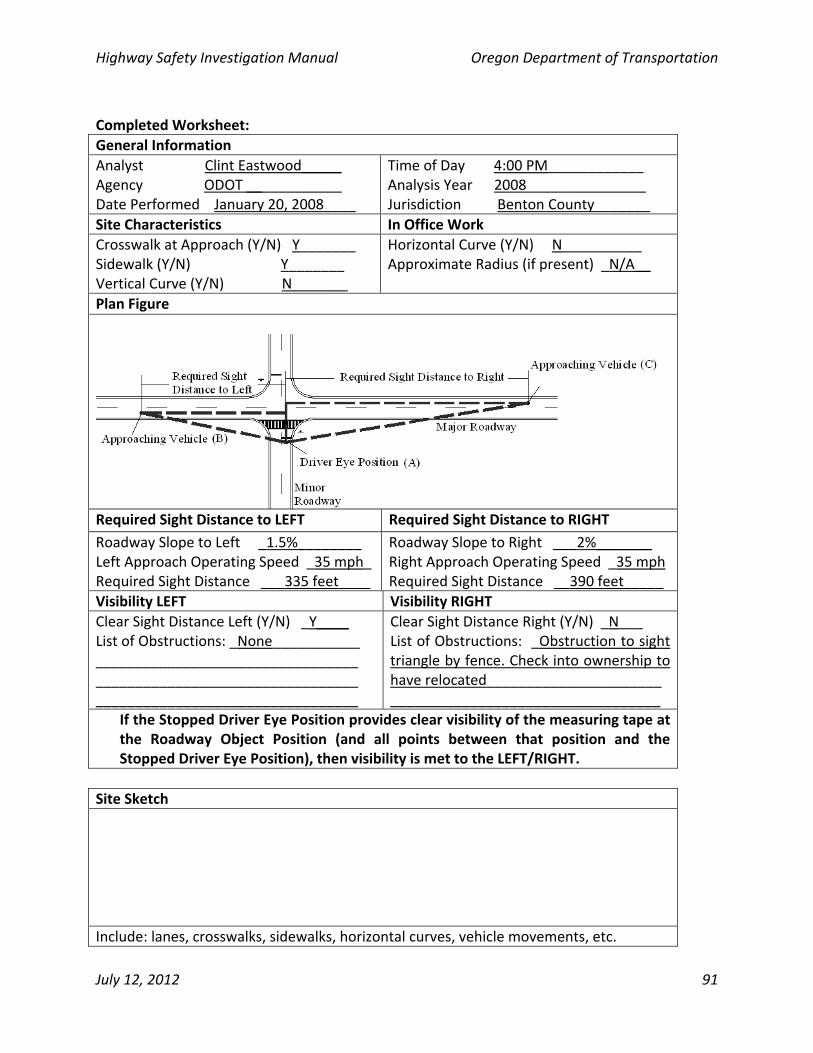
Highway Safety Investigation Manual Oregon Department of Transportation
July 12, 2012 91
Completed Worksheet:
General Information
Analyst Clint Eastwood_____ Agency ODOT ____________ Date Performed January 20, 2008____
Time of Day 4:00 PM____________ Analysis Year 2008_______________ Jurisdiction Benton County_______
Site Characteristics In Office Work
Crosswalk at Approach (Y/N) Y_______ Sidewalk (Y/N) Y_______ Vertical Curve (Y/N) N_______
Horizontal Curve (Y/N) N__________ Approximate Radius (if present) _N/A__
Plan Figure
Required Sight Distance to LEFT Required Sight Distance to RIGHT
Roadway Slope to Left _1.5%________ Left Approach Operating Speed _35 mph_ Required Sight Distance ___335 feet____
Roadway Slope to Right ___2%_______ Right Approach Operating Speed _35 mph Required Sight Distance __390 feet_____
Visibility LEFT Visibility RIGHT
Clear Sight Distance Left (Y/N) _Y____ List of Obstructions: _None___________ _________________________________ _________________________________ _________________________________
Clear Sight Distance Right (Y/N) _N___ List of Obstructions: _Obstruction to sight triangle by fence. Check into ownership to have relocated______________________ __________________________________
If the Stopped Driver Eye Position provides clear visibility of the measuring tape at the Roadway Object Position (and all points between that position and the Stopped Driver Eye Position), then visibility is met to the LEFT/RIGHT.
Site Sketch
Include: lanes, crosswalks, sidewalks, horizontal curves, vehicle movements, etc.
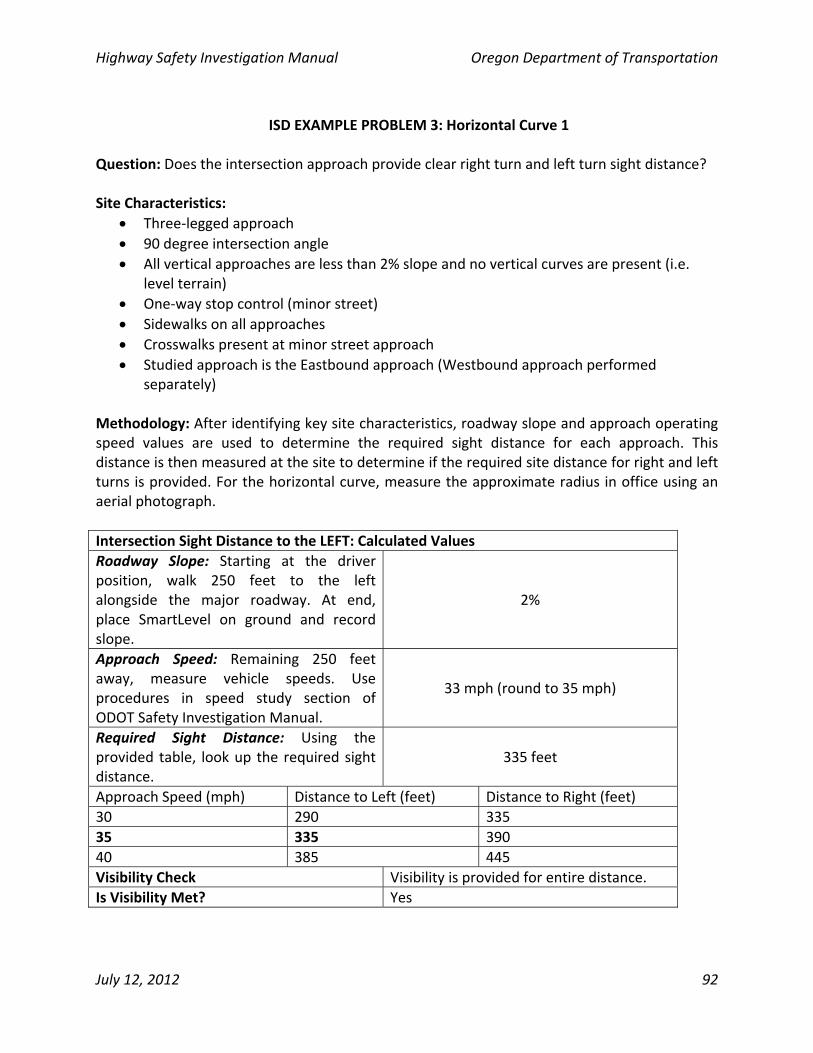
Highway Safety Investigation Manual Oregon Department of Transportation
July 12, 2012 92
ISD EXAMPLE PROBLEM 3: Horizontal Curve 1
Question: Does the intersection approach provide clear right turn and left turn sight distance? Site Characteristics:
Three‐legged approach
90 degree intersection angle
All vertical approaches are less than 2% slope and no vertical curves are present (i.e. level terrain)
One‐way stop control (minor street)
Sidewalks on all approaches
Crosswalks present at minor street approach
Studied approach is the Eastbound approach (Westbound approach performed separately)
Methodology: After identifying key site characteristics, roadway slope and approach operating speed values are used to determine the required sight distance for each approach. This distance is then measured at the site to determine if the required site distance for right and left turns is provided. For the horizontal curve, measure the approximate radius in office using an aerial photograph.
Intersection Sight Distance to the LEFT: Calculated Values
Roadway Slope: Starting at the driver position, walk 250 feet to the left alongside the major roadway. At end, place SmartLevel on ground and record slope.
2%
Approach Speed: Remaining 250 feet away, measure vehicle speeds. Use procedures in speed study section of ODOT Safety Investigation Manual.
33 mph (round to 35 mph)
Required Sight Distance: Using the provided table, look up the required sight distance.
335 feet
Approach Speed (mph) Distance to Left (feet) Distance to Right (feet)
30 290 335
35 335 390
40 385 445
Visibility Check Visibility is provided for entire distance.
Is Visibility Met? Yes
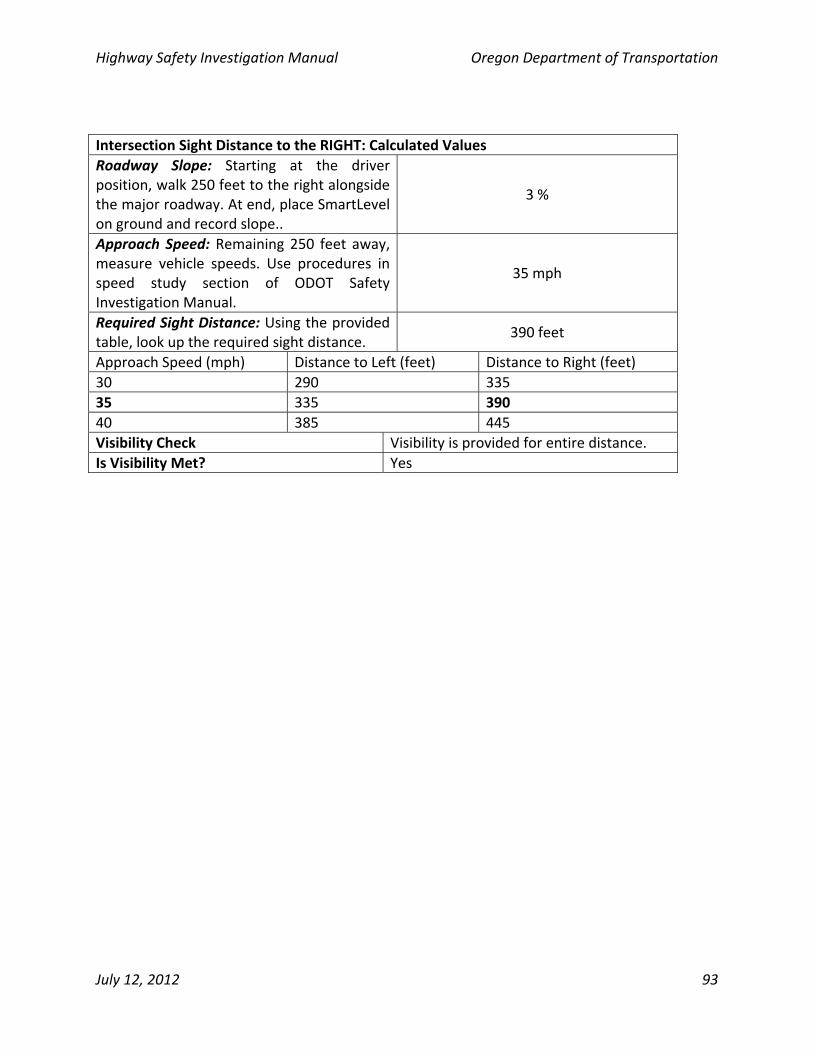
Highway Safety Investigation Manual Oregon Department of Transportation
July 12, 2012 93
Intersection Sight Distance to the RIGHT: Calculated Values
Roadway Slope: Starting at the driver position, walk 250 feet to the right alongside the major roadway. At end, place SmartLevel on ground and record slope..
3 %
Approach Speed: Remaining 250 feet away, measure vehicle speeds. Use procedures in speed study section of ODOT Safety Investigation Manual.
35 mph
Required Sight Distance: Using the provided table, look up the required sight distance.
390 feet
Approach Speed (mph) Distance to Left (feet) Distance to Right (feet)
30 290 335
35 335 390
40 385 445
Visibility Check Visibility is provided for entire distance.
Is Visibility Met? Yes
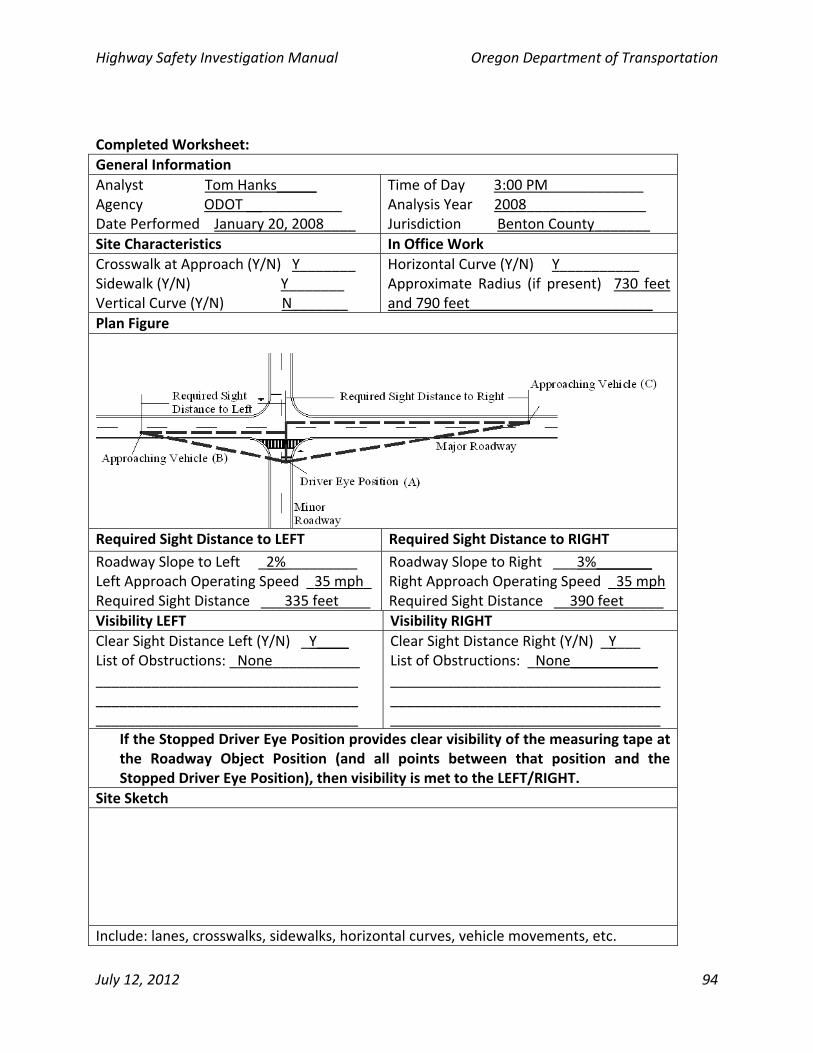
Highway Safety Investigation Manual Oregon Department of Transportation
July 12, 2012 94
Completed Worksheet:
General Information
Analyst Tom Hanks_____ Agency ODOT ____________ Date Performed January 20, 2008____
Time of Day 3:00 PM____________ Analysis Year 2008_______________ Jurisdiction Benton County_______
Site Characteristics In Office Work
Crosswalk at Approach (Y/N) Y_______ Sidewalk (Y/N) Y_______ Vertical Curve (Y/N) N_______
Horizontal Curve (Y/N) Y__________ Approximate Radius (if present) 730 feet and 790 feet_______________________
Plan Figure
Required Sight Distance to LEFT Required Sight Distance to RIGHT
Roadway Slope to Left _2%_________ Left Approach Operating Speed _35 mph_ Required Sight Distance ___335 feet____
Roadway Slope to Right ___3%_______ Right Approach Operating Speed _35 mph Required Sight Distance __390 feet_____
Visibility LEFT Visibility RIGHT
Clear Sight Distance Left (Y/N) _Y____ List of Obstructions: _None___________ _________________________________ _________________________________ _________________________________
Clear Sight Distance Right (Y/N) _Y___ List of Obstructions: _None___________ __________________________________ __________________________________ __________________________________
If the Stopped Driver Eye Position provides clear visibility of the measuring tape at the Roadway Object Position (and all points between that position and the Stopped Driver Eye Position), then visibility is met to the LEFT/RIGHT.
Site Sketch
Include: lanes, crosswalks, sidewalks, horizontal curves, vehicle movements, etc.
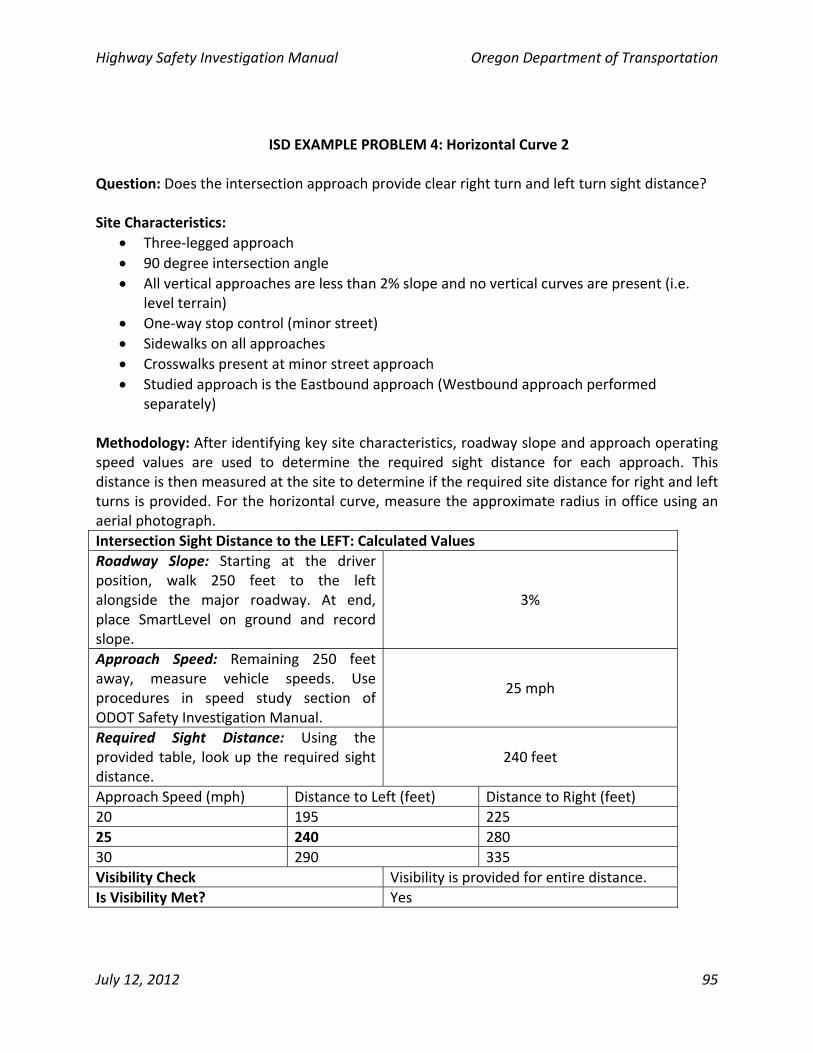
Highway Safety Investigation Manual Oregon Department of Transportation
July 12, 2012 95
ISD EXAMPLE PROBLEM 4: Horizontal Curve 2
Question: Does the intersection approach provide clear right turn and left turn sight distance? Site Characteristics:
Three‐legged approach
90 degree intersection angle
All vertical approaches are less than 2% slope and no vertical curves are present (i.e. level terrain)
One‐way stop control (minor street)
Sidewalks on all approaches
Crosswalks present at minor street approach
Studied approach is the Eastbound approach (Westbound approach performed separately)
Methodology: After identifying key site characteristics, roadway slope and approach operating speed values are used to determine the required sight distance for each approach. This distance is then measured at the site to determine if the required site distance for right and left turns is provided. For the horizontal curve, measure the approximate radius in office using an aerial photograph.
Intersection Sight Distance to the LEFT: Calculated Values
Roadway Slope: Starting at the driver position, walk 250 feet to the left alongside the major roadway. At end, place SmartLevel on ground and record slope.
3%
Approach Speed: Remaining 250 feet away, measure vehicle speeds. Use procedures in speed study section of ODOT Safety Investigation Manual.
25 mph
Required Sight Distance: Using the provided table, look up the required sight distance.
240 feet
Approach Speed (mph) Distance to Left (feet) Distance to Right (feet)
20 195 225
25 240 280
30 290 335
Visibility Check Visibility is provided for entire distance.
Is Visibility Met? Yes
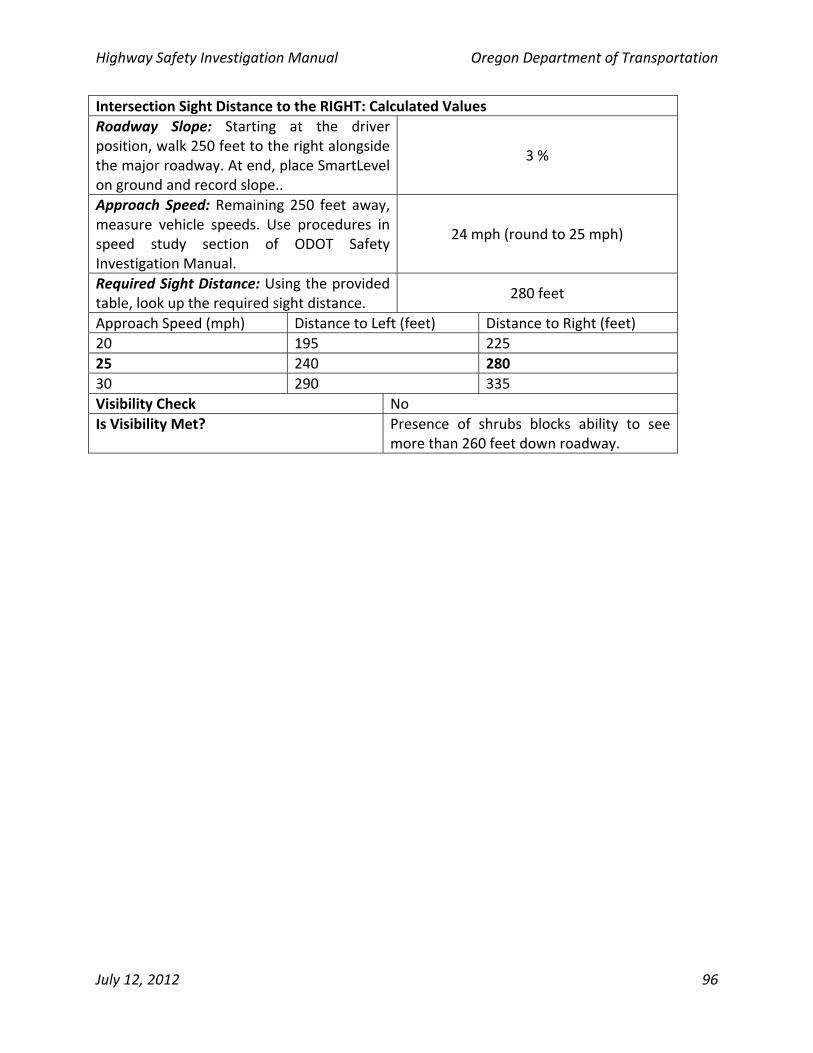
Highway Safety Investigation Manual Oregon Department of Transportation
July 12, 2012 96
Intersection Sight Distance to the RIGHT: Calculated Values
Roadway Slope: Starting at the driver position, walk 250 feet to the right alongside the major roadway. At end, place SmartLevel on ground and record slope..
3 %
Approach Speed: Remaining 250 feet away, measure vehicle speeds. Use procedures in speed study section of ODOT Safety Investigation Manual.
24 mph (round to 25 mph)
Required Sight Distance: Using the provided table, look up the required sight distance.
280 feet
Approach Speed (mph) Distance to Left (feet) Distance to Right (feet)
20 195 225
25 240 280
30 290 335
Visibility Check No
Is Visibility Met? Presence of shrubs blocks ability to see more than 260 feet down roadway.
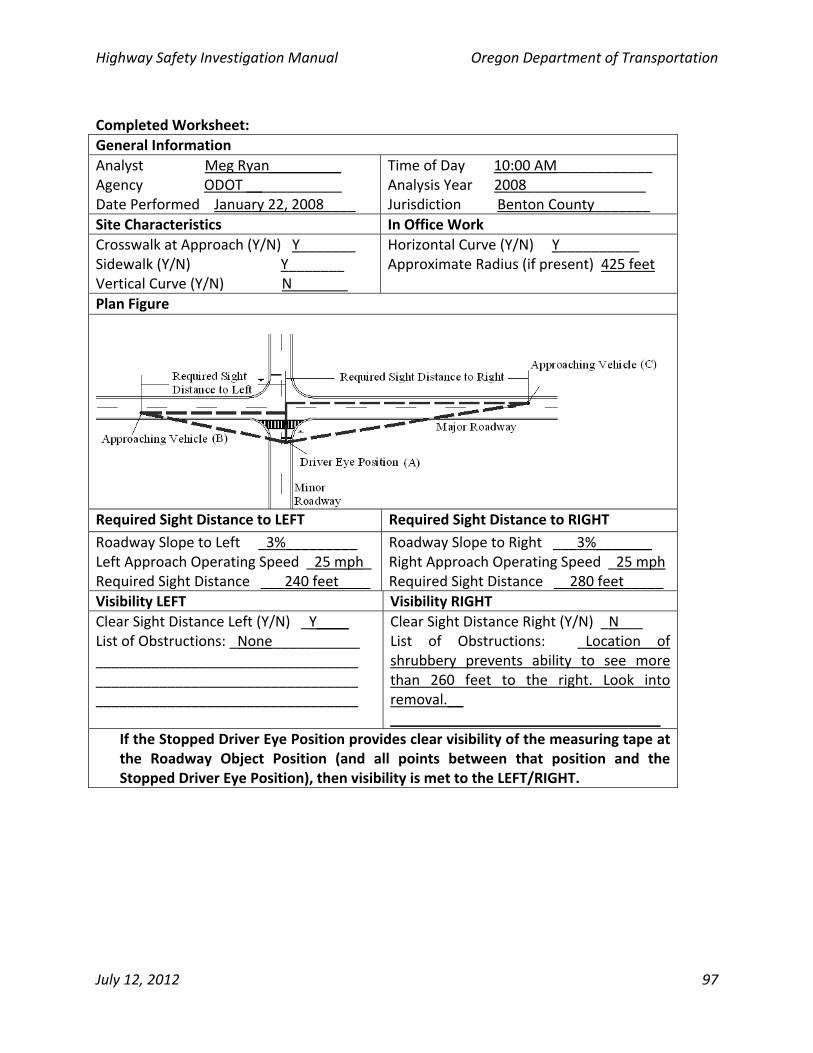
Highway Safety Investigation Manual Oregon Department of Transportation
July 12, 2012 97
Completed Worksheet:
General Information
Analyst Meg Ryan_________ Agency ODOT ____________ Date Performed January 22, 2008____
Time of Day 10:00 AM____________ Analysis Year 2008_______________ Jurisdiction Benton County_______
Site Characteristics In Office Work
Crosswalk at Approach (Y/N) Y_______ Sidewalk (Y/N) Y_______ Vertical Curve (Y/N) N_______
Horizontal Curve (Y/N) Y__________ Approximate Radius (if present) 425 feet
Plan Figure
Required Sight Distance to LEFT Required Sight Distance to RIGHT
Roadway Slope to Left _3%_________ Left Approach Operating Speed _25 mph_ Required Sight Distance ___240 feet____
Roadway Slope to Right ___3%_______ Right Approach Operating Speed _25 mph Required Sight Distance __280 feet_____
Visibility LEFT Visibility RIGHT
Clear Sight Distance Left (Y/N) _Y____ List of Obstructions: _None___________ _________________________________ _________________________________ _________________________________
Clear Sight Distance Right (Y/N) _N___ List of Obstructions: _Location of shrubbery prevents ability to see more than 260 feet to the right. Look into removal.__ __________________________________
If the Stopped Driver Eye Position provides clear visibility of the measuring tape at the Roadway Object Position (and all points between that position and the Stopped Driver Eye Position), then visibility is met to the LEFT/RIGHT.
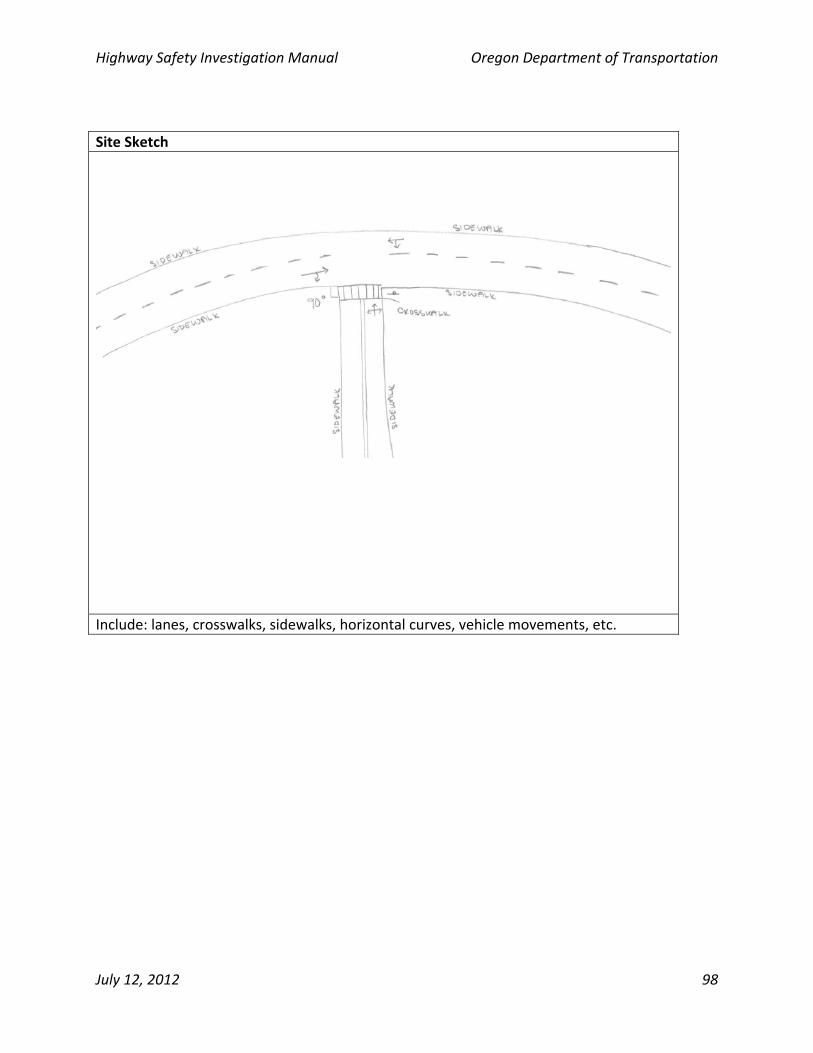
Highway Safety Investigation Manual Oregon Department of Transportation
July 12, 2012 98
Site Sketch
Include: lanes, crosswalks, sidewalks, horizontal curves, vehicle movements, etc.
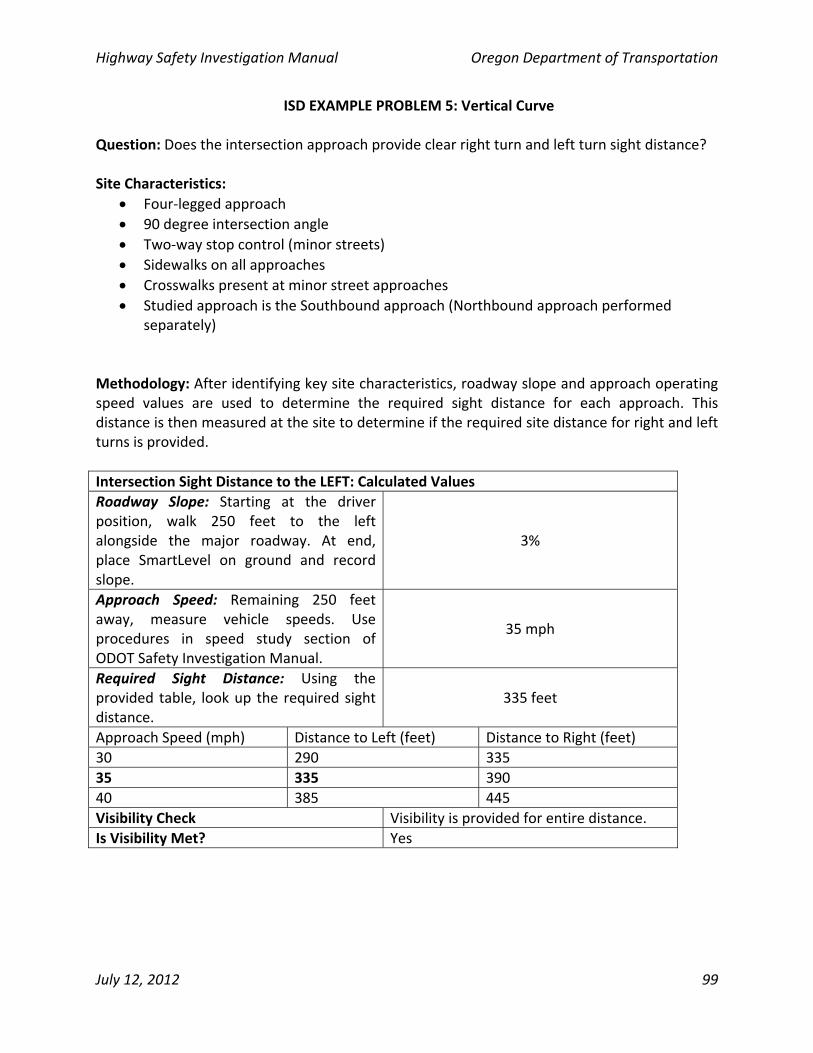
Highway Safety Investigation Manual Oregon Department of Transportation
July 12, 2012 99
ISD EXAMPLE PROBLEM 5: Vertical Curve
Question: Does the intersection approach provide clear right turn and left turn sight distance? Site Characteristics:
Four‐legged approach
90 degree intersection angle
Two‐way stop control (minor streets)
Sidewalks on all approaches
Crosswalks present at minor street approaches
Studied approach is the Southbound approach (Northbound approach performed separately)
Methodology: After identifying key site characteristics, roadway slope and approach operating speed values are used to determine the required sight distance for each approach. This distance is then measured at the site to determine if the required site distance for right and left turns is provided.
Intersection Sight Distance to the LEFT: Calculated Values
Roadway Slope: Starting at the driver position, walk 250 feet to the left alongside the major roadway. At end, place SmartLevel on ground and record slope.
3%
Approach Speed: Remaining 250 feet away, measure vehicle speeds. Use procedures in speed study section of ODOT Safety Investigation Manual.
35 mph
Required Sight Distance: Using the provided table, look up the required sight distance.
335 feet
Approach Speed (mph) Distance to Left (feet) Distance to Right (feet)
30 290 335
35 335 390
40 385 445
Visibility Check Visibility is provided for entire distance.
Is Visibility Met? Yes
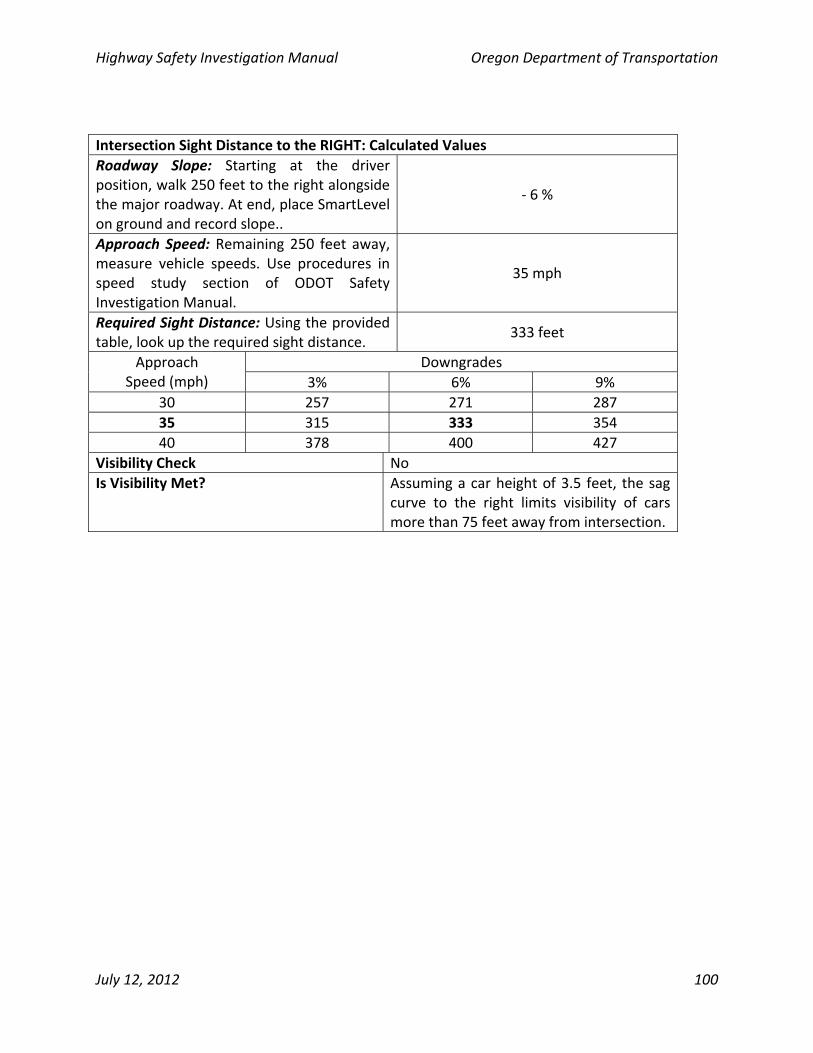
Highway Safety Investigation Manual Oregon Department of Transportation
July 12, 2012 100
Intersection Sight Distance to the RIGHT: Calculated Values
Roadway Slope: Starting at the driver position, walk 250 feet to the right alongside the major roadway. At end, place SmartLevel on ground and record slope..
‐ 6 %
Approach Speed: Remaining 250 feet away, measure vehicle speeds. Use procedures in speed study section of ODOT Safety Investigation Manual.
35 mph
Required Sight Distance: Using the provided table, look up the required sight distance.
333 feet
Downgrades Approach Speed (mph) 3% 6% 9%
30 257 271 287
35 315 333 354
40 378 400 427
Visibility Check No
Is Visibility Met? Assuming a car height of 3.5 feet, the sag curve to the right limits visibility of cars more than 75 feet away from intersection.
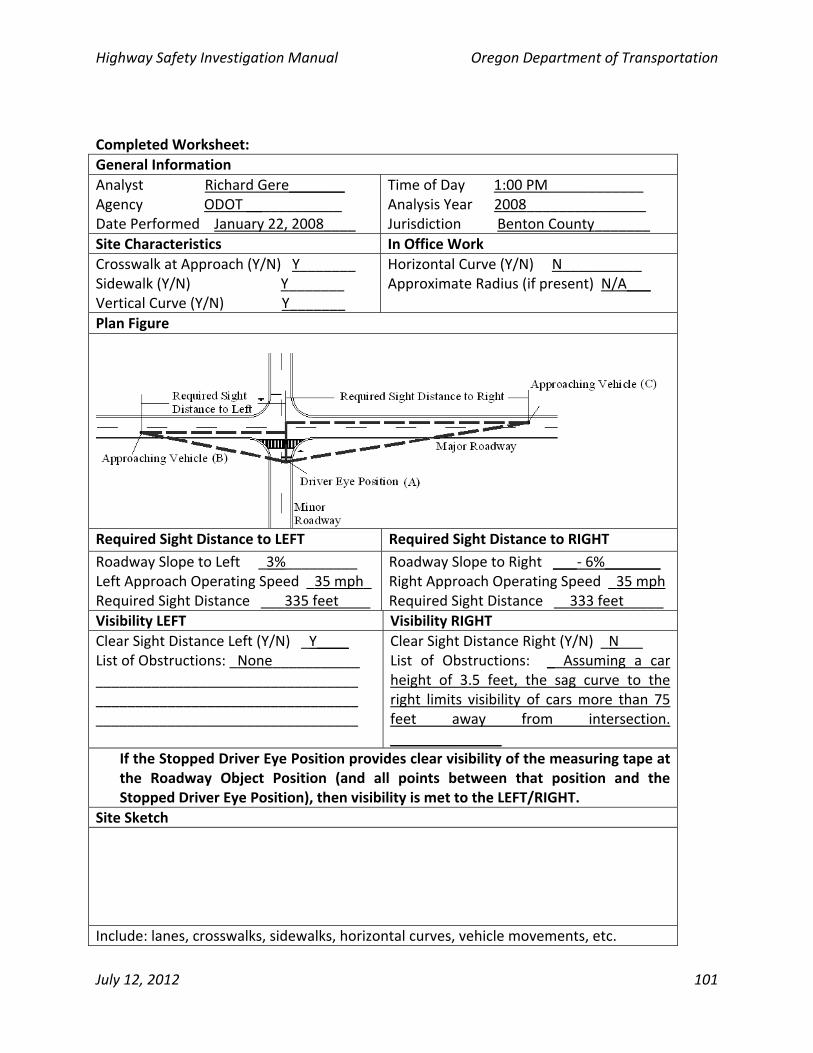
Highway Safety Investigation Manual Oregon Department of Transportation
July 12, 2012 101
Completed Worksheet:
General Information
Analyst Richard Gere_______ Agency ODOT ____________ Date Performed January 22, 2008____
Time of Day 1:00 PM____________ Analysis Year 2008_______________ Jurisdiction Benton County_______
Site Characteristics In Office Work
Crosswalk at Approach (Y/N) Y_______ Sidewalk (Y/N) Y_______ Vertical Curve (Y/N) Y_______
Horizontal Curve (Y/N) N__________ Approximate Radius (if present) N/A___
Plan Figure
Required Sight Distance to LEFT Required Sight Distance to RIGHT
Roadway Slope to Left _3%_________ Left Approach Operating Speed _35 mph_ Required Sight Distance ___335 feet____
Roadway Slope to Right ___‐ 6%_______ Right Approach Operating Speed _35 mph Required Sight Distance __333 feet_____
Visibility LEFT Visibility RIGHT
Clear Sight Distance Left (Y/N) _Y____ List of Obstructions: _None___________ _________________________________ _________________________________ _________________________________
Clear Sight Distance Right (Y/N) _N___ List of Obstructions: _ Assuming a car height of 3.5 feet, the sag curve to the right limits visibility of cars more than 75 feet away from intersection. ______________
If the Stopped Driver Eye Position provides clear visibility of the measuring tape at the Roadway Object Position (and all points between that position and the Stopped Driver Eye Position), then visibility is met to the LEFT/RIGHT.
Site Sketch
Include: lanes, crosswalks, sidewalks, horizontal curves, vehicle movements, etc.
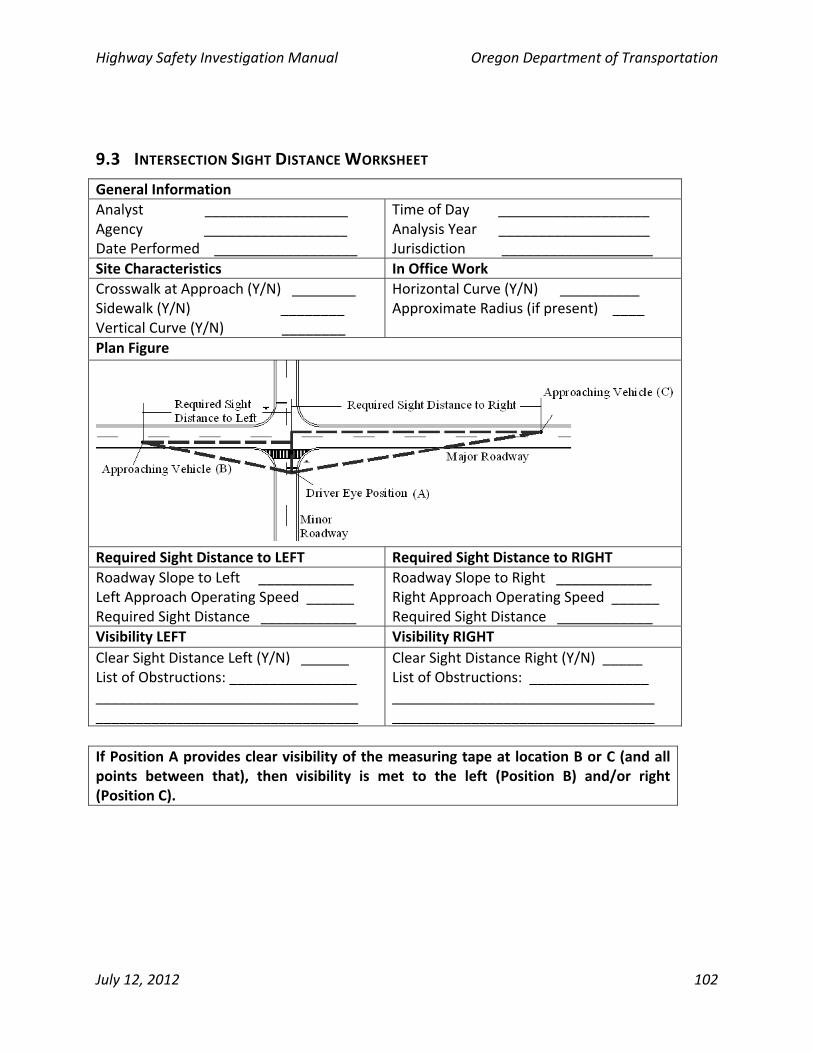
Highway Safety Investigation Manual Oregon Department of Transportation
July 12, 2012 102
9.3 INTERSECTION SIGHT DISTANCE WORKSHEET
General Information
Analyst __________________ Agency __________________ Date Performed __________________
Time of Day ___________________ Analysis Year ___________________ Jurisdiction ___________________
Site Characteristics In Office Work
Crosswalk at Approach (Y/N) ________ Sidewalk (Y/N) ________ Vertical Curve (Y/N) ________
Horizontal Curve (Y/N) __________ Approximate Radius (if present) ____
Plan Figure
Required Sight Distance to LEFT Required Sight Distance to RIGHT
Roadway Slope to Left ____________ Left Approach Operating Speed ______ Required Sight Distance ____________
Roadway Slope to Right ____________ Right Approach Operating Speed ______ Required Sight Distance ____________
Visibility LEFT Visibility RIGHT
Clear Sight Distance Left (Y/N) ______ List of Obstructions: ________________ _________________________________ _________________________________
Clear Sight Distance Right (Y/N) _____ List of Obstructions: _______________ _________________________________ _________________________________
If Position A provides clear visibility of the measuring tape at location B or C (and all points between that), then visibility is met to the left (Position B) and/or right (Position C).
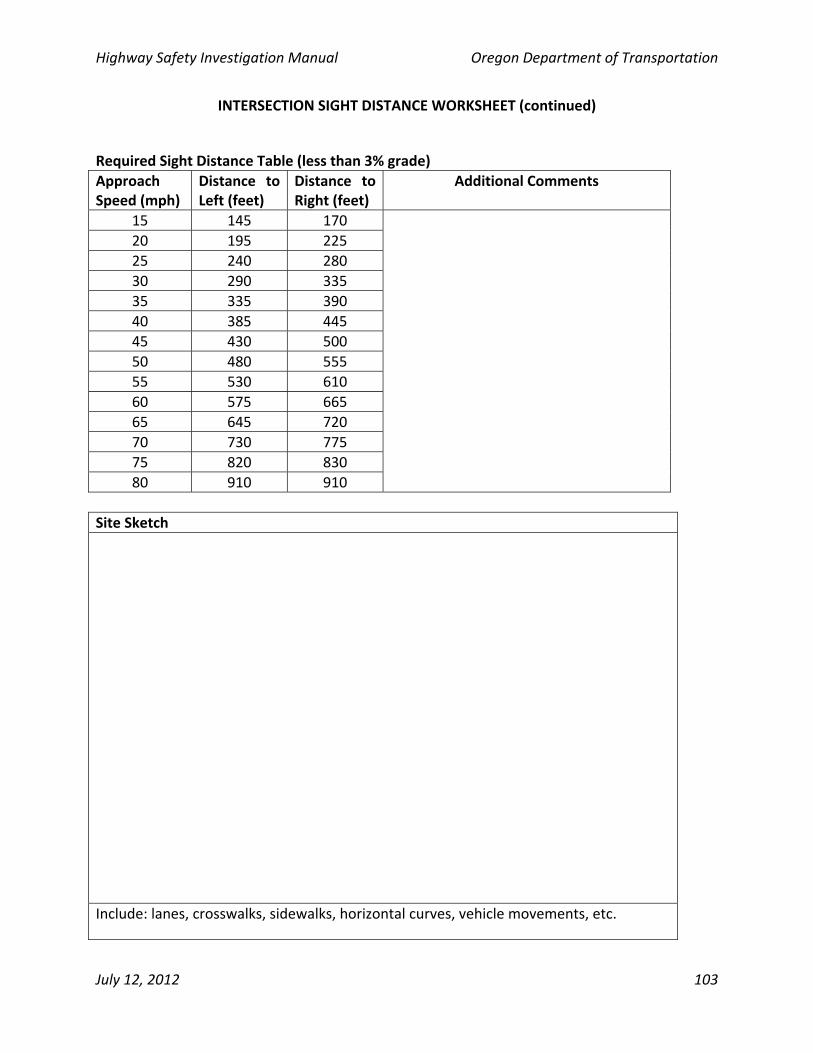
Highway Safety Investigation Manual Oregon Department of Transportation
July 12, 2012 103
INTERSECTION SIGHT DISTANCE WORKSHEET (continued)
Required Sight Distance Table (less than 3% grade)
Approach Speed (mph)
Distance to Left (feet)
Distance to Right (feet)
Additional Comments
15 145 170
20 195 225
25 240 280
30 290 335
35 335 390
40 385 445
45 430 500
50 480 555
55 530 610
60 575 665
65 645 720
70 730 775
75 820 830
80 910 910
Site Sketch
Include: lanes, crosswalks, sidewalks, horizontal curves, vehicle movements, etc.

Highway Safety Investigation Manual Oregon Department of Transportation
July 12, 2012 104
Page Intentionally Blank

Highway Safety Investigation Manual Oregon Department of Transportation
July 12, 2012 105
10 APPENDIX B – WORKSHEETS

Highway Safety Investigation Manual Oregon Department of Transportation
July 12, 2012 106
Page Intentionally Blank
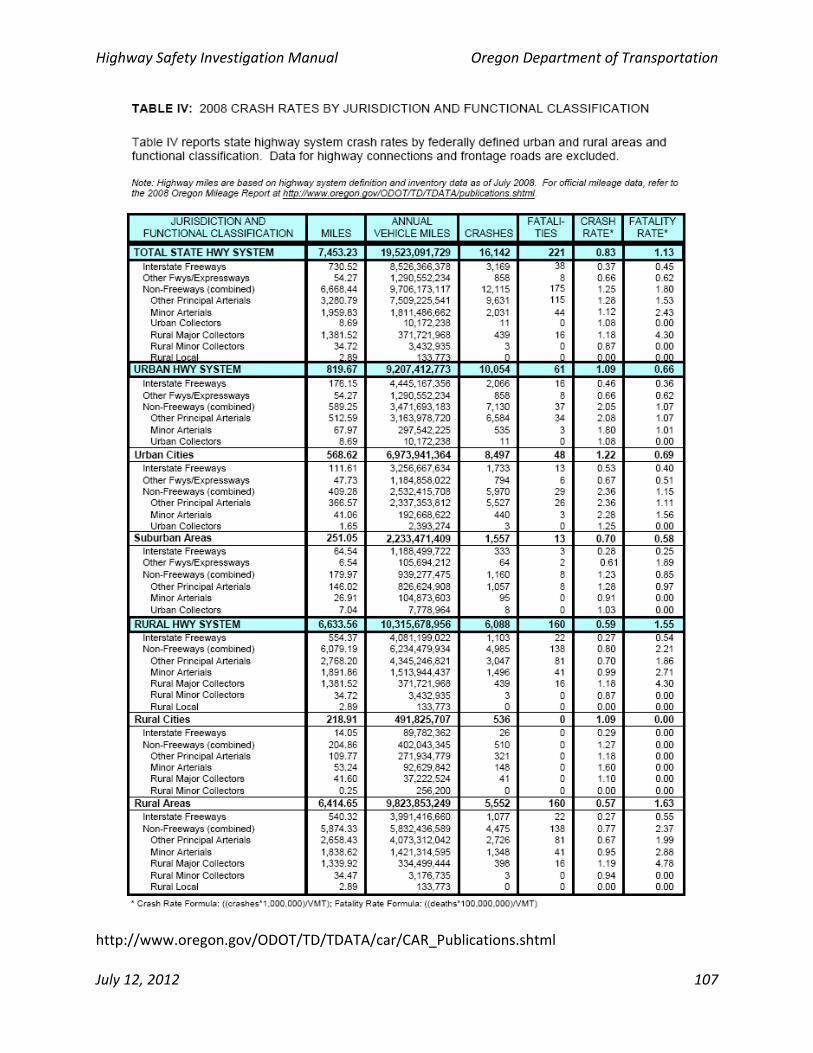
Highway Safety Investigation Manual Oregon Department of Transportation
July 12, 2012 107
http://www.oregon.gov/ODOT/TD/TDATA/car/CAR_Publications.shtml
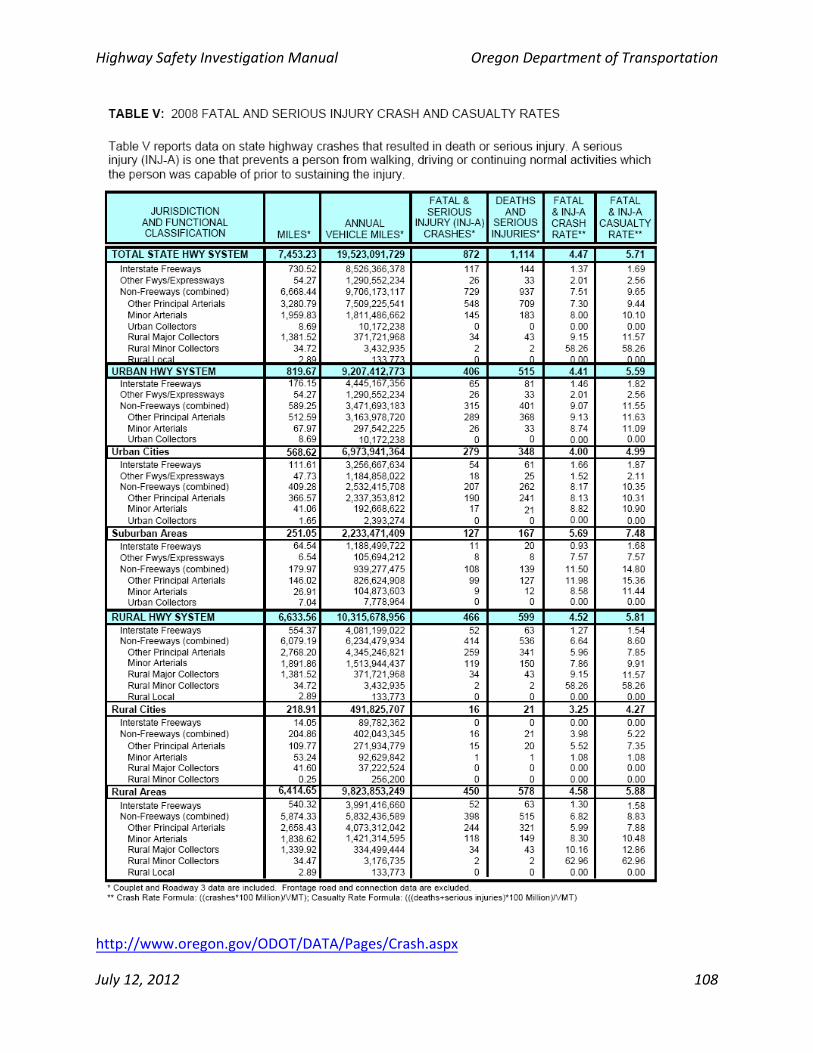
Highway Safety Investigation Manual Oregon Department of Transportation
108
http://www.oregon.gov/ODOT/DATA/Pages/Crash.aspx
July 12, 2012
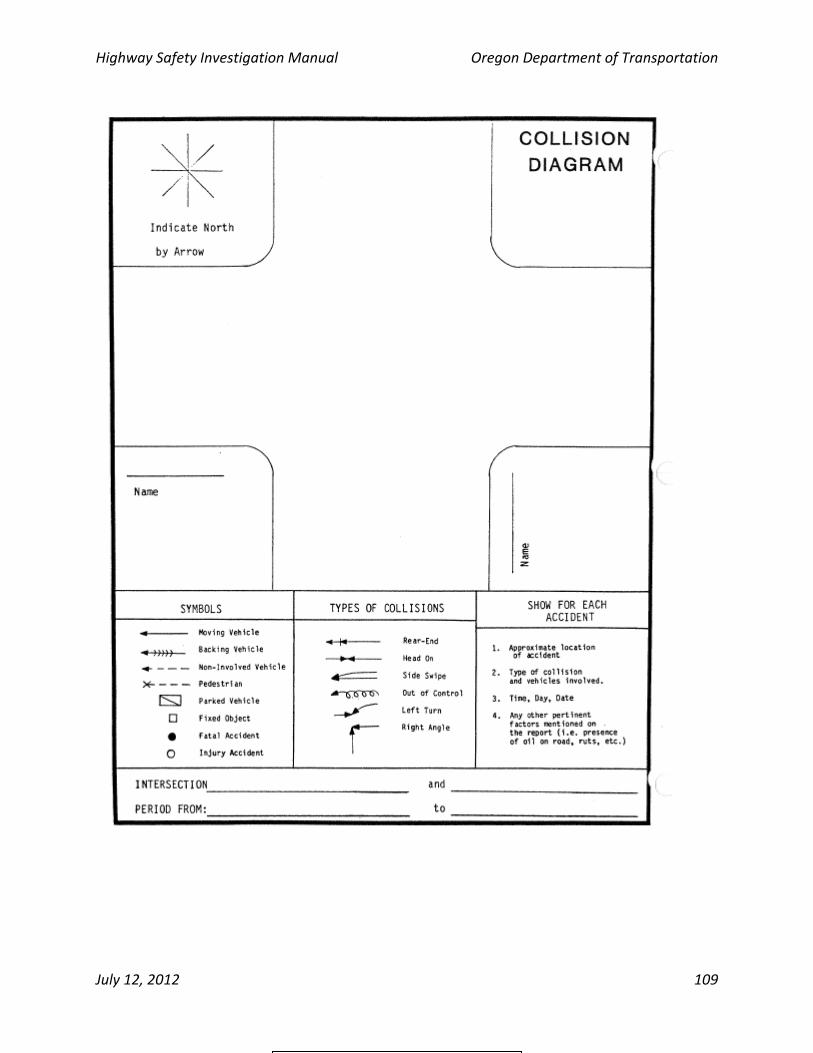
Highway Safety Investigation Manual Oregon Department of Transportation
July 12, 2012 109
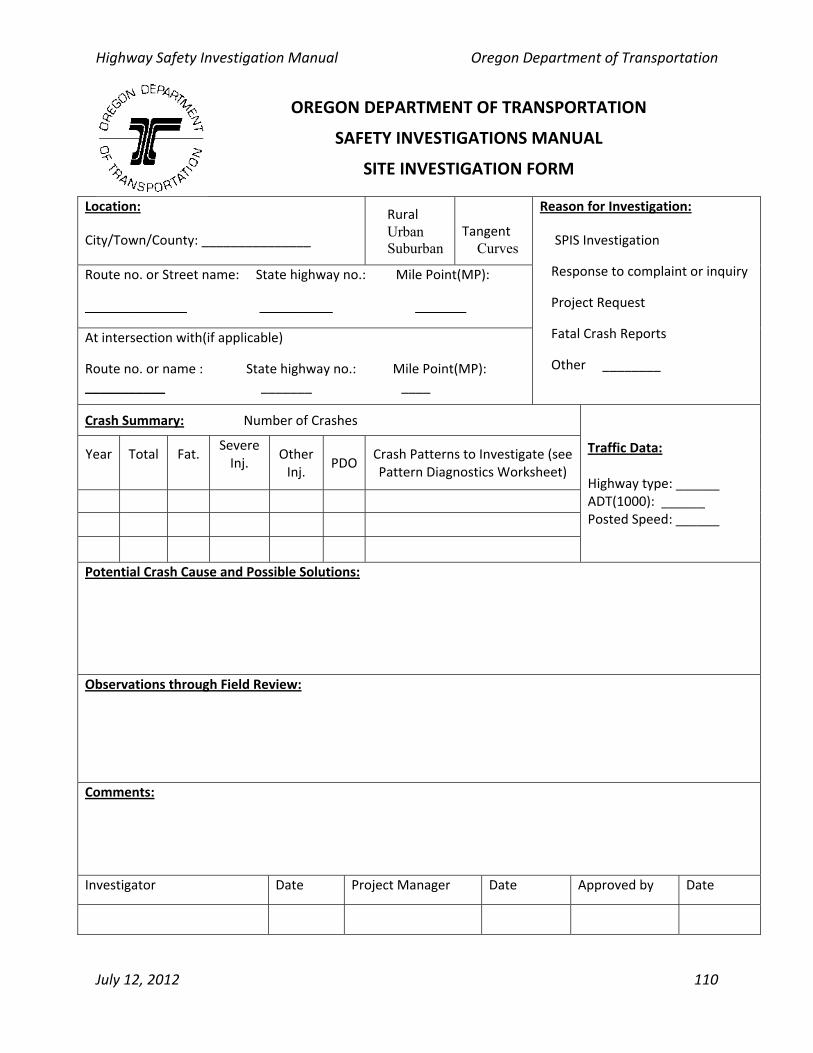
Highway Safety Investigation Manual Oregon Department of Transportation
July 12, 2012 110
OREGON DEPARTMENT OF TRANSPORTATION
SAFETY INVESTIGATIONS MANUAL
SITE INVESTIGATION FORM
Location:
City/Town/County: _______________
� Rural � Urban � Suburban
� Tangent � Curves
Route no. or Street name: State highway no.: Mile Point(MP):
______________ __________ _______
At intersection with(if applicable)
Route no. or name : State highway no.: Mile Point(MP): ___________ _______ ____
Reason for Investigation:
� SPIS Investigation
�Response to complaint or inquiry
�Project Request
�Fatal Crash Reports
�Other ________
Crash Summary: Number of Crashes
Year
Total
Fat.
Severe Inj.
Other Inj.
PDO Crash Patterns to Investigate (see Pattern Diagnostics Worksheet)
Traffic Data: Highway type: ______ ADT(1000): ______ Posted Speed: ______
Potential Crash Cause and Possible Solutions:
Observations through Field Review:
Comments:
Investigator Date Project Manager Date Approved by Date
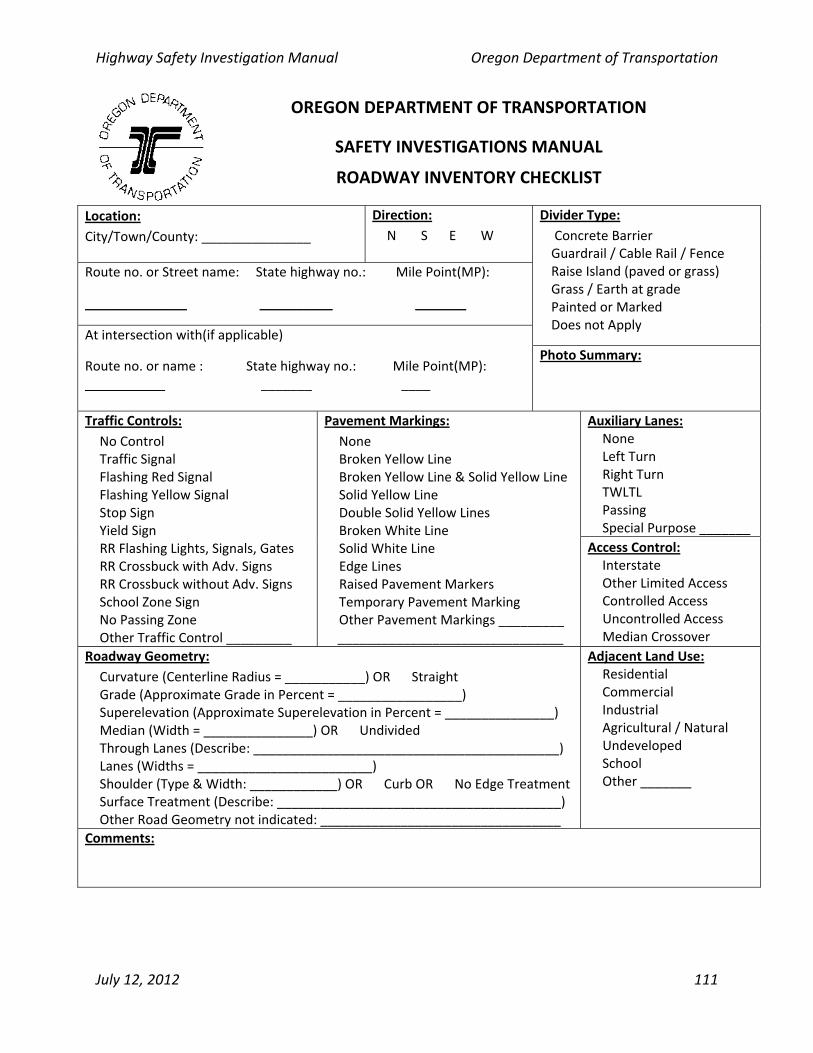
Highway Safety Investigation Manual Oregon Department of Transportation
July 12, 2012 111
OREGON DEPARTMENT OF TRANSPORTATION
SAFETY INVESTIGATIONS MANUAL
ROADWAY INVENTORY CHECKLIST
Location:
City/Town/County: _______________
Direction:
� N � S � E � W
Route no. or Street name: State highway no.: Mile Point(MP):
______________ __________ _______
Divider Type:
� Concrete Barrier �Guardrail / Cable Rail / Fence �Raise Island (paved or grass) �Grass / Earth at grade �Painted or Marked �Does not Apply
At intersection with(if applicable)
Route no. or name : State highway no.: Mile Point(MP): ___________ _______ ____
Photo Summary:
Auxiliary Lanes: � None � Left Turn � Right Turn � TWLTL � Passing � Special Purpose _______
Traffic Controls:
� No Control � Traffic Signal � Flashing Red Signal � Flashing Yellow Signal � Stop Sign � Yield Sign � RR Flashing Lights, Signals, Gates � RR Crossbuck with Adv. Signs � RR Crossbuck without Adv. Signs � School Zone Sign � No Passing Zone � Other Traffic Control _________
Pavement Markings:
� None � Broken Yellow Line � Broken Yellow Line & Solid Yellow Line � Solid Yellow Line � Double Solid Yellow Lines � Broken White Line � Solid White Line � Edge Lines � Raised Pavement Markers � Temporary Pavement Marking � Other Pavement Markings _________ _______________________________
Access Control: � Interstate � Other Limited Access � Controlled Access � Uncontrolled Access � Median Crossover
Roadway Geometry:
� Curvature (Centerline Radius = ___________) OR � Straight � Grade (Approximate Grade in Percent = _________________) � Superelevation (Approximate Superelevation in Percent = _______________) � Median (Width = _______________) OR � Undivided � Through Lanes (Describe: __________________________________________) � Lanes (Widths = ________________________) � Shoulder (Type & Width: ____________) OR � Curb OR � No Edge Treatment � Surface Treatment (Describe: _______________________________________) � Other Road Geometry not indicated: _________________________________
Adjacent Land Use: � Residential � Commercial � Industrial � Agricultural / Natural � Undeveloped � School � Other _______
Comments:
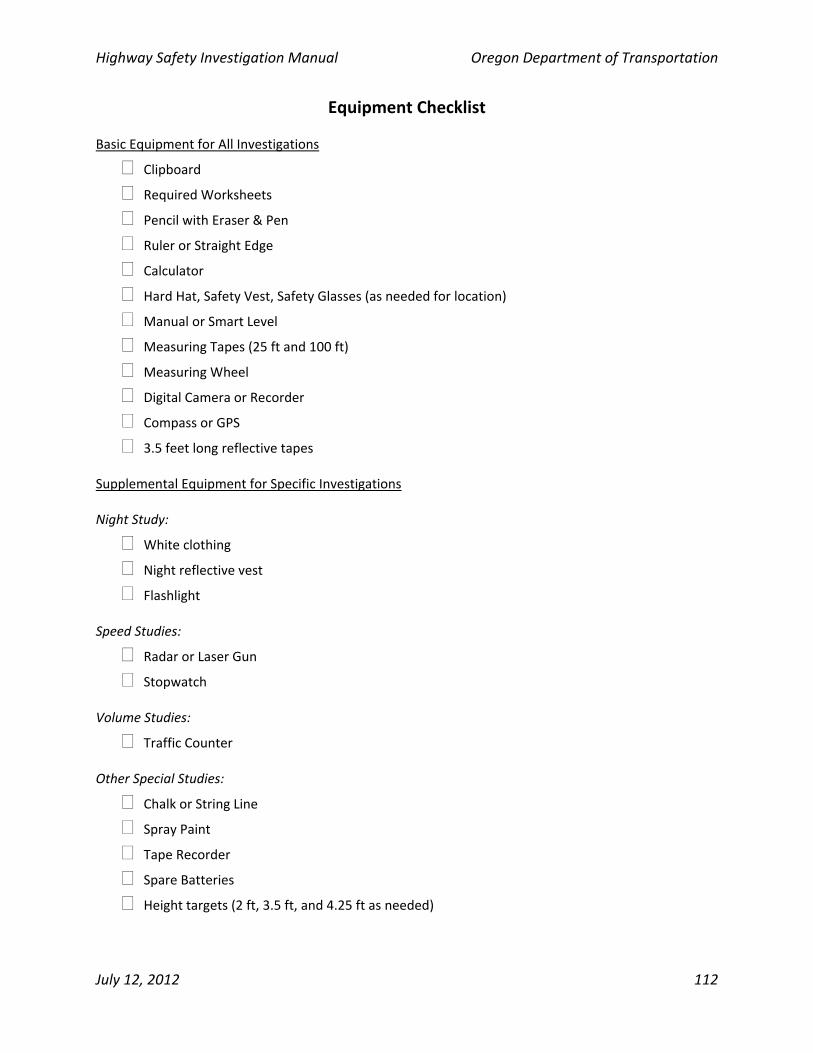
Highway Safety Investigation Manual Oregon Department of Transportation
July 12, 2012 112
Equipment Checklist
Basic Equipment for All Investigations
Clipboard
Required Worksheets
Pencil with Eraser & Pen
Ruler or Straight Edge
Calculator
Hard Hat, Safety Vest, Safety Glasses (as needed for location)
Manual or Smart Level
Measuring Tapes (25 ft and 100 ft)
Measuring Wheel
Digital Camera or Recorder
Compass or GPS
3.5 feet long reflective tapes Supplemental Equipment for Specific Investigations Night Study:
White clothing
Night reflective vest
Flashlight Speed Studies:
Radar or Laser Gun
Stopwatch Volume Studies:
Traffic Counter Other Special Studies:
Chalk or String Line
Spray Paint
Tape Recorder
Spare Batteries
Height targets (2 ft, 3.5 ft, and 4.25 ft as needed)
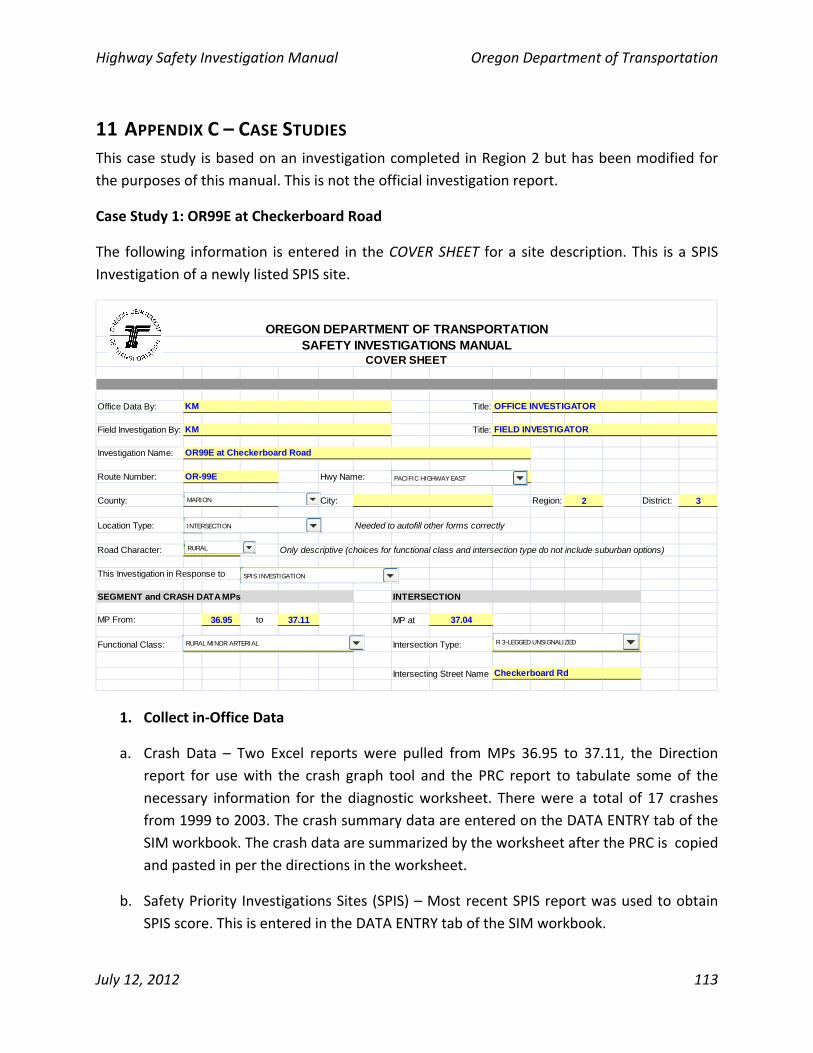
Highway Safety Investigation Manual Oregon Department of Transportation
July 12, 2012 113
11 APPENDIX C – CASE STUDIES This case study is based on an investigation completed in Region 2 but has been modified for
the purposes of this manual. This is not the official investigation report.
Case Study 1: OR99E at Checkerboard Road
The following information is entered in the COVER SHEET for a site description. This is a SPIS
Investigation of a newly listed SPIS site.
Office Data By: Title:
Field Investigation By: Title:
Investigation Name:
Route Number: Hwy Name: PACIFIC HIGHWAY EAST
County: MARION City: Region: 2 District: 3
Location Type: RURAL Needed to autofill other forms correctly
Road Character: RURAL Only descriptive (choices for functional class and intersection type do not include suburban options)
This Investigation in Response to
SEGMENT and CRASH DATA MPs INTERSECTION
MP From: 36.95 to 37.11 MP at 37.04
Functional Class: Intersection Type:
Intersecting Street Name Checkerboard Rd
SPIS INVESTIGATION
R 3-LEGGED UNSIGNALIZED
FIELD INVESTIGATOR
RURAL MINOR ARTERIAL
OR-99E
OFFICE INVESTIGATOR
OREGON DEPARTMENT OF TRANSPORTATIONSAFETY INVESTIGATIONS MANUAL
COVER SHEET
OR99E at Checkerboard Road
KM
KM
PACIFIC HIGHWAY EAST
MARION
R 3-LEGGED UNSIGNALIZEDRURAL MINOR ARTERIAL
INTERSECTION
RURAL
SPIS INVESTIGATION
1. Collect in‐Office Data
a. Crash Data – Two Excel reports were pulled from MPs 36.95 to 37.11, the Direction
report for use with the crash graph tool and the PRC report to tabulate some of the
necessary information for the diagnostic worksheet. There were a total of 17 crashes
from 1999 to 2003. The crash summary data are entered on the DATA ENTRY tab of the
SIM workbook. The crash data are summarized by the worksheet after the PRC is copied
and pasted in per the directions in the worksheet.
b. Safety Priority Investigations Sites (SPIS) – Most recent SPIS report was used to obtain
SPIS score. This is entered in the DATA ENTRY tab of the SIM workbook.
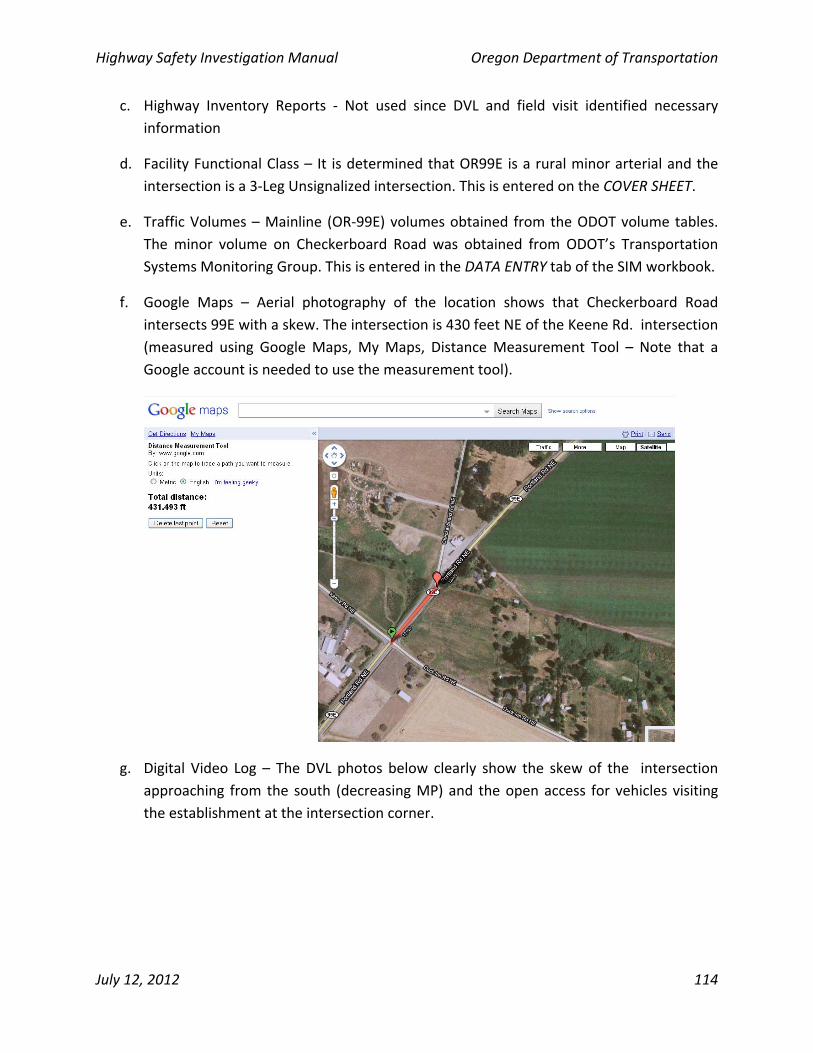
Highway Safety Investigation Manual Oregon Department of Transportation
July 12, 2012 114
c. Highway Inventory Reports ‐ Not used since DVL and field visit identified necessary
information
d. Facility Functional Class – It is determined that OR99E is a rural minor arterial and the
intersection is a 3‐Leg Unsignalized intersection. This is entered on the COVER SHEET.
e. Traffic Volumes – Mainline (OR‐99E) volumes obtained from the ODOT volume tables.
The minor volume on Checkerboard Road was obtained from ODOT’s Transportation
Systems Monitoring Group. This is entered in the DATA ENTRY tab of the SIM workbook.
f. Google Maps – Aerial photography of the location shows that Checkerboard Road
intersects 99E with a skew. The intersection is 430 feet NE of the Keene Rd. intersection
(measured using Google Maps, My Maps, Distance Measurement Tool – Note that a
Google account is needed to use the measurement tool).
g. Digital Video Log – The DVL photos below clearly show the skew of the intersection
approaching from the south (decreasing MP) and the open access for vehicles visiting
the establishment at the intersection corner.
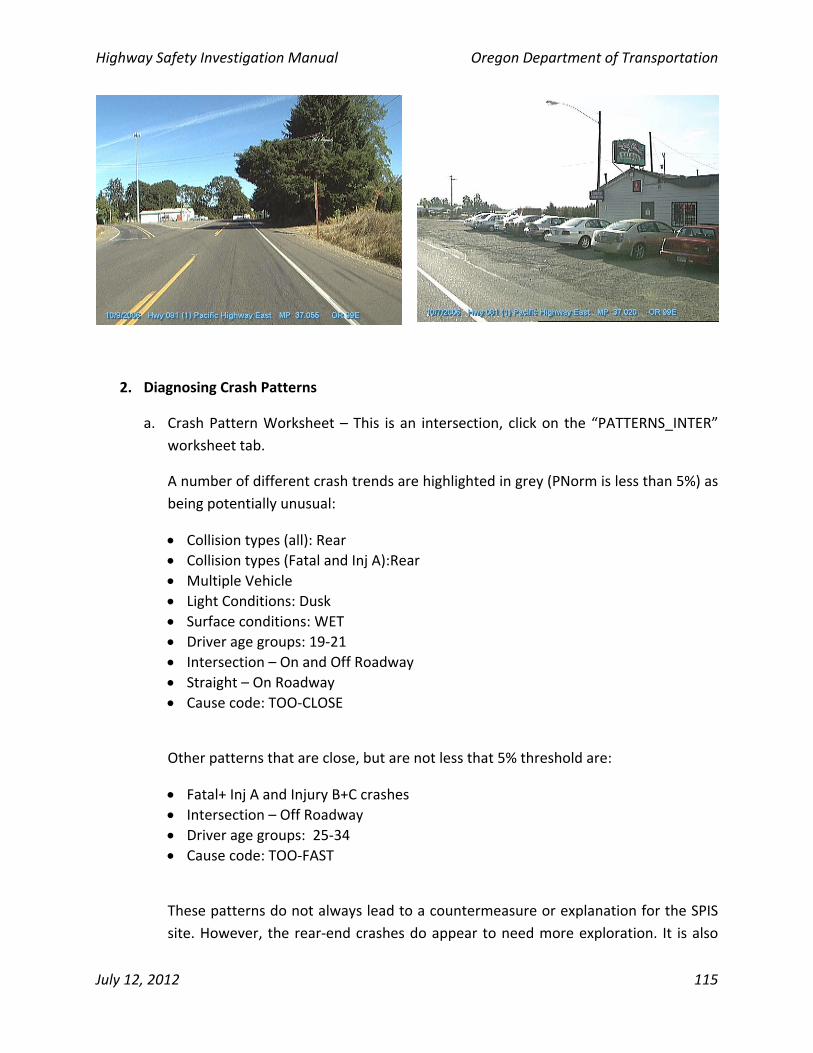
Highway Safety Investigation Manual Oregon Department of Transportation
July 12, 2012 115
2. Diagnosing Crash Patterns
a. Crash Pattern Worksheet – This is an intersection, click on the “PATTERNS_INTER”
worksheet tab.
A number of different crash trends are highlighted in grey (PNorm is less than 5%) as
being potentially unusual:
Collision types (all): Rear
Collision types (Fatal and Inj A):Rear
Multiple Vehicle
Light Conditions: Dusk
Surface conditions: WET
Driver age groups: 19‐21
Intersection – On and Off Roadway
Straight – On Roadway
Cause code: TOO‐CLOSE
Other patterns that are close, but are not less that 5% threshold are:
Fatal+ Inj A and Injury B+C crashes
Intersection – Off Roadway
Driver age groups: 25‐34
Cause code: TOO‐FAST
These patterns do not always lead to a countermeasure or explanation for the SPIS
site. However, the rear‐end crashes do appear to need more exploration. It is also
Highway Safety Investigation Manual Oregon Department of Transportation
July 12, 2012 116
good to note that all drivers are local. The intersection crash rate is not FLAGGED as
exceeding the critical rate for 3‐Leg Unsignalized intersections.
b. Collision Diagrams – A collision diagram was requested from CAR. Inspection of the
diagram clearly shows the pattern of rear‐end and turning collisions that related to
both the northbound vehicles turning left on to Checkerboard Road and what
appears to be waiting to turn left into the tavern.
3. Site Investigations
a. After reviewing the crash data in‐office, the investigator should have a good idea
what the potential problems at the intersection might be. A field visit would focus
on observations of vehicle entering and exiting the business property. Since the
most crashes occurred in the afternoon, a field visit during this time period would be
appropriate.
The two crash patterns to browse in Table 3 would be “Rear‐end collisions at
unsignalized intersections” and “Collisions at driveways”. The table suggests
documenting and investigating:
Location and visibility of crosswalks and stop bars
Location and visibility of stop/yield signs
Location and visibility of advance warning signs
Sight distance obstructions
Peak hour, 4‐hour, and 8‐hour traffic volumes
Pedestrian volumes
Upstream operating speeds for high‐speed approaches
Sight distance obstructions
Conspicuity of pavement marking and signs
Number of lanes / lane widths / lane usage
Location and measurement of median openings
Location and description of driveway width and geometry, surface type, condition of driveway
Shoulder type, width and condition
Location and visibility of advance warning signs
Sight distance obstructions
Lighting
SUMMARY OF DATA ANALYSIS AND FIELD INVESTIGATION:
Checkerboard Rd (County) joins OR 99E at a skew and is in close proximity to the Keen Rd/
Duckin intersection. On the gore point is a business (tavern) with open front access to 99E and
Highway Safety Investigation Manual Oregon Department of Transportation
July 12, 2012 117
open access to Checkerboard Rd. Vehicles park along the open frontage and back out onto the
roadway from the business. Crash patterns (collision diagram and diagnostic form) reveal that
rear‐end crashes of vehicles turning from 99E to access business and tavern are
overrepresented. Sight distance does not appear to be an issue.
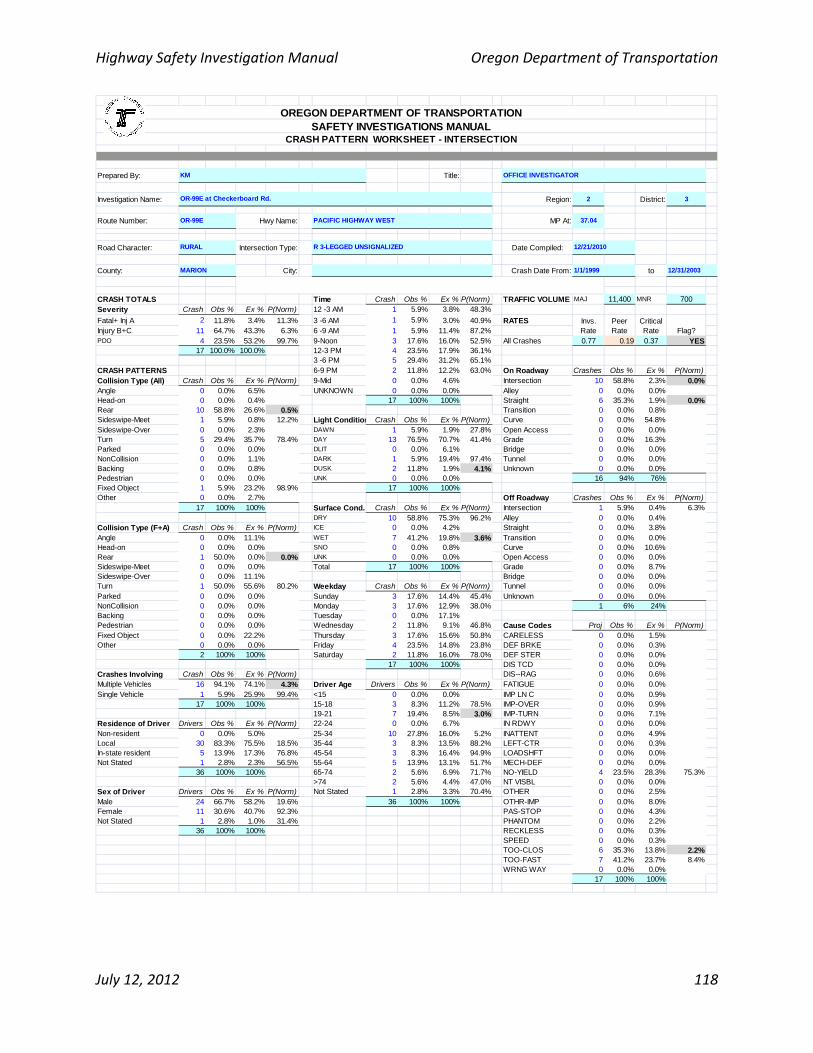
Highway Safety Investigation Manual Oregon Department of Transportation
July 12, 2012 118
Prepared By: Title:
Investigation Name: Region: 2 District: 3
Route Number: OR-99E Hwy Name: PACIFIC HIGHWAY WEST MP At: 37.04
Road Character: Intersection Type: Date Compiled:
County: City: Crash Date From: to 12/31/2003
CRASH TOTALS Time Crash Obs % Ex % P(Norm) TRAFFIC VOLUME MAJ 11,400 MNR 700Severity Crash Obs % Ex % P(Norm) 12 -3 AM 1 5.9% 3.8% 48.3%
Fatal+ Inj A 2 11.8% 3.4% 11.3% 3 -6 AM 1 5.9% 3.0% 40.9% RATESInjury B+C 11 64.7% 43.3% 6.3% 6 -9 AM 1 5.9% 11.4% 87.2%PDO 4 23.5% 53.2% 99.7% 9-Noon 3 17.6% 16.0% 52.5% All Crashes 0.77 0.19 0.37 YES
17 100.0% 100.0% 12-3 PM 4 23.5% 17.9% 36.1%3 -6 PM 5 29.4% 31.2% 65.1%
CRASH PATTERNS 6-9 PM 2 11.8% 12.2% 63.0% On Roadway Crashes Obs % Ex % P(Norm)Collision Type (All) Crash Obs % Ex % P(Norm) 9-Mid 0 0.0% 4.6% Intersection 10 58.8% 2.3% 0.0%Angle 0 0.0% 6.5% UNKNOWN 0 0.0% 0.0% Alley 0 0.0% 0.0%Head-on 0 0.0% 0.4% 17 100% 100% Straight 6 35.3% 1.9% 0.0%Rear 10 58.8% 26.6% 0.5% Transition 0 0.0% 0.8%Sideswipe-Meet 1 5.9% 0.8% 12.2% Light Condition Crash Obs % Ex % P(Norm) Curve 0 0.0% 54.8%Sideswipe-Over 0 0.0% 2.3% DAWN 1 5.9% 1.9% 27.8% Open Access 0 0.0% 0.0%Turn 5 29.4% 35.7% 78.4% DAY 13 76.5% 70.7% 41.4% Grade 0 0.0% 16.3%Parked 0 0.0% 0.0% DLIT 0 0.0% 6.1% Bridge 0 0.0% 0.0%NonCollision 0 0.0% 1.1% DARK 1 5.9% 19.4% 97.4% Tunnel 0 0.0% 0.0%Backing 0 0.0% 0.8% DUSK 2 11.8% 1.9% 4.1% Unknown 0 0.0% 0.0%Pedestrian 0 0.0% 0.0% UNK 0 0.0% 0.0% 16 94% 76%Fixed Object 1 5.9% 23.2% 98.9% 17 100% 100%Other 0 0.0% 2.7% Off Roadway Crashes Obs % Ex % P(Norm)
17 100% 100% Surface Cond. Crash Obs % Ex % P(Norm) Intersection 1 5.9% 0.4% 6.3%DRY 10 58.8% 75.3% 96.2% Alley 0 0.0% 0.4%
Collision Type (F+A) Crash Obs % Ex % P(Norm) ICE 0 0.0% 4.2% Straight 0 0.0% 3.8%Angle 0 0.0% 11.1% WET 7 41.2% 19.8% 3.6% Transition 0 0.0% 0.0%Head-on 0 0.0% 0.0% SNO 0 0.0% 0.8% Curve 0 0.0% 10.6%Rear 1 50.0% 0.0% 0.0% UNK 0 0.0% 0.0% Open Access 0 0.0% 0.0%Sideswipe-Meet 0 0.0% 0.0% Total 17 100% 100% Grade 0 0.0% 8.7%Sideswipe-Over 0 0.0% 11.1% Bridge 0 0.0% 0.0%Turn 1 50.0% 55.6% 80.2% Weekday Crash Obs % Ex % P(Norm) Tunnel 0 0.0% 0.0%Parked 0 0.0% 0.0% Sunday 3 17.6% 14.4% 45.4% Unknown 0 0.0% 0.0%NonCollision 0 0.0% 0.0% Monday 3 17.6% 12.9% 38.0% 1 6% 24%Backing 0 0.0% 0.0% Tuesday 0 0.0% 17.1%Pedestrian 0 0.0% 0.0% Wednesday 2 11.8% 9.1% 46.8% Cause Codes Proj Obs % Ex % P(Norm)Fixed Object 0 0.0% 22.2% Thursday 3 17.6% 15.6% 50.8% CARELESS 0 0.0% 1.5%Other 0 0.0% 0.0% Friday 4 23.5% 14.8% 23.8% DEF BRKE 0 0.0% 0.3%
2 100% 100% Saturday 2 11.8% 16.0% 78.0% DEF STER 0 0.0% 0.0%17 100% 100% DIS TCD 0 0.0% 0.0%
Crashes Involving Crash Obs % Ex % P(Norm) DIS--RAG 0 0.0% 0.6%Multiple Vehicles 16 94.1% 74.1% 4.3% Driver Age Drivers Obs % Ex % P(Norm) FATIGUE 0 0.0% 0.0%Single Vehicle 1 5.9% 25.9% 99.4% <15 0 0.0% 0.0% IMP LN C 0 0.0% 0.9%
17 100% 100% 15-18 3 8.3% 11.2% 78.5% IMP-OVER 0 0.0% 0.9%19-21 7 19.4% 8.5% 3.0% IMP-TURN 0 0.0% 7.1%
Residence of Driver Drivers Obs % Ex % P(Norm) 22-24 0 0.0% 6.7% IN RDWY 0 0.0% 0.0%Non-resident 0 0.0% 5.0% 25-34 10 27.8% 16.0% 5.2% INATTENT 0 0.0% 4.9%Local 30 83.3% 75.5% 18.5% 35-44 3 8.3% 13.5% 88.2% LEFT-CTR 0 0.0% 0.3%In-state resident 5 13.9% 17.3% 76.8% 45-54 3 8.3% 16.4% 94.9% LOADSHFT 0 0.0% 0.0%Not Stated 1 2.8% 2.3% 56.5% 55-64 5 13.9% 13.1% 51.7% MECH-DEF 0 0.0% 0.0%
36 100% 100% 65-74 2 5.6% 6.9% 71.7% NO-YIELD 4 23.5% 28.3% 75.3%>74 2 5.6% 4.4% 47.0% NT VISBL 0 0.0% 0.0%
Sex of Driver Drivers Obs % Ex % P(Norm) Not Stated 1 2.8% 3.3% 70.4% OTHER 0 0.0% 2.5%Male 24 66.7% 58.2% 19.6% 36 100% 100% OTHR-IMP 0 0.0% 8.0%Female 11 30.6% 40.7% 92.3% PAS-STOP 0 0.0% 4.3%Not Stated 1 2.8% 1.0% 31.4% PHANTOM 0 0.0% 2.2%
36 100% 100% RECKLESS 0 0.0% 0.3%SPEED 0 0.0% 0.3%TOO-CLOS 6 35.3% 13.8% 2.2%TOO-FAST 7 41.2% 23.7% 8.4%WRNG WAY 0 0.0% 0.0%
17 100% 100%
OREGON DEPARTMENT OF TRANSPORTATIONSAFETY INVESTIGATIONS MANUAL
CRASH PATTERN WORKSHEET - INTERSECTION
KM OFFICE INVESTIGATOR
OR-99E at Checkerboard Rd.
Critical Rate Flag?
R 3-LEGGED UNSIGNALIZED 12/21/2010
1/1/1999MARION
RURAL
Invs. Rate
Peer Rate
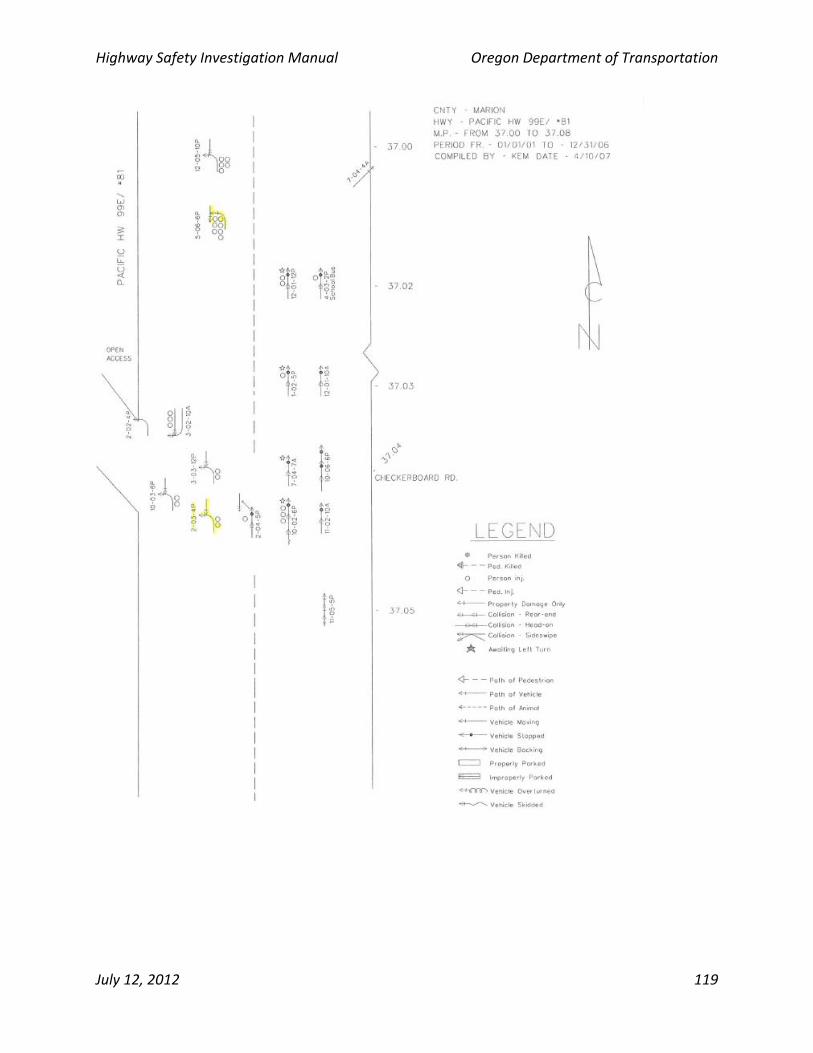
Highway Safety Investigation Manual Oregon Department of Transportation
July 12, 2012 119
Highway Safety Investigation Manual Oregon Department of Transportation
July 12, 2012 120
4. Identify Candidate Countermeasures
a. After reviewing the suggestions in Table 3 for rear‐end crashes at unsignalized
intersections, considering the field investigation and the crash patterns, a number of
potential solutions can be considered.
The open access is likely contributing to the crash patterns and occurrence. While
skew and turning‐related crashes were not highlighted by the patterns, it would
generally be desirable to remove the intersection skew. Along with that, closing the
open access to the business would be desirable. Finally, adding a left‐turn lane
refuge on OR‐99E would move waiting vehicles out of the traffic stream and
eliminate rear‐end collisions.
5. Expected Effectiveness of Countermeasures
a. The FHWA Countermeasure Clearinghouse was searched for intersection
geometry related CMFs in a rural area. A countermeasure to install a left turn
refuge was identified with a 5‐star rating. The CRF value is 58% and it applies to
Add left‐turn lane refuge (both directions)
Apply access management to limit open access
Realign Checkerboard to remove skew
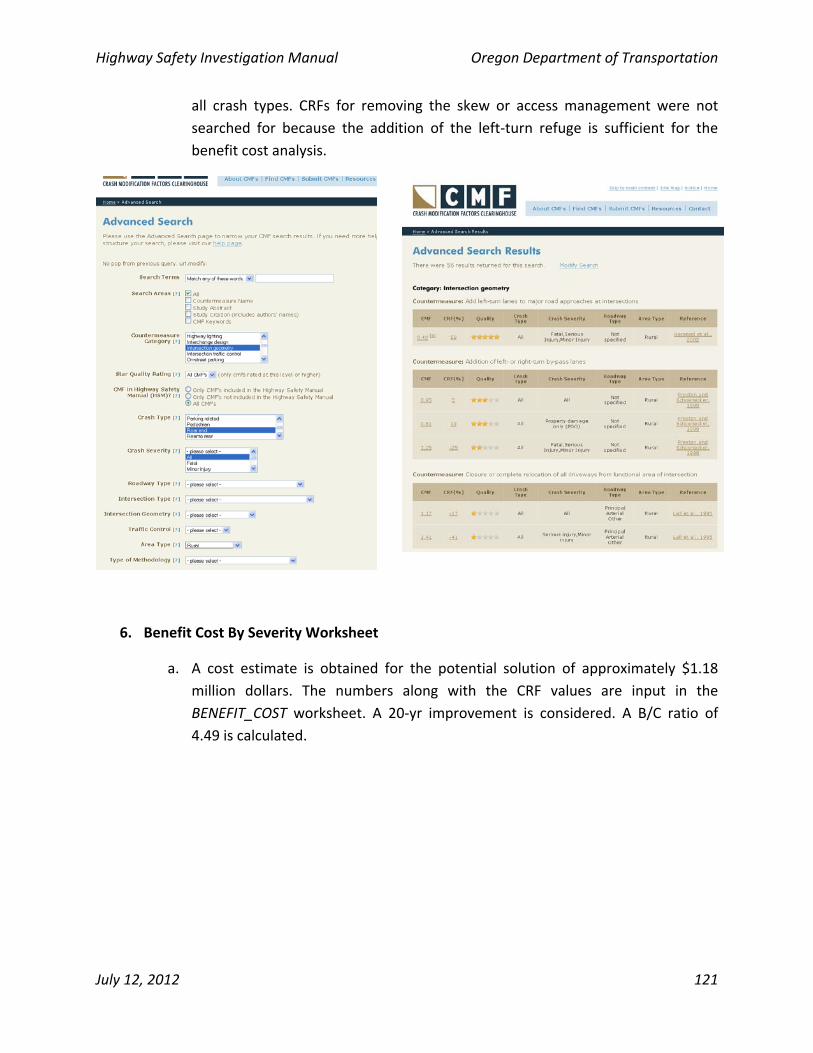
Highway Safety Investigation Manual Oregon Department of Transportation
July 12, 2012 121
all crash types. CRFs for removing the skew or access management were not
searched for because the addition of the left‐turn refuge is sufficient for the
benefit cost analysis.
6. Benefit Cost By Severity Worksheet
a. A cost estimate is obtained for the potential solution of approximately $1.18
million dollars. The numbers along with the CRF values are input in the
BENEFIT_COST worksheet. A 20‐yr improvement is considered. A B/C ratio of
4.49 is calculated.
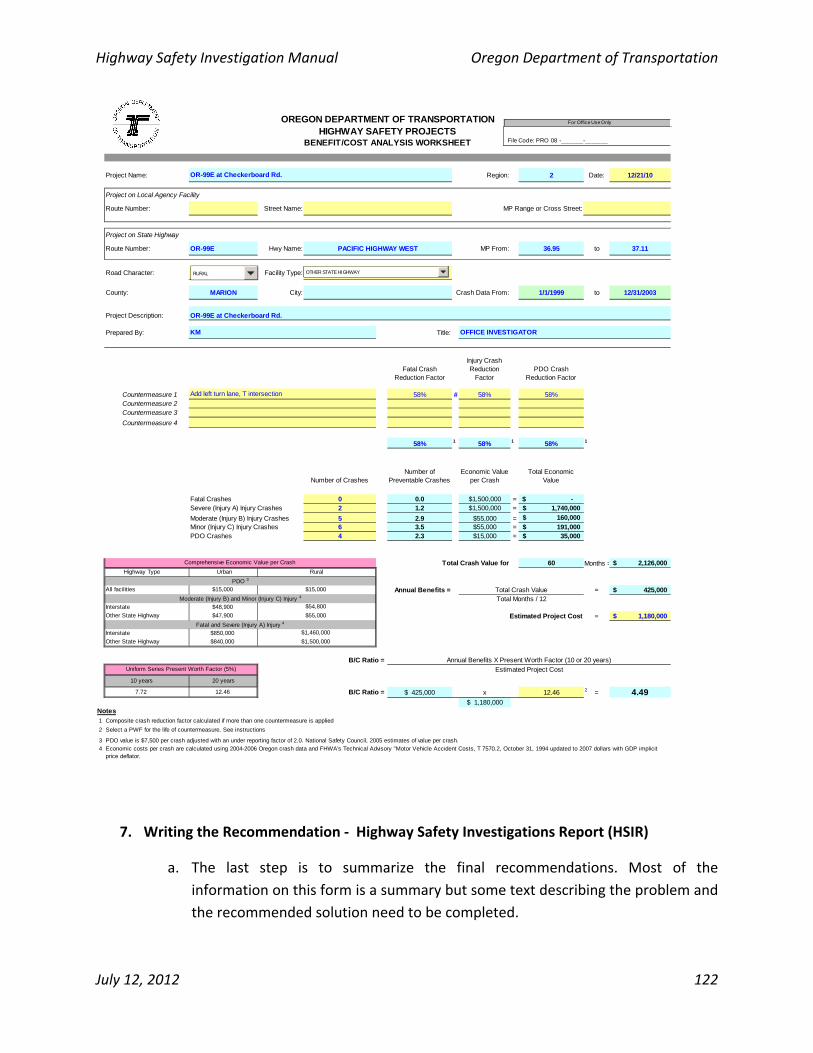
Highway Safety Investigation Manual Oregon Department of Transportation
July 12, 2012 122
Project Name: Region: 2 Date: 12/21/10
Project on Local Agency Facility
Route Number: Street Name: MP Range or Cross Street:
Project on State Highway
Route Number: OR-99E Hwy Name: PACIFIC HIGHWAY WEST MP From: 36.95 to 37.11
Road Character: RURAL Facility Type:
County: MARION City: Crash Data From: 1/1/1999 to 12/31/2003
Project Description:
Prepared By: Title:
Fatal Crash Reduction Factor
Injury Crash Reduction
FactorPDO Crash
Reduction Factor
Countermeasure 1 58% # 58% 58%Countermeasure 2Countermeasure 3
Countermeasure 4
58% 1 58% 1 58% 1
Number of CrashesNumber of
Preventable CrashesEconomic Value
per CrashTotal Economic
Value
Fatal Crashes 0 0.0 $1,500,000 = -$ Severe (Injury A) Injury Crashes 2 1.2 $1,500,000 = 1,740,000$
Moderate (Injury B) Injury Crashes 5 2.9 $55,000 = 160,000$ Minor (Injury C) Injury Crashes 6 3.5 $55,000 = 191,000$ PDO Crashes 4 2.3 $15,000 = 35,000$
Total Crash Value for 60 Months = 2,126,000$ Highway Type Urban
All facilities $15,000 Annual Benefits = = 425,000$
Interstate $48,900
Other State Highway $47,900 Estimated Project Cost = 1,180,000$
Interstate $850,000
Other State Highway $840,000
B/C Ratio =
10 years 20 years
7.72 12.46 B/C Ratio = $ 425,000 x 12.46 2 = 4.49$ 1,180,000
Notes
1 Composite crash reduction factor calculated if more than one countermeasure is applied
2 Select a PWF for the life of countermeasure. See instructions
3 PDO value is $7,500 per crash adjusted with an under reporting factor of 2.0. National Safety Council, 2005 estimates of value per crash.4
Estimated Project Cost
Fatal and Severe (Injury A) Injury 4
$1,460,000
$54,800
$55,000
Annual Benefits X Present Worth Factor (10 or 20 years)
Total Crash ValueTotal Months / 12
OR-99E at Checkerboard Rd.
OTHER STATE HIGHWAY
Economic costs per crash are calculated using 2004-2006 Oregon crash data and FHWA's Technical Advisory "Motor Vehicle Accident Costs, T 7570.2, October 31, 1994 updated to 2007 dollars with GDP implicit price deflator.
Uniform Series Present Worth Factor (5%)
OFFICE INVESTIGATORKM
$1,500,000
Comprehensive Economic Value per Crash
OR-99E at Checkerboard Rd.
HIGHWAY SAFETY PROJECTSOREGON DEPARTMENT OF TRANSPORTATION
BENEFIT/COST ANALYSIS WORKSHEET
PDO 3
Moderate (Injury B) and Minor (Injury C) Injury 4
Add left turn lane, T intersection
$15,000
Rural
File Code: PRO 08 -_______-_______
For Office Use Only
OTHER STATE HIGHWAYRURAL
7. Writing the Recommendation ‐ Highway Safety Investigations Report (HSIR)
a. The last step is to summarize the final recommendations. Most of the
information on this form is a summary but some text describing the problem and
the recommended solution need to be completed.
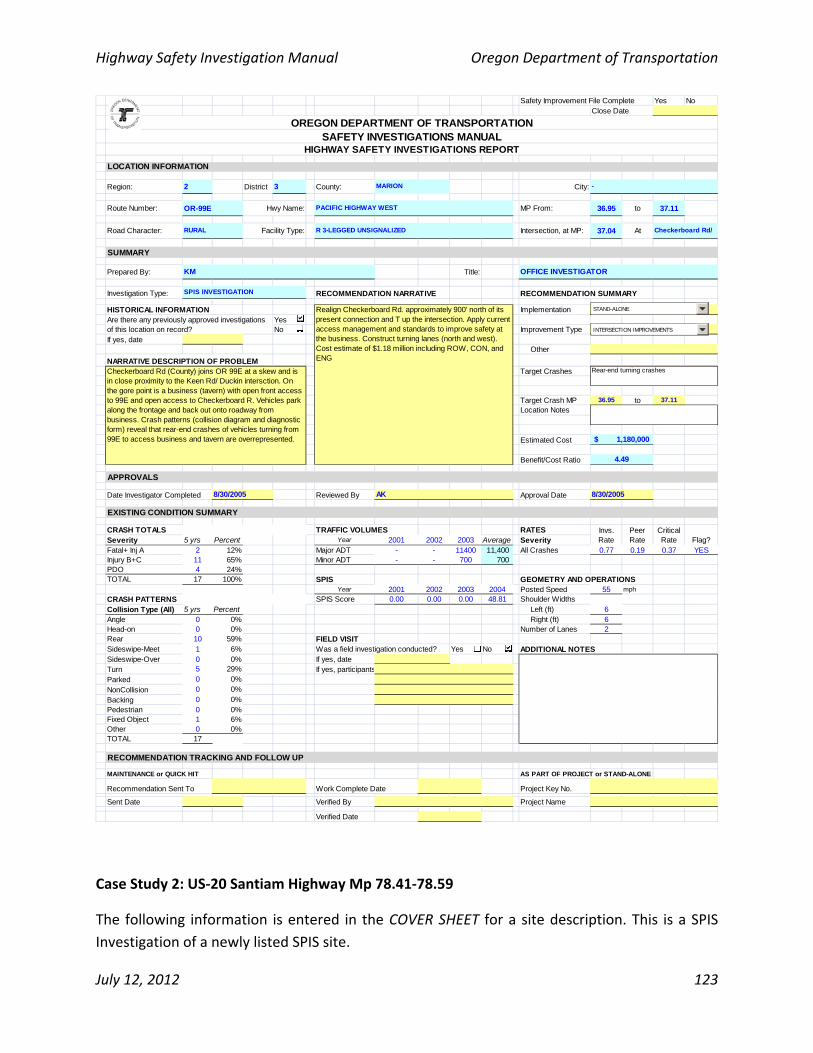
Highway Safety Investigation Manual Oregon Department of Transportation
July 12, 2012 123
Safety Improvement File Complete Yes No
LOCATION INFORMATION
Region: 2 District 3 County: City:
Route Number: OR-99E Hwy Name: PACIFIC HIGHWAY WEST MP From: 36.95 to 37.11
Road Character: Facility Type: Intersection, at MP: 37.04 At
SUMMARY
Prepared By: Title:
Investigation Type: SPIS INVESTIGATION RECOMMENDATION NARRATIVE RECOMMENDATION SUMMARY
HISTORICAL INFORMATION ImplementationYesNo Improvement Type
If yes, date Other
NARRATIVE DESCRIPTION OF PROBLEMTarget Crashes
Target Crash MP 36.95 to 37.11
Location Notes
Estimated Cost
Benefit/Cost Ratio
APPROVALS
Date Investigator Completed Reviewed By Approval Date
EXISTING CONDITION SUMMARY
CRASH TOTALS TRAFFIC VOLUMES RATESSeverity 5 yrs Percent Year 2001 2002 2003 Average SeverityFatal+ Inj A 2 12% Major ADT - - 11400 11,400 All Crashes 0.77 0.19 0.37 YESInjury B+C 11 65% Minor ADT - - 700 700 PDO 4 24%TOTAL 17 100% SPIS GEOMETRY AND OPERATIONS
Year 2001 2002 2003 2004 Posted Speed 55 mph
CRASH PATTERNS SPIS Score 0.00 0.00 0.00 48.81 Shoulder WidthsCollision Type (All) 5 yrs Percent Left (ft) 6Angle 0 0% Right (ft) 6Head-on 0 0% Number of Lanes 2Rear 10 59% FIELD VISITSideswipe-Meet 1 6% Was a field investigation conducted? Yes No ADDITIONAL NOTESSideswipe-Over 0 0% If yes, dateTurn 5 29% If yes, participantsParked 0 0%
NonCollision 0 0%
Backing 0 0%Pedestrian 0 0%Fixed Object 1 6%Other 0 0%TOTAL 17
RECOMMENDATION TRACKING AND FOLLOW UP
MAINTENANCE or QUICK HIT AS PART OF PROJECT or STAND-ALONE
Work Complete Date Project Key No.
Sent Date Verified By Project Name
Verified Date
HIGHWAY SAFETY INVESTIGATIONS REPORT
R 3-LEGGED UNSIGNALIZED
KM
8/30/2005AK
Recommendation Sent To
Are there any previously approved investigations of this location on record?
Checkerboard Rd (County) joins OR 99E at a skew and is in close proximity to the Keen Rd/ Duckin intersction. On the gore point is a business (tavern) with open front access to 99E and open access to Checkerboard R. Vehicles park along the frontage and back out onto roadway from business. Crash patterns (collision diagram and diagnostic form) reveal that rear-end crashes of vehicles turning from 99E to access business and tavern are overrepresented.
Checkerboard Rd/
Invs. Rate
Peer Rate
Critical Rate Flag?
OFFICE INVESTIGATOR
Close Date
SAFETY INVESTIGATIONS MANUALOREGON DEPARTMENT OF TRANSPORTATION
8/30/2005
STAND-ALONE
RURAL
-MARION
INTERSECTION IMPROVEMENTS
Rear-end turning crashes
4.49
Realign Checkerboard Rd. approximately 900' north of its present connection and T up the intersection. Apply current access management and standards to improve safety at the business. Construct turning lanes (north and west). Cost estimate of $1.18 million including ROW, CON, and ENG
1,180,000$
INTERSECTION IMPROVEMENTS
STAND-ALONE
Case Study 2: US‐20 Santiam Highway Mp 78.41‐78.59
The following information is entered in the COVER SHEET for a site description. This is a SPIS
Investigation of a newly listed SPIS site.
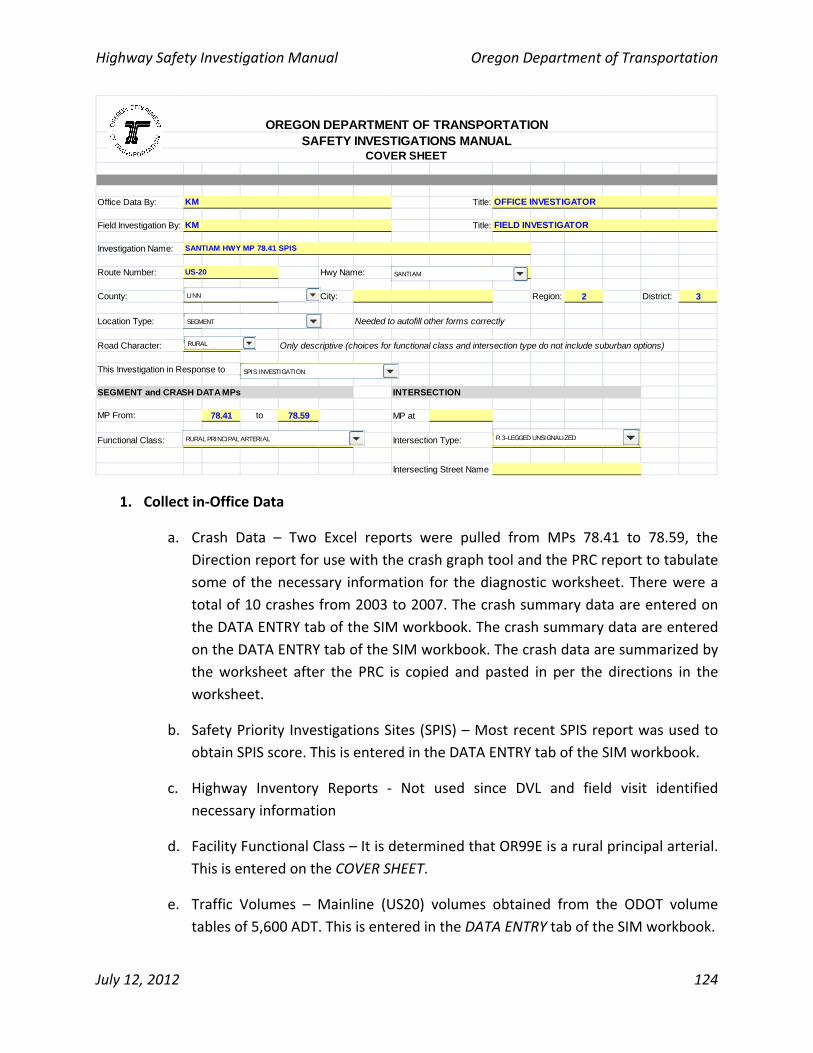
Highway Safety Investigation Manual Oregon Department of Transportation
July 12, 2012 124
Office Data By: Title:
Field Investigation By: Title:
Investigation Name:
Route Number: Hwy Name: SANTIAM
County: LINN City: Region: 2 District: 3
Location Type: URBAN Needed to autofill other forms correctly
Road Character: RURAL Only descriptive (choices for functional class and intersection type do not include suburban options)
This Investigation in Response to
SEGMENT and CRASH DATA MPs INTERSECTION
MP From: 78.41 to 78.59 MP at
Functional Class: Intersection Type:
Intersecting Street Name
SPIS INVESTIGATION
R 3-LEGGED UNSIGNALIZED
FIELD INVESTIGATOR
RURAL PRINCIPAL ARTERIAL
US-20
OFFICE INVESTIGATOR
OREGON DEPARTMENT OF TRANSPORTATIONSAFETY INVESTIGATIONS MANUAL
COVER SHEET
SANTIAM HWY MP 78.41 SPIS
KM
KM
SANTIAM
LINN
R 3-LEGGED UNSIGNALIZEDRURAL PRINCIPAL ARTERIAL
SEGMENT
RURAL
SPIS INVESTIGATION
1. Collect in‐Office Data
a. Crash Data – Two Excel reports were pulled from MPs 78.41 to 78.59, the
Direction report for use with the crash graph tool and the PRC report to tabulate
some of the necessary information for the diagnostic worksheet. There were a
total of 10 crashes from 2003 to 2007. The crash summary data are entered on
the DATA ENTRY tab of the SIM workbook. The crash summary data are entered
on the DATA ENTRY tab of the SIM workbook. The crash data are summarized by
the worksheet after the PRC is copied and pasted in per the directions in the
worksheet.
b. Safety Priority Investigations Sites (SPIS) – Most recent SPIS report was used to
obtain SPIS score. This is entered in the DATA ENTRY tab of the SIM workbook.
c. Highway Inventory Reports ‐ Not used since DVL and field visit identified
necessary information
d. Facility Functional Class – It is determined that OR99E is a rural principal arterial.
This is entered on the COVER SHEET.
e. Traffic Volumes – Mainline (US20) volumes obtained from the ODOT volume
tables of 5,600 ADT. This is entered in the DATA ENTRY tab of the SIM workbook.
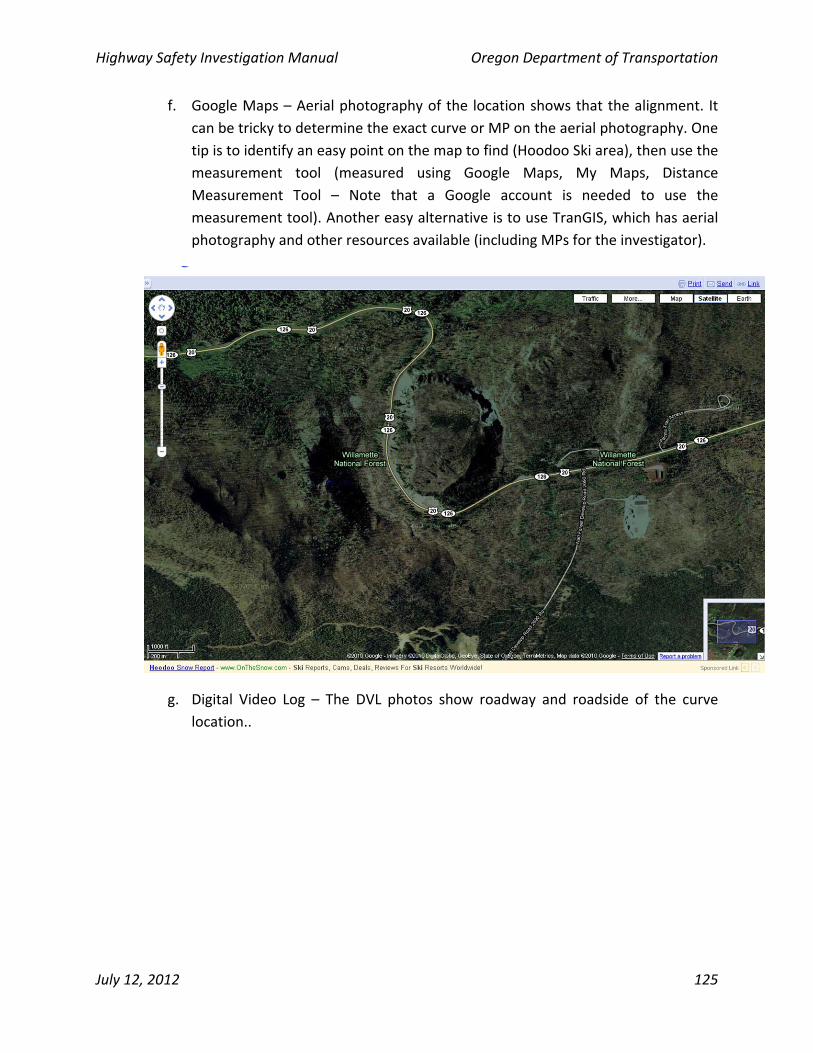
Highway Safety Investigation Manual Oregon Department of Transportation
July 12, 2012 125
f. Google Maps – Aerial photography of the location shows that the alignment. It
can be tricky to determine the exact curve or MP on the aerial photography. One
tip is to identify an easy point on the map to find (Hoodoo Ski area), then use the
measurement tool (measured using Google Maps, My Maps, Distance
Measurement Tool – Note that a Google account is needed to use the
measurement tool). Another easy alternative is to use TranGIS, which has aerial
photography and other resources available (including MPs for the investigator).
g. Digital Video Log – The DVL photos show roadway and roadside of the curve
location..
Highway Safety Investigation Manual Oregon Department of Transportation
July 12, 2012 126
2. Diagnosing Crash Patterns
a. Crash Pattern Worksheet – This is a segment, click on the click on the
“PATTERNS_SEG” worksheet tab.
A number of different crash trends are highlighted in grey (PNorm is less than 5%) as
being potentially unusual:
Fatal+ Inj A crashes
Collision types (Fatal and Inj A): Sideswipe‐Meet
In‐state resident drivers
Female drivers
Surface conditions: ICE
Grade – On Roadway
Curve –Off Roadway Other patterns that are close, but are not less that 5% threshold are:
Collision types (all): Sideswipe‐Meet)
Time period – 9‐AM Noon
Driver age groups: 19‐21;
Curve –On Roadway These patterns do not always lead to a countermeasure or explanation for the SPIS
site. This particular curve has high fatal and injury A count (3/10). Contributing
factors such as driving too fast for conditions and lane departure (sideswipe‐meeting
and non‐collision) appears to be trends. Given the location in the Cascades, the ICE
related crashes might not be that unusual but it does appear to be recreation based
Highway Safety Investigation Manual Oregon Department of Transportation
July 12, 2012 127
–non‐local drivers and higher proportions on Sunday. The segment crash rate is
FLAGGED as exceeding the critical rate for rural principal arterial.
b. Collision Diagrams – With only ten crashes and the trend apparent from the PRC and
diagnostics form, a collision diagram was not requested from CAR.
3. Site Investigations
a. After reviewing the crash data in‐office, the investigator should have a good idea
what the potential problems at the intersection might be. A field visit may or may
not be needed.
The crash patterns to browse in Table 3 would be “Sideswipe collisions between
vehicles traveling in opposite directions or head‐on collisions”. The table suggests
documenting and investigating:
Number of lanes / lane widths / lane usage
Location / description / measurement of median
Shoulder type / width and condition
Location and visibility of advance warning signs
Roadway type and condition
SUMMARY OF DATA ANALYSIS AND FIELD INVESTIGATION:
Two of the injury A crashes involved EB drivers losing control and crossing into oncoming lanes.
Only 1 WB driver was coded as too fast for conditions. One EB driver avoided debris in roadway.
There are existing speed curve warning signs posted with 40 mph riders, thermoplastic was
installed on MP 73‐88 in September 2006. Curve realignment is not possible. A dynamic curve
warning or enhanced chevrons could be considered.
Highway Safety Investigation Manual Oregon Department of Transportation
July 12, 2012 128
Prepared By: Title:
Investigation Name: Region: 2 District: 3
Route Number: Hwy Name: MP From: 78.41 to 78.59
Road Character: Facility Type: Date Compiled:
County: City: Crash Date From: to 12/31/2007
CRASH TOTALSSeverity Crash Obs % Ex % P(Norm) TRAFFIC VOLUM 5,600 ADT (average )Fatal+ Inj A 3 30.0% 8.7% 4.9% Time Crash Obs % Ex % P(Norm)Injury B+C 3 30.0% 39.1% 81.7% 12 -3 AM 0 0.0% 3.4% RATESPDO 4 40.0% 52.3% 86.3% 3 -6 AM 0 0.0% 4.0%
10 100.0% 100.0% 6 -9 AM 0 0.0% 14.0% All Crashes 5.44 0.72 2.02 YES9-Noon 4 40.0% 15.9% 6.0%
CRASH PATTERNS 12-3 PM 3 30.0% 19.0% 29.2%Collision Type (All) Crash Obs % Ex % P(Norm) 3 -6 PM 2 20.0% 23.5% 72.0% On Roadway Crashes Obs % Ex % P(Norm)Angle 0 0.0% 3.6% 6-9 PM 1 10.0% 12.4% 73.4% Intersection 0 0.0% 15.6%Head-on 1 10.0% 3.1% 27.2% 9-Mid 0 0.0% 7.4% Alley 0 0.0% 5.8%Rear 0 0.0% 22.5% UNKNOWN 0 0.0% 0.5% Straight 0 0.0% 32.2%Sideswipe-Meet 2 20.0% 4.1% 6.1% 10 100% 100% Transition 0 0.0% 0.2%Sideswipe-Over 1 10.0% 3.9% 32.7% Curve 2 20.0% 4.0% 5.8%Turn 0 0.0% 13.7% Light Condition Crash Obs % Ex % P(Norm) Open Access 0 0.0% 0.1%Parked 0 0.0% 0.3% DAWN 0 0.0% 4.1% Grade 3 30.0% 2.4% 0.1%NonCollision 2 20.0% 5.1% 9.0% DAY 8 80.0% 64.1% 24.3% Bridge 0 0.0% 0.4%Backing 0 0.0% 0.4% DLIT 0 0.0% 2.6% Tunnel 0 0.0% 0.0%Pedestrian 0 0.0% 0.5% DARK 1 10.0% 26.1% 95.1% Unknown 0 0.0% 0.0%Fixed Object 4 40.0% 35.0% 48.7% DUSK 1 10.0% 2.8% 24.9% 5 50% 61%Other 0 0.0% 7.8% UNK 0 0.0% 0.3%
10 100% 100% 10 100% 100% Off Roadway Crashes Obs % Ex % P(Norm)Intersection 0 0.0% 0.9%
Collision Type (F+A) Crash Obs % Ex % P(Norm) Surface Cond. Crash Obs % Ex % P(Norm) Alley 0 0.0% 0.3%Angle 0 0.0% 4.0% DRY 1 10.0% 58.5% 100.0% Straight 0 0.0% 23.6%Head-on 1 33.3% 17.1% 43.0% ICE 5 50.0% 17.7% 2.0% Transition 0 0.0% 0.0%Rear 0 0.0% 8.0% WET 4 40.0% 19.5% 11.2% Curve 5 50.0% 10.3% 0.2%Sideswipe-Meet 2 66.7% 7.8% 1.7% SNOW 0 0.0% 3.5% Open Access 0 0.0% 0.1%Sideswipe-Over 0 0.0% 1.5% UNK 0 0.0% 0.8% Grade 0 0.0% 3.4%Turn 0 0.0% 12.7% Total 10 100% 100% Bridge 0 0.0% 0.5%Parked 0 0.0% 0.0% Tunnel 0 0.0% 0.0%NonCollision 0 0.0% 7.0% Weekday Crash Obs % Ex % P(Norm) Unknown 0 0.0% 0.0%Backing 0 0.0% 0.1% Sunday 3 30.0% 14.1% 15.7% 5 50% 39%Pedestrian 0 0.0% 2.4% Monday 2 20.0% 14.4% 43.3%Fixed Object 0 0.0% 36.9% Tuesday 0 0.0% 13.1% Cause Codes Drivers Obs % Ex % P(Norm)Other 0 0.0% 2.5% Wednesday 1 10.0% 13.5% 76.6% TOO-CLOS 0 0.0% 9.3%
3 100% 100% Thursday 1 10.0% 14.2% 78.3% TOO-FAST 8 47.1% 36.9% 26.5%Friday 1 10.0% 16.6% 83.7% NO-YIELD 0 0.0% 11.1%
Crashes Involving Crash Obs % Ex % P(Norm) Saturday 2 20.0% 14.2% 42.6% OTHR-IMP 4 23.5% 11.2% 11.5%Multiple Vehicles 5 50.0% 53.1% 69.7% 10 100% 100% IMP LN C 0 0.0% 0.8%Single Vehicle 5 50.0% 46.9% 54.4% INATTENT 1 5.9% 5.8% 63.9%
10 100% 100% Driver Age Drivers Obs % Ex % P(Norm) DIS--RAG 0 0.0% 0.8%<15 0 0.0% 0.0% IMP-TURN 0 0.0% 2.4%
Residence of Driver Drivers Obs % Ex % P(Norm) 15-18 1 6.7% 7.0% 66.1% OTHER 1 5.9% 7.0% 71.1%Non-resident 0 0.0% 11.3% 19-21 3 20.0% 7.5% 9.7% CARELESS 1 5.9% 1.4% 20.8%Local 2 13.3% 60.4% 100.0% 22-24 2 13.3% 5.9% 22.3% FATIGUE 0 0.0% 1.4%In-state resident 13 86.7% 26.2% 0.0% 25-34 3 20.0% 15.5% 41.7% LEFT-CTR 2 11.8% 4.4% 17.1%Not Stated 0 0.0% 2.1% 35-44 2 13.3% 15.9% 71.4% SPEED 0 0.0% 0.7%
15 100% 100% 45-54 2 13.3% 18.3% 79.0% PHANTOM 0 0.0% 1.6%55-64 2 13.3% 13.5% 62.2% IMP-OVER 0 0.0% 2.9%
Sex of Driver Drivers Obs % Ex % P(Norm) 65-74 0 0.0% 7.4% RECKLESS 0 0.0% 0.3%Male 4 26.7% 63.3% 99.9% >74 0 0.0% 5.2% PAS-STOP 0 0.0% 0.8%Female 11 73.3% 35.5% 0.3% Not Stated 0 0.0% 3.8% IN RDWY 0 0.0% 0.1%Not Stated 0 0.0% 1.2% 15 100% 100% MECH-DEF 0 0.0% 0.4%
15 100% 100% LOADSHFT 0 0.0% 0.3%NT VISBL 0 0.0% 0.1%DIS TCD 0 0.0% 0.0%WRNG WAY 0 0.0% 0.0%IMP PKNG 0 0.0% 0.1%
17 100% 100%
Peer Rate
Critical Rate
Invs. Rate Flag?
SANTIAM HWY MP 78.41 SPIS
RURAL
LINN
SANTIAM
1/1/2003
OREGON DEPARTMENT OF TRANSPORTATION
CRASH PATTERN WORKSHEET - SEGMENTS
RURAL PRINCIPAL ARTERIAL
OFFICE INVESTIGATORKM
8/30/2005
US-20
SAFETY INVESTIGATIONS MANUAL
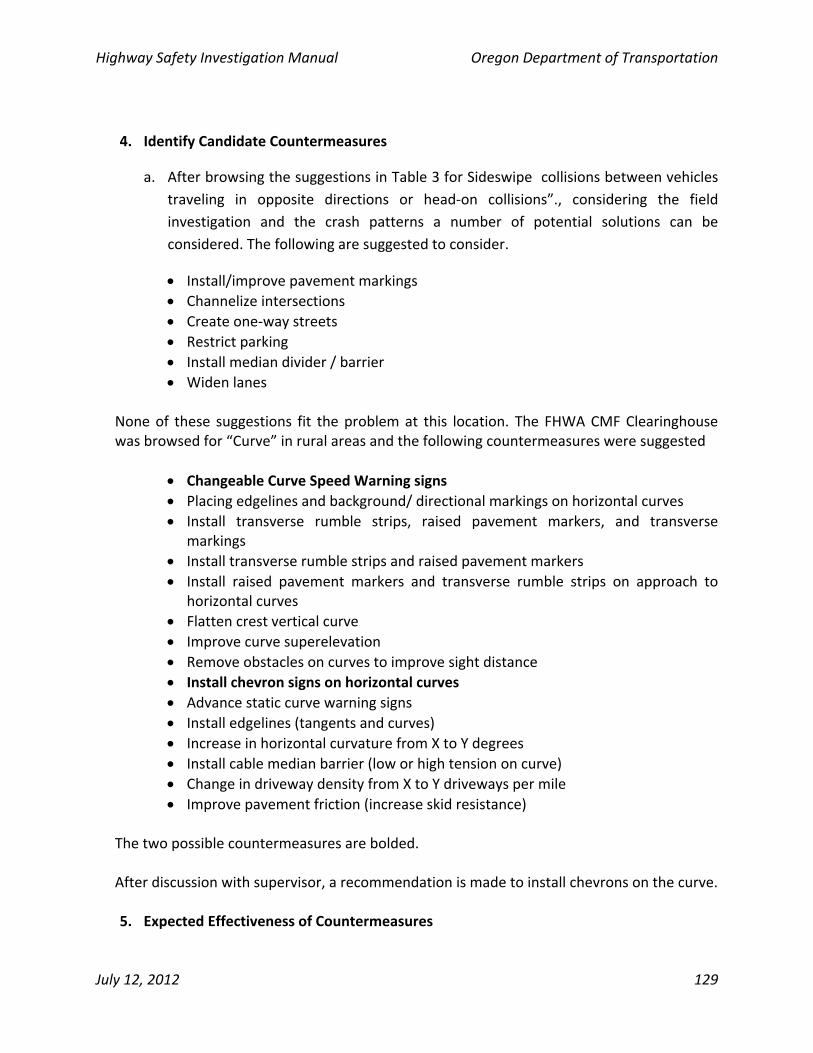
Highway Safety Investigation Manual Oregon Department of Transportation
July 12, 2012 129
4. Identify Candidate Countermeasures
a. After browsing the suggestions in Table 3 for Sideswipe collisions between vehicles
traveling in opposite directions or head‐on collisions”., considering the field
investigation and the crash patterns a number of potential solutions can be
considered. The following are suggested to consider.
Install/improve pavement markings
Channelize intersections
Create one‐way streets
Restrict parking
Install median divider / barrier
Widen lanes None of these suggestions fit the problem at this location. The FHWA CMF Clearinghouse was browsed for “Curve” in rural areas and the following countermeasures were suggested
Changeable Curve Speed Warning signs
Placing edgelines and background/ directional markings on horizontal curves
Install transverse rumble strips, raised pavement markers, and transverse markings
Install transverse rumble strips and raised pavement markers
Install raised pavement markers and transverse rumble strips on approach to horizontal curves
Flatten crest vertical curve
Improve curve superelevation
Remove obstacles on curves to improve sight distance
Install chevron signs on horizontal curves
Advance static curve warning signs
Install edgelines (tangents and curves)
Increase in horizontal curvature from X to Y degrees
Install cable median barrier (low or high tension on curve)
Change in driveway density from X to Y driveways per mile
Improve pavement friction (increase skid resistance) The two possible countermeasures are bolded. After discussion with supervisor, a recommendation is made to install chevrons on the curve. 5. Expected Effectiveness of Countermeasures
Highway Safety Investigation Manual Oregon Department of Transportation
July 12, 2012 130
a. Since the cost to install the signs is small, no CRFs needed.
6. Benefit Cost Worksheet
a. Since the cost to install the signs is small, no CRFs needed.
7. Writing the Recommendation ‐ Highway Safety Investigations Report (HSIR)
a. The last step is to summarize the final recommendations. Most of the
information on this form is a summary but some text describing the problem and
the recommended solution need to be completed. Here the work was to be
done by maintenance. Note that the date the signs were installed is documented
on the form.
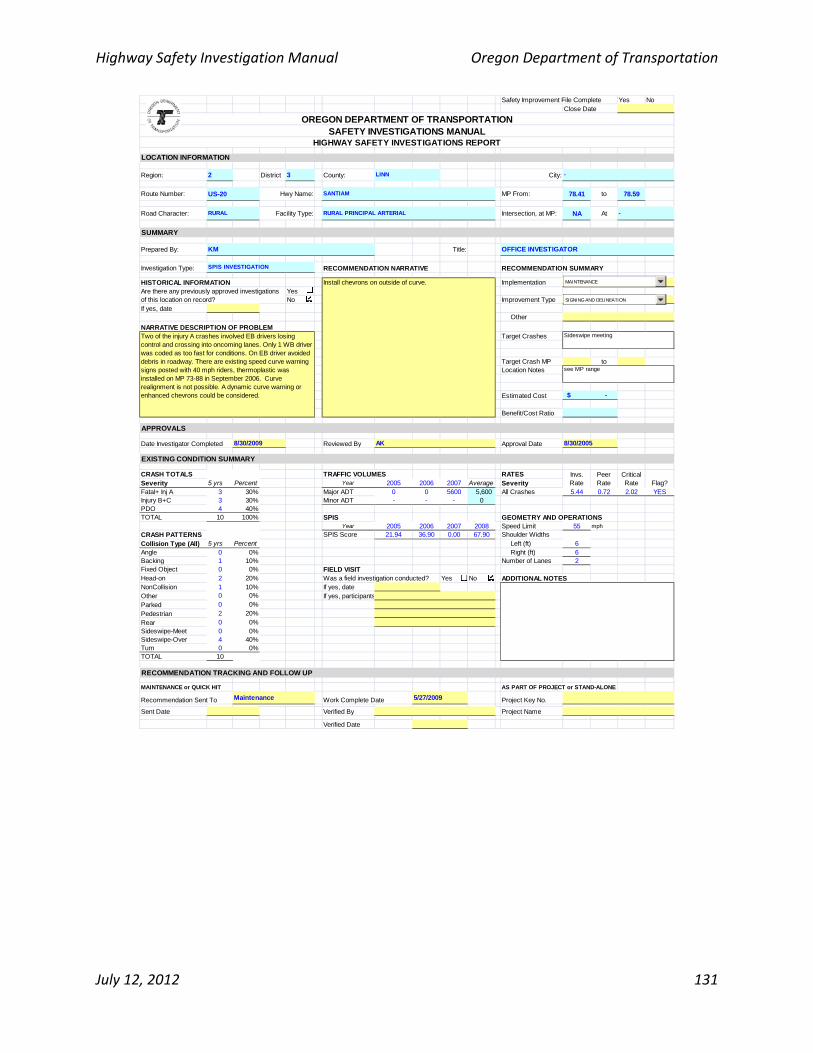
Highway Safety Investigation Manual Oregon Department of Transportation
July 12, 2012 131
Safety Improvement File Complete Yes No
LOCATION INFORMATION
Region: 2 District 3 County: City:
Route Number: US-20 Hwy Name: SANTIAM MP From: 78.41 to 78.59
Road Character: Facility Type: Intersection, at MP: NA At
SUMMARY
Prepared By: Title:
Investigation Type: SPIS INVESTIGATION RECOMMENDATION NARRATIVE RECOMMENDATION SUMMARY
HISTORICAL INFORMATION ImplementationYesNo Improvement Type
If yes, date Other
NARRATIVE DESCRIPTION OF PROBLEMTarget Crashes
Target Crash MP toLocation Notes
Estimated Cost
Benefit/Cost Ratio
APPROVALS
Date Investigator Completed Reviewed By Approval Date
EXISTING CONDITION SUMMARY
CRASH TOTALS TRAFFIC VOLUMES RATESSeverity 5 yrs Percent Year 2005 2006 2007 Average SeverityFatal+ Inj A 3 30% Major ADT 0 0 5600 5,600 All Crashes 5.44 0.72 2.02 YESInjury B+C 3 30% Minor ADT - - - 0PDO 4 40%TOTAL 10 100% SPIS GEOMETRY AND OPERATIONS
Year 2005 2006 2007 2008 Speed Limit 55 mph
CRASH PATTERNS SPIS Score 21.94 36.90 0.00 67.90 Shoulder WidthsCollision Type (All) 5 yrs Percent Left (ft) 6Angle 0 0% Right (ft) 6Backing 1 10% Number of Lanes 2Fixed Object 0 0% FIELD VISITHead-on 2 20% Was a field investigation conducted? Yes No ADDITIONAL NOTESNonCollision 1 10% If yes, dateOther 0 0% If yes, participantsParked 0 0%
Pedestrian 2 20%
Rear 0 0%Sideswipe-Meet 0 0%Sideswipe-Over 4 40%Turn 0 0%TOTAL 10
RECOMMENDATION TRACKING AND FOLLOW UP
MAINTENANCE or QUICK HIT AS PART OF PROJECT or STAND-ALONE
Work Complete Date Project Key No.
Sent Date Verified By Project Name
Verified Date
HIGHWAY SAFETY INVESTIGATIONS REPORT
RURAL PRINCIPAL ARTERIAL
KM
8/30/2005AK
Recommendation Sent To Maintenance
Close Date
see MP range
SAFETY INVESTIGATIONS MANUALOREGON DEPARTMENT OF TRANSPORTATION
8/30/2009
MAINTENANCE
RURAL
-
Invs. Rate
Peer Rate
Critical Rate Flag?
5/27/2009
SIGNING AND DELINEATION
OFFICE INVESTIGATOR
Sideswipe meeting
Install chevrons on outside of curve.
LINN
Are there any previously approved investigations of this location on record?
Two of the injury A crashes involved EB drivers losing control and crossing into oncoming lanes. Only 1 WB driver was coded as too fast for conditions. On EB driver avoided debris in roadway. There are existing speed curve warning signs posted with 40 mph riders, thermoplastic was installed on MP 73-88 in September 2006. Curve realignment is not possible. A dynamic curve warning or enhanced chevrons could be considered. -$
-
SIGNING AND DELINEATION
MAINTENANCE

![]oogle Maps Google maps Hataor Osland stfial Distri 'Vest Get Google Maps … · 2011. 5. 15. · Google maps Hataor Osland stfial Distri 'Vest Get Google Maps on your phone "GMAPS"t046þ453](https://img.pdfslide.tips/doc/110x75/6033290187ae2e30bc06dc6c/oogle-maps-google-maps-hataor-osland-stfial-distri-vest-get-google-maps-2011.jpg)

![Informationstag Juni 02, 2016 Das menschliche Verhalten bei … · vehicle safety 3.8 Mio. car to car crashes in 2012 in the US [NHTSA12] 9 side crashes are most deathly narrow space](https://img.pdfslide.tips/doc/110x75/5f99fe507f732a16646de008/informationstag-juni-02-2016-das-menschliche-verhalten-bei-vehicle-safety-38-mio.jpg)