Embed Size (px)
Citation preview
2012
Grupo Unión Fenosa GasUnion Fenosa Gas Group
Huella deCarbono Carbon Footprint Report

2012
Grupo Unión Fenosa GasUnion Fenosa Gas Group
Huella de Carbono
CarbonFootprint Report

Índice
Summary

4 INTRODUCCIÓN
IntrodUctIon
7OBJETO Y ALCANCE
object and Scope
9RESULTADOS DEL GRUPO UNION FENOSA GAS
reSUltS oF the UnIon FenoSa GaS GroUp
16CONCLUSIONES
conclUSIonS

4
Un
ión
Feno
sa Gas
HU
EL
LA
DE
CA
RB
ON
O 2
01
2
la huella de carbono (en adelante hc) permite calcular las emisiones de co
2e debidas a una actividad/proceso concreto.
la metodología desarrollada para el cálculo de la hc en Unión Fenosa Gas ha tomado como referencia principalmente los si-guientes documentos:
l Une-ISo 14064-1 “Gases de efecto invernadero. parte 1. es-pecificación con orientación, a nivel de las organizaciones, para la cuantificación y el informe de las emisiones y remo-ciones de gases de efecto invernadero”.
l paS 2050:2008 “Specification for the assessment of the life cycle greenhouse gas emissions of goods and services”. Guías y herramientas asociadas (Guide to paS 2050 how to assess the carbon foot print of goods and services).
l Une-en ISo 14040: 2006 “Gestión ambiental. análisis de ciclo de vida. principios y marco de referencia”.
l Une-en ISo 14044: 2006 “Gestión ambiental. análisis de ciclo de vida. requisitos y directrices”.
l the Greenhouse Gas protocol. a corporate accounting and reporting Standard (revised edition) (GhG protocol). Guías sectoriales y herramientas asociadas.
l corporate Value chain (Scope 3) accounting and reporting Standard. Supplement to the GhG protocol corporate ac-counting and reporting Standard.
l product life cicle accounting & reporting Standard. GhG protocol.
the carbon Footprint (hereinafter cF) allows the calculation of co
2 emissions due to a specific activity or process.
the methodology developed for the calculation of the cF in Union Fenosa Gas has mainly used the following documents for reference:
l Une-ISo 14064-1 “Greenhouse Gases. part 1. Specification with guidance at the organization level for quantification and reporting of greenhouse gas emissions and removals”.
l paS 2050:2008 “Specification for the assessment of the life cycle greenhouse gas emissions of goods and services”. associated guides and tools (Guide to paS 2050 how to assess the carbon footprint of goods and services).
l Une-en ISo 14040:2006 “environmental Management - life cycle assessment - principles and framework”.
l Une-en ISo 14044:2006 “environmental Management. life cycle assessment. requirements and Guidelines”.
l the Greenhouse Gas protocol. a corporate accounting and reporting Standard (revised edition) (GhG protocol). Sector guides and associated tools.
l corporate Value chain (Scope 3) accounting and reporting Standard. Supplement to the GhG protocol corporate accounting and reporting Standard.
l product life cycle accounting & reporting Standard. GhG protocol.
1. INTRODUCCIÓN
1. IntrodUctIon
5
Un
ión
Fen
osa
Gas
CA
RB
ON
FO
OT
PR
INT
20
12
el proceso de definición de la hc en su conjunto, se ha llevado a cabo a través del desarrollo de las siguientes actividades:
l Definición de los ciclos de vida de los distintos negocios del gas natural abarcando desde la etapa de extracción hasta la gestión de los residuos finales generados.
l Recopilación de información para cuantificar las emisiones de Gases de Efecto Invernadero (GEI) que tienen lugar en cada etapa de los ciclos de vida. esta información procede tanto de las emisiones directas debidas a actividades regula-das por la directiva de comercio de emisiones declaradas de acuerdo con los protocolos de seguimiento y notificación de emisiones de GeI aprobados, como de fuentes documentales y bibliográficas que han permitido completar los datos acerca de las emisiones procedentes de otras etapas que forman parte de los ciclos de vida.
l Consideración de los seis GEI de forma separada (CO2, CH4, N
2O, HFCs, PFCs, SF6), en los casos que proceda,
según el tipo de sistema.
l Aplicación de factores de emisión específicos para cada tipo de GEI y para cada etapa del ciclo de vida de acuerdo a las directrices establecidas en el documento “2006 IPCC Gui-delines for National Greenhouse Gas Inventories” y otras fuentes reconocidas.
l Estructuración de la información resultante sobre emisio-nes de GEI conforme a las premisas y directrices establecidas en el documento “A CORPORATE ACCOUNTING AND RE-PORTING STANDARD. REVISED EDITION” elaborado por el World business council for Sustainable development y por el World resources Institute, de forma que sea posible el re-porte de las emisiones por alcances 1, 2 y 3:
l las emisiones directas de GeI de fuentes propias o controladas (Alcance 1, según el GhG proto-col).
l las emisiones indirectas de GeI por consumo de energía eléctrica (Alcance 2, según el GhG pro-tocol).
l las emisiones indirectas de GeI que, no siendo generadas en fuentes pertenecientes o controla-das por los negocios de UnIon FenoSa GaS, son consecuencia de sus actividades; conside-rando por tanto las provenientes de los procesos asociados a las etapas de los ciclos de vida de cada uno de los sistemas, en las que no está presente UnIon FenoSa GaS. (Alcance 3, según el GhG protocol). así, se han tenido en cuenta:
l los tipos de energía consumida: conside-rando las cadenas de suministro de los com-bustibles empleados en las instalaciones y, en el caso de la energía eléctrica, el “mix”
defining the cF as a whole was carried out through the following activities:
l Definition of the life cycles of the different natural gas processes, from the production of natural gas.
l Compilation of information to quantify the emissions of Greenhouse Gases (GHG) that occur in each stage of the life cycles. this information comes from the direct emissions due to activities regulated by the GhG european trading Scheme (eU etS) declared in accordance with the approved protocols for the monitoring and notification of GhG emissions, and from documentary and bibliographical sources that have allowed completion of the data about the emissions coming from other stages that form part of the life cycles.
l Individual consideration of the six GHG (CO2, CH4, N2O, HFCs, PFCs, SF6), in the appropiated cases, according to each system type.
l Application of specific emission factors for each type of GHG and each stage of the life cycle according to the directives established in the document “2006 Ipcc Guidelines for national Greenhouse Gas Inventories” and other recognised sources.
l Structuring of the resulting information on GHG emissions according to the premises and directives established in the document “a corporate accoUntInG and reportInG Standard. reVISed edItIon” produced by the World business council for Sustainable development and by the World resources Institute, in order to report on the emissions for Scopes 1, 2 and 3:
l direct GhG emissions from owned or controlled sources (Scope 1, according to the GhG protocol).
l Indirect GhG emissions from consumption of purchased electricity, heat or steam (Scope 2, according to the GhG protocol).
l Indirect GhG emissions GhG that, although not generated in sources owned or controlled by UnIon FenoSa GaS shared companies, are a consequence of its activities; these therefore include those originated from the processes associated with the stages of the life cycle of each one of the systems, in which UnIon FenoSa GaS is not present. (Scope 3, according to the GhG protocol). thus, the following are taken into account:
l the types of energy consumed: considering the supply chains of the fuels used in the facilities and, in the case of the electrical
6
HU
EL
LA
DE
CA
RB
ON
O 2
01
2 U
nió
n Fen
osa G
as
de generación (tco2e/MWh) aplicable en
cada país donde tiene lugar el consumo.
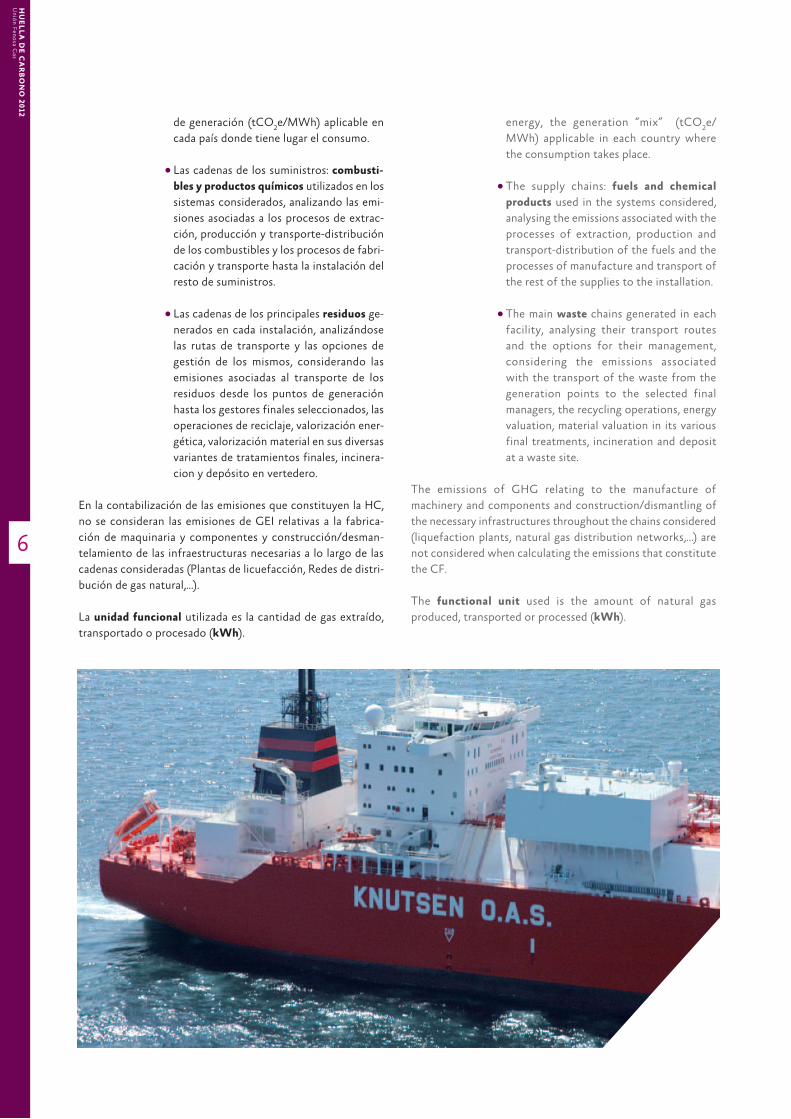
l las cadenas de los suministros: combusti-bles y productos químicos utilizados en los sistemas considerados, analizando las emi-siones asociadas a los procesos de extrac-ción, producción y transporte-distribución de los combustibles y los procesos de fabri-cación y transporte hasta la instalación del resto de suministros.
l las cadenas de los principales residuos ge-nerados en cada instalación, analizándose las rutas de transporte y las opciones de gestión de los mismos, considerando las emisiones asociadas al transporte de los residuos desde los puntos de generación hasta los gestores finales seleccionados, las operaciones de reciclaje, valorización ener-gética, valorización material en sus diversas variantes de tratamientos finales, incinera-cion y depósito en vertedero.
en la contabilización de las emisiones que constituyen la hc, no se consideran las emisiones de GeI relativas a la fabrica-ción de maquinaria y componentes y construcción/desman-telamiento de las infraestructuras necesarias a lo largo de las cadenas consideradas (plantas de licuefacción, redes de distri-bución de gas natural,…).
la unidad funcional utilizada es la cantidad de gas extraído, transportado o procesado (kWh).
energy, the generation “mix” (tco2e/
MWh) applicable in each country where the consumption takes place.
l the supply chains: fuels and chemical products used in the systems considered, analysing the emissions associated with the processes of extraction, production and transport-distribution of the fuels and the processes of manufacture and transport of the rest of the supplies to the installation.
l the main waste chains generated in each facility, analysing their transport routes and the options for their management, considering the emissions associated with the transport of the waste from the generation points to the selected final managers, the recycling operations, energy valuation, material valuation in its various final treatments, incineration and deposit at a waste site.
the emissions of GhG relating to the manufacture of machinery and components and construction/dismantling of the necessary infrastructures throughout the chains considered (liquefaction plants, natural gas distribution networks,…) are not considered when calculating the emissions that constitute the cF.
the functional unit used is the amount of natural gas produced, transported or processed (kWh).
7
CA
RB
ON
FO
OT
PR
INT
20
12
Un
ión
Fen
osa
Gas
la huella de carbono consolida el inventario de Gases de efecto Invernadero (GeI) del Grupo Unión Fenosa Gas (en términos de co
2e), abarcando tanto las emisiones directas generadas por
actividades controladas por la compañía, como las emisiones indirectas sobre las que no se tiene un control, pero que son consecuencia de la actividad desarrollada y sobre las cuales se puede llegar a tener cierta capacidad de influencia.
el cálculo de la huella de carbono es un elemento de informa-ción que permite ayudar a gestionar los riesgos y oportunidades de la compañía en relación a los GeI de una manera global e in-tegrada, aportando la posibilidad de incorporar la “componente carbono” a la toma de decisiones y a la estrategia de negocio.
el presente documento recoge las emisiones de GeI de las em-presas del Grupo UFG en el año 2012, diferenciando las emi-siones desglosadas por negocio y las emisiones consolidadas del Grupo Unión Fenosa Gas. además, se presenta un análisis evolutivo de las emisiones en los años 2010, 2011 y 2012, tanto a nivel negocio como a nivel compañía.
los sistemas incluidos en el alcance de la hc son, de forma resumida, los indicados a continuación.
2. OBJETO Y ALCANCE
2. object and Scope
the carbon footprint consolidates the inventory of Green-house Gases (GhG) of Union Fenosa Gas Group (in terms of co
2e), including the direct emissions generated by activities
controlled by the company, and the indirect emissions over which there is no control, but which are the consequence of the activity undertaken and upon which it is possible to have a certain capacity of influence.
the calculation of the carbon footprint is a data element that assists the management of the risks and opportunities for the company in relation to the GhG in a global and integrated manner, giving the possibility of incorporating the “carbon component” to decision making and the business strategy.
the present document describes the GhG emissions of the UFG Group companies in 2012, differentiating the emissions broken down by business and the consolidated emissions of the Union Fenosa Gas Group. In addition, there is an analysis of the evolution of emissions in 2010, 2011 and 2012, at both the business and UFG Group levels.
the systems included in the scope of the cF are summarized below.
8
HU
EL
LA
DE
CA
RB
ON
O 2
01
2 U
nió
n Fen
osa G
as
SISTEMASYSTEM
PAÍSCOUNTRY
INSTALACIÓN/ZONA/SEDEINSTALLATION/ZONE/BASE
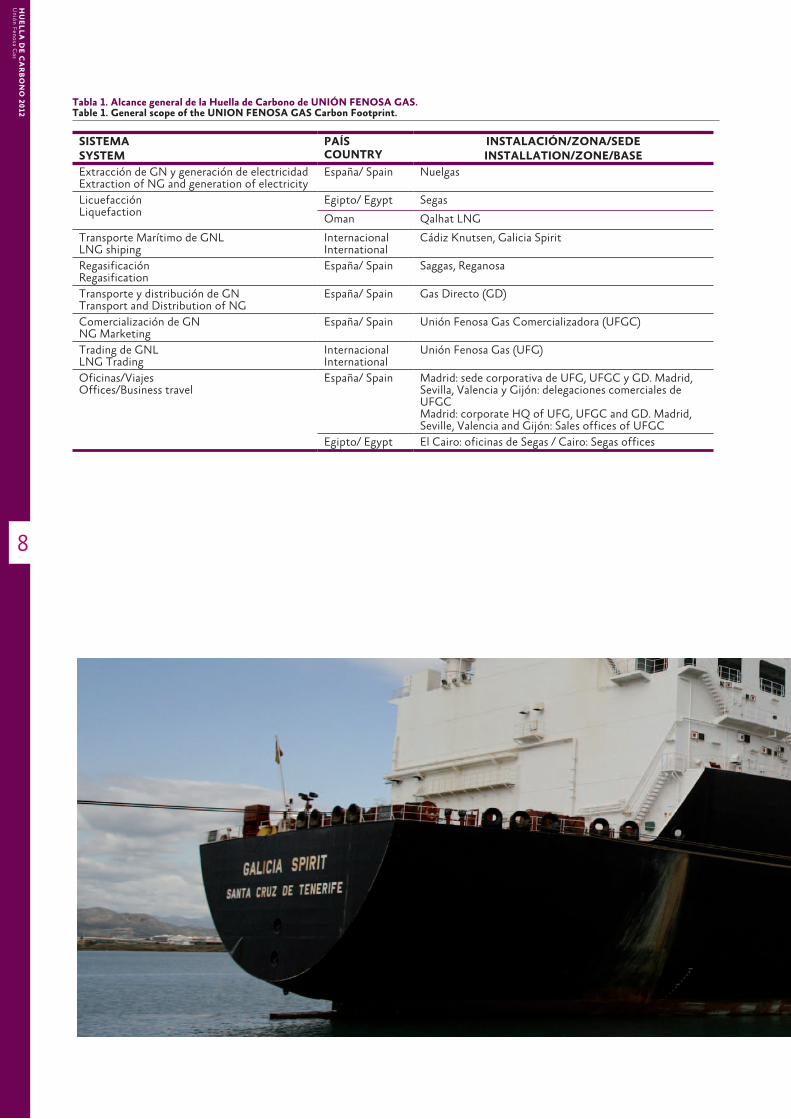
extracción de Gn y generación de electricidad Extraction of Ng and generation of electricity
España/ Spain Nuelgas
licuefacción Liquefaction
Egipto/ Egypt Segas
Oman Qalhat LNg
transporte Marítimo de GnlLNg shiping
InternacionalInternational
Cádiz Knutsen, galicia Spirit
regasificaciónRegasification
España/ Spain Saggas, Reganosa
transporte y distribución de GnTransport and Distribution of Ng
España/ Spain gas Directo (gD)
comercialización de GnNg Marketing
España/ Spain Unión Fenosa gas Comercializadora (UFgC)
trading de GnlLNg Trading
InternacionalInternational
Unión Fenosa gas (UFg)
oficinas/Viajesoffices/business travel
España/ Spain Madrid: sede corporativa de UFg, UFgC y gD. Madrid, Sevilla, Valencia y gijón: delegaciones comerciales de UFgCMadrid: corporate HQ of UFg, UFgC and gD. Madrid, Seville, Valencia and gijón: Sales offices of UFgC
Egipto/ Egypt El Cairo: oficinas de Segas / Cairo: Segas offices
Tabla 1. Alcance general de la Huella de Carbono de UNIÓN FENOSA GAS.Table 1. General scope of the UNION FENOSA GAS Carbon Footprint.

9
CA
RB
ON
FO
OT
PR
INT
20
12
Un
ión
Fen
osa
Gas
a continuación se analizan los resultados de las emisiones con-solidadas alcance 1, 2 y 3 para el Grupo Unión Fenosa Gas. para ello, se han tenido en cuenta el porcentaje de participación de Unión Fenosa Gas en cada uno de los negocios considerados.
por otra parte, debido a que Unión Fenosa Gas cuenta con ne-gocios que se integran verticalmente a lo largo de la cadena de valor del gas natural, a la hora de reportar la huella de carbono de la compañía es necesario consolidar las emisiones mediante la realización de una serie de balances que eviten la doble con-tabilidad de emisiones entre los diferentes alcances de los ne-gocios individualizados. Se trata, de forma simplificada, de ir
3. RESULTADOS DEL GRUPO UNIÓN FENOSA GAS
3. reSUltS oF the UnIon FenoSa GaS GroUp
the consolidated emissions results for Scopes 1, 2 and 3 for the Union Fenosa Gas Group are analysed next. this analysis has taken into account the percentage interest of Union Fenosa Gas in each of the considered companies.
also, because Union Fenosa Gas has businesses that are vertically integrated throughout the natural gas value chain, when reporting the carbon Footprint of the company, it is necessary to consolidate the emissions by making a series of balances that avoid the double accounting of emissions between the different Scopes of the individual businesses. expressed simply, it is a matter of subtracting the Scope 3
10
Un
ión
Feno
sa Gas
HU
EL
LA
DE
CA
RB
ON
O 2
01
2
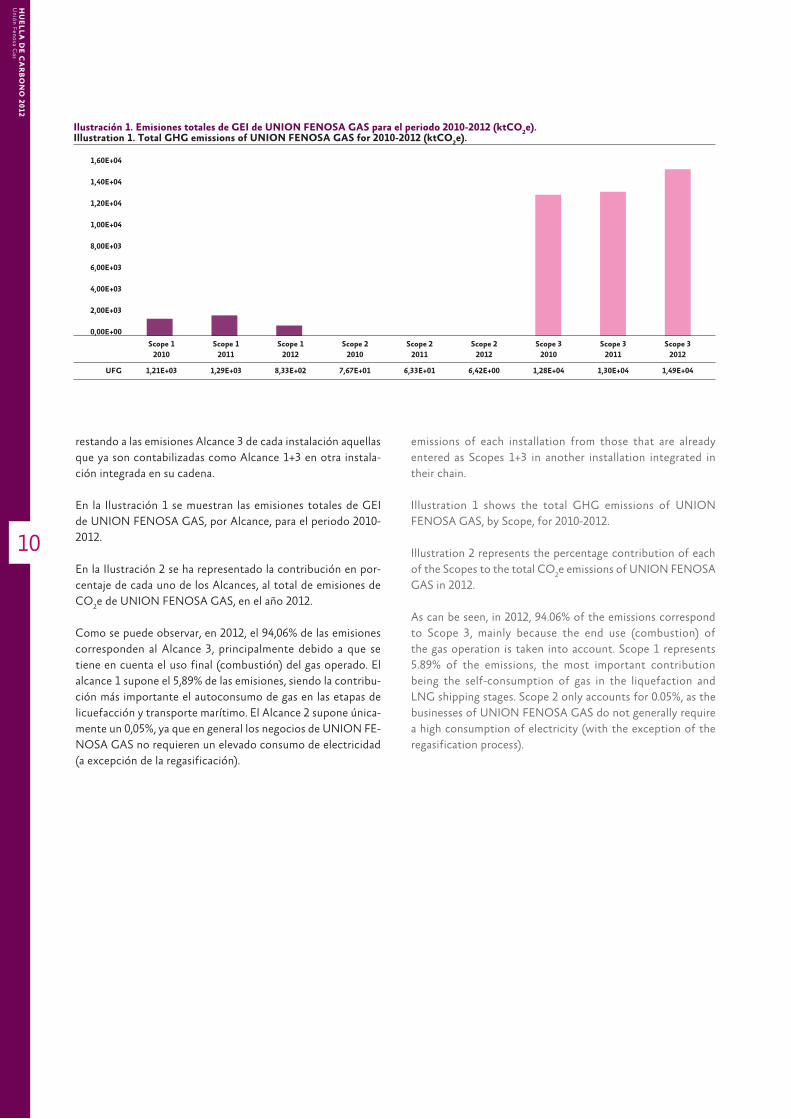
Ilustración 1. Emisiones totales de GEI de UNION FENOSA GAS para el periodo 2010-2012 (ktCO2e).
Illustration 1. Total GHG emissions of UNION FENOSA GAS for 2010-2012 (ktCO2e).
1,60E+04
1,40E+04
1,20E+04
1,00E+04
8,00E+03
6,00E+03
4,00E+03
2,00E+03
0,00E+00
UFG
Scope 12010
Scope 12011
Scope 12012
Scope 22010
Scope 22011
Scope 22012
Scope 32010
Scope 32011
Scope 32012
1,21E+03 1,29E+03 8,33E+02 7,67E+01 6,33E+01 6,42E+00 1,28E+04 1,30E+04 1,49E+04
restando a las emisiones alcance 3 de cada instalación aquellas que ya son contabilizadas como alcance 1+3 en otra instala-ción integrada en su cadena.
en la Ilustración 1 se muestran las emisiones totales de GeI de UnIon FenoSa GaS, por alcance, para el periodo 2010-2012.
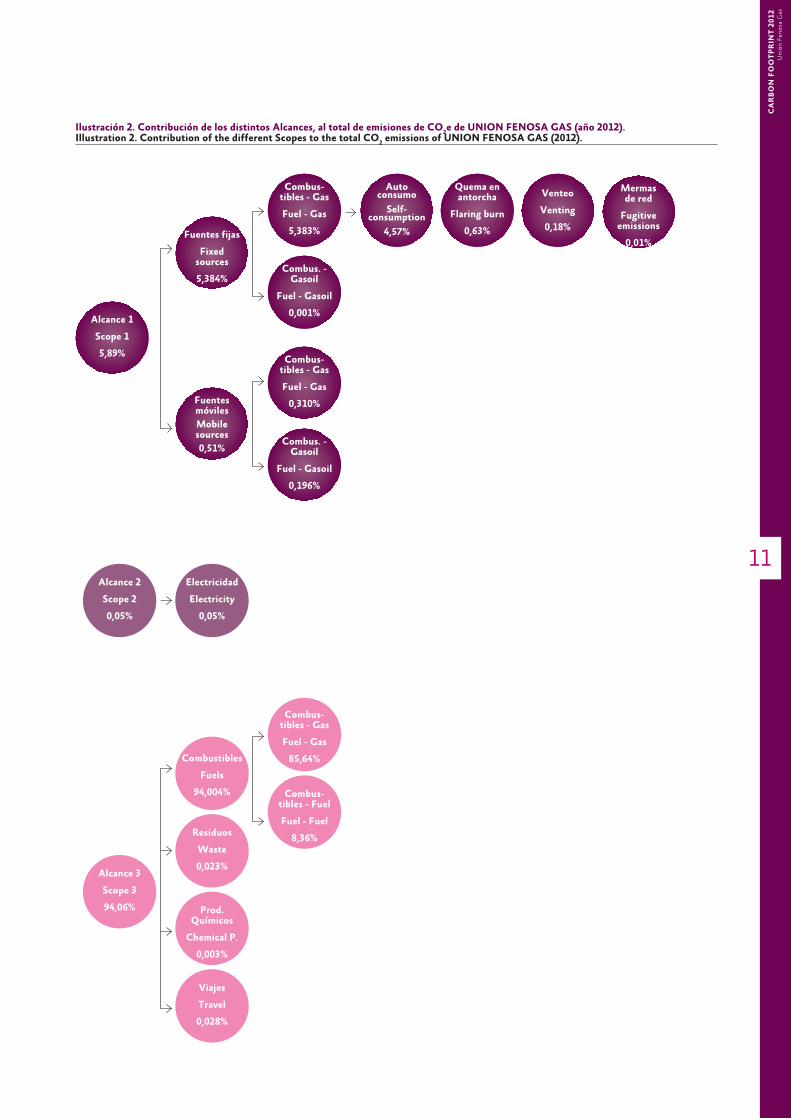
en la Ilustración 2 se ha representado la contribución en por-centaje de cada uno de los alcances, al total de emisiones de co
2e de UnIon FenoSa GaS, en el año 2012.
como se puede observar, en 2012, el 94,06% de las emisiones corresponden al alcance 3, principalmente debido a que se tiene en cuenta el uso final (combustión) del gas operado. el alcance 1 supone el 5,89% de las emisiones, siendo la contribu-ción más importante el autoconsumo de gas en las etapas de licuefacción y transporte marítimo. el alcance 2 supone única-mente un 0,05%, ya que en general los negocios de UnIon Fe-noSa GaS no requieren un elevado consumo de electricidad (a excepción de la regasificación).
emissions of each installation from those that are already entered as Scopes 1+3 in another installation integrated in their chain.
Illustration 1 shows the total GhG emissions of UnIon FenoSa GaS, by Scope, for 2010-2012.
Illustration 2 represents the percentage contribution of each of the Scopes to the total co
2e emissions of UnIon FenoSa
GaS in 2012.
as can be seen, in 2012, 94.06% of the emissions correspond to Scope 3, mainly because the end use (combustion) of the gas operation is taken into account. Scope 1 represents 5.89% of the emissions, the most important contribution being the self-consumption of gas in the liquefaction and lnG shipping stages. Scope 2 only accounts for 0.05%, as the businesses of UnIon FenoSa GaS do not generally require a high consumption of electricity (with the exception of the regasification process).
11
Un
ión
Fen
osa
Gas
CA
RB
ON
FO
OT
PR
INT
20
12
Alcance 2
Scope 2
0,05%
Electricidad
Electricity
0,05%
Alcance 1
Scope 1
5,89%
Fuentes fijas
Fixed sources
5,384%
Fuentes móvilesMobile sources0,51%
Combus- tibles - Gas
Fuel - Gas
5,383%
Auto consumo
Self-consumption
4,57%
Quema en antorcha
Flaring burn
0,63%
Venteo
Venting
0,18%
Mermas de red
Fugitive emissions
0,01%
Combus- tibles - Gas
Fuel - Gas
0,310%
Combus. - Gasoil
Fuel - Gasoil
0,001%
Combus. - Gasoil
Fuel - Gasoil
0,196%
Alcance 3
Scope 3
94,06%
Combustibles
Fuels
94,004%
Combus- tibles - Gas
Fuel - Gas
85,64%
Residuos
Waste
0,023%
Combus- tibles - Fuel
Fuel - Fuel
8,36%
Prod. Químicos
Chemical P.
0,003%
Viajes
Travel
0,028%
Ilustración 2. Contribución de los distintos Alcances, al total de emisiones de CO2e de UNION FENOSA GAS (año 2012).
Illustration 2. Contribution of the different Scopes to the total CO2 emissions of UNION FENOSA GAS (2012).
12
Un
ión
Feno
sa Gas
HU
EL
LA
DE
CA
RB
ON
O 2
01
2
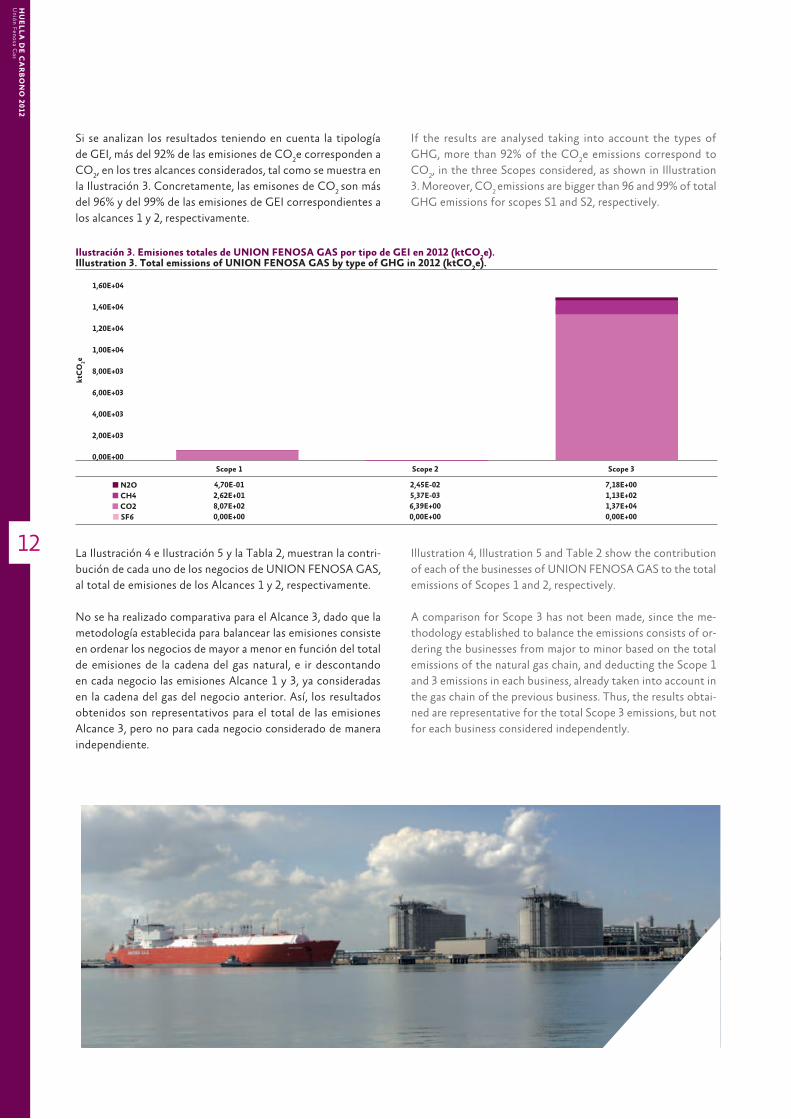
Si se analizan los resultados teniendo en cuenta la tipología de GeI, más del 92% de las emisiones de co
2e corresponden a
co2, en los tres alcances considerados, tal como se muestra en
la Ilustración 3. concretamente, las emisones de co2 son más
del 96% y del 99% de las emisiones de GeI correspondientes a los alcances 1 y 2, respectivamente.
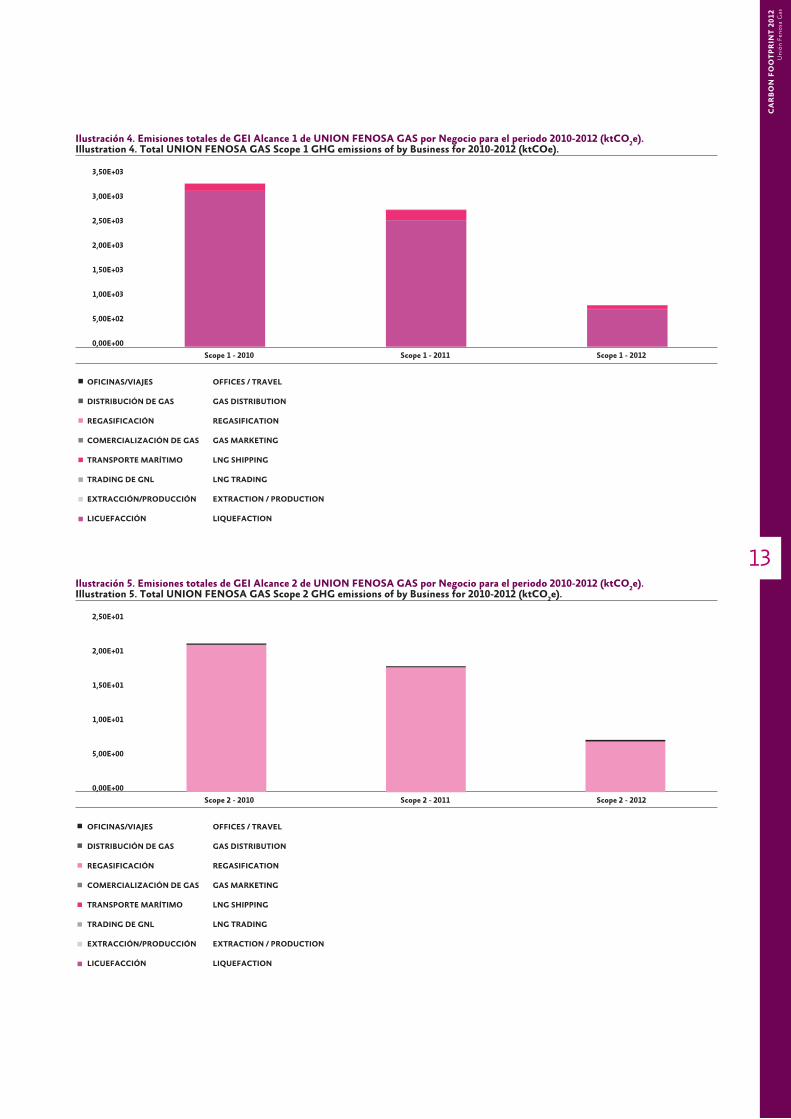
la Ilustración 4 e Ilustración 5 y la tabla 2, muestran la contri-bución de cada uno de los negocios de UnIon FenoSa GaS, al total de emisiones de los alcances 1 y 2, respectivamente.
no se ha realizado comparativa para el alcance 3, dado que la metodología establecida para balancear las emisiones consiste en ordenar los negocios de mayor a menor en función del total de emisiones de la cadena del gas natural, e ir descontando en cada negocio las emisiones alcance 1 y 3, ya consideradas en la cadena del gas del negocio anterior. así, los resultados obtenidos son representativos para el total de las emisiones alcance 3, pero no para cada negocio considerado de manera independiente.
If the results are analysed taking into account the types of GhG, more than 92% of the co
2e emissions correspond to
co2, in the three Scopes considered, as shown in Illustration
3. Moreover, co2 emissions are bigger than 96 and 99% of total
GhG emissions for scopes S1 and S2, respectively.
Illustration 4, Illustration 5 and table 2 show the contribution of each of the businesses of UnIon FenoSa GaS to the total emissions of Scopes 1 and 2, respectively.
a comparison for Scope 3 has not been made, since the me-thodology established to balance the emissions consists of or-dering the businesses from major to minor based on the total emissions of the natural gas chain, and deducting the Scope 1 and 3 emissions in each business, already taken into account in the gas chain of the previous business. thus, the results obtai-ned are representative for the total Scope 3 emissions, but not for each business considered independently.
Ilustración 3. Emisiones totales de UNION FENOSA GAS por tipo de GEI en 2012 (ktCO2e).
Illustration 3. Total emissions of UNION FENOSA GAS by type of GHG in 2012 (ktCO2e).
1,60E+04
1,40E+04
1,20E+04
1,00E+04
8,00E+03
6,00E+03
4,00E+03
2,00E+03
0,00E+00
ktC
O2e
Scope 1 Scope 2 Scope 3
4,70E- 012,62E+018,07E+020,00E+00
2,45E-025,37E- 036,39E+000,00E+00
7,18E+001,13E+021,37E+040,00E+00
n N2On CH4n CO2
n SF6
13
Un
ión
Fen
osa
Gas
CA
RB
ON
FO
OT
PR
INT
20
12
Ilustración 4. Emisiones totales de GEI Alcance 1 de UNION FENOSA GAS por Negocio para el periodo 2010-2012 (ktCO2e).
Illustration 4. Total UNION FENOSA GAS Scope 1 GHG emissions of by Business for 2010-2012 (ktCOe).
3,50E+03
3,00E+03
2,50E+03
2,00E+03
1,50E+03
1,00E+03
5,00E+02
0,00E+00
Scope 1 - 2010 Scope 1 - 2011 Scope 1 - 2012
OFICINAS/VIAJES
DISTRIBUCIÓN DE GAS
REGASIFICACIÓN
COMERCIALIZACIÓN DE GAS
TRANSPORTE MARÍTIMO
TRADING DE GNL
EXTRACCIÓN/PRODUCCIÓN
LICUEFACCIÓN
OFFICES / TRAVEL
GAS DISTRIBUTION
REGASIFICATION
GAS MARKETING
LNG SHIPPING
LNG TRADING
EXTRACTION / PRODUCTION
LIQUEFACTION
Ilustración 5. Emisiones totales de GEI Alcance 2 de UNION FENOSA GAS por Negocio para el periodo 2010-2012 (ktCO2e).
Illustration 5. Total UNION FENOSA GAS Scope 2 GHG emissions of by Business for 2010-2012 (ktCO2e).
2,50E+01
2,00E+01
1,50E+01
1,00E+01
5,00E+00
0,00E+00
Scope 2 - 2010 Scope 2 - 2011 Scope 2 - 2012
OFICINAS/VIAJES
DISTRIBUCIÓN DE GAS
REGASIFICACIÓN
COMERCIALIZACIÓN DE GAS
TRANSPORTE MARÍTIMO
TRADING DE GNL
EXTRACCIÓN/PRODUCCIÓN
LICUEFACCIÓN
OFFICES / TRAVEL
GAS DISTRIBUTION
REGASIFICATION
GAS MARKETING
LNG SHIPPING
LNG TRADING
EXTRACTION / PRODUCTION
LIQUEFACTION
14
Un
ión
Feno
sa Gas
HU
EL
LA
DE
CA
RB
ON
O 2
01
2
ALCANCE /SCOPE 1
2010 2011 2012
oFIcInaS/VIajeSOFFICES/TRAVEL
0,00e+00 0,00e+00 0,00e+00
dIStrIbUcIÓn de GaSNg DISTRIBUTION
1,45e+00 1,45e+00 1,27e+00
reGaSIFIcacIÓnREgASIFICATION
1,74e-01 9,65e-01 2,18e+00
coMercIalIZacIÓn de GaSNg MARKETINg
0,00e+00 0,00e+00 0,00e+00
tranSporte MarÍtIMo GnlLNg SHIPPINg
1,39e+02 1,97e+02 9,49e+01
tradInG GnlLNg TRADINg
0,00e+00 0,00e+00 0,00e+00
eXtraccIÓn/prodUccIÓnEXTRACTION/PRODUCTION
4,10e+00 1,05e+00 3,07e+00
lIcUeFaccIÓnLIQUEFACTION
1,06e+03 1,09e+03 7,32e+02
TOTAL 1,21E+03 1,29E+03 8,33E+02
ALCANCE /SCOPE 2
2010 2011 2012
oFIcInaS/VIajeSOFFICES/TRAVEL
1,73e-01 1,32e-01 2,14e-01
dIStrIbUcIÓn de GaSNg DISTRIBUTION
2,05e-04 2,11e-04 2,48e-04
reGaSIFIcacIÓnREgASIFICATION
7,46e+00 6,18e+00 6,18e+00
coMercIalIZacIÓn de GaSNg MARKETINg
0,00e+00 0,00e+00 0,00e+00
tranSporte MarÍtIMo GnlLNg SHIPPINg
0,00e+00 0,00e+00 0,00e+00
tradInG GnlLNg TRADINg
0,00e+00 0,00e+00 0,00e+00
eXtraccIÓn/prodUccIÓnEXTRACTION/PRODUCTION
3,87e-02 1,55e-02 3,36e-02
lIcUeFaccIÓnLIQUEFACTION
0,00e+00 0,00e+00 0,00e+00
TOTAL 7,67E+00 6,33E+00 6,42E+00
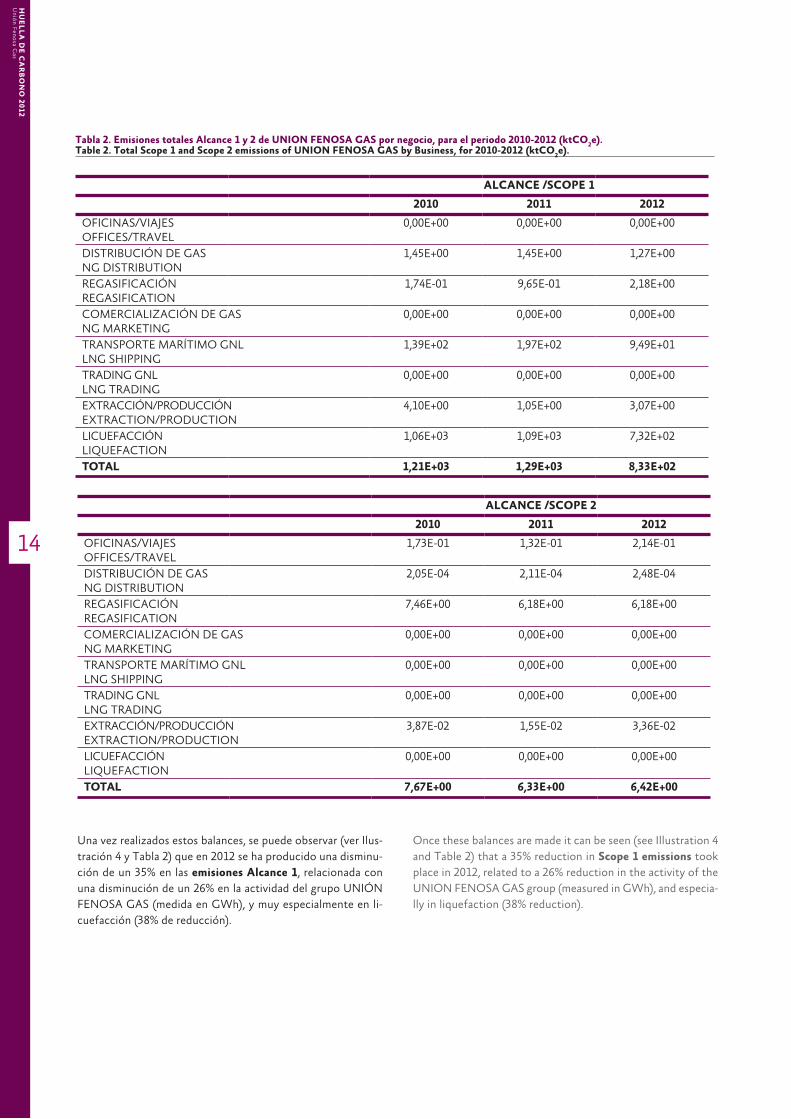
Tabla 2. Emisiones totales Alcance 1 y 2 de UNION FENOSA GAS por negocio, para el periodo 2010-2012 (ktCO2e).
Table 2. Total Scope 1 and Scope 2 emissions of UNION FENOSA GAS by Business, for 2010-2012 (ktCO2e).
Una vez realizados estos balances, se puede observar (ver Ilus-tración 4 y tabla 2) que en 2012 se ha producido una disminu-ción de un 35% en las emisiones Alcance 1, relacionada con una disminución de un 26% en la actividad del grupo UnIÓn FenoSa GaS (medida en GWh), y muy especialmente en li-cuefacción (38% de reducción).
once these balances are made it can be seen (see Illustration 4 and table 2) that a 35% reduction in Scope 1 emissions took place in 2012, related to a 26% reduction in the activity of the UnIon FenoSa GaS group (measured in GWh), and especia-lly in liquefaction (38% reduction).
15
Un
ión
Fen
osa
Gas
CA
RB
ON
FO
OT
PR
INT
20
12
la mayor contribución al alcance 1 la representan las emisio-nes procedentes de la licuefacción (88% del total de emisiones alcance 1 en 2012) y en mucha menor medida del transporte marítimo (11% en 2012), debido a que incluyen instalaciones donde se produce un autoconsumo significativo de gas natural y/o un consumo de otros combustibles.
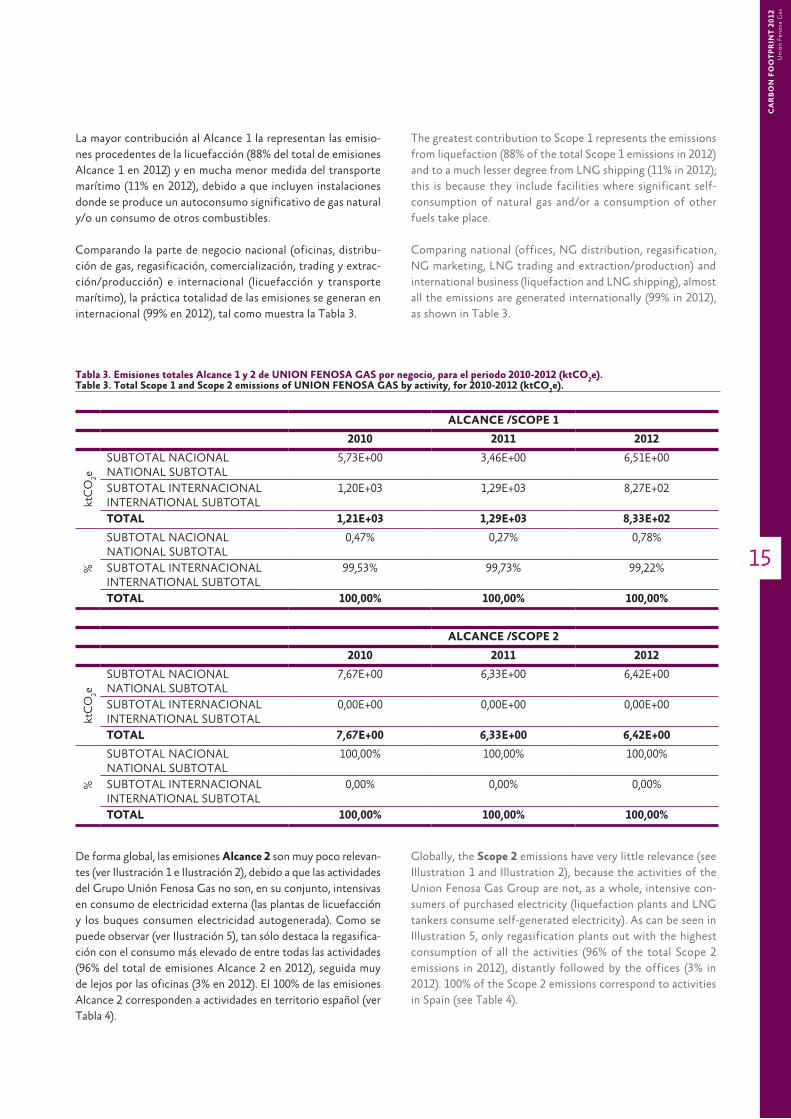
comparando la parte de negocio nacional (oficinas, distribu-ción de gas, regasificación, comercialización, trading y extrac-ción/producción) e internacional (licuefacción y transporte marítimo), la práctica totalidad de las emisiones se generan en internacional (99% en 2012), tal como muestra la tabla 3.
de forma global, las emisiones Alcance 2 son muy poco relevan-tes (ver Ilustración 1 e Ilustración 2), debido a que las actividades del Grupo Unión Fenosa Gas no son, en su conjunto, intensivas en consumo de electricidad externa (las plantas de licuefacción y los buques consumen electricidad autogenerada). como se puede observar (ver Ilustración 5), tan sólo destaca la regasifica-ción con el consumo más elevado de entre todas las actividades (96% del total de emisiones alcance 2 en 2012), seguida muy de lejos por las oficinas (3% en 2012). el 100% de las emisiones alcance 2 corresponden a actividades en territorio español (ver tabla 4).
the greatest contribution to Scope 1 represents the emissions from liquefaction (88% of the total Scope 1 emissions in 2012) and to a much lesser degree from lnG shipping (11% in 2012); this is because they include facilities where significant self-consumption of natural gas and/or a consumption of other fuels take place.
comparing national (offices, nG distribution, regasification, nG marketing, lnG trading and extraction/production) and international business (liquefaction and lnG shipping), almost all the emissions are generated internationally (99% in 2012), as shown in table 3.
Globally, the Scope 2 emissions have very little relevance (see Illustration 1 and Illustration 2), because the activities of the Union Fenosa Gas Group are not, as a whole, intensive con-sumers of purchased electricity (liquefaction plants and lnG tankers consume self-generated electricity). as can be seen in Illustration 5, only regasification plants out with the highest consumption of all the activities (96% of the total Scope 2 emissions in 2012), distantly followed by the offices (3% in 2012). 100% of the Scope 2 emissions correspond to activities in Spain (see table 4).
ALCANCE /SCOPE 1
2010 2011 2012
ktc
o2e
SUbtotal nacIonalNATIONAL SUBTOTAL
5,73e+00 3,46e+00 6,51e+00
SUbtotal InternacIonalINTERNATIONAL SUBTOTAL
1,20e+03 1,29e+03 8,27e+02
TOTAL 1,21E+03 1,29E+03 8,33E+02
%
SUbtotal nacIonalNATIONAL SUBTOTAL
0,47% 0,27% 0,78%
SUbtotal InternacIonalINTERNATIONAL SUBTOTAL
99,53% 99,73% 99,22%
TOTAL 100,00% 100,00% 100,00%
ALCANCE /SCOPE 2
2010 2011 2012
ktc
o2e
SUbtotal nacIonalNATIONAL SUBTOTAL
7,67e+00 6,33e+00 6,42e+00
SUbtotal InternacIonalINTERNATIONAL SUBTOTAL
0,00e+00 0,00e+00 0,00e+00
TOTAL 7,67E+00 6,33E+00 6,42E+00
%
SUbtotal nacIonalNATIONAL SUBTOTAL
100,00% 100,00% 100,00%
SUbtotal InternacIonalINTERNATIONAL SUBTOTAL
0,00% 0,00% 0,00%
TOTAL 100,00% 100,00% 100,00%
Tabla 3. Emisiones totales Alcance 1 y 2 de UNION FENOSA GAS por negocio, para el periodo 2010-2012 (ktCO2e).
Table 3. Total Scope 1 and Scope 2 emissions of UNION FENOSA GAS by activity, for 2010-2012 (ktCO2e).

16
Un
ión
Feno
sa Gas
HU
EL
LA
DE
CA
RB
ON
O 2
01
2
el cambio climático es uno de los grandes desafíos de la so-ciedad actual. los mecanismos básicos del cambio climático están ampliamente consensuados: la tierra se está calentando y lo seguirá haciendo en el futuro, y este calentamiento es causado principalmente por la actividad del hombre, más con-cretamente por la quema de combustibles fósiles (con un 95% de probabilidad, según los estudios más recientes del Ipcc, el panel Intergubernamental sobre cambio climático, por sus siglas en inglés) y las emisiones asociadas de gases de efecto invernadero (GeI).
en el entorno actual, las empresas y organizaciones afrontan riesgos (y oportunidades) entre los cuales el cambio climá-tico no es uno de los más graves ni inmediatos. no obstante, el impacto del cambio climático en las organizaciones en los próximos años será sin duda creciente, ya que los estados y organismos supranacionales definirán requisitos regulatorios cada vez más exigentes enfocados a la reducción y gestión de las emisiones de GeI.
de forma añadida, la identificación, control, gestión y reduc-ción de GeI no solo reporta beneficios ambientales, sino que también conlleva generalmente ahorros relevantes en el con-sumo de energía, una mejora estable y recurrente de la eficien-cia de los procesos y actividades y una mejora en reputación e imagen tanto externa como interna de las organizaciones.
la gestión de los recursos, el control de costes, la protección de la reputación corporativa y el cumplimiento legal, aparte de la preservación del medio ambiente, son razones de negocio suficientes para que las organizaciones definan estrategias de gestión del carbono.
el cálculo de la hc de UFG ayudará a la organización a iden-tificar oportunidades para mejorar la gestión ambiental, la efi-ciencia energética, ahorrar costes energéticos y prepararse ante requisitos regulatorios futuros más estrictos en esta materia.
5. CONCLUSIONES
5. conclUSIonS
climate change is one of the great challenges facing today’s society. the basic mechanisms of climate change are widely agreed: the earth is warming and it will continue to do so in the future. this warming is caused mainly by human activity, more specifically by the burning of fossil fuels (with a 95% probability, according to the most recent conclusions of the Ipcc, the Intergovernmental panel on climate change,) and the associated greenhouse gas (GhG) emissions.
In the current environment, companies and organisations face risks (and opportunities) among which climate change is not one of most serious, nor immediate. however, the impact of climate change on organisations in the coming years will un-doubtedly increase, as States and supranational organisations will define increasingly more demanding regulatory require-ments, focused on the reduction and management of GhG emissions.
additionally, the identification, control and reduction of GhG emissions not only bring environmental benefits, but also generally entail important savings in energy consumption, a stable and recurrent improvement in the efficiency of the pro-cesses and activities and an improvement in both the external, and internal, reputation and image of organisations.
apart from the preservation of the environment, resources management, cost control, protection of corporate reputation and legal compliance provide sufficient business reasons for organisations to define carbon management strategies.
the calculation of the carbon Footprint (cF) of UFG helps the organisation to identify opportunities to improve environmen-tal management, energy efficiency, and savings in energy costs, and to prepare for stricter future regulatory requirements in this matter.
17
Un
ión
Fen
osa
Gas
CA
RB
ON
FO
OT
PR
INT
20
12
la hc de UFG (alcances 1+2+3) es significativa. principalmente por las emisiones de la combustión en las instalaciones de los clientes del gas natural comercializado por UFG, tanto en el mercado nacional como internacional (emisiones indirectas al-cance 3). la capacidad de influencia de UFG en estos procesos de combustión en clientes es muy limitada, pero aún así, es una de las líneas de acción relevantes de UFG. las emisiones indirectas por el consumo de electricidad son muy poco rele-vantes (<0,1%).
por otro lado, las emisiones de GeI generadas de forma directa por las actividades de las empresas del grupo UFG (alcance 1) representan menos del 6% del total de la cadena del gas, y se producen principalmente en los procesos de licuefacción y transporte marítimo de Gnl.
la hc de UFG se ha incrementado un 10% en 2012 con res-pecto de 2011. este aumento esta causado por el incremento de emisiones indirectas alcance 3, (15% mayores) que no ha sido suficientemente compensada por la bajada de las emisio-nes directas alcance 1 (35% menores).
la metodología desarrollada basada en el GhG protocol y las ampliaciones y mejoras realizadas proporcionan a UFG los si-guientes beneficios:
• Permite a UFG realizar un inventario de emisiones de GEI de la organización fiable y transparente. de forma añadida a la publicación de este informe, las principales cifras del mismo se reflejan asimismo en el Informe de responsabilidad corpo-rativa que publica UFG desde 2012.
• Las herramientas de gestión de la información, ampliadas y actualizadas en 2013, simplificarán el proceso de inventario de datos, cálculo de emisiones y la trazabilidad de la informa-ción, de forma que este ejercicio se pueda repetir anualmente, asignando menos recursos.
• Proporciona información adicional, clara y precisa, de las fuentes de emisiones en el grupo, lo cual permitirá la defi-nición de proyectos y estrategias de reducción de emisiones de GeI más efectivos y ajustados a las necesidades de UFG.
• Las herramientas definidas son escalables y los resultados se calculan de forma tanto consolidada como desagregada per-mitiendo realizar análisis, cálculos e informes para perímetros adaptables a las necesidades de UFG.
este informe muestra que UFG está bien preparada para ges-tionar las emisiones de GeI resultantes de sus actividades, con proyectos presentes y futuros con potencial para reducir las emisiones, tanto dentro de la organización, como en las cade-nas de aprovisionamiento de gas y utilización de sus productos y servicios.
the cF of UFG (Scopes 1+2+3) is significant. this is due mainly to the emissions from combustion in the installations of the clients of the natural gas marketed by UFG, in both the na-tional and international markets (indirect emissions scope 3). UFG’s capacity for influence in these combustion processes among clients is very limited, but even so, it is one of the im-portant lines of action of UFG. Indirect emissions through electricity consumption are of little relevance (<0.1%).
Moreover, the GhG emissions generated directly by the acti-vities of the UFG group of companies (scope 1) represent less than 6% of the total of the gas chain, and are mainly produced in the processes of liquefaction and marine transport of lnG.
the cF of UFG has increased 10% in 2012 with respect to the previous year. this increase was caused by the increase of Scope 3 indirect emissions (15% higher), which had not been sufficiently compensated by the reduction of Scope 1 direct emissions (35% lower).
the methodology developed, based on the GhG protocol and its additions and improvements, provides UFG with the following benefits:
• It allows UFG to make a reliable and transparent inventory of the GhG emissions of the organisation. In addition to the publication of this report, its main figures are also reflected in the corporate responsibility report, published by UFG since 2012.
• The information management tools, extended and updated in 2013, will simplify the data inventory process, emissions calculation and information traceability, so that this exercise can be repeated annually, assigning less resources.
• It provides additional, clear and precise information, on the sources of emissions in the group, which will allow the defini-tion of GhG emissions reduction projects and strategies that are more effective and adapted to the needs of UFG.
• The defined tools are scalable and the results are calculated in a consolidated and disaggregated manner, allowing analyses, calculations and reports to be made for parameters adaptable to the needs of UFG.
this report shows that UFG is well prepared to manage the GhG emissions resulting from its activities, with present and future projects with the potential to reduce the emissions, both within the organisation, and in the gas supply chains and use of its products and services.

Informe resultados huella de carbono 2010-2012 del Grupo UnIon FenoSa GaS
para obtener una copia diríjase al departamento de calidad y Medio ambiente de UnIon FenoSa GaS
autor
departamento de calidad y Medio ambiente de UnIon FenoSa GaS
edita
departamento de Marketing y comunicación de UnIon FenoSa GaS
diseño y desarrollo
gosban consultora de comunicación
Unión Fenosa Gas, S.a.
parque empresarial alvento
Vía de los poblados, 1
edificio d - 3ª planta
28033 Madrid