Embed Size (px)
Citation preview
DOI: 10.1590/1808-057x201704450ISSN 1808-057X
326
IFRS, synchronicity, and financial crisis: the dynamics of accounting information for the Brazilian capital market
Bruno FiglioliUniversidade de São Paulo, Faculdade de Economia, Administração e Contabilidade de Ribeirão Preto, Departamento de Contabilidade, Ribeirão Preto, SP, Brazil
Sirlei LemesUniversidade Federal de Uberlândia, Faculdade de Ciências Contábeis, Uberlândia, MG, Brazil
Fabiano Guasti LimaUniversidade de São Paulo, Faculdade de Economia, Administração e Contabilidade de Ribeirão Preto, Departamento de Contabilidade, Ribeirão Preto, SP, Brazil
Received on 10.05.2016 – Desk acceptance on 11.07.2016 – 3rd version approved on 03.19.2017 – Ahead of print on 07.03.2017
ABSTRACTThis study aims is to investigate the synchronicity levels of shares traded on the spot market of the São Paulo Stock, Commodities, and Futures Exchange (BM&FBOVESPA) in relation to the accounting convergence process towards International Financial Reporting Standards (IFRS) in Brazil. The term synchronicity refers to the amount that company-specific information and market information are reflected in stock prices. The more share prices reflect company-specific information rather than market information, the greater the informational content of these prices will be in terms of representing the economic value of a particular company. For this investigation, information on companies and shares from 2005 to 2015 was collected, excluding the financial sector. The data were analyzed using cross-sectional and panel regressions. The results indicate a reduction in the synchronicity levels of stocks in the period of full adoption of IFRS in Brazil from 2010 onwards. From 2008 to 2009, which includes the partial adoption of IFRS in Brazil, statistically significant results were not found for the synchronicity levels of shares. However, for times of financial crisis, evidence was found of a reduction in the relevance of accounting information even with the adoption of international accounting standards. The results obtained for the Brazilian context do not support the idea that the adoption of IFRS necessarily causes an increase in the informational content of financial statements and that relevant information is consequently reflected in stock prices.
Keywords: synchronicity, accounting information, informational content, financial crisis, IFRS.
R. Cont. Fin. – USP, São Paulo, v. 28, n. 75, p. 326-343, set./dez. 2017
Bruno Figlioli, Sirlei Lemes & Fabiano Guasti Lima
R. Cont. Fin. – USP, São Paulo, v. 28, n. 75, p. 326-343, set./dez. 2017 327
1. INTRODUCTION
In an efficient market, stock prices reflect investor expectations with regards to future cash flow creation. In the formation of these expectations, company-specific information competes with market information, such as rumors and political events, among others (Roll, 1988).
Morck, Yeung, and Yu (2000) employed the term synchronicity to describe the amount that specific and market information is incorporated into share prices. These authors measured the synchronicity construct as the result of the coefficient of determination (R2) based on the market model. The R2 can be interpreted as an inverse measure of the informational content of share prices; that is, the lower the value of this measure, the greater the efficiency of share prices in reflecting company-specific information and consequently their intrinsic value. It follows on from this that lower synchronicity levels can be important factors for price and share returns forecasts.
The literature in Finance that addresses the informational content of share prices points to various factors being associated with synchronicity levels: ownership rights (Morck et al., 2000), corporate transparency (Jin & Myers, 2006), investment analyst coverage (Chan & Hameed, 2006), quality of financial reports (Hutton, Marcus & Tehranian, 2009), and shareholder concentration (Boubaker, Mansali & Rjiba, 2014; Gul, Kim & Qiu, 2010), among others.
More recently, Kim and Shi (2012) and Wang and Yu (2015) indicated that the adoption of International Financial Reporting Standards (IFRS) by a particular country can lead to greater incorporation of company-specific information in share prices (low synchronicity). However, the authors note than only for countries where adequate levels of legal enforcement and investor protection were identified was an improvement in the informational content of share prices observed. It is therefore interesting to study the IFRS convergence process in less developed markets for at least three reasons.
The first reason relates to comparing the quantitative and qualitative attributes of two different standards. Countries such as Brazil, Russia, India, and China (BRIC) have historically focused their accounting standards on providing information to their governments, whereas investors constitute the main users of the international standards (Ghio & Verona, 2015).
The second reason concerns the interaction of accounting information with the political, economic, and cultural aspects of each country. For example, Piotroski, Wong, and Zhang (2015) indicate that Chinese firms controlled by the government avoid reporting bad news
on their economic performance on dates close the Chinese Communist Party’s Annual Conference. For the authors, this characteristic of the Chinese market violates investors’ right of access to information.
The third reason relates to the measurement criteria adopted in IFRS for some items, such as financial instruments, which are measured at fair value. This marking-to-market in the measurement of assets and liabilities is subject to possible biases, especially in markets with little liquidity. In such markets value estimation techniques based on projected cash flow are adopted, which can in turn create a considerable increase in manager discretion in this estimation process. Emerging markets supposedly fit this scenario (Laux & Leuz, 2009; Mala & Chand, 2012).
In this context, in order to study the relationship between the construct of synchronicity of shares in emerging markets and IFRS adoption, the Brazilian scenario was defined as the focus of investigation. According to Ghio and Verona (2015), Brazil adopted IFRS without great changes, unlike countries such as China and India, which decided to adopt a kind of combination of local and international accounting standards. Moreover, the IFRS convergence process in Brazil was separated into two stages. The first involved partial adoption for 2008 and 2009. In the second stage, from 2010 onwards, companies were obliged to publish their accounting reports entirely in the IFRS format.
This paper thus aims to answer the following question: what was the influence of Brazil adopting IFRS on the synchronicity levels of shares traded on the São Paulo Stock, Commodities, and Futures Exchange (BM&FBOVESPA)?
In order to investigate the research problem, data was used on companies with shares listed on the BM&FBOVESPA – except those from the financial sector – in the period from 2005 to 2015. The data were analyzed using regression analysis of cross-sectional and panel data.
The results obtained, and supported by additional tests, differed between the periods of partial and full adoption of IFRS. The evidence found did not indicate changes in synchronicity levels in the period of partial adoption (from 2008 to 2009). However, a reduction in synchronicity levels was identified for the period of full adoption (from 2010 onwards). For the period of full adoption, the results support the arguments that IFRS represents accounting standards with better informational quality than local standards, as found in Barth, Landsman, and Lang (2008). One possible explanation for the results found for the period of partial adoption of IFRS is that
IFRS, synchronicity, and financial crisis: the dynamics of accounting information for the Brazilian capital market
R. Cont. Fin. – USP, São Paulo, v. 28, n. 75, p. 326-343, set./dez. 2017328
they involve a period of transition and adaptation of the Brazilian market to the new accounting standards.
Another important result concerns the synchronicity levels during periods of financial crisis in the Brazilian financial market. In these periods, increases in synchronicity levels were identified, independently of partial or full adoption of IFRS. An example of this is that the synchronicity levels for 2014 and 2015 were not statistically different from those found for 2005, the latter period being prior to IFRS adoption.
In periods of financial crisis, the actions of less sophisticated investors (noise traders) can systematically distort asset prices in relation to their intrinsic value (De Long, Shleifer, Summers & Waldman, 1990). This factor could be a plausible explanation for the synchronicity levels verified in this study for the periods of financial crisis.
The results obtained have important implications for investors, regulators, and standardizers in the area of
accounting. For investors, they provide information on the share price formation process, especially in periods of greater financial market turbulence; for regulators and standardizers in the area of accounting, they provide important contributions on the process of accounting convergence towards IFRS. For example, the period of partial adoption of IFRS in Brazil was shown to be critical in this accounting convergence process in terms of reducing the informational asymmetry between companies and investors.
This article is divided into five sections. The first relates to this introduction. The second section concerns the theoretical framework, which addresses IFRS accounting standardization, the synchronicity construct, and the development of the hypotheses. The third section presents the methodological aspects. The fourth presents and analyzes the results, and finally, section five lays out the final remarks.
2. THEORETICAL FRAMEWORK
2.1 Accounting Standardization – IFRS
The accounting reports that companies publish play an important role in the valuation process and in managing the different contracts established between the interested parties. For the evaluation process, accounting information can help current and potential investors to more precisely predict future economic benefits and their risks. For contract management, accounting information can be used as a means of control and in evaluating the performance of company resources, mitigating conflicts of interest between the different interested parties. The effectiveness of these functions of accounting information also involves examining the code used for its development; that is, its standardization. (Bruggemann, Hitz & Sellhorn, 2013).
Accounting standards establish the principles, rules, and guidelines for recognizing, measuring, and reporting accounting facts. Thus, specific accounting standards (United States Generally Accepted Accounting Principles – US GAAP –, IFRS, local standards) strike a particular balance between their qualitative and quantitative aspects (Glaum, Baete, Groethe & Oberdorster, 2013a). For example, the accounting standards of countries influenced by common-law legal systems tend to be based on principles, unlike those of countries influenced by the code-law model, in which accounting standards are based on rules (Ali & Hwang, 2000; Ball, Kothari & Robin, 2000).
The issue of accounting standardization has reshaped the research. Recently, more than 130 jurisdictions underwent the accounting convergence process from local standards to IFRS (Deloitte Global Services, 2016). However, studies have indicated contrasting results in relation to the economic consequences resulting from this convergence process.
Daske, Hail, Leuz, and Verdi (2013) examined the changes in market liquidity and cost of equity for companies in 30 countries that voluntarily and mandatorily adopted International Accounting Standards (IAS)/IFRS. The authors found evidence that only companies that integrated this accounting convergence process into their strategies to increase transparency (serious adopters) presented a significant increase in the liquidity of their shares listed on the stock exchange and a reduction in the cost of equity.
Other papers have identified positive effects of adopting IFRS accounting norms only in environments with greater enforcement and protection of shareholder rights. Examples of this include increased informational content in published accounting reports (Landsman, Maydew & Thornock, 2012), increased coverage and accuracy when predicting earnings on the part of market analysts (Tan, Wang & Welker, 2011), and increased shareholder liquidity (Christensen, Hail & Leuz, 2013), among others.
Bruno Figlioli, Sirlei Lemes & Fabiano Guasti Lima
R. Cont. Fin. – USP, São Paulo, v. 28, n. 75, p. 326-343, set./dez. 2017 329
For Christensen, Lee, and Walker (2007), convergence towards international accounting standards does not benefit countries equally and creates winners and losers. Daske et al. (2013) and Daske, Hail, Leuz, and Verdi (2008) suggest that the institutional and political environment and ownership structure verified in countries are important factors for explaining the supposed benefits derived from adopting IFRS.
In this sense, studies indicate a distinction between the economic consequences related to the IFRS adoption process for developed and non-developed markets. For emerging countries, for example, society’s perception regarding levels of government corruption, low legal enforcement, and ownership rights violations, are factors that mitigate the quality of accounting information (Houqe & Monem, 2016).
Studies such as those from Nnadi and Soobaroyen (2015) and Hamberg, Mavruk, and Sjogren (2013) indicate that the incentives for emerging countries to adopt IFRS lie in attracting more direct foreign investments and participation in international channels of exchange. These incentives are warranted for the case of emerging countries as a significant portion of their wealth creation derives from exporting commodities: petroleum (Russia), soy and iron ore (Brazil), among others.
Another important point in the process of convergence towards IFRS, especially for emerging markets, relates to periods of financial crisis.
Laux and Leuz (2009, p. 827) understand that “there are legitimate concerns related to measuring assets at market prices in periods of financial crisis”. The authors perceive that accounting standards such as IFRS, which enable some items to be measured at market value, may not be adequate for markets with low liquidity. Under these conditions, accounting statements would lose comparability given that managers could use a high degree of discretion in estimating asset values. Emerging markets supposedly have less liquidity compared to developed markets. Also according to the authors, in periods of financial crisis, marking assets to market creates incentives for managers to transfer bad results from previous periods to a single period (big bath accounting).
For the Brazilian case, Pelucio-Grecco, Geron, Grecco, and Lima (2014) investigated levels of discretionary accruals in companies listed on the BM&FBOVESPA and did not find evidence of earnings management after the full adoption of IFRS. Silva, Weffort, Flores, and Silva (2014) identified, for companies listed on the BM&FBOVESPA, indications of earnings management in periods of financial crisis in Brazil. Thus, periods of
greater financial market instability can reduce the quality of accounting information published by companies.
As the idiosyncrasies identified for emerging markets tend to reduce the relevance of accounting information for decision making, the process of accounting convergence towards IFRS may not reduce information asymmetry between companies and investors. Thus, the informational content of Brazilian company reports was investigated by means of the synchronicity construct.
2.2 Synchronicity
Synchronicity refers to the amount that market and company-specific information are reflected in share prices (Morck et al., 2000). The more share prices reflect market information (greater synchronicity), the worse the informational quality of these prices tends to be, having no relation with the ability of company investments to create future economic benefits based on their economic and financial fundamentals. Roll (1988) proposed that market information would explain only a small portion of share prices and therefore company-specific information would play a relevant role in the pricing process.
Morck et al. (2000) identified greater synchronicity for emerging markets compared with developed markets and attributed this difference to the low levels of protection of ownership rights identified in less developed markets.
For Jin and Myers (2006), environments with greater corporate transparency provide the necessary conditions so that a greater amount of relevant information can be accessed by investors, and with this, synchronicity levels reduced. It is thus reasonable to question whether IFRS adoption can influence synchronicity levels for shares traded on the stock exchange.
Kim and Shi (2012), using data on 34 countries from between 1998 and 2004, found evidence of a reduction in synchronicity levels for companies that voluntarily adopted IFRS. According to the authors, this effect would be more significant for companies followed by a low number of market analysts, with high quality accruals, and a low institutional infrastructure. For Wang and Yu (2015), IFRS adoption by a particular country does not necessarily guarantee better informational quality in share prices. Wang and Yu (2015) indicated that a reduction in synchronicity levels was only verified for countries with high legal enforcement.
Dasgupta, Gan, and Gao (2010) addressed the question of synchronicity from another perspective and developed a theoretical model that provides a dynamic pattern in relation to synchronicity levels. According to
IFRS, synchronicity, and financial crisis: the dynamics of accounting information for the Brazilian capital market
R. Cont. Fin. – USP, São Paulo, v. 28, n. 75, p. 326-343, set./dez. 2017330
the hypotheses raised by the authors, synchronicity levels would initially be reduced with IFRS adoption. Such norms would increase accounting information quality compared to local accounting standards. Subsequently, there would be an increase in synchronicity levels, given that the economic agents would more accurately predict company performance. The current accounting information would not result in “surprises” when estimating future cash flows for the share evaluation process.
Thus, the literature on synchronicity has indicated to a greater or lesser extent that the economic consequences of IFRS adoption are dependent on factors related to institutional environment, legal enforcement, and ownership rights. Moreover, whether the theoretical model from Dasgupta et al. (2010) can be widened or even generalized for other markets such as emerging ones remains an open question.
2.3 Development of the Hypotheses
Of the emerging markets, Brazil has an environment that is conducive to investigating the possible economic consequences of the IFRS convergence process.
According to Ghio and Verona (2015), Brazil adopted IFRS without many alterations and basically involving a process of simple imitation. Moreover, this accounting convergence process was divided into two stages in the Brazilian context. The first relates to the period from 2008 to 2009 with the partial adoption of IFRS norms. In the second stage, from 2010 onwards, companies were obliged to report their accounting statements entirely in the IFRS format.
Unlike Dasgupta et al. (2010), for this study the hypothesis was elaborated that there was an increase in the synchronicity levels of shares traded on the BM&FBOVESPA in the period covering the partial adoption of the IFRS accounting rules.
According to Glaum, Schmidt, Street, and Vogel (2013b), in periods of transition towards IFRS, companies may not present the same level of adaptation in relation to the accounting standards required. In this situation there may be an increase in information asymmetry between current and potential managers and investors. This thus gives rise to the first hypothesis:
H1: the period of partial convergence towards IFRS in Brazil is characterized by an increase in the synchronicity level of the shares traded on the BM&FBOVESPA compared with the period in which local rules applied and the period of full adoption.
In relation to the period of full adoption, the hypothesis was elaborated of a reduction in the synchronicity level of the shares traded on the BM&FBOVESPA. In the period of full adoption, a higher level of company compliance with the new accounting standards was expected. An increase in the informational content of accounting reports was also expected in the period of full adoption. The Brazilian accounting standards in the pre-adoption period can be characterized as focused on fulfilling the informational needs of government. In this case, the accounting reports were perceived by investors as being of little relevance to the decision making process (Lopes, 2006).
H2: the period of full convergence with IFRS in Brazil is characterized by a decrease in the synchronicity level of shares traded on the BM&FBOVESPA compared with the period in which local norms applied and the period of partial adoption.
In addition, a hypothesis was elaborated that relates periods of financial crisis with the synchronicity construct. An increase in synchronicity levels in periods of financial crisis was expected. This effect would be verified both for local norms and for IFRS.
According to De Long et al. (1990), the actions of less sophisticated investors (noise traders) in the capital market can systematically distort the price of assets in relation to their fair value in periods of greater financial market turbulence. These agents would make share price arbitration processes difficult as their decision making processes supposedly do not involve information on the ability of companies to generate future economic benefits. The accounting information would thus lose relevance. This therefore gives rise to the third hypothesis:
H3: periods of financial crisis are associated with higher synchronicity levels for shares traded on the BM&FBOVESPA, independent of the accounting standards adopted.
For the Brazilian context, two periods of greater market turbulence are considered. The first relates to 2008 and 2009 (international crisis) as a reflection of the US financial crisis (subprime securities crisis). According to Mensi, Hammoudeh, Reboredo, and Nguyen (2014), the American financial crisis directly and indirectly impacted the Brazilian market for debt securities (bonds) and the stock market. The second period relates to 2014 and 2015 (domestic crisis), in which a strong retraction in the Brazilian economy was identified. According to data
Bruno Figlioli, Sirlei Lemes & Fabiano Guasti Lima
R. Cont. Fin. – USP, São Paulo, v. 28, n. 75, p. 326-343, set./dez. 2017 331
from the Brazilian Institute of Geography and Statistics (IBGE, 2016), in 2014 and 2015 the average variation in
Brazilian gross domestic product (GDP), considering quarterly data, was -2.99%.
3. METHODOLOGICAL ASPECTS
3.1 Data Collection and Sample
The data used in this study were gathered from the Economática® database. When necessary, they were taken already adjusted for earnings of any nature and refer to information on companies and shares traded on the BM&FBOVESPA from 2005 to 2015.
When composing the sample, observations relating to the financial sector were excluded. Some characteristics of this sector, such as liquidity and capital structure indicators, cannot be compared well with other sectors.
Inactive shares were also excluded as well as the observations that did not present all of the information needed for a particular period in order to conduct the statistical and econometric tests. Moreover, observations
referring to periods in which a particular company presented negative net equity were also excluded, as the results of this study are based on the assumption of business continuity (going concern). With the filters used for data exclusions, the final sample was composed, on average, of shares with a higher degree of tradeability on the spot market of the BM&FBOVESPA. The sample was composed of 674 observations of the shares under analysis.
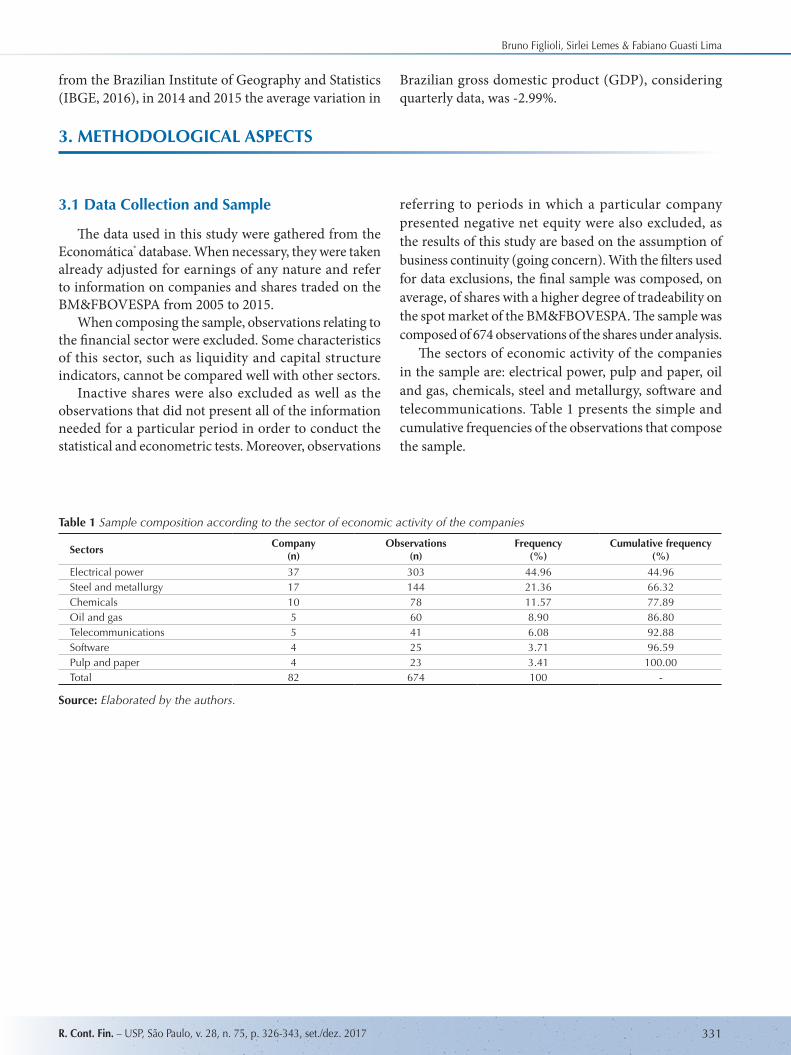
The sectors of economic activity of the companies in the sample are: electrical power, pulp and paper, oil and gas, chemicals, steel and metallurgy, software and telecommunications. Table 1 presents the simple and cumulative frequencies of the observations that compose the sample.
Table 1 Sample composition according to the sector of economic activity of the companies
SectorsCompany
(n)Observations
(n)Frequency
(%)Cumulative frequency
(%)
Electrical power 37 303 44.96 44.96Steel and metallurgy 17 144 21.36 66.32Chemicals 10 78 11.57 77.89Oil and gas 5 60 8.90 86.80Telecommunications 5 41 6.08 92.88Software 4 25 3.71 96.59Pulp and paper 4 23 3.41 100.00Total 82 674 100 -
Source: Elaborated by the authors.
IFRS, synchronicity, and financial crisis: the dynamics of accounting information for the Brazilian capital market
R. Cont. Fin. – USP, São Paulo, v. 28, n. 75, p. 326-343, set./dez. 2017332
3.2 Econometric Modeling
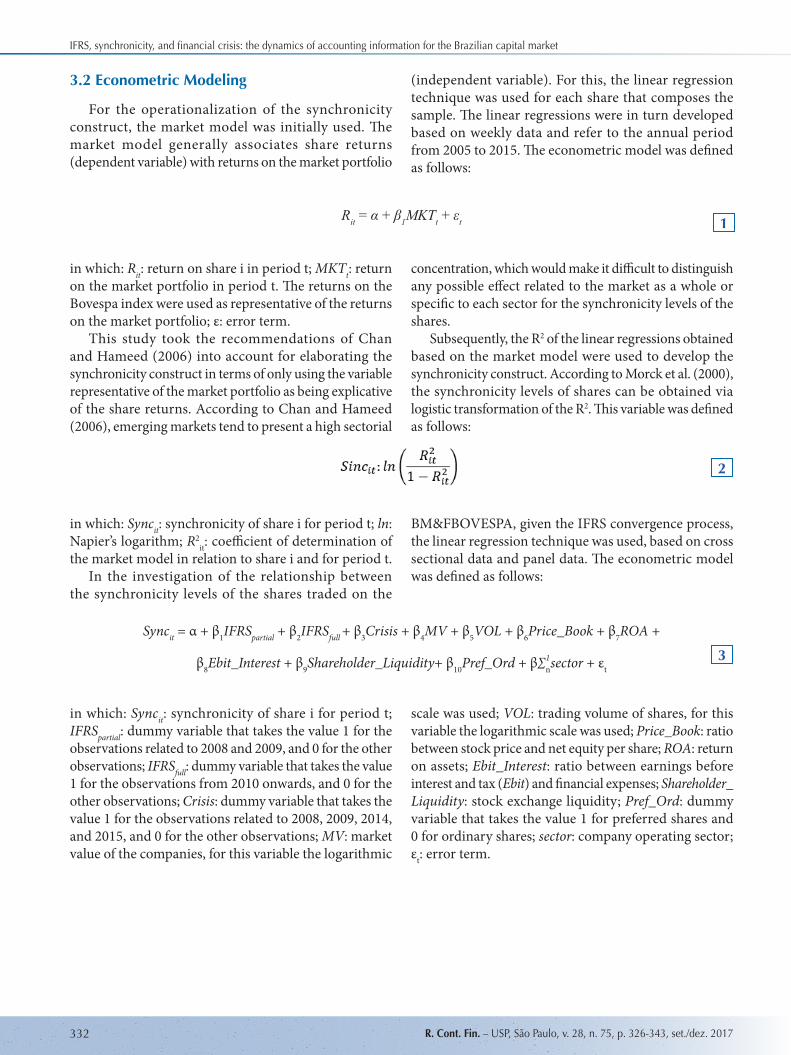
For the operationalization of the synchronicity construct, the market model was initially used. The market model generally associates share returns (dependent variable) with returns on the market portfolio
(independent variable). For this, the linear regression technique was used for each share that composes the sample. The linear regressions were in turn developed based on weekly data and refer to the annual period from 2005 to 2015. The econometric model was defined as follows:
in which: Rit: return on share i in period t; MKTt: return on the market portfolio in period t. The returns on the Bovespa index were used as representative of the returns on the market portfolio; ε: error term.
This study took the recommendations of Chan and Hameed (2006) into account for elaborating the synchronicity construct in terms of only using the variable representative of the market portfolio as being explicative of the share returns. According to Chan and Hameed (2006), emerging markets tend to present a high sectorial
concentration, which would make it difficult to distinguish any possible effect related to the market as a whole or specific to each sector for the synchronicity levels of the shares.
Subsequently, the R2 of the linear regressions obtained based on the market model were used to develop the synchronicity construct. According to Morck et al. (2000), the synchronicity levels of shares can be obtained via logistic transformation of the R2. This variable was defined as follows:
in which: Syncit: synchronicity of share i for period t; ln: Napier’s logarithm; R2
it: coefficient of determination of the market model in relation to share i and for period t.
In the investigation of the relationship between the synchronicity levels of the shares traded on the
BM&FBOVESPA, given the IFRS convergence process, the linear regression technique was used, based on cross sectional data and panel data. The econometric model was defined as follows:
in which: Syncit: synchronicity of share i for period t; IFRSpartial: dummy variable that takes the value 1 for the observations related to 2008 and 2009, and 0 for the other observations; IFRSfull: dummy variable that takes the value 1 for the observations from 2010 onwards, and 0 for the other observations; Crisis: dummy variable that takes the value 1 for the observations related to 2008, 2009, 2014, and 2015, and 0 for the other observations; MV: market value of the companies, for this variable the logarithmic
scale was used; VOL: trading volume of shares, for this variable the logarithmic scale was used; Price_Book: ratio between stock price and net equity per share; ROA: return on assets; Ebit_Interest: ratio between earnings before interest and tax (Ebit) and financial expenses; Shareholder_Liquidity: stock exchange liquidity; Pref_Ord: dummy variable that takes the value 1 for preferred shares and 0 for ordinary shares; sector: company operating sector; εt: error term.
Rit = α + β1MKTt + εt
Syncit = α + β1IFRSpartial + β2IFRSfull + β3Crisis + β4MV + β5VOL + β6Price_Book + β7ROA +
β8Ebit_Interest + β9Shareholder_Liquidity+ β10Pref_Ord + β∑nsector + εt
1
2
31
Bruno Figlioli, Sirlei Lemes & Fabiano Guasti Lima
R. Cont. Fin. – USP, São Paulo, v. 28, n. 75, p. 326-343, set./dez. 2017 333
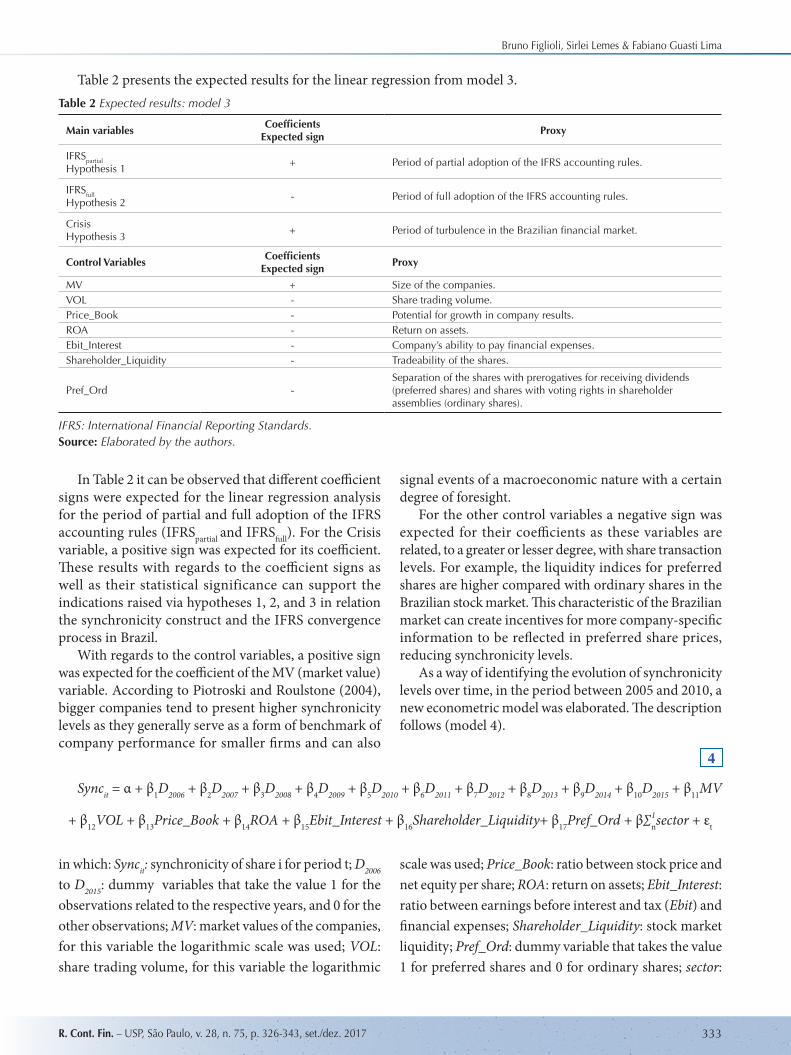
Table 2 presents the expected results for the linear regression from model 3.
in which: Syncit: synchronicity of share i for period t; D2006 to D2015: dummy variables that take the value 1 for the observations related to the respective years, and 0 for the other observations; MV: market values of the companies, for this variable the logarithmic scale was used; VOL: share trading volume, for this variable the logarithmic
scale was used; Price_Book: ratio between stock price and net equity per share; ROA: return on assets; Ebit_Interest: ratio between earnings before interest and tax (Ebit) and financial expenses; Shareholder_Liquidity: stock market liquidity; Pref_Ord: dummy variable that takes the value 1 for preferred shares and 0 for ordinary shares; sector:
Table 2 Expected results: model 3
Main variablesCoefficients
Expected signProxy
IFRSpartialHypothesis 1
+ Period of partial adoption of the IFRS accounting rules.
IFRSfullHypothesis 2
- Period of full adoption of the IFRS accounting rules.
CrisisHypothesis 3
+ Period of turbulence in the Brazilian financial market.
Control VariablesCoefficients
Expected signProxy
MV + Size of the companies.VOL - Share trading volume.Price_Book - Potential for growth in company results. ROA - Return on assets.Ebit_Interest - Company’s ability to pay financial expenses.Shareholder_Liquidity - Tradeability of the shares.
Pref_Ord -Separation of the shares with prerogatives for receiving dividends (preferred shares) and shares with voting rights in shareholder assemblies (ordinary shares).
IFRS: International Financial Reporting Standards.Source: Elaborated by the authors.
In Table 2 it can be observed that different coefficient signs were expected for the linear regression analysis for the period of partial and full adoption of the IFRS accounting rules (IFRSpartial and IFRSfull). For the Crisis variable, a positive sign was expected for its coefficient. These results with regards to the coefficient signs as well as their statistical significance can support the indications raised via hypotheses 1, 2, and 3 in relation the synchronicity construct and the IFRS convergence process in Brazil.
With regards to the control variables, a positive sign was expected for the coefficient of the MV (market value) variable. According to Piotroski and Roulstone (2004), bigger companies tend to present higher synchronicity levels as they generally serve as a form of benchmark of company performance for smaller firms and can also
signal events of a macroeconomic nature with a certain degree of foresight.
For the other control variables a negative sign was expected for their coefficients as these variables are related, to a greater or lesser degree, with share transaction levels. For example, the liquidity indices for preferred shares are higher compared with ordinary shares in the Brazilian stock market. This characteristic of the Brazilian market can create incentives for more company-specific information to be reflected in preferred share prices, reducing synchronicity levels.
As a way of identifying the evolution of synchronicity levels over time, in the period between 2005 and 2010, a new econometric model was elaborated. The description follows (model 4).
Syncit = α + β1D2006 + β2D2007 + β3D2008 + β4D2009 + β5D2010 + β6D2011 + β7D2012 + β8D2013 + β9D2014 + β10D2015 + β11MV
+ β12VOL + β13Price_Book + β14ROA + β15Ebit_Interest + β16Shareholder_Liquidity+ β17Pref_Ord + β∑nsector + εt 1
4
IFRS, synchronicity, and financial crisis: the dynamics of accounting information for the Brazilian capital market
R. Cont. Fin. – USP, São Paulo, v. 28, n. 75, p. 326-343, set./dez. 2017334
Table 3 Descriptive statistics
Panel A
Synchronicity variableObservations
(n)Mean
Standard deviation
Coefficient of variationDifference of means
z statistic
Total sample 674 -2.403 2.393 -0.996 -Pre-IFRS adoption (A) 127 -2.818 2.549 -0.905 -
Partial adoption of IFRS (B) 121 -1.720 2.320 -1.349(B-A)3.550
Full adoption of IFRS (C) 426 -2.657 2.328 -0.876(C-B)
-3.918
Full adoption of IFRS –Excluding 2014 and 2015
272 -2.923 2.382 -0.815 -
Non-crisis period (D) 441 -2.698 2.456 -0.910 -
Crisis period (E) 233 -1.942 2.219 -1.143(E-D)4.054
Panel B
Control variablesTotal sample
Observations(n)
Mean Median Standard deviation Coefficient of variation
MV 674 14.795 15.210 1.961 0.133VOL 674 11.283 10.964 3.800 0.337Price_Book 674 2.215 1.407 6.805 3.072ROA 674 15.945 4.839 315.052 19.759Ebit_Interest 674 -0.792 -2.084 88.880 -112.222Shareholder_Liquidity 674 0.340 0.005 0.882 2.594
Pref_Ord preferred shares (%) Ordinary shares (%)
41.5058.50
- - - -
CV: coefficient of variation; Pre International Financial Reporting Standards (IFRS) adoption: covers 2005 to 2007; Partial adoption of IFRS: covers 2008 to 2009; Full adoption of IFRS: covers 2010 to 2015. Crisis period: covers 2008, 2009, 2014, and 2015; Non-crisis period: covers 2005, 2006, 2007, 2010, 2011, 2012, and 2013; MV: market value of the companies; VOL: share trading volume; Price_Book: ratio between stock price and net equity per share; ROA: return on assets; Ebit_Interest: ratio between earnings before interest and tax (Ebit) and financial expenses; Shareholder_Liquidity: stock exchange liquidity; Pref_Ord: dummy variable that takes the value 1 for preferred shares and 0 for ordinary shares.Source: Elaborated by the authors.
company operating sector; εt: error term.Econometric model 4 considers 2005 as the base year.
Therefore, the coefficients for the period from 2006 to 2015 will be analyzed as marginal alterations in relation to the base-year coefficient (coefficient of the intersection in model 4).
For model 4, the Crisis variable was removed in order to avoid multicollinearity problems. An increase in synchronicity levels is expected for the periods of crisis in the Brazilian financial market. The periods of crisis for
this study correspond to 2008 and 2009 (international crisis) and 2014 and 2015 (domestic crisis).
In model 4 an increase in synchronicity levels was expected for 2008 and 2009 (period of partial adoption of the IFRS accounting rules) and a reduction in synchronicity levels was expected for 2010 to 2015 (period of full adoption of the IFRS accounting rules). For the other (control) variables the same pattern of coefficient signs as those presented in model 3 was expected.
4 PRESENTATION AND ANALYSIS OF THE RESULTS
4.1 Empirical Evidence
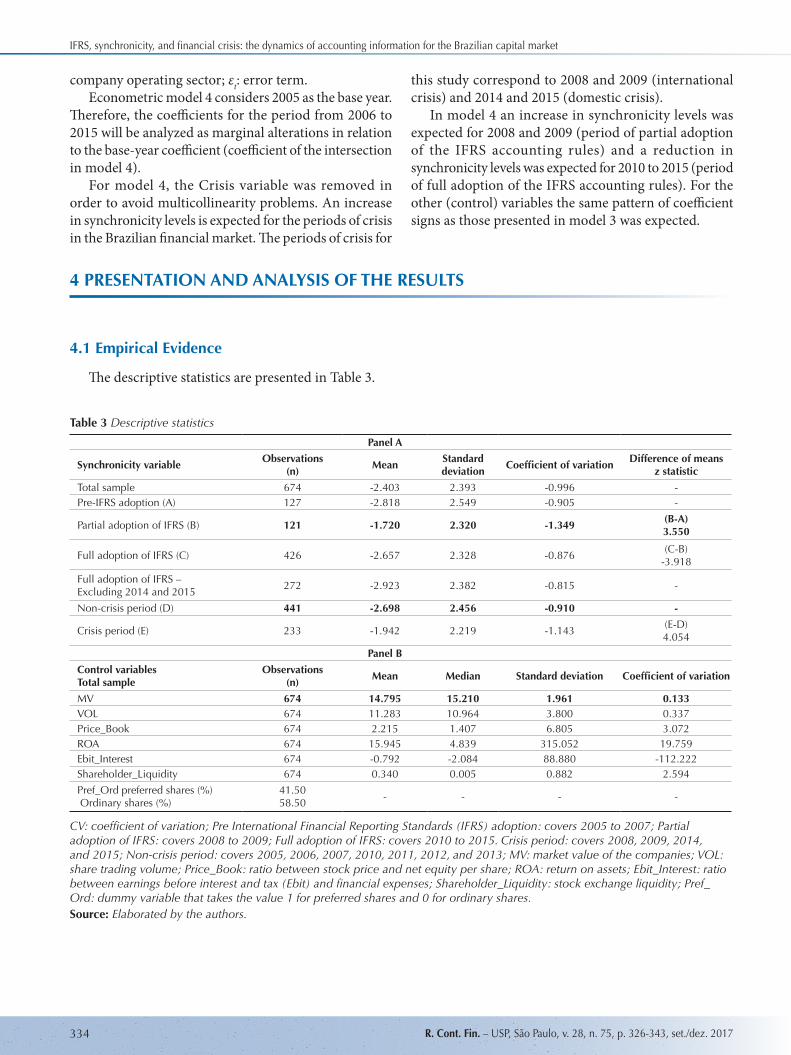
The descriptive statistics are presented in Table 3.
Bruno Figlioli, Sirlei Lemes & Fabiano Guasti Lima
R. Cont. Fin. – USP, São Paulo, v. 28, n. 75, p. 326-343, set./dez. 2017 335
The descriptive statistics for the synchronicity variable are presented in Table 3 (panel A). These statistics refer to the total sample in the period of partial and full adoption of IFRS and for the crisis and non-crisis periods.
Significant statistical differences were identified for the average synchronicity variable in relation to the periods investigated. There were indications of an increase in average synchronicity levels for the period of partial adoption of IFRS compared to the pre-adoption period (z statistic = 3.550). Moreover, there were indications of a decrease in the average synchronicity levels for the period of full adoption of IFRS in relation to the partial adoption period (z statistic = -3.918). For the Crisis variable, an increase in average synchronicity was identified for the crisis periods compared to the non-crisis periods (z statistic = 4.054).
The results found via the difference of means tests support hypotheses 1, 2, and 3 raised in this study. However, these bivariate tests for the averages should be interpreted with much caution since among other facts
they did not use any control variable. Table 3 (panel B) presents the descriptive statistics for
the control variables. One potential problem for using these variables in the econometric models was the high coefficient of variation (CV) verified in some variables (ROA and Ebit_Interest). For this, statistical procedures (Cook distance and measure of leverage) were used to identify the influent (exacerbated) variables in the residuals of the auxiliary (non-tabulated) linear regressions. The observations identified as outliers were removed from the sample. However, there were no significant changes in the quality of the data adjustment in relation to the linear regression model. We thus decided to maintain all of the data in the sample.
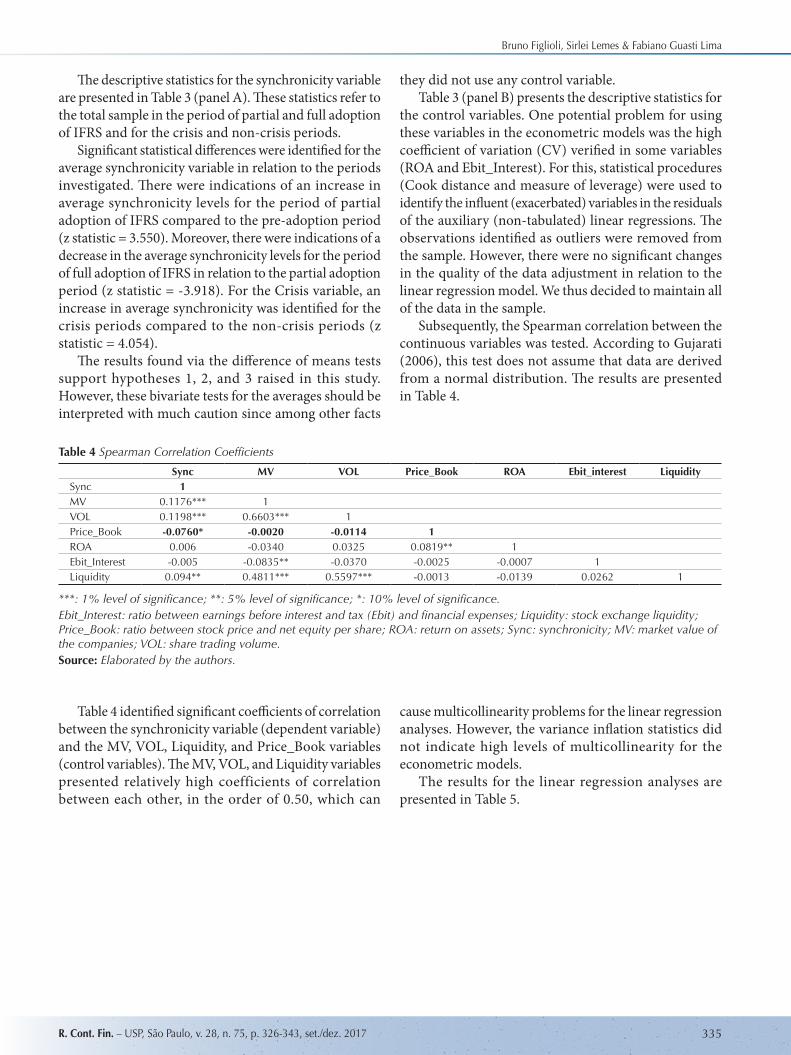
Subsequently, the Spearman correlation between the continuous variables was tested. According to Gujarati (2006), this test does not assume that data are derived from a normal distribution. The results are presented in Table 4.
Table 4 Spearman Correlation Coefficients
Sync MV VOL Price_Book ROA Ebit_interest LiquiditySync 1MV 0.1176*** 1VOL 0.1198*** 0.6603*** 1Price_Book -0.0760* -0.0020 -0.0114 1ROA 0.006 -0.0340 0.0325 0.0819** 1Ebit_Interest -0.005 -0.0835** -0.0370 -0.0025 -0.0007 1Liquidity 0.094** 0.4811*** 0.5597*** -0.0013 -0.0139 0.0262 1
***: 1% level of significance; **: 5% level of significance; *: 10% level of significance.Ebit_Interest: ratio between earnings before interest and tax (Ebit) and financial expenses; Liquidity: stock exchange liquidity; Price_Book: ratio between stock price and net equity per share; ROA: return on assets; Sync: synchronicity; MV: market value of the companies; VOL: share trading volume.Source: Elaborated by the authors.
Table 4 identified significant coefficients of correlation between the synchronicity variable (dependent variable) and the MV, VOL, Liquidity, and Price_Book variables (control variables). The MV, VOL, and Liquidity variables presented relatively high coefficients of correlation between each other, in the order of 0.50, which can
cause multicollinearity problems for the linear regression analyses. However, the variance inflation statistics did not indicate high levels of multicollinearity for the econometric models.
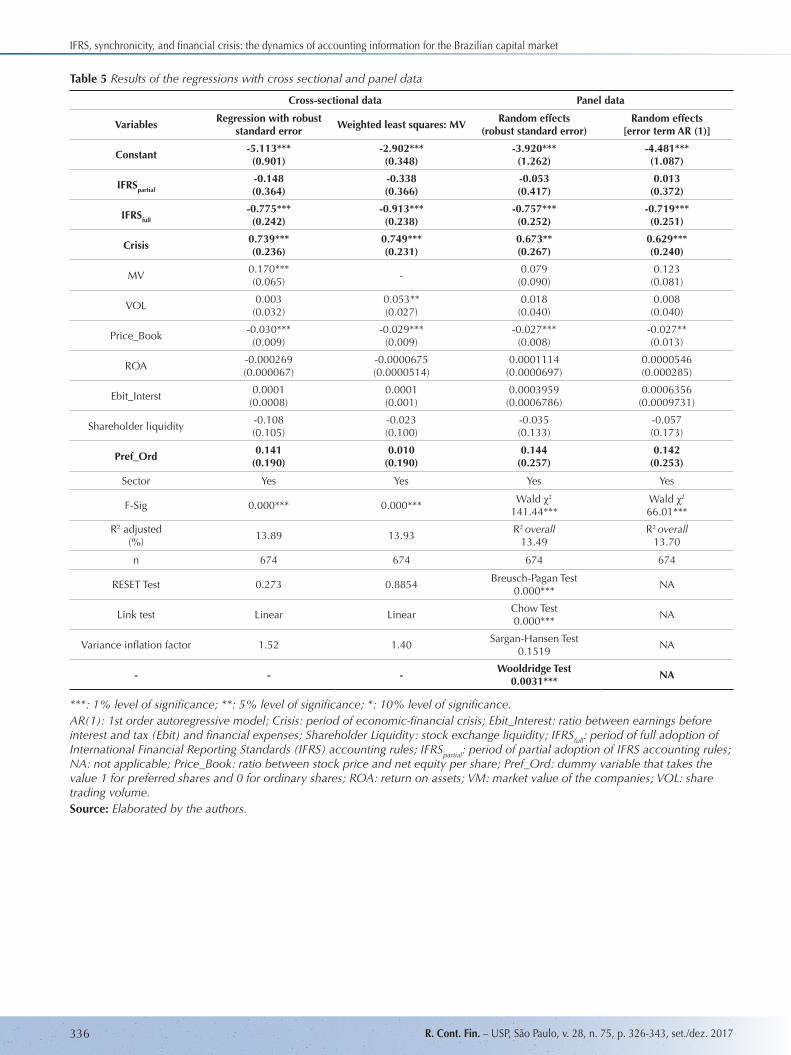
The results for the linear regression analyses are presented in Table 5.
IFRS, synchronicity, and financial crisis: the dynamics of accounting information for the Brazilian capital market
R. Cont. Fin. – USP, São Paulo, v. 28, n. 75, p. 326-343, set./dez. 2017336
Table 5 Results of the regressions with cross sectional and panel data
Cross-sectional data Panel data
VariablesRegression with robust
standard errorWeighted least squares: MV
Random effects(robust standard error)
Random effects[error term AR (1)]
Constant-5.113***(0.901)
-2.902***(0.348)
-3.920***(1.262)
-4.481***(1.087)
IFRSpartial
-0.148(0.364)
-0.338(0.366)
-0.053(0.417)
0.013(0.372)
IFRSfull
-0.775***(0.242)
-0.913***(0.238)
-0.757***(0.252)
-0.719***(0.251)
Crisis0.739***(0.236)
0.749***(0.231)
0.673**(0.267)
0.629***(0.240)
MV0.170***(0.065)
-0.079(0.090)
0.123(0.081)
VOL0.003(0.032)
0.053**(0.027)
0.018(0.040)
0.008(0.040)
Price_Book-0.030***(0.009)
-0.029***(0.009)
-0.027***(0.008)
-0.027**(0.013)
ROA-0.000269(0.000067)
-0.0000675(0.0000514)
0.0001114(0.0000697)
0.0000546(0.000285)
Ebit_Interst0.0001(0.0008)
0.0001(0.001)
0.0003959(0.0006786)
0.0006356(0.0009731)
Shareholder liquidity-0.108(0.105)
-0.023(0.100)
-0.035(0.133)
-0.057(0.173)
Pref_Ord0.141
(0.190)0.010
(0.190)0.144
(0.257)0.142
(0.253)
Sector Yes Yes Yes Yes
F-Sig 0.000*** 0.000***Wald χ2
141.44***Wald χ2
66.01***
R2 adjusted(%)
13.89 13.93R2 overall
13.49R2 overall
13.70
n 674 674 674 674
RESET Test 0.273 0.8854Breusch-Pagan Test
0.000***NA
Link test Linear LinearChow Test0.000***
NA
Variance inflation factor 1.52 1.40Sargan-Hansen Test
0.1519NA
- - -Wooldridge Test
0.0031***NA
***: 1% level of significance; **: 5% level of significance; *: 10% level of significance.AR(1): 1st order autoregressive model; Crisis: period of economic-financial crisis; Ebit_Interest: ratio between earnings before interest and tax (Ebit) and financial expenses; Shareholder Liquidity: stock exchange liquidity; IFRSfull: period of full adoption of International Financial Reporting Standards (IFRS) accounting rules; IFRSpartial: period of partial adoption of IFRS accounting rules; NA: not applicable; Price_Book: ratio between stock price and net equity per share; Pref_Ord: dummy variable that takes the value 1 for preferred shares and 0 for ordinary shares; ROA: return on assets; VM: market value of the companies; VOL: share trading volume. Source: Elaborated by the authors.
Bruno Figlioli, Sirlei Lemes & Fabiano Guasti Lima
R. Cont. Fin. – USP, São Paulo, v. 28, n. 75, p. 326-343, set./dez. 2017 337
The linear regression models with cross-sectional data (model with standard errors robust against heteroskedasticty of the data and model with variables weighted by the market value of the companies) presented statistical significance for the F test, indicating the adequacy of the models. The RESET test did not show problems with the functional form of the models and the Link test identified only linear patterns.
The results presented in Table 5 indicate that the sign of the coefficient for the IFRSpartial variable for the two linear regression models are negative. However they were not statistically significant. With regards to the coefficient of the IFRSfull variable, this presented a negative sign and 1% statistical significance, indicating a reduction in the synchronicity levels of the shares listed on the BM&FBOVESPA in the period of full adoption of IFRS. It was also identified that the coefficient related to the periods of financial crisis presented a positive sign and 1% statistical significance.
The panel data linear regressions were separated into two models. The first used random effects with standard errors robust against heteroskedasticity of the data, based on the results found for the Breusch-Pagan, Chow, and Sargan-Hansen tests. To mitigate possible problems of autocorrection of the data indicated by the Wooldridge
test, the 1st order autoregressive model was used. This second model also used random effects.
The results presented in Table 5 are very close to those found in the cross-sectional data analysis. The coefficient of the IFRSpartial variable was not statistically significant. The coefficients of the IFRSfull and Crisis variables presented negative and positive signs, respectively, and were also statistically significant. Therefore, for this analysis, there were indications of a reduction in synchronicity levels only in the period of full adoption of IFRS, while in periods of financial crisis there were indications of an increase in share synchronicity.
In relation to the control variables, only the Price_Book variable was statistically significant in all of the econometric models (based on cross-sectional data and panel data). There were indications that synchronicity levels are lower for companies with growth potential in terms of creating current and future cash flow. One reasonable explanation for this effect is that for the companies with this characteristic (high price/net equity ratio), investors would have incentives for using company-specific information to access the quality of company investments.
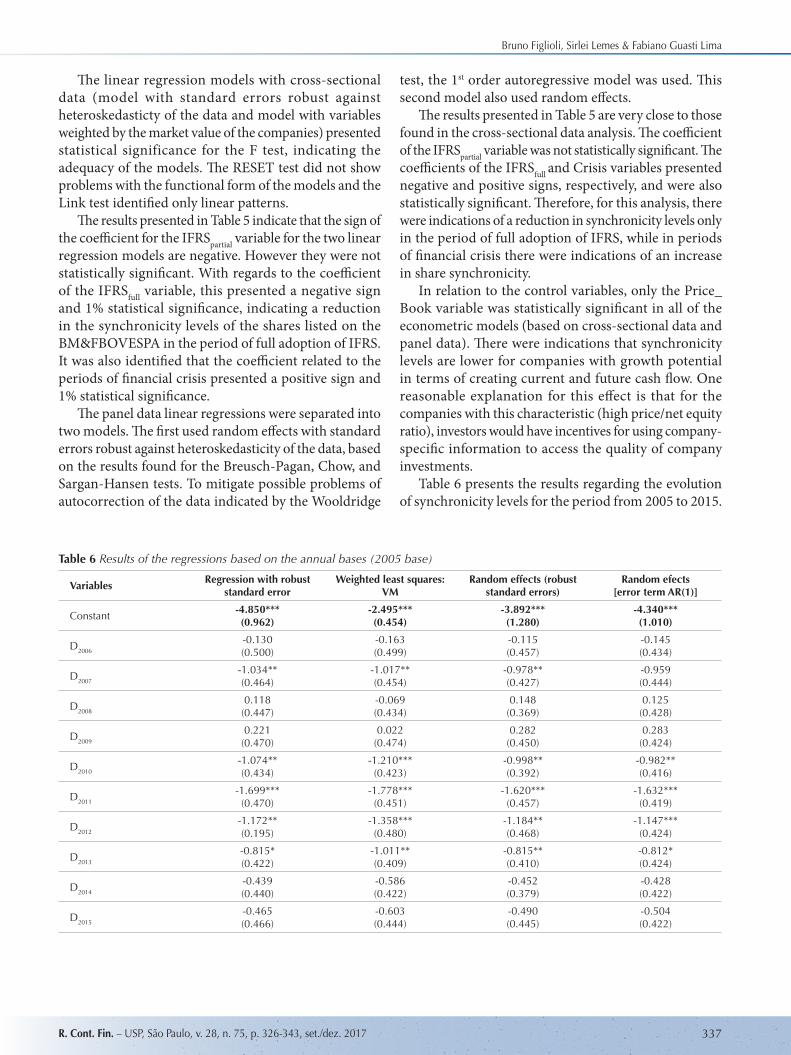
Table 6 presents the results regarding the evolution of synchronicity levels for the period from 2005 to 2015.
Table 6 Results of the regressions based on the annual bases (2005 base)
VariablesRegression with robust
standard errorWeighted least squares:
VMRandom effects (robust
standard errors)Random efects
[error term AR(1)]
Constant-4.850***(0.962)
-2.495***(0.454)
-3.892***(1.280)
-4.340***(1.010)
D2006
-0.130(0.500)
-0.163(0.499)
-0.115(0.457)
-0.145(0.434)
D2007
-1.034**(0.464)
-1.017**(0.454)
-0.978**(0.427)
-0.959(0.444)
D2008
0.118(0.447)
-0.069(0.434)
0.148(0.369)
0.125(0.428)
D2009
0.221(0.470)
0.022(0.474)
0.282(0.450)
0.283(0.424)
D2010
-1.074**(0.434)
-1.210***(0.423)
-0.998**(0.392)
-0.982**(0.416)
D2011
-1.699***(0.470)
-1.778***(0.451)
-1.620***(0.457)
-1.632***(0.419)
D2012
-1.172**(0.195)
-1.358***(0.480)
-1.184**(0.468)
-1.147***(0.424)
D2013
-0.815*(0.422)
-1.011**(0.409)
-0.815**(0.410)
-0.812*(0.424)
D2014
-0.439(0.440)
-0.586(0.422)
-0.452(0.379)
-0.428(0.422)
D2015
-0.465(0.466)
-0.603(0.444)
-0.490(0.445)
-0.504(0.422)
IFRS, synchronicity, and financial crisis: the dynamics of accounting information for the Brazilian capital market
R. Cont. Fin. – USP, São Paulo, v. 28, n. 75, p. 326-343, set./dez. 2017338
VM0.181***(0.065)
-0.104***(0.091)
0.141*(0.081)
VOL0.003(0.032)
0.055**(0.027)
0.017(0.039)
0.009(0.040)
Price_Book-0.029***(0.009)
-0.028***(0.009)
-0.026***(0.008)
-0.026**(0.013)
ROA-0.0000284(0.0000692)
-0.000071(0.0000545)
0.0000953(0.0000747)
0.0000498(0.0002846)
Ebit_Interst2.16e-06
(0.0009011)7.06e-06
(0.001003)0.0002613(0.0007102)
0.0005208(0.0009816)
Shareholder liquidity-0.129(0.108)
-0.037(0.104)
-0.082(0.132)
-0.0916(0.174)
Pref_Ord0.144
(0.190)0.009
(0.190)0.143
(0.257)0.144
(0.253)
Sector Yes Yes Yes Yes
F-Sig 0.000*** 0.000***Wald χ2
167.57***Wald χ2
78.38***
R2 ajusted(%)
15.40 15.24R2 overall
15.12R2 overall
15.25
N 674 674 674 674RESET test 0.6528 0.9235 - -Link test Linear Linear - -Variance inflation factor 1.74 1.68 - -Breusch-Pagan Test - - 0.000*** -Chow Test - - 0.000*** -Sargan-Hansen Test - - 0.0614 -Wooldridge Test - - 0.0044*** -
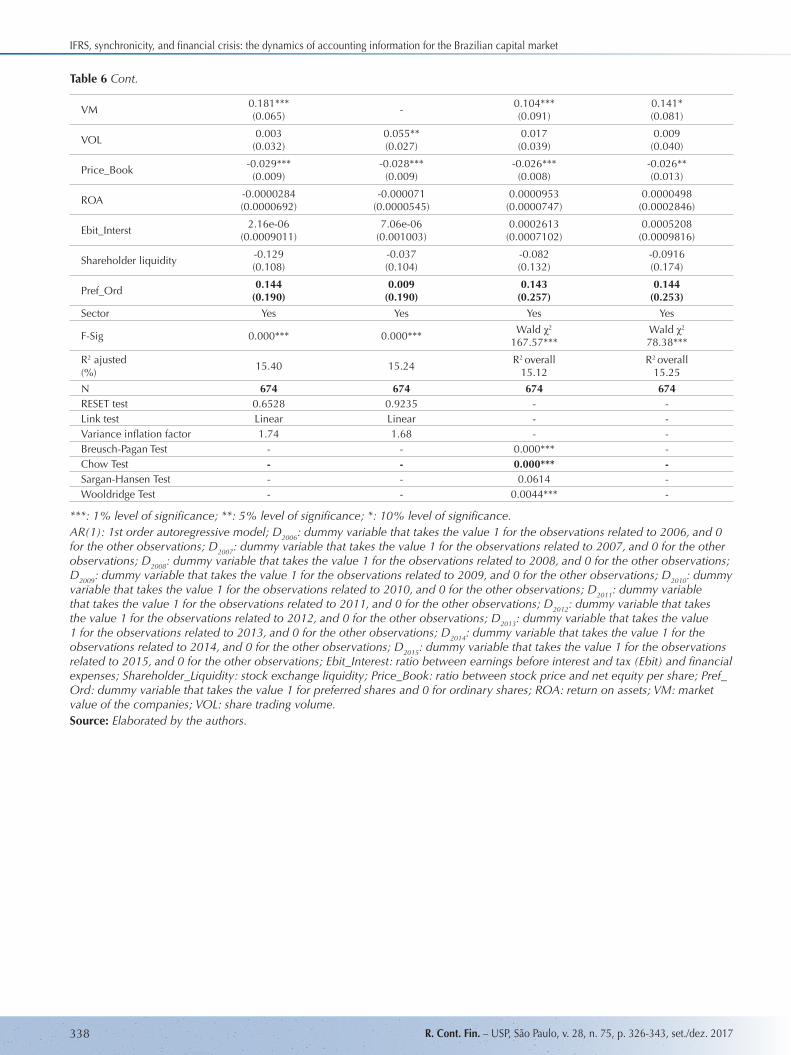
***: 1% level of significance; **: 5% level of significance; *: 10% level of significance.AR(1): 1st order autoregressive model; D2006: dummy variable that takes the value 1 for the observations related to 2006, and 0 for the other observations; D2007: dummy variable that takes the value 1 for the observations related to 2007, and 0 for the other observations; D2008: dummy variable that takes the value 1 for the observations related to 2008, and 0 for the other observations; D2009: dummy variable that takes the value 1 for the observations related to 2009, and 0 for the other observations; D2010: dummy variable that takes the value 1 for the observations related to 2010, and 0 for the other observations; D2011: dummy variable that takes the value 1 for the observations related to 2011, and 0 for the other observations; D2012: dummy variable that takes the value 1 for the observations related to 2012, and 0 for the other observations; D2013: dummy variable that takes the value 1 for the observations related to 2013, and 0 for the other observations; D2014: dummy variable that takes the value 1 for the observations related to 2014, and 0 for the other observations; D2015: dummy variable that takes the value 1 for the observations related to 2015, and 0 for the other observations; Ebit_Interest: ratio between earnings before interest and tax (Ebit) and financial expenses; Shareholder_Liquidity: stock exchange liquidity; Price_Book: ratio between stock price and net equity per share; Pref_Ord: dummy variable that takes the value 1 for preferred shares and 0 for ordinary shares; ROA: return on assets; VM: market value of the companies; VOL: share trading volume. Source: Elaborated by the authors.
Table 6 Cont.
Bruno Figlioli, Sirlei Lemes & Fabiano Guasti Lima
R. Cont. Fin. – USP, São Paulo, v. 28, n. 75, p. 326-343, set./dez. 2017 339
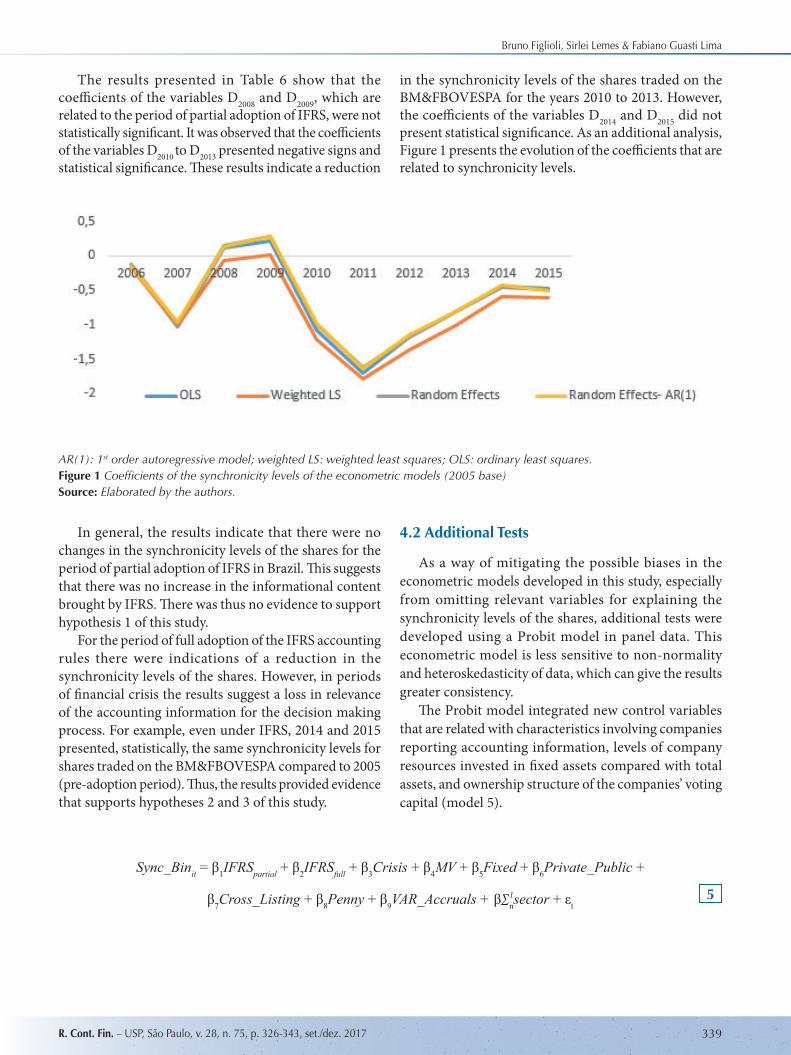
The results presented in Table 6 show that the coefficients of the variables D2008 and D2009, which are related to the period of partial adoption of IFRS, were not statistically significant. It was observed that the coefficients of the variables D2010 to D2013 presented negative signs and statistical significance. These results indicate a reduction
in the synchronicity levels of the shares traded on the BM&FBOVESPA for the years 2010 to 2013. However, the coefficients of the variables D2014 and D2015 did not present statistical significance. As an additional analysis, Figure 1 presents the evolution of the coefficients that are related to synchronicity levels.
In general, the results indicate that there were no changes in the synchronicity levels of the shares for the period of partial adoption of IFRS in Brazil. This suggests that there was no increase in the informational content brought by IFRS. There was thus no evidence to support hypothesis 1 of this study.
For the period of full adoption of the IFRS accounting rules there were indications of a reduction in the synchronicity levels of the shares. However, in periods of financial crisis the results suggest a loss in relevance of the accounting information for the decision making process. For example, even under IFRS, 2014 and 2015 presented, statistically, the same synchronicity levels for shares traded on the BM&FBOVESPA compared to 2005 (pre-adoption period). Thus, the results provided evidence that supports hypotheses 2 and 3 of this study.
4.2 Additional Tests
As a way of mitigating the possible biases in the econometric models developed in this study, especially from omitting relevant variables for explaining the synchronicity levels of the shares, additional tests were developed using a Probit model in panel data. This econometric model is less sensitive to non-normality and heteroskedasticity of data, which can give the results greater consistency.
The Probit model integrated new control variables that are related with characteristics involving companies reporting accounting information, levels of company resources invested in fixed assets compared with total assets, and ownership structure of the companies’ voting capital (model 5).
AR(1): 1st order autoregressive model; weighted LS: weighted least squares; OLS: ordinary least squares.Figure 1 Coefficients of the synchronicity levels of the econometric models (2005 base)Source: Elaborated by the authors.
Sync_Binit = β1IFRSpartial + β2IFRSfull + β3Crisis + β4MV + β5Fixed + β6Private_Public +
β7Cross_Listing + β8Penny + β9VAR_Accruals + β∑nsector + εt 51
IFRS, synchronicity, and financial crisis: the dynamics of accounting information for the Brazilian capital market
R. Cont. Fin. – USP, São Paulo, v. 28, n. 75, p. 326-343, set./dez. 2017340
Table 7 Probit Model in panel data
Variables Expected sign for the coefficients Coefficients Standard Error
IFRSpartial + -0.589 0.368
IFRSfull - -0.843*** 0.256
Crisis + 0.883*** 0.240MV + -0.008 0.080Fixed - -1.236* 0.633Private_Public - -0.006 0.537Cross_Listing - -0.384*** 0.138Penny + 0.5354 0.568VAR_Accruals + 2.026 3.205
Sector Yes -n 674 -
Wald χ2 37.57*** -
*** 1% level of significance; ** 5% level of significance; *10% level of significance.Crisis: period of economic-financial crisis; Cross_Listing: dummy variable that takes the value 1 for companies that trade shares on the US market via American Depositary Receipts (ADRs), and 0 for the other observations; IFRSfull: period of full adoption of the International Financial Reporting Standards (IFRS) accounting rules; IFRSpartial: period of partial adoption of the IFRS accounting rules; Fixed: variable representative of the percentage share of fixed assets in relation to total assets; Penny: dummy variable that takes the value 1 for shares that on an yearly average were listed on the spot market of the BM&FBOVESPA for a value equal to or less than R$ 1.00, and 0 for the other observations; Private_Public: dummy variable that takes the value 1 for the companies that have their voting capital controlled by some private initiative, and 0 for the companies that have their voting capital controlled by the public sector; VAR_Accruals: variable representative of the standard deviation in accruals; MV: market value of the companies’ net equity.Source: Elaborated by the authors.
in which: Sync_Binit: dummy variable representative of the synchronicity level of share i for period t, takes the value of 1 for the observations that present values higher than the median for the synchronicity levels of share i for the period from 2005 to 2015, and 0 for the other observations; IFRSpartial: dummy variable that takes the value 1 for the observations related to 2008 and 2009, and 0 for the other observation; IFRSfull: dummy variable that takes the value 1 for the observations from 2010 onwards, and 0 for the other observations; Crisis: dummy variables that takes the value 1 for the observations related to 2008, 2009, 2014, and 2015, and 0 for the other observations; MV: market value of the companies’ net equity, for this variable the logarithmic scale was used; Fixed: variable representative of the percentage share of fixed assets in relation to total assets; Private_Public: dummy variable that takes the value 1 for companies with voting capital controlled by some private initiative, and 0 for companies with voting capital controlled by the public sector; Cross_Listing: dummy variable that takes the value 1 for companies that trade shares on the US market via American Depositary Receipts (ADRs), and 0 for the other observations; Penny: dummy variable that takes the value 1 for shares that on an yearly average were listed on the BM&FBOVESPA spot market for a value equal to or lower than R$1.00, and 0 for the other observations; VAR_Accruals: variable representative of the standard deviation in accruals, for the accruals calculation the companies’ balance sheet accounts
were used: variation in current assets (∆CA), variation in available cash (∆cash), variation in current liabilities (∆CL), variation in short term loans and financing (∆LF), variation in tax payable (∆Tax) and depreciation expenses (DE). The expression for the accruals calculation was defined as: (∆CA-∆Cash) – (∆CL-∆LF-∆Tax) – DE. All of the variables were scaled by average annual total assets. To calculate the standard deviation in the accruals, three company annual accounting statement publications were considered (t-2, t-1, and t); Sector: economic activity sector of the companies; εt: error term.
The synchronicity levels of the shares in model 5 were controlled for company size, as recommended by Piotroski and Roulstone (2004). For this, the MV variable was used (market value of the net equity of the companies). The purpose of the Fixed variable was to control the results for the metric related to the investment structure of company resource in tangible and intangible assets (Brown & Kimbrough, 2011). Inclusion of the Cross_Listing and Private_Public variables aimed to control the results for corporate governance mechanisms with regards to the companies’ reporting of accounting information (Li, Brockman & Zurbruegg, 2015). The Penny variable considered the liquidity risk associated with investments in low value shares (Chiang & Zheng, 2015), and finally, the VAR_Accruals variable controlled the results for the possible effect of earnings management on the synchronicity levels of the shares (Kim & Shi, 2012).
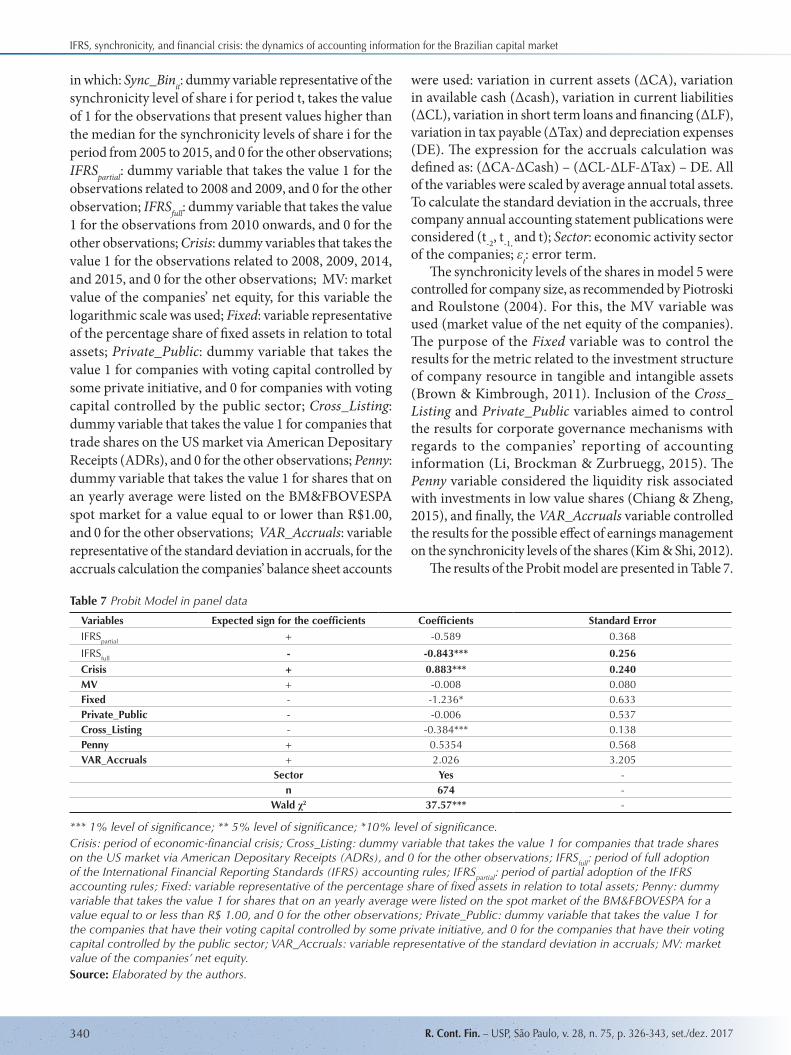
The results of the Probit model are presented in Table 7.
Bruno Figlioli, Sirlei Lemes & Fabiano Guasti Lima
R. Cont. Fin. – USP, São Paulo, v. 28, n. 75, p. 326-343, set./dez. 2017 341
The results presented in Table 7 support the idea that the synchronicity levels of the shares analyzed are statistically lower after the adoption of IFRS in Brazil, compared with the period prior to this accounting standardization. The coefficient of the IFRSfull variable presented a negative sign and 1% statistical significance. The results were not significant for the IFRSpartial variable.
For the Crisis variable, its coefficient presented a positive sign and 1% statistical significance. The results obtained from the Probit model for the Crisis variable suggest a higher probability of increased synchronicity levels for the shares in periods of greater financial market turbulence.
In relation to the control variables, it was verified that only the Fixed and Cross_Listing variables presented statistical significance. For the Fixed variable, its coefficient was only marginally significant, to a level of 10%, indicating a negative association between the synchronicity levels of the shares and the share of tangible assets in relation to total assets of the companies analyzed. The Cross_Listing variable presented a statistically significant coefficient to a level of 1%, which may signal that the quantity and quality of accounting information required to trade ADRs in the US market may provide the conditions for share prices to more consistently reflect relevant accounting information.
5. FINAL REMARKS
IFRS adoption has been one of the key accounting regulation milestones in Brazil. Brazilian accounting standardization was not historically focused on meeting investor demands for information and existed in a context that can be characterized by low legal and institutional enforcement. In these circumstances, the adoption of international accounting standards may not reflect possible economic consequences such as lower synchronicity levels of shares traded on the stock exchange.
For the period of partial adoption of IFRS, no significant changes in the synchronicity levels of the shares were found. It can thus be inferred that this was a critical period in the accounting convergence process. Some factors may contribute to this: the different levels of company compliance in meeting the accounting standardization, questions of shareholder and market analyst experience in analyzing the accounting information derived from IFRS, and the chronogram by which the different standards were required of the companies, among others.
The results obtained by this study indicated a reduction in synchronicity levels for the shares listed on the BM&FBOVESPA only for the period of partial adoption of IFRS. This result therefore supports the hypothesis that IFRS is more relevant for the investor decision making process in comparison with previous accounting standards. The supposed increase in accounting information transparency derived from IFRS,
and consequent reduction in informational asymmetry between managers and current and potential shareholders, could be a plausible explanation for the synchronicity levels verified in the Brazilian capital market.
However, for periods of financial crisis, the results indicated that accounting information loses relevance, even information derived from IFRS. Thus, the possible surprises derived from the accounting information would not be reflected in the share prices; in these periods these prices would reflect aspects of investor behavior.
Another important point in this paper was the consideration of information on shares listed on the Brazilian stock exchange only. This research design aimed to control the results for aspects of the regulatory environment in Brazil, since all of the companies in the sample operate within this environment. Including information on companies and shares in other countries in the sample, with possible differences in regulatory environments, may on one hand increase the generalization of the results, but on the other hand it can lead to unsuitable inferences.
For future studies, we suggest an investigation of the characteristics of recognition, measurement, and reporting of accounting information under the IFRS rules and their relationships with the synchronicity levels of shares.
REFERENCES
Ali, A., & Hwang, L. (2000). Country-specific factors related to financial reporting and the value relevance of accounting data. Journal of Accounting Research, 38(1), 1-25.
Ball, R., Kothari, S. P., & Robin, A. (2000). The effect of international institutional factors on properties of accounting earnings. Journal of Accounting and Economics, 29, 1-51.
IFRS, synchronicity, and financial crisis: the dynamics of accounting information for the Brazilian capital market
R. Cont. Fin. – USP, São Paulo, v. 28, n. 75, p. 326-343, set./dez. 2017342
Barth, M. E., Landsman, W. R., & Lang, M. H. (2008). International accounting standards and accounting quality. Journal of Accounting Research, 46(3), 467-498.
Boubaker, S., Mansali, H., & Rjiba, H. (2014). Large controlling shareholders and stock price synchronicity. Journal of Banking & Finance, 40, 80-96.
Brown, N. C., & Kimbrough, M. D. (2011). Intangible investment and the importance of firm-specific factors in the determination of earnings. Review of Accounting Studies, 16, 559-573.
Bruggemann, U., Hitz, J. M., & Sellhorn, T. (2013). Intended and unintended consequences of mandatory IFRS adoption: a review of extant evidence and suggestions for future research. European Accounting Review, 22, 1-37.
Chan, K., & Hameed, A. (2006). Stock price synchronicity and analyst coverage in emerging markets. Journal of Financial Economics, 80, 115-147.
Chiang, T. C., & Zheng, D. (2015). Liquidity and stock returns: evidence from international markets. Global Finance Journal, 27, 73-97.
Christensen, H. B., Hail, L., & Leuz, C. (2013). Mandatory IFRS reporting and changes in enforcement. Journal of Accounting and Economics, 56, 147-177.
Christensen, H. B., Lee, E., & Walker, M. (2007). Cross-sectional variation in the economic consequences of international accounting harmonization: the case of mandatory IFRS adoption in the UK. The International Journal of Accounting, 42, 341-379.
Dasgupta, S., Gan, J., & Gao, N. (2010). Transparency, price informativeness, and stock return synchronicity: theory and evidence. Journal of Financial and Quantitative Analysis, 45(5), 1189-1220.
Daske, H., Hail, L., Leuz, C., & Verdi, R. S. (2008). Mandatory IFRS reporting around the world: early evidence on the economic consequences. Journal of Accounting Research, 46(5), 1085-1142.
Daske, H., Hail, L., Leuz, C., & Verdi, R. S. (2013). Adopting a label: heterogeneity in the economic consequences around IAS/IFRS adoptions. Journal of Accounting Research, 51(3), 495-547.
De Long, J. B., Shleifer, A., Summers, L. H., & Waldman, R. J. (1990). Noise trader risk in financial markets. Journal of Political Economy, 98(4), 703-738.
Deloitte Global Services (2016). Use of IFRS by jurisdiction. Retrieved from http://www.iasplus.com/en/jurisdictions
Ghio, A., & Verona, R. (2015). Accounting harmonization in the BRIC countries: a common path? Accounting Forum, 39, 121-139.
Glaum, M., Baetge, J., Grothe, A., & Oberdorster, T. (2013a). Introduction of international accounting Sstandards, disclosure quality, and accuracy of analysts’ earnings forecasts. European Accounting Review, 22(1), 79-116.
Glaum, M., Schmidt, P., Street, D. L., & Vogel, S. (2013b). Compliance with IFRS 3 and IAS 36 required disclosures across 17 European countries: company and country-level determinants. Accounting and Business Research, 43(3), 163-204.
Gujarati, D. (2006). Econometria básica (Monteiro, M. J. C., Trad.) (Ed. rev.) (4a. ed.). Rio de Janeiro, RJ: Elsevier (2003).
Gul, F. A., Kim, J. B., & Qiu, A. A. (2010). Ownership concentration, foreign shareholding, audit quality, and stock price synchronicity: evidence from China. Journal of Financial Economics, 95, 425-442.
Hamberg, M., Mavruk, T., & Sjogren, S. (2013). Investment allocation decisions, home bias, and the mandatory IFRS adoption. Journal of International Money and Finance, 36, 107-130.
Houqe, M. N., & Monem, R. M. (2016). IFRS adoption, extent of disclosure, and perceived corruption: a cross-country study. The International Journal of Accounting, 51(3), 363-378.
Hutton, A. P., Marcus, A. J., & Tehranian, H. (2009). Opaque financial reports, R2, and crash risk. Journal of Financial Economics, 94, 67-86.
Instituto Brasileiro de Geografia e Estatística. (2016). Séries históricas e estatísticas. Retrieved from http://seriesestatisticas.ibge.gov.br/series.aspx?no=1&op=1&vcodigo=ST12&t=produto-interno-bruto-br-variacao-volumebrtaxa
Jin, L., & Myers, S. C. (2006). R2 around the world: new theory and new tests. Journal of Financial Economics, 79, 257-292.
Kim, J. B., & Shi, H. (2012). IFRS reporting, firm-specific information flows, and institutional environments: international evidence. Review of Accounting Studies, 17(3), 474-517.
Landsman, W. R., Maydew, E. L., & Thornock, J. R. (2012). The information content of annual earnings announcements and mandatory adoption of IFRS. Journal of Accounting and Economics, 53, 34-54.
Laux, C., & Leuz, C. (2009). The crisis of fair-value accounting: making sense of the recent debate. Accounting, Organizations and Society, 34, 826-834.
Li, S., Brockman, P., & Zurbruegg, R. (2015). Cross-listing, firm-specific information, and corporate governance: evidence from Chinese A-shares and H-shares. Journal of Corporate Finance, 32, 347-362.
Lopes, A. B. (2006). Financial accounting in Brazil: an empirical examination. Latin American Business Review, 6, 45-68.
Mala, R., & Chand, P. (2012). Effect of the global financial crisis on accounting convergence. Accounting & Finance, 52, 21-46.
Mensi, W., Hammoudeh, S., Reboredo, J. C., & Nguyen, D. K. (2014). Do global factors impact BRICs stock markets? A quantile regression approach. Emerging Markets Review, 19, 1-17.
Morck, R., Yeung, B., & Yu, W. (2000). The information content of stock markets: why do emerging markets have synchronous stock price movements? Journal of Financial Economics, 58, 215-260.
Nnadi, M., & Soobaroyen, T. (2015). International financial reporting standard and foreign direct investment: the case of Africa. Advances in Accounting, Incorporating Advances in International Accounting, 31, 228-238.
Pelucio-Grecco, M. C., Geron, C. M. S., Grecco, G. B., & Lima, J. P. C. (2014). The effect of IFRS on earnings management in Brazilian non-financial public companies. Emerging Markets Review, 21, 42-66.
Bruno Figlioli, Sirlei Lemes & Fabiano Guasti Lima
R. Cont. Fin. – USP, São Paulo, v. 28, n. 75, p. 326-343, set./dez. 2017 343
Piotroski, J. D., & Roulstone, D. (2004). The influence of analysts, institutional investors, and insiders on the incorporation of market, industry, and firm-specific information into stock prices. The Accounting Review, 79(4), 1119-1151.
Piotroski, J. D., Wong, T. J., & Zhang, T. (2015). Political incentives to suppress negative information: evidence from Chinese listed firms. Journal of Accounting Research, 53(2), 405-459.
Roll, R. (1988). R-squared. The Journal of Finance, 43, 541-566.
Silva, A. F., Weffort, E. F. J., Flores, E. S., & Silva, G. P. (2014).
Earnings management and economic crises in the Brazilian capital market. Revista de Administração de Empresas – RAE, 54(3), 268-283.
Tan, H., Wang, S., & Welker, M. (2011). Analyst following and forecast accuracy after mandated IFRS adoptions. Journal of Accounting Research, 49(5), 1307-1357.
Wang, J. W., & Yu, W. W. (2015). The information content of stock prices, legal environments and accounting standards: international evidence. European Accounting Review, 24(3), 471-493.
Address for correspondence
Bruno FiglioliUniversidade de São Paulo, Faculdade de Economia, Administração e Contabilidade de Ribeirão Preto, Departamento de ContabilidadeAvenida Bandeirantes, 3900, Bloco B2, Sala 42 – CEP: 14040-900Monte Alegre – Ribeirão Preto – SP – BrasilE-mail: [email protected]


![[Film Novità]Synchronicity (2015).avi AC3 BRRip ITA](https://img.pdfslide.tips/doc/110x75/61e00cf07ac57825457cfddf/film-novitsynchronicity-2015avi-ac3-brrip-ita.jpg)