Embed Size (px)
Citation preview
SUPPLEMENTARY INFORMATIONDOI: 10.1038/NPLANTS.2015.167
NATURE PLANTS | www.nature.com/natureplants 1
Impact of the plastidial stringent response in plant growth and stress
responses
Mikika Maekawa1, Rina Honoki1, Yuta Ihara1, Ryoichi Sato1, Akira Oikawa2,3, Yuri Kanno3,
Hiroyuki Ohta1,6, Mitsunori Seo3, Kazuki Saito3,4 & Shinji Masuda5,6,*
1Graduate School of Bioscience & Biotechnology, Tokyo Institute of Technology, Yokohama 226-8501, Japan 2Faculty of Agriculture, Yamagata University, Tsuruoka 997-8555, Japan 3RIKEN Center for Sustainable Resource Science, Yokohama 230-0045, Japan 4Graduate School of Pharmaceutical Sciences, Chiba University, Chiba 260-8675, Japan 5Center for Biological Resources & Informatics, Tokyo Institute of Technology, Yokohama 226-8501, Japan 6Earth-Life Science Institute, Tokyo Institute of Technology, Tokyo 152-8551, Japan *e-mail: [email protected] (S.M.).

2 NATURE PLANTS | www.nature.com/natureplants
SUPPLEMENTARY INFORMATION DOI: 10.1038/NPLANTS.2015.167
Supplementary Methods Transient expression of GFP fusion proteins. To construct GFP fusions of RSH2
and RSH3, full-length cDNAs of RSH2 and RSH3 were amplified from RT-PCR
products with gene-specific primers (Supplementary Table 2). The PCR products were
first cloned into the pDONRzeo vector using BP reactions (Invitrogen). The inserted
fragments were then cloned into pGWB5 (kindly provided by Dr. Nakagawa of Shimane
University) using LR reactions (Invitrogen). The obtained constructs were introduced
into Agrobacterium by electroporation. The Agrobacterium strains were grown in LB
medium until late-log phase and then collected by centrifugation at room temperature.
The harvested cells were suspended in ~15 ml of an infiltration buffer containing 10 mM
MES-KOH (pH 5.5), 10 mM MgSO4 and 2% (w/v) sucrose to an adjusted OD600 of ~0.7.
The suspensions were injected through pores into leaves of N. benthamiana using
syringes. Plants were incubated for 3 days under continuous light (40 µmol photons m-2
s-1) at 23°C. GFP or chlorophyll fluorescence was observed with a confocal laser
scanning microscopy (LSM780, ZEISS).
Starch Quantification. Shoot tissues were homogenized in 2 ml of 80% ethanol
followed by incubation at 80°C for 1 h. After centrifugation (15,000 × g, 10 min), the
supernatant and pellet were collected as glucose and starch fractions, respectively.
Distilled water (0.6 ml) was added to the pellet and mixed well. The mixture was
incubated at 95°C for 1 h, and then combined with the same volume of 35 U/ml
amyloglucosidase (Sigma-Aldrich). The mixture was incubated at 55°C for 1 h to
hydrolyze starch into glucose. The glucose concentration was determined using a
glucose assay kit (Glucose-CII-test Wako, Wako Pure Chemical Industries) according to
the manufacturer’s protocol.
Histology and electron microscopy. For electron microscopy, rosette leaves were
harvested from 28-day-old plants and fixed on ice with 0.1 M cacodylate buffer (pH 7.2)
containing 2.5% (w/v) glutaraldehyde and left overnight in the dark. The samples were
washed several times with the same buffer, and post-fixed with 1% osmium tetroxide
(w/v) for 2 h on ice. Then, the samples were dehydrated using a graded acetone series
and embedded in Spurr’s low-viscosity resin48. Thin sections were stained with uranyl
acetate and lead citrate, and observed under a JEOL 1200 EX transmission electron
NATURE PLANTS | www.nature.com/natureplants 3
SUPPLEMENTARY INFORMATIONDOI: 10.1038/NPLANTS.2015.167
microscope (JEOL). Transverse sections were also prepared from the resin, followed by
staining with Toluidine Blue and analysis using a Nikon ECLIPSE 80i microscope
(Nikon). Leaf length, width and area, as well as petiole size, were measured using
Image J software (http://www.rsb.info.nih.gov/ij). To visualize palisade cells, the seventh
leaf of each line grown for 21 days was fixed in a buffer containing 3.5%
paraformaldehyde, 5% acetic acid and 50% ethanol overnight, and then incubated with
a buffer composed of 80 g chloral hydrate, 30 ml water and 10 ml glycerol. The cleared
leaves were photographed using a confocal microscope (TCS SE; Leica).
Lipid analysis. The fatty acid composition of shoots from plants grown for 28 days was
measured using gas chromatographic analysis after the combined digestion and fatty
acid methyl ester formation of lipids using a reported method49. Lipids were extracted
from vegetative shoots of 28-day-old plants as described50. The extracts were applied to
silica gel 60A plates (Merck) and analyzed using 2D-TLC with chloroform/methanol/7N
NH4 (15:10:1), followed by chloroform/methanol/acetic acid/water (170:20:15:3). Lipids
were visualized by spraying 60% acetone containing 0.01% (w/v) primulin under UV
light. The lipids were identified by co-chromatography with commercial standards
(Sigma-Aldrich), and their fatty acid content was determined using gas chromatographic
analysis. To allow quantification, the lipid extracts were spiked with pentadecanoic acid
(15:0), and the absolute quantity of each lipid class was calculated based on the final
recovery of 15:0. Fatty acids were extracted from vegetative shoots of 28-day-old plants,
followed by quantification using gas chromatography. 15:0 was used as the control.
Supplementary references
49. Browse, J., McCourt, P.J. & Somerville, C.R. Fatty acid composition of leaf lipids
determined after combined digestion and fatty acid methyl ester formation from fresh
tissue. Anal. Biochem. 152, 141-145 (1986).
50. Dörmann, P., Hoffmann-Benning, S., Balbo, I. & Benning, C. Isolation and
characterization of an Arabidopsis mutant deficient in the thylakoid lipid digalactosyl
diacylglycerol. Plant Cell 7, 1801-1810 (1995).
4 NATURE PLANTS | www.nature.com/natureplants
SUPPLEMENTARY INFORMATION DOI: 10.1038/NPLANTS.2015.167
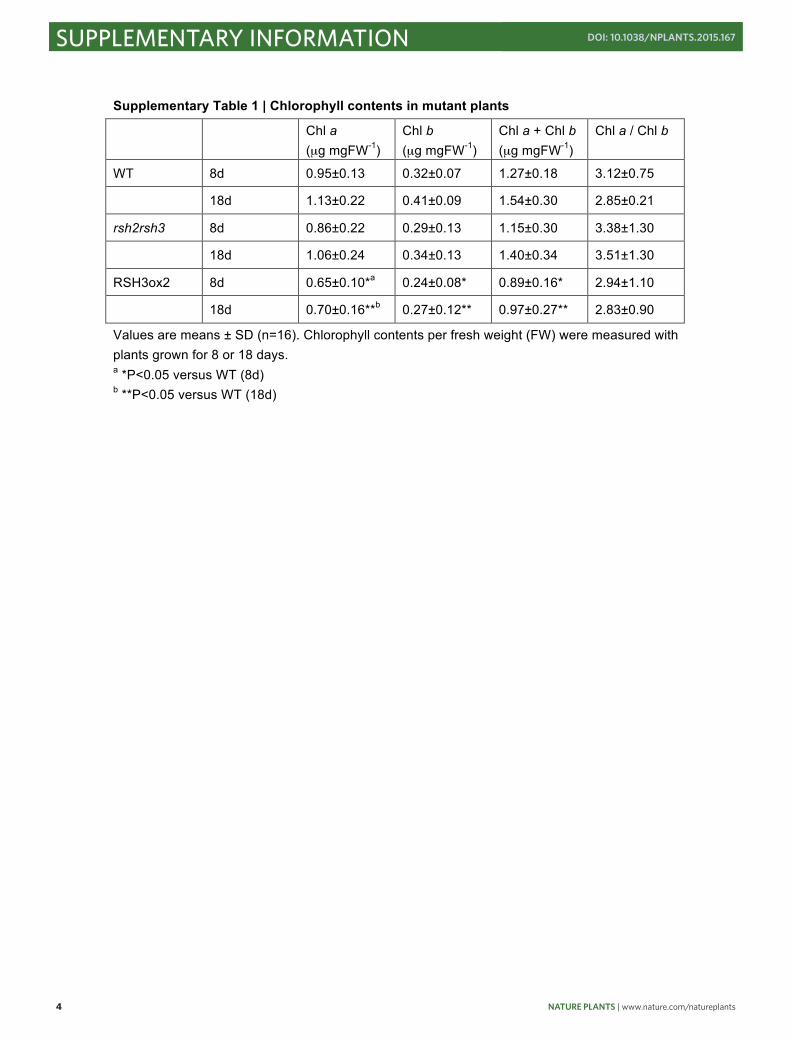
Supplementary Table 1 | Chlorophyll contents in mutant plants
Chl a (µg mgFW-1)
Chl b (µg mgFW-1)
Chl a + Chl b (µg mgFW-1)
Chl a / Chl b
WT 8d 0.95±0.13 0.32±0.07 1.27±0.18 3.12±0.75
18d 1.13±0.22 0.41±0.09 1.54±0.30 2.85±0.21
rsh2rsh3 8d 0.86±0.22 0.29±0.13 1.15±0.30 3.38±1.30
18d 1.06±0.24 0.34±0.13 1.40±0.34 3.51±1.30
RSH3ox2 8d 0.65±0.10*a 0.24±0.08* 0.89±0.16* 2.94±1.10
18d 0.70±0.16**b 0.27±0.12** 0.97±0.27** 2.83±0.90
Values are means ± SD (n=16). Chlorophyll contents per fresh weight (FW) were measured with plants grown for 8 or 18 days. a *P<0.05 versus WT (8d) b **P<0.05 versus WT (18d)
NATURE PLANTS | www.nature.com/natureplants 5
SUPPLEMENTARY INFORMATIONDOI: 10.1038/NPLANTS.2015.167
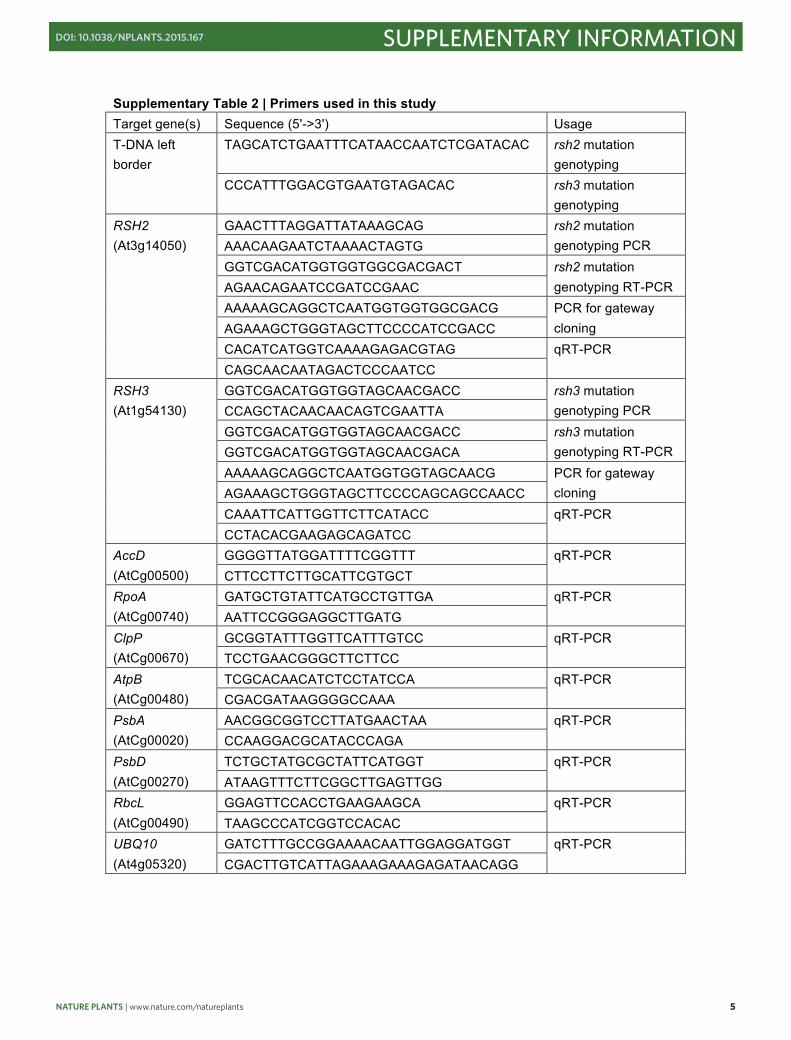
Supplementary Table 2 | Primers used in this study Target gene(s) Sequence (5'->3') Usage T-DNA left border
TAGCATCTGAATTTCATAACCAATCTCGATACAC rsh2 mutation genotyping
CCCATTTGGACGTGAATGTAGACAC rsh3 mutation genotyping
RSH2 (At3g14050)
GAACTTTAGGATTATAAAGCAG rsh2 mutation genotyping PCR AAACAAGAATCTAAAACTAGTG
GGTCGACATGGTGGTGGCGACGACT rsh2 mutation genotyping RT-PCR AGAACAGAATCCGATCCGAAC
AAAAAGCAGGCTCAATGGTGGTGGCGACG PCR for gateway cloning AGAAAGCTGGGTAGCTTCCCCATCCGACC
CACATCATGGTCAAAAGAGACGTAG qRT-PCR CAGCAACAATAGACTCCCAATCC
RSH3 (At1g54130)
GGTCGACATGGTGGTAGCAACGACC rsh3 mutation genotyping PCR CCAGCTACAACAACAGTCGAATTA
GGTCGACATGGTGGTAGCAACGACC rsh3 mutation genotyping RT-PCR GGTCGACATGGTGGTAGCAACGACA
AAAAAGCAGGCTCAATGGTGGTAGCAACG PCR for gateway cloning AGAAAGCTGGGTAGCTTCCCCAGCAGCCAACC
CAAATTCATTGGTTCTTCATACC qRT-PCR CCTACACGAAGAGCAGATCC
AccD (AtCg00500)
GGGGTTATGGATTTTCGGTTT qRT-PCR CTTCCTTCTTGCATTCGTGCT
RpoA (AtCg00740)
GATGCTGTATTCATGCCTGTTGA qRT-PCR AATTCCGGGAGGCTTGATG
ClpP (AtCg00670)
GCGGTATTTGGTTCATTTGTCC qRT-PCR TCCTGAACGGGCTTCTTCC
AtpB (AtCg00480)
TCGCACAACATCTCCTATCCA qRT-PCR CGACGATAAGGGGCCAAA
PsbA (AtCg00020)
AACGGCGGTCCTTATGAACTAA qRT-PCR CCAAGGACGCATACCCAGA
PsbD (AtCg00270)
TCTGCTATGCGCTATTCATGGT qRT-PCR ATAAGTTTCTTCGGCTTGAGTTGG
RbcL (AtCg00490)
GGAGTTCCACCTGAAGAAGCA qRT-PCR TAAGCCCATCGGTCCACAC
UBQ10 (At4g05320)
GATCTTTGCCGGAAAACAATTGGAGGATGGT qRT-PCR CGACTTGTCATTAGAAAGAAAGAGATAACAGG
6 NATURE PLANTS | www.nature.com/natureplants
SUPPLEMENTARY INFORMATION DOI: 10.1038/NPLANTS.2015.167
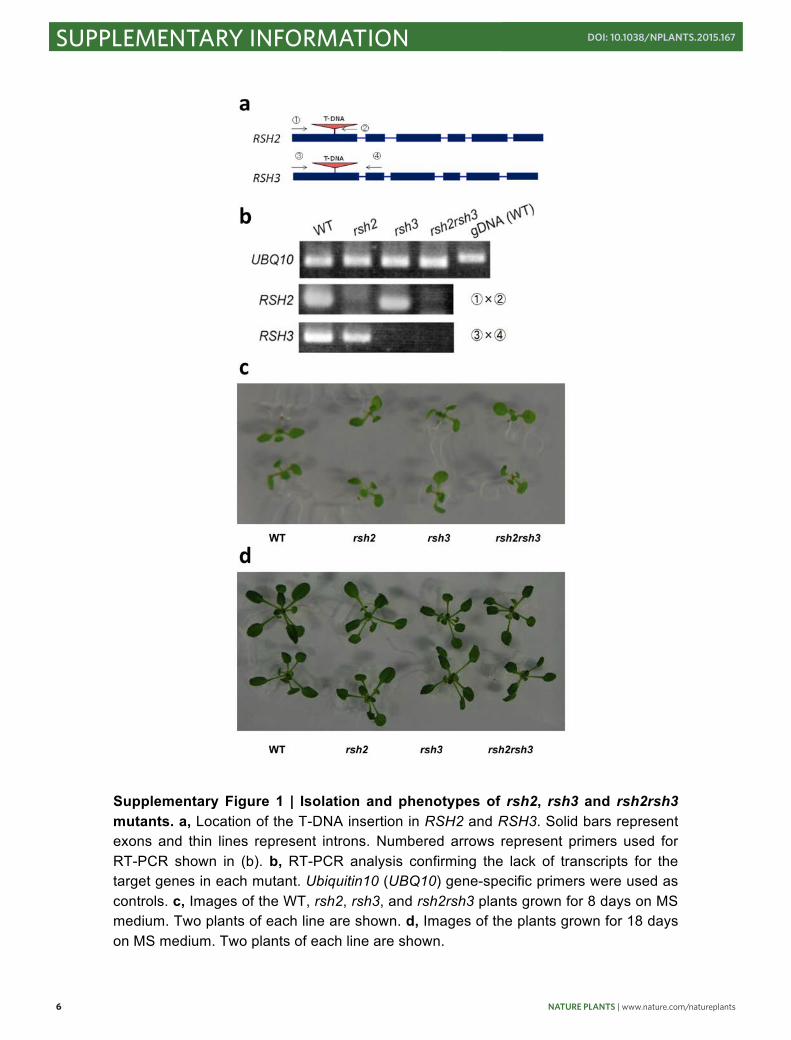
Supplementary Figure 1 | Isolation and phenotypes of rsh2, rsh3 and rsh2rsh3 mutants. a, Location of the T-DNA insertion in RSH2 and RSH3. Solid bars represent exons and thin lines represent introns. Numbered arrows represent primers used for RT-PCR shown in (b). b, RT-PCR analysis confirming the lack of transcripts for the target genes in each mutant. Ubiquitin10 (UBQ10) gene-specific primers were used as controls. c, Images of the WT, rsh2, rsh3, and rsh2rsh3 plants grown for 8 days on MS medium. Two plants of each line are shown. d, Images of the plants grown for 18 days on MS medium. Two plants of each line are shown.

NATURE PLANTS | www.nature.com/natureplants 7
SUPPLEMENTARY INFORMATIONDOI: 10.1038/NPLANTS.2015.167
Supplementary Figure 2 | ppGpp quantification of 21-day-old plants. ppGpp levels per fresh weight (FW) were quantified using LC-MS/MS. Values are means ± S.D. (n = 3). *P < 0.05.
8 NATURE PLANTS | www.nature.com/natureplants
SUPPLEMENTARY INFORMATION DOI: 10.1038/NPLANTS.2015.167
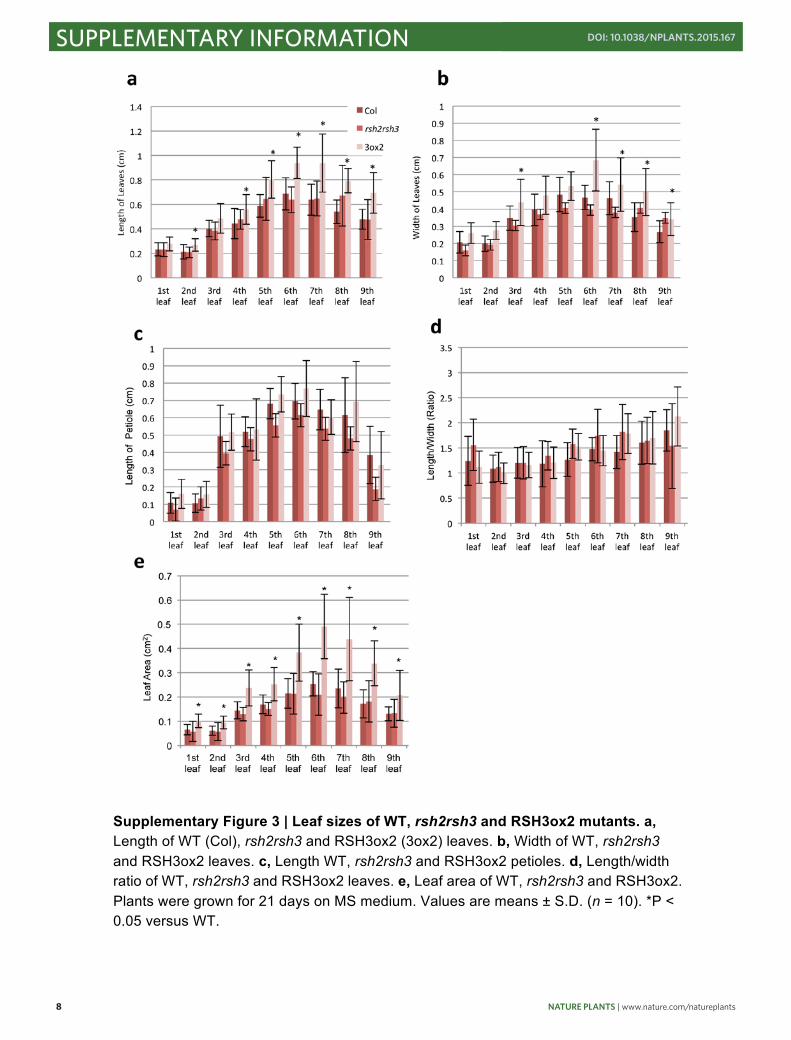
Supplementary Figure 3 | Leaf sizes of WT, rsh2rsh3 and RSH3ox2 mutants. a, Length of WT (Col), rsh2rsh3 and RSH3ox2 (3ox2) leaves. b, Width of WT, rsh2rsh3 and RSH3ox2 leaves. c, Length WT, rsh2rsh3 and RSH3ox2 petioles. d, Length/width ratio of WT, rsh2rsh3 and RSH3ox2 leaves. e, Leaf area of WT, rsh2rsh3 and RSH3ox2. Plants were grown for 21 days on MS medium. Values are means ± S.D. (n = 10). *P < 0.05 versus WT.
NATURE PLANTS | www.nature.com/natureplants 9
SUPPLEMENTARY INFORMATIONDOI: 10.1038/NPLANTS.2015.167
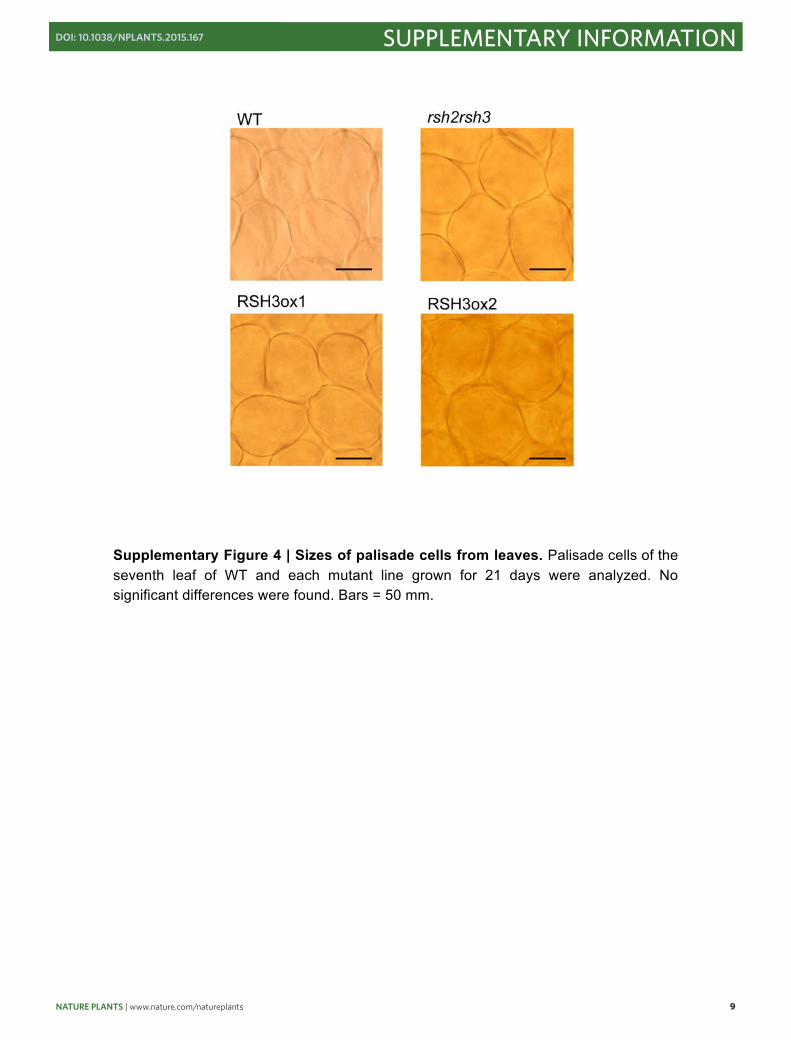
Supplementary Figure 4 | Sizes of palisade cells from leaves. Palisade cells of the seventh leaf of WT and each mutant line grown for 21 days were analyzed. No significant differences were found. Bars = 50 mm.
10 NATURE PLANTS | www.nature.com/natureplants
SUPPLEMENTARY INFORMATION DOI: 10.1038/NPLANTS.2015.167
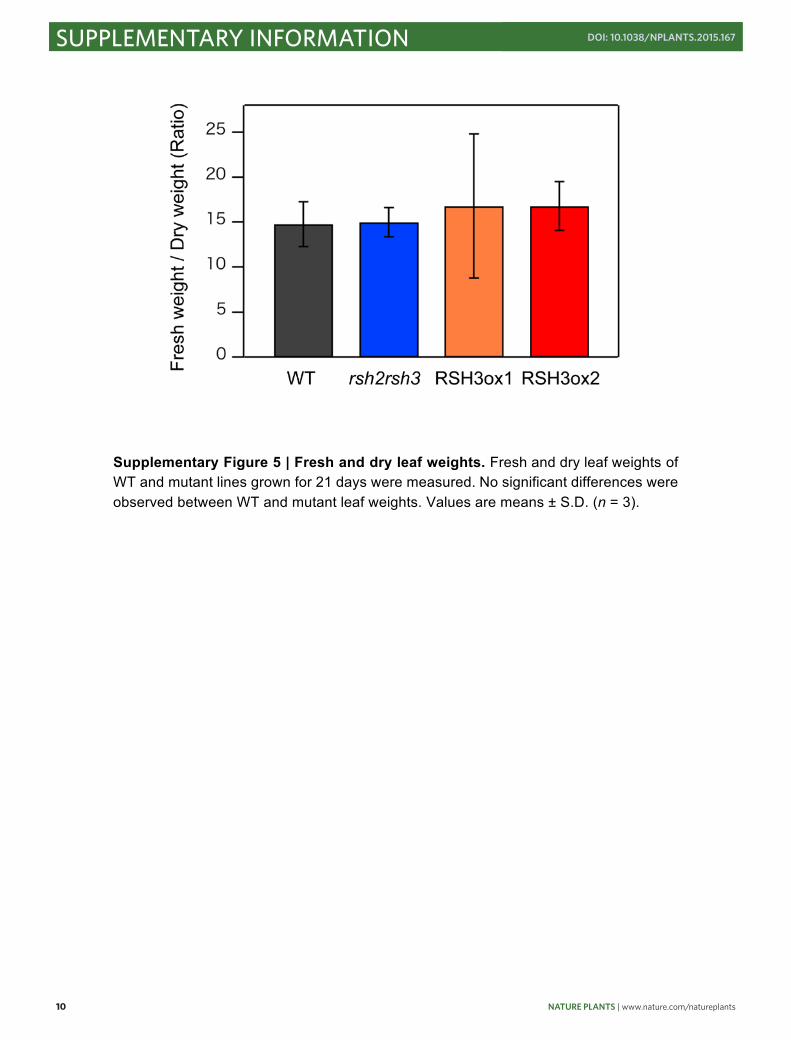
Supplementary Figure 5 | Fresh and dry leaf weights. Fresh and dry leaf weights of WT and mutant lines grown for 21 days were measured. No significant differences were observed between WT and mutant leaf weights. Values are means ± S.D. (n = 3).
NATURE PLANTS | www.nature.com/natureplants 11
SUPPLEMENTARY INFORMATIONDOI: 10.1038/NPLANTS.2015.167
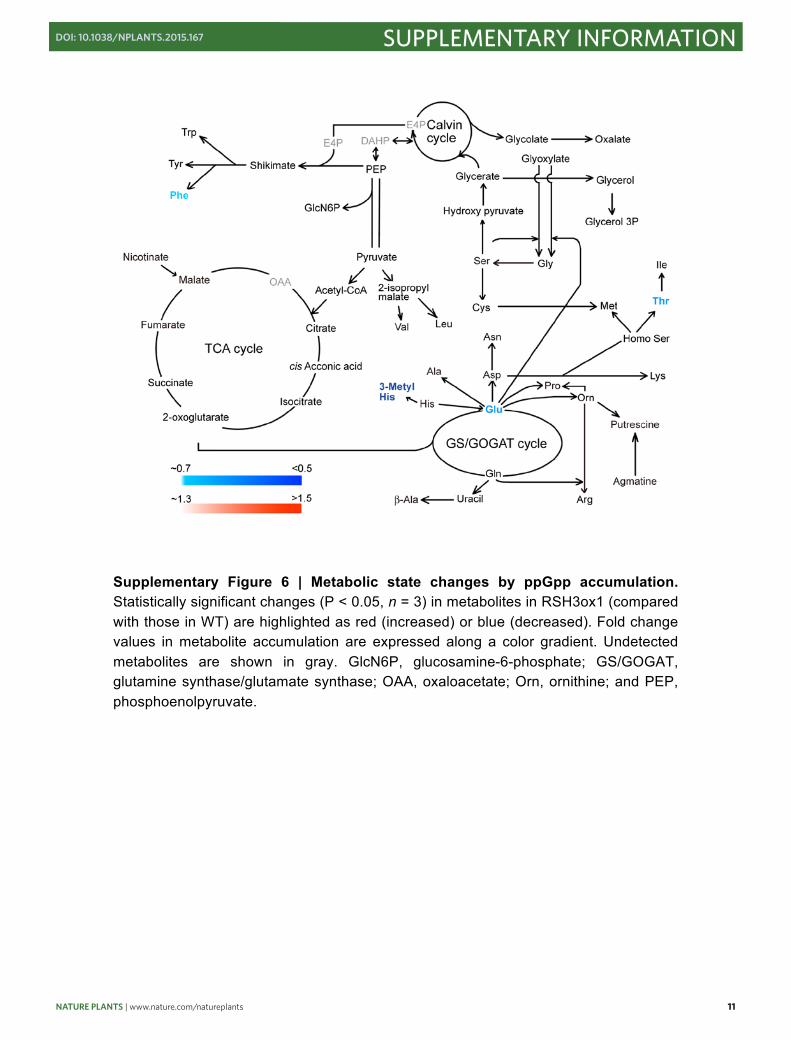
Supplementary Figure 6 | Metabolic state changes by ppGpp accumulation. Statistically significant changes (P < 0.05, n = 3) in metabolites in RSH3ox1 (compared with those in WT) are highlighted as red (increased) or blue (decreased). Fold change values in metabolite accumulation are expressed along a color gradient. Undetected metabolites are shown in gray. GlcN6P, glucosamine-6-phosphate; GS/GOGAT, glutamine synthase/glutamate synthase; OAA, oxaloacetate; Orn, ornithine; and PEP, phosphoenolpyruvate.

12 NATURE PLANTS | www.nature.com/natureplants
SUPPLEMENTARY INFORMATION DOI: 10.1038/NPLANTS.2015.167
Supplementary Figure 7 | Abscisic acid, cytokinin and glucose contents are not affected by ppGpp accumulation. a, Abscisic acid levels in WT, rsh2rsh3, RSH3ox1 and RSH3ox2 grown for 21 days. b, trans-zeatin levels in WT, rsh2rsh3, RSH3ox1 and RSH3ox2 grown for 21 days. c, Glucose levels in WT, rsh2rsh3, RSH3ox1 and RSH3ox2 grown for 21 days.