Embed Size (px)
Citation preview
Infrared Spectroscopy
紅外線光譜儀
Chapter 12 2
Introduction
• Spectroscopy is an analytical technique
which helps determine structure.
• It destroys little or no sample (non-
destructive method).
• The amount of light absorbed by the
sample is measured as wavelength is
varied.
=>
Chapter 12 3
Types of Spectroscopy
• Infrared (IR) spectroscopy measures the bond
vibration frequencies in a molecule and is used
to determine the functional group.
• Mass spectrometry (MS) fragments the molecule
and measures the masses.
• Nuclear magnetic resonance (NMR)
spectroscopy detects signals from hydrogen
atoms and can be used to distinguish isomers.
• Ultraviolet (UV) spectroscopy uses electron
transitions to determine bonding patterns. =>
Chapter 12 4
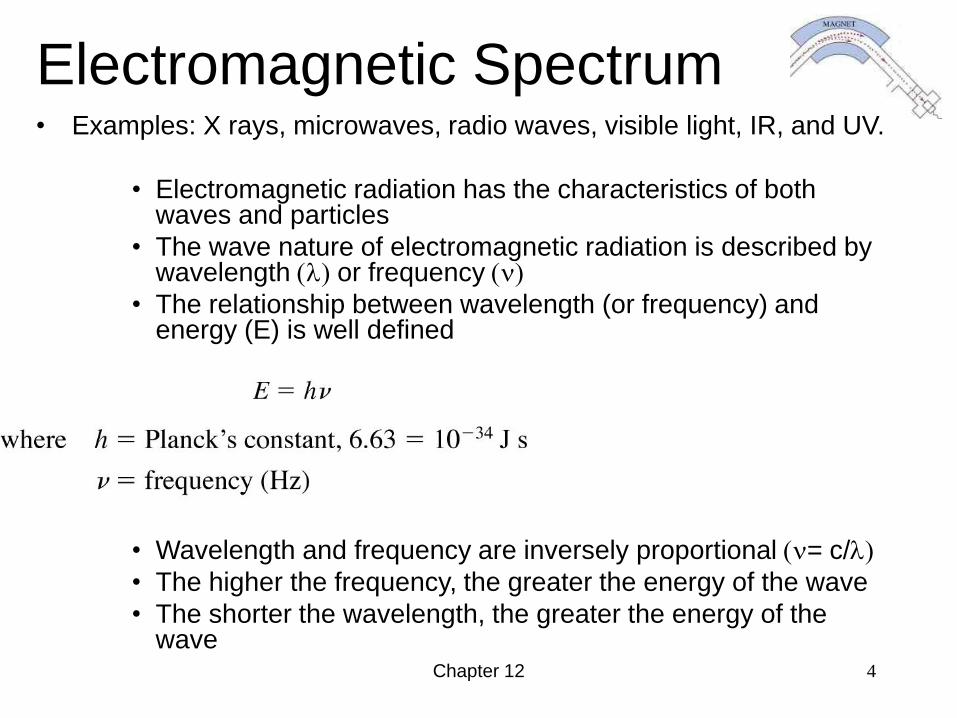
Electromagnetic Spectrum• Examples: X rays, microwaves, radio waves, visible light, IR, and UV.
• Electromagnetic radiation has the characteristics of both waves and particles
• The wave nature of electromagnetic radiation is described by wavelength (l) or frequency (n)
• The relationship between wavelength (or frequency) and energy (E) is well defined
• Wavelength and frequency are inversely proportional (n= c/l)
• The higher the frequency, the greater the energy of the wave
• The shorter the wavelength, the greater the energy of the wave
Chapter 12 5
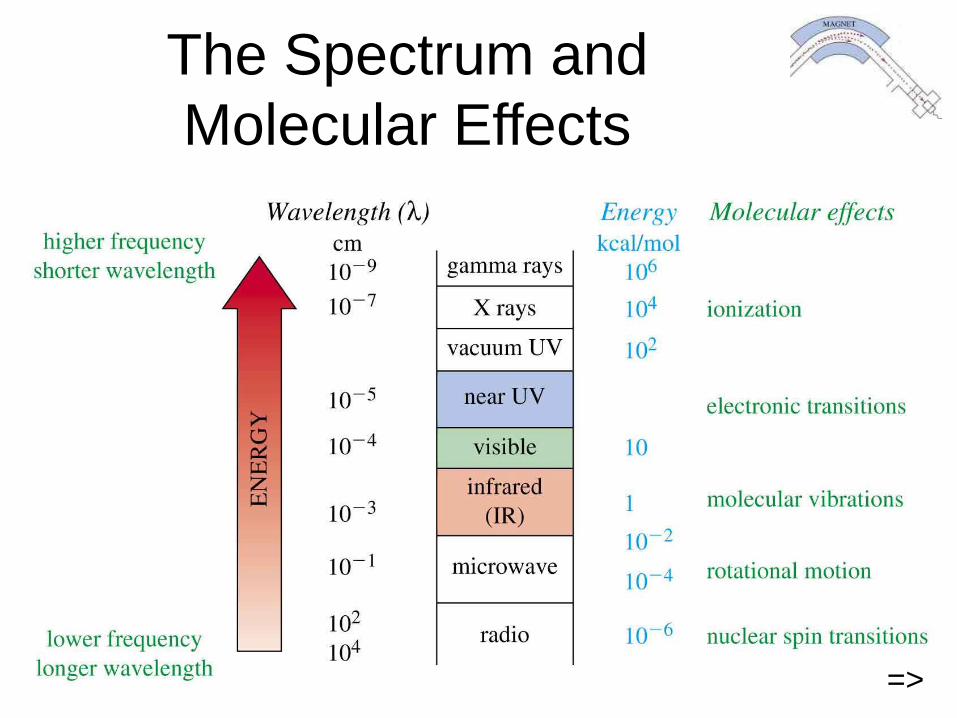
The Spectrum and
Molecular Effects
=>
=>
Chapter 12 6
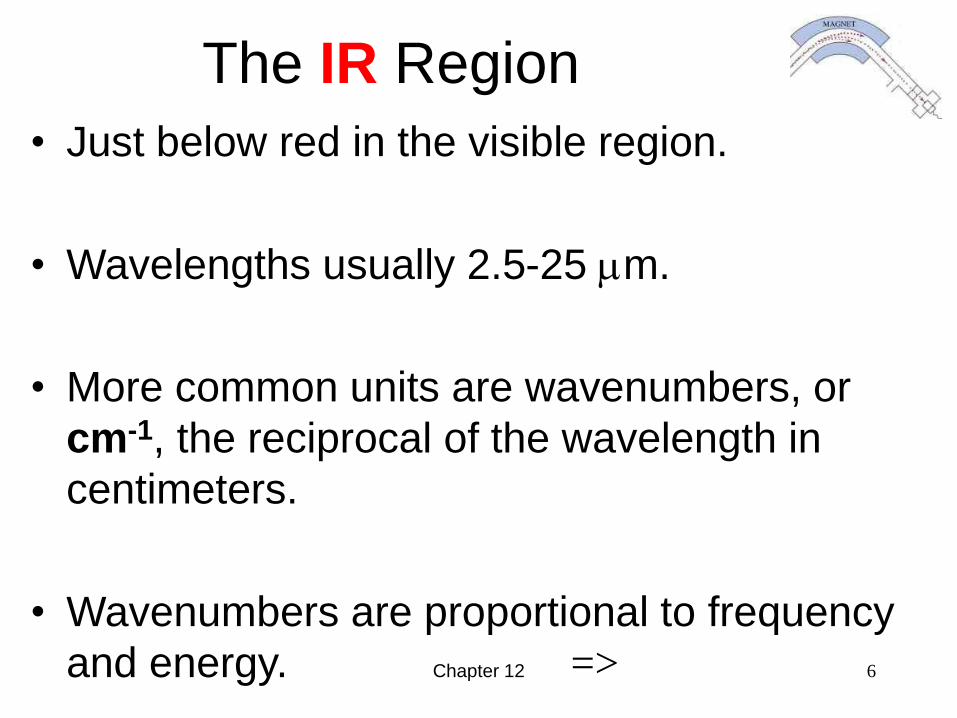
The IR Region
• Just below red in the visible region.
• Wavelengths usually 2.5-25 mm.
• More common units are wavenumbers, or
cm-1, the reciprocal of the wavelength in
centimeters.
• Wavenumbers are proportional to frequency
and energy. =>
Chapter 12 7
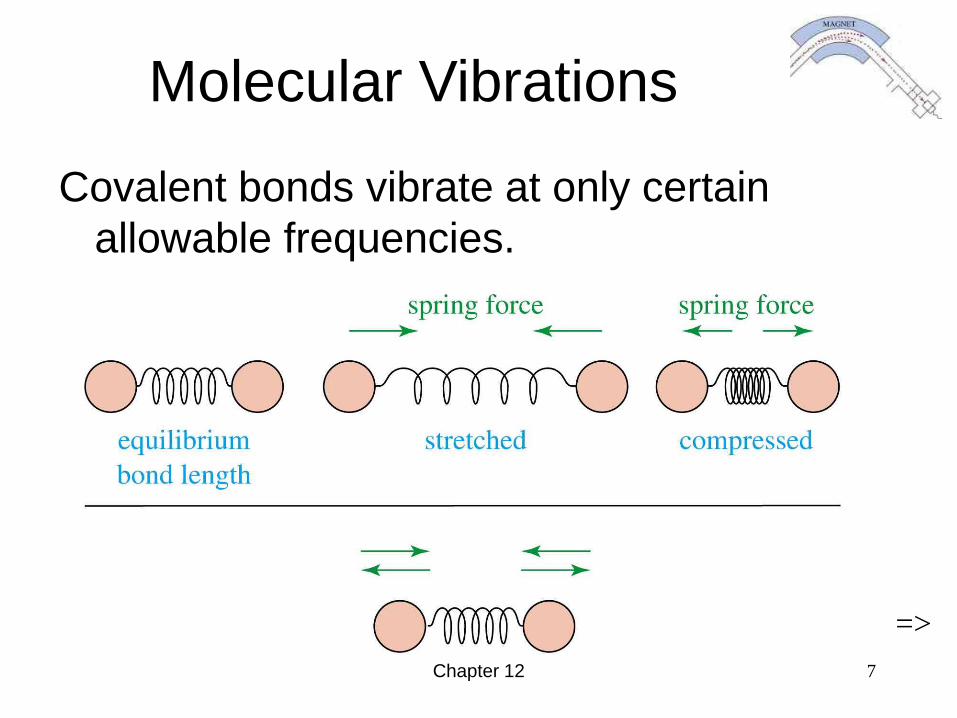
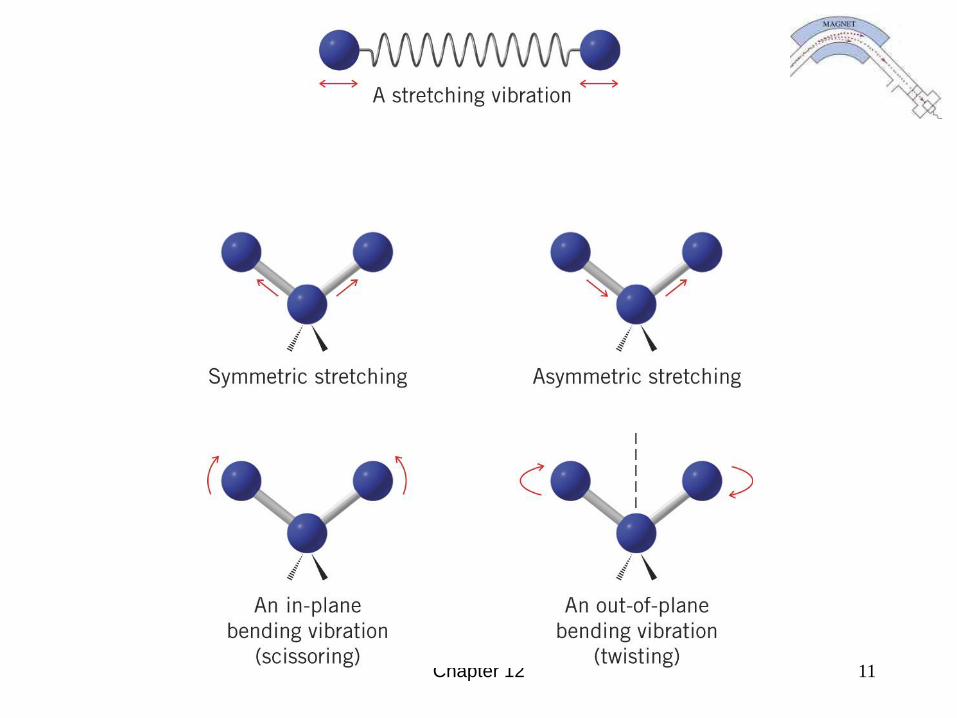
Molecular Vibrations
Covalent bonds vibrate at only certain
allowable frequencies.
=>
Chapter 128
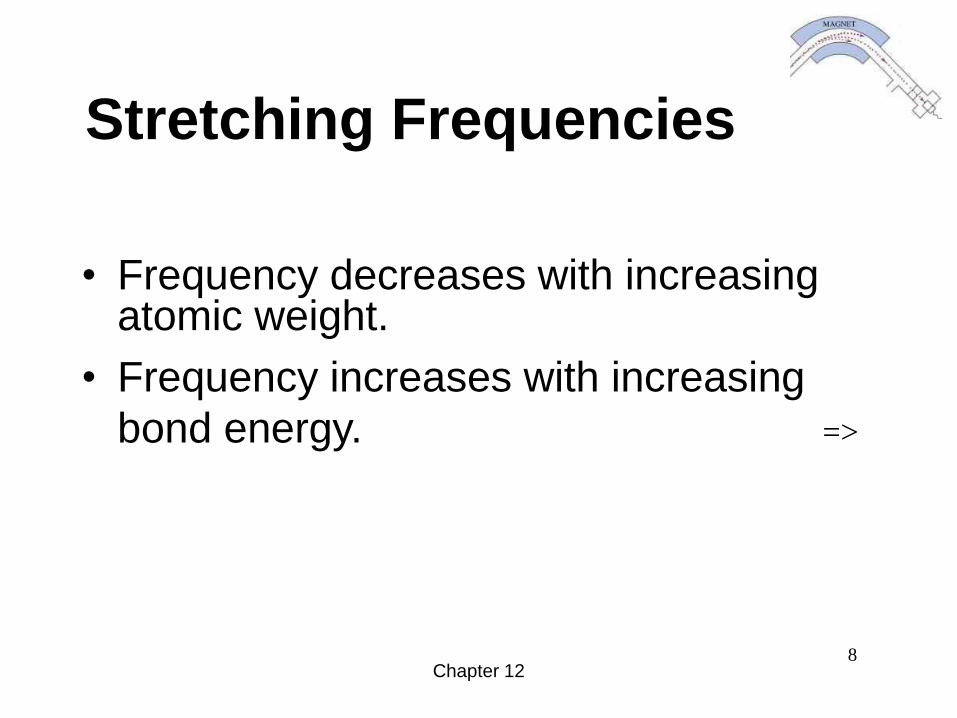
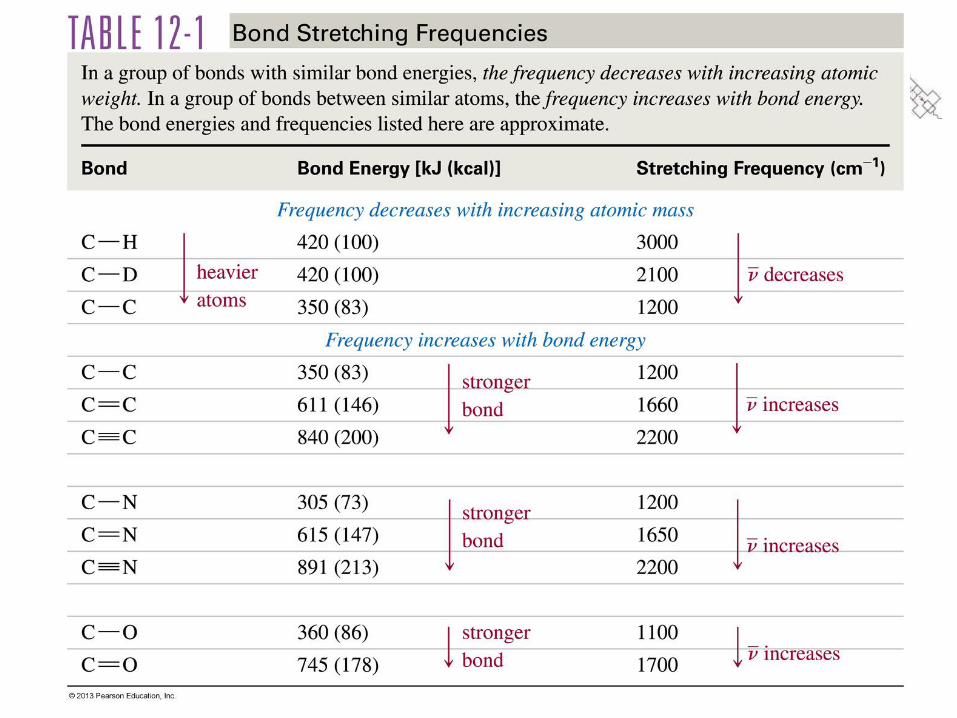
Stretching Frequencies
• Frequency decreases with increasing atomic weight.
• Frequency increases with increasing
bond energy. =>
Chapter 12 9
Chapter 12 10
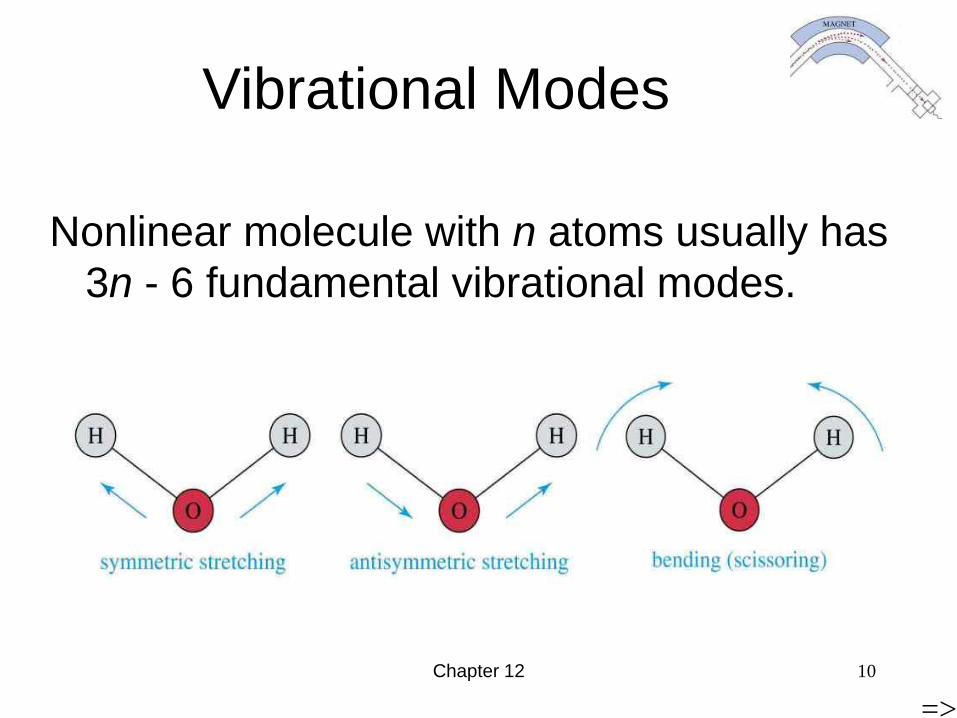
Vibrational Modes
Nonlinear molecule with n atoms usually has
3n - 6 fundamental vibrational modes.
=>
Chapter 12 11
Chapter 12 12
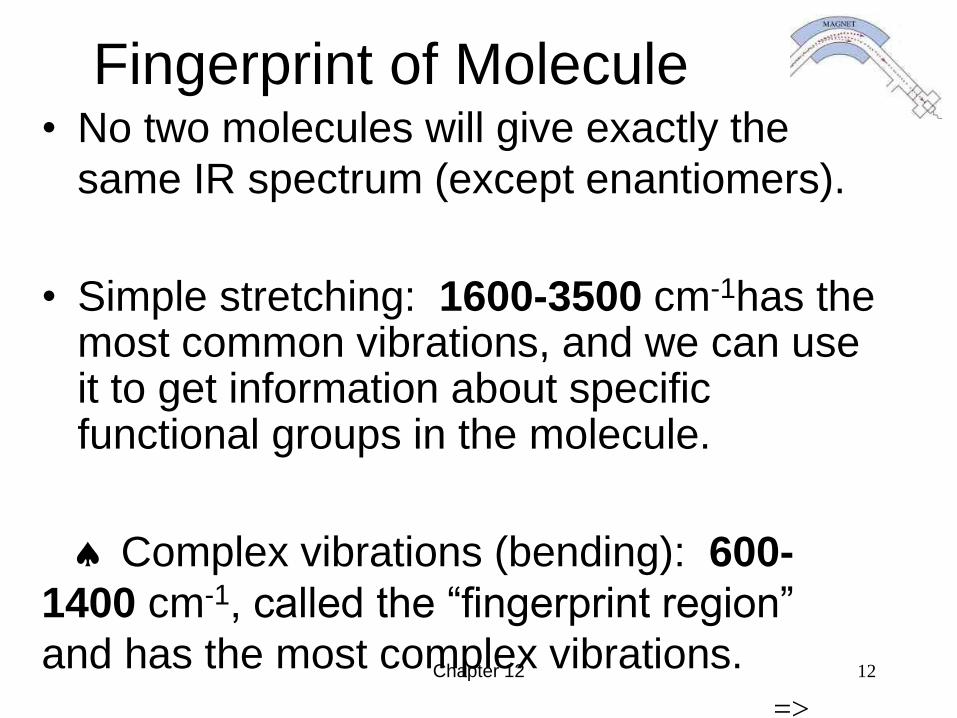
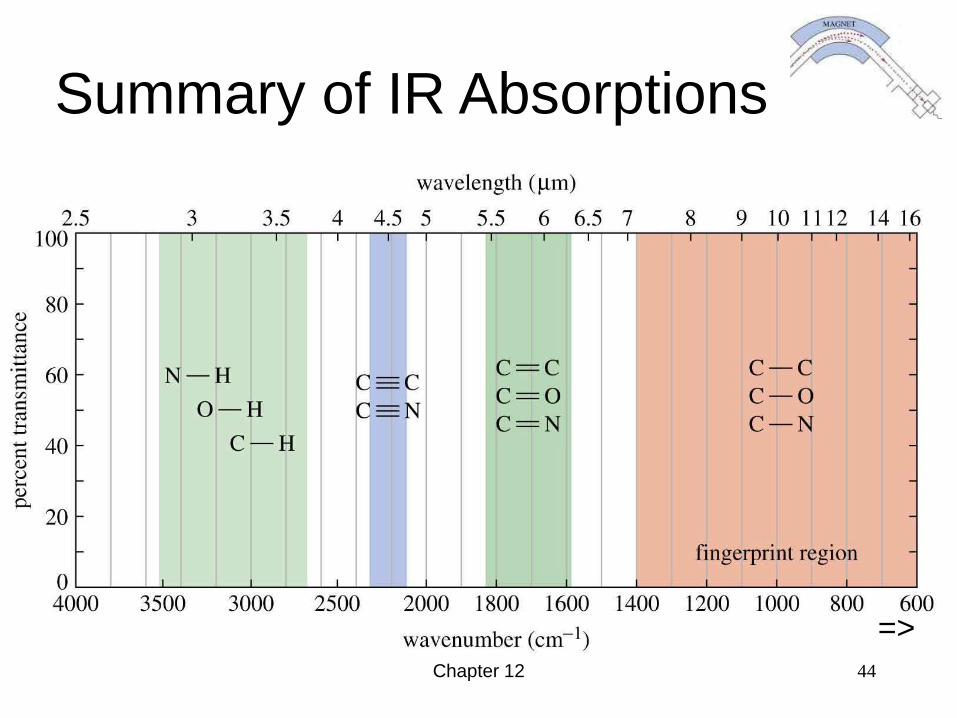
Fingerprint of Molecule• No two molecules will give exactly the
same IR spectrum (except enantiomers).
• Simple stretching: 1600-3500 cm-1has the most common vibrations, and we can use it to get information about specific functional groups in the molecule.
Complex vibrations (bending): 600-
1400 cm-1, called the “fingerprint region”
and has the most complex vibrations.
=>
Chapter 12 13
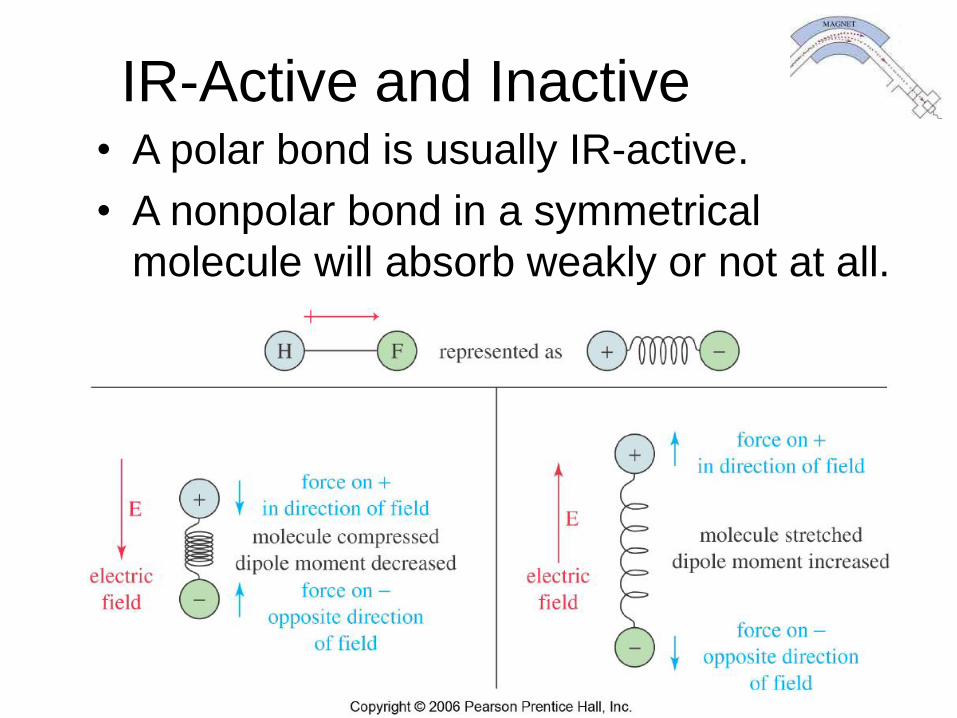
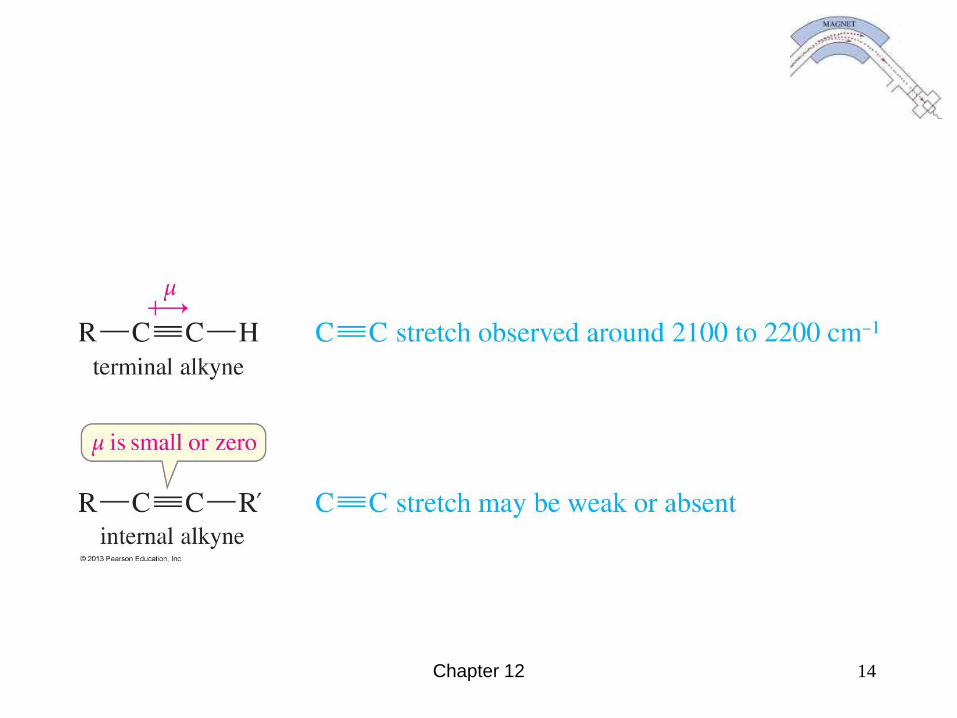
IR-Active and Inactive• A polar bond is usually IR-active.
• A nonpolar bond in a symmetrical
molecule will absorb weakly or not at all.
Chapter 12 14
Chapter 12 15
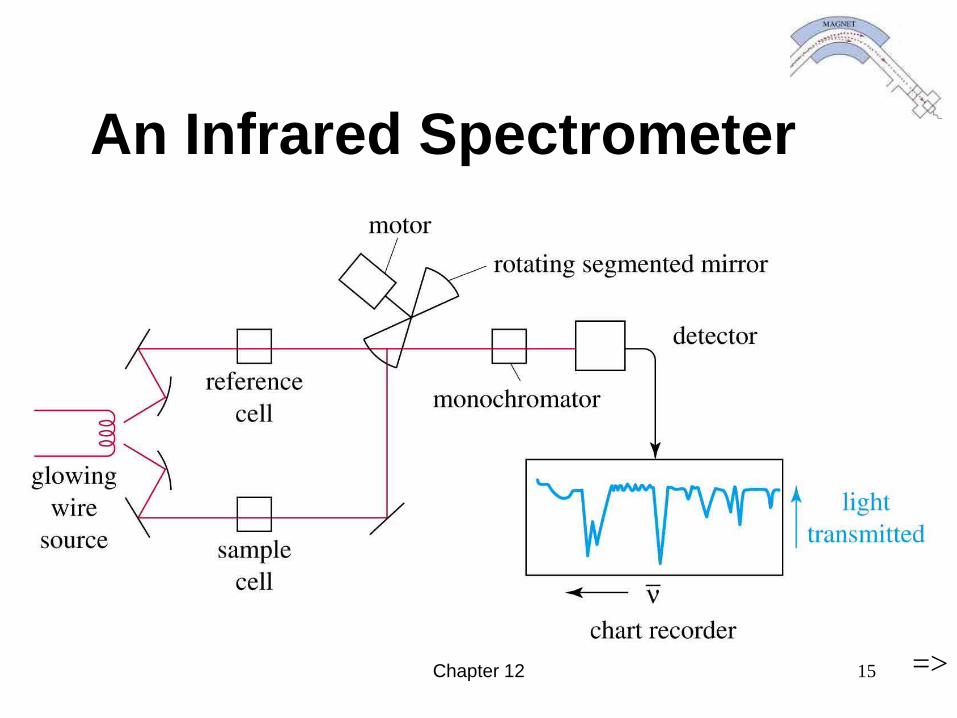
An Infrared Spectrometer
=>
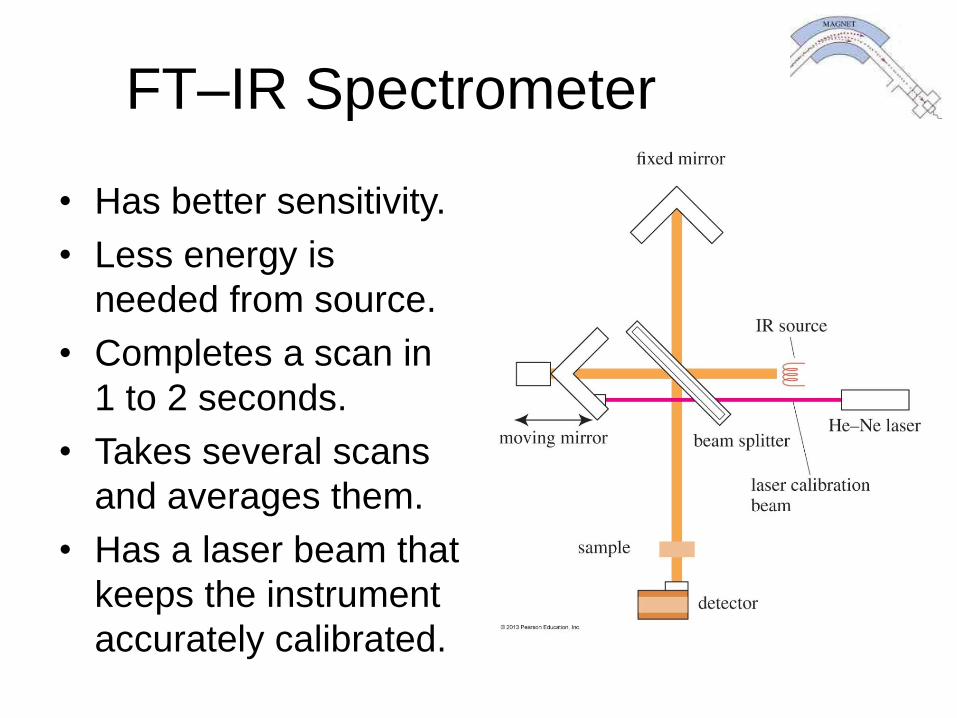
FT–IR Spectrometer
• Has better sensitivity.
• Less energy is
needed from source.
• Completes a scan in
1 to 2 seconds.
• Takes several scans
and averages them.
• Has a laser beam that
keeps the instrument
accurately calibrated.
Chapter 12 17
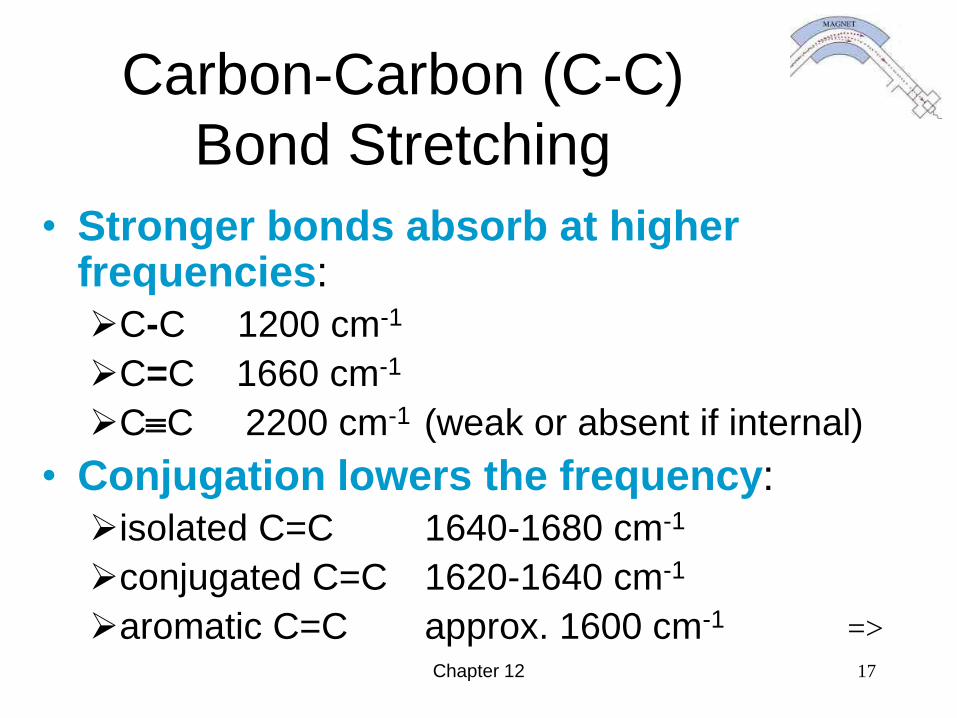
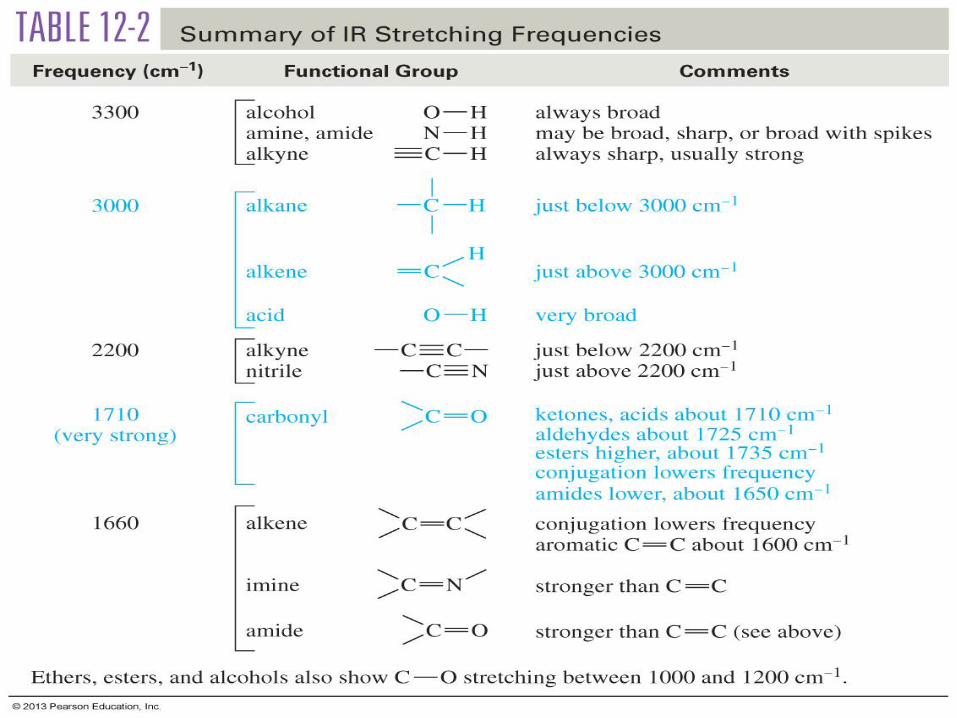
Carbon-Carbon (C-C)
Bond Stretching
• Stronger bonds absorb at higher frequencies:
C-C 1200 cm-1
C=C 1660 cm-1
CC 2200 cm-1 (weak or absent if internal)
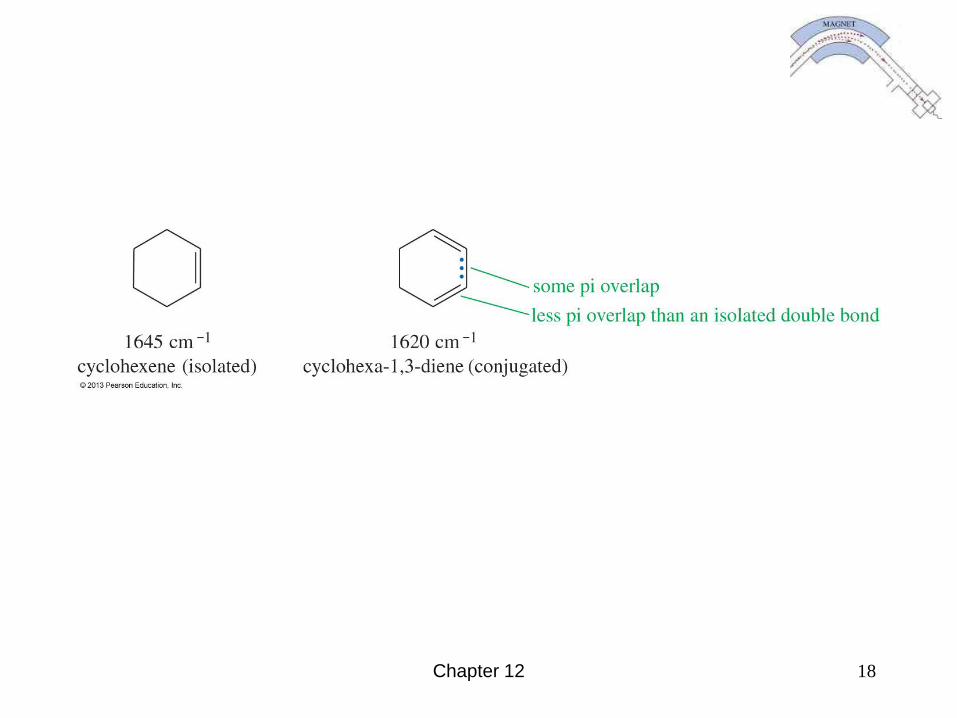
• Conjugation lowers the frequency:
isolated C=C 1640-1680 cm-1
conjugated C=C 1620-1640 cm-1
aromatic C=C approx. 1600 cm-1 =>
Chapter 12 18
Chapter 12 19
Carbon-Hydrogen (C-H)
Stretching
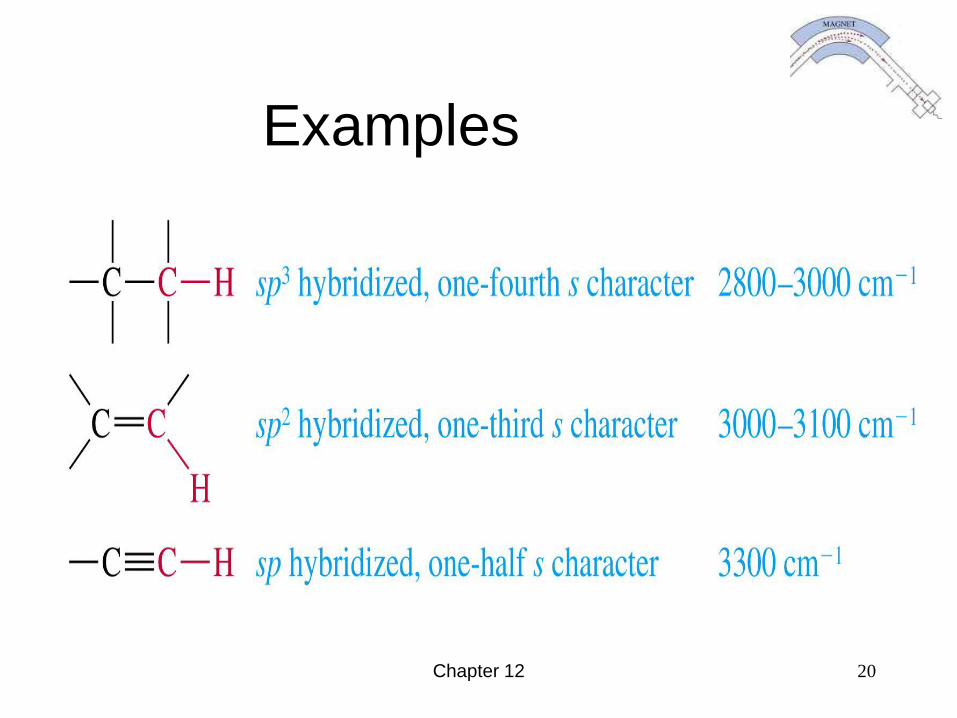
Bonds with more s character absorb at a
higher frequency.
sp3 C-H, just below 3000 cm-1 (to the right)
sp2 C-H, just above 3000 cm-1 (to the left)
sp C-H, at 3300 cm-1
=>
Chapter 12 20
Examples
Chapter 12 21
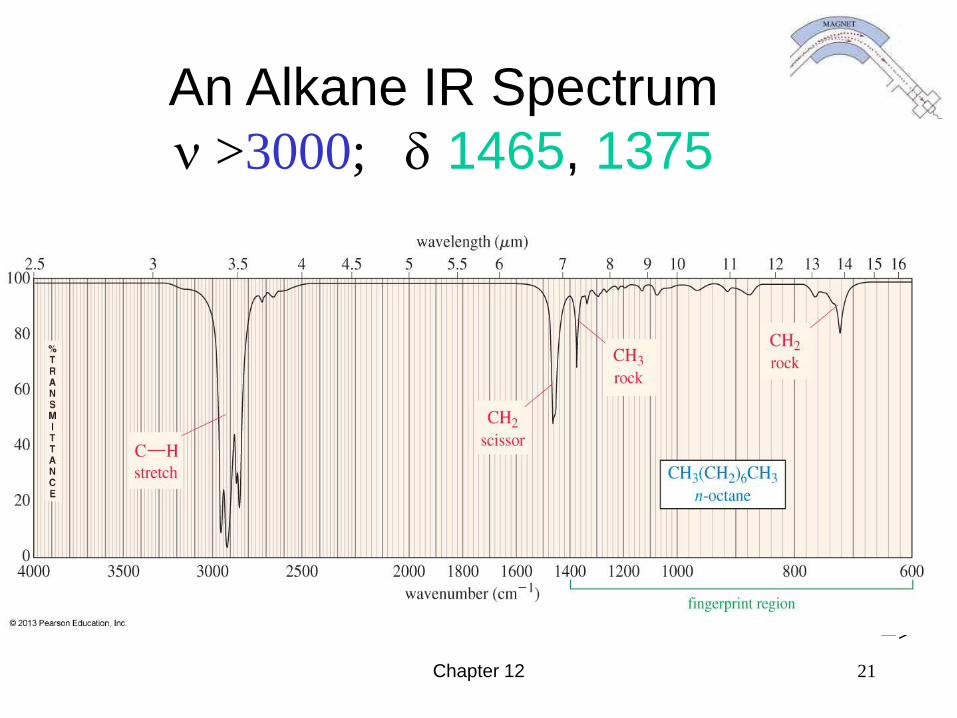
An Alkane IR Spectrum
n >3000; d 1465, 1375
=>
Chapter 12 22
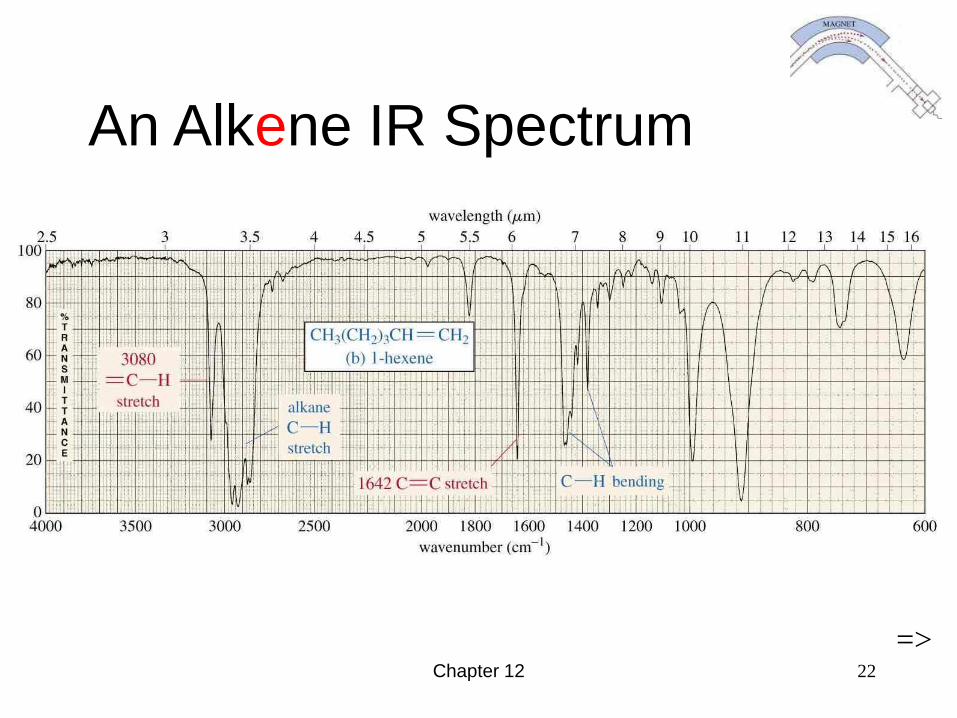
An Alkene IR Spectrum
=>
Chapter 12 23
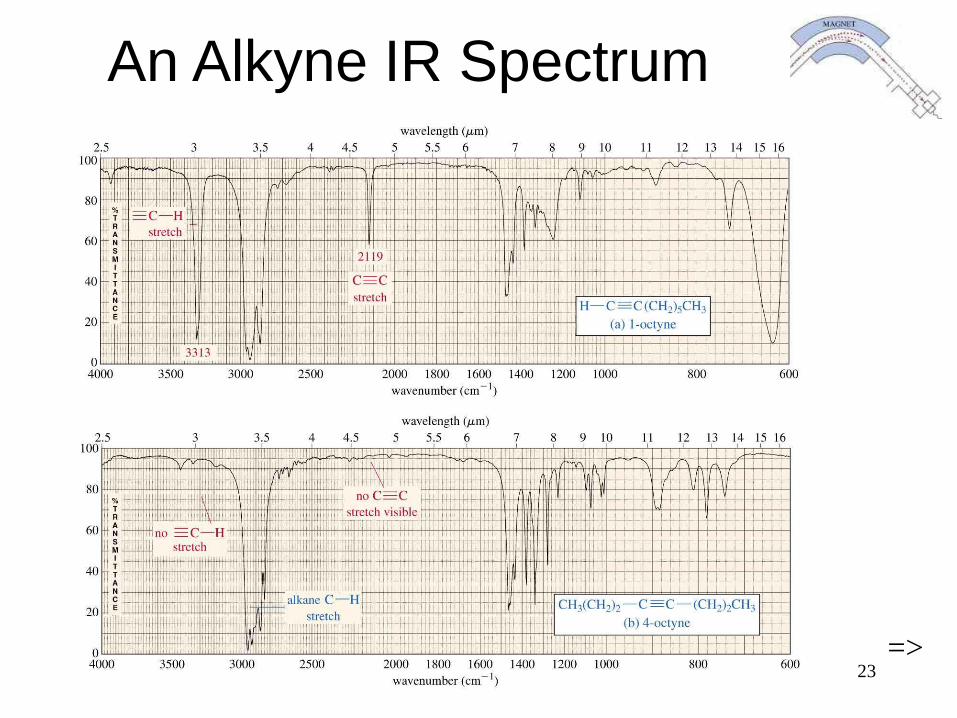
An Alkyne IR Spectrum
=>
Chapter 12 24
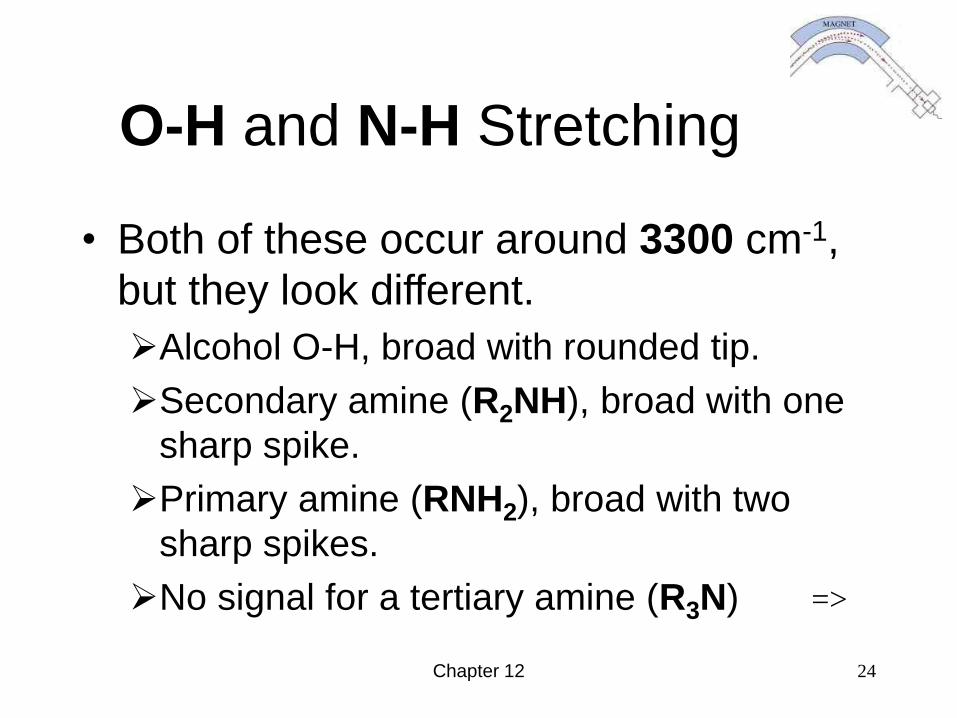
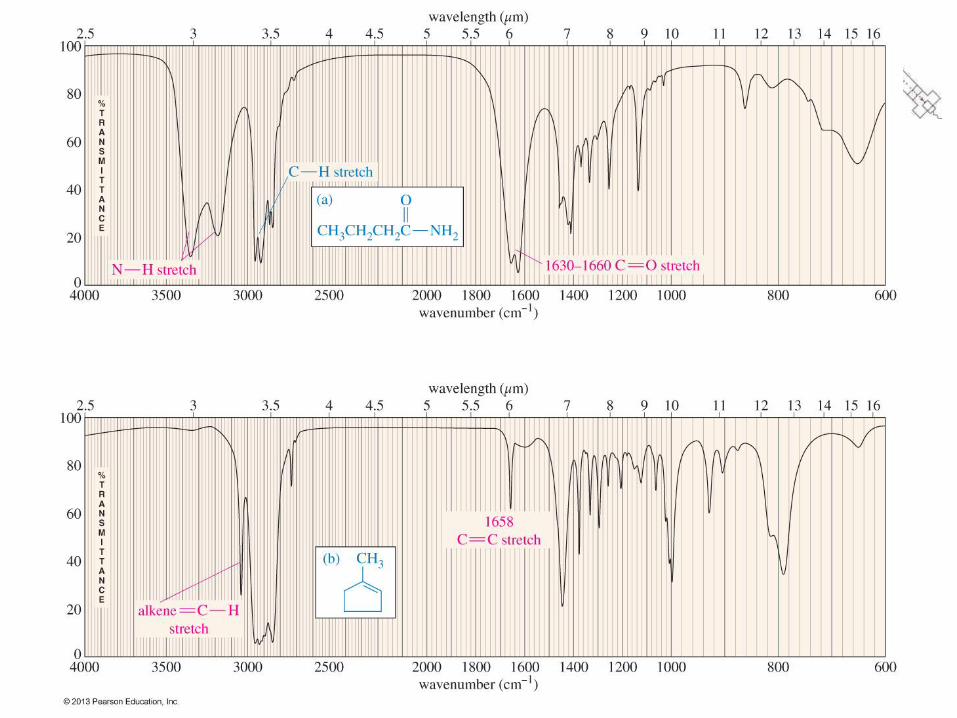
O-H and N-H Stretching
• Both of these occur around 3300 cm-1,
but they look different.
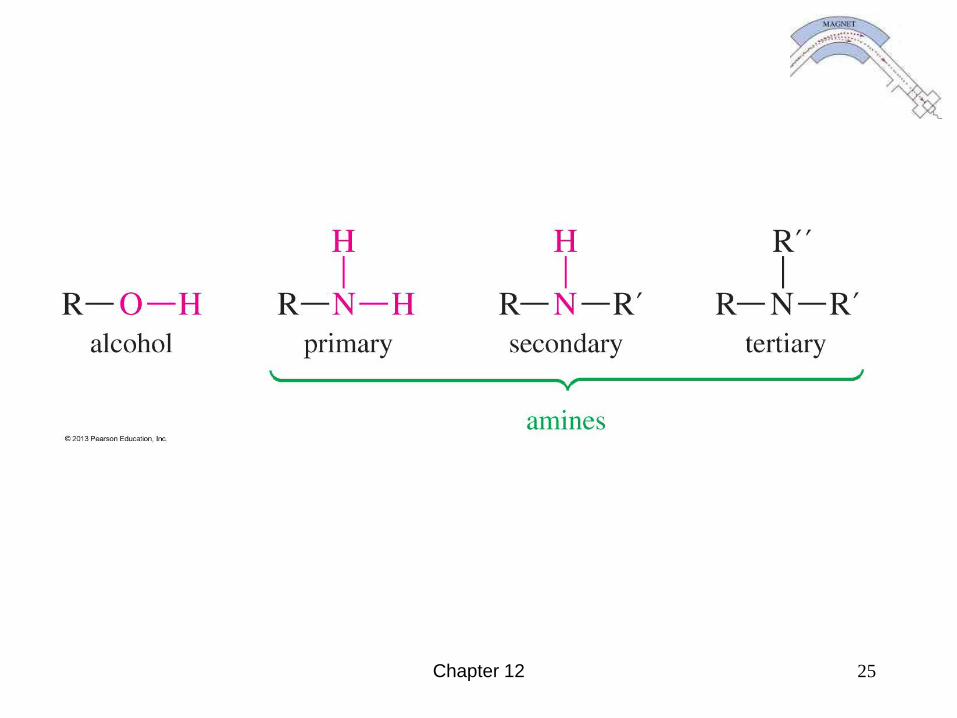
Alcohol O-H, broad with rounded tip.
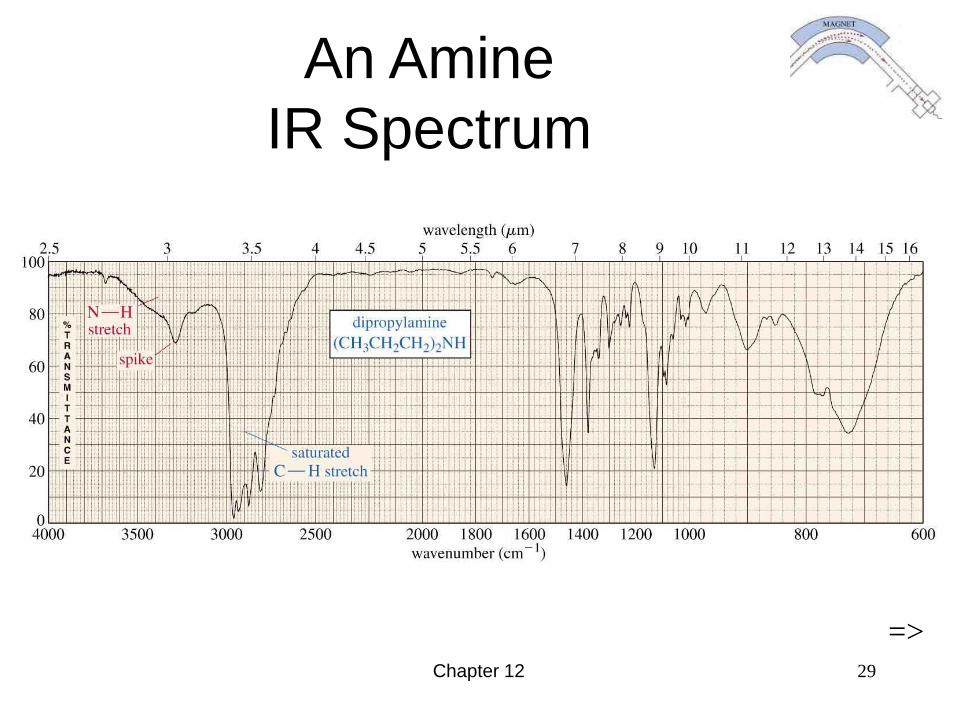
Secondary amine (R2NH), broad with one
sharp spike.
Primary amine (RNH2), broad with two
sharp spikes.
No signal for a tertiary amine (R3N) =>
Chapter 12 25
Chapter 12 26
Chapter 12 27
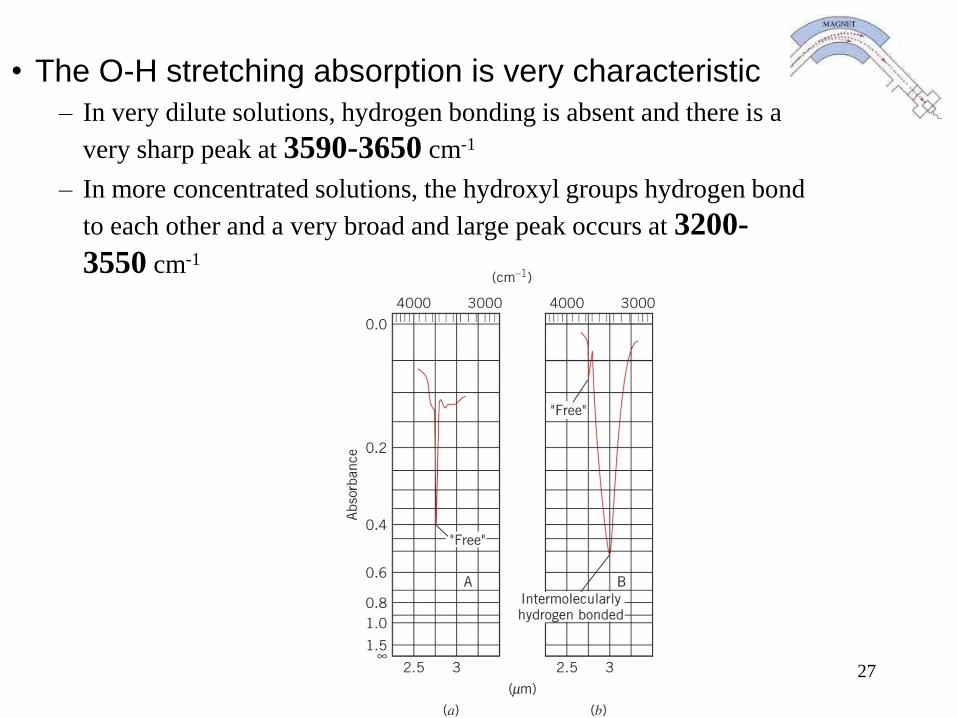
• The O-H stretching absorption is very characteristic
– In very dilute solutions, hydrogen bonding is absent and there is a
very sharp peak at 3590-3650 cm-1
– In more concentrated solutions, the hydroxyl groups hydrogen bond
to each other and a very broad and large peak occurs at 3200-
3550 cm-1
Chapter 12 28
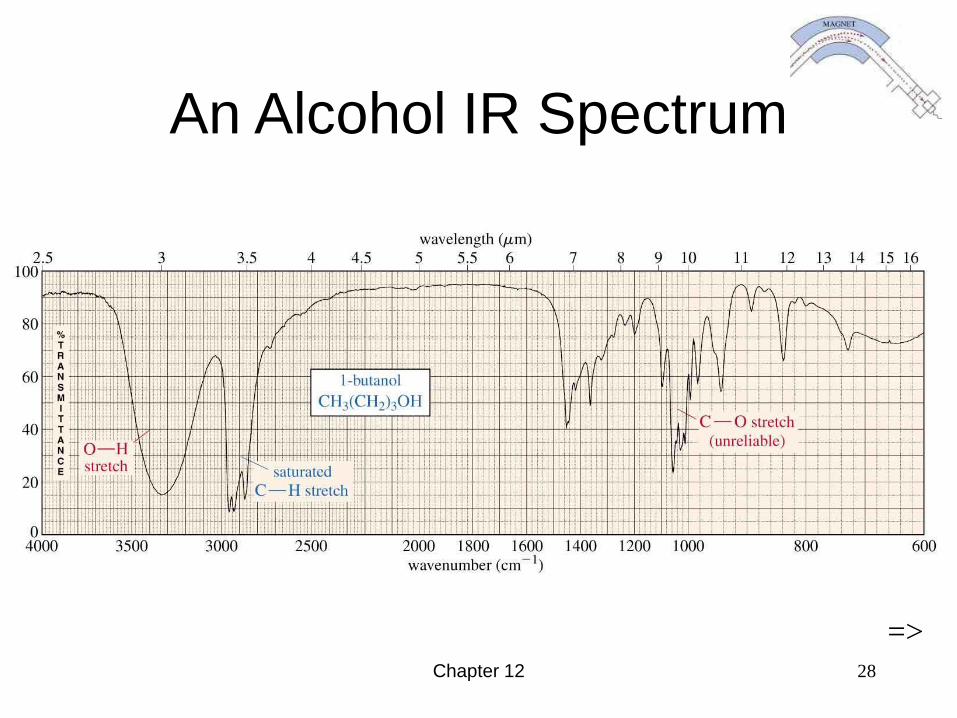
An Alcohol IR Spectrum
=>
Chapter 12 29
An Amine
IR Spectrum
=>
Chapter 12 30
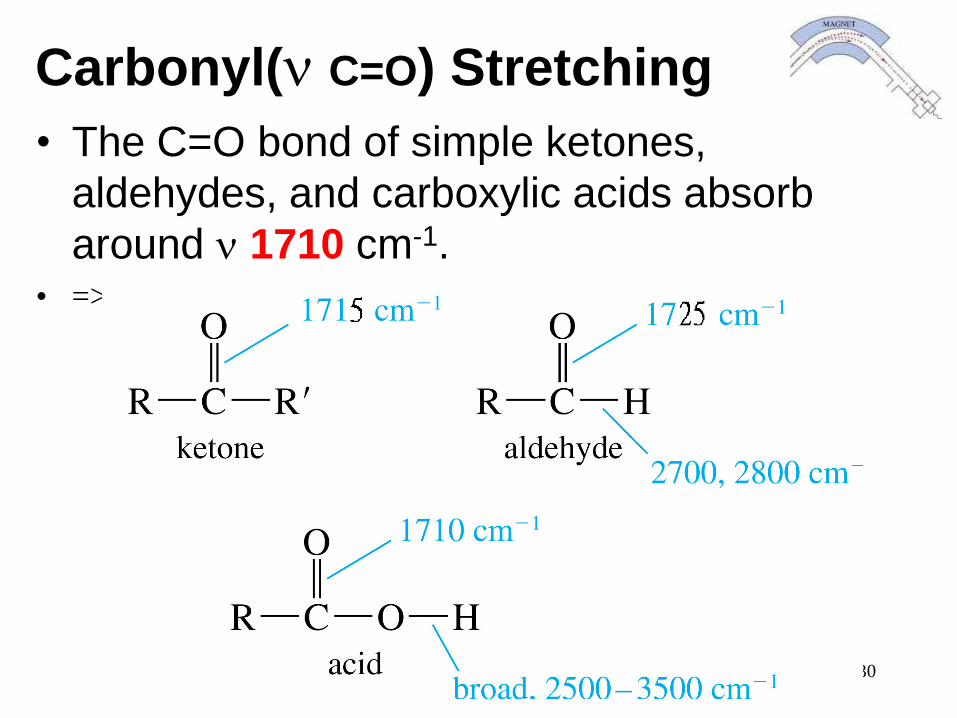
Carbonyl(n C=O) Stretching
• The C=O bond of simple ketones,
aldehydes, and carboxylic acids absorb
around n 1710 cm-1.• =>
Chapter 12 31
• Usually, it’s the strongest IR signal.
• Carboxylic acids will have O-H also.
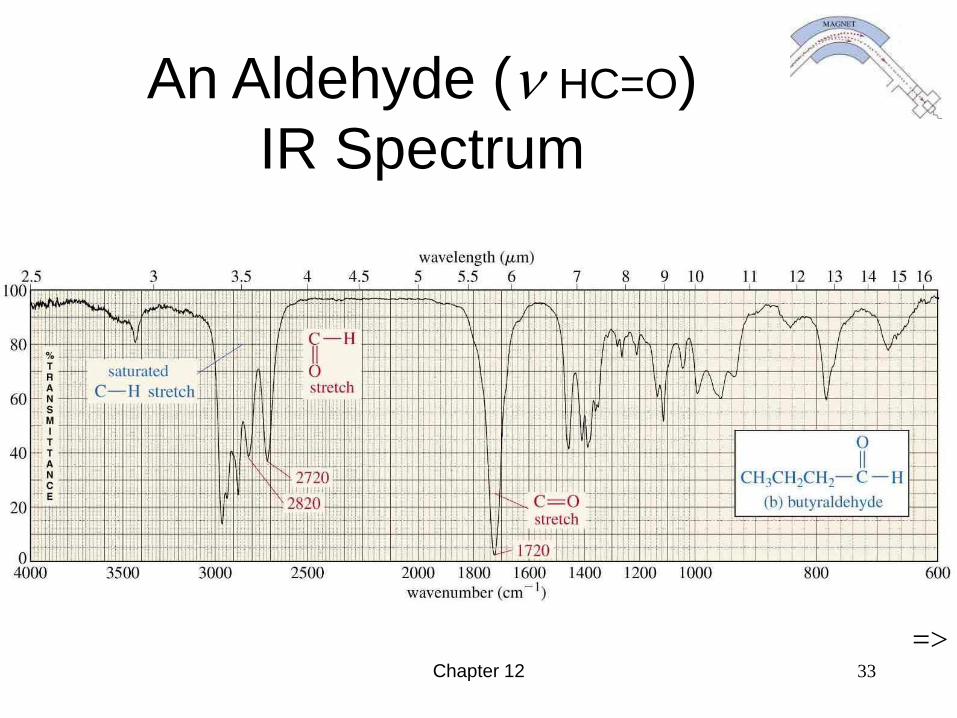
• Aldehydes have two C-H signals around
2700 and 2800 cm-1.
Chapter 12 32
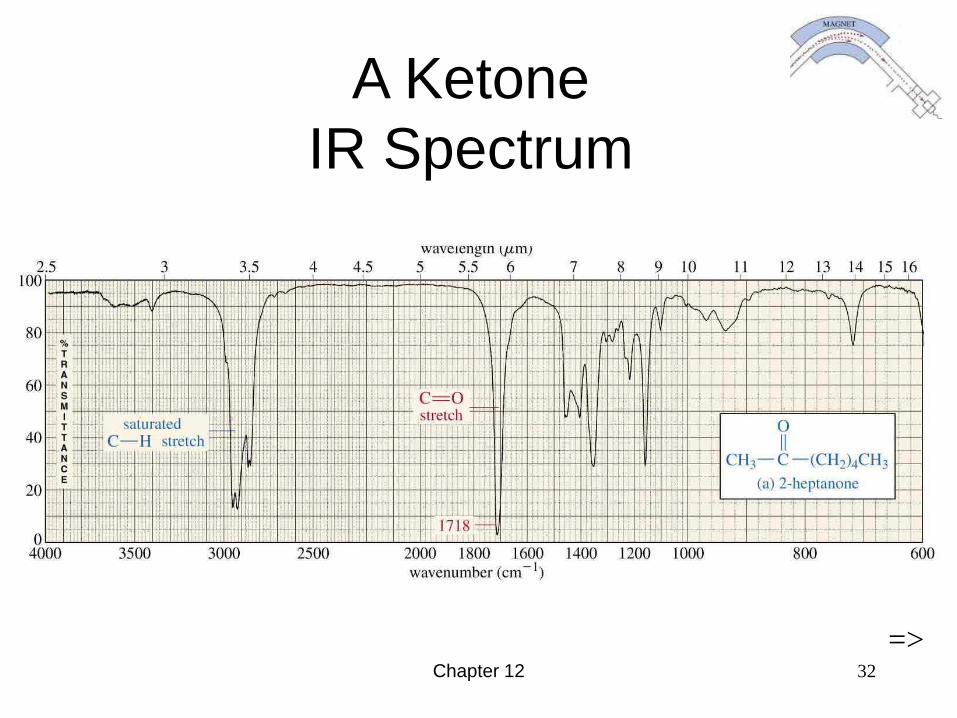
A Ketone
IR Spectrum
=>
Chapter 12 33
An Aldehyde (n HC=O)
IR Spectrum
=>
Chapter 12 34
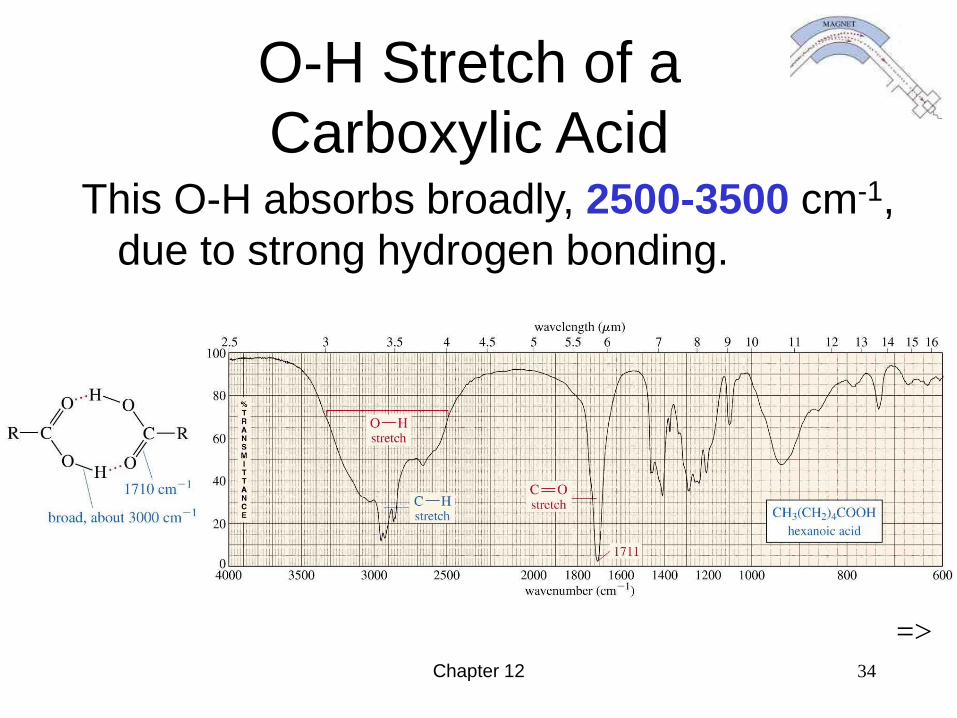
O-H Stretch of a
Carboxylic AcidThis O-H absorbs broadly, 2500-3500 cm-1,
due to strong hydrogen bonding.
=>
Chapter 12 35
Variations in
C=O Absorption
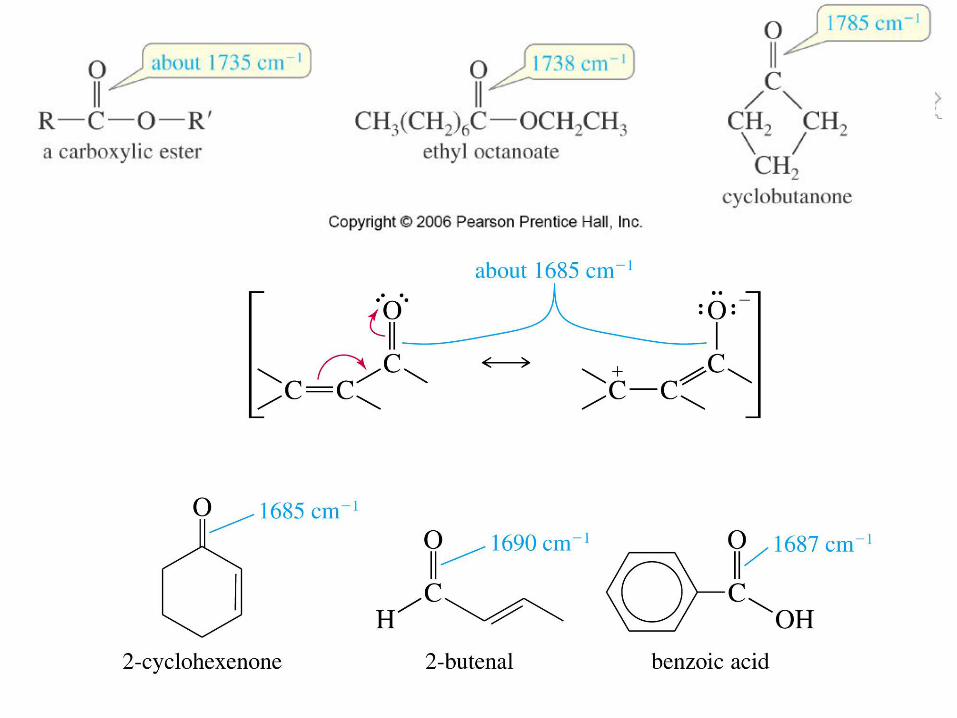
• Conjugation of C=O with C=C lowers the stretching frequency to ~1680 cm-1.
• The C=O group of an amide absorbs at an even lower frequency, 1640-1680 cm-1.
• The C=O of an ester absorbs at a higher frequency, ~1730-1740 cm-1.
• Carbonyl groups in small rings (5 C’s or less) absorb at an even higher frequency. =>
Chapter 12 36
Chapter 12 37
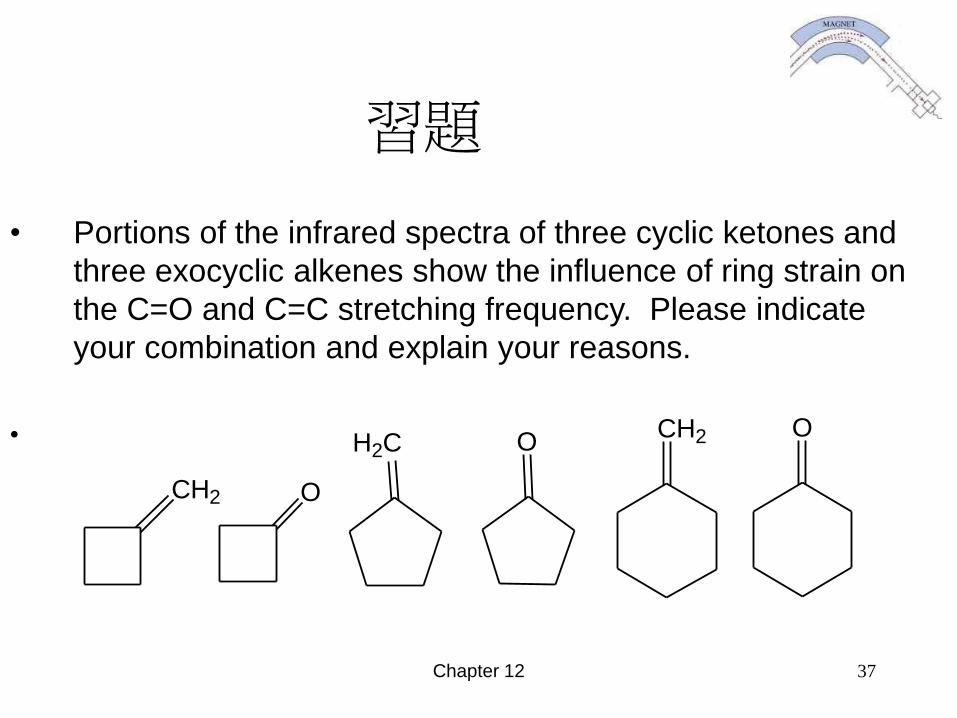
習題
• Portions of the infrared spectra of three cyclic ketones and
three exocyclic alkenes show the influence of ring strain on
the C=O and C=C stretching frequency. Please indicate
your combination and explain your reasons.
• CH2H2C
CH2
OO
O
Chapter 12 38
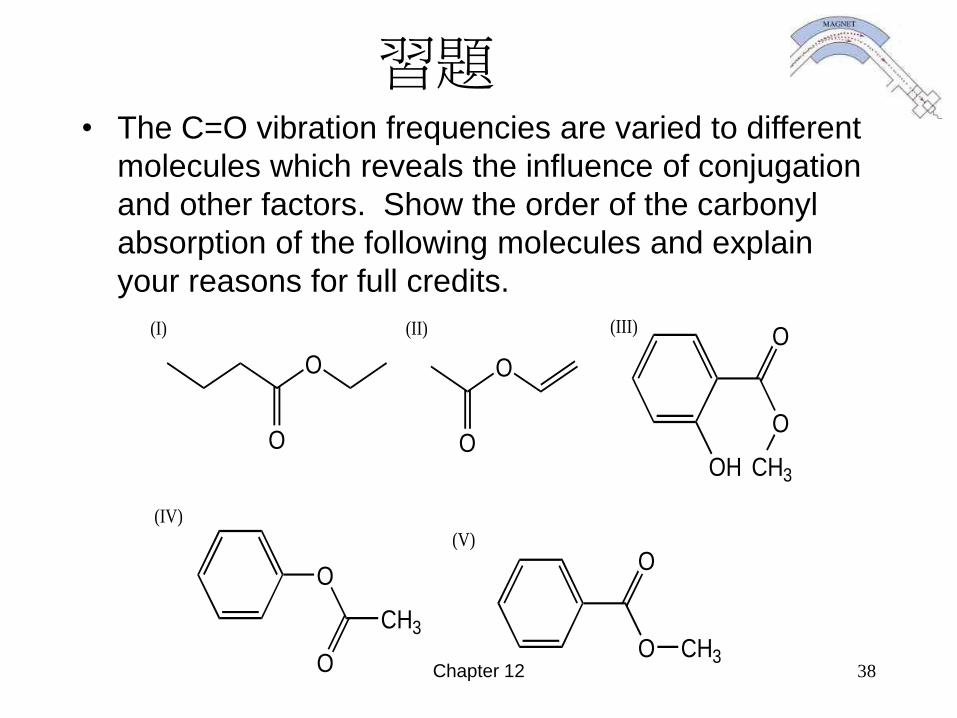
習題• The C=O vibration frequencies are varied to different
molecules which reveals the influence of conjugation
and other factors. Show the order of the carbonyl
absorption of the following molecules and explain
your reasons for full credits.
O
O
O
OOH
O
O
CH3
O
CH3
OO CH3
O
(I) (II) (III)
(IV)
(V)
Chapter 12 39
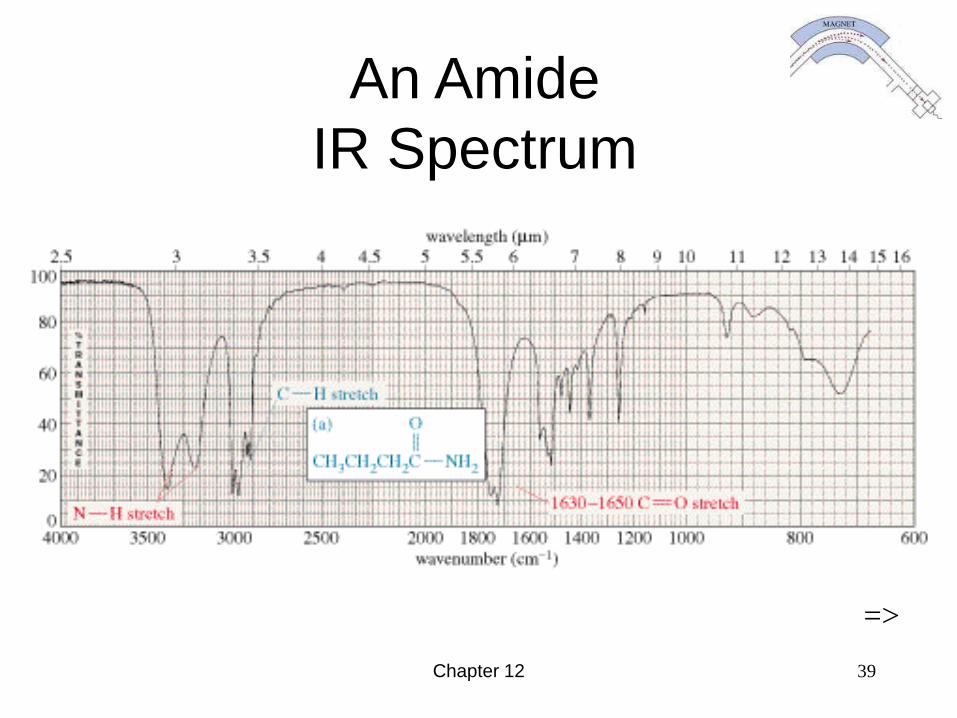
An Amide
IR Spectrum
=>
Chapter 12 40
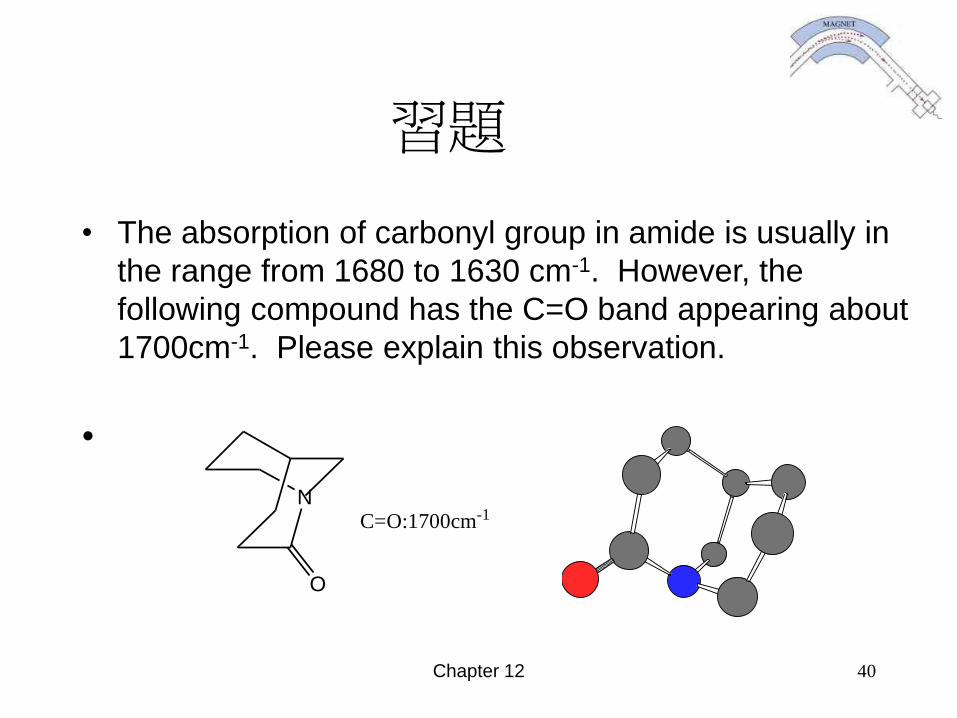
習題
• The absorption of carbonyl group in amide is usually in
the range from 1680 to 1630 cm-1. However, the
following compound has the C=O band appearing about
1700cm-1. Please explain this observation.
•
N
O
C=O:1700cm-1
Chapter 12 41
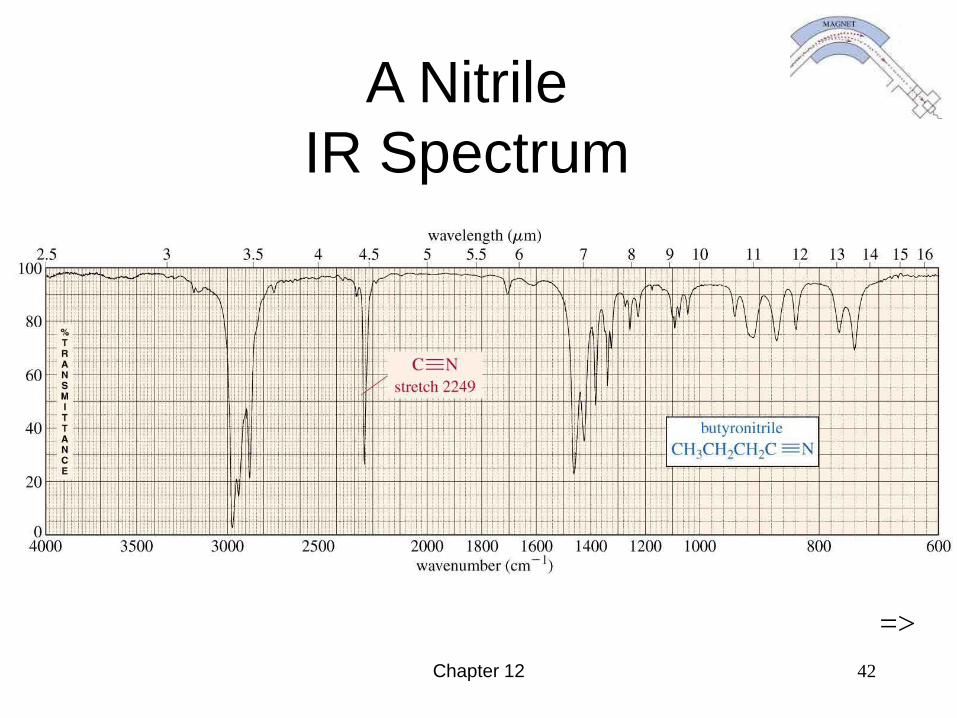
Carbon - Nitrogen
Stretching (C~N)
• C - N absorbs around 1200 cm-1.
• C = N absorbs around 1660 cm-1 and is
much stronger than the C = C
absorption in the same region.
• C N absorbs strongly just above 2200
cm-1. The alkyne C C signal is much
weaker and is just below 2200 cm-1 .
=>
Chapter 12 42
A Nitrile
IR Spectrum
=>
Chapter 12 43
Chapter 12 44
Summary of IR Absorptions
=>=>
Chapter 12 45
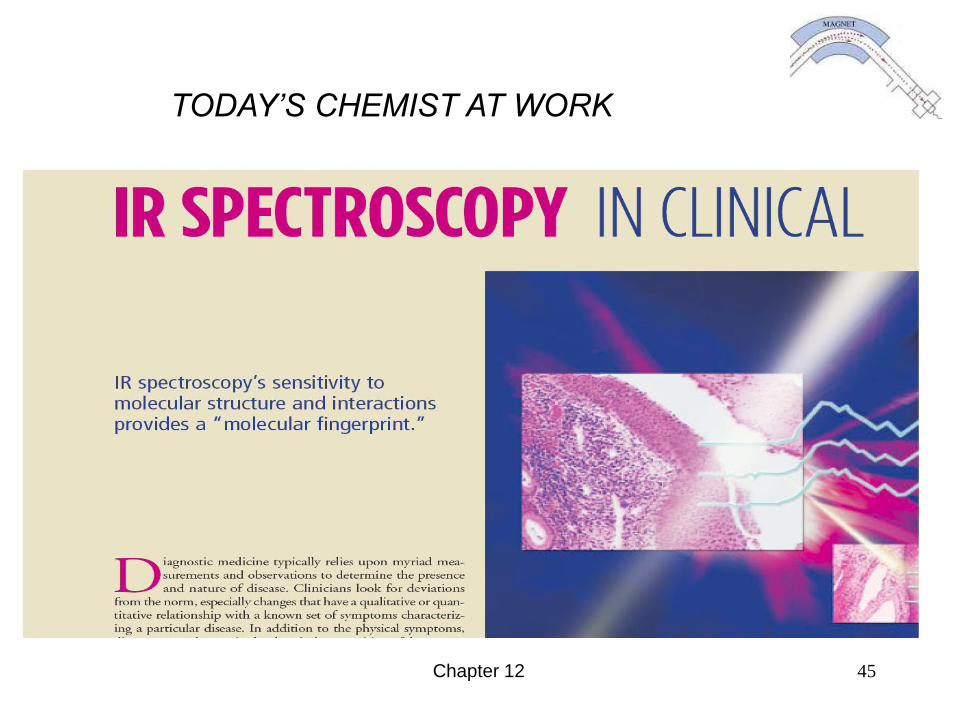
TODAY’S CHEMIST AT WORK
Chapter 12 46
• In addition to the physical symptoms, diseases cause changes in the chemical composition of the organs,tissues, or fluids they affect; these differences are the basis of everyday clinical chemical tests, tissue staining, and medical imaging techniques.
• IR spectroscopy not only probes the chemical composition
of a sample but also determines the precise position and
amplitude of IR absorption bands that reflect interactions
among the matrix constituents. Because of its sensitivity to
both molecular structure and molecular interactions, the
spectrum is often referred to as a molecular fingerprint of the
sample;
• the specificity of that fingerprint is the basis for biomedical applications.
Chapter 12 47
Strengths and Limitations
• IR alone cannot determine a structure.
• Some signals may be ambiguous.
• The functional group is usually indicated.
• The absence of a signal is definite proof
that the functional group is absent.
• Correspondence with a known sample’s
IR spectrum confirms the identity of the
compound. =>