Embed Size (px)
Citation preview
Page 1 of 16
INITIATING COVERAGE 18 September 2017
Malayan Flour Mills Berhad HOLD Analyst Consensus: Buy 0 Hold 1 Sell 0
3x poultry processing capacity to come onstream in late 2018 Expect high capex of RM550 million over 2017-2018 3Q17 earnings lift from rise in market-ready chicken price But flattish growth likely for 2017-2018 Potential future expansion into fish farming
Summary
Malayan Flour is the second largest flour miller (1,950 tonnes daily capacity) and the third largest broiler producer (average day old chick production of more than 5 million per month) in the country.
Flour The removal of flour subsidies is positive for Malayan Flour. It has translated into positive 1Q2017 earnings for the flour industry. Malayan Flour has strong distribution channel and integrated, cost-effective operations. Its venture in Vietnam is expected to see growing demand from the emerging middle class in the Indo-China region. Capacity in the country is still under-utilised and supportive of future growth.
Poultry Broiler segment expected to get lift from rising chicken prices in 3Q2017 but volume sales growth is limited by plant capacity. Construction is underway for a new processing plant that will triple broiler capacity when completed in late 2018. This should underpin revenue growth for the following 2-3 years, as the plant progressively reaches full capacity. Malayan Flour operates a closed house integration operation for its broilers, which improves hygiene and quality.
Aqua Feed Mill Malayan Flour may expand its aqua feed mill production line further downstream to fish farming, mirroring its broiler vertical integration pathway.
Risk It is a net beneficiary of a stronger ringgit as 70% of its costs consist of imported raw materials. Shortage in raw materials for flour milling (wheat) and animal feeds (soybean, corn) will inflate costs. Apart from epidemics, another major risk for the broiler industry is the possible increase in competition due to ongoing industry-wide capacity expansions.
Financials Profit is projected to be flattish medium-term, +5% in 2017 and -3% in 2018, on the back of higher capex (depreciation and interest expense) of RM550 million. Gearing will rise from net debt of RM595 million in 2Q2017. But management intends to maintain its dividends payout at above 40%.
Considering the huge capex and gestation period, prevailing P/E of 13.2-13.6x versus flattish growth in 2017-2018 and yields of 3.1%, we initiate coverage of Malayan Flour with a cautious HOLD call.
Share price RM2.07
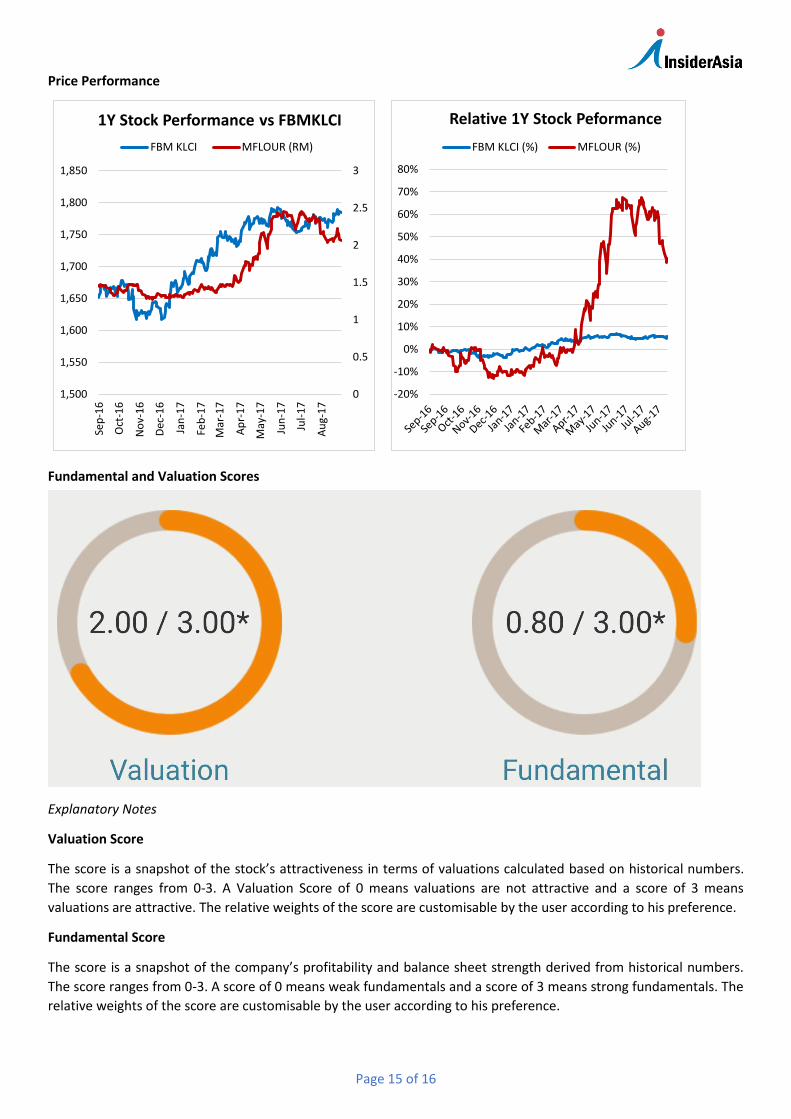
Fundamental Score 0.8/3
Valuation Score 2.0/3
Company Description
Flour milling and trading in flour related products. Diversified to integrated poultry operations including feed mills, breeder farming, broiler farming, poultry processing & further processed products.
Stock Information
Industry Consumer
Sub-industry Food & Beverage
Bursa Code 3662
Bloomberg Ticker MFL MK
Listing Main
Outstanding Shares 550.2 mil
Market Cap RM 1,139.1 mil
Par Value RM0.50
52-week Range 1.32-2.50
Estimated Free Float 43.8%
Beta 0.80
200-day Avg Volume 755,623
Price Performance (%)
1M 3M 12M
Stock -4.1 -13.6 42.1
FBMKLCI 0.4 -0.3 8.0
Major Shareholders
Teh Wee Chye 18.23%
D. Liewphairatana 10.99%
Earnings Forecast 16A 17E 18E
Net Profit (RM mil) 80.8 82.1 84.2
EPS (sen) 14.7 14.9 15.3
EPS Growth (%) 285 2 2
P/E (x) 9.2 14.7 14.4
DPS (sen) 6.5 6.5 6.5
Dividend Yield (%) 4.8 3.1 3.1
NTA/share (RM) 1.51 1.60 1.69
P/NTA (x) 0.9 1.3 1.2
Net Gearing (%) 74 87 98
ROA (%) 8.6 8.4 8.3
ROE (%) 10.1 9.6 9.3
Page 2 of 16
Background
Company profile
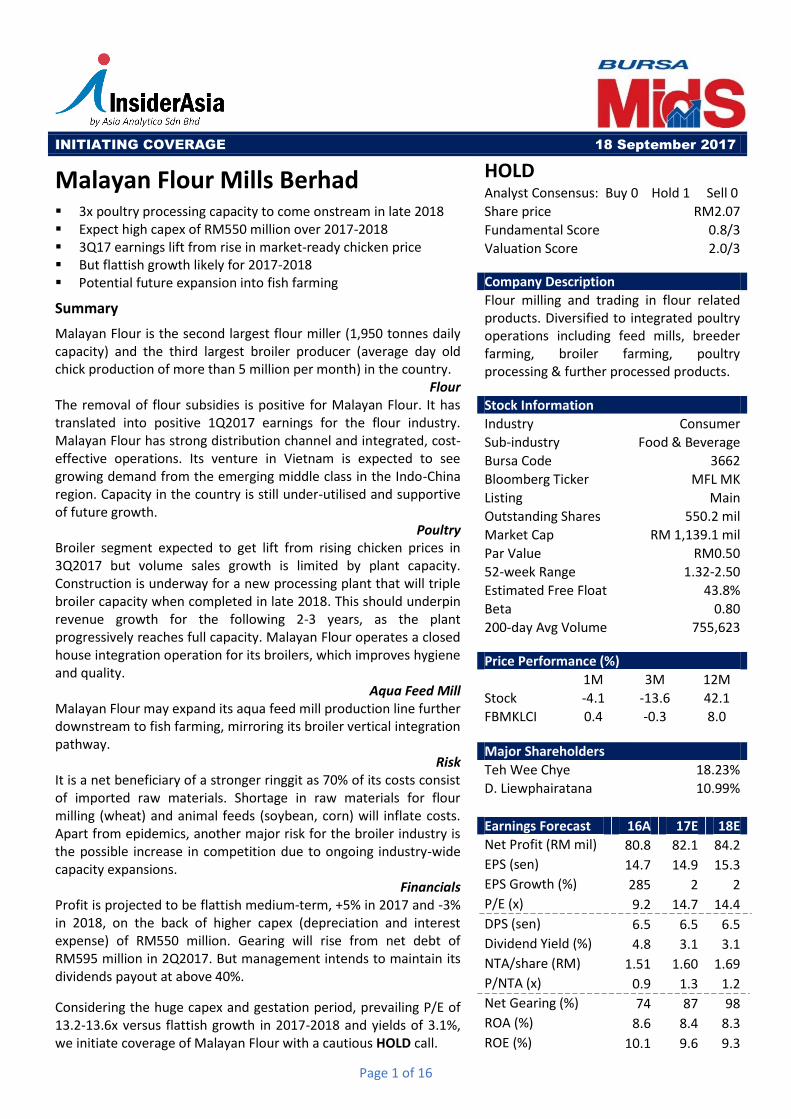
Malayan Flour Mills Berhad is based in Kuala Lumpur. It was established in 1961 and was listed on the Bursa Malaysia in 1968. Currently, Mr Teh Wee Chye is the Managing Director with 28 years of presence on the board. The company operates, primarily, in two businesses: flour and poultry. The former involves milling and sales of wheat flour, trading in grains and other related products, whereas the latter segment involves manufacturing and sales of animal feeds, farming, processing and sale of poultry products. In 2016, flour and poultry makes up 68% and 32% of its revenue, respectively. Malayan Flour is the second largest flour miller in the country, behind Federal Flour Mills of the PPB Group. Its flour products are sold in both industrial and retail/household packs. Currently, the company has milling operations in Malaysia, Vietnam and Indonesia. The company is also the third largest broiler producer in Malaysia, behind Leong Hup. Its poultry product range consists of dressed chicken, marinated chicken and further processed products. The bulk of the chicken is sold for domestic consumption. The company’s poultry farm practices closed house integration and is located in Manjung, Perak. Most recently, in June 2017, the company added 7 fish feed production lines to its business. The newly set up aquatic feed mills can utilise the by-products from flour milling and poultry processing. The company also engages in hedging and trading of raw materials for flour and animal feeds.
Report Outline (click to move to the section)
Background Page 2
Flour Segment------ Page 3
Poultry Segment--------------------------Page 5
Financial Analysis- Page 8
Management & Governance Page 10
Investment Risk Page 11
Valuation & Recommendation Page 12
Financial Summary Page 13
Appendix-----------------------------------Page 15
Corporate structure
Page 3 of 16
Flour milling
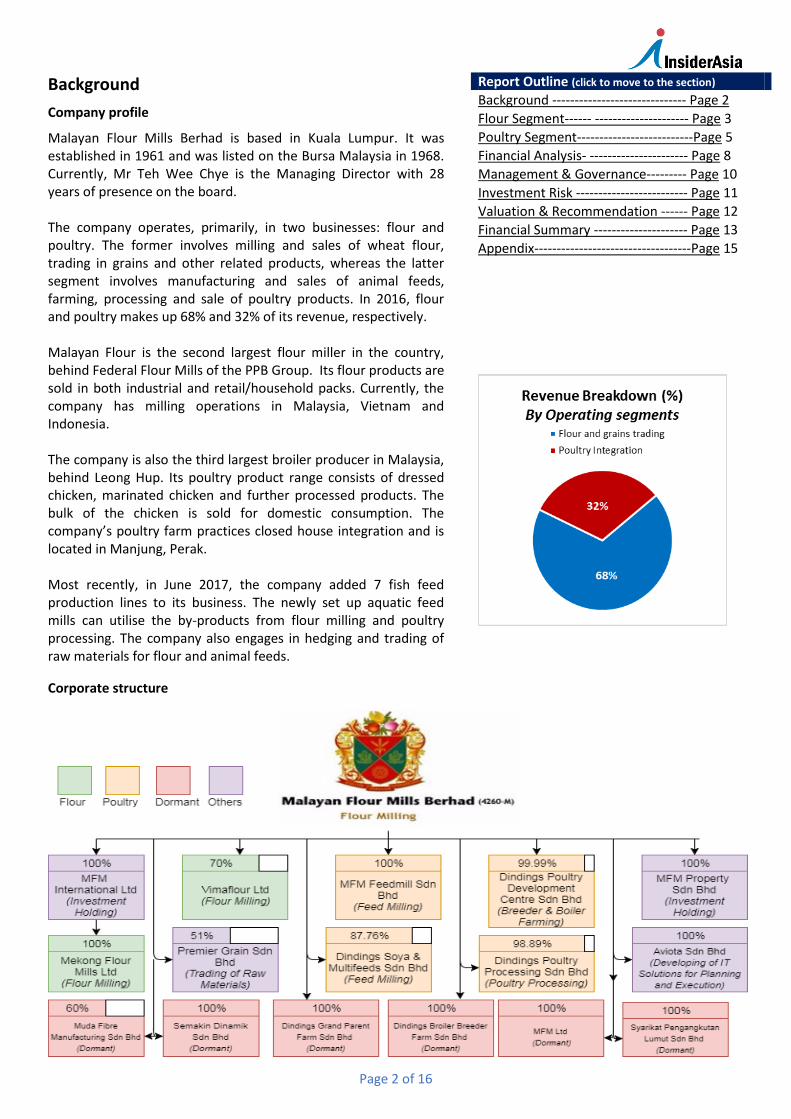
Business overview The company started as the pioneer in Malaysia’s wheat flour milling industry way back in 1966. Today, it operates flour mills in Lumut, Perak and Pasir Gudang, Johor, with a total milling capacity of 1,950 tonnes of wheat per day. The company has since expanded its operations to Cái Lân, Northern Vietnam and Bà Rịa-Vũng Tàu, Southern Vietnam, which have combined daily capacity of 2,700 tonnes. It has also entered into a joint venture, to tap into the Indonesian market in 2011. Some of its brand names include Red Roses and Bunga Cempaka. The company uses wheat as the main raw material for flour. Hence, it is dependent on wheat imports (70% denominated in USD) from countries like Australia, the Black Sea and Canada. Purchasing by bulk gives the company some level of bargaining power. By-products from the milling operations such as wheat pollard, germ and bran are processed and sold to external parties. A small portion of these is currently used by the company’s poultry and aqua feed mills.
Growth drivers Demand outlook from ASEAN markets is upbeat
Flour consumption in Vietnam and Indonesia is growing at a faster pace, thanks to their huge consumer base and relatively low flour consumption per capita. The emerging middle class will spur demand for flour products such as noodles, bread and cake. Currently, the total daily capacity for Malaysia and Vietnam is 1,950 tonnes and 2,700 tonnes, respectively. In annual monetary value (at full capacity), they translate to some RM1.1 billion and RM1.3 billion for Malaysia and Vietnam, respectively. The company’s utilisation rate at its Vietnam plant is still comparatively low and will be able to cater to growth for several years. Flour from the Vietnam plant is also exported to Laos, Cambodia and Philippines. The company is exploring other potential export markets within ASEAN.
Industry overview Volatile wheat price
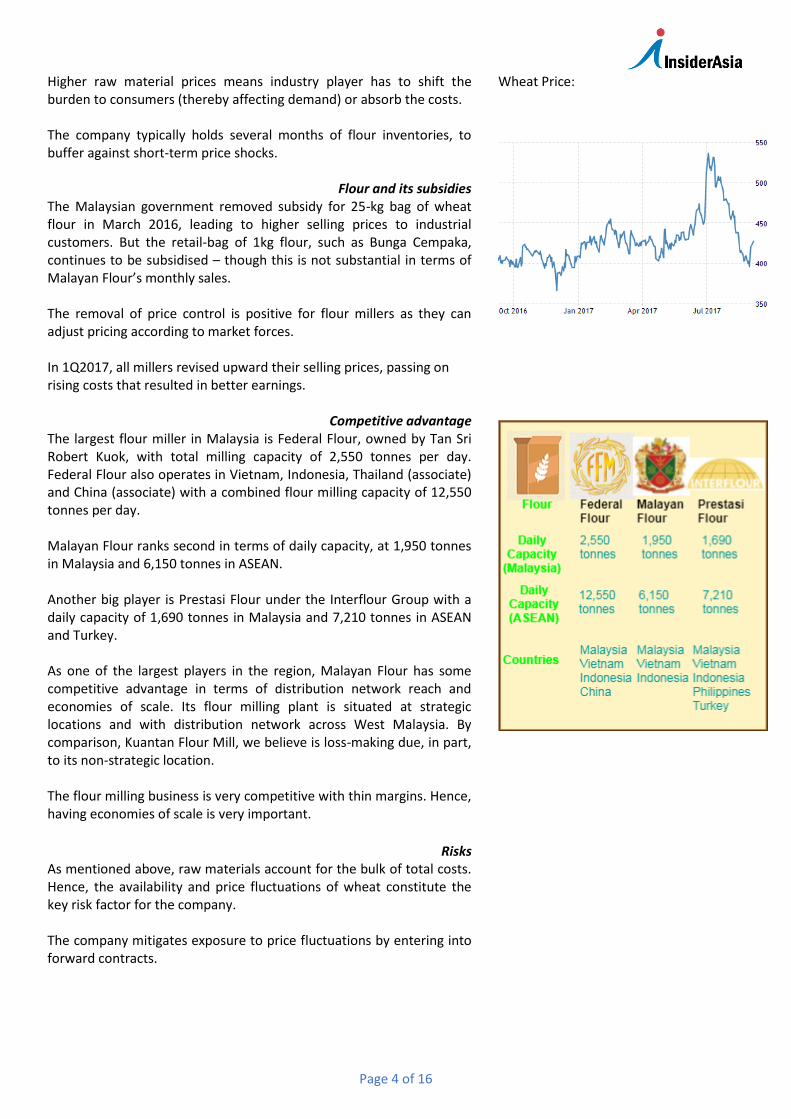
Wheat prices can be volatile, usually due to unpredictable weather patterns. For instance, sustained drought was feared to cause production shortfalls in spring crop supplies from the US Northern Great Plains. That resulted in a sharp rally in wheat futures prices, up nearly 30%, in mid-July 2017. Prices have since fallen back due, in part, to projections for bumper harvest in Russia.
Page 4 of 16
Higher raw material prices means industry player has to shift the burden to consumers (thereby affecting demand) or absorb the costs. The company typically holds several months of flour inventories, to buffer against short-term price shocks.
Flour and its subsidies The Malaysian government removed subsidy for 25-kg bag of wheat flour in March 2016, leading to higher selling prices to industrial customers. But the retail-bag of 1kg flour, such as Bunga Cempaka, continues to be subsidised – though this is not substantial in terms of Malayan Flour’s monthly sales. The removal of price control is positive for flour millers as they can adjust pricing according to market forces. In 1Q2017, all millers revised upward their selling prices, passing on rising costs that resulted in better earnings.
Competitive advantage
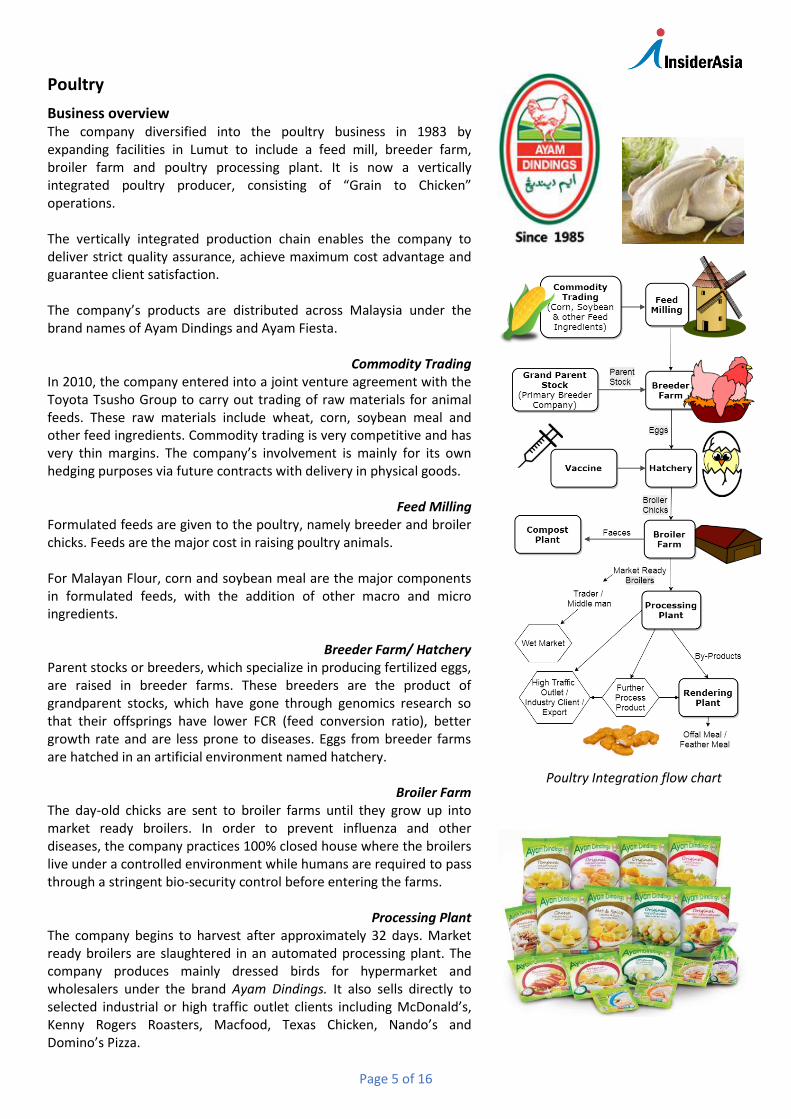
The largest flour miller in Malaysia is Federal Flour, owned by Tan Sri Robert Kuok, with total milling capacity of 2,550 tonnes per day. Federal Flour also operates in Vietnam, Indonesia, Thailand (associate) and China (associate) with a combined flour milling capacity of 12,550 tonnes per day. Malayan Flour ranks second in terms of daily capacity, at 1,950 tonnes in Malaysia and 6,150 tonnes in ASEAN. Another big player is Prestasi Flour under the Interflour Group with a daily capacity of 1,690 tonnes in Malaysia and 7,210 tonnes in ASEAN and Turkey. As one of the largest players in the region, Malayan Flour has some competitive advantage in terms of distribution network reach and economies of scale. Its flour milling plant is situated at strategic locations and with distribution network across West Malaysia. By comparison, Kuantan Flour Mill, we believe is loss-making due, in part, to its non-strategic location. The flour milling business is very competitive with thin margins. Hence, having economies of scale is very important.
Risks
As mentioned above, raw materials account for the bulk of total costs. Hence, the availability and price fluctuations of wheat constitute the key risk factor for the company. The company mitigates exposure to price fluctuations by entering into forward contracts.
Wheat Price:
Page 5 of 16
Poultry
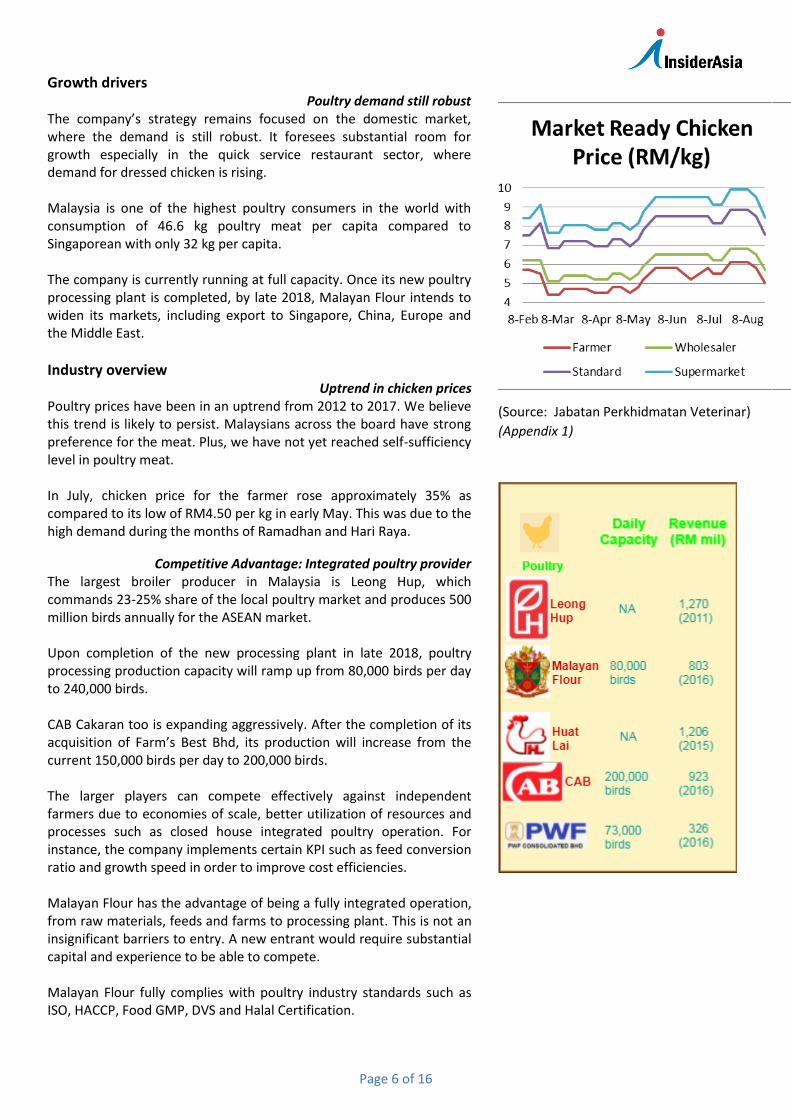
Business overview The company diversified into the poultry business in 1983 by expanding facilities in Lumut to include a feed mill, breeder farm, broiler farm and poultry processing plant. It is now a vertically integrated poultry producer, consisting of “Grain to Chicken” operations. The vertically integrated production chain enables the company to deliver strict quality assurance, achieve maximum cost advantage and guarantee client satisfaction. The company’s products are distributed across Malaysia under the brand names of Ayam Dindings and Ayam Fiesta.
Commodity Trading In 2010, the company entered into a joint venture agreement with the Toyota Tsusho Group to carry out trading of raw materials for animal feeds. These raw materials include wheat, corn, soybean meal and other feed ingredients. Commodity trading is very competitive and has very thin margins. The company’s involvement is mainly for its own hedging purposes via future contracts with delivery in physical goods.
Feed Milling Formulated feeds are given to the poultry, namely breeder and broiler chicks. Feeds are the major cost in raising poultry animals. For Malayan Flour, corn and soybean meal are the major components in formulated feeds, with the addition of other macro and micro ingredients.
Breeder Farm/ Hatchery Parent stocks or breeders, which specialize in producing fertilized eggs, are raised in breeder farms. These breeders are the product of grandparent stocks, which have gone through genomics research so that their offsprings have lower FCR (feed conversion ratio), better growth rate and are less prone to diseases. Eggs from breeder farms are hatched in an artificial environment named hatchery.
Broiler Farm The day-old chicks are sent to broiler farms until they grow up into market ready broilers. In order to prevent influenza and other diseases, the company practices 100% closed house where the broilers live under a controlled environment while humans are required to pass through a stringent bio-security control before entering the farms.
Processing Plant The company begins to harvest after approximately 32 days. Market ready broilers are slaughtered in an automated processing plant. The company produces mainly dressed birds for hypermarket and wholesalers under the brand Ayam Dindings. It also sells directly to selected industrial or high traffic outlet clients including McDonald’s, Kenny Rogers Roasters, Macfood, Texas Chicken, Nando’s and Domino’s Pizza.
Poultry Integration flow chart
Page 6 of 16
Growth drivers Poultry demand still robust
The company’s strategy remains focused on the domestic market, where the demand is still robust. It foresees substantial room for growth especially in the quick service restaurant sector, where demand for dressed chicken is rising. Malaysia is one of the highest poultry consumers in the world with consumption of 46.6 kg poultry meat per capita compared to Singaporean with only 32 kg per capita. The company is currently running at full capacity. Once its new poultry processing plant is completed, by late 2018, Malayan Flour intends to widen its markets, including export to Singapore, China, Europe and the Middle East.
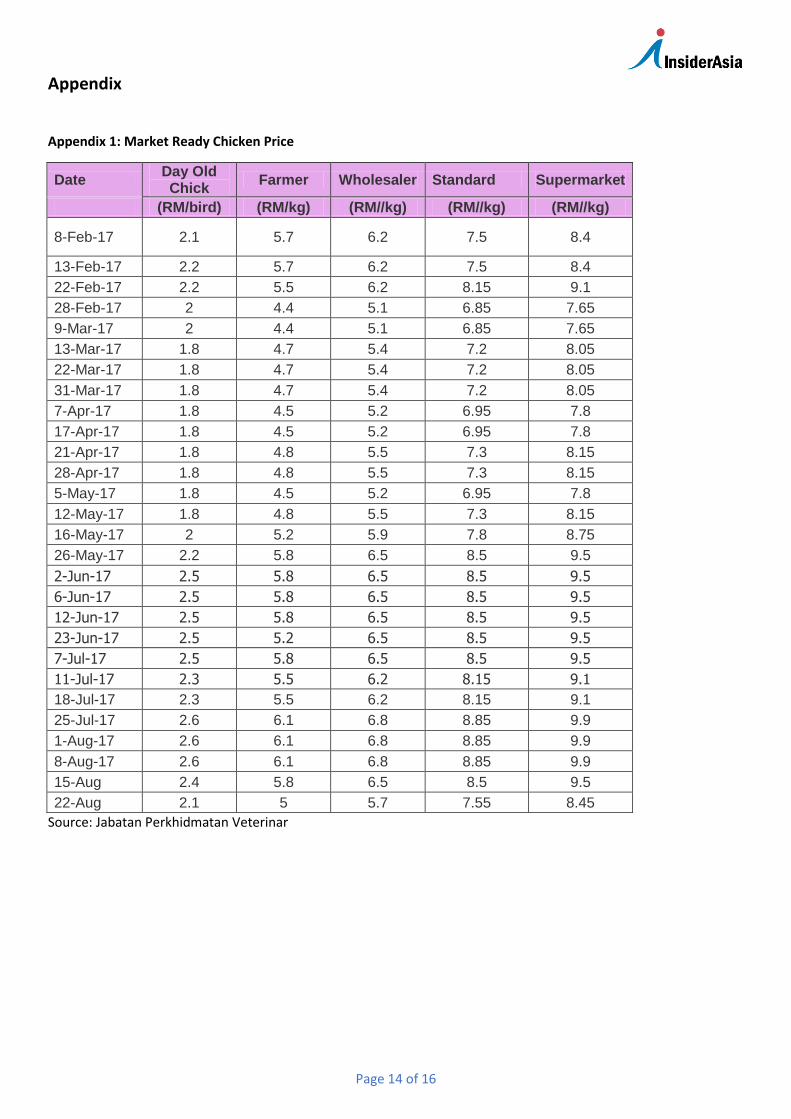
Industry overview Uptrend in chicken prices
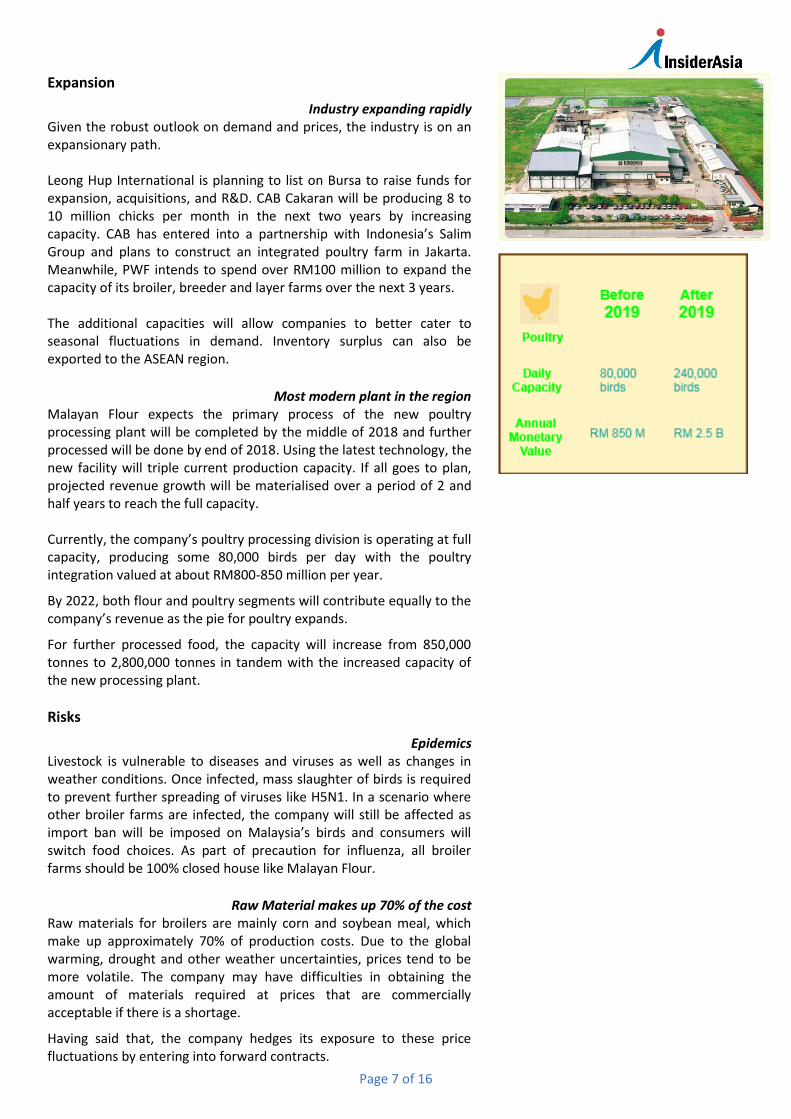
Poultry prices have been in an uptrend from 2012 to 2017. We believe this trend is likely to persist. Malaysians across the board have strong preference for the meat. Plus, we have not yet reached self-sufficiency level in poultry meat. In July, chicken price for the farmer rose approximately 35% as compared to its low of RM4.50 per kg in early May. This was due to the high demand during the months of Ramadhan and Hari Raya.
Competitive Advantage: Integrated poultry provider The largest broiler producer in Malaysia is Leong Hup, which commands 23-25% share of the local poultry market and produces 500 million birds annually for the ASEAN market. Upon completion of the new processing plant in late 2018, poultry processing production capacity will ramp up from 80,000 birds per day to 240,000 birds. CAB Cakaran too is expanding aggressively. After the completion of its acquisition of Farm’s Best Bhd, its production will increase from the current 150,000 birds per day to 200,000 birds.
The larger players can compete effectively against independent farmers due to economies of scale, better utilization of resources and processes such as closed house integrated poultry operation. For instance, the company implements certain KPI such as feed conversion ratio and growth speed in order to improve cost efficiencies. Malayan Flour has the advantage of being a fully integrated operation, from raw materials, feeds and farms to processing plant. This is not an insignificant barriers to entry. A new entrant would require substantial capital and experience to be able to compete. Malayan Flour fully complies with poultry industry standards such as ISO, HACCP, Food GMP, DVS and Halal Certification.
(Source: Jabatan Perkhidmatan Veterinar)
(Appendix 1)
Page 7 of 16
Expansion
Industry expanding rapidly Given the robust outlook on demand and prices, the industry is on an expansionary path. Leong Hup International is planning to list on Bursa to raise funds for expansion, acquisitions, and R&D. CAB Cakaran will be producing 8 to 10 million chicks per month in the next two years by increasing capacity. CAB has entered into a partnership with Indonesia’s Salim Group and plans to construct an integrated poultry farm in Jakarta. Meanwhile, PWF intends to spend over RM100 million to expand the capacity of its broiler, breeder and layer farms over the next 3 years. The additional capacities will allow companies to better cater to seasonal fluctuations in demand. Inventory surplus can also be exported to the ASEAN region.
Most modern plant in the region Malayan Flour expects the primary process of the new poultry processing plant will be completed by the middle of 2018 and further processed will be done by end of 2018. Using the latest technology, the new facility will triple current production capacity. If all goes to plan, projected revenue growth will be materialised over a period of 2 and half years to reach the full capacity. Currently, the company’s poultry processing division is operating at full capacity, producing some 80,000 birds per day with the poultry integration valued at about RM800-850 million per year.
By 2022, both flour and poultry segments will contribute equally to the company’s revenue as the pie for poultry expands.
For further processed food, the capacity will increase from 850,000 tonnes to 2,800,000 tonnes in tandem with the increased capacity of the new processing plant.
Risks
Epidemics Livestock is vulnerable to diseases and viruses as well as changes in weather conditions. Once infected, mass slaughter of birds is required to prevent further spreading of viruses like H5N1. In a scenario where other broiler farms are infected, the company will still be affected as import ban will be imposed on Malaysia’s birds and consumers will switch food choices. As part of precaution for influenza, all broiler farms should be 100% closed house like Malayan Flour.
Raw Material makes up 70% of the cost Raw materials for broilers are mainly corn and soybean meal, which make up approximately 70% of production costs. Due to the global warming, drought and other weather uncertainties, prices tend to be more volatile. The company may have difficulties in obtaining the amount of materials required at prices that are commercially acceptable if there is a shortage.
Having said that, the company hedges its exposure to these price fluctuations by entering into forward contracts.
Page 8 of 16
New product and market
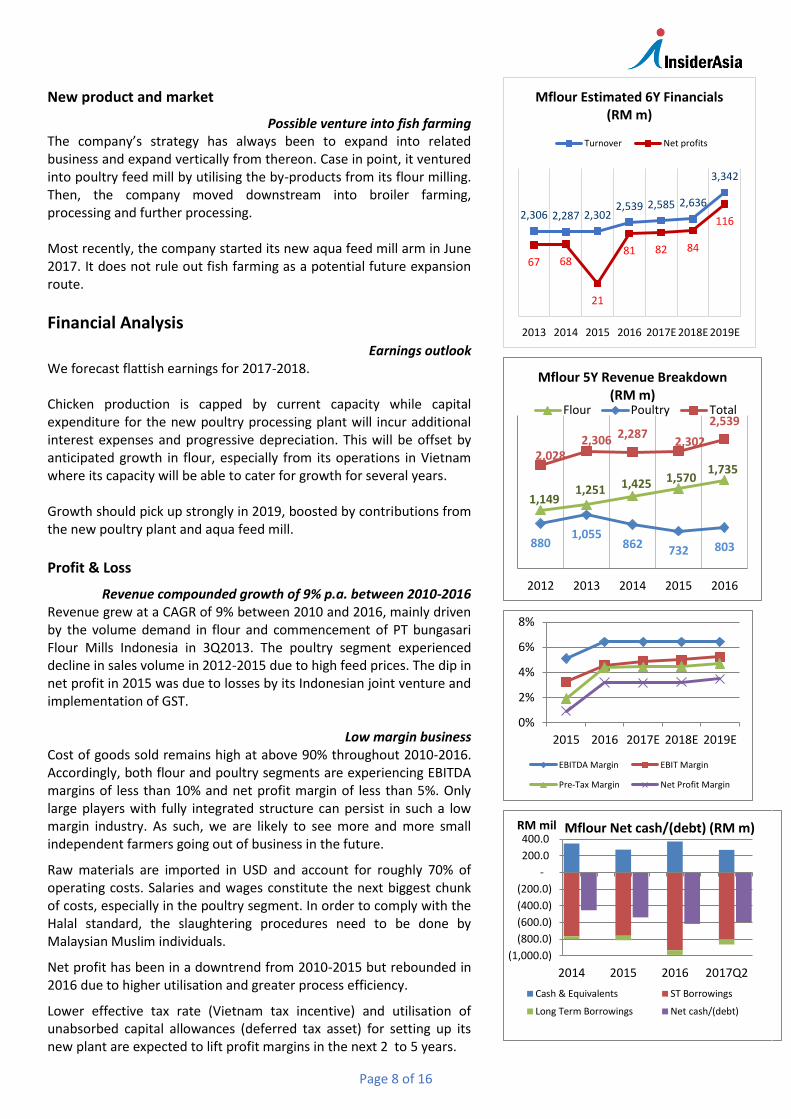
Possible venture into fish farming The company’s strategy has always been to expand into related business and expand vertically from thereon. Case in point, it ventured into poultry feed mill by utilising the by-products from its flour milling. Then, the company moved downstream into broiler farming, processing and further processing. Most recently, the company started its new aqua feed mill arm in June 2017. It does not rule out fish farming as a potential future expansion route.
Financial Analysis
Earnings outlook We forecast flattish earnings for 2017-2018. Chicken production is capped by current capacity while capital expenditure for the new poultry processing plant will incur additional interest expenses and progressive depreciation. This will be offset by anticipated growth in flour, especially from its operations in Vietnam where its capacity will be able to cater for growth for several years. Growth should pick up strongly in 2019, boosted by contributions from the new poultry plant and aqua feed mill.
Profit & Loss
Revenue compounded growth of 9% p.a. between 2010-2016 Revenue grew at a CAGR of 9% between 2010 and 2016, mainly driven by the volume demand in flour and commencement of PT bungasari Flour Mills Indonesia in 3Q2013. The poultry segment experienced decline in sales volume in 2012-2015 due to high feed prices. The dip in net profit in 2015 was due to losses by its Indonesian joint venture and implementation of GST.
Low margin business Cost of goods sold remains high at above 90% throughout 2010-2016. Accordingly, both flour and poultry segments are experiencing EBITDA margins of less than 10% and net profit margin of less than 5%. Only large players with fully integrated structure can persist in such a low margin industry. As such, we are likely to see more and more small independent farmers going out of business in the future.
Raw materials are imported in USD and account for roughly 70% of operating costs. Salaries and wages constitute the next biggest chunk of costs, especially in the poultry segment. In order to comply with the Halal standard, the slaughtering procedures need to be done by Malaysian Muslim individuals.
Net profit has been in a downtrend from 2010-2015 but rebounded in 2016 due to higher utilisation and greater process efficiency.
Lower effective tax rate (Vietnam tax incentive) and utilisation of unabsorbed capital allowances (deferred tax asset) for setting up its new plant are expected to lift profit margins in the next 2 to 5 years.
2,306 2,287 2,3022,539 2,585 2,636
3,342
67 68
21
81 82 84
116
2013 2014 2015 2016 2017E 2018E 2019E
Mflour Estimated 6Y Financials (RM m)
Turnover Net profits
1,149 1,251 1,425 1,570
1,735
8801,055
862732 803
2,0282,306 2,287
2,302
2,539
2012 2013 2014 2015 2016
Mflour 5Y Revenue Breakdown (RM m)
Flour Poultry Total
0%
2%
4%
6%
8%
2015 2016 2017E 2018E 2019E
EBITDA Margin EBIT Margin
Pre-Tax Margin Net Profit Margin
(1,000.0)
(800.0)
(600.0)
(400.0)
(200.0)
-
200.0
400.0
2014 2015 2016 2017Q2
RM mil Mflour Net cash/(debt) (RM m)
Cash & Equivalents ST Borrowings
Long Term Borrowings Net cash/(debt)
Page 9 of 16
Balance Sheet
Rising debt not a key issue
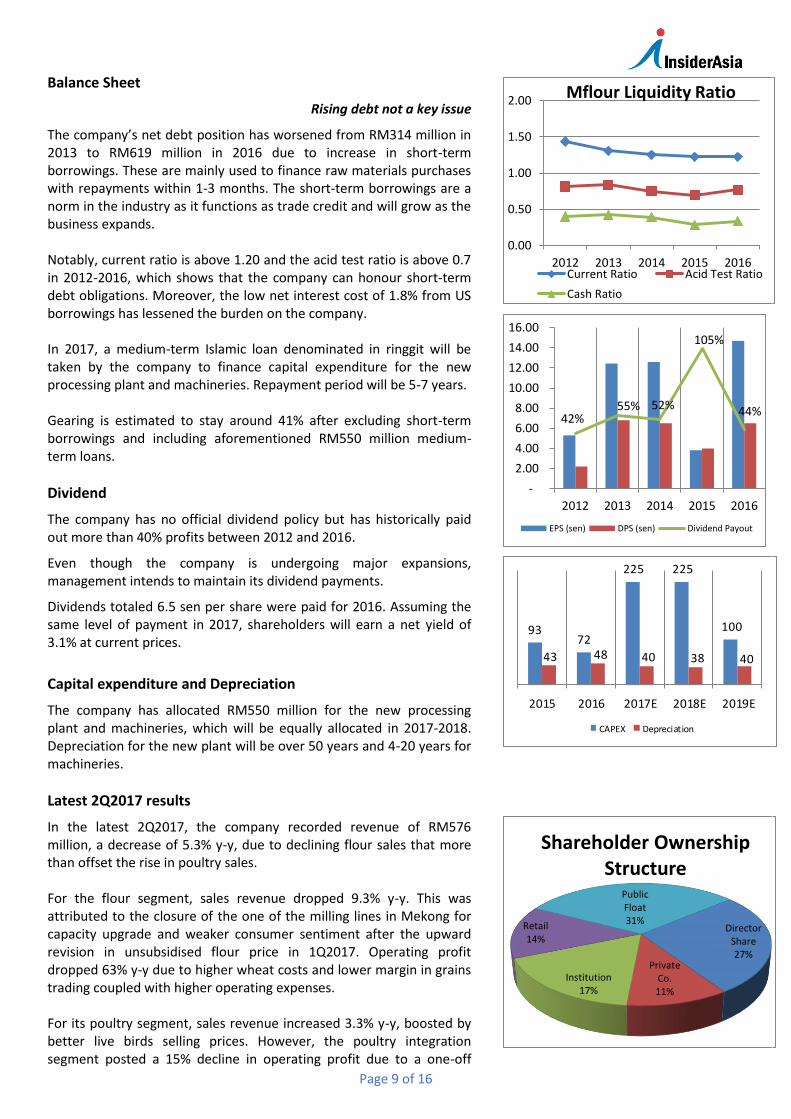
The company’s net debt position has worsened from RM314 million in 2013 to RM619 million in 2016 due to increase in short-term borrowings. These are mainly used to finance raw materials purchases with repayments within 1-3 months. The short-term borrowings are a norm in the industry as it functions as trade credit and will grow as the business expands. Notably, current ratio is above 1.20 and the acid test ratio is above 0.7 in 2012-2016, which shows that the company can honour short-term debt obligations. Moreover, the low net interest cost of 1.8% from US borrowings has lessened the burden on the company. In 2017, a medium-term Islamic loan denominated in ringgit will be taken by the company to finance capital expenditure for the new processing plant and machineries. Repayment period will be 5-7 years. Gearing is estimated to stay around 41% after excluding short-term borrowings and including aforementioned RM550 million medium-term loans.
Dividend
The company has no official dividend policy but has historically paid out more than 40% profits between 2012 and 2016.
Even though the company is undergoing major expansions, management intends to maintain its dividend payments.
Dividends totaled 6.5 sen per share were paid for 2016. Assuming the same level of payment in 2017, shareholders will earn a net yield of 3.1% at current prices.
Capital expenditure and Depreciation
The company has allocated RM550 million for the new processing plant and machineries, which will be equally allocated in 2017-2018. Depreciation for the new plant will be over 50 years and 4-20 years for machineries.
Latest 2Q2017 results
In the latest 2Q2017, the company recorded revenue of RM576 million, a decrease of 5.3% y-y, due to declining flour sales that more than offset the rise in poultry sales. For the flour segment, sales revenue dropped 9.3% y-y. This was attributed to the closure of the one of the milling lines in Mekong for capacity upgrade and weaker consumer sentiment after the upward revision in unsubsidised flour price in 1Q2017. Operating profit dropped 63% y-y due to higher wheat costs and lower margin in grains trading coupled with higher operating expenses. For its poultry segment, sales revenue increased 3.3% y-y, boosted by better live birds selling prices. However, the poultry integration segment posted a 15% decline in operating profit due to a one-off
0.00
0.50
1.00
1.50
2.00
2012 2013 2014 2015 2016
Mflour Liquidity Ratio
Current Ratio Acid Test Ratio
Cash Ratio
42%55% 52%
105%
44%
-
2.00
4.00
6.00
8.00
10.00
12.00
14.00
16.00
2012 2013 2014 2015 2016
EPS (sen) DPS (sen) Dividend Payout
9372
225 225
100
43 48 40 38 40
2015 2016 2017E 2018E 2019E
CAPEX Depreciation
Director Share27%
Private Co.11%
Institution17%
Retail14%
Public Float31%
Shareholder Ownership Structure
Page 10 of 16
insurance recovery of RM4.2 million in 2Q2016 and higher raw material costs.
Management & Governance
Management The company practises centralised management where policies, internal controls and decisions are made from the head office. A dedicated plant manager is assigned to each plant, reporting directly to HQ. Senior management of each division has hands-on experience for more than 20 years. The Chairman and Managing Director hold 7.4% and 18.23% stakes in the company, respectively. Management maximises shareholder wealth by carrying out compensation and incentive programs that are performance orientated. Each key executive’s salary and bonus are tied to KPI such as the feed conversion ratio for poultry division.
Corporate Governance The company practices good corporate governance. There is a clearly defined division of responsibilities between the Chairman and Managing Director.
The Board of Directors is chaired by Tan Sri Dato’ Seri Utama Arshad bin Ayub whereas the day-to-day management is led by Mr. Teh Wee Chye. The Board comprises of 2 executives and 7 non-executive directors, with various industry experiences ranging from agriculture, economics, banking, accounting, politics and law. 5 out of 7 non-executive directors fulfil independent criteria. The Board has established a proper remuneration, nomination and audit committees, chaired by different non-executive directors. The Managing Director sits on the remuneration committee to make recommendations on the remuneration of top executives.
Investment Risks
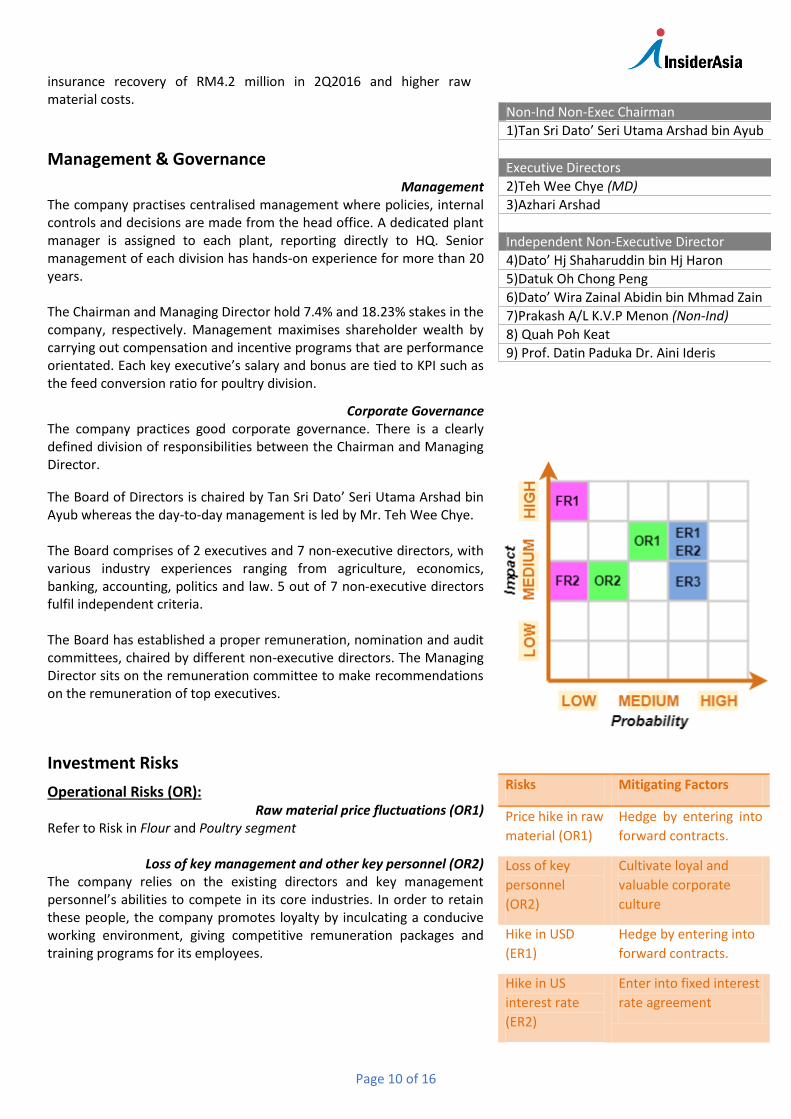
Operational Risks (OR): Raw material price fluctuations (OR1)
Refer to Risk in Flour and Poultry segment
Loss of key management and other key personnel (OR2) The company relies on the existing directors and key management personnel’s abilities to compete in its core industries. In order to retain these people, the company promotes loyalty by inculcating a conducive working environment, giving competitive remuneration packages and training programs for its employees.
Non-Ind Non-Exec Chairman
1)Tan Sri Dato’ Seri Utama Arshad bin Ayub
Executive Directors
2)Teh Wee Chye (MD)
3)Azhari Arshad
Independent Non-Executive Director
4)Dato’ Hj Shaharuddin bin Hj Haron
5)Datuk Oh Chong Peng
6)Dato’ Wira Zainal Abidin bin Mhmad Zain
7)Prakash A/L K.V.P Menon (Non-Ind)
8) Quah Poh Keat
9) Prof. Datin Paduka Dr. Aini Ideris
Risks Mitigating Factors
Price hike in raw
material (OR1)
Hedge by entering into
forward contracts.
Loss of key
personnel
(OR2)
Cultivate loyal and
valuable corporate
culture
Hike in USD
(ER1)
Hedge by entering into
forward contracts.
Hike in US
interest rate
(ER2)
Enter into fixed interest
rate agreement
Page 11 of 16
Economic Risks (ER): Exchange rate risk (ER1)
The company settles its material supplies in USD and receives 68% of its payments in ringgit. Therefore, a 5% strengthening of USD against ringgit will result in some RM6.85 million (7.4% in 2016) fall in earnings according to sensitivity analysis. To mitigate risks, the company undertakes hedging exercises – for example, all raw materials imports for 2017 have been hedged.
Interest rate risk (ER2) The company has large exposure to short-term borrowing from US banks as part of financing for its raw materials. Hike in US interest rate will dampen profitability and liquidity of the company. Moving forward, the medium-term loan for the new processing plant will also increase net gearing.
Competitive risk (ER3) Flour and chicken are commodities with no obvious differentiating factor. The customer could easily switch to the company’s competitor product without any switching costs. Any slight changes in consumer preference will have a huge impact to flour and chicken prices. Ongoing expansions in the poultry industry could result in greater competition.
Fundamental Risks:
Epidemics (FR1) Refer to Risk in Poultry segment
Political, economic and regulatory changes (FR2) Adverse developments in political, economic and regulatory conditions in or outside Malaysia and Vietnam could adversely affect the company’s financial and business prospects. These risks include war, global economic downturn and unfavourable changes in government policies relating to taxation, currency exchange controls and import ban.
Valuation & Recommendation
We are upbeat about the new poultry processing plant, which will triple current capacity, as well as the company’s potential entry into aquatic farming. We estimate net profit growth at +5% and -3% for the next two years, dampened by the huge capital expenditure in the new poultry processing plant. Capex is expected to normalise in 2019 barring any new development. Based on our estimates, the stock is trading at decent forward P/E of 13.3 times for 2017 and 13.8 times for 2018. By comparison, the average P/E of the poultry industry is now averaging at nearly 20.8 times. We also expect the company to maintain its dividends. Dividends are estimated to remain at 6.5 sen this year, giving a net yield of 3.1%. Considering the huge capital outlay in 2017-2018, the associated expansion and execution risks, vagaries in raw material prices and rising operating costs as well as unfavourable 2Q2017 results, we initiate coverage with a HOLD on the stock.
Risks Mitigating Factors
Competitive risk
(ER3)
Keep costs low by
being fully
integrated
Epidemics
(FR1)
Practise fully
integrated close
house system
Unfavourable
changes in
government policies
(tax, currency,
import ban) (FR2)
Diversify across
various countries
SWOT Analysis
Strengths
1. Practise closed house integration
2. Strong network effect
3. Cost efficient in a thin margin business
4. Strong KPI orientated business model
5. Diversified client base
6. Experienced management
Weaknesses
1. Rising gearing for capex
2. Competitive, fragmented industry
3. Suffer from strengthening USD
4. Business sales fluctuate with the flour
and broiler cycles (no say in pricing)
Opportunities
1. Removal of subsidies/control in flour
and poultry
2. Growing customer base and low flour
consumption per capita in Vietnam/Indo
3. Surge in demand during festive seasons
4. Removal of export ban in poultry
Threats
1. Shortage in wheat and animal feeds
2. Excessive competition from other
poultry players amid expansion fever
3. Hike in US interest rate
4. Labour dependent for Halal procedure
Page 12 of 16
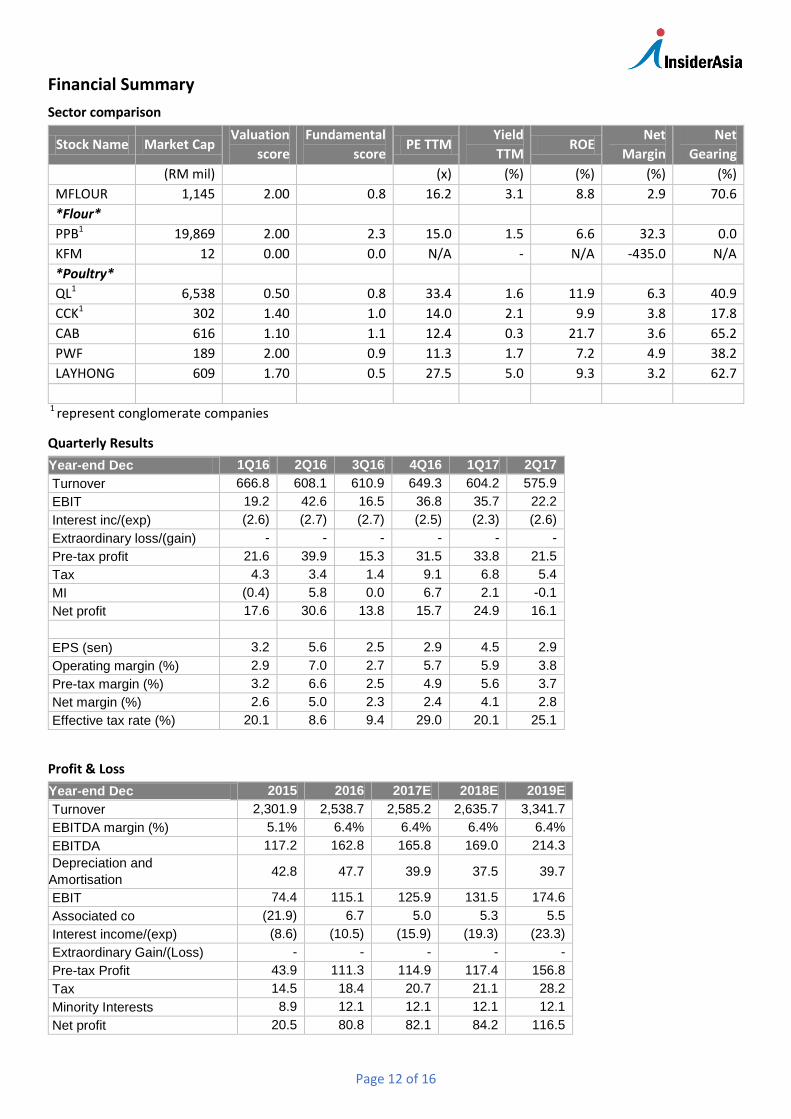
Financial Summary
Sector comparison
Stock Name Market Cap Valuation
score
Fundamental
score PE TTM
Yield
TTM ROE
Net
Margin
Net
Gearing
(RM mil) (x) (%) (%) (%) (%)
MFLOUR 1,145 2.00 0.8 16.2 3.1 8.8 2.9 70.6
*Flour*
PPB1 19,869 2.00 2.3 15.0 1.5 6.6 32.3 0.0
KFM 12 0.00 0.0 N/A - N/A -435.0 N/A
*Poultry*
QL1 6,538 0.50 0.8 33.4 1.6 11.9 6.3 40.9
CCK1 302 1.40 1.0 14.0 2.1 9.9 3.8 17.8
CAB 616 1.10 1.1 12.4 0.3 21.7 3.6 65.2
PWF 189 2.00 0.9 11.3 1.7 7.2 4.9 38.2
LAYHONG 609 1.70 0.5 27.5 5.0 9.3 3.2 62.7
1 represent conglomerate companies
Quarterly Results
Year-end Dec 1Q16 2Q16 3Q16 4Q16 1Q17 2Q17
Turnover 666.8 608.1 610.9 649.3 604.2 575.9
EBIT 19.2 42.6 16.5 36.8 35.7 22.2
Interest inc/(exp) (2.6) (2.7) (2.7) (2.5) (2.3) (2.6)
Extraordinary loss/(gain) - - - - - -
Pre-tax profit 21.6 39.9 15.3 31.5 33.8 21.5
Tax 4.3 3.4 1.4 9.1 6.8 5.4
MI (0.4) 5.8 0.0 6.7 2.1 -0.1
Net profit 17.6 30.6 13.8 15.7 24.9 16.1
EPS (sen) 3.2 5.6 2.5 2.9 4.5 2.9
Operating margin (%) 2.9 7.0 2.7 5.7 5.9 3.8
Pre-tax margin (%) 3.2 6.6 2.5 4.9 5.6 3.7
Net margin (%) 2.6 5.0 2.3 2.4 4.1 2.8
Effective tax rate (%) 20.1 8.6 9.4 29.0 20.1 25.1
Profit & Loss
Year-end Dec 2015 2016 2017E 2018E 2019E
Turnover 2,301.9 2,538.7 2,585.2 2,635.7 3,341.7
EBITDA margin (%) 5.1% 6.4% 6.4% 6.4% 6.4%
EBITDA 117.2 162.8 165.8 169.0 214.3
Depreciation and
Amortisation 42.8 47.7 39.9 37.5 39.7
EBIT 74.4 115.1 125.9 131.5 174.6
Associated co (21.9) 6.7 5.0 5.3 5.5
Interest income/(exp) (8.6) (10.5) (15.9) (19.3) (23.3)
Extraordinary Gain/(Loss) - - - - -
Pre-tax Profit 43.9 111.3 114.9 117.4 156.8
Tax 14.5 18.4 20.7 21.1 28.2
Minority Interests 8.9 12.1 12.1 12.1 12.1
Net profit 20.5 80.8 82.1 84.2 116.5
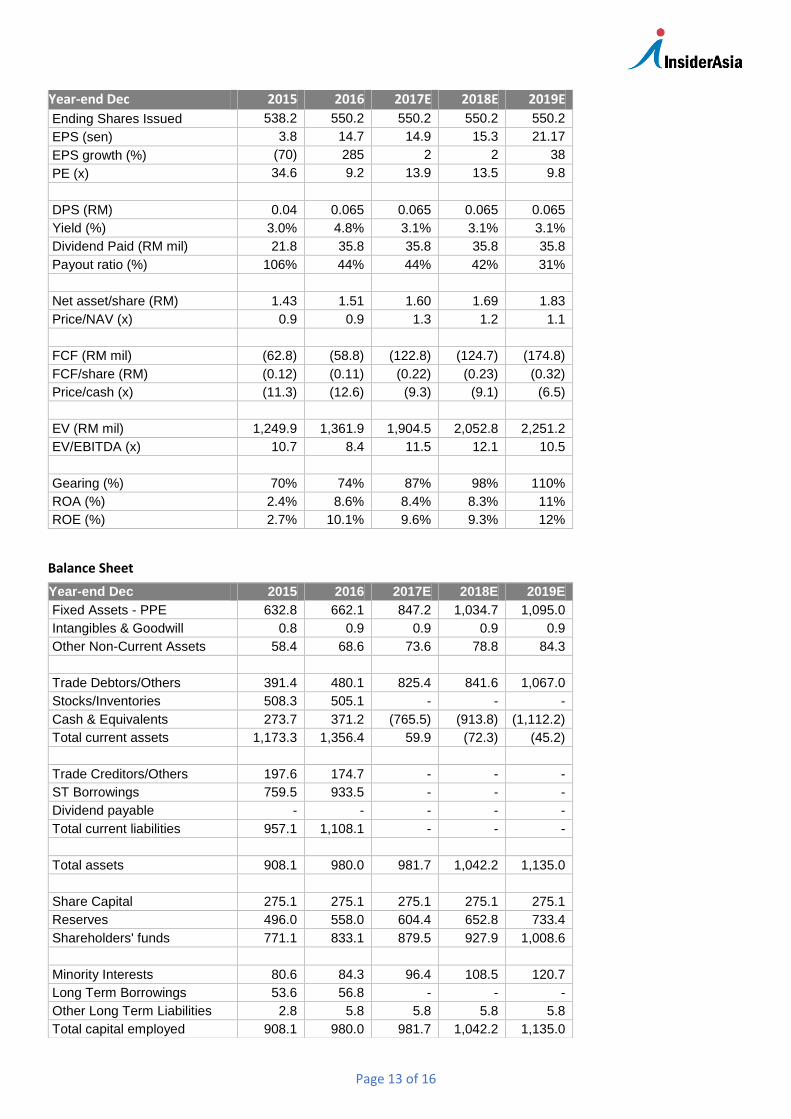
Page 13 of 16
Year-end Dec 2015 2016 2017E 2018E 2019E
Ending Shares Issued 538.2 550.2 550.2 550.2 550.2
EPS (sen) 3.8 14.7 14.9 15.3 21.17
EPS growth (%) (70) 285 2 2 38
PE (x) 34.6 9.2 13.9 13.5 9.8
DPS (RM) 0.04 0.065 0.065 0.065 0.065
Yield (%) 3.0% 4.8% 3.1% 3.1% 3.1%
Dividend Paid (RM mil) 21.8 35.8 35.8 35.8 35.8
Payout ratio (%) 106% 44% 44% 42% 31%
Net asset/share (RM) 1.43 1.51 1.60 1.69 1.83
Price/NAV (x) 0.9 0.9 1.3 1.2 1.1
FCF (RM mil) (62.8) (58.8) (122.8) (124.7) (174.8)
FCF/share (RM) (0.12) (0.11) (0.22) (0.23) (0.32)
Price/cash (x) (11.3) (12.6) (9.3) (9.1) (6.5)
EV (RM mil) 1,249.9 1,361.9 1,904.5 2,052.8 2,251.2
EV/EBITDA (x) 10.7 8.4 11.5 12.1 10.5
Gearing (%) 70% 74% 87% 98% 110%
ROA (%) 2.4% 8.6% 8.4% 8.3% 11%
ROE (%) 2.7% 10.1% 9.6% 9.3% 12%
Balance Sheet
Year-end Dec 2015 2016 2017E 2018E 2019E
Fixed Assets - PPE 632.8 662.1 847.2 1,034.7 1,095.0
Intangibles & Goodwill 0.8 0.9 0.9 0.9 0.9
Other Non-Current Assets 58.4 68.6 73.6 78.8 84.3
Trade Debtors/Others 391.4 480.1 825.4 841.6 1,067.0
Stocks/Inventories 508.3 505.1 - - -
Cash & Equivalents 273.7 371.2 (765.5) (913.8) (1,112.2)
Total current assets 1,173.3 1,356.4 59.9 (72.3) (45.2)
Trade Creditors/Others 197.6 174.7 - - -
ST Borrowings 759.5 933.5 - - -
Dividend payable - - - - -
Total current liabilities 957.1 1,108.1 - - -
Total assets 908.1 980.0 981.7 1,042.2 1,135.0
Share Capital 275.1 275.1 275.1 275.1 275.1
Reserves 496.0 558.0 604.4 652.8 733.4
Shareholders' funds 771.1 833.1 879.5 927.9 1,008.6
Minority Interests 80.6 84.3 96.4 108.5 120.7
Long Term Borrowings 53.6 56.8 - - -
Other Long Term Liabilities 2.8 5.8 5.8 5.8 5.8
Total capital employed 908.1 980.0 981.7 1,042.2 1,135.0
Page 14 of 16
Appendix
Appendix 1: Market Ready Chicken Price
Date Day Old Chick
Farmer Wholesaler Standard Supermarket
(RM/bird) (RM/kg) (RM//kg) (RM//kg) (RM//kg)
8-Feb-17 2.1 5.7 6.2 7.5 8.4
13-Feb-17 2.2 5.7 6.2 7.5 8.4
22-Feb-17 2.2 5.5 6.2 8.15 9.1
28-Feb-17 2 4.4 5.1 6.85 7.65
9-Mar-17 2 4.4 5.1 6.85 7.65
13-Mar-17 1.8 4.7 5.4 7.2 8.05
22-Mar-17 1.8 4.7 5.4 7.2 8.05
31-Mar-17 1.8 4.7 5.4 7.2 8.05
7-Apr-17 1.8 4.5 5.2 6.95 7.8
17-Apr-17 1.8 4.5 5.2 6.95 7.8
21-Apr-17 1.8 4.8 5.5 7.3 8.15
28-Apr-17 1.8 4.8 5.5 7.3 8.15
5-May-17 1.8 4.5 5.2 6.95 7.8
12-May-17 1.8 4.8 5.5 7.3 8.15
16-May-17 2 5.2 5.9 7.8 8.75
26-May-17 2.2 5.8 6.5 8.5 9.5
2-Jun-17 2.5 5.8 6.5 8.5 9.5
6-Jun-17 2.5 5.8 6.5 8.5 9.5
12-Jun-17 2.5 5.8 6.5 8.5 9.5
23-Jun-17 2.5 5.2 6.5 8.5 9.5
7-Jul-17 2.5 5.8 6.5 8.5 9.5
11-Jul-17 2.3 5.5 6.2 8.15 9.1
18-Jul-17 2.3 5.5 6.2 8.15 9.1
25-Jul-17 2.6 6.1 6.8 8.85 9.9
1-Aug-17 2.6 6.1 6.8 8.85 9.9
8-Aug-17 2.6 6.1 6.8 8.85 9.9
15-Aug 2.4 5.8 6.5 8.5 9.5
22-Aug 2.1 5 5.7 7.55 8.45
Source: Jabatan Perkhidmatan Veterinar
Page 15 of 16
Price Performance
0
0.5
1
1.5
2
2.5
3
1,500
1,550
1,600
1,650
1,700
1,750
1,800
1,850
Sep
-16
Oct
-16
No
v-1
6
Dec
-16
Jan
-17
Feb
-17
Mar
-17
Ap
r-1
7
May
-17
Jun
-17
Jul-
17
Au
g-1
7
1Y Stock Performance vs FBMKLCI
FBM KLCI MFLOUR (RM)
-20%
-10%
0%
10%
20%
30%
40%
50%
60%
70%
80%
Relative 1Y Stock Peformance
FBM KLCI (%) MFLOUR (%)
Fundamental and Valuation Scores
Explanatory Notes
Valuation Score
The score is a snapshot of the stock’s attractiveness in terms of valuations calculated based on historical numbers.
The score ranges from 0-3. A Valuation Score of 0 means valuations are not attractive and a score of 3 means
valuations are attractive. The relative weights of the score are customisable by the user according to his preference.
Fundamental Score
The score is a snapshot of the company’s profitability and balance sheet strength derived from historical numbers.
The score ranges from 0-3. A score of 0 means weak fundamentals and a score of 3 means strong fundamentals. The
relative weights of the score are customisable by the user according to his preference.
Page 16 of 16
Disclaimer
This report is intended for Malaysian residents only and has been prepared without regard to your specific
investment objectives, financial situation or particular needs.
Neither the information nor any opinion expressed constitutes an offer, or an invitation to make an offer, to buy or
sell any securities or related financial instruments.
The information herein is obtained from various sources and we do not guarantee its accuracy or completeness.
All views and advice are given in good faith but without legal responsibility. You should not regard the reports as a
substitute for the exercise of your own judgment and you should seek professional advice for your specific
investment needs. Any opinions expressed in this report are subject to change without notice.
Our shareholders, directors and employees may have positions in or may be materially interested in any of the
stocks. We may also have or have had dealings with or may provide or have provided content services to the
companies mentioned in the reports.
This report has been prepared by Asia Analytica Sdn Bhd pursuant to the Mid and Small Cap Research Scheme (MidS)
administered by Bursa Malaysia Berhad. This report has been produced independent of any influence from Bursa
Malaysia Berhad or the subject company. Bursa Malaysia Berhad and its group of companies disclaim any and all
liability, howsoever arising, out of or in relation to the administration of the MidS and/or this report.
For other research reports under the MidS, please visit Bursa Marketplace at http://www.bursamids.com.
Linda Koh
603-77218060
Asia Analytica Sdn Bhd
Suite 3D, Level 3, Menara KLK
1 Jalan PJU7/6 Mutiara Damansara
47810 Petaling Jaya
Selangor
Malaysia