Embed Size (px)
Citation preview
InSAR-derived Crustal Deformation and Reverse Fault Motion of the 2017 Iran-Iraq Earthquake in the Northwestern Part of the Zagros Orogenic Belt
Tomokazu Kobayashi, Yu Morishita, Hiroshi Yarai and Satoshi Fujiwara
(Published online: 5 March 2018)
Abstract
An inland earthquake with a moment magnitude of 7.3 occurred in western Iran / eastern Iraq on November 12,
2017. Applying an interferometric SAR (InSAR) analysis using ALOS-2 SAR data to the earthquake, we detected the
crustal deformation in the northwestern part of the Zagros orogenic belt. We successfully obtained quasi-up-down and
quasi-east-west displacement components by combining two sets of InSAR data. The results show that uplift occurred in
the western part of the source region with ~90 cm at most, while in the east subsidence occurred with ~30 cm at most.
Most of the source region moved westward with ~50 cm at most. Our preferred fault model shows that the observations
can be accounted for by a nearly pure reverse fault motion with a slight dextral motion on a low-angle fault plane
dipping northeast.
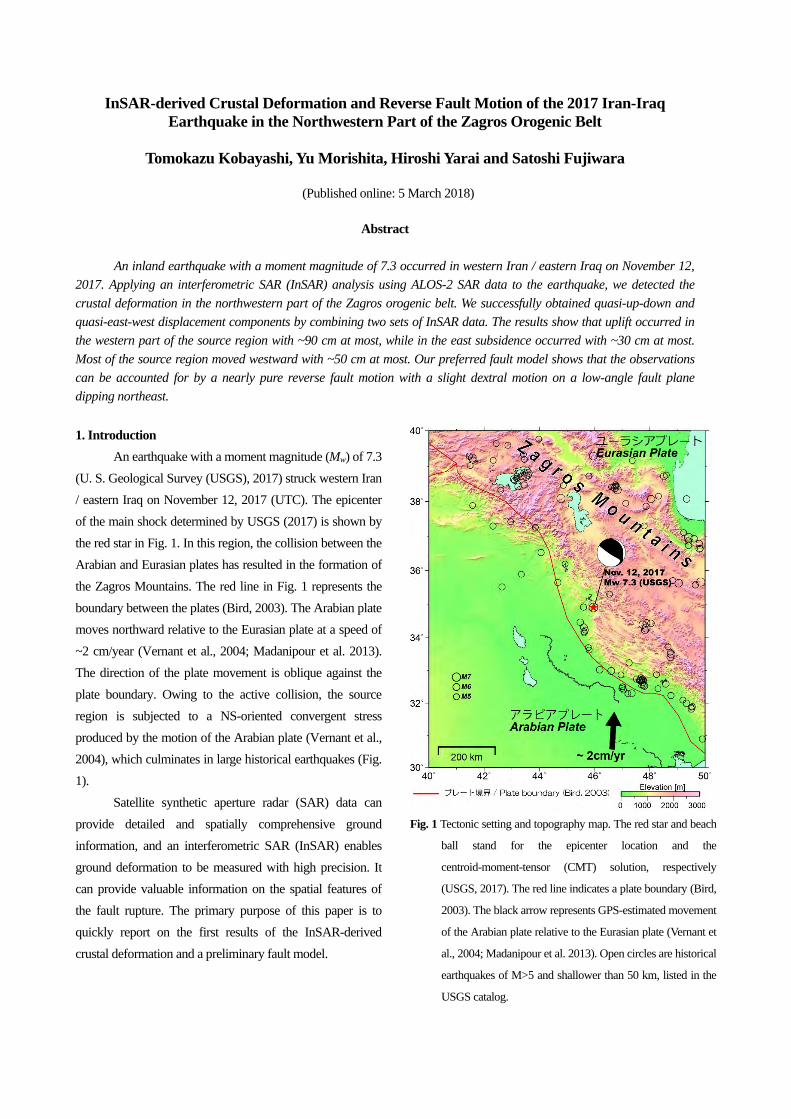
1. Introduction
An earthquake with a moment magnitude (Mw) of 7.3
(U. S. Geological Survey (USGS), 2017) struck western Iran
/ eastern Iraq on November 12, 2017 (UTC). The epicenter
of the main shock determined by USGS (2017) is shown by
the red star in Fig. 1. In this region, the collision between the
Arabian and Eurasian plates has resulted in the formation of
the Zagros Mountains. The red line in Fig. 1 represents the
boundary between the plates (Bird, 2003). The Arabian plate
moves northward relative to the Eurasian plate at a speed of
~2 cm/year (Vernant et al., 2004; Madanipour et al. 2013).
The direction of the plate movement is oblique against the
plate boundary. Owing to the active collision, the source
region is subjected to a NS-oriented convergent stress
produced by the motion of the Arabian plate (Vernant et al.,
2004), which culminates in large historical earthquakes (Fig.
1).
Satellite synthetic aperture radar (SAR) data can
provide detailed and spatially comprehensive ground
information, and an interferometric SAR (InSAR) enables
ground deformation to be measured with high precision. It
can provide valuable information on the spatial features of
the fault rupture. The primary purpose of this paper is to
quickly report on the first results of the InSAR-derived
crustal deformation and a preliminary fault model.
Fig. 1 Tectonic setting and topography map. The red star and beach
ball stand for the epicenter location and the
centroid-moment-tensor (CMT) solution, respectively
(USGS, 2017). The red line indicates a plate boundary (Bird,
2003). The black arrow represents GPS-estimated movement
of the Arabian plate relative to the Eurasian plate (Vernant et
al., 2004; Madanipour et al. 2013). Open circles are historical
earthquakes of M>5 and shallower than 50 km, listed in the
USGS catalog.
2. SAR Data Analysis
A Japanese L-band synthetic aperture radar satellite,
known as the Advanced Land Observing Satellite 2
(ALOS-2), made emergency observations for the purpose of
detecting crustal deformation using InSAR. The images used
in the study are listed in Table 1. We analyzed the
ScanSAR-ScanSAR interferometry. The ScanSAR data we
processed were produced by a full-aperture method in which
range/azimuth compression was performed for the data
whose gaps between neighboring bursts were filled with
zeroes. The original interferograms were contaminated by a
long-wavelength phase change noise of unknown causes,
maybe due in part to the ionospheric effect. To pick out the
crustal deformation only, we modeled the noises by
estimating a phase curve with a second-order polynomial
from far-field data, and subtracted the estimated phase curve
from the original interferograms.
Table 1 Analyzed ALOS-2 images.
Observation Date
Aug. 09, 2016 Nov. 14, 2017
Oct. 04, 2017 Nov. 15, 2017
Flight Direction
Ascending Descending
Beam Direction
Right Right
Incidence Angle
47° 47°
Observation Mode
ScanSAR- ScanSAR
ScanSAR- ScanSAR
Perpendicular Baseline
—70 m +160 m
Figure # Fig. 2 Fig. 3
We processed the ALOS-2 data with GSISAR
software (Fujiwara and Tobita, 1999; Tobita et al., 1999;
Fujiwara et al., 1999; Tobita, 2003), and used ASTER
GDEM for the InSAR analyses.
3. Ground displacement detected by InSAR
3.1 Line-of-sight component
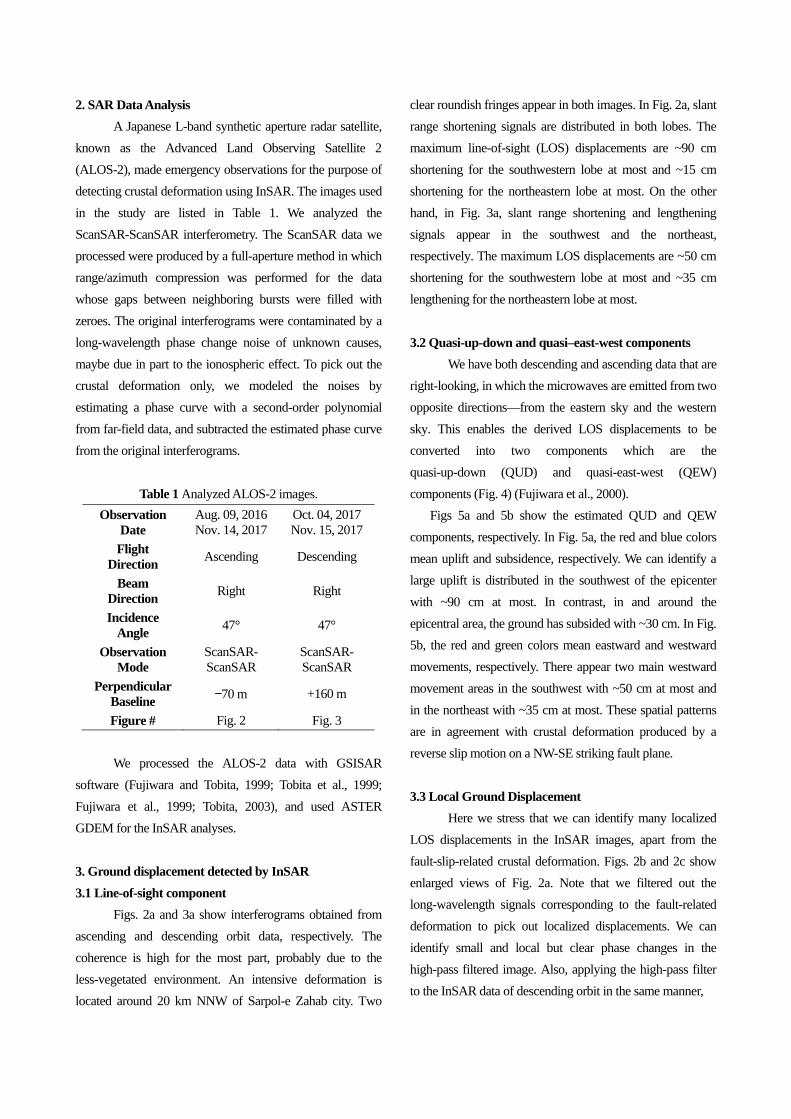
Figs. 2a and 3a show interferograms obtained from
ascending and descending orbit data, respectively. The
coherence is high for the most part, probably due to the
less-vegetated environment. An intensive deformation is
located around 20 km NNW of Sarpol-e Zahab city. Two
clear roundish fringes appear in both images. In Fig. 2a, slant
range shortening signals are distributed in both lobes. The
maximum line-of-sight (LOS) displacements are ~90 cm
shortening for the southwestern lobe at most and ~15 cm
shortening for the northeastern lobe at most. On the other
hand, in Fig. 3a, slant range shortening and lengthening
signals appear in the southwest and the northeast,
respectively. The maximum LOS displacements are ~50 cm
shortening for the southwestern lobe at most and ~35 cm
lengthening for the northeastern lobe at most.
3.2 Quasi-up-down and quasi–east-west components
We have both descending and ascending data that are
right-looking, in which the microwaves are emitted from two
opposite directions—from the eastern sky and the western
sky. This enables the derived LOS displacements to be
converted into two components which are the
quasi-up-down (QUD) and quasi-east-west (QEW)
components (Fig. 4) (Fujiwara et al., 2000).
Figs 5a and 5b show the estimated QUD and QEW
components, respectively. In Fig. 5a, the red and blue colors
mean uplift and subsidence, respectively. We can identify a
large uplift is distributed in the southwest of the epicenter
with ~90 cm at most. In contrast, in and around the
epicentral area, the ground has subsided with ~30 cm. In Fig.
5b, the red and green colors mean eastward and westward
movements, respectively. There appear two main westward
movement areas in the southwest with ~50 cm at most and
in the northeast with ~35 cm at most. These spatial patterns
are in agreement with crustal deformation produced by a
reverse slip motion on a NW-SE striking fault plane.
3.3 Local Ground Displacement
Here we stress that we can identify many localized
LOS displacements in the InSAR images, apart from the
fault-slip-related crustal deformation. Figs. 2b and 2c show
enlarged views of Fig. 2a. Note that we filtered out the
long-wavelength signals corresponding to the fault-related
deformation to pick out localized displacements. We can
identify small and local but clear phase changes in the
high-pass filtered image. Also, applying the high-pass filter
to the InSAR data of descending orbit in the same manner,
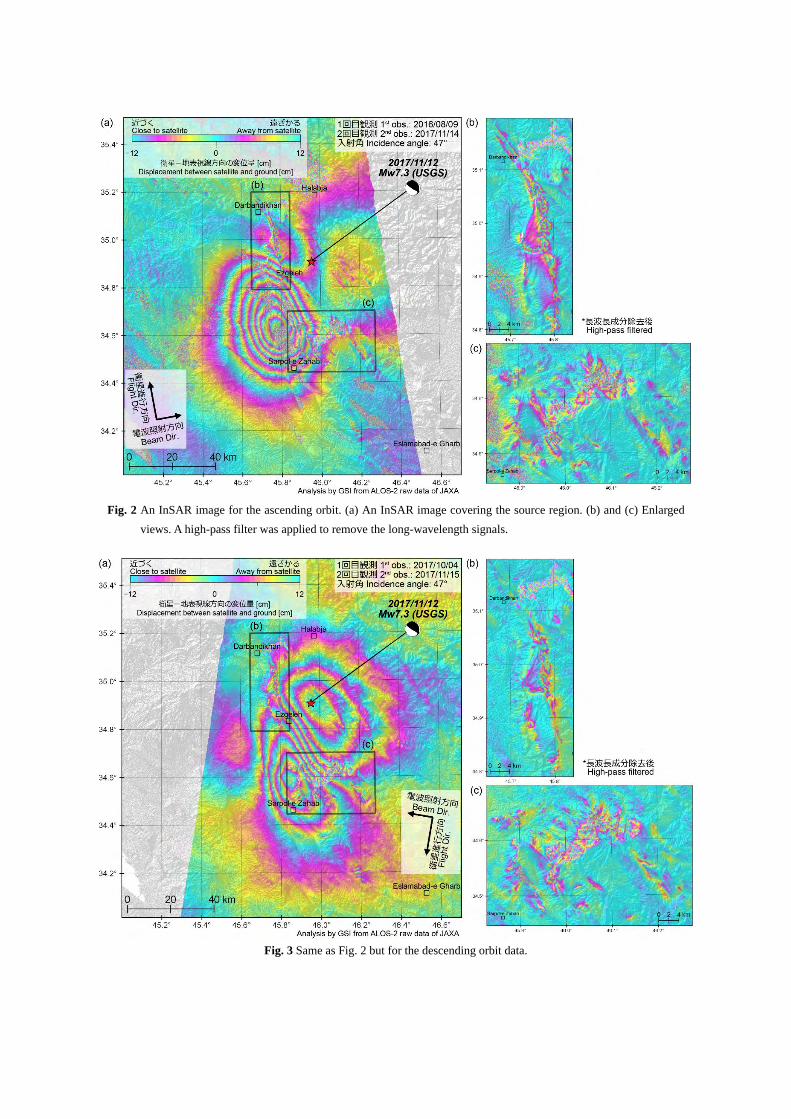
Fig. 2 An InSAR image for the ascending orbit. (a) An InSAR image covering the source region. (b) and (c) Enlarged
views. A high-pass filter was applied to remove the long-wavelength signals.
Fig. 3 Same as Fig. 2 but for the descending orbit data.
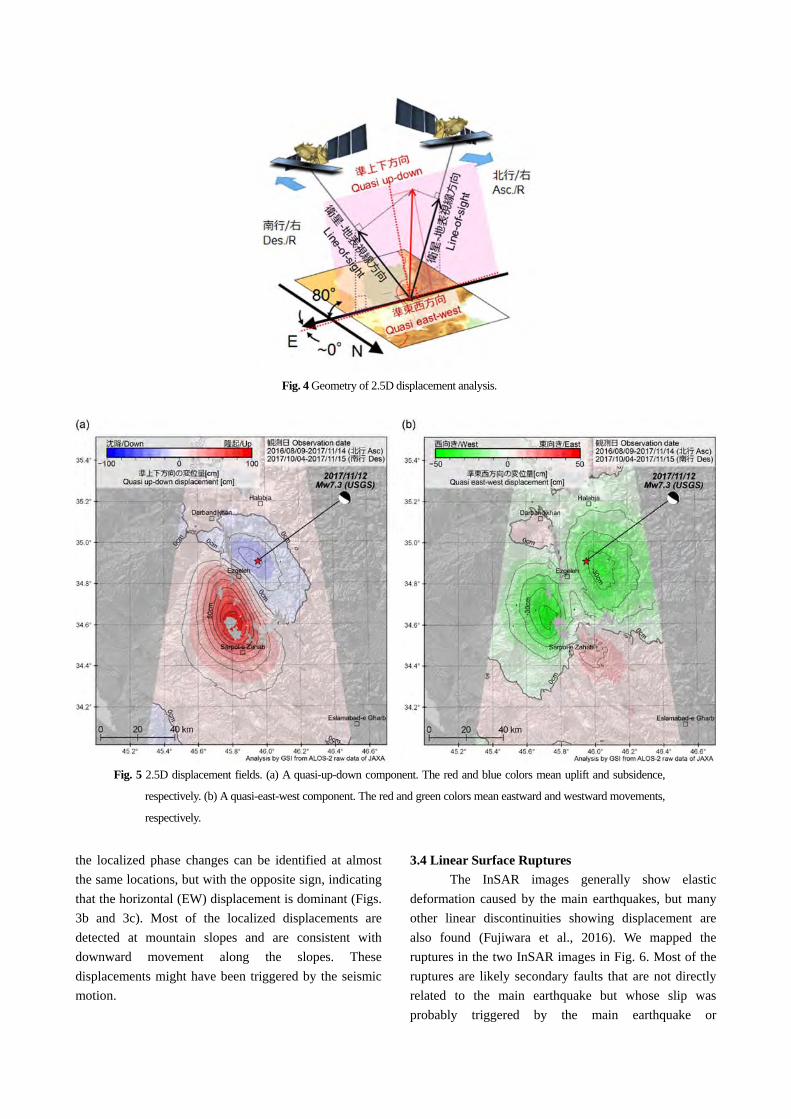
Fig. 4 Geometry of 2.5D displacement analysis.
Fig. 5 2.5D displacement fields. (a) A quasi-up-down component. The red and blue colors mean uplift and subsidence,
respectively. (b) A quasi-east-west component. The red and green colors mean eastward and westward movements,
respectively.
the localized phase changes can be identified at almost
the same locations, but with the opposite sign, indicating
that the horizontal (EW) displacement is dominant (Figs.
3b and 3c). Most of the localized displacements are
detected at mountain slopes and are consistent with
downward movement along the slopes. These
displacements might have been triggered by the seismic
motion.
3.4 Linear Surface Ruptures
The InSAR images generally show elastic
deformation caused by the main earthquakes, but many
other linear discontinuities showing displacement are
also found (Fujiwara et al., 2016). We mapped the
ruptures in the two InSAR images in Fig. 6. Most of the
ruptures are likely secondary faults that are not directly
related to the main earthquake but whose slip was
probably triggered by the main earthquake or
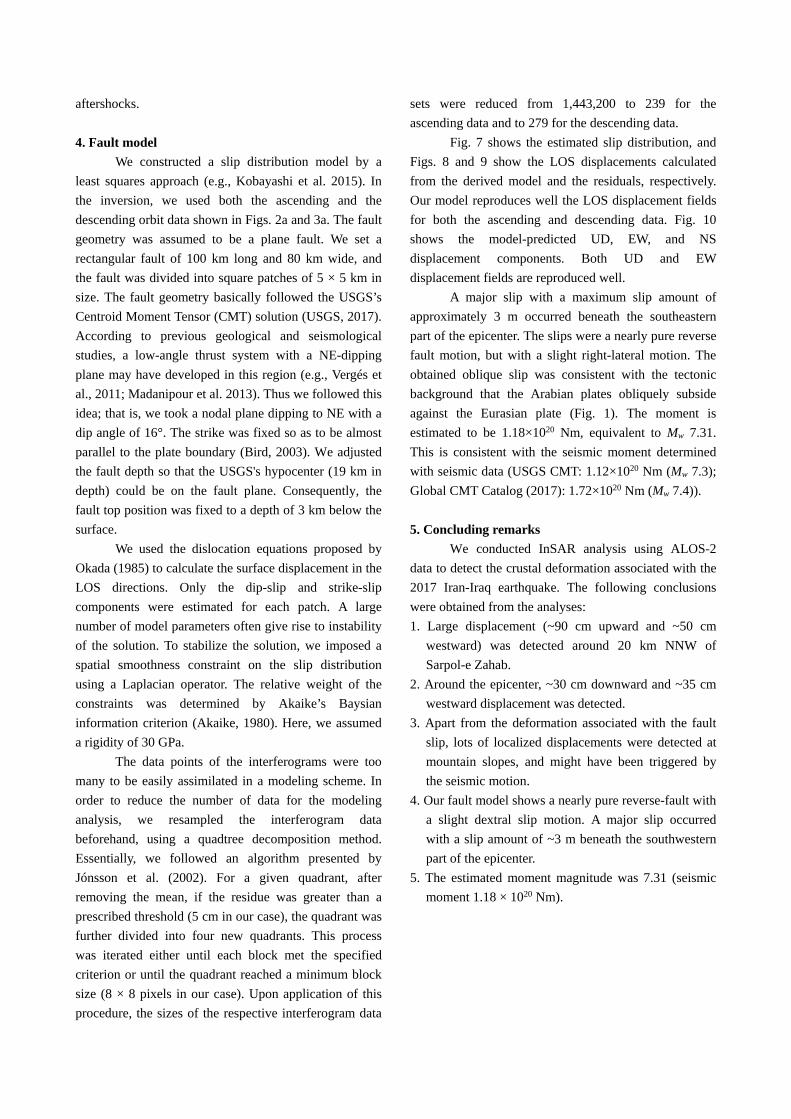
aftershocks.
4. Fault model
We constructed a slip distribution model by a
least squares approach (e.g., Kobayashi et al. 2015). In
the inversion, we used both the ascending and the
descending orbit data shown in Figs. 2a and 3a. The fault
geometry was assumed to be a plane fault. We set a
rectangular fault of 100 km long and 80 km wide, and
the fault was divided into square patches of 5 × 5 km in
size. The fault geometry basically followed the USGS’s
Centroid Moment Tensor (CMT) solution (USGS, 2017).
According to previous geological and seismological
studies, a low-angle thrust system with a NE-dipping
plane may have developed in this region (e.g., Vergés et
al., 2011; Madanipour et al. 2013). Thus we followed this
idea; that is, we took a nodal plane dipping to NE with a
dip angle of 16°. The strike was fixed so as to be almost
parallel to the plate boundary (Bird, 2003). We adjusted
the fault depth so that the USGS's hypocenter (19 km in
depth) could be on the fault plane. Consequently, the
fault top position was fixed to a depth of 3 km below the
surface.
We used the dislocation equations proposed by
Okada (1985) to calculate the surface displacement in the
LOS directions. Only the dip-slip and strike-slip
components were estimated for each patch. A large
number of model parameters often give rise to instability
of the solution. To stabilize the solution, we imposed a
spatial smoothness constraint on the slip distribution
using a Laplacian operator. The relative weight of the
constraints was determined by Akaike’s Baysian
information criterion (Akaike, 1980). Here, we assumed
a rigidity of 30 GPa.
The data points of the interferograms were too
many to be easily assimilated in a modeling scheme. In
order to reduce the number of data for the modeling
analysis, we resampled the interferogram data
beforehand, using a quadtree decomposition method.
Essentially, we followed an algorithm presented by
Jónsson et al. (2002). For a given quadrant, after
removing the mean, if the residue was greater than a
prescribed threshold (5 cm in our case), the quadrant was
further divided into four new quadrants. This process
was iterated either until each block met the specified
criterion or until the quadrant reached a minimum block
size (8 × 8 pixels in our case). Upon application of this
procedure, the sizes of the respective interferogram data
sets were reduced from 1,443,200 to 239 for the
ascending data and to 279 for the descending data.
Fig. 7 shows the estimated slip distribution, and
Figs. 8 and 9 show the LOS displacements calculated
from the derived model and the residuals, respectively.
Our model reproduces well the LOS displacement fields
for both the ascending and descending data. Fig. 10
shows the model-predicted UD, EW, and NS
displacement components. Both UD and EW
displacement fields are reproduced well.
A major slip with a maximum slip amount of
approximately 3 m occurred beneath the southeastern
part of the epicenter. The slips were a nearly pure reverse
fault motion, but with a slight right-lateral motion. The
obtained oblique slip was consistent with the tectonic
background that the Arabian plates obliquely subside
against the Eurasian plate (Fig. 1). The moment is
estimated to be 1.18×10²⁰ Nm, equivalent to Mw 7.31.
This is consistent with the seismic moment determined
with seismic data (USGS CMT: 1.12×10²⁰ Nm (Mw 7.3);
Global CMT Catalog (2017): 1.72×10²⁰ Nm (Mw 7.4)).
5. Concluding remarks
We conducted InSAR analysis using ALOS-2
data to detect the crustal deformation associated with the
2017 Iran-Iraq earthquake. The following conclusions
were obtained from the analyses:
1. Large displacement (~90 cm upward and ~50 cm
westward) was detected around 20 km NNW of
Sarpol-e Zahab.
2. Around the epicenter, ~30 cm downward and ~35 cm
westward displacement was detected.
3. Apart from the deformation associated with the fault
slip, lots of localized displacements were detected at
mountain slopes, and might have been triggered by
the seismic motion.
4. Our fault model shows a nearly pure reverse-fault with
a slight dextral slip motion. A major slip occurred
with a slip amount of ~3 m beneath the southwestern
part of the epicenter.
5. The estimated moment magnitude was 7.31 (seismic
moment 1.18 × 10²⁰ Nm).
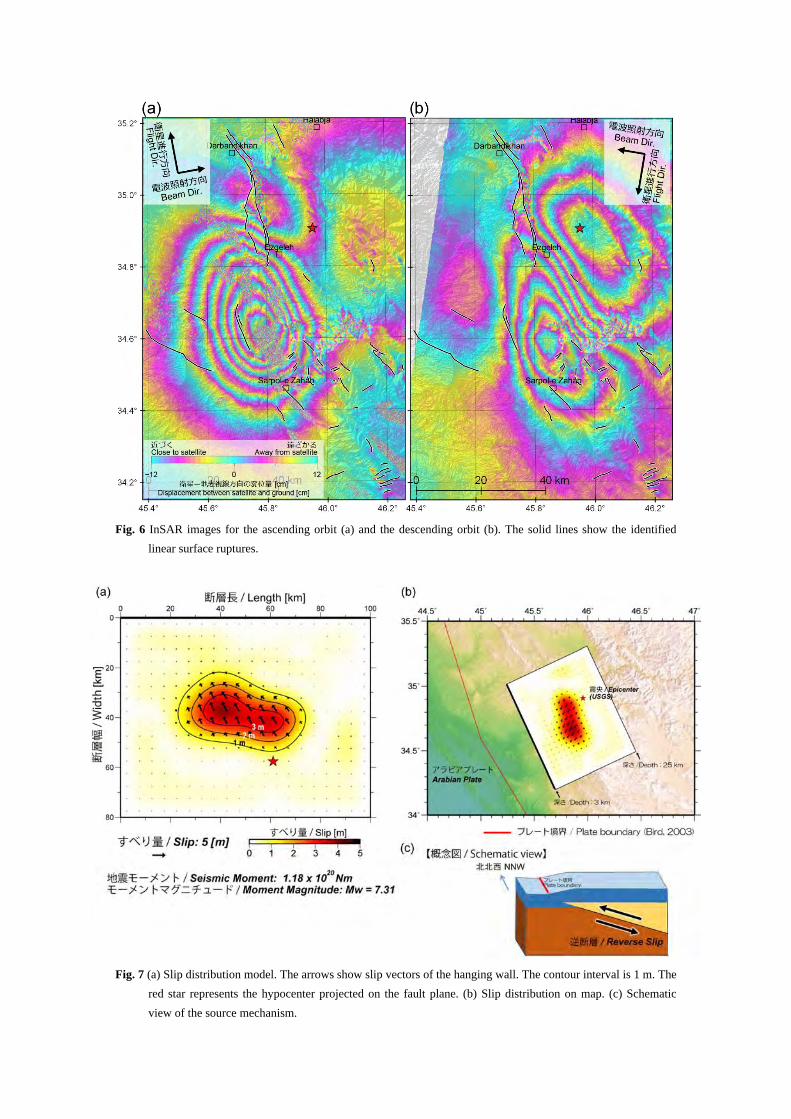
Fig. 6 InSAR images for the ascending orbit (a) and the descending orbit (b). The solid lines show the identified
linear surface ruptures.
Fig. 7 (a) Slip distribution model. The arrows show slip vectors of the hanging wall. The contour interval is 1 m. The
red star represents the hypocenter projected on the fault plane. (b) Slip distribution on map. (c) Schematic
view of the source mechanism.
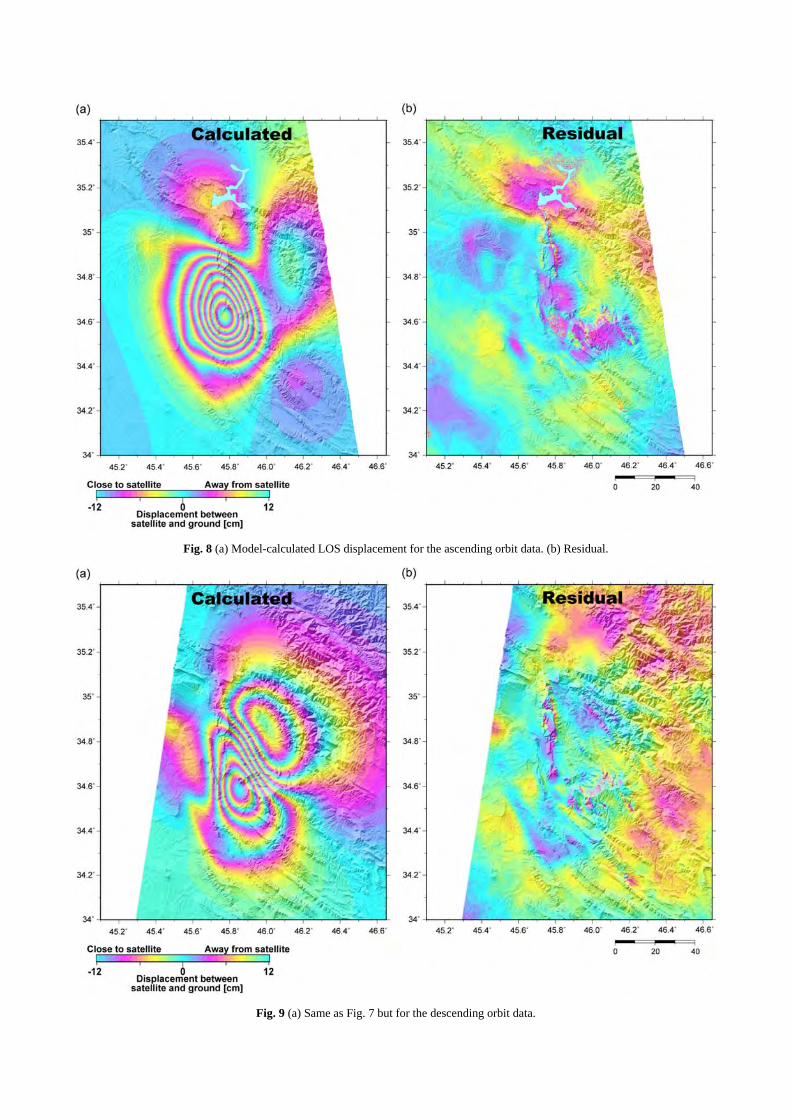
Fig. 8 (a) Model-calculated LOS displacement for the ascending orbit data. (b) Residual.
Fig. 9 (a) Same as Fig. 7 but for the descending orbit data.
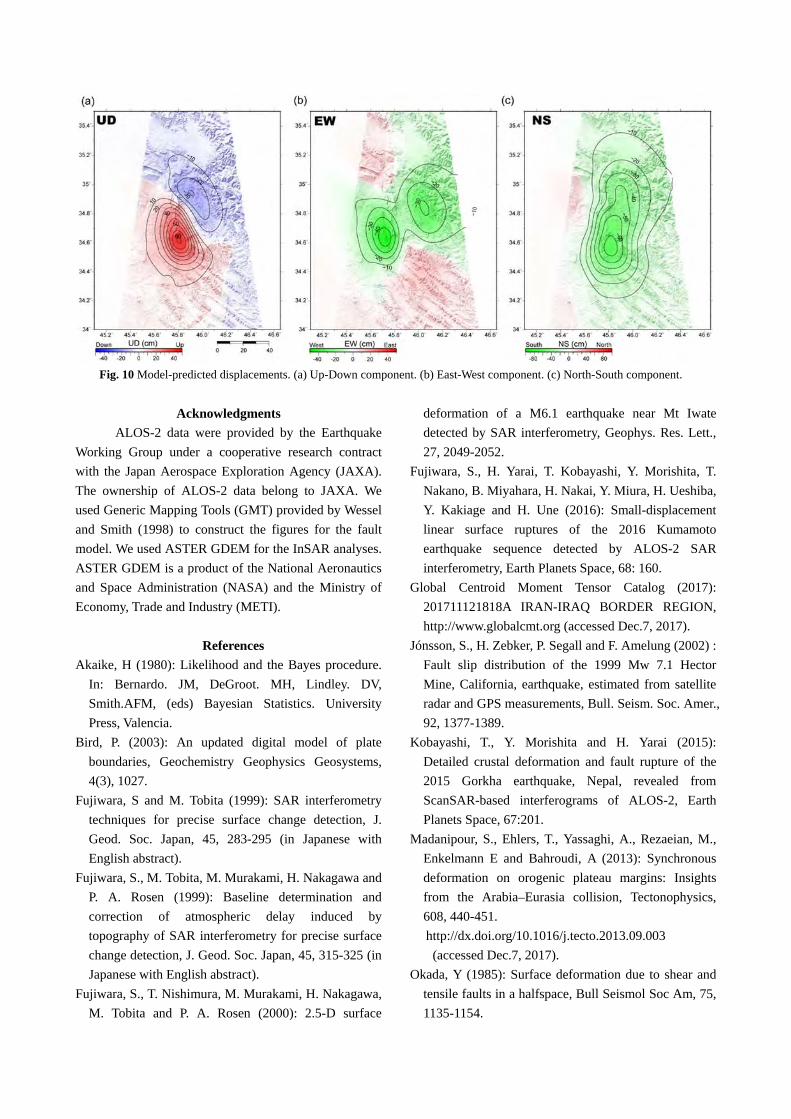
Fig. 10 Model-predicted displacements. (a) Up-Down component. (b) East-West component. (c) North-South component.
Acknowledgments
ALOS-2 data were provided by the Earthquake
Working Group under a cooperative research contract
with the Japan Aerospace Exploration Agency (JAXA).
The ownership of ALOS-2 data belong to JAXA. We
used Generic Mapping Tools (GMT) provided by Wessel
and Smith (1998) to construct the figures for the fault
model. We used ASTER GDEM for the InSAR analyses.
ASTER GDEM is a product of the National Aeronautics
and Space Administration (NASA) and the Ministry of
Economy, Trade and Industry (METI).
References
Akaike, H (1980): Likelihood and the Bayes procedure.
In: Bernardo. JM, DeGroot. MH, Lindley. DV,
Smith.AFM, (eds) Bayesian Statistics. University
Press, Valencia. Bird, P. (2003): An updated digital model of plate
boundaries, Geochemistry Geophysics Geosystems,
4(3), 1027.
Fujiwara, S and M. Tobita (1999): SAR interferometry
techniques for precise surface change detection, J.
Geod. Soc. Japan, 45, 283-295 (in Japanese with
English abstract).
Fujiwara, S., M. Tobita, M. Murakami, H. Nakagawa and
P. A. Rosen (1999): Baseline determination and
correction of atmospheric delay induced by
topography of SAR interferometry for precise surface
change detection, J. Geod. Soc. Japan, 45, 315-325 (in
Japanese with English abstract).
Fujiwara, S., T. Nishimura, M. Murakami, H. Nakagawa,
M. Tobita and P. A. Rosen (2000): 2.5-D surface
deformation of a M6.1 earthquake near Mt Iwate
detected by SAR interferometry, Geophys. Res. Lett.,
27, 2049-2052.
Fujiwara, S., H. Yarai, T. Kobayashi, Y. Morishita, T.
Nakano, B. Miyahara, H. Nakai, Y. Miura, H. Ueshiba,
Y. Kakiage and H. Une (2016): Small-displacement
linear surface ruptures of the 2016 Kumamoto
earthquake sequence detected by ALOS-2 SAR
interferometry, Earth Planets Space, 68: 160.
Global Centroid Moment Tensor Catalog (2017):
201711121818A IRAN-IRAQ BORDER REGION,
http://www.globalcmt.org (accessed Dec.7, 2017).
Jónsson, S., H. Zebker, P. Segall and F. Amelung (2002) :
Fault slip distribution of the 1999 Mw 7.1 Hector
Mine, California, earthquake, estimated from satellite
radar and GPS measurements, Bull. Seism. Soc. Amer.,
92, 1377-1389.
Kobayashi, T., Y. Morishita and H. Yarai (2015):
Detailed crustal deformation and fault rupture of the
2015 Gorkha earthquake, Nepal, revealed from
ScanSAR-based interferograms of ALOS-2, Earth
Planets Space, 67:201.
Madanipour, S., Ehlers, T., Yassaghi, A., Rezaeian, M.,
Enkelmann E and Bahroudi, A (2013): Synchronous
deformation on orogenic plateau margins: Insights
from the Arabia–Eurasia collision, Tectonophysics,
608, 440-451.
http://dx.doi.org/10.1016/j.tecto.2013.09.003
(accessed Dec.7, 2017).
Okada, Y (1985): Surface deformation due to shear and
tensile faults in a halfspace, Bull Seismol Soc Am, 75,
1135-1154.
Tobita, M., S. Fujiwara, M. Murakami, H. Nakagawa and
P. A. Rosen (1999): Accurate offset estimation
between two SLC images for SAR interferometry, J.
Geod. Soc. Japan, 45, 297-314 (in Japanese with
English abstract).
Tobita, M (2003): Development of SAR interferometry
analysis and its application to crustal deformation
study, J. Geod. Soc. Japan, 49, 1-23 (in Japanese with
English abstract).
U. S. Geological Survey (2017): M7.3 – 30km S of
Halabjar, Iraq.
https://earthquake.usgs.gov/earthquakes/eventpage/us
2
000bmcg#executive (accessed Dec.7, 2017).
Vergés, J., Saura, E., Casciello, E., Fernàndez, M.,
Villaseñor, A., Jiménez-Munt, I., García-Castellanos,
D (2011): Crustal-scale cross-sections across the NW
Zagros belt: implications for the Arabian margin
reconstruction, Geological Magazine, 148, 739-761.
Vernant, Ph., F. Nilforoushan, D. Hatzfeld, M.R.
Abbassi, C. Vigny, F. Masson, H. Nankali, J.
Martinod, M. Ghafory-Ashtiany, R. Bayer, F.
Tavakoli and J. Chéry (2004) : Present-Day Crustal
Deformation and Plate Kinematics in the Middle East
Constrained by GPS Measurements in Iran and
Northern Oman, Geophys. J., Int., 157, 381-398.
Wessel, P and Smith, WH (1998): New, improved
version of Generic Mapping Tools released, Eos Trans
AGU, 79, 579.