Embed Size (px)
Citation preview
INTEGRATED CONTROL AND ASSESSMENT OF KNAPWEED AND CHEATGRASS ON DEPARTMENT OF
DEFENSE INSTALLATIONS
Final Technical Report
Submitted to: SERDP Support Office HydroGeoLogic, Inc.
1155 Herndon Parkway, Suite 900 Herndon, VA 20170
Submitted by:
Mark W. Paschke (Project Leader) Edward F. Redente
Department of Forest Rangeland and Watershed Stewardship Steven D. Warren
Center for Environmental Management of Military Lands Donald A. Klein
Department of Microbiology, Immunology and Pathology Colorado State University
Lincoln Smith
Western Regional Research Center Exotic and Invasive Weeds Research Unit USDA ‐ Agricultural Research Service
Alan Klawitter
Remote Sensing Lab National Nuclear Security Administration
Terry McLendon
Montgomery Watson Harza, Inc. January 2005
Report Documentation Page Form ApprovedOMB No. 0704-0188
Public reporting burden for the collection of information is estimated to average 1 hour per response, including the time for reviewing instructions, searching existing data sources, gathering andmaintaining the data needed, and completing and reviewing the collection of information. Send comments regarding this burden estimate or any other aspect of this collection of information,including suggestions for reducing this burden, to Washington Headquarters Services, Directorate for Information Operations and Reports, 1215 Jefferson Davis Highway, Suite 1204, ArlingtonVA 22202-4302. Respondents should be aware that notwithstanding any other provision of law, no person shall be subject to a penalty for failing to comply with a collection of information if itdoes not display a currently valid OMB control number.
1. REPORT DATE JAN 2005
2. REPORT TYPE Final
3. DATES COVERED -
4. TITLE AND SUBTITLE Integrated control & assessment of knapweed & cheatgrass on DoDinstallations
5a. CONTRACT NUMBER
5b. GRANT NUMBER
5c. PROGRAM ELEMENT NUMBER
6. AUTHOR(S) Dr. Mark W. Paschke
5d. PROJECT NUMBER CS 1145
5e. TASK NUMBER
5f. WORK UNIT NUMBER
7. PERFORMING ORGANIZATION NAME(S) AND ADDRESS(ES) Colorado State University Department of Rangeland Ecosystem Science1472 Campus Delivery Fort Collins, CO 80523-1472
8. PERFORMING ORGANIZATIONREPORT NUMBER
9. SPONSORING/MONITORING AGENCY NAME(S) AND ADDRESS(ES) Strategic Environmental Research & Development Program 901 N StuartStreet, Suite 303 Arlington, VA 22203
10. SPONSOR/MONITOR’S ACRONYM(S) SERDP
11. SPONSOR/MONITOR’S REPORT NUMBER(S)
12. DISTRIBUTION/AVAILABILITY STATEMENT Approved for public release, distribution unlimited
13. SUPPLEMENTARY NOTES The original document contains color images.
14. ABSTRACT SERDP project CS1145 explored alternative control and assessment strategies for knapweeds and annualbrome, two non-indigenous plant taxa, on US military installations. These plant taxa infest large areas ofthe Western United States and they are a major concern for military bases. Heavy maneuvering of troopsand equipment causes large disturbances where native vegetation is stressed, soil is lost, and invasivenoxious plants often take hold. Replacing stands of noxious weeds with native plant communities onmilitary training grounds will reduce soil erosion and create more sustainable ecological systems.Non-indigenous invasive plants can also reduce and destroy forage for livestock and wildlife, displacenative plant species, increase fire frequency, reduce recreational opportunities, and can poison domesticanimals. It is imperative to find economical, ecologically sound methods to control these weeds to minimizecontrol costs and degradation of military training grounds.
15. SUBJECT TERMS
16. SECURITY CLASSIFICATION OF: 17. LIMITATION OF ABSTRACT
SAR
18. NUMBEROF PAGES
88
19a. NAME OFRESPONSIBLE PERSON
a. REPORT unclassified
b. ABSTRACT unclassified
c. THIS PAGE unclassified
Standard Form 298 (Rev. 8-98) Prescribed by ANSI Std Z39-18

This report was prepared under contract to the Department of Defense Strategic Environmental Research and Development Program (SERDP). The publication of this report does not indicate endorsement by the Department of Defense, nor should the contents be construed as reflecting the official policy or position of the Department of Defense. Reference herein to any specific commercial product, process, or service by trade name, trademark, manufacturer, or otherwise, does not necessarily constitute or imply its endorsement, recommendation, or favoring by the Department of Defense.

SERDP CS1145 2
TABLE OF CONTENTS LIST OF ACRONYMS............................................................................................................... 4
FIGURES AND TABLES .............................................................................................................. 5
EXECUTIVE SUMMARY ............................................................................................................ 8
EXECUTIVE SUMMARY ............................................................................................................ 8 TREATMENT EFFECTS ........................................................................................................... 8 REMOTE SENSING................................................................................................................. 10 ECOLOGICAL MODELLING................................................................................................. 11
Fort Carson ............................................................................................................................ 11 Yakima Training Center ........................................................................................................ 12
PROJECT BACKGROUND ........................................................................................................ 14 OBJECTIVE.............................................................................................................................. 14 TECHNICAL APPROACH...................................................................................................... 14
Control of non-indigenous invasive plant species................................................................. 14 Reduction of pest plant population ................................................................................................. 15 Control of N availability ................................................................................................................. 16 Seeding............................................................................................................................................ 16 Restoration of the soil community .................................................................................................. 16
Remote sensing of non-indigenous plant populations........................................................... 17 Ecological Modelling ............................................................................................................ 18
MATERIALS AND METHODS – FIELD STUDIES................................................................. 19 STUDY SITES.......................................................................................................................... 19 FIELD PLOT DESIGN............................................................................................................. 19 TREATMENTS ........................................................................................................................ 19
Reduction of pest plant population........................................................................................ 19 Biological control of knapweed ...................................................................................................... 19 Fire (annual brome only) ................................................................................................................ 20
Control of N availability........................................................................................................ 20 Seeding .................................................................................................................................. 21 Restoration of the soil community ........................................................................................ 23
SAMPLING METHODS .......................................................................................................... 23 Monitoring Biocontrol Insects............................................................................................... 23 Knapweed density and fitness. .............................................................................................. 24 Soil community structure and function ................................................................................. 24
Microscopic assessment of microbial community structure ........................................................... 24 Molecular assessment of Glomus occurrence in roots of selected plant species ............................ 24 Root microscopic analyses.............................................................................................................. 26 Systemic Endophytic fungal (SEF) and possible Chytrid Presence................................................ 26
Plant community biomass...................................................................................................... 27
PROJECT ACCOMPLISHMENTS AND RESULTS – FIELD STUDIES................................. 28 BIOLOGICAL CONTROL AGENTS AND KNAPWEED DENSITY AND FITNESS ........ 28
Final Report

SERDP CS1145 3
Yakima Training Center. ....................................................................................................... 28 Fort Carson. ........................................................................................................................... 32 Recommendations to the DOD Regarding Biological Control of Knapweed....................... 37
SOIL COMMUNITY................................................................................................................ 37 2000 Studies .......................................................................................................................... 37
Mycorrhizal and endophytic fungal infection ................................................................................. 37 Fungal community structure ........................................................................................................... 38 Molecular analyses.......................................................................................................................... 38
2001 Studies .......................................................................................................................... 38 Fungal community structure ........................................................................................................... 38 Molecular Analyses ........................................................................................................................ 39
2002 studies ........................................................................................................................... 40 Fungal community structure ........................................................................................................... 40 Molecular analyses.......................................................................................................................... 41
2003 Studies .......................................................................................................................... 42 Mycorrhizal and endophytic fungal infection ................................................................................. 42 Fungal Community Structure.......................................................................................................... 43
Summary of Fungal responses 2000-2003 ............................................................................ 45 Discussion - Soil Community................................................................................................ 47 Recommendations to the DoD for Management of Microbial Communities. ...................... 48
PLANT COMMUNITY............................................................................................................ 49 2001 Pretreatment Results..................................................................................................... 49 Intermediate Years 2001-2002 .............................................................................................. 49 Final Sampling Year -2003 ................................................................................................... 51
Fort Carson Annual Brome Site...................................................................................................... 51 Yakima Training Center Annual Brome......................................................................................... 53 Fort Carson Knapweed Site ............................................................................................................ 55 Yakima Training Center Knapweed Site ........................................................................................ 57
Plant Community Discussion ................................................................................................ 59 Recommendations to DoD Regarding Control of Knapweed and Annual Brome................ 61
REMOTE SENSING OF RESEARCH PLOTS – SUMMARY OF RESULTS ...................... 61 ECOLOGICAL MODELLING................................................................................................. 63
Fort Carson – Summary of EDYS Results ............................................................................ 63 Yakima Training Center – Summary of EDYS Results........................................................ 64
LITERATURE CITED ................................................................................................................. 66
APPENDIX A. PROJECT PUBLICATIONS ............................................................................. 70
APPENDIX B. PRESENTATIONS AT PROFESSIONAL MEETINGS. ................................. 71
APPENDIX C. END PRODUCTS DELIVERED DIRECTLY TO YTC AND FC PERSONNEL. .............................................................................................................................. 73
APPENDIX D. BIOLOGICAL CONTROL OF SPOTTED AND DIFFUSE KNAPWEEDS. . 74
Final Report
SERDP CS1145 4
LIST OF ACRONYMS AGL above ground level ANOVA Analysis Of Variance ASD Analytical Spectral Devices ATM airborne thematic mapper CIR color infrared CSU Colorado State University EDYS Ecological DYnamics Simulation FC Fort Carson GENIE GENetic Imagery Exploitation GPS global positioning system GVI greenness vegetation index MTMF Mixture Tuned Matched Filtering NDVI normalized difference vegetation index ROI region of interest RSL Remote Sensing Laboratory SAM spectral angle mapper SAVI soil adjusted vegetation index SERDP Strategic Environmental Research & Development Program SWIR short-wave infrared YTC Yakima Training Center
Final Report
SERDP CS1145 5
FIGURES AND TABLES Figure 1. Total mineral N recovered in ion-exchange resin bags in study plots during successive
incubations from June 2000 to May 2002. Letters indicate significant difference between treatments (Fisher’s LSD, P < 0.05, n = 5). Plots receiving the sucrose treatments are indicated by red. .......... 21
Figure 2. Climate at the Colorado Springs airport near the Fort Carson study sites represented as Walter Diagrams for long-term averages and study period conditions........................................................... 22
Figure 3. Climate at the Yakima, WA airport located near the Yakima Training Center study sites represented as Walter Diagrams for long-term averages and study period conditions. ...................... 23
Figure 1. Infestation of diffuse knapweed by the root-borer, Sphenoptera jugoslavica, at Yakima Training Center (mean + SE). ............................................................................................................. 29
Figure 2. Infestation of diffuse knapweed by the flower weevil, Larinus minutus at Yakima Training Center (mean + SE)............................................................................................................................. 29
Figure 3. Infestation of diffuse knapweed by the flies, Urophora affinis and U. quadrifasciata, at Yakima Training Center (mean + SE). ............................................................................................................. 30
Figure 4. Infestation of diffuse knapweed seedheads by all insects at Yakima Training Center (mean + SE). ..................................................................................................................................................... 30
Figure 5. Density of diffuse knapweed bolts (flower stems) at Yakima Training Center (mean + SE). ... 31 Figure 6. Density of diffuse knapweed seedheads at Yakima Training Center (mean + SE). ................... 31 Figure 7. Density of diffuse knapweed rosettes at Yakima Training Center (mean + SE). ....................... 32 Figure 8. Density of diffuse knapweed seedlings at Yakima Training Center (mean + SE). .................... 32 Figure 9. Infestation of spotted knapweed by the root weevil, Cyphocleonus achates (mean + SE). ....... 34 Figure 10. Infestation of spotted knapweed by the flower weevil, Larinus minutus, at Fort Carson (mean
+ SE). .................................................................................................................................................. 34 Figure 11. Infestation of diffuse knapweed by the flies, Urophora affinis and U. quadrifasciata, at Fort
Carson (mean + SE). ........................................................................................................................... 35 Figure 12. Infestation of spotted knapweed seedheads by all insects at Fort Carson (mean + SE). .......... 35 Figure 13. Density of spotted knapweed bolts (flower stems) at Fort Carson (mean + SE)...................... 36 Figure 14. Density of spotted knapweed seedheads at Fort Carson (mean + SE)...................................... 36 Figure 15. Density of spotted knapweed rosettes at Fort Carson (mean + SE).......................................... 37 Figure 16. Density of spotted knapweed seedlings at Fort Carson (mean + SE). ...................................... 37 Figure 17. Active and total soil fungi hyphal lengths at the FC study plots in May 2001. Letters indicate
significant difference between treatments (Fisher’s LSD, P < 0.05, n = 5). ....................................... 39 Figure 18. A typical gel from the PCR system used on fungi obtained from the roots of perennial native
grasses at disturbed and undisturbed sites, 2001. Two lanes were used for each sample because varying amounts of DNA were used during the PCR. The variations are between 5 and 10 ng/µL of purified PCR product used for each reaction tube. The 600-620 bp result is within the expected range for isolating fungi of the order Glomales. The lane numbers run from left to right on the gel............................................................................................................................................................. 40
Figure 19. Soil fungal hyphal lengths (total and active) on the Annual Brome and Knapweed Sites at the Yakima Training Center, in relation to treatments. Letters indicate significant difference between treatments (Fisher’s LSD, P < 0.05, n = 5) for active hyphae (lower case letters) and total hyphae (upper case letters). Thin bars represent the standard error of the mean (n = 5)................................ 41
Figure 20. Mean plant community biomass composition of the research sites (n = 40). Panel a shows the plant communities organized by life forms. Panel b shows the plant communities organized by native versus introduced species origins. Numbers in panel b are the total number of each type of species encountered on the research sites. Panel c shows the relative biomass of the four target weed species in the study. ............................................................................................................................ 49
Figure 21. Biomass of target weed species in study plots receiving one of eight treatment combinations (and controls) during the summer of 2001, one year after treatments began. Letters indicate
Final Report
SERDP CS1145 6
significant difference between treatments (Fisher’s LSD, P < 0.05, n = 5). Thin bars represent the standard error of the mean. A solid triangle indicates that the corresponding treatment was applied............................................................................................................................................................. 50
Figure 22. Mean biomass of the target weed species in control plots during the study period.................. 51 Figure 23. Photographs of plot number 83 at the FC knapweed site taken in July 2002 (Panel A) and July
2003 (Panel B). The effects of the severe drought of 2002 are evident in the 2002 photo (Panel A)............................................................................................................................................................. 51
Figure 24. Mean relative biomass of major plant life form groups at the FC annual brome site in 2003. Different letters indicate significant difference between treatments within each life form group (Fisher’s LSD, P < 0.05, n = 5)........................................................................................................... 52
Figure 25. Mean relative biomass of introduced versus native plant taxa at the FC annual brome site in 2003. Different letters indicate significant difference between treatments (Fisher’s LSD, P < 0.05, n = 5). ..................................................................................................................................................... 52
Figure 26. Mean relative biomass of invasive plant taxa at the FC annual brome site in 2003. Invasive species can be introduced or native and are defined here as described by USDA (2003). Different letters indicate significant difference between treatments (Fisher’s LSD, P < 0.05, n = 5)................ 53
Figure 27. Mean relative biomass of desirable plant taxa at the FC annual brome site in 2003. Desirablespecies are all native, non-invasive or seeded taxa (the target community). Different letters indicate significant difference between treatments (Fisher’s LSD, P < 0.05, n = 5). ......................... 53
Figure 28. Mean relative biomass of major plant life form groups at the YTC annual brome site in 2003. Different letters indicate significant difference between treatments within each life form group (Fisher’s LSD, P < 0.05, n = 5)........................................................................................................... 54
Figure 29. Mean relative biomass of introduced versus native plant taxa at the YTC annual brome site in 2003. Different letters indicate significant difference between treatments (Fisher’s LSD, P < 0.05, n = 5). ..................................................................................................................................................... 54
Figure 30. Mean relative biomass of major plant life form groups at the Fort Carson knapweed site in 2003. Different letters indicate significant difference between treatments within each life form group (Fisher’s LSD, P < 0.05, n = 5)........................................................................................................... 55
Figure 31. Mean relative biomass of introduced versus native plant taxa at the FC knapweed site in 2003. Different letters indicate significant difference between treatments (Fisher’s LSD, P < 0.05, n = 5).56
Figure 32. Mean relative biomass of invasive plant taxa at the FC knapweed site in 2003. Invasive species can be introduced or native and are defined here as described by USDA (2003). Different letters indicate significant difference between treatments (Fisher’s LSD, P < 0.05, n = 5)................ 56
Figure 33. Mean relative biomass of major plant life form groups at the Yakima Training Center knapweed site in 2003. Different letters indicate significant difference between treatments within each life form group (Fisher’s LSD, P < 0.05, n = 5). ........................................................................ 57
Figure 34. Mean relative biomass of introduced versus native plant taxa at the YTC knapweed site in 2003. Different letters indicate significant difference between treatments (Fisher’s LSD, P < 0.05, n = 5). ..................................................................................................................................................... 58
Figure 35. Mean relative biomass of invasive plant taxa at the FC annual brome site in 2003. Invasive species can be introduced or native and are defined here as described by USDA (2003). Different letters indicate significant difference between treatments (Fisher’s LSD, P < 0.05, n = 5)................ 58
Figure 36. Mean relative biomass of desirable plant taxa at the YTC knapweed site in 2003. Desirable species are all native, non-invasive or seeded taxa (the target community). Different letters indicate significant difference between treatments (Fisher’s LSD, P < 0.05, n = 5). ....................................... 58
Figure 37. Change in the relative biomass of target weed species between 2000 (pre-treatment) and 2003 (three years after treatments began) at Fort Carson, CO and Yakima Training Center, WA. A negative mean indicates that the relative biomass of the weed decreased by the amount during the study period. Different letters indicate significant difference between treatments (Fisher’s LSD, P < 0.05, n = 5). Knapweed control plots (treatment 1) are not included due to biocontrol insect
Final Report
SERDP CS1145 7
migration to the control sites. The valid control for comparison to the other treatments (3-8) is treatment 2. ......................................................................................................................................... 60
Table 1. Seed mixtures used in the study................................................................................................... 22 Table 2. Mycorrhizae in roots of native perennial grass species common to disturbed and adjacent
undisturbed sites at YTC and FC during the summer of 2000. The undisturbed sites were used as a source of soil inoculum for treatments 6, 7 and 8. .............................................................................. 38
Table 3. Native perennial grass (Bouteloua gracilis) root infection by mycorrhizae (infection intensity, vesicles, arbuscules) and SEFa/Olpidium chytrids at CO spotted knapweed (Centaurea maculosa Lam.) infested site managed by varied combinations of sucrose amendment, seeding and whole soil inoculation treatments. Data are for 2003, three years after treatment application. Means within a column followed by the same letter are not significantly different at α = 0.05 using an LSD test. ... 42
Table 4. Native perennial grass (Poa secunda) root infection by mycorrhizae (infection intensity, vesicles, arbuscules) and SEFa/Olpidium chytrids at WA Diffuse Knapweed (Centaurea diffusa Lam.) infested site managed by varied combinations of sucrose amendment, seeding and whole soil inoculation treatments. Data are for 2003, three years after treatment application. Means within a column followed by the same letter are not significantly different at α = 0.05 using an LSD test. ... 43
Table 5. Total and active hyphal lengths, and percent active hyphae, at FC annual brome (Bromus japonicus) infested site managed by varied combinations of sucrose amendment, seeding and whole soil inoculation treatments. Data are for 2003, three years after treatment application. Means within a column followed by the same letter are not significantly different at α = 0.05 using an LSD test.. 43
Table 6. Total and active hyphal lengths, and percent active hyphae, at YTC Cheatgrass (Bromus tectorum) infested site managed by varied combinations of sucrose amendment, seeding and whole soil inoculation treatments. varied combinations of sucrose amendment, seeding and whole soil inoculation treatments. Data are for 2003, three years after treatment application. Means within a column followed by the same letter are not significantly different at α = 0.05 using an LSD test. ... 44
Table 7. Total and active hyphal lengths, and percent active hyphae, at CO Spotted Knapweed (Centaurea maculosa Lam.) infested site managed by varied combinations of sucrose amendment, seeding and whole soil inoculation treatments. Data are for 2003, three years after treatment application. Means within a column followed by the same letter are not significantly different at α = 0.05 using an LSD test. ....................................................................................................................... 44
Table 8. Total and active hyphal lengths, and percent active hyphae, at WA Diffuse Knapweed (Centaurea diffusa Lam.) infested site managed by varied combinations of sucrose amendment, seeding and whole soil inoculation treatments. varied combinations of sucrose amendment, seeding and whole soil inoculation treatments. Data are for 2003, three years after treatment application. Means within a column followed by the same letter are not significantly different at α = 0.05 using an LSD test.......................................................................................................................................... 45
Table 9. Mean relative biomass (%) of invasive, exotic and desirable (native non-invasive) plant species in CO plots infested with spotted knapweed (Centaurea maculosa Lam.) after three years of management by varied combinations of sucrose amendment, seeding and whole soil inoculation (2003). Means within a column followed by the same letter are not significantly different at α = 0.05 using an LSD test. ....................................................................................................................... 45
Table 10. Significant correlations between filamentous fungal responses and plant responses in CO spotted knapweed (Centaurea maculosa Lam.) plots managed by varied combinations of sucrose amendment, seeding and whole soil inoculation treatments. Data are for the post-treatment years of 2001 through 2003. ............................................................................................................................. 46
Table 11. Significant correlations between filamentous fungal responses and plant or soil responses in WA diffuse knapweed (Centaurea diffusa Lam.) plots managed by varied combinations of sucrose amendment, seeding and whole soil inoculation treatments. Data are for the post-treatment years of 2001 through 2003. ............................................................................................................................. 46
Final Report
SERDP CS1145 8
EXECUTIVE SUMMARY SERDP project CS1145 explored alternative control and assessment strategies for knapweeds and
annual brome, two non-indigenous plant taxa, on US military installations. These plant taxa infest large areas of the Western United States and they are a major concern for military bases. Heavy maneuvering of troops and equipment causes large disturbances where native vegetation is stressed, soil is lost, and invasive noxious plants often take hold. Replacing stands of noxious weeds with native plant communities on military training grounds will reduce soil erosion and create more sustainable ecological systems. Non-indigenous invasive plants can also reduce and destroy forage for livestock and wildlife, displace native plant species, increase fire frequency, reduce recreational opportunities, and can poison domestic animals. It is imperative to find economical, ecologically sound methods to control these weeds to minimize control costs and degradation of military training grounds.
The objective of CS1145 was to develop a general strategy for the control, monitoring and prediction of knapweed and annual brome infestations on Department of Defense installations in the Western U.S. The driving hypothesis of this research is that the control of invasive exotic plants is best achieved through multiple ecological factors acting in synergy to reduce the target population rather than single factors
Biological control, fire, manipulation of soil nitrogen availability, seeding with native late-seral species, and restoration of the soil community were combined in field studies on disturbed weed-infested sites at Yakima Training Center (YTC), WA and Fort Carson (FC), CO. The effects of these manipulations on plant community composition were monitored over a 4-year period on the ground and by using multispectral remote sensing techniques. Data from the field study was incorporated into an ecosystems dynamics simulation (EDYS) model. The EDYS model was calibrated to each of the field study sites to assess the direct and indirect effects of treatments on ecosystem dynamics at multiple spatial scales and to project the potential effects of treatments on long-term successional dynamics.
Knapweed biological control agents that were released have become well established and others are present in high numbers. The biocontrol agents attacked knapweed in high numbers and were likely responsible for much of the knapweed decline observed during this study, although the effects of drought on knapweed decline could not be experimentally separated from biocontrol effects. Soil N availability was significantly reduced with soil carbon amendments resulting in significant reductions in weed abundance. Soil microbial community analyses has indicated plot-level differences and molecular approaches have shown potential for discerning fungal taxa that can be used as markers of restoration success.
TREATMENT EFFECTS Significant treatment effects were evident in the plant community composition in plots at the FC
annual brome site during the third growing season after treatments were initiated. Unburned control plots were dominated by perennial forbs, which were predominantly introduced invasive taxa. The major species in these unburned plots was field bindweed (Convolvulus arvensis), which seemed to be responding to the elimination of vegetation in the previous year due to the drought. This was not the case in the burned plots. Burned control plots were similar to other treatments although a non-significant trend toward increase in the ratio of native to introduced taxa was observed for treated plots. It is likely that the momentum of native perennial grasses at this site will continue and result in increasingly significant and desirable treatment effects in the future. This prediction is supported by long term EDYS model simulations, which predict the site to be dominated by perennial grass after 50 years.
The YTC annual brome site continued to be dominated by cheatgrass three years after treatment. Dry conditions apparently slowed the development of seeded species; although large numbers of small seedlings of seeded grasses were apparent in some seeded plots. This observation indicates that some establishment has occurred. It remains to be seen if these seedlings will competitively displace the
Final Report
SERDP CS1145 9
dominant cheatgrass community in the long run. EDYS simulations predict that in the absence of management or disturbance, the site will undergo succession to a shrubland within 50 years.
Drought and/or insect biocontrols resulted in a near elimination of knapweed at the FC knapweed site during the study period. However, a few significant differences in plant community composition among treatments developed at the FC knapweed site. This site was different from other sites in the study in that the initial plant community at the site contained a large native, late-seral component. There were few introduced taxa at the site three years after treatment and the decline of once-dominant knapweed has contributed to this trend. The relative lack of weedy invasive species at the site, especially after the drought of 2002, may be a reason for a relative lack of treatment effects here. Among the treated plots, there were significant differences in the proportions of perennial grasses, perennial forbs, and annual forbs.
Significant and desirable treatment effects develop in treated plots at the YTC knapweed study site. Treated plots had an increased abundance of native perennial species. Results from treatment combination 8, which received biocontrol, seeding, sucrose and soil inoculation were the most encouraging. These plots contain significantly more native and desirable species relative to control treatments. The good establishment of desirable species in these plots with the reduction of knapweed biomass and the suppression of cheatgrass invasion indicates that the long-term momentum of the plant community has shifted in favor of native late-seral vegetation.
Overall, at all sites, the sucrose was effective at reducing soil N availability and provided a temporary reduction in the biomass of winter annuals (mainly annual brome species). Results from this field study indicate that soil N management can be an effective tool for reducing competition from weedy annual species. If this treatment can be timed to coincide with favorable seeding years, then lasting effects may be achieved. However, before this technique can be used on a large scale, a more cost effective approach needs to be developed.
Results from this study suggest that soil inoculations (moving a small amount of fresh soil from undisturbed to reclamation sites) could be an effective management tool. For many land managers, the use of soil from a relatively undisturbed site may not be a viable option due to limited source areas. For DOD lands however, this might be a useful approach since training lands often encompass severely disturbed lands immediately adjacent to relatively pristine areas. In this study, we used a relatively small quantity of soil from the donor area (undisturbed) in order to inoculate a relatively large disturbed area. Given that soil microbes have rapid growth rates and short population doubling times, it is likely that only a small quantity of inoculum is needed to establish new populations.
This study indicates that management efforts to control exotic species invasion of native perennial grassland communities results in changes in filamentous fungal communities that may be useful for understanding the ecological effects of these control practices. In addition, mycorrhizal assessment of roots of native perennial grasses that are in competition with these invasive plants show differences in the extent of mycorrhizal colonization among the sites used in this study. The filamentous fungi represent a subtle integration of form and function that may prove useful for predicting the outcome of invasive-indigenous plant interactions.
Overall, the treatment responses that were observed were generally only significant in plots receiving a combination of burning/biocontrol, seeding, soil available N reduction, and soil inoculation. This implies that multiple stressors applied to invasive weed populations combined with efforts to promote desirable species populations appear to be superior over single tool or single species approaches. In other words, managing invasive weeds is better approached at the plant community level rather than at the species level.
Final Report
SERDP CS1145 10
REMOTE SENSING Pixel purity analysis of multispectral scanner imagery showed that the content of imagery pixels
was spectral mixtures of plants/plant debris, plants/plant debris and soils, and/or soils, and that very few pixels contained pure spectral signatures. The vast majority of these pure spectral signatures were related to soils. This was due to semiarid conditions at the YTC with soils accounting for 65 – 75 percent of the signal received by the airborne scanner. Unsupervised classifications of multispectral scanner data verified that most pixels were spectral mixtures, since very few clusters were directly correlated to a single vegetation species or soil type.
Ground-based measurements that were used to determine statistical relationships between spectral data and vegetation conditions were plot biomass and reflectance spectra of plant species and soils. Biomass estimates for vegetation plots using spectral indices NDVI, SAVI, and GVI had poor correlations to measured biomass, due to inclusion of senescent vegetation in measured biomass values.
Ground-based reflectance spectra of the dominant plant species in the vegetation plots revealed that many of the plant species had similar reflectance characteristics, rendering them spectrally indistinguishable by a Daedalus 1268 multispectral scanner. Reflectance spectra of the same plant species over a three-year period showed that variations in percent reflectance amplitude had occurred. These amplitude variations were most likely due to changes in illumination conditions, plant growth stage, and variations in atmospheric water vapor between the years. Reflectance spectra also revealed that the spectrum of a plant radically changes as senescence approaches due to the loss of chlorophyll, and that the spectrum of dead vegetation of differing species is similar. It is therefore imperative that ground-based reflectance spectra be acquired at the same time as the spectrometer overpasses.
Supervised Mixture Tuned Matched Filtering (MTMF) classifications confirmed that a broad-band multispectral scanner could not map diffuse knapweeds at the knapweed test site. This was attributable to the variety of spectrally similar materials present, low knapweed densities, and spatially scattered knapweed populations. MTMF classifications of materials present at the cheatgrass test site produced good results due to the higher density of vegetation and lack of species diversity. Soil mapping at both vegetation sites was accurate.
Vegetation change was detected and monitored statistically with ANOVA. Sucrose treated plots were consistently statistically different from non-sucrose treated plots at both the knapweed and cheatgrass test sites. Effectiveness of sucrose treatments could also be evaluated. No statistical differences were detected within non-sucrose treated plots at either the knapweed or the cheatgrass sites. No statistical differences were evident within sucrose treated plots at the knapweed site, but slight statistical differences were noted within sucrose treated plots at the cheatgrass site. The effects of soil inoculations appear to be expressing themselves spectrally. Vegetation plot statistical differences were best expressed by infrared wavelengths and vegetation indices. Biomass was not the best indicator of change because of the low statistical correlations.
Ground-based spectral reflectance curves for knapweed and cheatgrass were convolved to Landsat Thematic Mapper bandwidths for supervised classification of Landsat images. The convolved spectra of these distinct species look almost identical to the Landsat Thematic Mapper spectrometer, and therefore cannot be identified or discriminated spectrally using a single scene containing both healthy knapweeds and cheatgrass. An MTMF classification of a Landsat scene was conducted for Ft. Carson, Colorado, using these convolved spectra as endmembers. The resulting classification could not discriminate between the input endmembers and other species of vegetation except for conifers. Although supervised classifications for knapweeds and cheatgrass using a single Landsat scene failed, multi-temporal methodology using Landsat Thematic Mapper imagery for identifying and monitoring cheatgrass in the western United States has been reported in recent remote sensing literature.
Final Report
SERDP CS1145 11
ECOLOGICAL MODELLING Fort Carson
At the FC brome site, Japanese brome was the dominant species at the beginning of the study, but four years later, the production of this species had drastically declined. The drought conditions of 2002 and 2003 were probably the main reason for this effect. The EDYS model did not simulate well this decline in Japanese brome, probably because the precipitation data that was used for modeling did not represent accurately the precipitation that was received at the study site. The decline in Japanese brome dominance by 2003 was followed by an increase in bindweed dominance. This replacement in species dominance was not observed in the EDYS simulations because Japanese brome was not as affected in the simulations as it was in the field.
At the knapweed site, the population of spotted knapweed dominated the plant community at the beginning of the study. However, as occurred in the brome site with Japanese brome, spotted knapweed declined drastically four years later. The main reason for the decline in spotted knapweed production was the below average precipitation that occurred in 2002 and 2003 (insect biocontrol agents may have also played a role in knapweed decline). This decline and the replacement of western wheatgrass as the dominant species were well simulated by the EDYS model. At the knapweed site, the EDYS simulations of biomass production did not generally differ statistically from the field sampling estimations.
In the FC brome site long-term simulations, Japanese brome and bindweed had negligible biomass by Year 50, while western wheatgrass became the dominant species. At the knapweed site, the population of spotted knapweed was lost by Year 10 and western wheatgrass, twistspine prickly pear, and soapweed yucca became the dominant species. The treatments applied to the study plots had little effect in the long-term simulations. This may have been the result of the short-term application of the treatments. Fire was applied only the first year, microbial inoculation was applied two years, and sugar was applied only for four years. The long-term simulated replacement of weedy invasive species by native perennials corresponds well to results obtained in long-term studies found in the literature. The EDYS model simulated well these vegetation changes through time, showing to be a valuable tool to forecast plant community dynamics under different management scenarios.
Spotted knapweed and Japanese brome declined in their respective communities and showed great susceptibility to drought conditions. Spotted knapweed was eliminated from the community within 10 years, while Japanese brome survived at low production levels until Year 50. The faster elimination of spotted knapweed may indicate higher susceptibility to drought than Japanese brome. The effect of biological control agents was not clearly demonstrated, perhaps because it was masked by the overriding influence of the drought.
When grazing was included in the model, no substantial impacts on vegetation total aboveground biomass were seen. Species composition was different at the end of the 50-year simulation. Twistspine pricklypear disappeared from the plots whereas in ungrazed plots it was a major species. Western wheatgrass biomass increased with all levels of grazing and, at the end of 50 years, it was the dominant species. Most other grasses and forbs were gone by the end of the simulation.
When impacts of an M-1 Abrams tank passing through the plots in Year 5 were included in the model, there was no long-term change seen in vegetation biomass and species composition. When impacts of an M-1 Abrams tank or a HMMWV passing through the plots every five years were included in the model, total aboveground biomass was much lower at Year 50 than in non-impacted plots. Species composition was also negatively affected. Biomass of twistspine pricklypear, soapweed yucca, and western wheatgrass, the major species in undisturbed plots, decreased substantially. No species increased and most other grasses and forbs had disappeared by the end of the simulation.
These modeling results suggest that the plant community in Fort Carson would tend to become a grassland dominated by western wheatgrass over the long-term, provided that the precipitation regimes are similar to the ones registered over the past 50 years and that no further disturbance occurred. Disturbances such as military vehicle training will change biomass production but do not appear to change the major species composition in a 50-year simulation.
Final Report
SERDP CS1145 12
Yakima Training Center Two species, cheatgrass and tumblemustard, comprised almost all of the biomass at the YTC
brome site. Mean overall accuracy of the 4-year EDYS simulations at the brome site, compared to the experimental results, was 89% for cheatgrass and 88% for total biomass. Accuracy for tumblemustard was lower (62%). At the end of the four-year simulation, cheatgrass was the dominant species in all plots, regardless of treatment. This was also the case in the field experiment. These validation results indicate that EDYS was successful in simulating the vegetation dynamics at the brome site.
EDYS was then used to simulate vegetation dynamics at this site over a longer period of time (50 years). These simulations indicated that under control conditions (i.e., no treatments), the cheatgrass site would become dominated by big sagebrush and rabbitbrush after 50 years. These simulations also indicated that the fire, sugar, and microbial treatments, as applied in the field experiments alone and in combination, had no long-term affect on secondary succession at this site. This may have been the result of the short-term application of the treatments. Fire was applied only in the first year, microbial inoculation was applied two years, and sugar was applied only for four years. The seeding treatment, however, did have a long-term affect on secondary succession. Based on the simulations, seeding with native perennial grasses resulted in a grass-dominated community at the end of 50 years, rather than a shrub-dominated community without seeding.
At the knapweed site, diffuse knapweed declined dramatically in all of the experimental plots in 2001, regardless of treatment. By the fourth year of the experiment, knapweed remained very low in all treatments, compared to initial conditions. Over the four-year experimental period, big sagebrush and perennial grasses increased under most treatments, and cheatgrass increased on half the treatments and decreased on half. When averaged over all plots and all treatments, cheatgrass was the most abundant species on the knapweed site in 2003, with a mean aboveground biomass of 30 g/m2. Big sagebrush averaged 9 g/m2 and perennial grasses averaged 27 g/m2.
The 4-year EDYS simulations produced similar results. Knapweed declined dramatically, as it did in the experimental study plots, and cheatgrass became the most abundant species at the site. Perennial grasses were the second most abundant group, followed by big sagebrush. As in the experimental study, each of these three groups of plants (cheatgrass, perennial grasses, and big sagebrush) increased in 2003 compared to initial conditions. Fourth-year accuracy varied among species, with values for the major species ranging from 52% for Sandberg bluegrass to 100% for bluebunch wheatgrass. Accuracy for total aboveground biomass in the fourth year was 93%.
The EDYS simulations resulted in cheatgrass becoming the most abundant species by the fourth year in all treatments except the sugar treatment, which was dominated by perennial grasses. This was similar to the experimental results. Therefore, the model accurately simulated the overall treatment responses. At the end of the 50-year simulations, all treatments converged to a big-sagebrush community, with a strong perennial grass component. As at the brome site, the treatments had some initial influence on successional development, but these differences were no longer present after 50 years.
When impacts of military vehicles were included in the model, total aboveground biomass was reduced and vegetation composition was affected. If the vehicle use occurred only early in a 50-year simulation, vegetation biomass was reduced in the five or so years following the disturbance. In the long-term, however, the vegetation recovered and was similar to an undisturbed community. In undisturbed communities, shrubs were the major species at the end of 50 years, while in sites impacted by military vehicles every five years needle-and-thread was the dominant species at the brome site and only a small amount of big sagebrush was left on the knapweed sites. These results show that if the system is impacted by vehicles, vegetation will be negatively impacted and species composition will be different from an undisturbed community. The long-term results depend on how often the community is disturbed.
These modeling results suggest that over relatively short periods of time (< 10 years), some of the treatments may provide methods of reducing cheatgrass. This is especially true for reseeding and application of sugar. However, over longer periods of time (> 20 years) and in the absence of further disturbance, these sites will revert to a big sagebrush-perennial grass community; given similar precipitation patterns as have occurred in the area over the past 50 years. None of the treatments, except
Final Report

SERDP CS1145 13
reseeding, had a measurable effect on this successional pattern in the long-term. Reseeding with perennial grasses had the long-term effect of increasing perennial grasses and decreasing shrubs. Impacts by rabbit, insect, and cattle grazing and by military vehicle training will negatively impact vegetation biomass and species composition. The degree of impact depends on density of herbivores and frequency of training.
Final Report

SERDP CS1145 14
PROJECT BACKGROUND This project explored alternative control and assessment strategies for knapweeds and annual
brome, two non-indigenous plant taxa, on US military installations. Large areas of the Western United States are infested by these plant taxa and they are a major concern for military bases. Heavy maneuvering of troops and equipment causes large disturbances where native vegetation is stressed, soil is lost, and invasive noxious plants often take hold. Replacing stands of noxious weeds with native plant communities on military training grounds will reduce soil erosion and create more sustainable ecological systems. Non-indigenous invasive plants can also reduce and destroy forage for livestock and wildlife, displace native plant species, increase fire frequency, reduce recreational opportunities, and can poison domestic animals. It is imperative to find economical, ecologically sound methods to control these weeds to minimize control costs and degradation of military training grounds.
OBJECTIVE The objective of our research was to develop a general strategy for the control, monitoring and
prediction of knapweed and annual brome infestations on Department of Defense installations in the Western U.S. The driving hypothesis of this research is that the control of invasive exotic plants can best be achieved through multiple ecological factors acting in synergy to reduce the target population rather than single factors
TECHNICAL APPROACH Single method approaches to non-indigenous invasive plant management rarely are successful. In
natural plant communities, populations of plant species are kept in check by multiple factors acting synergistically. Therefore, we have examined the control of non-indigenous invasive plant species by using a combination of manipulations that accelerate natural secondary succession. We tested combinations of four types of manipulations for controlling non-indigenous plant populations: 1) reduction of the pest plant population using biological control or burning, 2) reducing soil N availability, 3) reseeding with desirable mid- and late-seral plant species, and 4) reintroduction of a native late-seral soil microbial community. We tested the general usefulness of this approach by applying different combinations of these treatments to established communities of non-indigenous knapweed and annual brome at Fort Carson, Colorado and Yakima Training Center, Washington. We monitored our research plots using remote sensing techniques in order to develop methods for assessing the status of weed populations and monitoring large-scale effectiveness of control methodologies. We have extrapolated our results to larger spatial and temporal scales using an ecosystem dynamics model in order to gain insight into ecological mechanisms of control methods so that we can project the likely effectiveness of single and combined control methodologies. Our goal has been to develop a general strategy for managing these non-indigenous species on DOD lands in the Western U.S.
Control of non-indigenous invasive plant species Large areas of the Western United States are infested by exotic plant species, particularly
knapweeds (Centaurea maculosa, C. diffusa) (Roché 1994, Hirsch and Leitch 1996, Sheley et al. 1998) and annual bromes (Bromus tectorum, B. japonicus) (DiTomasso 2000). Noxious weeds are a major concern for military bases. Heavy maneuvering of troops and equipment cause large disturbances where native vegetation is stressed, soil is compacted or lost and invasive non-indigenous plants often take hold (Goran et al. 1983, Shaw and Diersing 1990). Replacing stands of non-indigenous plants with native plant communities on military training grounds may reduce soil erosion (Lacey et al. 1989) and create more sustainable ecological systems. Non-indigenous plants can also reduce and destroy forage for livestock and wildlife (Bedunah and Carpenter 1989, Spoon et al. 1983), displace native plant species
Final Report
SERDP CS1145 15
(Sheley and Jacobs 1997), reduce land use opportunities, and can poison domestic animals or people. It is imperative to find economical, ecologically sound methods to control these weeds to minimize control costs and to minimize degradation of military training grounds.
The natural process of recovery of disturbed lands (secondary succession) can take decades or even centuries depending on the nature of the disturbance. This process can be arrested by the invasion and dominance of non-indigenous species. The processes that control the rate of recovery of disturbed lands to late-seral native plant communities are poorly understood. Nitrogen (N) availability has been found to be a control mechanism of succession in several ecosystems. The rate of natural recovery of disturbed lands can also be hindered by a lack of propagules of appropriate flora and fauna, as well as by the lack of a proper balance of plants and insect herbivores. Long-term disturbance to a site can destroy the soil seed bank as well as the rich community of soil organisms and insect herbivores that are vital to ecosystem functioning.
Reduction of pest plant population Biological control
Biological control can play a key role in noxious weed management because it can permanently reduce weed populations, does not require expensive technology, and is ecologically non-disruptive (Harris and Cranston 1979, Maddox 1979, Story 1992, Radosevich et al. 1997). Twelve species of insects have been approved for introduction into the United States for biological control of spotted and diffuse knapweed (Rees et al. 1996). Most of these attack both weed species, but some of the insects are established in restricted habitats or only in a few sites. Although several of these agents have become well established and can be collected in large numbers, there is very little quantitative data on efficacy of weed control. Two flies, Urophora affinis and U. quadrifasciata, that form galls in seedheads have spread widely and have reduced knapweed seed production by 75% to 94% in British Columbia (Harris and Cranston 1979, Harris 1980). The root-feeding beetle, Sphenoptera jugoslavica, has become widely established in British Columbia and Washington State (Powell and Myers 1988, Lang et al. 1996), and it has reduced seedling and rosette survival, delayed flowering and reduced seed production (Powell 1990). A root-boring weevil, Cyphocleonus achates, which has reduced plant size in controlled experiments has multiplied prolifically in British Colombia and is also promising for application in states such as Oregon, Washington and Montana. The root-mining tortricid moth Agapeta zoegana, which has been introduced to western Canada (Harris and Myers 1984) and the northwestern USA (Maddox 1982), is spreading well but may have less impact on knapweed. Larinus minutus, a weevil whose larvae feed on developing seeds, was first released in the U.S. in 1991. It is multiplying rapidly and has decimated isolated patches of diffuse knapweed in Montana (Lang et al. 1996).
The effectiveness of biological control agents is also affected by other vegetation (interspecific plant competition; shading of soil), soil fertility, local climate, and site orientation (slope and aspect). For example, the root boring beetle, Sphenoptera jugoslavica, is more successful on diffuse knapweed when the plant is growing among determinate grasses that largely cease growing after flowering in the spring or early summer (Harris and Clapperton 1997). Arbuscular mycorrhizal (AM) fungi that transfer nutrients between plant species are thought to play an important role in this interaction. The root boring weevil, Cyphocleonus achates, reduced shoot growth of spotted knapweed twice as much under poor N conditions as under high N (Steinger and Muller 1992).
Fire Cheatgrass and other exotic annual plant species are good competitors with native species
because their fast growth allows them to mature earlier than natives. The easily ignited fuel of a cheatgrass stand increases the likelihood of repeated fires that may eliminate native species and perpetuate dominance by cheatgrass (Pellant 1990). Seeding with desirable species after cheatgrass canopy removal by fire can be an effective restoration practice (Anderson et al. 1990, McArthur et al. 1990). However, the success of reseeding can be diminished by recolonization of the site by cheatgrass. The large build-up of plant litter associated with a cheatgrass stand (Paschke et al. 2000) may also hinder
Final Report
SERDP CS1145 16
the germination and growth of native plant species. We tested the feasibility of an initial burn to remove the annual brome canopy and prepare the site for additional treatments, such as seeding, control of soil N availability, and soil community restoration.
Control of N availability Nitrogen availability is inversely related to the abundance of native late-seral plant species in a
number of ecosystems. In European heathlands, shrub dominance decreases and perennial grasses become more abundant as available N increases (Heil and Diemont 1983, Berendse et al. 1987, Heil and Bruggink 1987, Aerts and Berendse 1988). Huenneke and coworkers (1990) found that N additions to Californian serpentine grassland led to the invasion and dominance of exotic annual grasses in patches originally dominated by native annual forbs. Shifts from late-seral to mid- or early-seral stages in forests are correlated with increases in available N (Aber et al. 1989, Cherfas 1991). Increased N availability has been shown to affect the seral process in semiarid ecosystems, slowing the replacement of weedy annuals by native herbaceous perennials (McLendon and Redente 1991 and 1992, Trent et al. 1992). Conversely, decreased N availability has been correlated with the replacement of early-seral species by mid-seral species in prairie and shrubland systems (Wedin and Tilman 1990, Tilman and Wedin 1991, McLendon and Redente 1992), and competitive success of shrubs over grasses is increased by lower N availability in semiarid (van Auken and Bush 1989) and arid ecosystems (Ettershank et al. 1978). Our research has shown that cheatgrass biomass can be reduced through reduction of soil N availability in sagebrush shrublands (McLendon and Redente 1991) and on abandoned agricultural fields in shortgrass steppe (Paschke et al. 2000). The effects of reducing soil N availability on knapweeds have not been established.
Seeding Seeding is a common practice in ecological restorations. The composition of the restored plant
community can be controlled, and when used in combination with other treatments, seeding with native species may hinder development of a non-native plant community (Redente and DePuit 1988, DePuit and Redente 1988, Sheley et al. 1998). Seeding with native species is an important restoration method for establishing plant communities that effectively control erosion, are self sustaining, require only minimal management, and provide excellent wildlife habitat (Redente and Keammerer 1999). Seeding can also lead to communities with greater plant diversity that contributes to greater stability and more effectively meet the demands of multiple land uses (Munshower 1994).
Restoration of the soil community Soil is a habitat for numerous and diverse organisms including bacteria, fungi, algae, lichens,
protozoa, nematodes, microarthropods, macroarthropods, annelids, and molluscs. The soil community is an intricate part of the functionality of most terrestrial ecosystems. When soil habitats are severely degraded, their physical and biological attributes are compromised, resulting in far-reaching effects on the soil community.
The reestablishment of soil functionality following disturbance is dependent on assuring that the assemblage of soil organisms and vegetation with their respective influences on the soil environment and the plant-soil system. In some instances, the introduction of a single genus of a particular organism to a site can have profound effects on the structure and function of an ecosystem. An example is the practice of introducing symbiotic organisms such as mycorrhizae (improvement of plant responses to stress, as well as access to nutrients and soil moisture), or the diazotrophs Rhizobia and Frankia, to facilitate nitrogen accumulation by the plant community. Introduction of these microbes is often used successfully to enhance survival and growth of plants used in reclamation efforts. Unfortunately, commercial sources of these and other beneficial organisms are limited (Torrey 1992). The reintroduction of these endophytes and other beneficial organisms could be achieved by reintroducing healthy native soil to the restoration site. This technique may prove to be a low-cost and effective alternative to the inoculation of plants with select exotic microsymbionts.
Final Report
SERDP CS1145 17
A critical aspect of the exotic/native plant dynamic, that has been given lesser emphasis, is mycocentric; the structure of the filamentous fungal community, including the mycorrhizal extraradical hyphae and saprophytic fungi, reflects the nutritional and functional status of the fungal community (Klein and Paschke, 2005). The environment in which the fungi are functioning is suggested to be closely linked to the environment in which the plant community is functioning and competing. Information on filamentous fungal community structure may assist in better predicting the outcome of such competition, particularly in the context of management of such complex systems to minimize/preclude invasion by knapweeds, and other exotic invasive species.
In this context, the structure of the filamentous fungal community may be able to be related to specific soil conditions that will promote native perennial plant species maintenance and development. Among factors that may influence filamentous fungi, as well as plant community development, are nitrogen availability (Johnson et al., 2003), the C:N ratio and nutrient content/composition of plants undergoing decomposition (Klein et al., 1989), and the soil microbial community that is present or which can be added. In addition, nutrient pool shifts involving changes such as substrate lignification (Klein et al., 1995) and substrate heterogeneity (Holland and Coleman, l987; Davidson, 1998; Rayner et al., 1999) may reflect common factors influencing both filamentous fungi and the invasive plant-native perennial grass interaction. The dynamics of root infection, including mycorrhizal (Allen et al., 2003) and non-mycorrhizal fungi (Mozafar et al., 2000) also are critical aspects of these interactions.
Stimulating the redevelopment of the soil community, both directly and indirectly, may accelerate the restoration of sites dominated by non-indigenous invasive plants. Military training grounds provide an excellent opportunity for exploring this approach because they usually contain intact areas of relatively undisturbed native plant and soil communities adjacent to degraded sites dominated by non-indigenous plants. These undisturbed soil communities could serve as unique sustainable sources of organisms for use in restoring adjacent disturbed lands dominated by non-indigenous plant species.
Remote sensing of non-indigenous plant populations The development of comprehensive integrated weed management strategies requires timely and
accurate information concerning the extent and distribution of weed populations. The field component of this project provided a unique opportunity to develop and test methods for monitoring populations of knapweed and cheatgrass from remote platforms. Thorough monitoring of plant populations in test plots through time, as done here, provided excellent sites for testing more cost-effective monitoring tools. The test plots in this study were monitored annually using high resolution multispectral airborne imagery. These data will be used with the detailed ground-collected plant community data to develop methods for assessing knapweed and cheatgrass populations on a larger spatial scale.
The Department of Energy Remote Sensing Laboratory (RSL) has shown that significant relationships exist between biological parameters related to plant conditions and spectral data. Utilizing laboratory-measured characteristics, we have been able to identify significant regressions between plant biomass and spectral data, as well as derived spectral indices (Blohm and Best 1995).
Assessing the relationships between spectral data and general plant characteristics was accomplished by using radiometric and geometric rectification of acquired Daedalus 1268 multispectral scanner digital imagery, simultaneous collection of aerial photography, and acquisition of ground-based imagery. Effectiveness of treatments on vegetation test sites was qualitatively and quantitatively monitored with airborne multispectral scanner imagery as well as from aerial and ground photography.
Further details of the approach used in the remote sensing portion of this project are available in the separate report: National Nuclear Security Administration – Remote Sensing Lab. 2004. Integrated control and
assessment of knapweed and cheatgrass on Department of Defense Installations. SERDP Contract # CS 1145. Report no. BN-RSL-05-0005. National Nuclear Security Administration Remote Sensing Lab. Las Vegas, NV. 98pp.
Final Report
SERDP CS1145 18
Ecological Modelling The simulation modeling for this project was conducted using the EDYS ecological model.
EDYS is a PC-based, mechanistic model that provides a powerful tool for evaluating ecological responses to a wide variety of natural and anthropogenic stressors over time, on spatial scales ranging from small plots to large landscapes and watersheds. EDYS has been applied to over 40 ecological communities within deserts, forests, grasslands, shrublands, wetlands, and highly disturbed areas. The objective of this EDYS application was to evaluate long-term ecological responses to a set of management options experimentally tested at YTC and FC to control invasive species and to project rates and patterns of vegetation recovery through secondary succession.
Our first step was to validate the EDYS model for these sites. This was done by parameterizing the model for the initial conditions at the beginning of the field experiments, simulating the changes in the vegetation over the four-year experimental period, and then comparing these simulation results to data from the field experiments. Following this validation procedure, 50-year simulation runs were conducted to evaluate long-term responses to the control methods. Effects of variations in environmental and management factors were then simulated to estimate how these factors might impact the control of cheatgrass and knapweed and the recovery of the native vegetation.
The field experiments were applied to two sites at YTC and FC, and EDYS was applied to these same four sites. One site at each base was dominated by annual brome and the other was a community that had been invaded by knapweed. Each site consisted of a 4000 m2 treatment area, divided into 40 10 m x 10 m treatment plots. The EDYS footprint consisted of 40 cells at each of the four sites, each cell corresponding to a treatment plot. Twenty plant species were included in this application at YTC and thirty at FC, along with the four treatments (prescribed fire/biological control, seeding to native perennial species, application of sugar, and microbial application). The four treatments were modeled as single factors and each of the combinations used in the experimental study. A control (no treatment applied) was included for each site. In addition to the treatments, natural ecological stressors (precipitation fluctuations, natural fire, intra- and inter-specific competition, ecological succession, natural herbivory by insects and rabbits, and livestock grazing) and military training (tracked and wheeled vehicles) were also included as environmental factors.
Further details on the approach used in the ecological modelling portion of this project are
described in the separate reports: Hunter, Rachael G., Ricardo Mata-Gonzalez, and Terry McLendon. 2004. Application of the EDYS
model to evaluate control methods for invasive plants at Yakima Training Center, Washington. MWH Americas, Fort Collins, Colorado. 167 p.
Hunter, Rachael G., Ricardo Mata-Gonzalez, and Terry McLendon. 2004. Application of the EDYS model to evaluate control methods for invasive plants at Fort Carson, Colorado. MWH Global, Fort Collins, Colorado. 182 p.
Final Report

SERDP CS1145 19
MATERIALS AND METHODS – FIELD STUDIES
STUDY SITES Two US Army installations are participating in this research. Yakima Training Center (YTC) in
Washington and Fort Carson (FC) in Colorado each contain problem populations of the non-indigenous invasive plants knapweed (spotted knapweed at FC and diffuse knapweed at YTC) and annual brome (downy brome at YTC and Japanese brome at FC). Site personnel recommended several infestation sites for the project and these were evaluated by the PIs in April 2000. Site selection was based on accessibility, level of infestation, presence of biocontrol agents, and suitability for remote sensing work.
At FC, a suitable knapweed study site was established along Little Turkey Creek adjacent to the Turkey Creek Recreation Area. A population of spotted knapweed (Centaurea maculosa) at this site was identified by base personnel as a high priority for control. The area is regularly impacted by light vehicles. A large tract of annual brome within the Turkey Creek Recreation Area was also identified as a high priority for control. The area has been used as a hay meadow and pasture in the past for Army cavalry units. Base personnel had mapped this community as an infestation of Bromus tectorum L. However, during our plant biomass sampling in the summer of 2000 we determined that the major cheatgrass species in this community was Bromus japonicus Thunb. ex Murr. These two species are easily confused and both are often grouped under the colloquial “cheatgrass” term. Both are annual exotic grasses in the Bromus genus and have very similar life histories and ecological characteristics (Hulbert 1955). Both study sites at FC contain numerous additional species of introduced weedy plants.
Very large expanses of cheatgrass (Bromus tectorum L.) are present at YTC, and with the assistance of base personnel, we located a suitable study site at the eastern edge of Training Area 4, on an upper terrace of the Columbia River floodplain. The area was used as a troop assembly area or camp during training exercises. A suitable knapweed site was located in Assembly Area 1. This site contains a problematic population of diffuse knapweed (Centaurea diffusa Lam.). Some biological control agents of knapweed were already present at this site, so a suitable control site was located some distance away near Badger Gap. SYBOR stakes were installed around all of the experimental plots at YTC to minimize troop damage to the research plots during the course of the study.
FIELD PLOT DESIGN Immediately after the study sites were identified in April 2000, we established grids of 10- x 10-
m study plots that would later contain a partial factorial arrangement of the four treatments (biocontrol for knapweed and burning for annual brome, sucrose amendment, seeding with native plant species and, soil community restoration) plus controls. Each treatment combination and control plot was replicated 5 times. Plots were arranged on the sites to avoid obvious discontinuities in the landscape and to maximize evenness in the experimental plant communities. Since the biological control agents of knapweed are mobile, and because the burning of annual brome was to be applied to a single area at each installation, additional control plots were located at sufficient distance from study plots to allow analysis of biological control and burning effectiveness.
TREATMENTS
Reduction of pest plant population Biological control of knapweed
Initial assessments of knapweed biocontrol agents at our research sites in spring 2000 revealed that the root beetle, Sphenoptera jugoslavica, was already well established at the YTC research sites (50-90% of mature plants infested). One larva of the root weevil, Cyphocleonus achates, (0.3% of plants
Final Report

SERDP CS1145 20
sampled) and no root moths, Agapeta zoegana, were observed at the FC site. The seedhead gall flies, Urophora affinis and U. quadrifasciata, were well established at all sites at both locations. Based on these results, we decided to release only Larinus minutus at the YTC knapweed release site and Cyphocleonus achates and Agapeta zoegana at the FC Turkey Creek knapweed release site.
Releasing Insect Biological Control Agents. The flower weevil, Larinus minutus, was successfully released at YTC on June 29, 2000. Twenty
active adult insects were released in the center of each of 35 plots (700 total) at the knapweed release site. The root weevil, Cyphocleonus achates, (250 adults) and the root moth, Agapeta zoegana, (600 adults) were released at FC on July 18-19, 2000. Because these releases appear to have been successful, no additional releases were made in 2001.
Insecticide exclusion. By fall 2001, it became clear that the insect biological control agents were dispersing much better
than anticipated. Infestation rates at the control and alternate control sites at both YTC and FC had become as high as at the release sites, so we decided to use a systemic insecticide to suppress the insects at the control sites. We could not obtain permission to apply insecticides at FC, but YTC personnel were very cooperative. In 2002, we planned to apply insecticide (0.16 oz acephate [75% active ingredient] per gallon) to individual knapweed plants at the Badger Gap control site in May, July and September. Due to logistical problems, insecticide was applied less frequently than planned (applications on June 20, and Aug. 8, 2002). In 2003, we planned to apply the insecticide more frequently: in May, June, July, and August), but actual treatments were made on May 27, and July 2, 2003. No insecticide applications were made in 2004. The insecticide may have reduced the flower weevil population in fall 2003, but the seedhead flies were still abundant (see Results). In spring 2004, the root beetle population decreased twice as much at the check site as at the release site, which may have been due to the insecticide applications in 2003 effectively reducing the beetle population. The beetles have only one generation per year, but the flies have two or more generations, so their populations may have been able to recover as insecticide concentrations declined. In 2003, a knapweed infested area near the Badger Gap control site was designated to receive insecticide applications, so that we could sample knapweed plants to determine efficacy of the insecticide on the root feeding insects, without disturbing plants in the control plots. In spring 2004, 46% of the plants were infested with root beetle larvae, which indicates that the insecticide application was only partially effective, at best. Seedhead insects did not appear to be significantly reduced by the insecticide applications (see Results).
Fire (annual brome only) The unusually dry conditions in the western US during the spring and summer of 2000 created
dangerous fire conditions. Fire bans were in effect in Colorado and Washington during our targeted spring burn dates due to large wildfires near the military bases. As a result, we were not able to burn the YTC cheatgrass site until July 21 and the FC burn was delayed until October 20, 2000. At the time of the burns, conditions were dry and the late season burns were hot enough to destroy a major portion of the annual brome seed on the soil surface, and the hot burns provided ideal conditions for fall seeding.
Control of N availability Nitrogen availability in the study plots was reduced by applying a carbon source to immobilize soil N
beginning in the summer of 2000 and continuing through the spring of 2003. Treatment plots received sucrose at a rate of 1600 kg C ha-1 yr-1. The sucrose was hand broadcast in increments throughout the year in order to provide a more temporally uniform reduction in available N through immobilization. Our objective was to time the applications with periods of weed growth (and N uptake) to be more effective. This sucrose application rate and method has been effective at reducing soil N availability in a number of ecosystems (McLendon and Redente 1992, McLendon and Redente 1994, Horn and Redente 1998, Paschke et al. 2000). We monitored the effectiveness of sucrose for reducing soil N availability using standard in situ ion-exchange resin bags during 2000, 2001 and 2002 (Binkley and Matson 1983). Results from the
Final Report
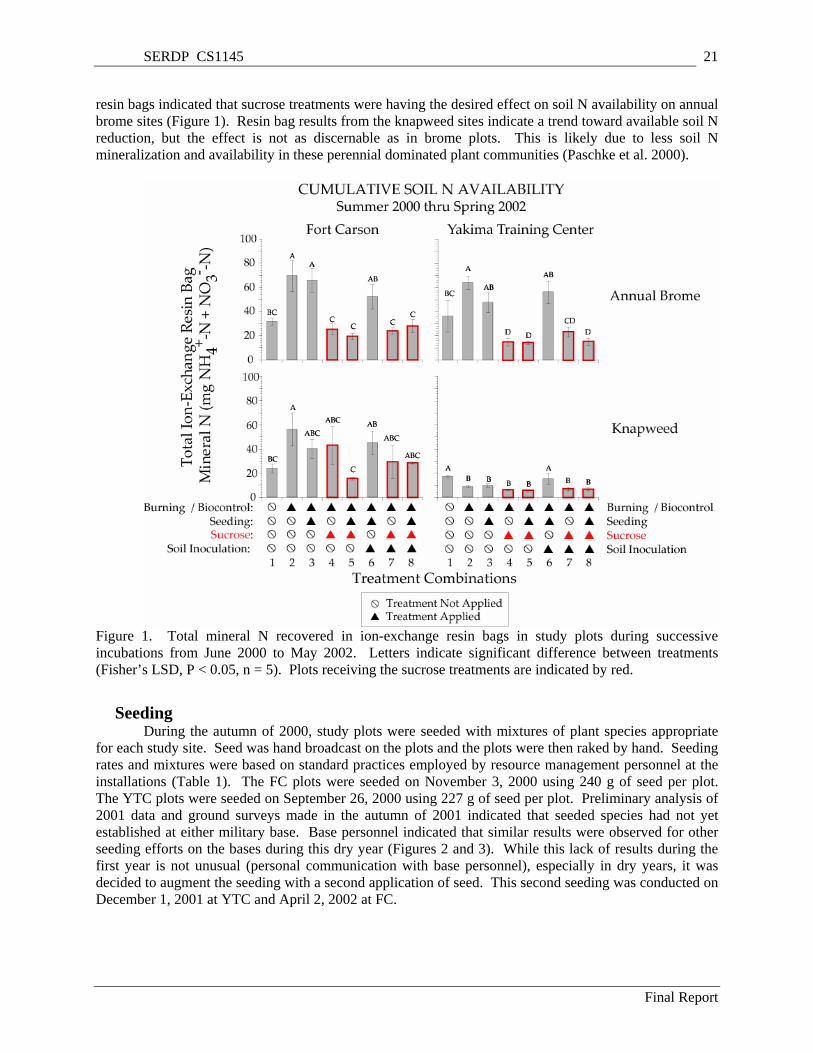
SERDP CS1145 21
resin bags indicated that sucrose treatments were having the desired effect on soil N availability on annual brome sites (Figure 1). Resin bag results from the knapweed sites indicate a trend toward available soil N reduction, but the effect is not as discernable as in brome plots. This is likely due to less soil N mineralization and availability in these perennial dominated plant communities (Paschke et al. 2000).
Figure 1. Total mineral N recovered in ion-exchange resin bags in study plots during successive incubations from June 2000 to May 2002. Letters indicate significant difference between treatments (Fisher’s LSD, P < 0.05, n = 5). Plots receiving the sucrose treatments are indicated by red.
Seeding During the autumn of 2000, study plots were seeded with mixtures of plant species appropriate
for each study site. Seed was hand broadcast on the plots and the plots were then raked by hand. Seeding rates and mixtures were based on standard practices employed by resource management personnel at the installations (Table 1). The FC plots were seeded on November 3, 2000 using 240 g of seed per plot. The YTC plots were seeded on September 26, 2000 using 227 g of seed per plot. Preliminary analysis of 2001 data and ground surveys made in the autumn of 2001 indicated that seeded species had not yet established at either military base. Base personnel indicated that similar results were observed for other seeding efforts on the bases during this dry year (Figures 2 and 3). While this lack of results during the first year is not unusual (personal communication with base personnel), especially in dry years, it was decided to augment the seeding with a second application of seed. This second seeding was conducted on December 1, 2001 at YTC and April 2, 2002 at FC.
Final Report
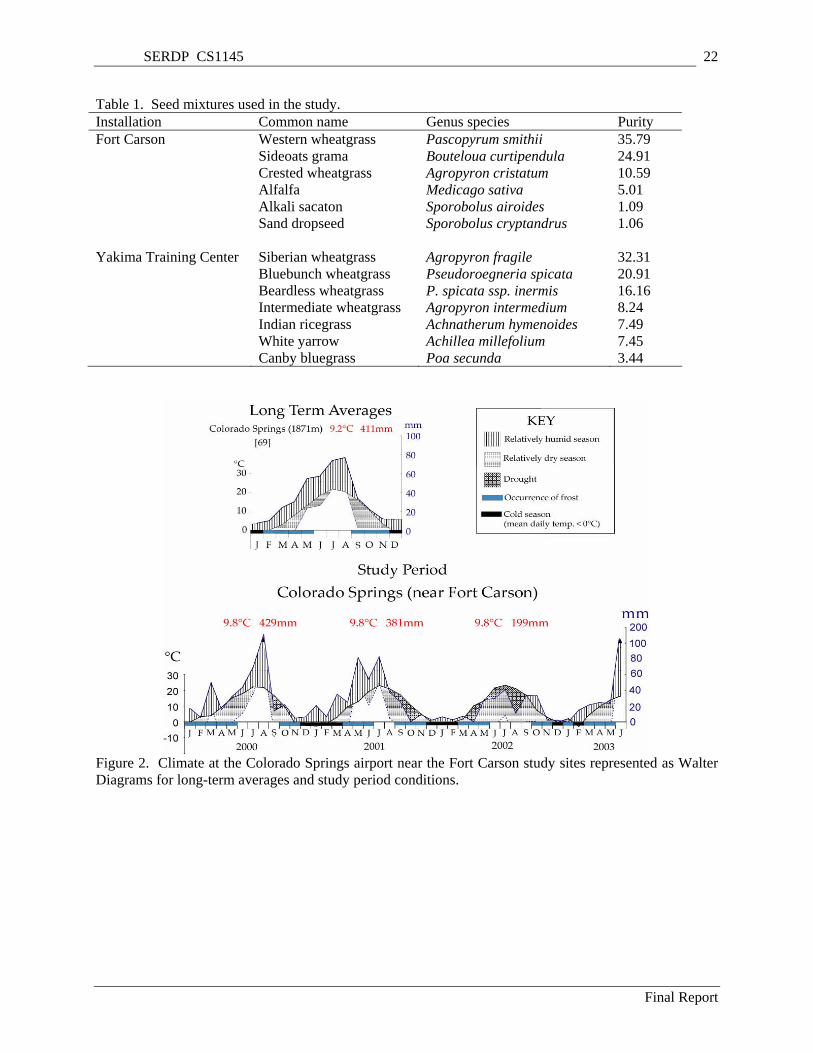
SERDP CS1145 22
Table 1. Seed mixtures used in the study. Installation Common name Genus species Purity Fort Carson Western wheatgrass Pascopyrum smithii 35.79 Sideoats grama Bouteloua curtipendula 24.91 Crested wheatgrass Agropyron cristatum 10.59 Alfalfa Medicago sativa 5.01 Alkali sacaton Sporobolus airoides 1.09 Sand dropseed Sporobolus cryptandrus 1.06 Yakima Training Center Siberian wheatgrass Agropyron fragile 32.31 Bluebunch wheatgrass Pseudoroegneria spicata 20.91 Beardless wheatgrass P. spicata ssp. inermis 16.16 Intermediate wheatgrass Agropyron intermedium 8.24 Indian ricegrass Achnatherum hymenoides 7.49 White yarrow Achillea millefolium 7.45 Canby bluegrass Poa secunda 3.44
Figure 2. Climate at the Colorado Springs airport near the Fort Carson study sites represented as Walter Diagrams for long-term averages and study period conditions.
Final Report
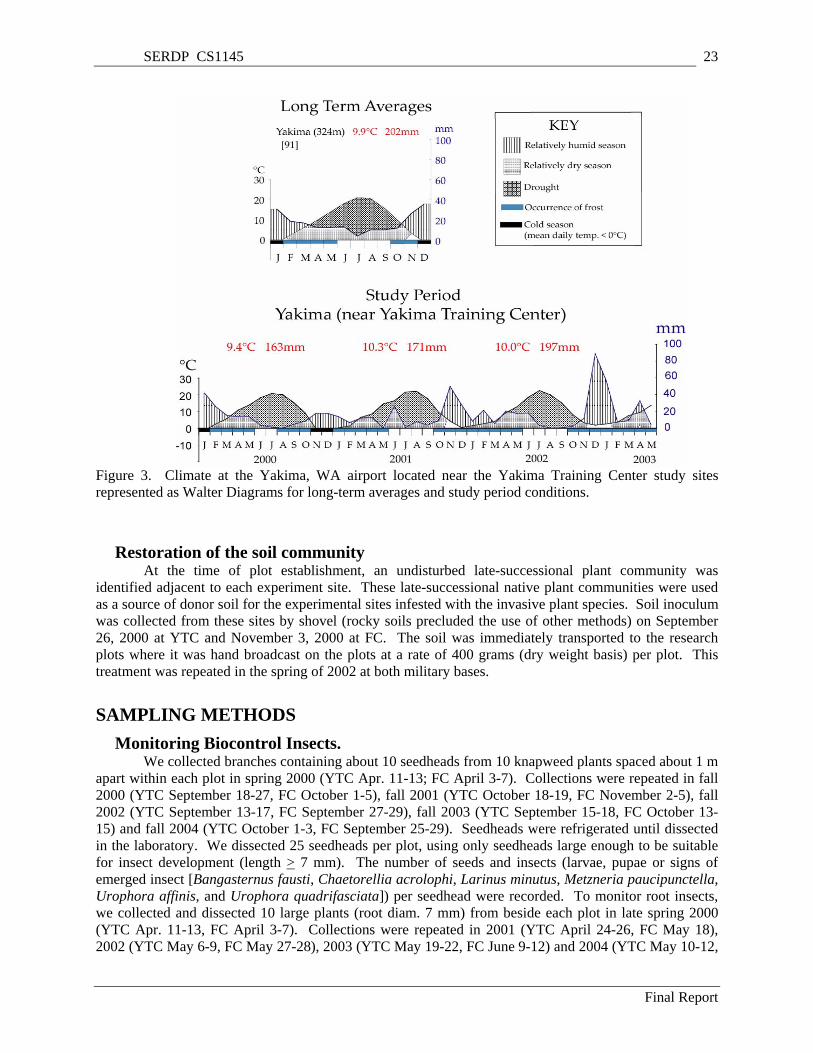
SERDP CS1145 23
Figure 3. Climate at the Yakima, WA airport located near the Yakima Training Center study sites represented as Walter Diagrams for long-term averages and study period conditions.
Restoration of the soil community At the time of plot establishment, an undisturbed late-successional plant community was
identified adjacent to each experiment site. These late-successional native plant communities were used as a source of donor soil for the experimental sites infested with the invasive plant species. Soil inoculum was collected from these sites by shovel (rocky soils precluded the use of other methods) on September 26, 2000 at YTC and November 3, 2000 at FC. The soil was immediately transported to the research plots where it was hand broadcast on the plots at a rate of 400 grams (dry weight basis) per plot. This treatment was repeated in the spring of 2002 at both military bases.
SAMPLING METHODS Monitoring Biocontrol Insects.
We collected branches containing about 10 seedheads from 10 knapweed plants spaced about 1 m apart within each plot in spring 2000 (YTC Apr. 11-13; FC April 3-7). Collections were repeated in fall 2000 (YTC September 18-27, FC October 1-5), fall 2001 (YTC October 18-19, FC November 2-5), fall 2002 (YTC September 13-17, FC September 27-29), fall 2003 (YTC September 15-18, FC October 13-15) and fall 2004 (YTC October 1-3, FC September 25-29). Seedheads were refrigerated until dissected in the laboratory. We dissected 25 seedheads per plot, using only seedheads large enough to be suitable for insect development (length > 7 mm). The number of seeds and insects (larvae, pupae or signs of emerged insect [Bangasternus fausti, Chaetorellia acrolophi, Larinus minutus, Metzneria paucipunctella, Urophora affinis, and Urophora quadrifasciata]) per seedhead were recorded. To monitor root insects, we collected and dissected 10 large plants (root diam. 7 mm) from beside each plot in late spring 2000 (YTC Apr. 11-13, FC April 3-7). Collections were repeated in 2001 (YTC April 24-26, FC May 18), 2002 (YTC May 6-9, FC May 27-28), 2003 (YTC May 19-22, FC June 9-12) and 2004 (YTC May 10-12,
Final Report
SERDP CS1145 24
FC June 7-9). We recorded number and stage of root-feeding insects (Agapeta zoegana, Cyphocleonus achates, and Sphenoptera jugoslavica).
Knapweed density and fitness. At YTC, we counted the number of diffuse knapweed plants, rosettes (individual leaf whorls),
seedlings, and bolts in six 0.5- x 2-m quadrats placed at permanent, equally-spaced locations in each plot (positioned at 2, 5 and 8 m north along transects placed at 3 and 7 m along the southern side of the plot, facing west) September 18-27, 2000. Detailed measurements of knapweed fitness (plant height, number of bolted stems, number of seedheads, root diameter) were made on one mature plant and rosette per quadrat (closest plant to a fixed point). At FC we counted number of spotted knapweed bolts and rosettes in six 20-cm x 2-m quadrats placed at permanent, equally-spaced locations in each plot (positioned at 2, 5 and 8 m north along transects placed at 3 and 7 m along the southern side of the plot, facing west) on October 1-5, 2000. Seedlings were counted in half the quadrat. At FC, we did not count individual knapweed plants because it is often difficult to distinguish whether nearby bolts and rosettes are attached to the same root. Detailed measurements of knapweed fitness (plant height, number of bolted stems, number of seedheads, root diameter, plant stage, (R1, R2, B1, B2), number of rosettes) were made on one mature plant and one rosette plant per quadrat (closest plant to a fixed point). The quadrats were permanently marked with blue "stake chasers" at YTC on April 23-26, 2001 and at FC on May 13-18, 2001, and knapweed plants were counted as before. Knapweed counts and measurements of fitness were repeated each spring and fall in 2001, 2002 and 2003 (at YTC on April 24-26, 2001, August 13-16, 2001, May 6-9, 2002, September 13-17, 2002, May 19-22, 2003, September 15-18, 2003, May 10-12, 2004 and October 1-4, 2004; and at FC on May 18, 2001, November 2-5, 2001, May 27-28, 2002, September 27-29, 2002, June 9-12, 2003, October 13-15, 2003, June 7-9, 2004 and September 25-29, 2004).
Soil community structure and function Microscopic assessment of microbial community structure
To assess the effectiveness of the soil inoculations (treatments 6-8), we collected soil samples in each plot (at the time of plant community biomass sampling) for microbial community analysis. Ten soil samples were collected in each study plot using a 1.5- x 15-cm soil corer. These ten soil samples were composited to yield one soil sample per research plot. Samples were processed in the field by gently sieving through a 2.0 mm-mesh screen. Portions of these samples were kept for measures of soil chemical characteristics (moisture, pH, total N and C). The remaining samples were then shipped by overnight delivery under cooled (5oC) conditions for microscopy-based assessment of microbial community structure. Microscopic analyses were completed within 48 h of the time of sampling. Total and active fungal biomass was determined by measuring the length and diameter of all hyphae in agar-film soil suspensions using FDA and a combination of epifluorescent and phase contrast/DIC microscopy (Ingham and Klein 1984a, b, Stamatiadis et al. 1990, Lodge and Ingham 1991).
Molecular assessment of Glomus occurrence in roots of selected plant species Effectiveness of soil inoculation was also assessed by examining Glomus (an important plant
symbiont) occurrence in selected native plant species from soil inoculation plots, control plots and reference areas (where soil inocula was obtained) by the use of polymerase chain reaction (PCR) procedures. The goal of this work was to identify AM fungal taxa unique to the reference area that could be used to gauge establishment of AM fungi in inoculated plots. Root samples were held at -80 °C, and initial root sample preparation for microscopic and polymerase chain reaction (PCR)-based analysis of AM fungal types was completed. Using sterile conditions, samples of roots were cut into 1-2 mm segments and these were stored under -80 °C conditions, from which root samples were taken for analyses. Samples of Glomus intraradices, from BioNet, LLC, Marina CA, and of Glomus etunicatum NE108A-5, in artificial soil, were used as positive controls.
Major efforts of this research were given to selection and evaluation of primers to be used in the Polymerase Chain Reaction (PCR) of the root samples. Primers were received from Operon
Final Report
SERDP CS1145 25
Technologies, and the following were used in the nested reactions, based on the recommendations of van Tuinen, et al. (1998).
ITS1: 5' TCCGTAGGTGAACCTGCGG 3' NSL22: 5' TGGTCCGTGTTTCAAGACG 3' LR1: 5' GCATATCAATAAGCGGAGGA 3'
These were used in a nested PCR format, as noted, with the ITS1 and NDL22 being used in the first PCR step as the forward and reverse primers, respectively, followed by use of the QIAquick PCR Purification kit 28104 to remove excess dNTP, primer and templates. Then the second PCR was run, using the LR1 (forward) and NDL22 as the reverse primer. The PCR first step was set up using the following PCR conditions:
1. Hot start 95°C – 5 min 2. Load Taq 80°C - 1 hour available 3. initial denature 95°C - 3 min 4. anneal 58°C - 1 min 5. extension 72°C - 1 min 6. denature 93°C - 1 min 7. anneal 48°C - 1 min 8. extension 72°C - 1 min (repeat 6,7,8 steps 35 times) 9. final extension 72°C - 5 min 10 hold 4°C - 24 hrs.
This yielded products of 324 bp for Glomus, and for other AM fungi, a product of 276 bp. These product size differences made it possible to directly screen PCR products for Glomus vs. other AM fungi. Initial gel electrophoresis runs were completed to establish the optimum marker dye-PCR product ratio. Based on initial results, gels were loaded with 2 µl of dye and 3µ of DNA sample.
The Bio101 soil DNA extraction kit was used in a first set of extractions using the two Glomus cultures as positive controls and 5 pairs of washed and unwashed root samples from the test sites. Based on gel electrophoresis, it was possible to extract DNA from these samples using this rapid kit approach.
In this second phase of the molecular studies, two approaches were used for fungal DNA extraction; the van Tuinen (1998) Chelex procedure in the first phase of the study and the Kjoller and Rosendahl (2000) procedure later in the study. The final DNA extractions were done using the Bio101 FastDNA kit, Catalog # 6540-400-85834. Extracted DNA was then used in the PCR procedure. Primers were received from Operon Technologies. The following was used in the nested reactions, based on the recommendations of Van Tuinen, et al. (1998).
ITS1: 5' TCCGTAGGTGAACCTGCGG 3' NDL22: 5' TGGTCCGTGTTTCAAGACG 3' LR1: 5' GCATATCAATAAGCGGAGGA 3'
Initially, primers used in the nested PCR were to be based on the recommendations of van Tuinen, et al. (1998) as used by Kjoller and Rosendahl (2000). These involve the same eukaryotic primers as used by van Tuinen, et al., (1998), LR1 (forward) and NDL22 (reverse) in the primary PCR, with a more specific set of AM fungus-specific primers, as noted below, used in the second nested PCR step:
Final Report
SERDP CS1145 26
Primary PCR LSU 0061 5′AGCATATCAATAAGCGGAGGA LSU 0599 5′TGGTCCGTGTTTCAAGACG (these primers are also known as LR1 and NDL22, VanTuinen 1998). Nested PCR- LSU4f 5′GGGAGGTAAATTTCTCCTAAGGC LSU7r 5′ATCGAAGCTACACATTCCTCC
In addition to the contents of the MβP EasyStart PCR Mix-in-a-tube, Catalog #6022, 1 µL DNA template (10ng/µL), 1 µL LSU0061 (50pmol/µL), 1 µL LSU0559 (50pmol/µL), 0.625µL BSA, 0.25µL Taq polymerase (5 units/µL), and 21.125µL molecular biology grade water were added to the reaction mix. Samples were then put into the thermal cycler using the following cycles: 95°C for 5 minutes of initial denaturation, and 30 cycles of 93°C for 1 minute denaturation, 55°C for 1 minute annealing, 72°C for 1 minute 30 seconds extension each cycle; then 72°C for 5 minutes final extension and 4°C for up to 24 hours until the samples are removed from the thermal cycler.
The PCR product was then purified using QIAGEN QIAquick PCR Purification kit, Catalog #28104. The protocol supplied with the kit was used. The nested PCR was then performed on the primary PCR products using the AM fungal-specific LSU4f and LSU7r primers. Samples were then put into the thermal cycler using the following cycles: 95°C for 5 minutes of initial denaturation, and 25 cycles of 93°C for 1 minute denaturation, 60°C for 1 minute annealing, 72°C for 1 minute 4 seconds extension; and then 72°C for 5 minutes final extension (Kjoller and Rosendahl, 2000, 2001).
The nested PCR products were then purified using the QIAGEN QIAquick PCR Purification Kit (50). The protocol was followed as in the primary PCR except for the final DNA elution. Instead of using the EB buffer, the DNA was eluted in 30µL molecular biology grade water at 50°C so that the samples could be sent for sequencing. The salts contained in the EB buffer cause inaccurate sequencing.
As carried out in earlier work, variations in template concentration were evaluated, together with the use of bovine serum albumin (BSA) to react with possibly inhibitory humic acids.
Sequencing of PCR products was carried out using the T7 sequencing system as carried out by Seqwrite (http://seqwright.com) at the University of Colorado, Boulder, CO. Sequences were aligned and edited, and compared with other fungal ITS region sequences deposited in GenBank (http://www.ncbi.nlm.nih.gov), as well as the EMBL data base (http://www.ebi.ac.uk/ebi_home.html), the Ribosomal Database Project (http://www.cme.msu.edu/RDP/html/index/html), the NCBI (http://ncbi.nlm.nih.gov) and the Duke University fungal sequence collection.
Root microscopic analyses The percent root infection, vesicle and arbuscule occurrence in select native plants at the two sites
was carried out using root standard clearing and microscopic procedures (Phillips and Hayman, 1970; Schenck, l982; Barrow et al., l997) with examination of stained roots at 400x, after mounting of roots in lactoglycerol. Root samples collected for the Glomus work described above were used here. For each plant, five root samples were used, and five fields were examined per root sample, or a total of 25 fields per plant. The intensity of fungal infection was determined by the intersect method as carried out by Klein and Paschke (2000), and Barrow et al., (l997). Vesicle and arbuscule occurrence was scored in terms of the number of structures observed per mm2 of root observed.
Systemic Endophytic fungal (SEF) and possible Chytrid Presence Presence of chytrids in root materials, visually considered to be Olpidium, was carried out using
roots cleared for percent root infection, vesicle and arbuscule occurrence. These were examined at 400X magnification and five fields were examined on each root sample, with five roots being examined per
Final Report

SERDP CS1145 27
plant, using a double-blind format. SEF/Chytrid occurrence was estimated on the basis of presence or absence of characteristic resting structures of SEF (Barrow, 2003) and Olpidium (Mozafar et al., 2000) in observed fields, and expressed as the percent occurrence of structures per observed field.
Plant community biomass Plant community biomass composition of the research plots was assessed in May of 2000 through
2003 at YTC, and June and July of 2000 through 2003 at FC, by clipping ten randomly located 0.5 m2 quadrats in each study plot. Plants were clipped to ground level, separated by species, and then transported to the lab where they were dried to constant mass and weighed. Voucher specimens of all plant taxa were collected for positive identification and deposition in the Restoration Ecology Herbarium at CSU.
Final Report
SERDP CS1145 28
PROJECT ACCOMPLISHMENTS AND RESULTS – FIELD STUDIES
BIOLOGICAL CONTROL AGENTS AND KNAPWEED DENSITY AND FITNESS
Yakima Training Center. The knapweed root-borer, Sphenoptera jugoslavica, which was established before the beginning of
this project, maintained a high attack rate at the knapweed release site (near Range 73) (Figure 1). It increased at both the control site (Badger Gap) and alternate control site (Doris) and attained an equal attack rate at all sites by spring 2003. Samples at all sites were taken just outside each experimental plot, so the plants from the control site were not exposed to insecticide and therefore may overestimate the attack rate of plants inside the control site plots in spring 2003 and 2004. The root-borer population decreased significantly in spring 2004 at the check site, which may have been in response to the insecticide applications the preceding summer.
The knapweed flower weevil, Larinus minutus, which was released in July 2000, became well established at the knapweed release site and increased to infestation rates of about 50% of the seedheads (Figure 2). However, this insect has also spread from other releases to the two control sites. At the alternate control site, infestation rates rose to levels similar to those at the release site during 2002 and 2003. At the control site, the population increased until 2002, when insecticide applications began. The insecticide probably partially suppressed this insect during 2002 and 2003, but it began to increase again in 2004, when insecticides were not applied. The cause for the dramatic decrease of the weevil population at the alternate control site in 2004 is not known.
Two seedhead gall flies, Urophora affinis and U. quadrifasciata, which were introduced over 20 years ago, are attacking knapweeds at the three sites (Figure 3). At the release site, their populations declined from 2000 to 2002 and then remained constant, probably because of increasing competition with the flower weevil. At the alternate control site, the pattern of decrease then increase of the fly populations is the opposite of that of the flower weevil population. At the control site, where the weevil population was less than half that at the release site, the fly population was about twice as high (2002-2004). The flies were not being well controlled by insecticide in 2002-2003 at the control site, probably because it was not being applied frequently enough. The combined attack rate by all seedhead insects increased at the release site from 40% in 2000 to 70% in 2004. The numbers in 2003 and 2004 may be underestimations due to rodent predation of insects in the seedheads (Figure 4). The sustained high attack rate by the root and seedhead insects is promising for biological control of diffuse knapweed.
The density of knapweed bolts (flower stems) and seedheads decreased by 92% and 83%, respectively, between 2000 and 2001 at the release site (Figures 5 and 6). By 2002, there were similar decreases at the control site (86% and 92%, respectively), which had become similarly infested by insects. The number of rosettes slightly decreased at these two sites and remained low over the course of the experiment (Figure 7). Spring seedling densities were higher at the control site than at the release site in 2001 and 2002, but dropped to similarly low levels in 2003 and 2004, presumably due to depletion of the soil seedbank and the cumulative effect of insects and other factors reducing seed production (Figure 8). Knapweed populations remained much higher at the alternate control site, which was a gravel bed with little competing vegetation. The relatively high densities of seedlings in 2003 and 2004 at the alternate control site reflect favorable environmental conditions for germination of seeds in the soil seedbank. Such a rebound is not surprising because knapweed seeds can persist in the soil for 7 or more years. The absence of similar resurgences at the release and control site suggest that the seedbanks at these sites has been severely depleted, which is encouraging for long-term control of the weed.
Final Report
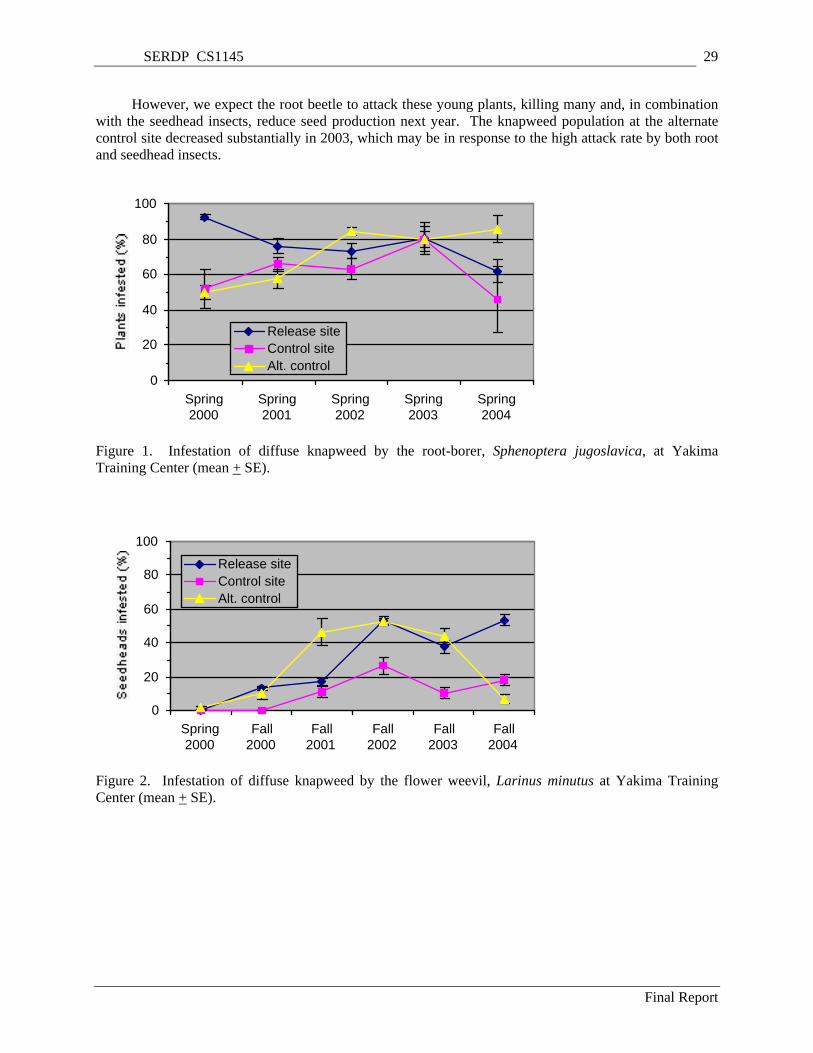
SERDP CS1145 29
However, we expect the root beetle to attack these young plants, killing many and, in combination with the seedhead insects, reduce seed production next year. The knapweed population at the alternate control site decreased substantially in 2003, which may be in response to the high attack rate by both root
Figure 1. Infestation
and seedhead insects.
of diffuse knapweed by the root-borer, Sphenoptera jugoslavica, at Yakima
0
20
40
60
80
100
Spring2000
Spring2001
Spring2002
Spring2003
Spring2004
Pla
nts
infe
sted
(%)
Release siteControl siteAlt. control
Training Center (mean + SE).
0
20
40
60
80
100
Spring2000
Fall2000
Fall2001
Fall2002
Fall2003
Fall2004
Release siteControl siteAlt. control
Figure 2. Infestation of diffuse knapweed by the flower weevil, Larinus minutus at Yakima Training enter (mean +C SE).
Final Report
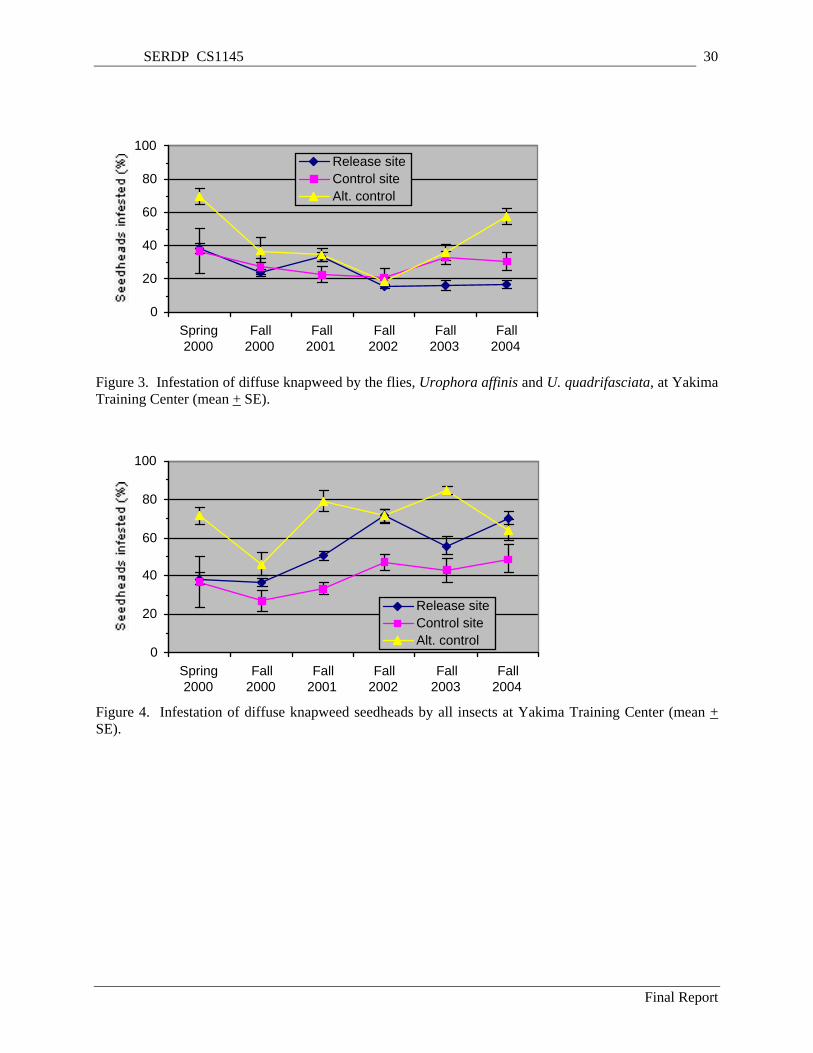
SERDP CS1145 30
0
20
40
60
80
100
Spring2000
Fall2000
Fall2001
Fall2002
Fall2003
Fall2004
Release siteControl siteAlt. control
Figure 3. Infestation of diffuse knapweed by the flies, Urophora affinis and U. quadrifasciata, at Yakima Training Center (mean + SE).
igure 4. Infestation of diffuse knapweed seedheads by all insects at Yakima Training Center (mean +
0
20
40
60
80
100
Spring2000
Fall2000
Fall2001
Fall2002
Fall2003
Fall2004
Release siteControl siteAlt. control
FSE).
Final Report

SERDP CS1145 31
0
5
10
15
20
Fall 2000 Fall 2001 Fall 2002 Fall 2003 Fall 2004
Release siteControl siteAlt. control
Figure 5. Density of diffuse knapweed bolts (flower stems) at Yakima Training Center (mean + SE).
Figure 6. Density of diffuse knapweed seedheads at Yakima Training Center (mean + SE).
0
1,000
2,000
3,000
4,000
Fall 2000 Fall 2001 Fall 2002 Fall 2003 Fall 2004
Release siteControl siteAlt. control
Final Report
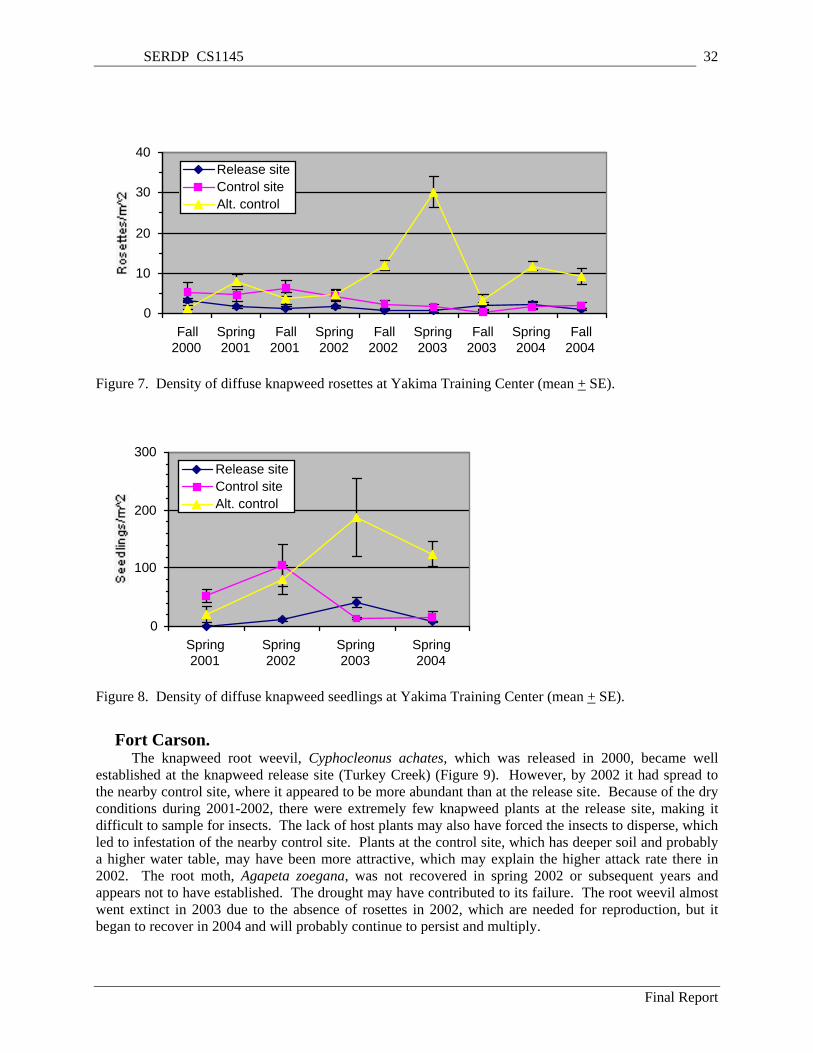
SERDP CS1145 32
0
10
20
30
40
Fall2000
Spring2001
Fall2001
Spring2002
Fall2002
Spring2003
Fall2003
Spring2004
Fall2004
Release siteControl siteAlt. control
Figure 7. Density of diffuse knapweed rosettes at Yakima Training Center (mean + SE).
Figure 8. Density of diffuse knapweed seedlings at Yakima Training Center (mean + SE).
Fort Carson. root weevil, Cyphocleonus achates, which was released in 2000, became well
establ
0
100
200
300
Spring2001
Spring2002
Spring2003
Spring2004
Release siteControl siteAlt. control
The knapweedished at the knapweed release site (Turkey Creek) (Figure 9). However, by 2002 it had spread to
the nearby control site, where it appeared to be more abundant than at the release site. Because of the dry conditions during 2001-2002, there were extremely few knapweed plants at the release site, making it difficult to sample for insects. The lack of host plants may also have forced the insects to disperse, which led to infestation of the nearby control site. Plants at the control site, which has deeper soil and probably a higher water table, may have been more attractive, which may explain the higher attack rate there in 2002. The root moth, Agapeta zoegana, was not recovered in spring 2002 or subsequent years and appears not to have established. The drought may have contributed to its failure. The root weevil almost went extinct in 2003 due to the absence of rosettes in 2002, which are needed for reproduction, but it began to recover in 2004 and will probably continue to persist and multiply.
Final Report
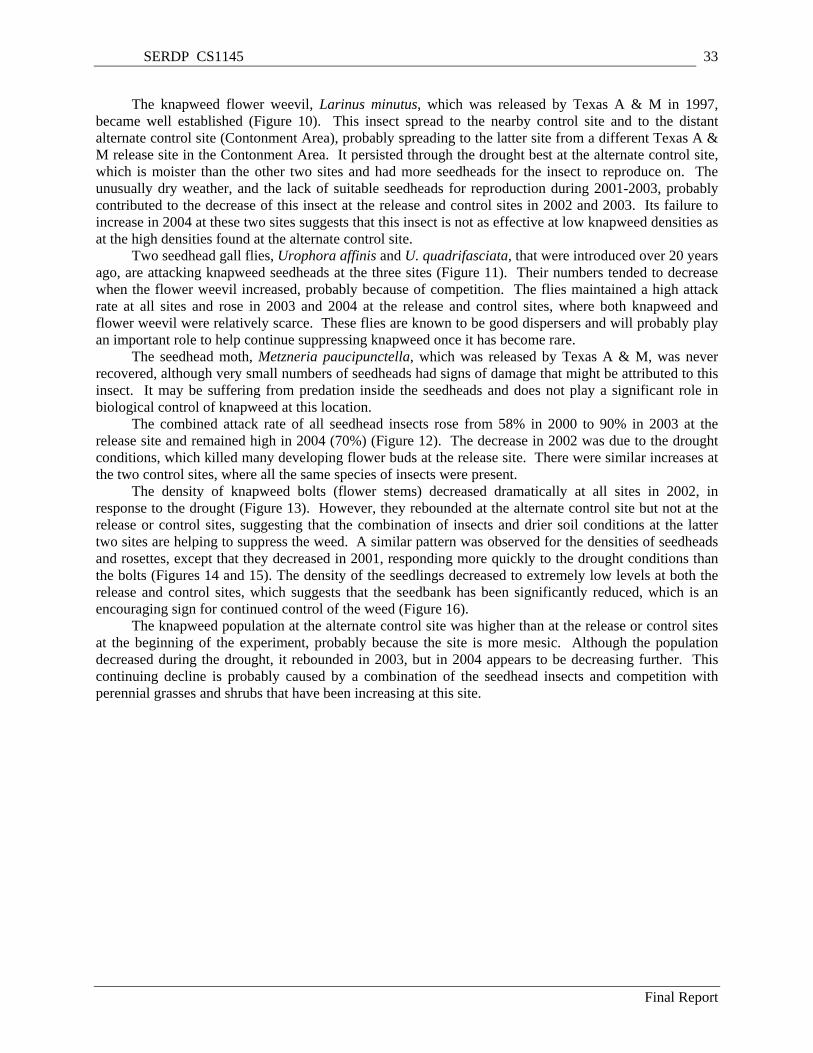
SERDP CS1145 33
The knapweed flower weevil, Larinus minutus, which was released by Texas A & M in 1997, became well established (Figure 10). This insect spread to the nearby control site and to the distant alternate control site (Contonment Area), probably spreading to the latter site from a different Texas A & M release site in the Contonment Area. It persisted through the drought best at the alternate control site, which is moister than the other two sites and had more seedheads for the insect to reproduce on. The unusually dry weather, and the lack of suitable seedheads for reproduction during 2001-2003, probably contributed to the decrease of this insect at the release and control sites in 2002 and 2003. Its failure to increase in 2004 at these two sites suggests that this insect is not as effective at low knapweed densities as at the high densities found at the alternate control site.
Two seedhead gall flies, Urophora affinis and U. quadrifasciata, that were introduced over 20 years ago, are attacking knapweed seedheads at the three sites (Figure 11). Their numbers tended to decrease when the flower weevil increased, probably because of competition. The flies maintained a high attack rate at all sites and rose in 2003 and 2004 at the release and control sites, where both knapweed and flower weevil were relatively scarce. These flies are known to be good dispersers and will probably play an important role to help continue suppressing knapweed once it has become rare.
The seedhead moth, Metzneria paucipunctella, which was released by Texas A & M, was never recovered, although very small numbers of seedheads had signs of damage that might be attributed to this insect. It may be suffering from predation inside the seedheads and does not play a significant role in biological control of knapweed at this location.
The combined attack rate of all seedhead insects rose from 58% in 2000 to 90% in 2003 at the release site and remained high in 2004 (70%) (Figure 12). The decrease in 2002 was due to the drought conditions, which killed many developing flower buds at the release site. There were similar increases at the two control sites, where all the same species of insects were present.
The density of knapweed bolts (flower stems) decreased dramatically at all sites in 2002, in response to the drought (Figure 13). However, they rebounded at the alternate control site but not at the release or control sites, suggesting that the combination of insects and drier soil conditions at the latter two sites are helping to suppress the weed. A similar pattern was observed for the densities of seedheads and rosettes, except that they decreased in 2001, responding more quickly to the drought conditions than the bolts (Figures 14 and 15). The density of the seedlings decreased to extremely low levels at both the release and control sites, which suggests that the seedbank has been significantly reduced, which is an encouraging sign for continued control of the weed (Figure 16).
The knapweed population at the alternate control site was higher than at the release or control sites at the beginning of the experiment, probably because the site is more mesic. Although the population decreased during the drought, it rebounded in 2003, but in 2004 appears to be decreasing further. This continuing decline is probably caused by a combination of the seedhead insects and competition with perennial grasses and shrubs that have been increasing at this site.
Final Report
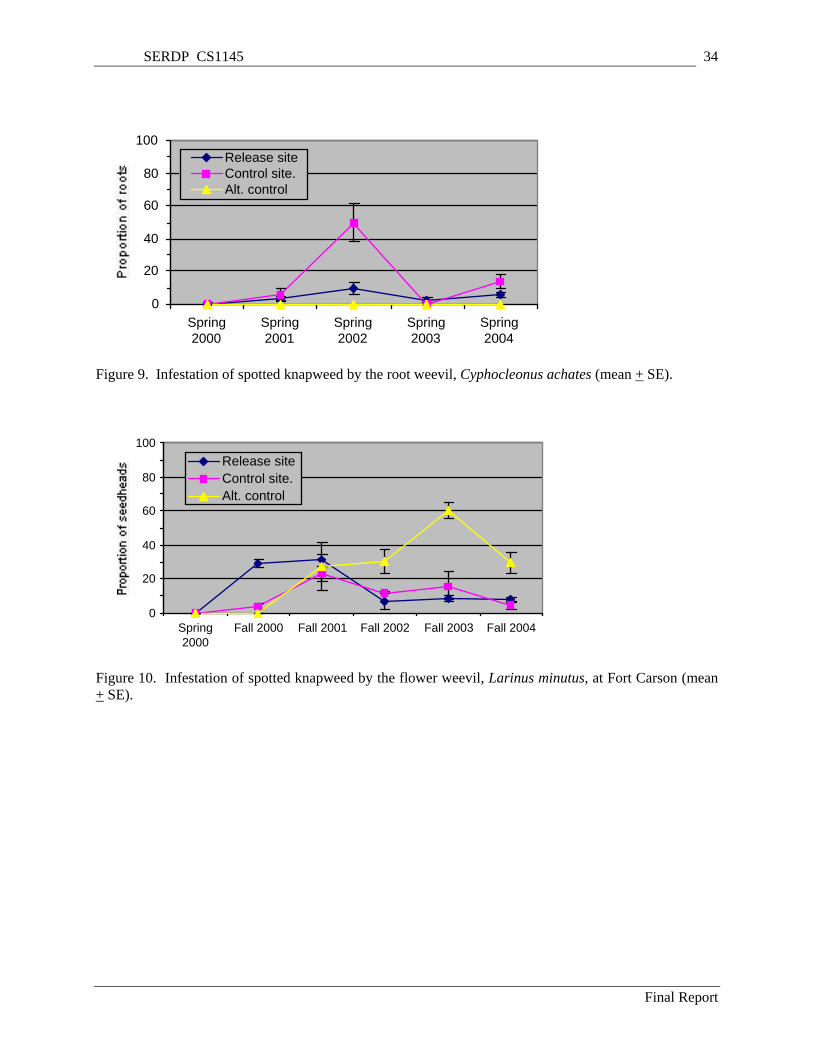
SERDP CS1145 34
0
20
40
60
80
100
Spring2000
Spring2001
Spring2002
Spring2003
Spring2004
Release siteControl site.Alt. control
Figure 9. Infestation of spotted knapweed by the root weevil, Cyphocleonus achates (mean + SE).
Figure 10. Infestation of spotted knapweed by the flower weevil, Larinus minutus, at Fort Carson (mean
0
20
40
60
80
100
Spring2000
Fall 2000 Fall 2001 Fall 2002 Fall 2003 Fall 2004
Release siteControl site.Alt. control
+ SE).
Final Report
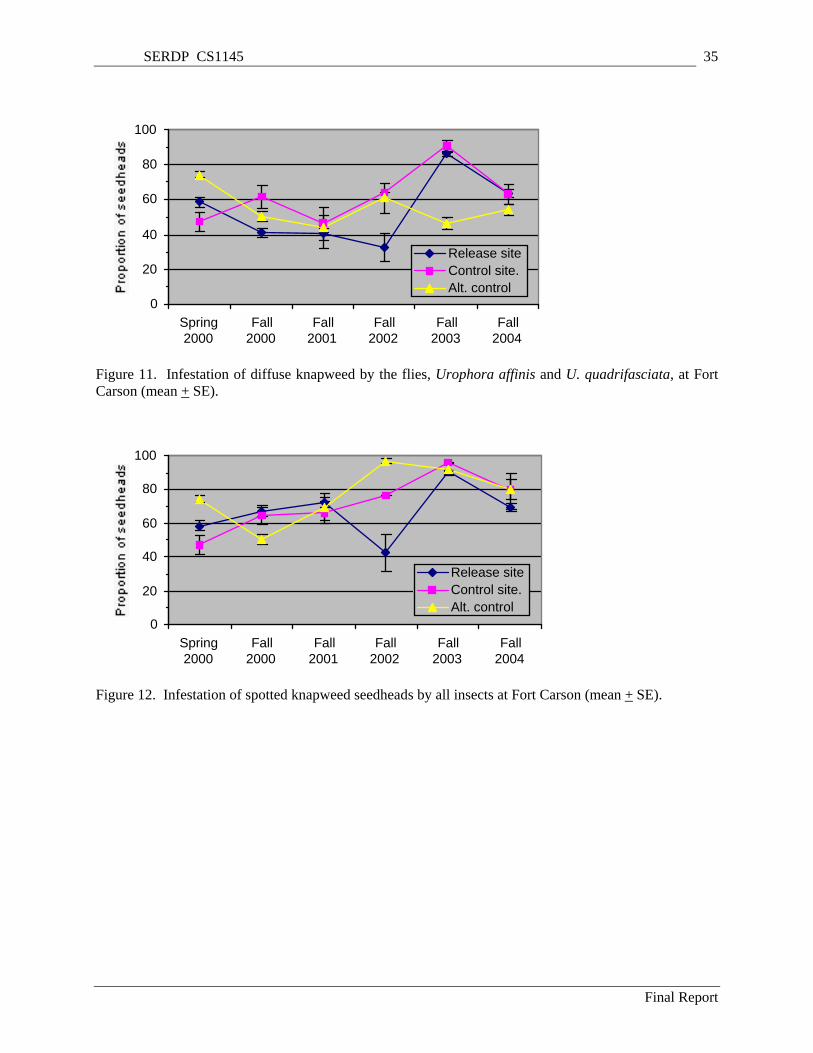
SERDP CS1145 35
0
20
40
60
80
100
Spring2000
Fall2000
Fall2001
Fall2002
Fall2003
Fall2004
Release siteControl site.Alt. control
Figure 11. Infestation of diffuse knapweed by the flies, Urophora affinis and U. quadrifasciata, at Fort Carson (mean + SE).
Figure 12. Infestation of spotted knapweed seedheads by all insects at Fort Carson (mean + SE).
0
20
40
60
80
100
Spring2000
Fall2000
Fall2001
Fall2002
Fall2003
Fall2004
Release siteControl site.Alt. control
Final Report

SERDP CS1145 36
0
50
100
150
200
Fall 2000 Fall 2001 Fall 2002 Fall 2003 Fall 2004
Release siteControl site.Alt. control
Figure 13. Density of spotted knapweed bolts (flower stems) at Fort Carson (mean + SE).
Figure 14. Density of spotted knapweed seedheads at Fort Carson (mean + SE).
0
500
1,000
1,500
2,000
Fall 2000 Fall 2001 Fall 2002 Fall 2003 Fall 2004
Release siteControl site.Alt. control
Final Report

SERDP CS1145 37
0
100
200
300
400
500
Fall2000
Spring2001
Fall2001
Spring2002
Fall2002
Spring2003
Fall2003
Spring2004
Fall2004
Release siteControl site.Alt. control
Figure 15. Density of spotted knapweed rosettes at Fort Carson (mean + SE).
Figure 16. Density of spotted knapweed seedlings at Fort Carson (mean + SE).
Recommendations to the DOD Regarding Biological Control of Knapweed. pecies
can be f
SOIL COMMUNITY
nd endophytic fungal infection
0
200
400
600
800
Spring2001
Spring2002
Spring2003
Spring2004
Release siteControl site.Alt. control
Recommendations regarding the use of biological control agents for invasive knapweed sound in Appendix D. This separate brochure will be sent to collaborating military bases.
2000 Studies Mycorrhizal a
the YTC sites and the annual brome at the FC site,
The mycorrhizal and endophytic fungal infection for including vesicle and arbuscule occurrence, were decreased in the disturbed plots, based on
results of the first 2000 season of sampling (Table 2). The only site where this relationship was not observed was the FC site knapweed plots. These results indicated the assessment of fungal root infection
Final Report
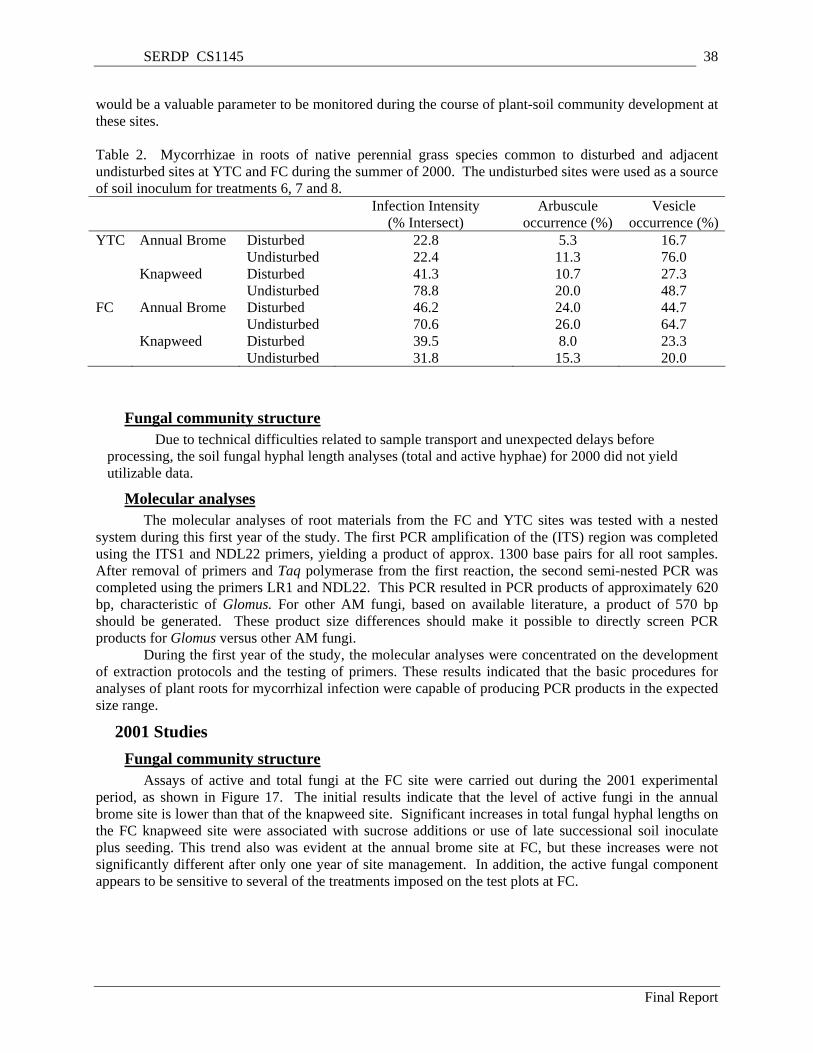
SERDP CS1145 38
would be a valuable parameter to be monitored during the course of plant-soil community development at these sites.
Table 2. Mycorrhizae in roots of native perennial grass species common to disturbed and adjacent undisturbed sites at YTC and FC during the summer of 2000. The undisturbed sites were used as a source of soil inoculum for treatments 6, 7 and 8. Infection Intensity
(% Intersect) Arbuscule
occurrence (%) Vesicle
occurrence (%)YTC Annual Brome Disturbed 22.8 5.3 16.7 Undisturbed 22.4 11.3 76.0 Knapweed Disturbed 41.3 10.7 27.3 Undisturbed 78.8 20.0 48.7 FC Annual Brome Disturbed 46.2 24.0 44.7 Undisturbed 70.6 26.0 64.7 Knapweed Disturbed 39.5 8.0 23.3 Undisturbed 31.8 15.3 20.0
Fungal community structure Due to technical difficulties related to sample transport and unexpected delays before
processing, the soil fungal hyphal length analyses (total and active hyphae) for 2000 did not yield utilizable data.
Molecular analyses The molecular analyses of root materials from the FC and YTC sites was tested with a nested
system during this first year of the study. The first PCR amplification of the (ITS) region was completed using the ITS1 and NDL22 primers, yielding a product of approx. 1300 base pairs for all root samples. After removal of primers and Taq polymerase from the first reaction, the second semi-nested PCR was completed using the primers LR1 and NDL22. This PCR resulted in PCR products of approximately 620 bp, characteristic of Glomus. For other AM fungi, based on available literature, a product of 570 bp should be generated. These product size differences should make it possible to directly screen PCR products for Glomus versus other AM fungi.
During the first year of the study, the molecular analyses were concentrated on the development of extraction protocols and the testing of primers. These results indicated that the basic procedures for analyses of plant roots for mycorrhizal infection were capable of producing PCR products in the expected size range.
2001 Studies Fungal community structure
Assays of active and total fungi at the FC site were carried out during the 2001 experimental period, as shown in Figure 17. The initial results indicate that the level of active fungi in the annual brome site is lower than that of the knapweed site. Significant increases in total fungal hyphal lengths on the FC knapweed site were associated with sucrose additions or use of late successional soil inoculate plus seeding. This trend also was evident at the annual brome site at FC, but these increases were not significantly different after only one year of site management. In addition, the active fungal component appears to be sensitive to several of the treatments imposed on the test plots at FC.
Final Report
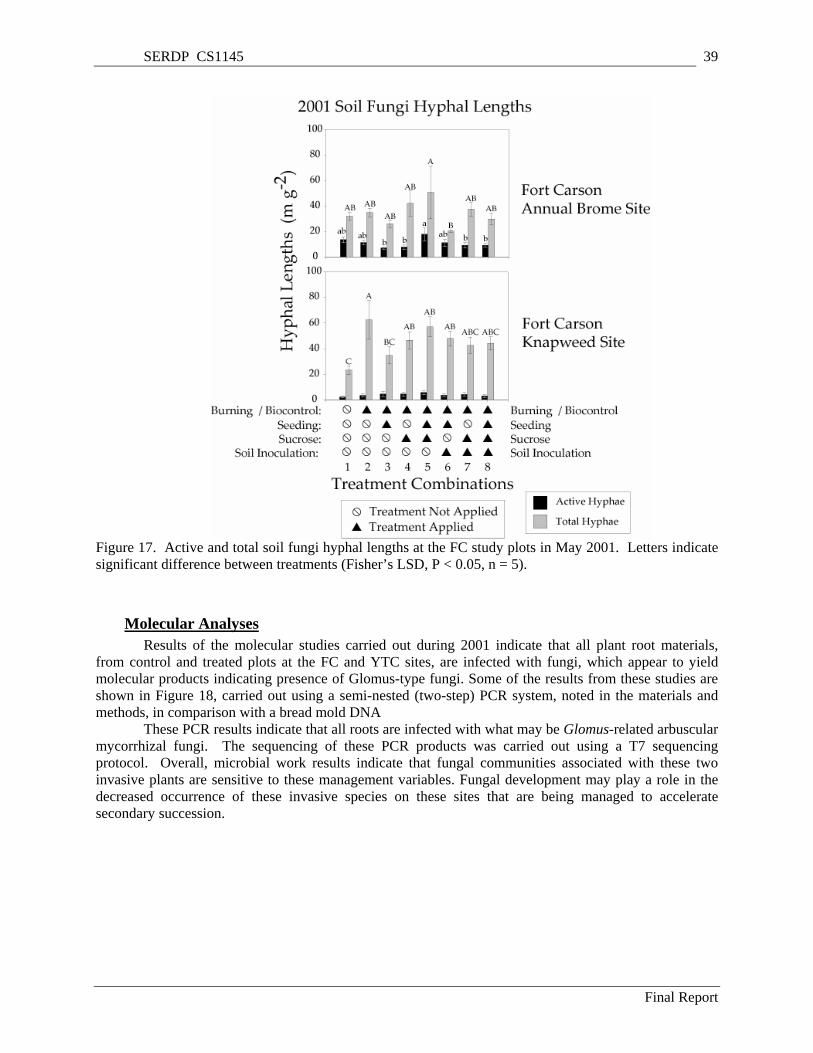
SERDP CS1145 39
Figure 17. Active and total soil fungi hyphal lengths at the FC study plots in May 2001. Letters indicate significant difference between treatments (Fisher’s LSD, P < 0.05, n = 5).
Molecular Analyses Results of the molecular studies carried out during 2001 indicate that all plant root materials,
from control and treated plots at the FC and YTC sites, are infected with fungi, which appear to yield molecular products indicating presence of Glomus-type fungi. Some of the results from these studies are shown in Figure 18, carried out using a semi-nested (two-step) PCR system, noted in the materials and methods, in comparison with a bread mold DNA
These PCR results indicate that all roots are infected with what may be Glomus-related arbuscular mycorrhizal fungi. The sequencing of these PCR products was carried out using a T7 sequencing protocol. Overall, microbial work results indicate that fungal communities associated with these two invasive plants are sensitive to these management variables. Fungal development may play a role in the decreased occurrence of these invasive species on these sites that are being managed to accelerate secondary succession.
Final Report

SERDP CS1145 40
LANE CONTENTS APPROXIMATE
BP 1 Molecular weight marker 250, 500, 750,
etc. 2 Root sample 197-24-1 YTC ~600 bp 3 Root sample 197-24-2 YTC ~600 bp 4 Root sample 197-24-2 YTC ~600 bp 5 Root sample 197-24-3 YTC ~600 bp 6 Root sample 197-24-3 YTC ~600 bp 7 Root sample 197-24-4 FC ~600 bp 8 Root sample 197-24-4 FC ~600 bp 9 Bread mold- positive control ~775 bp 10 Bread mold- positive control ~775 bp 11 No DNA –negative control 0 bp 12 Ladder 250, 500, 750,
etc. Figure 18. A typical gel from the PCR system used on fungi obtained from the roots of perennial native grasses at disturbed and undisturbed sites, 2001. Two lanes were used for each sample because varying amounts of DNA were used during the PCR. The variations are between 5 and 10 ng/µL of purified PCR product used for each reaction tube. The 600-620 bp result is within the expected range for isolating fungi of the order Glomales. The lane numbers run from left to right on the gel.
2002 studies Fungal community structure
Assays of active and total fungi at the YTC site were carried out during 2002 (Figure 19). The major finding from 2002 is that fungal development at the YTC site is dominated by hyphomycetes/deuteromycetes; there was only a minor presence of normal vegetative hyphae in these soil samples. These saprophytic hyphae, when present, were usually devoid of cytoplasm. The general trend noted is that the treatments resulted generally in increased active fungi in the brome plots, particularly with treatment combination 4, while in the knapweed plots, the treatments led generally to decreases in active fungi, with the exception of treatment combination 7. No statistically significant responses were observed at the YTC for this year.
Final Report
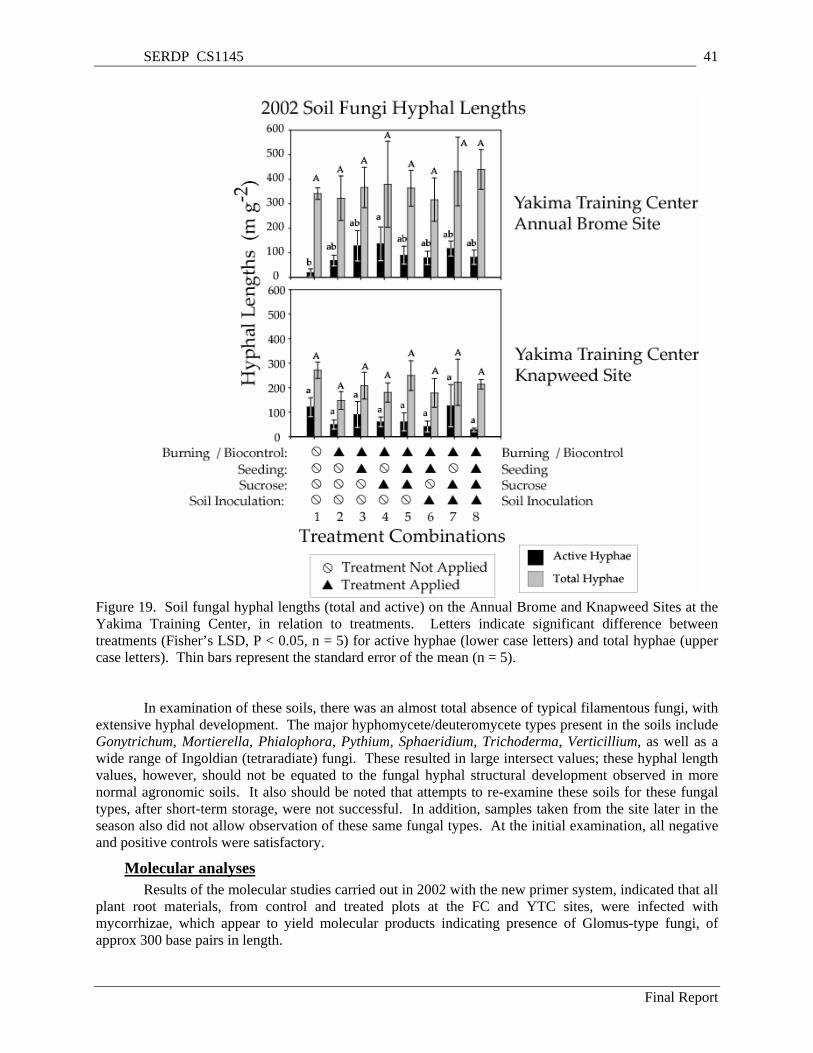
SERDP CS1145 41
Figure 19. Soil fungal hyphal lengths (total and active) on the Annual Brome and Knapweed Sites at the Yakima Training Center, in relation to treatments. Letters indicate significant difference between treatments (Fisher’s LSD, P < 0.05, n = 5) for active hyphae (lower case letters) and total hyphae (upper case letters). Thin bars represent the standard error of the mean (n = 5).
In examination of these soils, there was an almost total absence of typical filamentous fungi, with
extensive hyphal development. The major hyphomycete/deuteromycete types present in the soils include Gonytrichum, Mortierella, Phialophora, Pythium, Sphaeridium, Trichoderma, Verticillium, as well as a wide range of Ingoldian (tetraradiate) fungi. These resulted in large intersect values; these hyphal length values, however, should not be equated to the fungal hyphal structural development observed in more normal agronomic soils. It also should be noted that attempts to re-examine these soils for these fungal types, after short-term storage, were not successful. In addition, samples taken from the site later in the season also did not allow observation of these same fungal types. At the initial examination, all negative and positive controls were satisfactory.
Molecular analyses Results of the molecular studies carried out in 2002 with the new primer system, indicated that all
plant root materials, from control and treated plots at the FC and YTC sites, were infected with mycorrhizae, which appear to yield molecular products indicating presence of Glomus-type fungi, of approx 300 base pairs in length.
Final Report
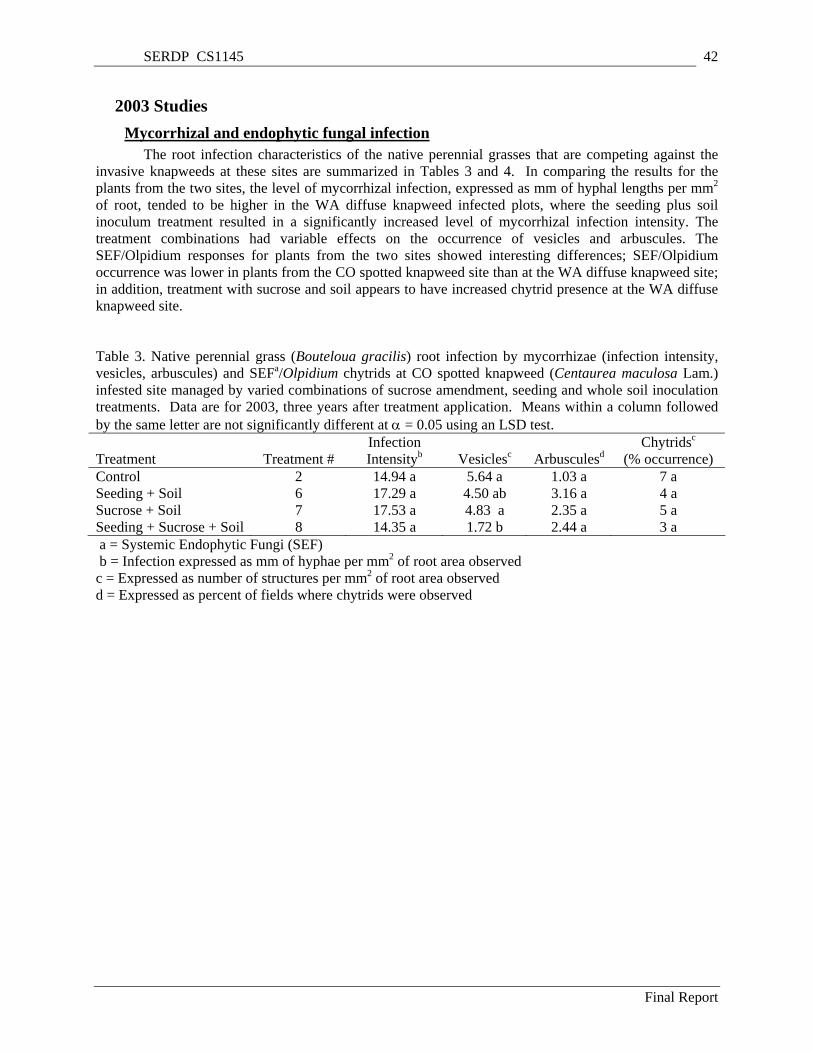
SERDP CS1145 42
2003 Studies Mycorrhizal and endophytic fungal infection
The root infection characteristics of the native perennial grasses that are competing against the invasive knapweeds at these sites are summarized in Tables 3 and 4. In comparing the results for the plants from the two sites, the level of mycorrhizal infection, expressed as mm of hyphal lengths per mm2 of root, tended to be higher in the WA diffuse knapweed infected plots, where the seeding plus soil inoculum treatment resulted in a significantly increased level of mycorrhizal infection intensity. The treatment combinations had variable effects on the occurrence of vesicles and arbuscules. The SEF/Olpidium responses for plants from the two sites showed interesting differences; SEF/Olpidium occurrence was lower in plants from the CO spotted knapweed site than at the WA diffuse knapweed site; in addition, treatment with sucrose and soil appears to have increased chytrid presence at the WA diffuse knapweed site.
Table 3. Native perennial grass (Bouteloua gracilis) root infection by mycorrhizae (infection intensity, vesicles, arbuscules) and SEFa/Olpidium chytrids at CO spotted knapweed (Centaurea maculosa Lam.) infested site managed by varied combinations of sucrose amendment, seeding and whole soil inoculation treatments. Data are for 2003, three years after treatment application. Means within a column followed by the same letter are not significantly different at α = 0.05 using an LSD test. Treatment
Treatment #
Infection Intensityb
Vesiclesc
Arbusculesd
Chytridsc (% occurrence)
Control 2 14.94 a 5.64 a 1.03 a 7 a Seeding + Soil 6 17.29 a 4.50 ab 3.16 a 4 a Sucrose + Soil 7 17.53 a 4.83 a 2.35 a 5 a Seeding + Sucrose + Soil 8 14.35 a 1.72 b 2.44 a 3 a a = Systemic Endophytic Fungi (SEF) b = Infection expressed as mm of hyphae per mm2 of root area observed c = Expressed as number of structures per mm2 of root area observed d = Expressed as percent of fields where chytrids were observed
Final Report
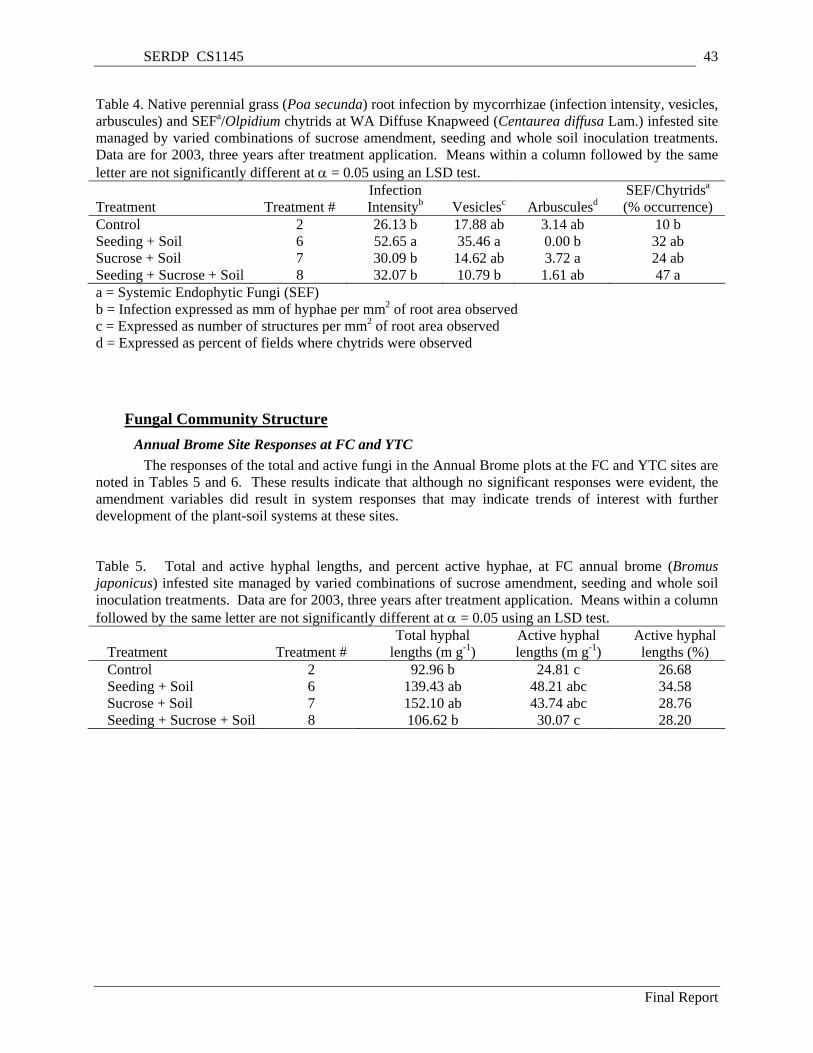
SERDP CS1145 43
Table 4. Native perennial grass (Poa secunda) root infection by mycorrhizae (infection intensity, vesicles, arbuscules) and SEFa/Olpidium chytrids at WA Diffuse Knapweed (Centaurea diffusa Lam.) infested site managed by varied combinations of sucrose amendment, seeding and whole soil inoculation treatments. Data are for 2003, three years after treatment application. Means within a column followed by the same letter are not significantly different at α = 0.05 using an LSD test. Treatment
Treatment #
Infection Intensityb
Vesiclesc
Arbusculesd
SEF/Chytridsa (% occurrence)
Control 2 26.13 b 17.88 ab 3.14 ab 10 b Seeding + Soil 6 52.65 a 35.46 a 0.00 b 32 ab Sucrose + Soil 7 30.09 b 14.62 ab 3.72 a 24 ab Seeding + Sucrose + Soil 8 32.07 b 10.79 b 1.61 ab 47 a a = Systemic Endophytic Fungi (SEF) b = Infection expressed as mm of hyphae per mm2 of root area observed c = Expressed as number of structures per mm2 of root area observed d = Expressed as percent of fields where chytrids were observed
Fungal Community Structure Annual Brome Site Responses at FC and YTC
The responses of the total and active fungi in the Annual Brome plots at the FC and YTC sites are noted in Tables 5 and 6. These results indicate that although no significant responses were evident, the amendment variables did result in system responses that may indicate trends of interest with further development of the plant-soil systems at these sites.
Table 5. Total and active hyphal lengths, and percent active hyphae, at FC annual brome (Bromus japonicus) infested site managed by varied combinations of sucrose amendment, seeding and whole soil inoculation treatments. Data are for 2003, three years after treatment application. Means within a column followed by the same letter are not significantly different at α = 0.05 using an LSD test.
Treatment
Treatment #
Total hyphal lengths (m g-1)
Active hyphal lengths (m g-1)
Active hyphal lengths (%)
Control 2 92.96 b 24.81 c 26.68 Seeding + Soil 6 139.43 ab 48.21 abc 34.58 Sucrose + Soil 7 152.10 ab 43.74 abc 28.76 Seeding + Sucrose + Soil 8 106.62 b 30.07 c 28.20
Final Report
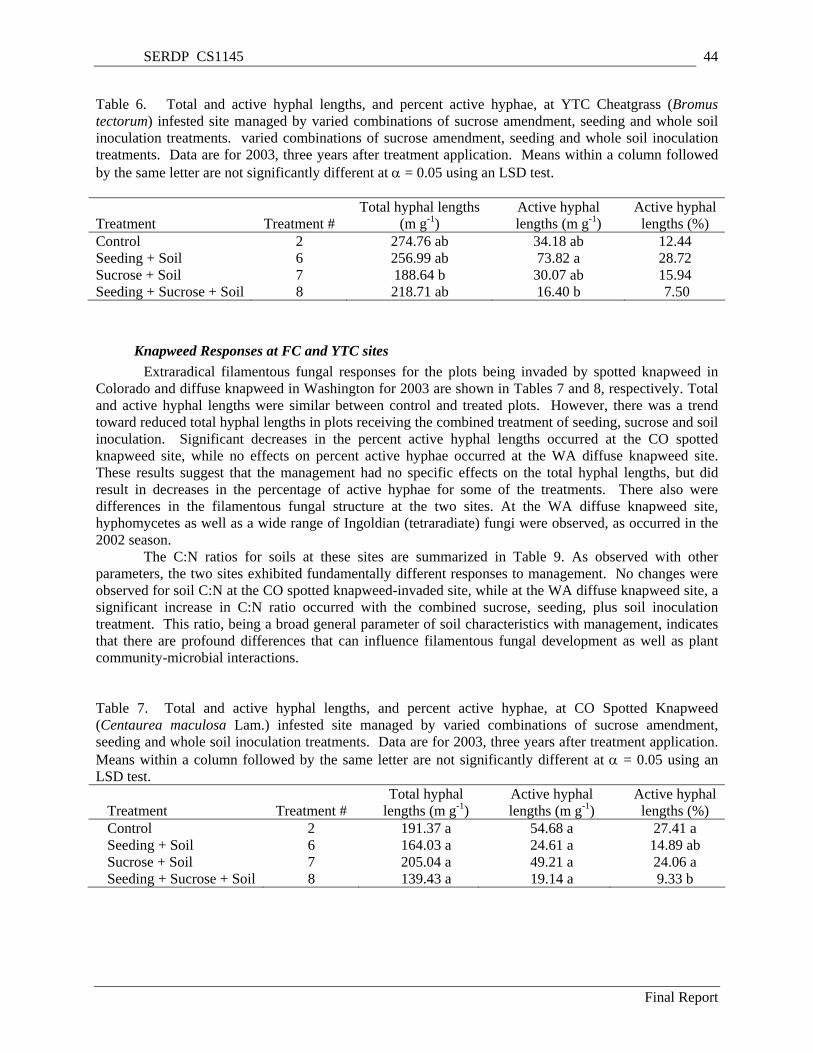
SERDP CS1145 44
Table 6. Total and active hyphal lengths, and percent active hyphae, at YTC Cheatgrass (Bromus tectorum) infested site managed by varied combinations of sucrose amendment, seeding and whole soil inoculation treatments. varied combinations of sucrose amendment, seeding and whole soil inoculation treatments. Data are for 2003, three years after treatment application. Means within a column followed by the same letter are not significantly different at α = 0.05 using an LSD test. Treatment
Treatment #
Total hyphal lengths (m g-1)
Active hyphal lengths (m g-1)
Active hyphal lengths (%)
Control 2 274.76 ab 34.18 ab 12.44 Seeding + Soil 6 256.99 ab 73.82 a 28.72 Sucrose + Soil 7 188.64 b 30.07 ab 15.94 Seeding + Sucrose + Soil 8 218.71 ab 16.40 b 7.50
Knapweed Responses at FC and YTC sites Extraradical filamentous fungal responses for the plots being invaded by spotted knapweed in
Colorado and diffuse knapweed in Washington for 2003 are shown in Tables 7 and 8, respectively. Total and active hyphal lengths were similar between control and treated plots. However, there was a trend toward reduced total hyphal lengths in plots receiving the combined treatment of seeding, sucrose and soil inoculation. Significant decreases in the percent active hyphal lengths occurred at the CO spotted knapweed site, while no effects on percent active hyphae occurred at the WA diffuse knapweed site. These results suggest that the management had no specific effects on the total hyphal lengths, but did result in decreases in the percentage of active hyphae for some of the treatments. There also were differences in the filamentous fungal structure at the two sites. At the WA diffuse knapweed site, hyphomycetes as well as a wide range of Ingoldian (tetraradiate) fungi were observed, as occurred in the 2002 season.
The C:N ratios for soils at these sites are summarized in Table 9. As observed with other parameters, the two sites exhibited fundamentally different responses to management. No changes were observed for soil C:N at the CO spotted knapweed-invaded site, while at the WA diffuse knapweed site, a significant increase in C:N ratio occurred with the combined sucrose, seeding, plus soil inoculation treatment. This ratio, being a broad general parameter of soil characteristics with management, indicates that there are profound differences that can influence filamentous fungal development as well as plant community-microbial interactions.
Table 7. Total and active hyphal lengths, and percent active hyphae, at CO Spotted Knapweed (Centaurea maculosa Lam.) infested site managed by varied combinations of sucrose amendment, seeding and whole soil inoculation treatments. Data are for 2003, three years after treatment application. Means within a column followed by the same letter are not significantly different at α = 0.05 using an LSD test.
Treatment
Treatment #
Total hyphal lengths (m g-1)
Active hyphal lengths (m g-1)
Active hyphal lengths (%)
Control 2 191.37 a 54.68 a 27.41 a Seeding + Soil 6 164.03 a 24.61 a 14.89 ab Sucrose + Soil 7 205.04 a 49.21 a 24.06 a Seeding + Sucrose + Soil 8 139.43 a 19.14 a 9.33 b
Final Report
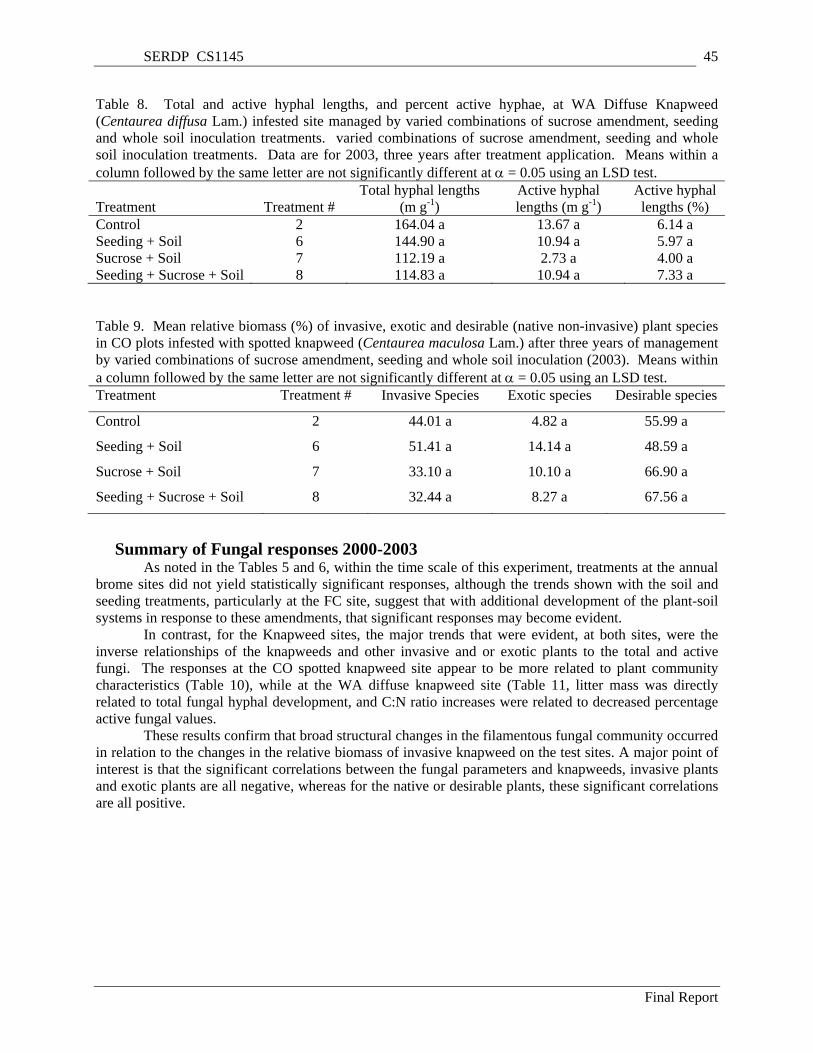
SERDP CS1145 45
Table 8. Total and active hyphal lengths, and percent active hyphae, at WA Diffuse Knapweed (Centaurea diffusa Lam.) infested site managed by varied combinations of sucrose amendment, seeding and whole soil inoculation treatments. varied combinations of sucrose amendment, seeding and whole soil inoculation treatments. Data are for 2003, three years after treatment application. Means within a column followed by the same letter are not significantly different at α = 0.05 using an LSD test. Treatment
Treatment #
Total hyphal lengths (m g-1)
Active hyphal lengths (m g-1)
Active hyphal lengths (%)
Control 2 164.04 a 13.67 a 6.14 a Seeding + Soil 6 144.90 a 10.94 a 5.97 a Sucrose + Soil 7 112.19 a 2.73 a 4.00 a Seeding + Sucrose + Soil 8 114.83 a 10.94 a 7.33 a Table 9. Mean relative biomass (%) of invasive, exotic and desirable (native non-invasive) plant species in CO plots infested with spotted knapweed (Centaurea maculosa Lam.) after three years of management by varied combinations of sucrose amendment, seeding and whole soil inoculation (2003). Means within a column followed by the same letter are not significantly different at α = 0.05 using an LSD test. Treatment Treatment # Invasive Species Exotic species Desirable species
Control 2 44.01 a 4.82 a 55.99 a
Seeding + Soil 6 51.41 a 14.14 a 48.59 a
Sucrose + Soil 7 33.10 a 10.10 a 66.90 a
Seeding + Sucrose + Soil 8 32.44 a 8.27 a 67.56 a
Summary of Fungal responses 2000-2003 As noted in the Tables 5 and 6, within the time scale of this experiment, treatments at the annual
brome sites did not yield statistically significant responses, although the trends shown with the soil and seeding treatments, particularly at the FC site, suggest that with additional development of the plant-soil systems in response to these amendments, that significant responses may become evident.
In contrast, for the Knapweed sites, the major trends that were evident, at both sites, were the inverse relationships of the knapweeds and other invasive and or exotic plants to the total and active fungi. The responses at the CO spotted knapweed site appear to be more related to plant community characteristics (Table 10), while at the WA diffuse knapweed site (Table 11, litter mass was directly related to total fungal hyphal development, and C:N ratio increases were related to decreased percentage active fungal values.
These results confirm that broad structural changes in the filamentous fungal community occurred in relation to the changes in the relative biomass of invasive knapweed on the test sites. A major point of interest is that the significant correlations between the fungal parameters and knapweeds, invasive plants and exotic plants are all negative, whereas for the native or desirable plants, these significant correlations are all positive.
Final Report

SERDP CS1145 46
Table 10. Significant correlations between filamentous fungal responses and plant responses in CO spotted knapweed (Centaurea maculosa Lam.) plots managed by varied combinations of sucrose amendment, seeding and whole soil inoculation treatments. Data are for the post-treatment years of 2001 through 2003.
Plant Variable Fungal Variable Spotted
knapweed Biomass
Native Plant Biomass
Exotic Plant Biomass
Desirable Plant Biomass
Active R2= -0.44 p=0.0004 n=60
R2= 0.41 p=0.0011 n=60
R2= -0.28 p=0.0304 n=60
R2= 0.34 p=0.0078 n=60
Total R2= -0.45
p=0.0003 n=60
R2= 0.68 p<0.0001 n=60
R2= 0.67 p<0.0001 n=60
Percent Active R2= -0.32
p=0.0115 n=60
R2= -0.26 p=0.0486 n=60
Mycorrhizal infection intensity
R2= -0.69 p=0.0135 n=12
Table 11. Significant correlations between filamentous fungal responses and plant or soil responses in WA diffuse knapweed (Centaurea diffusa Lam.) plots managed by varied combinations of sucrose amendment, seeding and whole soil inoculation treatments. Data are for the post-treatment years of 2001 through 2003.
Plant/Soil Variable Fungal Variable Diffuse
knapweed Biomass
Invasive Plant Biomass
Shrub Biomass
Litter Mass Soil C:N
Active R2= -0.34 p=0.0339 n=40
Total R2= -0.48
p<0.0001 n=40
R2= 0.58 p<0.0001 n=40
Percent Active R2= -0.28
p=0.0311 n=59
Mycorrhizal infection intensity
R2= 0.57 p=0.0531 n=12
Final Report
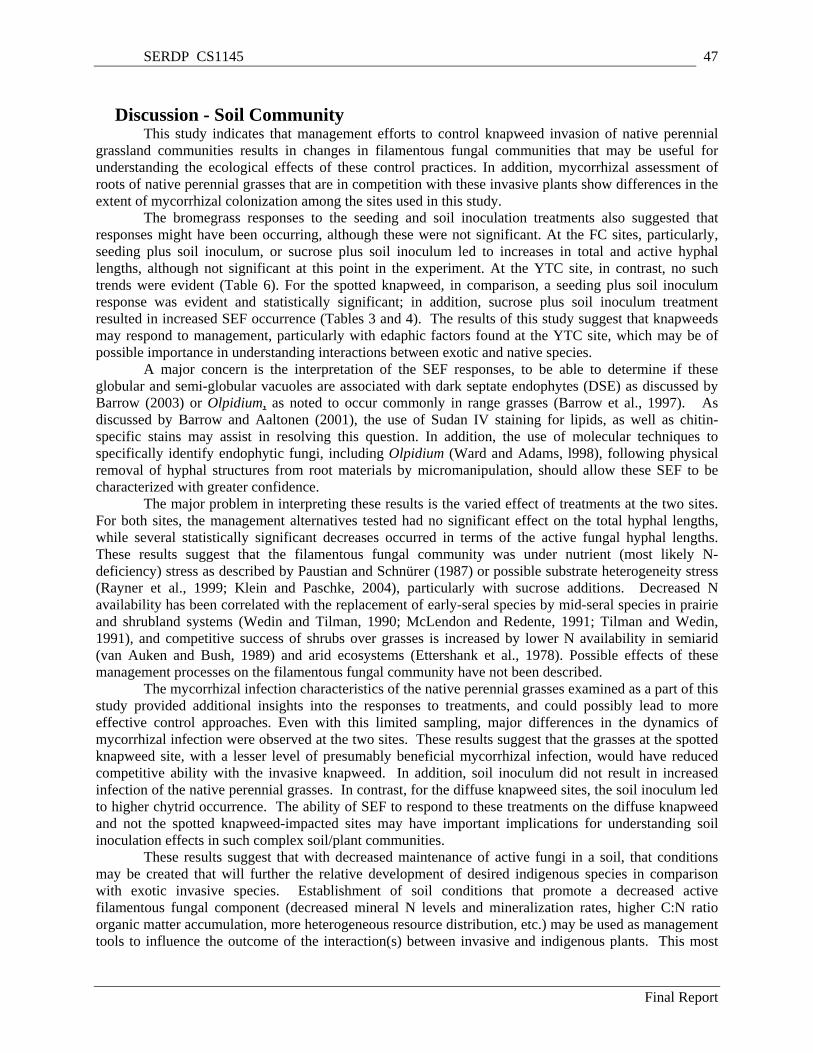
SERDP CS1145 47
Discussion - Soil Community This study indicates that management efforts to control knapweed invasion of native perennial
grassland communities results in changes in filamentous fungal communities that may be useful for understanding the ecological effects of these control practices. In addition, mycorrhizal assessment of roots of native perennial grasses that are in competition with these invasive plants show differences in the extent of mycorrhizal colonization among the sites used in this study.
The bromegrass responses to the seeding and soil inoculation treatments also suggested that responses might have been occurring, although these were not significant. At the FC sites, particularly, seeding plus soil inoculum, or sucrose plus soil inoculum led to increases in total and active hyphal lengths, although not significant at this point in the experiment. At the YTC site, in contrast, no such trends were evident (Table 6). For the spotted knapweed, in comparison, a seeding plus soil inoculum response was evident and statistically significant; in addition, sucrose plus soil inoculum treatment resulted in increased SEF occurrence (Tables 3 and 4). The results of this study suggest that knapweeds may respond to management, particularly with edaphic factors found at the YTC site, which may be of possible importance in understanding interactions between exotic and native species.
A major concern is the interpretation of the SEF responses, to be able to determine if these globular and semi-globular vacuoles are associated with dark septate endophytes (DSE) as discussed by Barrow (2003) or Olpidium, as noted to occur commonly in range grasses (Barrow et al., 1997). As discussed by Barrow and Aaltonen (2001), the use of Sudan IV staining for lipids, as well as chitin-specific stains may assist in resolving this question. In addition, the use of molecular techniques to specifically identify endophytic fungi, including Olpidium (Ward and Adams, l998), following physical removal of hyphal structures from root materials by micromanipulation, should allow these SEF to be characterized with greater confidence.
The major problem in interpreting these results is the varied effect of treatments at the two sites. For both sites, the management alternatives tested had no significant effect on the total hyphal lengths, while several statistically significant decreases occurred in terms of the active fungal hyphal lengths. These results suggest that the filamentous fungal community was under nutrient (most likely N-deficiency) stress as described by Paustian and Schnürer (1987) or possible substrate heterogeneity stress (Rayner et al., 1999; Klein and Paschke, 2004), particularly with sucrose additions. Decreased N availability has been correlated with the replacement of early-seral species by mid-seral species in prairie and shrubland systems (Wedin and Tilman, 1990; McLendon and Redente, 1991; Tilman and Wedin, 1991), and competitive success of shrubs over grasses is increased by lower N availability in semiarid (van Auken and Bush, 1989) and arid ecosystems (Ettershank et al., 1978). Possible effects of these management processes on the filamentous fungal community have not been described.
The mycorrhizal infection characteristics of the native perennial grasses examined as a part of this study provided additional insights into the responses to treatments, and could possibly lead to more effective control approaches. Even with this limited sampling, major differences in the dynamics of mycorrhizal infection were observed at the two sites. These results suggest that the grasses at the spotted knapweed site, with a lesser level of presumably beneficial mycorrhizal infection, would have reduced competitive ability with the invasive knapweed. In addition, soil inoculum did not result in increased infection of the native perennial grasses. In contrast, for the diffuse knapweed sites, the soil inoculum led to higher chytrid occurrence. The ability of SEF to respond to these treatments on the diffuse knapweed and not the spotted knapweed-impacted sites may have important implications for understanding soil inoculation effects in such complex soil/plant communities.
These results suggest that with decreased maintenance of active fungi in a soil, that conditions may be created that will further the relative development of desired indigenous species in comparison with exotic invasive species. Establishment of soil conditions that promote a decreased active filamentous fungal component (decreased mineral N levels and mineralization rates, higher C:N ratio organic matter accumulation, more heterogeneous resource distribution, etc.) may be used as management tools to influence the outcome of the interaction(s) between invasive and indigenous plants. This most
Final Report
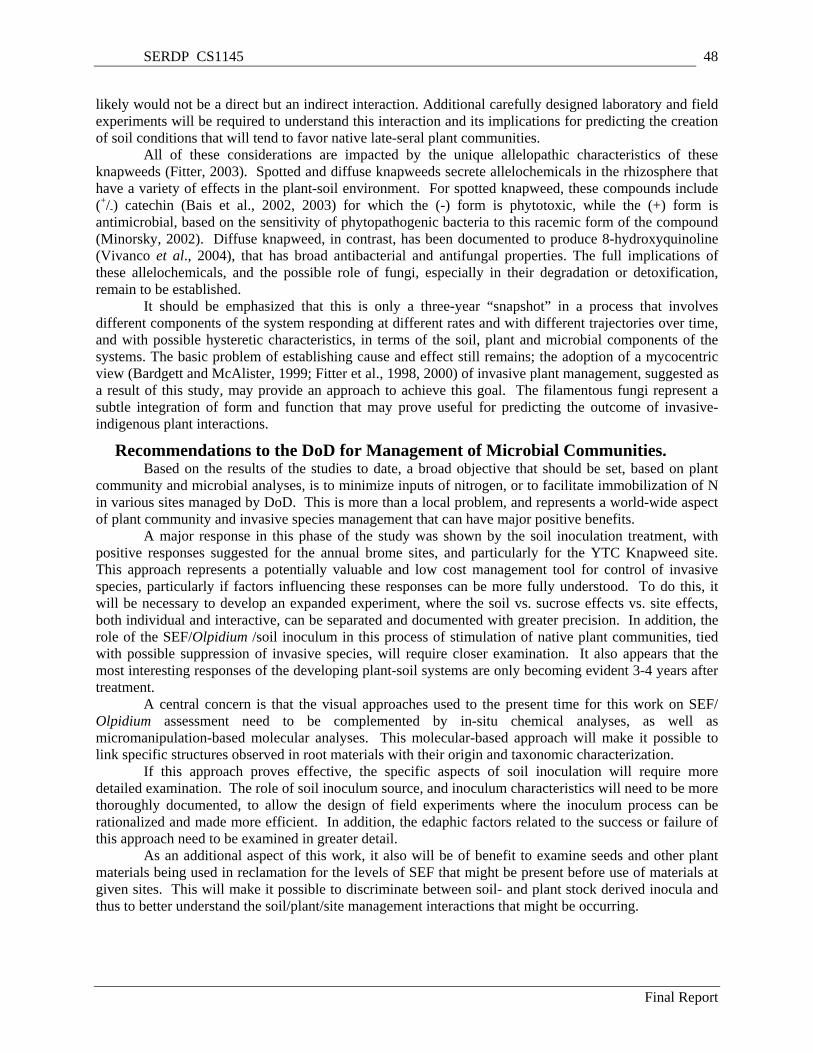
SERDP CS1145 48
likely would not be a direct but an indirect interaction. Additional carefully designed laboratory and field experiments will be required to understand this interaction and its implications for predicting the creation of soil conditions that will tend to favor native late-seral plant communities.
All of these considerations are impacted by the unique allelopathic characteristics of these knapweeds (Fitter, 2003). Spotted and diffuse knapweeds secrete allelochemicals in the rhizosphere that have a variety of effects in the plant-soil environment. For spotted knapweed, these compounds include (+/-) catechin (Bais et al., 2002, 2003) for which the (-) form is phytotoxic, while the (+) form is antimicrobial, based on the sensitivity of phytopathogenic bacteria to this racemic form of the compound (Minorsky, 2002). Diffuse knapweed, in contrast, has been documented to produce 8-hydroxyquinoline (Vivanco et al., 2004), that has broad antibacterial and antifungal properties. The full implications of these allelochemicals, and the possible role of fungi, especially in their degradation or detoxification, remain to be established.
It should be emphasized that this is only a three-year “snapshot” in a process that involves different components of the system responding at different rates and with different trajectories over time, and with possible hysteretic characteristics, in terms of the soil, plant and microbial components of the systems. The basic problem of establishing cause and effect still remains; the adoption of a mycocentric view (Bardgett and McAlister, 1999; Fitter et al., 1998, 2000) of invasive plant management, suggested as a result of this study, may provide an approach to achieve this goal. The filamentous fungi represent a subtle integration of form and function that may prove useful for predicting the outcome of invasive-indigenous plant interactions.
Recommendations to the DoD for Management of Microbial Communities. Based on the results of the studies to date, a broad objective that should be set, based on plant
community and microbial analyses, is to minimize inputs of nitrogen, or to facilitate immobilization of N in various sites managed by DoD. This is more than a local problem, and represents a world-wide aspect of plant community and invasive species management that can have major positive benefits.
A major response in this phase of the study was shown by the soil inoculation treatment, with positive responses suggested for the annual brome sites, and particularly for the YTC Knapweed site. This approach represents a potentially valuable and low cost management tool for control of invasive species, particularly if factors influencing these responses can be more fully understood. To do this, it will be necessary to develop an expanded experiment, where the soil vs. sucrose effects vs. site effects, both individual and interactive, can be separated and documented with greater precision. In addition, the role of the SEF/Olpidium /soil inoculum in this process of stimulation of native plant communities, tied with possible suppression of invasive species, will require closer examination. It also appears that the most interesting responses of the developing plant-soil systems are only becoming evident 3-4 years after treatment.
A central concern is that the visual approaches used to the present time for this work on SEF/ Olpidium assessment need to be complemented by in-situ chemical analyses, as well as micromanipulation-based molecular analyses. This molecular-based approach will make it possible to link specific structures observed in root materials with their origin and taxonomic characterization.
If this approach proves effective, the specific aspects of soil inoculation will require more detailed examination. The role of soil inoculum source, and inoculum characteristics will need to be more thoroughly documented, to allow the design of field experiments where the inoculum process can be rationalized and made more efficient. In addition, the edaphic factors related to the success or failure of this approach need to be examined in greater detail.
As an additional aspect of this work, it also will be of benefit to examine seeds and other plant materials being used in reclamation for the levels of SEF that might be present before use of materials at given sites. This will make it possible to discriminate between soil- and plant stock derived inocula and thus to better understand the soil/plant/site management interactions that might be occurring.
Final Report
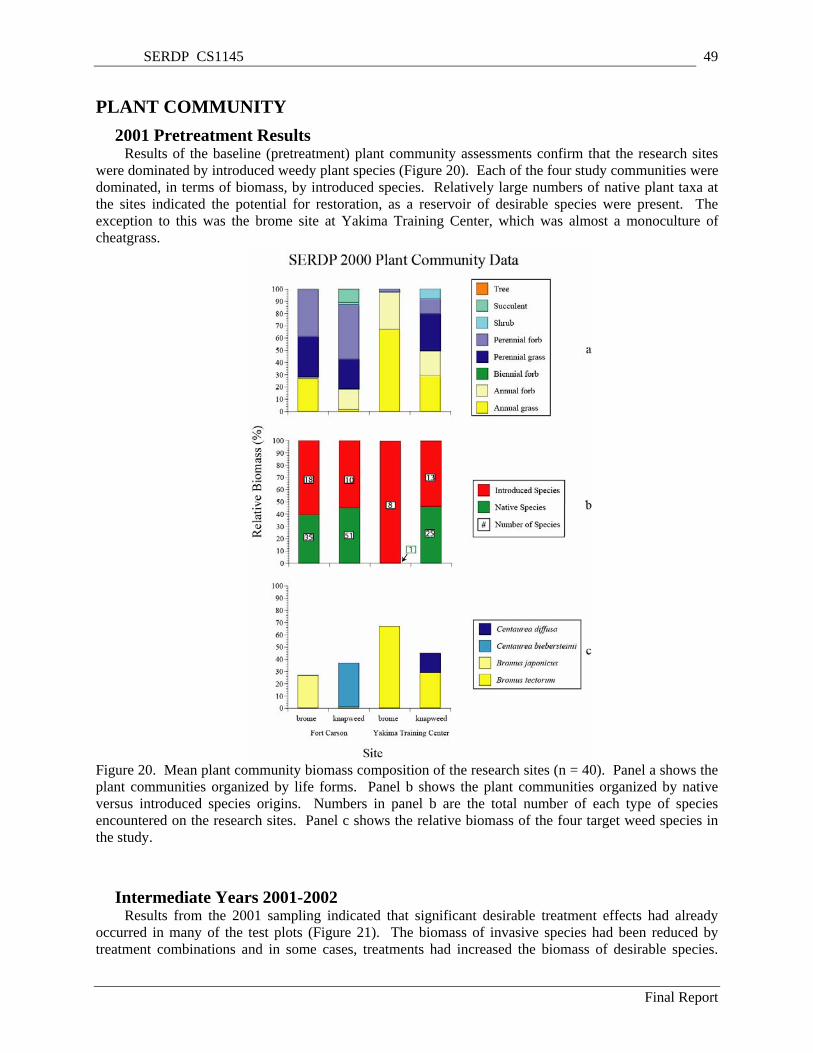
SERDP CS1145 49
PLANT COMMUNITY 2001 Pretreatment Results
Results of the baseline (pretreatment) plant community assessments confirm that the research sites were dominated by introduced weedy plant species (Figure 20). Each of the four study communities were dominated, in terms of biomass, by introduced species. Relatively large numbers of native plant taxa at the sites indicated the potential for restoration, as a reservoir of desirable species were present. The exception to this was the brome site at Yakima Training Center, which was almost a monoculture of cheatgrass.
Figure 20. Mean plant community biomass composition of the research sites (n = 40). Panel a shows the plant communities organized by life forms. Panel b shows the plant communities organized by native versus introduced species origins. Numbers in panel b are the total number of each type of species encountered on the research sites. Panel c shows the relative biomass of the four target weed species in the study.
Intermediate Years 2001-2002 Results from the 2001 sampling indicated that significant desirable treatment effects had already
occurred in many of the test plots (Figure 21). The biomass of invasive species had been reduced by treatment combinations and in some cases, treatments had increased the biomass of desirable species.
Final Report
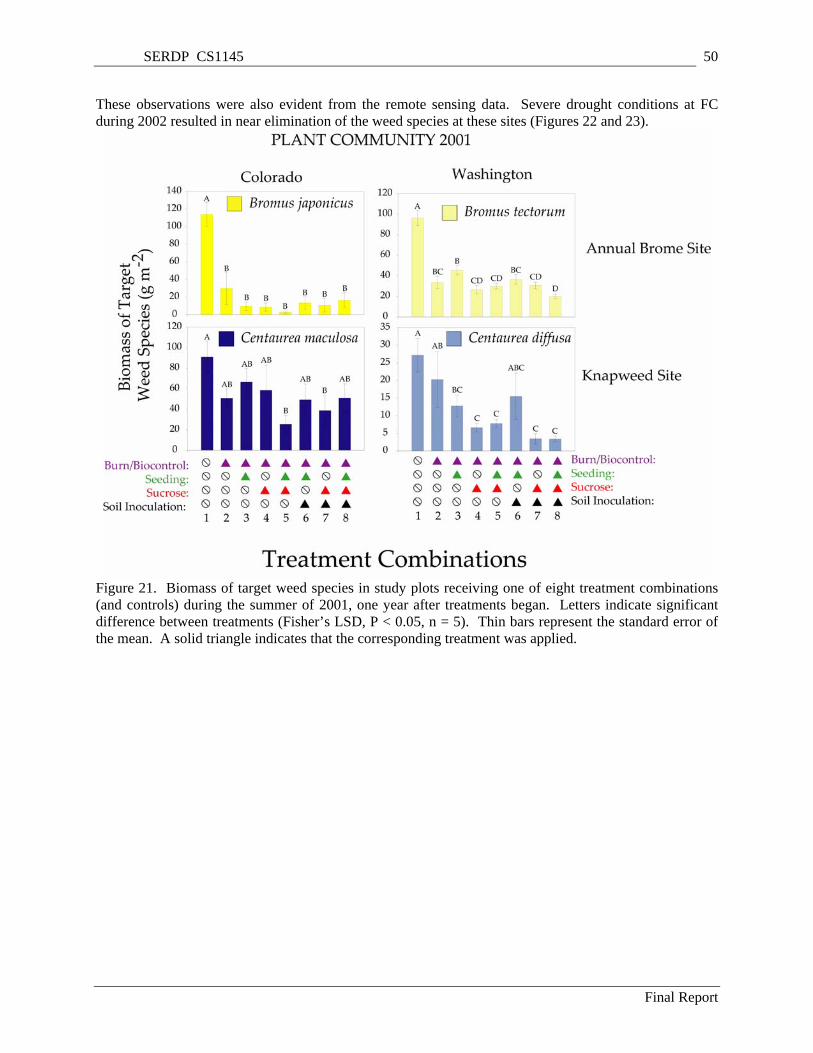
SERDP CS1145 50
These observations were also evident from the remote sensing data. Severe drought conditions at FC during 2002 resulted in near elimination of the weed species at these sites (Figures 22 and 23).
Figure 21. Biomass of target weed species in study plots receiving one of eight treatment combinations (and controls) during the summer of 2001, one year after treatments began. Letters indicate significant difference between treatments (Fisher’s LSD, P < 0.05, n = 5). Thin bars represent the standard error of the mean. A solid triangle indicates that the corresponding treatment was applied.
Final Report
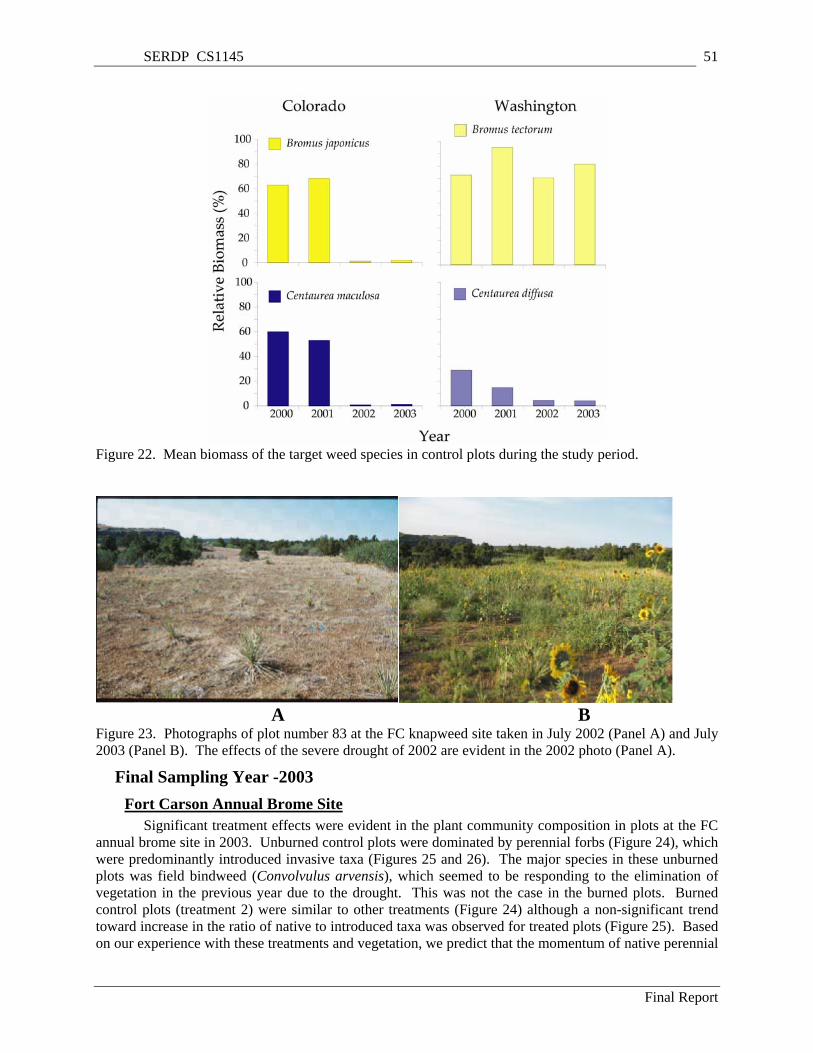
SERDP CS1145 51
Figure 22. Mean biomass of the target weed species in control plots during the study period.
A B
Figure 23. Photographs of plot number 83 at the FC knapweed site taken in July 2002 (Panel A) and July 2003 (Panel B). The effects of the severe drought of 2002 are evident in the 2002 photo (Panel A).
Final Sampling Year -2003 Fort Carson Annual Brome Site
Significant treatment effects were evident in the plant community composition in plots at the FC annual brome site in 2003. Unburned control plots were dominated by perennial forbs (Figure 24), which were predominantly introduced invasive taxa (Figures 25 and 26). The major species in these unburned plots was field bindweed (Convolvulus arvensis), which seemed to be responding to the elimination of vegetation in the previous year due to the drought. This was not the case in the burned plots. Burned control plots (treatment 2) were similar to other treatments (Figure 24) although a non-significant trend toward increase in the ratio of native to introduced taxa was observed for treated plots (Figure 25). Based on our experience with these treatments and vegetation, we predict that the momentum of native perennial
Final Report
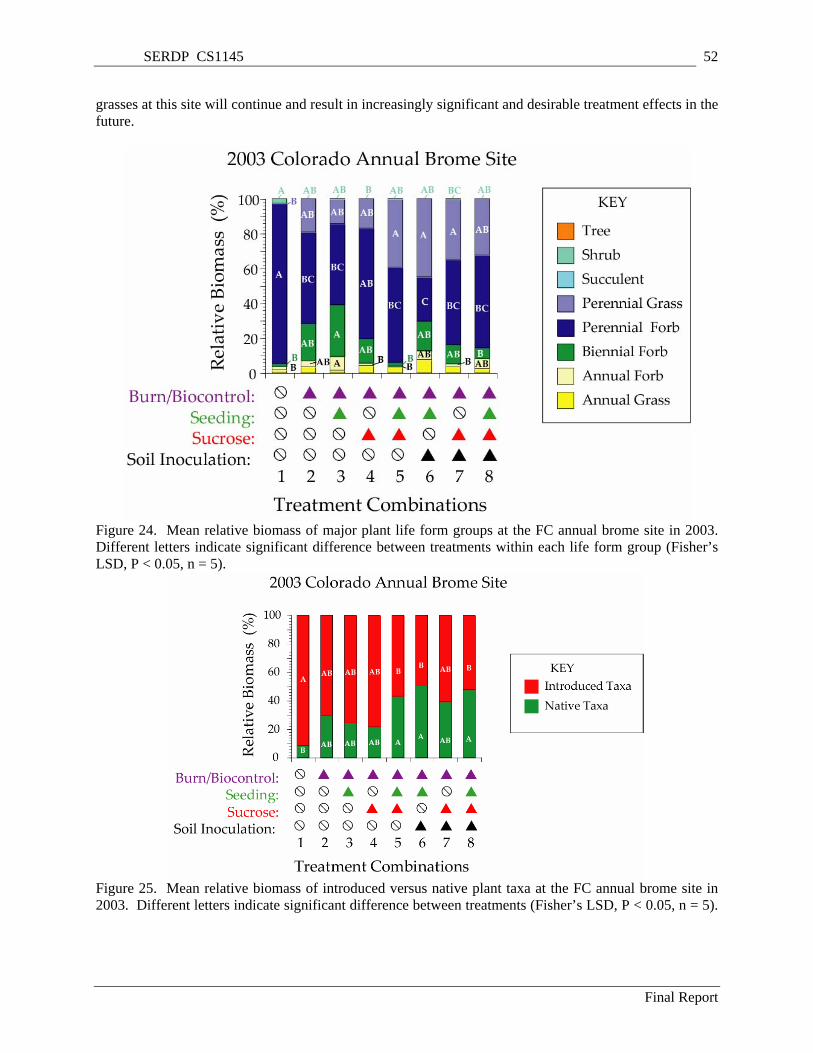
SERDP CS1145 52
grasses at this site will continue and result in increasingly significant and desirable treatment effects in the future.
Figure 24. Mean relative biomass of major plant life form groups at the FC annual brome site in 2003. Different letters indicate significant difference between treatments within each life form group (Fisher’s LSD, P < 0.05, n = 5).
Figure 25. Mean relative biomass of introduced versus native plant taxa at the FC annual brome site in 2003. Different letters indicate significant difference between treatments (Fisher’s LSD, P < 0.05, n = 5).
Final Report
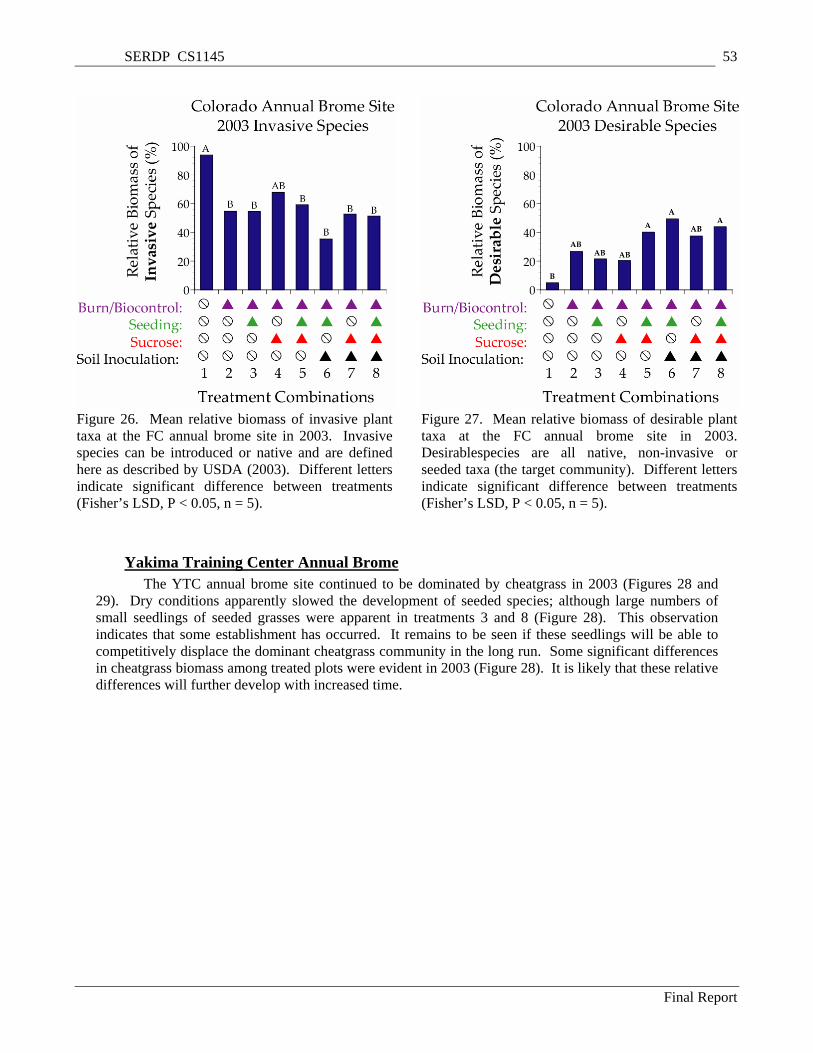
SERDP CS1145 53
Figure 26. Mean relative biomass of invasive plant taxa at the FC annual brome site in 2003. Invasive species can be introduced or native and are defined here as described by USDA (2003). Different letters indicate significant difference between treatments (Fisher’s LSD, P < 0.05, n = 5).
Figure 27. Mean relative biomass of desirable plant taxa at the FC annual brome site in 2003. Desirablespecies are all native, non-invasive or seeded taxa (the target community). Different letters indicate significant difference between treatments (Fisher’s LSD, P < 0.05, n = 5).
Yakima Training Center Annual Brome The YTC annual brome site continued to be dominated by cheatgrass in 2003 (Figures 28 and
29). Dry conditions apparently slowed the development of seeded species; although large numbers of small seedlings of seeded grasses were apparent in treatments 3 and 8 (Figure 28). This observation indicates that some establishment has occurred. It remains to be seen if these seedlings will be able to competitively displace the dominant cheatgrass community in the long run. Some significant differences in cheatgrass biomass among treated plots were evident in 2003 (Figure 28). It is likely that these relative differences will further develop with increased time.
Final Report

SERDP CS1145 54
Figure 28. Mean relative biomass of major plant life form groups at the YTC annual brome site in 2003. Different letters indicate significant difference between treatments within each life form group (Fisher’s LSD, P < 0.05, n = 5).
Figure 29. Mean relative biomass of introduced versus native plant taxa at the YTC annual brome site in 2003. Different letters indicate significant difference between treatments (Fisher’s LSD, P < 0.05, n = 5).
Final Report
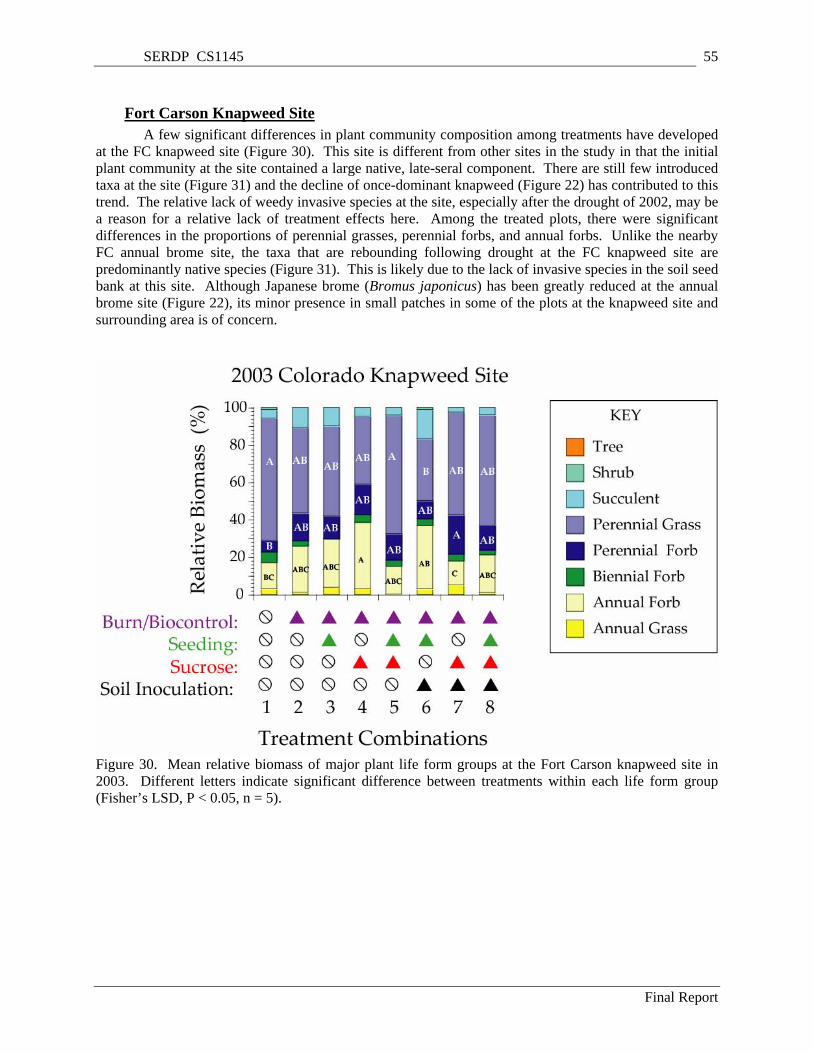
SERDP CS1145 55
Fort Carson Knapweed Site A few significant differences in plant community composition among treatments have developed
at the FC knapweed site (Figure 30). This site is different from other sites in the study in that the initial plant community at the site contained a large native, late-seral component. There are still few introduced taxa at the site (Figure 31) and the decline of once-dominant knapweed (Figure 22) has contributed to this trend. The relative lack of weedy invasive species at the site, especially after the drought of 2002, may be a reason for a relative lack of treatment effects here. Among the treated plots, there were significant differences in the proportions of perennial grasses, perennial forbs, and annual forbs. Unlike the nearby FC annual brome site, the taxa that are rebounding following drought at the FC knapweed site are predominantly native species (Figure 31). This is likely due to the lack of invasive species in the soil seed bank at this site. Although Japanese brome (Bromus japonicus) has been greatly reduced at the annual brome site (Figure 22), its minor presence in small patches in some of the plots at the knapweed site and surrounding area is of concern.
Figure 30. Mean relative biomass of major plant life form groups at the Fort Carson knapweed site in 2003. Different letters indicate significant difference between treatments within each life form group (Fisher’s LSD, P < 0.05, n = 5).
Final Report
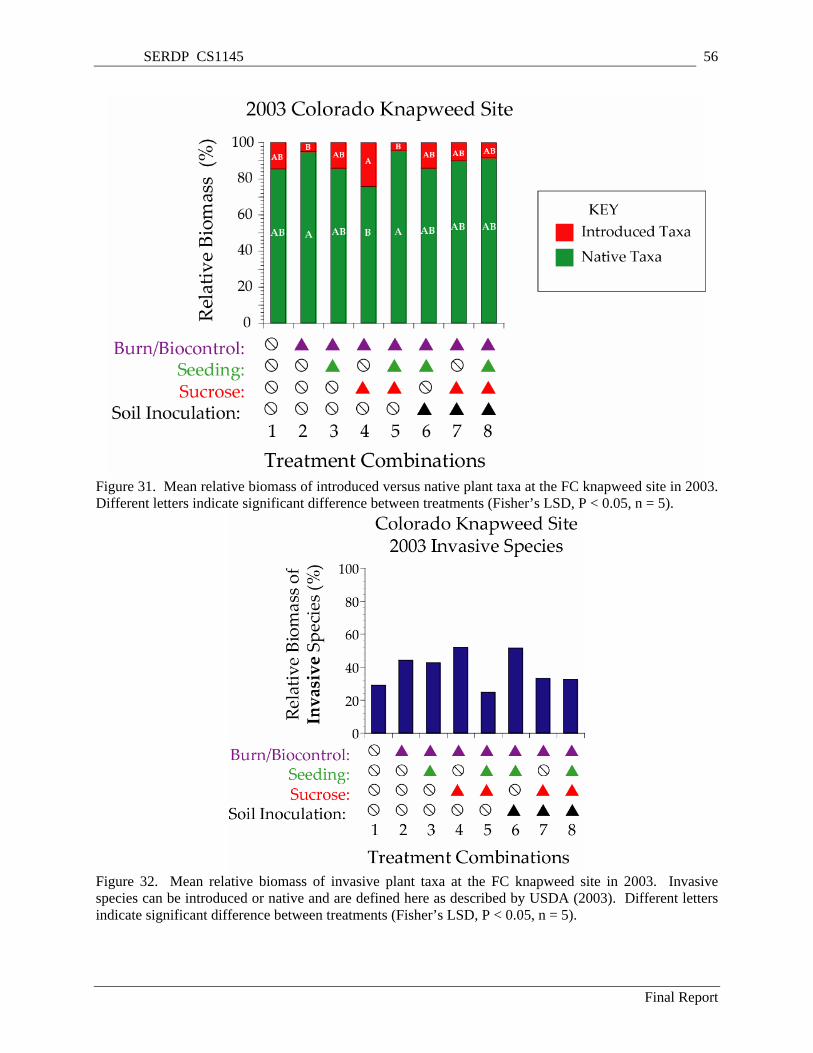
SERDP CS1145 56
Figure 31. Mean relative biomass of introduced versus native plant taxa at the FC knapweed site in 2003. Different letters indicate significant difference between treatments (Fisher’s LSD, P < 0.05, n = 5).
Figure 32. Mean relative biomass of invasive plant taxa at the FC knapweed site in 2003. Invasive species can be introduced or native and are defined here as described by USDA (2003). Different letters indicate significant difference between treatments (Fisher’s LSD, P < 0.05, n = 5).
Final Report
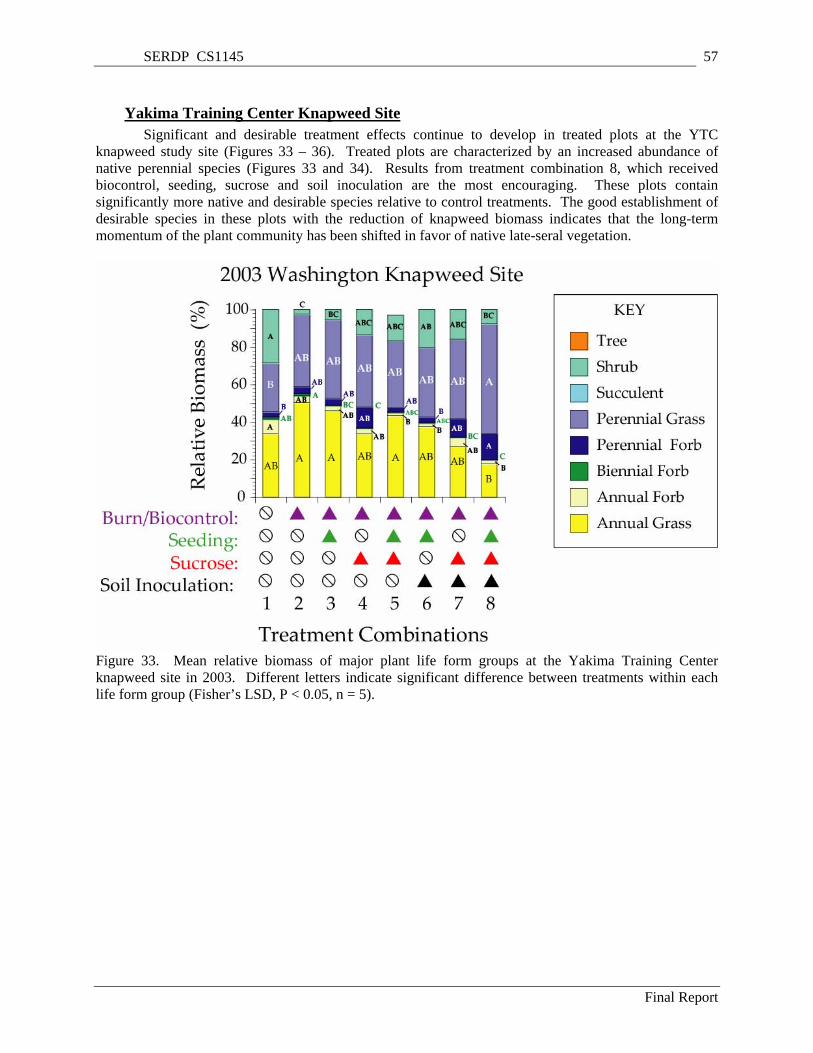
SERDP CS1145 57
Yakima Training Center Knapweed Site Significant and desirable treatment effects continue to develop in treated plots at the YTC
knapweed study site (Figures 33 – 36). Treated plots are characterized by an increased abundance of native perennial species (Figures 33 and 34). Results from treatment combination 8, which received biocontrol, seeding, sucrose and soil inoculation are the most encouraging. These plots contain significantly more native and desirable species relative to control treatments. The good establishment of desirable species in these plots with the reduction of knapweed biomass indicates that the long-term momentum of the plant community has been shifted in favor of native late-seral vegetation.
Figure 33. Mean relative biomass of major plant life form groups at the Yakima Training Center knapweed site in 2003. Different letters indicate significant difference between treatments within each life form group (Fisher’s LSD, P < 0.05, n = 5).
Final Report
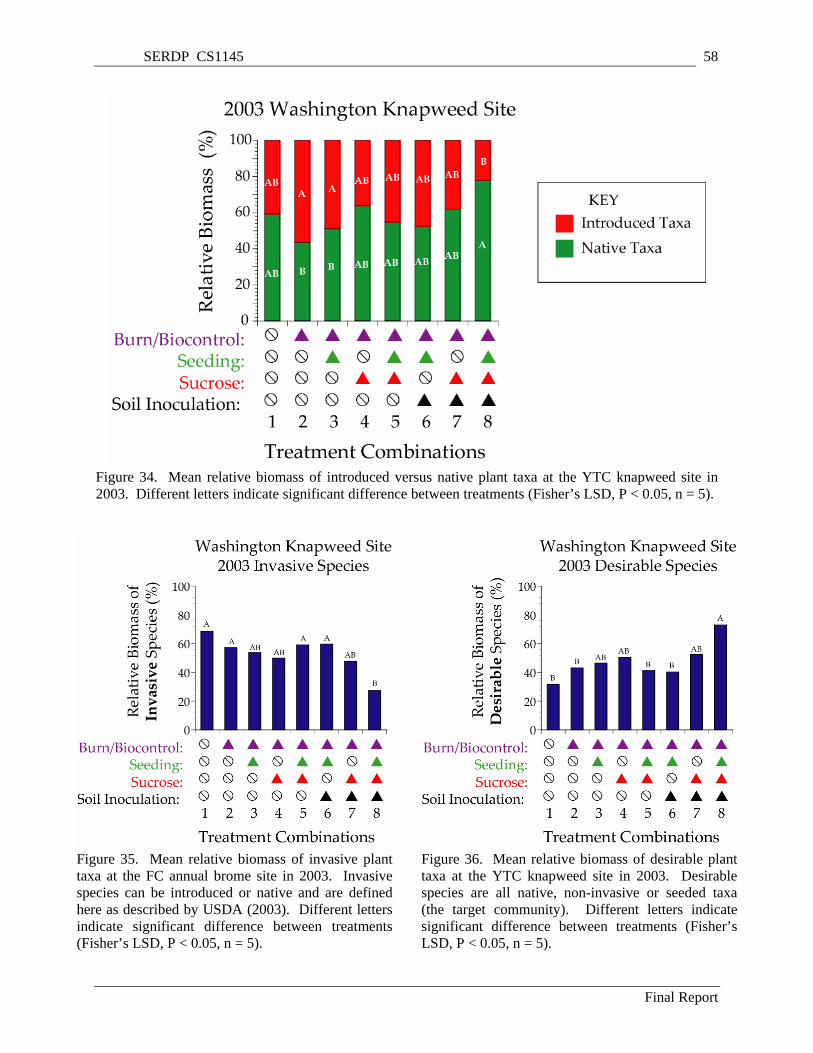
SERDP CS1145 58
Figure 34. Mean relative biomass of introduced versus native plant taxa at the YTC knapweed site in 2003. Different letters indicate significant difference between treatments (Fisher’s LSD, P < 0.05, n = 5).
Figure 35. Mean relative biomass of invasive plant taxa at the FC annual brome site in 2003. Invasive species can be introduced or native and are defined here as described by USDA (2003). Different letters indicate significant difference between treatments (Fisher’s LSD, P < 0.05, n = 5).
Figure 36. Mean relative biomass of desirable plant taxa at the YTC knapweed site in 2003. Desirable species are all native, non-invasive or seeded taxa (the target community). Different letters indicate significant difference between treatments (Fisher’s LSD, P < 0.05, n = 5).
Final Report
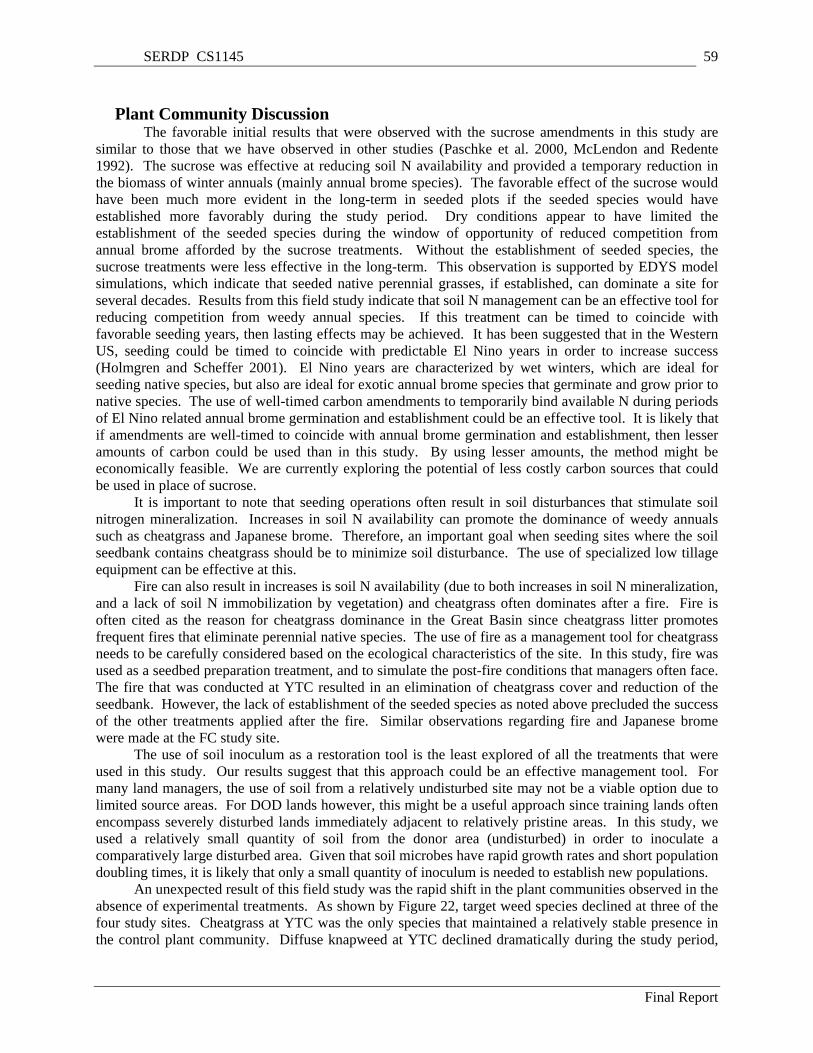
SERDP CS1145 59
Plant Community Discussion The favorable initial results that were observed with the sucrose amendments in this study are
similar to those that we have observed in other studies (Paschke et al. 2000, McLendon and Redente 1992). The sucrose was effective at reducing soil N availability and provided a temporary reduction in the biomass of winter annuals (mainly annual brome species). The favorable effect of the sucrose would have been much more evident in the long-term in seeded plots if the seeded species would have established more favorably during the study period. Dry conditions appear to have limited the establishment of the seeded species during the window of opportunity of reduced competition from annual brome afforded by the sucrose treatments. Without the establishment of seeded species, the sucrose treatments were less effective in the long-term. This observation is supported by EDYS model simulations, which indicate that seeded native perennial grasses, if established, can dominate a site for several decades. Results from this field study indicate that soil N management can be an effective tool for reducing competition from weedy annual species. If this treatment can be timed to coincide with favorable seeding years, then lasting effects may be achieved. It has been suggested that in the Western US, seeding could be timed to coincide with predictable El Nino years in order to increase success (Holmgren and Scheffer 2001). El Nino years are characterized by wet winters, which are ideal for seeding native species, but also are ideal for exotic annual brome species that germinate and grow prior to native species. The use of well-timed carbon amendments to temporarily bind available N during periods of El Nino related annual brome germination and establishment could be an effective tool. It is likely that if amendments are well-timed to coincide with annual brome germination and establishment, then lesser amounts of carbon could be used than in this study. By using lesser amounts, the method might be economically feasible. We are currently exploring the potential of less costly carbon sources that could be used in place of sucrose.
It is important to note that seeding operations often result in soil disturbances that stimulate soil nitrogen mineralization. Increases in soil N availability can promote the dominance of weedy annuals such as cheatgrass and Japanese brome. Therefore, an important goal when seeding sites where the soil seedbank contains cheatgrass should be to minimize soil disturbance. The use of specialized low tillage equipment can be effective at this.
Fire can also result in increases is soil N availability (due to both increases in soil N mineralization, and a lack of soil N immobilization by vegetation) and cheatgrass often dominates after a fire. Fire is often cited as the reason for cheatgrass dominance in the Great Basin since cheatgrass litter promotes frequent fires that eliminate perennial native species. The use of fire as a management tool for cheatgrass needs to be carefully considered based on the ecological characteristics of the site. In this study, fire was used as a seedbed preparation treatment, and to simulate the post-fire conditions that managers often face. The fire that was conducted at YTC resulted in an elimination of cheatgrass cover and reduction of the seedbank. However, the lack of establishment of the seeded species as noted above precluded the success of the other treatments applied after the fire. Similar observations regarding fire and Japanese brome were made at the FC study site.
The use of soil inoculum as a restoration tool is the least explored of all the treatments that were used in this study. Our results suggest that this approach could be an effective management tool. For many land managers, the use of soil from a relatively undisturbed site may not be a viable option due to limited source areas. For DOD lands however, this might be a useful approach since training lands often encompass severely disturbed lands immediately adjacent to relatively pristine areas. In this study, we used a relatively small quantity of soil from the donor area (undisturbed) in order to inoculate a comparatively large disturbed area. Given that soil microbes have rapid growth rates and short population doubling times, it is likely that only a small quantity of inoculum is needed to establish new populations.
An unexpected result of this field study was the rapid shift in the plant communities observed in the absence of experimental treatments. As shown by Figure 22, target weed species declined at three of the four study sites. Cheatgrass at YTC was the only species that maintained a relatively stable presence in the control plant community. Diffuse knapweed at YTC declined dramatically during the study period,
Final Report

SERDP CS1145 60
probably due to combined stresses of drought and biocontrol insects. Drought and or insect biocontrol agents also appear to have had a major impact on weed populations at Fort Carson. At Fort Carson, it is interesting to note that the dry conditions were associated with dramatic reductions in most exotic plant species.
Positive responses did occur at most sites with experimental treatments, especially after the first year of treatment. By subtracting baseline (2000) plant species relative biomass from end year (2003) data the study period trends in biomass can be discerned (Figure 37). As indicated by other analyses (see above), knapweed declined across all treatments and cheatgrass at YTC showed little response to treatment. At FC, Japanese brome declined in all treatments but this decline was most pronounced in the unburned control plots. The reasons for this response are likely related to the interactions between the drought, the deep litter layer that the fire removed, and the response of bindweed within these two plot types. During 2003, the unburned control plots were dominated by bindweed whereas the treatment plots were not.
Figure 37. Change in the relative biomass of target weed species between 2000 (pre-treatment) and 2003 (three years after treatments began) at Fort Carson, CO and Yakima Training Center, WA. A negative mean indicates that the relative biomass of the weed decreased by the amount during the study period. Different letters indicate significant difference between treatments (Fisher’s LSD, P < 0.05, n = 5). Knapweed control plots (treatment 1) are not included due to biocontrol insect migration to the control sites. The valid control for comparison to the other treatments (3-8) is treatment 2.
Final Report

SERDP CS1145 61
Overall, the treatment responses that were observed were generally only significant in plots receiving a combination of burning/biocontrol, seeding, soil available N reduction, and soil inoculation. This implies that multiple stressors applied to invasive weed populations combined with efforts to promote desirable species populations appear to be superior over single tool or single species approaches. In other words, managing invasive weeds is better approached at the plant community level rather than at the species level.
Recommendations to DoD Regarding Control of Knapweed and Annual Brome Based upon the results of this field study, we can make several recommendations regarding the
management of annual brome and knapweed invasions: • In managing annual brome infestations, care should be taken to avoid increases in soil N
availability, such as can occur with seeding operations or prescribed fires. Increases in N availability can be mitigated by immobilizing soil N, but an economical method for doing so has yet to be developed. If soil C amendments are used, they should be timed to coincide with periods of annual brome seed germination and establishment.
• Fire can be an effective tool for reducing annual brome cover and seed supply. However, the site must be reseeded with species that can suppress regrowth of the annual brome from the soil seed bank.
• Higher rates of seeding and persistent attempts may be needed to displace invasive annual brome species.
• Seeding operations that are timed to coincide with El Nino periods may increase success. The increased N availability associated with increased moisture might be mitigated with soil C amendments.
• Knapweed decline in this study was associated with increased populations of insect biocontrol agents. These biocontrol agents represent the only promising method for controlling invasive knapweeds at the landscape level and they are thus ideally suited for use on large military training lands where management activities are limited. However, as evidenced by this study, the establishment of true biocontrol-free test plots is problematic so the true impact of biocontrol insects in the field remains an under explored area.
• Restoration of the soil community, through soil inoculations, can enhance restoration efforts by accelerating below ground system recovery.
• Managing invasive weeds is better approached at the plant community level using integrated methods rather than at the species level using single tool approaches.
• Dramatic climatic shift (drought) appears to favor native species over introduced species – at least in the short term. Periods of climatic anomaly may represent unique windows of opportunity for vegetation management.
REMOTE SENSING OF RESEARCH PLOTS – SUMMARY OF RESULTS For detailed results see:
National Nuclear Security Administration – Remote Sensing Lab. 2004. Integrated control and assessment of knapweed and cheatgrass on Department of Defense Installations. SERDP Contract # CS 1145. Report no. BN-RSL-05-0005. National Nuclear Security Administration Remote Sensing Lab. Las Vegas, NV. 98pp. Assessing the relationships between spectral data and general plant characteristics was
accomplished by using radiometric and geometric rectification of acquired Daedalus 1268 multispectral scanner digital imagery, simultaneous collection of aerial photography, and acquisition of ground-based imagery. Effectiveness of burning and sucrose treatments on vegetation test sites was qualitatively and quantitatively monitored with airborne multispectral scanner imagery as well as from aerial and ground
Final Report
SERDP CS1145 62
photography. Imagery false color composites using reflected infrared wavelengths and CIR were more sensitive to changes in vegetation health and density than natural color composites, natural color airborne photography, or natural color ground-based photography. Pixel purity analysis of multispectral scanner imagery showed that the content of imagery pixels was spectral mixtures of plants/plant debris, plants/plant debris and soils, and/or soils, and that very few pixels contained pure spectral signatures. The vast majority of these pure spectral signatures were related to soils. This was due to semiarid conditions at the YTC with soils accounting for 65 – 75 percent of the signal received by the airborne scanner. Unsupervised classifications of multispectral scanner data verified that most pixels were spectral mixtures, since very few clusters were directly correlated to a single vegetation species or soil type.
Ground-based measurements that were used to determine statistical relationships between spectral data and vegetation conditions were plot biomass and reflectance spectra of plant species and soils. Biomass estimates for vegetation plots using spectral indices NDVI, SAVI, and GVI had poor correlations to measured biomass, due to inclusion of senescent vegetation in measured biomass values. Biomass values also showed that diffuse knapweed populations decreased drastically from 13 percent of the biomass by weight at F1 in 2000 to 1 percent in 2003.
Ground-based reflectance spectra of the dominant plant species in the vegetation plots revealed that many of the plant species had similar reflectance characteristics, rendering them spectrally indistinguishable by a Daedalus 1268 multispectral scanner. Reflectance spectra of the same plant species over a three-year period showed that variations in percent reflectance amplitude had occurred. These amplitude variations were most likely due to changes in illumination conditions, plant growth stage, and variations in atmospheric water vapor between the years. Reflectance spectra also revealed that the spectrum of a plant radically changes as senescence approaches due to the loss of chlorophyll, and that the spectrum of dead vegetation of differing species is similar. It is therefore imperative that ground-based reflectance spectra be acquired at the same time as the spectrometer overpasses.
Supervised MTMF classifications confirmed that a broad-band multispectral scanner could not map diffuse knapweeds at the knapweed test site. This was attributable to the variety of spectrally similar materials present, low knapweed densities, and spatially scattered knapweed populations. MTMF classifications of materials present at the cheatgrass test site produced good results due to the higher density of vegetation and lack of species diversity. Soil mapping at both vegetation sites was accurate.
Vegetation change was detected and monitored statistically with ANOVA. Sucrose treated plots were consistently statistically different from non-sucrose treated plots at both the knapweed and cheatgrass test sites. Effectiveness of sucrose treatments could also be evaluated. No statistical differences were detected within non-sucrose treated plots at either F1 or F3. No statistical differences were evident within sucrose treated plots at F1, but slight statistical differences were noted within sucrose treated plots at the F3. The effects of soil inoculations appear to be expressing themselves spectrally. Vegetation plot statistical differences were best expressed by infrared wavelengths and vegetation indices. Biomass was not the best indicator of change because of the low statistical correlations.
Ground-based spectral reflectance curves for knapweed and cheatgrass were convolved to Landsat Thematic Mapper bandwidths for supervised classification of Landsat images. The convolved spectra of these distinct species look almost identical to the Landsat Thematic Mapper spectrometer, and therefore can not be identified or discriminated spectrally using a single scene containing both healthy knapweeds and cheatgrass. An MTMF classification of a Landsat scene was conducted for Ft. Carson, Colorado, using these convolved spectra as endmembers. The resulting classification could not discriminate between the input endmembers and other species of vegetation except for conifers. Although supervised classifications for knapweeds and cheatgrass using a single Landsat scene failed, multi-temporal methodology using Landsat Thematic Mapper imagery for identifying and monitoring cheatgrass in the western United States has been reported in recent remote sensing literature.
Final Report
SERDP CS1145 63
ECOLOGICAL MODELLING Fort Carson – Summary of EDYS Results
For detailed results and conclusions see: Hunter, Rachael G., Ricardo Mata-Gonzalez, and Terry McLendon. 2004. Application of the EDYS
model to evaluate control methods for invasive plants at Fort Carson, Colorado. MWH Global, Fort Collins, Colorado. 182 p. At the brome site, Japanese brome was the dominant species at the beginning of the study, but
four years later, the production of this species had drastically declined. The drought conditions of 2002 and 2003 were probably the main reason for this effect. The EDYS model did not simulate well this decline in Japanese brome, probably because the precipitation data that was used for modeling did not represent accurately the precipitation that was received at the study site. The decline in Japanese brome dominance by 2003 was followed by an increase in bindweed dominance. This replacement in species dominance was not observed in the EDYS simulations because Japanese brome was not as affected in the simulations as it was in the field.
At the knapweed site, the population of spotted knapweed dominated the plant community at the beginning of the study. However, as occurred in the brome site with Japanese brome, spotted knapweed declined drastically four years later. The main reason for the decline in spotted knapweed production was the below average precipitation that occurred in 2002 and 2003. This decline and the replacement of western wheatgrass as the dominant species was well simulated by the EDYS model. At the knapweed site, the EDYS simulations of biomass production did not generally differ statistically from the field sampling estimations.
In the brome site long-term simulations, Japanese brome and bindweed had negligible biomass by Year 50, while western wheatgrass became the dominant species. At the knapweed site, the population of spotted knapweed was lost by Year 10 and western wheatgrass, twistspine prickly pear, and soapweed became the dominant species. The treatments applied to the study plots had little effect in the long-term simulations. This may have been the result of the short-term application of the treatments. Fire was applied only the first year, microbial inoculation was applied two years, and sugar was applied only for four years. The long-term simulated replacement of weedy invasive species by native perennials, corresponds well to results obtained in long-term studies found in the literature. The EDYS model simulated well these vegetation changes through time, showing to be a valuable tool to forecast plant community dynamics under different management scenarios.
Spotted knapweed and Japanese brome declined in their respective communities and showed great susceptibility to drought conditions. Spotted knapweed was eliminated from the community within 10 years, while Japanese brome survived at low production levels until Year 50. The faster elimination of spotted knapweed may indicate higher susceptibility to drought than Japanese brome. The effect of biological control agents was not clearly demonstrated, perhaps because it was masked by the overriding influence of the drought.
When grazing was included in the model, no substantial impacts on vegetation total aboveground biomass were seen. Species composition was different at the end of the 50-year simulation. Twistspine pricklypear disappeared from the plots whereas in ungrazed plots it was a major species. Western wheatgrass biomass increased with all levels of grazing and, at the end of 50 years, it was the dominant species. Most other grasses and forbs were gone by the end of the simulation.
When impacts of an M-1 Abrams tank passing through the plots in Year 5 were included in the model, there was no long-term change seen in vegetation biomass and species composition. When impacts of an M-1 Abrams tank or a HMMWV passing through the plots every five years were included in the model, total aboveground biomass was much lower at Year 50 than in non-impacted plots. Species composition was also negatively affected. Biomass of twistspine pricklypear, soapweed, and western wheatgrass, the major species in undisturbed plots, decreased substantially. No species increased and most other grasses and forbs had disappeared by the end of the simulation.
Final Report

SERDP CS1145 64
These modeling results suggest that the plant community in Fort Carson would tend to become a grassland dominated by western wheatgrass over the long-term, provided that the precipitation regimes are similar to the ones registered over the past 50 years and that no further disturbance occurred. Disturbances such as military vehicle training will change biomass production but do not appear to change the major species composition in a 50-year simulation.
Yakima Training Center – Summary of EDYS Results For detailed results and conclusions see:
Hunter, Rachael G., Ricardo Mata-Gonzalez, and Terry McLendon. 2004. Application of the EDYS model to evaluate control methods for invasive plants at Yakima Training Center, Washington. MWH Americas, Fort Collins, Colorado. 167 p.
Two species, cheatgrass and tumblemustard, comprised almost all of the biomass at the brome
site. Mean overall accuracy of the 4-year EDYS simulations at the brome site, compared to the experimental results, was 89% for cheatgrass and 88% for total biomass. Accuracy for tumblemustard was lower (62%). At the end of the four-year simulation, cheatgrass was the dominant species in all plots, regardless of treatment. This was also the case in the field experiment. These validation results indicate that EDYS was successful in simulating the vegetation dynamics at the brome site.
EDYS was then used to simulate vegetation dynamics at this site over a longer period of time (50 years). These simulations indicated that under control conditions (i.e., no treatments), the cheatgrass site would become dominated by big sagebrush and rabbitbrush after 50 years. These simulations also indicated that the fire, sugar, and microbial treatments, as applied in the field experiments alone and in combination, had no long-term affect on secondary succession at this site. This may have been the result of the short-term application of the treatments. Fire was applied only in the first year, microbial inoculation was applied two years, and sugar was applied only for four years. The seeding treatment, however, did have a long-term affect on secondary succession. Based on the simulations, seeding with native perennial grasses resulted in a grass-dominated community at the end of 50 years, rather than a shrub-dominated community without seeding.
At the knapweed site, diffuse knapweed declined dramatically in all of the experimental plots in 2001, regardless of treatment. By the fourth year of the experiment, knapweed remained very low in all treatments, compared to initial conditions. Over the four-year experimental period, big sagebrush and perennial grasses increased under most treatments, and cheatgrass increased on half the treatments and decreased on half. When averaged over all plots and all treatments, cheatgrass was the most abundant species in 2003, with a mean aboveground biomass of 30 g/m2. Big sagebrush averaged 9 g/m2 and perennial grasses averaged 27 g/m2.
The 4-year EDYS simulations produced similar results. Knapweed declined dramatically, as it did in the experimental study plots, and cheatgrass became the most abundant species at the site. Perennial grasses were the second most abundant group, followed by big sagebrush. As in the experimental study, each of these three groups of plants (cheatgrass, perennial grasses, and big sagebrush) increased in 2003 compared to initial conditions. Fourth-year accuracy varied among species, with values for the major species ranging from 52% for Sandberg bluegrass to 100% for bluebunch wheatgrass. Accuracy for total aboveground biomass in the fourth year was 93%.
The EDYS simulations resulted in cheatgrass becoming the most abundant species by the fourth year in all treatments except the sugar treatment, which was dominated by perennial grasses. This was similar to the experimental results. Therefore, the model accurately simulated the overall treatment responses. At the end of the 50-year simulations, all treatments converged to a big-sagebrush community, with a strong perennial grass component. As at the brome site, the treatments had some initial influence on successional development, but these differences were no longer present after 50 years.
Herbivory, by insects and rabbits, significantly reduced biomass on the brome site. The densities for these herbivores may have been too high in the simulations (3 grasshoppers/m2 and 0.3 rabbits/ha). Because only two species were present initially (cheatgrass and tumblemustard), grazing pressure on
Final Report
SERDP CS1145 65
seedlings of other species was very high. On the knapweed site, herbivory caused a decline in total biomass over 50 years. In Year 50, total aboveground biomass was reduced 88% with light rabbit and insect herbivory, 92% with moderate herbivory, and 96% with heavy herbivory. Big sagebrush biomass was reduced to almost zero at all herbivore densities, when without herbivory it was the dominant species by Year 20. Rubber rabbitbrush became the dominant species, with herbivory, although biomass was low. Thus, herbivory at the densities modelled with EDYS will decrease total production and change species composition.
When light cattle grazing was included in the EDYS simulation, minor decreases were observed in plant biomass in the brome and knapweed communities. Grazing did affect long-term community dynamics in both sites, however. In the both sites, by Year 50, rabbitbrush was the dominant species, with Russian knapweed becoming second in dominance. The moderate grazing simulation resulted in 75% less biomass than in the ungrazed simulation in the brome site and the community changed from cheatgrass-tumblemustard dominated to rabbitbrush-Russian knapweed dominated. The heavy grazing simulation resulted in an 80-85% reduction in biomass, compared to no grazing. The composition of the community with heavy grazing also changed, from the originally cheatgrass-tumblemustard dominated to one dominated totally by Russian knapweed. Heavy grazing greatly decreased rabbitbrush biomass. For the knapweed site, the moderate and heavy grazing simulations did not produce substantial changes with respect to the light grazing simulation. The total production at the end of the 50-year simulation was nearly identical, irrespective of the level of grazing. This was because the remaining species (rabbitbrush and Russian knapweed) were not consumed by livestock.
When impacts of military vehicles were included in the model, total aboveground biomass was reduced and vegetation composition was affected. If the vehicle use occurred only early in a 50-year simulation, vegetation biomass was reduced in the five or so years following the disturbance. In the long-term, however, the vegetation recovered and was similar to an undisturbed community. In undisturbed communities, shrubs were the major species at the end of 50 years, while in sites impacted by military vehicles every five years needle-and-thread was the dominant species at the brome site and only a small amount of big sagebrush was left on the knapweed sites. These results show that if the system is impacted by vehicles, vegetation will be negatively impacted and species composition will be different from an undisturbed community. The long-term results depend on how often the community is disturbed.
These modeling results suggest that over relatively short periods of time (< 10 years), some of the treatments may provide methods of reducing cheatgrass. This is especially true for reseeding and application of sugar. However, over longer periods of time (> 20 years) and in the absence of further disturbance, these sites will revert to a big sagebrush-perennial grass community, given similar precipitation patterns as have occurred in the area over the past 50 years. None of the treatments, except reseeding, had a measurable effect on this successional pattern in the long-term. Reseeding with perennial grasses had the long-term effect of increasing perennial grasses and decreasing shrubs. Impacts by rabbit, insect, and cattle grazing and by military vehicle training will negatively impact vegetation biomass and species composition. The degree of impact is dependant upon the density of herbivores and frequency of training.
Final Report
SERDP CS1145 66
LITERATURE CITED Aber, J.D., K.J. Nadelhoffer, P. Steudler, and J.M. Melillo. 1989. Nitrogen saturation in northern forest
ecosystems. Bioscience 39:378-386. Aerts, R. and F. Berendse. 1988. The effect of increased nutrient availability on vegetation dynamics in
wet heathlands. Vegetatio 76:63-69. Allen, M.F., Swenson, W., Querejeta, J. I., Egerton-Warburton, L. M., Treseder, K. K., 2003. Ecology of
mycorrhizae: a conceptual framework for complex interactions among plants and animals. Annu. Rev. Phytopathol. 41, 271-303.
Anderson, M.R., E.J. DePuit, R.H. Abernethy and L.H. Kleinman. 1990. Suppression of annual bromegrass by mountain rye on semiarid mined lands. p.47-55. In: E.D. McArthur et al. (eds.) Proceedings of a Symposium on cheatgrass invasion, shrub die-off, and other aspects of shrub biology and management. US For. Serv., Int. Res. Sta., Gen. Tech. Rep. INT-276. Ogden, UT.
Bais, H. L., Vepachedu, R., Gilroy, S., Callaway, R.M., Vivanco, J. M., 2003. Allelopathy and exotic plant invasion: from molecules and genes to species interactions. Science 301, 1377-1380.
Bais, H. L., Walker, T. S., Stermitz, F. S., Hufbauer, R. A., Vivanco, J. M., 2002. Enantiomeric-dependent phytotoxic and antimicrobial activity of (±)-catechin. A rhizosecreted racemic mixture from spotted knapweed. Plant Phys. 128, 1173-1179.
Bardgett, R. D., McAlister, E. l999. The measurement of soil fungal:bacterial biomass ratios as an indicator of ecosystem self-regulation in temperate meadow grasslands. Biol. Fert. Soils 29, 282-290.
Barrow, J. R. 2003. Atypical morphology of dark septate fungal root endophytes of Bouteloua in arid southwestern USA rangelands. Mycorrhiza 13:239-247.
Barrow, J. R., Havstad, K. M., McCaslin, B. D., 1997. Fungal root endophytes in fourwing saltbrush, Atriplex canescens, on arid rangelands of southwestern USA. Arid Soil Res. Rehab. 11, 177-185.
Bedunah, D. & J. Carpenter. 1989. Plant community response following spotted knapweed (Centaurea maculosa) control on three elk winter ranges in western Montana, pp. 205-212. In P.K. Ray and J.R. Lacey (editors), Proceedings of the 1989 Knapweed Symposium, April 4-5, 1989, Bozeman, Mt. Plant and Soil Department and Extension Service, Montana State University, Bozeman, Montana.
Berendse, F., H. Oudhof, and J. Bol. 1987. A comparative study on nutrient cycling in wet heathland ecosystems. I. Litter production and nutrient loss from the plant. Oecologia 74:174-184.
Binkley, D., and P. Matson. 1983. Ion exchange resin bag method for assessing available forest soil nitrogen. Soil Science Society of America Journal 47:1050-1052.
Cherfas, J. 1991. Disappearing mushrooms: another mass extinction? Science 254:1458. Davidson, F. A. l998. Modelling the qualitative response of fungal mycelia to heterogeneous
environments. J. Theoret. Biol. 195:281-290. DePuit, E. J. and E. F. Redente. 1988. Ecosystem dynamics on reconstructed semiarid lands, pp. 162-
204. In: Allen, E. (ed.) Reclamation of Disturbed Arid Ecosystems. Westview Press. Boulder, CO. Ettershank, G., J.A. Ettershank, M. Bryant, and W.G. Whitford. 1978. Effects of nitrogen fertilization on
primary production in a Chihuahuan Desert ecosystem. J. Arid Environments 1:135-139. Fitter, A. 2003. Making allelopathy respectable. Science 301:1337-1338. Fitter, A. H., Graves, J. D., Watkins, H. K., Robinson, D., Scrimgeour, C. l998. Carbon transfer between
plants and its control in networks of arbuscular mycorrhizas. Funct. Ecol. 12:406-412. Fitter, A. H., Heinemeyer, A., Staddon, P. L. 2000. The impact of elevated CO2 and global change on
arbuscular mycorrhizas: a mycocentric approach. New Phytol. 147:179-187. Goran, W. D., L. L. Radke and W. D. Severinghaus. 1983. An overiew of the ecological effects of
tracked vehicles on major U.S. Army installations. US. Army Corps of Eng, Const Eng Res Lab. Tech. Report N-142.
Final Report
SERDP CS1145 67
Harris, P. 1980. Effects of Urophora affinis Frfld, and U. quadrifasciata (Meig.) (Diptera: Tephritidae) on Centaurea diffusa Lam. and C. maculosa Lam. (Compositae). Zeitschrift fur Angewandte Entomologie 90: 190-201.
Harris, P. and J. H. Myers. 1984. Centaurea diffusa Lam. C. maculosa Lam. diffuse and spotted knapweed (Compositae), pp. 127-137. In: Kelleher, J.S. and M.A. Hulme (eds) Biological Control Programmes Against Insects and Weeds In Canada 1969-1980. London: Commonwealth Agricultural Bureaux.
Harris, P. and M. J. Clapperton. 1997. An exploratory study on the influence of vesicular-arbuscular mycorrhizal fungi on the success of weed biological control with insects. Biocontrol Sci. Tech. 7: 193-201.
Harris, P. and R. Cranston. 1979. An economic evaluation of control methods for diffuse and spotted knapweed in western Canada. Can. J. Plant Sci. 59: 375-382.
Heil, G.W. and M. Bruggink. 1987. Competition for nutrients between Calluna vulgaris (L.) Hull and Molinia caerulea (L.) Moench. Oecologia 73:105-107.
Heil, G.W. and W.H. Diemont. 1983. Raised nutrient levels change heathland into grassland. Vegetatio 53:113-120.
Hirsch, S. A. & J. A. Leitch. 1996. The impact of knapweed on Montana's economy. North Dakota State University, Fargo. Agricultural Econ. Rep. No. 355. 43 p.
Holland E.A., Coleman, D.C. 1987. Litter placement effects on microbial and organic matter dynamics in an agroecosystem. Ecology 68:425-433.
Holmgren, M., and M. Scheffer. 2001. El Nino as a window of opportunity for the restoration of degraded arid ecosystems. Ecosystems 4:151-159.
Horn, B. E., and E. F. Redente. 1998. Soil nitrogen and plant cover of an old-field on the shortgrass steppe in southeastern Colorado. Arid Soil Research & Rehabilitation 12:193-206.
Huenneke LF, Hamburg SP, Koide R, Mooney HA, Vitousek PM. 1990. Effects of soil resources on plant invasion and community structure in California serpentine grassland. Ecology 71:478-491
Hulbert, L. C. 1955. Ecological Studies of Bromus-Tectorum and Other Annual Bromegrasses. Ecological Monographs 25:181-213.
Ingham, E. R., and D. A. Klein. 1984a. Soil fungi: measurement of hyphal length. Soil Biol. Biochem. 16:279-280.
Ingham, E. R., and D. A. Klein. 1984b. Soil fungi: relationships between hyphal activity and staining with fluorescein diacetate. Soil Biol. Biochem. 16:273-278.
Johnson, N. C., Rowland, D. L., Corkidi, L., Egerton-Warburton, L. M., Allen, E. B., 2003. Nitrogen enrichment alters mycorrhizal allocation at five mesic to semiarid grasslands. Ecology 84, 1895-1908.
Kjoller R and Rosendahl S. 2000. Detection of arbuscular mycorrhizal fungi (Glomales) in roots by nested PCR and SSCP (Single Stranded Conformation Polymorphism). Plant and Soil 226:189-196.
Klein, D.A. and M.W. Paschke. 2004. Filamentous fungi: the indeterminate lifestyle and microbial ecology. Microbial Ecology 47: 224-235.
Klein, D.A., Frederick, B.A., Redente, E.F. 1989. Fertilizer effects on microbial communities and organic matter in the rhizosphere of Sitanion hystrix and Agropyron smithii. Arid Soil Res. Rehab. 3:397-404.
Klein, D.A., M.W. Paschke and T.L. Heskett. 2005. Comparative fungal responses in managed Spotted Knapweed (Centaurea maculosa Lam.), and Diffuse Knapweed (C. diffusa Lam.) - infested plant communities. Applied Soil Ecology (in press).
Klein, D.A., McLendon, T., Paschke, M.W., Redente, E. F. 1995. Saprophytic fungal-bacterial growth pattern variations in successional communities of a semi-arid steppe ecosystem. Biol. Fertil. Soils 19:253-256.
Lacey, J. R., C. B. Marlow, and J. R. Lane. 1989. Influence of spotted knapweed (Centaurea maculosa) on surface runoff and sediment yield. Weed Technol. 3: 627-631.
Final Report
SERDP CS1145 68
Lang, R. F., J. M. Story and G. L. Piper. 1996. Establishment of Larinus minutus Gyllenhal (Coleoptera: Curculionidae) for biological control of diffuse and spotted knapweed in the western United States. Pan-Pacific Entomologist 72: 209-212.
Lodge, D. J., and E. R. Ingham. 1991. A Comparison of Agar Film Techniques for Estimating Fungal Biovolumes in Litter and Soil. Agriculture Ecosystems & Environment 34:131-144.
Maddox, D. M. 1982. Biological control of diffuse knapweed (Centaurea diffusa) and spotted knapweed (Centaurea maculosa). Weed Sci. 30: 76-82.
Maddox, D.M. 1979. The knapweeds: Their economics and biological control in the western states, U.S.A.. Rangelands 1: 139-143.
McArthur, E.D., A.C. Blauer and R. Stevens. 1990. Forage kochia competition with cheatgrass in central Utah. p.56-65. In: E.D. McArthur et al. (eds.) Proceedings of a Symposium on cheatgrass invasion, shrub die-off, and other aspects of shrub biology and management. US For. Serv., Int. Res. Sta., Gen. Tech. Rep. INT-276. Ogden, UT.
McLendon, T. and E.F. Redente. 1991. Nitrogen and phosphorus effects on secondary succession dynamics on a semi-arid sagebrush site. Ecology 72:2016-2024.
McLendon, T., and E. F. Redente. 1992. Effects of nitrogen limitation on species replacement dynamics during early secondary succession on a semiarid sagebrush site. Oecologia 91:312-317.
McLendon, T., and E. F. Redente. 1994. Role of nitrogen availability in the transition from annual-dominated to perennial dominated seral communities. Pages 352-362 in S. B. Monsen and S. G. Kitchen, editors. Proceedings -- Ecology and management of annual rangelands. USDA Forest Service, GTR INT-313.
Minorsky, P.V. 2002. On the inside. Plant Phys. 128:1163-1164. Mozafar, M., Anken, T., Ruh, R., Frossard, E. 2000. Tillage intensity, mycorrhizal and nonmycorrhizal
fungi, and nutrient concentrations in maize, wheat, and canola. Agron. J. 92:1117-1124. Munshower, F.F. 1994. Practical Handbook of Disturbed Land Revegetation. CRC Press, Inc. Boca
Raton, FL. Paschke, M. W., T. McLendon, and E. F. Redente. 2000. Nitrogen availability and old-field succession in
a shortgrass steppe. Ecosystems 3:144-158. Paustian K, Schnürer J. 1987. Fungal growth response to carbon and nitrogen limitation: a theoretical
model. Soil Biol. Biochem. 19:613-620. Pellant, M. 1990. The cheatgrass-wildfire cycle -- Are there any solutions? p.11-18. In: E.D. McArthur
et al. (eds.) Proceedings of a Symposium on cheatgrass invasion, shrub die-off, and other aspects of shrub biology and management. US For. Serv., Int. Res. Sta., Gen. Tech. Rep. INT-276. Ogden, UT.
Phillips, J.M., Hayman, D.S. 1970. Improved procedures for clearing roots and staining parasitic and vesicular-arbuscular mycorrhizal fungi for rapid assessment of infection. Trans. Brit. Mycol. Soc. 55:158-162.
Powell, R. D. 1990. The functional forms of density-dependent birth and death rates in diffuse knapweed (Centaurea diffusa) explain why it has not been controlled by Urophora affinis, U. quadrifasciata and Sphenoptera jugoslavica. Proc. VII Int. Symp. on Biol. Control of Weeds 195-202
Powell, R. D. and J. H. Myers. 1988. The effect of Sphenoptera jugoslavica Obenb. (Col., Buprestidae) on its host plant Centaurea diffusa Lam. (Compositae). J. Appl. Entomology 106: 25-45.
Radosevich, S. R., J. S. Holt and C. Ghersa. 1997. Weed Ecology: Implications for Management. 2nd edition. John Wiley and Sons.
Rayner, A.J.R., Beeching, J.D., Crowe, J.C., Watkins, Z.R. 1999. Defining individual fungal boundaries. In: Worrall, J.J. (Ed) Structure and Dynamics of Fungal Populations. Kluwer Academic Pub, Norwell, MA , pp. 19-42.
Redente, E. F. and E. J. DePuit 1988. Reclamation of drastically disturbed rangelands, pp. 559-584. In: Tueller, P. T. (ed) Vegetation Science Applications for Rangelands Analysis and Management. Kluwer Academic Pub.
Redente, E. F. and W. R. Keammerer. 1999. Use of native plants for mined land reclamation. VI International Rangeland Congress, July 1999. Townsville, Australia.
Final Report
SERDP CS1145 69
Rees, N.E., P.C. Quimby Jr., G.L. Piper, E.M. Coombs, C.E. Turner, N.R. Spencer and L.V. Knutson (eds.). 1996. Biological Control of Weeds of the West. West. Soc. Weed Sci., Bozeman, Montana.
Roché, B. F., Jr. 1994. Status of knapweeds in Washington. Wash. State Univ. Coop. Ext. Serv. Knapweed Newsletter 8: 2-4.
Schenck, N.C. 1982. Methods and principles of mycorrhizal research. Am. Phytopath. Soc., St. Paul, MN.
Shaw, R. B. and V. E. Diersing. 1990. Tracked vehicle impacts on vegetation at the Pinon Canyon Maneuver Site, Colorado. J. Environ. Qual. 19: 234-243.
Sheley, R. L. and J. S. Jacobs. 1997. "Acceptable" levels of spotted knapweed (Centaurea maculosa) control. Weed Technology. 11: 363-368.
Sheley, R.L., J.S. Jacobs & M.F. Carpinelli. 1998. Distribution, biology, and management of diffuse (Centaurea diffusa) and spotted knapweed (Centaurea maculosa). Weed Tech. 12: 353-362.
Spoon, C.W., H.R. Bowles & A. Kulla. 1983. Noxious weeds on the Lolo National Forest. A situation analysis staff paper. US Dep. Agric. For. Serv., Northern Region, Missoula, MT. 6 p.
Stamatiadis, S., J. W. Doran, and E. R. Ingham. 1990. Use of Staining and Inhibitors to Separate Fungal and Bacterial-Activity in Soil. Soil Biology & Biochemistry 22:81-88.
Steinger, T. and H. Muller. 1992. Physiological and growth responses of Centaurea maculosa (Asteraceae) to root herbivory under varying levels of intraspecific plant competition and soil nitrogen availability. Oecologia 91: 141-149.
Story, J. M. 1992. Biological control of weeds: selective, economical and safe. West. Wildlands 18: 18-23.
Tilman, D. and D.A. Wedin. 1991. Dynamics of nitrogen competition between successional grasses. Ecology 72:685-700.
Torrey, J.G. 1992. Can plant productivity be increased by inoculation of tree roots with soil microorganisms? Can. J. For. Res. 22, 1815-1823.
Trent, J.D., J.A. Young and R.R. Blank. 1992. Potential role of soil microorganisms in medusahead invasion. p.140-142. In: S.B. Monson and S.G. Kitchen (eds.) Proceedings of a Symposium on the Ecology, Management, and Restoration of Intermountain Annual Rangelands. US For. Serv., Intermountain Res. Sta., Gen. Tech. Rep. INT-GTR-313. Ogden, UT.
USDA, NRCS. 2004. The PLANTS Database, Version 3.5 (http://plants.usda.gov). National Plant Data Center, Baton Rouge, LA 70874-4490 USA.
van Auken, O.W. and J.K. Bush. 1989. Prosopis glandulosa growth: influence of nutrients and simulated grazing of Bouteloua curtipendula. Ecology 70:512-516.
Van Tuinen, D., E. Jacquot, B. Zhao, A. Gollotte and V. Gianinazzi-Pearson. 1998. Characterization of root colonization profiles by a microcosm community of arbuscular mycorrhizal fungi using 25S rDNA-targeted nested PCR. Molecular Ecology 7:879-887.
Vivanco, J.M., Bais, H.P., Stermitz, F.R., Thelen, G.C., Callaway, R.M. 2004. Biogeographical variation in community response to root allelochemistry: novel weapons and exotic invasion. Ecol Letters 7:285-292.
Ward, E., Adams, M.J. l998. Analysis of ribosomal DNA sequences of Polymyxa species and related fungi and the development of genus-and species-specific PCR primers. Mycological Research 102:965-974.
Wedin, D.A. and D. Tilman. 1990. Species effects on nitrogen cycling: a test with perennial grasses. Oecologia 84:433-441.
Final Report
SERDP CS1145 70
APPENDIX A. PROJECT PUBLICATIONS Klein, D.A. 2005. Biodiversity of chytrids. In: Biodiversity in Agricultural Production Systems, G.
Benckiser, Ed., Marcel Dekker, New York, (in press). Meiman, P.J., E.F. Redente and M.W. Paschke. 2005. The role of the native soil community in the
invasion ecology of spotted (Centaurea maculosa auct. non Lam.) and diffuse (C. diffusa Lam.) knapweed. Applied Soil Ecology (in press).
Klein, D.A., M.W. Paschke and T.L. Heskett. 2005. Comparative fungal responses in managed Spotted Knapweed (Centaurea maculosa Lam.), and Diffuse Knapweed (C. diffusa Lam.) - infested plant communities. Applied Soil Ecology (in press).
Drew, A and L. Smith. 2004. Biological control of spotted and diffuse knapweed. USDA, Agricultural Research Service.
Klein, D.A. and M.W. Paschke. 2004. Filamentous fungi: the indeterminate lifestyle and microbial ecology. Microbial Ecology 47: 224-235.
Meiman, P.J. 2003. Invasion ecology of knapweed (Centaurea spp. L): Competition, establishment and interactions with soil biota. PhD dissertation. Colorado State University, Dept. of Forest, Rangeland and Watershed Stewardship. Fort Collins, CO.
Smith, L. and J. M. Story. 2003. Plant size preference of Agapeta zoegana L. (Lepidoptera: Tortricidae), a root-feeding biological control agent of spotted knapweed. Biological Control. 26: 270-278.
Al-Qarawi, A.A. 2002. Relationships among nitrogen availability, vesicular-arbuscular mycorrhizae, and Bromus tectorum in disturbed rangeland sites in Colorado. PhD Dissertation. Colorado State University, Dept. of Rangeland Ecosystem Science. Fort Collins, CO.
Smith, L. (ed.). 2001. Proceedings of the First International Knapweed Symposium of the Twenty-First Century, March 15-16, 2001, Coeur d'Alene, Idaho. USDA-ARS, Albany, CA. 103 p.
Smith, L. 2001. Considerations for Resuming Foreign Exploration for Natural Enemies of Spotted Knapweed, pp. 18-26. In L. Smith (ed.), Proceedings of the First International Knapweed Symposium of the Twenty-First Century, March 15-16, 2001, Coeur d'Alene, Idaho. USDA-ARS, Albany, CA.
Smith, L., J. M. Story, and J. M. DiTomaso. 2001. Bibliography of Spotted Knapweed, Yellow Starthistle and Other Weedy Knapweeds. In L. Smith (ed.), Proceedings of the First International Knapweed Symposium of the Twenty-First Century, March 15-16, 2001, Coeur d'Alene, Idaho. USDA-ARS, Albany, CA. 62 p.
MANUSCRIPTS IN PREPARATION: Smith, L. Paschke, M.W. et al. Population dynamics of insect biological control agents and diffuse
knapweed at Yakima Training Center, Washington. Environmental Entomology. Smith, L. Paschke, M.W. et al. Population dynamics of insect biological control agents and spotted
knapweed at Fort Carson, Colorado. Environmental Entomology. Paschke, M.W. et al. Restoration from the ground up: Control of exotic weeds on military training lands.
Journal of Range Management. Paschke, M.W. et al. The use of soil inoculum as a restoration tool. Restoration Ecology. Redente, E.F. et al. Soil carbon amendments for weed management. Frontiers in Ecology and the
Environment. Mata-Gonzalez, R., et al. Modeling plant growth on cheatgrass and knapweed sites on military training
lands. Ecological Modelling.
Final Report
SERDP CS1145 71
APPENDIX B. PRESENTATIONS AT PROFESSIONAL MEETINGS.
Mata-Gonzalez, R., R.G. Hunter, T. McLendon and M.W. Paschke. 2005. Modeling plant growth on cheatgrass and knapweed sites on military training lands. Society for Range Management 2005 Annual Meeting, February 2005, Fort Worth, Texas.
Paschke, M.W., D.A. Klein, L. Smith and E.F. Redente. 2004. Restoration from the ground up: Control of exotic weeds on military training lands. The 16th Annual Conference of the Society for Ecological Restoration. August 2004, Victoria, British Columbia, Canada.
Klein, D.A. and M.W. Paschke. 2004. A mycocentric approach for management of exotic invasive plants. Accepted for presentation at 104th General Meeting, American Society for Microbiology, May 2004, New Orleans, LA.
Paschke, M.W., E.F. Redente, S.D. Warren, D.A. Klein, and L. Smith. 2004. Experimental control of annual brome and knapweed on military training lands. Society for Range Management 2004 Annual Meeting, January 2004, Salt Lake City, Utah.
Paschke, M.W., E.F. Redente, L. Smith, D.A. Klein, S.D. Warren, A.A. Klawitter, M.E. Howard and T. McLendon. Integrated control and assessment of knapweed and annual brome on military training lands. 7th International Conference on the Ecology and Management of Alien Plant Invasions. November, 2003. Ft. Lauderdale, Florida.
Redente, E.F., M.W. Paschke, S.D. Warren, D.A. Klein, and L Smith. 2003. Control of knapweed and annual brome on DOD installations. The 2003 SERDP and ESTCP Partners in Environmental Technology Technical Symposium, December 2003, Washington, D.C.
Klein, D.A., M.W. Paschke, D.P. Burchers and G. Berardino-Lang. 2003. Fungal Responses during Management for Control of Knapweed (Centaurea biebersteinii, C. diffusa) and Cheatgrass (Bromus tectorum) on Disturbed Semiarid Soils. 103rd Annual Meeting, American Society for Microbiology. May 2003, Washington, DC.
Meiman, P.J., E.F. Redente and M.W. Paschke. 2003. Diffuse knapweed (Centaurea diffusa Lam.) invasion ecology. Society for Range Management 2003 Annual Meeting, February 2003, Casper, Wyoming.
Klein, D.A., M.W. Paschke, D.P. Burchers and G.M. Berardino-Lang. 2003. Fungal Responses during Management for Control of Knapweed (Centaurea biebersteinii, C. diffusa) and annual Brome (Bromus tectorum, Bromus japonicus) on Disturbed Semiarid Soils. Society for Range Management 2003 Annual Meeting, February 2003, Casper, Wyoming.
Paschke, M.W., E.F. Redente, S.D. Warren, L. Smith, M.E. Howard, A.L. Klawitter, and T. McLendon. 2002. Integrated control and assessment of knapweed and annual brome on DOD installations. The 2002 SERDP and ESTCP Partners in Environmental Technology Technical Symposium, December 2002, Washington, D.C.
Warren, S.D., M.W. Paschke, E.F. Redente, D.A. Klein, L. Smith, M.E. Howard, A.L. Klawitter, T. McLendon, W.M. Childress, B. Cochrane, and J. Linn. 2002. Integrated control, assessment and prediction of knapweeds and annual bromes on DOD installations. 11th Annual Integrated Training Area Workshop, August 2002, Savannah, GA.
Klein, D.A., M.W. Paschke, D.P. Burchers and G. Berardino-Lang. 2002. Fungal Responses during Management for Control of Knapweed (Centaurea biebersteinii, C. diffusa) and Cheatgrass (Bromus tectorum) on Disturbed Semiarid Soils. American Society for Microbiology 102nd Annual Meeting, May 2002, Salt Lake City, UT.
Paschke, M.W., E.F. Redente, S.D. Warren, D.A. Klein, L. Smith, M.E. Howard, A.L. Klawitter. 2001. Integrated control and assessment of knapweed and annual brome on DOD installations. The 2001 SERDP and ESTCP Partners in Environmental Technology Technical Symposium, December 2001, Washington, D.C.
Final Report

SERDP CS1145 72
Klein, D.A., J.L. Lowell and M.W. Paschke. 2001. Non-discrete microorganisms in microbial ecology: the filamentous fungi as a heuristic paradigm. Ninth International Symposium on Microbial Ecology. August 2001, Amsterdam, the Netherlands.
Final Report

SERDP CS1145 73
APPENDIX C. END PRODUCTS DELIVERED DIRECTLY TO YTC AND FC PERSONNEL.
• Copies of the final project reports.
• Reprints of publications.
• Biocontrol of Knapweed brochure (Appendix D).
• Final versions of the EDYS model for YTC and FC with supporting materials.
Final Report

SERDP CS1145 74
APPENDIX D. BIOLOGICAL CONTROL OF SPOTTED AND DIFFUSE KNAPWEEDS.
Final Report
R. Richard USDA-APHIS
Biological Control of Spotted and Diffuse
Knapweeds
Carol di Salvo NPS
Lincoln Smith and Allison E. Drew
EXOTIC & INVASIVE WEEDS RESEARCH UNIT
800 Buchanan Street Albany, California 94710
510-559-5800 510-559-5737 FAX
Western Regional Research Center
United States Department of Agricultural Research Service
Cindy Roche
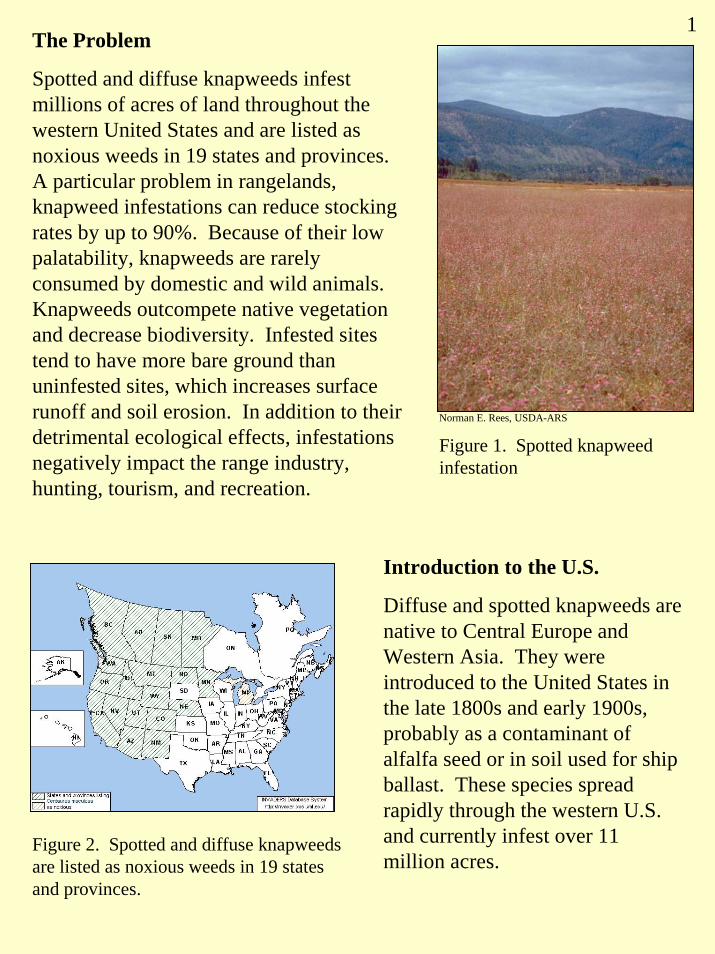
Figure 1. Spotted knapweed infestation
Norman E. Rees, USDA-ARS
1The Problem
Spotted and diffuse knapweeds infest millions of acres of land throughout the western United States and are listed as noxious weeds in 19 states and provinces. A particular problem in rangelands, knapweed infestations can reduce stocking rates by up to 90%. Because of their low palatability, knapweeds are rarely consumed by domestic and wild animals. Knapweeds outcompete native vegetation and decrease biodiversity. Infested sites tend to have more bare ground than uninfested sites, which increases surface runoff and soil erosion. In addition to their detrimental ecological effects, infestations negatively impact the range industry, hunting, tourism, and recreation.
Introduction to the U.S.
Diffuse and spotted knapweeds are native to Central Europe and Western Asia. They were introduced to the United States in the late 1800s and early 1900s, probably as a contaminant of alfalfa seed or in soil used for ship ballast. These species spread rapidly through the western U.S. and currently infest over 11 million acres.
Figure 2. Spotted and diffuse knapweeds are listed as noxious weeds in 19 states and provinces.
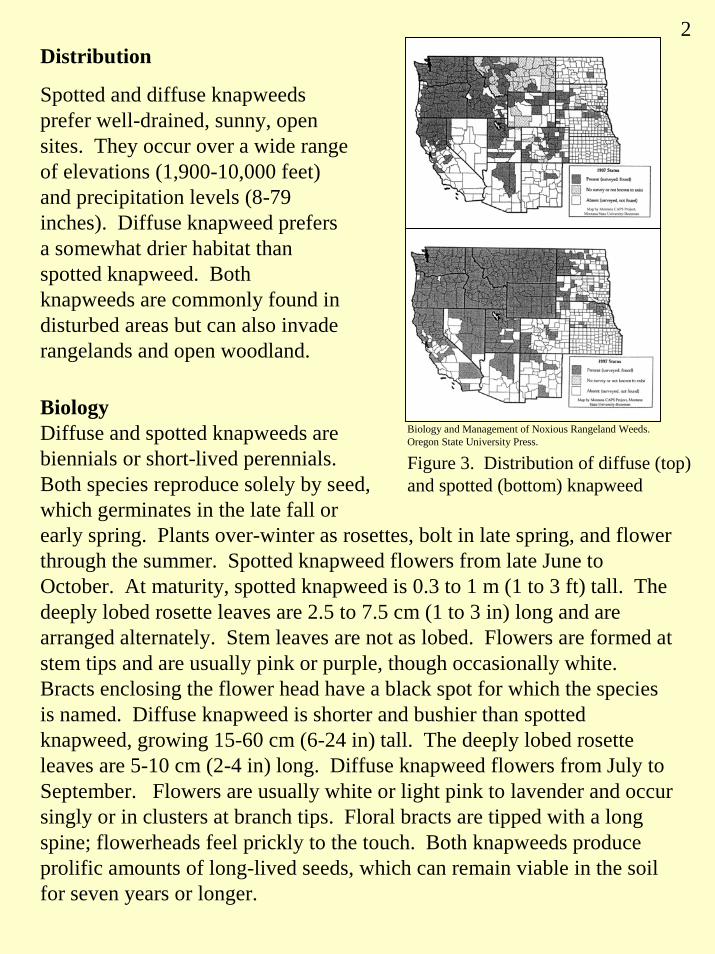
Distribution
Spotted and diffuse knapweeds prefer well-drained, sunny, open sites. They occur over a wide range of elevations (1,900-10,000 feet) and precipitation levels (8-79 inches). Diffuse knapweed prefers a somewhat drier habitat than spotted knapweed. Both knapweeds are commonly found in disturbed areas but can also invade rangelands and open woodland.
Figure 3. Distribution of diffuse (top) and spotted (bottom) knapweed
Biology and Management of Noxious Rangeland Weeds. Oregon State University Press.
early spring. Plants over-winter as rosettes, bolt in late spring, and flower through the summer. Spotted knapweed flowers from late June to October. At maturity, spotted knapweed is 0.3 to 1 m (1 to 3 ft) tall. The deeply lobed rosette leaves are 2.5 to 7.5 cm (1 to 3 in) long and are arranged alternately. Stem leaves are not as lobed. Flowers are formed at stem tips and are usually pink or purple, though occasionally white. Bracts enclosing the flower head have a black spot for which the species is named. Diffuse knapweed is shorter and bushier than spotted knapweed, growing 15-60 cm (6-24 in) tall. The deeply lobed rosette leaves are 5-10 cm (2-4 in) long. Diffuse knapweed flowers from July to September. Flowers are usually white or light pink to lavender and occur singly or in clusters at branch tips. Floral bracts are tipped with a long spine; flowerheads feel prickly to the touch. Both knapweeds produce prolific amounts of long-lived seeds, which can remain viable in the soil for seven years or longer.
BiologyDiffuse and spotted knapweeds are biennials or short-lived perennials. Both species reproduce solely by seed, which germinates in the late fall or
2
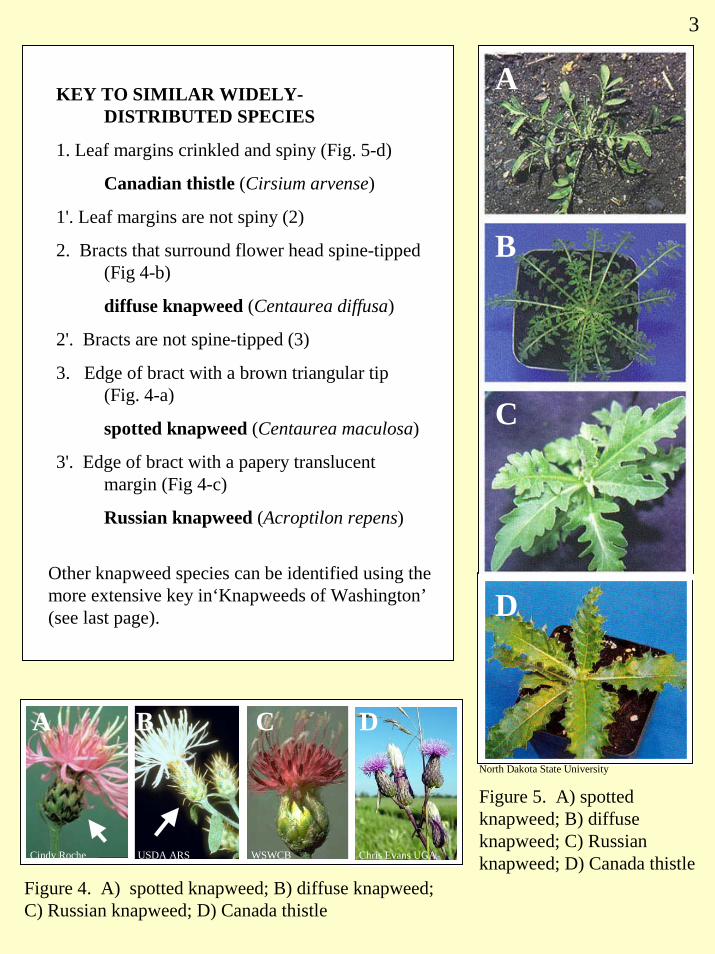
3
KEY TO SIMILAR WIDELY-DISTRIBUTED SPECIES
1. Leaf margins crinkled and spiny (Fig. 5-d)
Canadian thistle (Cirsium arvense)
1'. Leaf margins are not spiny (2)
2. Bracts that surround flower head spine-tipped (Fig 4-b)
diffuse knapweed (Centaurea diffusa)
2'. Bracts are not spine-tipped (3)
3. Edge of bract with a brown triangular tip (Fig. 4-a)
spotted knapweed (Centaurea maculosa)
3'. Edge of bract with a papery translucent margin (Fig 4-c)
Russian knapweed (Acroptilon repens)
Figure 5. A) spotted knapweed; B) diffuse knapweed; C) Russian knapweed; D) Canada thistle
North Dakota State University
Cindy Roche Chris Evans UGAWSWCBUSDA ARS
Figure 4. A) spotted knapweed; B) diffuse knapweed; C) Russian knapweed; D) Canada thistle
A
B
C
D
A B C D
Other knapweed species can be identified using the more extensive key in‘Knapweeds of Washington’(see last page).
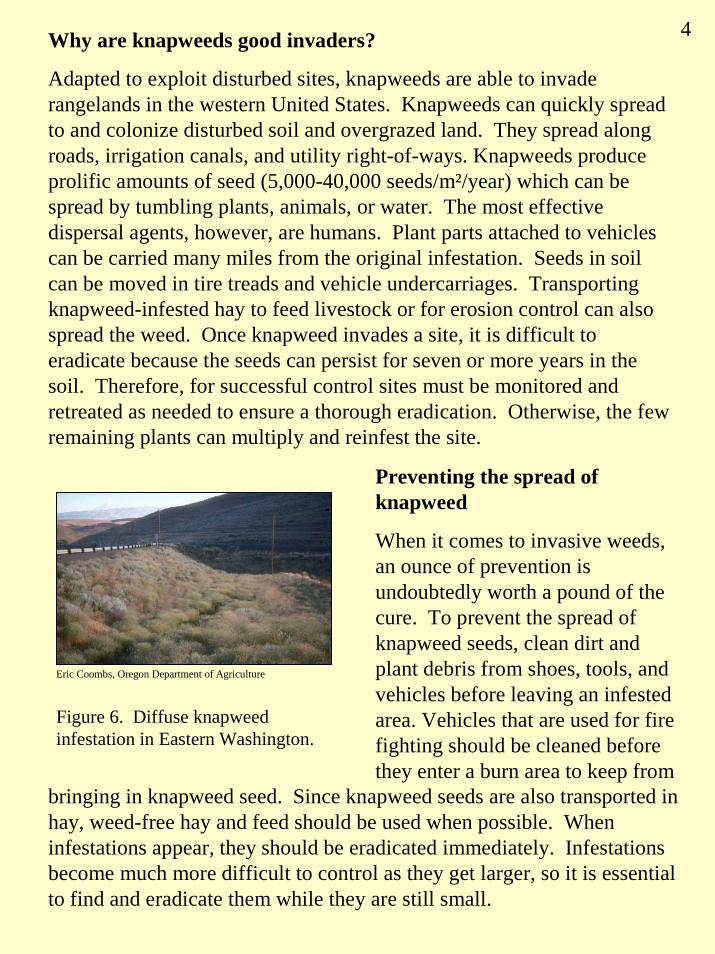
4Why are knapweeds good invaders?
Adapted to exploit disturbed sites, knapweeds are able to invaderangelands in the western United States. Knapweeds can quickly spread to and colonize disturbed soil and overgrazed land. They spread along roads, irrigation canals, and utility right-of-ways. Knapweeds produce prolific amounts of seed (5,000-40,000 seeds/m²/year) which can be spread by tumbling plants, animals, or water. The most effective dispersal agents, however, are humans. Plant parts attached to vehicles can be carried many miles from the original infestation. Seeds in soil can be moved in tire treads and vehicle undercarriages. Transporting knapweed-infested hay to feed livestock or for erosion control can also spread the weed. Once knapweed invades a site, it is difficult to eradicate because the seeds can persist for seven or more years in the soil. Therefore, for successful control sites must be monitored and retreated as needed to ensure a thorough eradication. Otherwise, the few
bringing in knapweed seed. Since knapweed seeds are also transported in hay, weed-free hay and feed should be used when possible. When infestations appear, they should be eradicated immediately. Infestations become much more difficult to control as they get larger, so it is essential to find and eradicate them while they are still small.
remaining plants can multiply and reinfest the site.
Preventing the spread of knapweed
When it comes to invasive weeds, an ounce of prevention is undoubtedly worth a pound of the cure. To prevent the spread of knapweed seeds, clean dirt and plant debris from shoes, tools, and vehicles before leaving an infested area. Vehicles that are used for fire fighting should be cleaned before they enter a burn area to keep from
Eric Coombs, Oregon Department of Agriculture
Figure 6. Diffuse knapweed infestation in Eastern Washington.
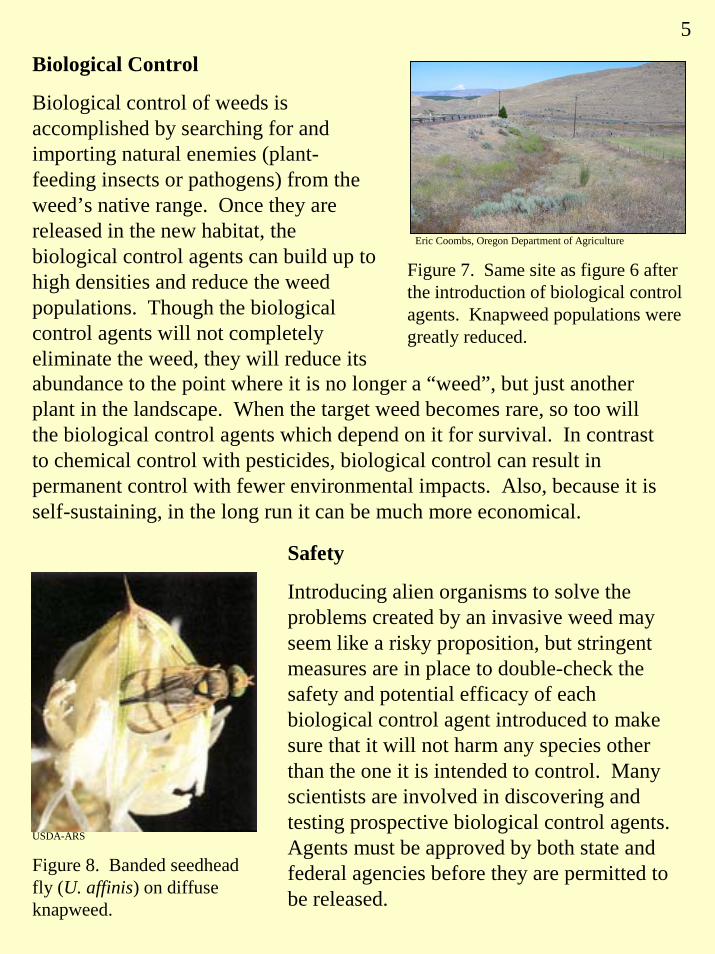
5
Biological Control
Biological control of weeds is accomplished by searching for and importing natural enemies (plant-feeding insects or pathogens) from the weed’s native range. Once they are released in the new habitat, the biological control agents can build up to high densities and reduce the weed populations. Though the biological control agents will not completely eliminate the weed, they will reduce its
Eric Coombs, Oregon Department of Agriculture
Figure 7. Same site as figure 6 after the introduction of biological control agents. Knapweed populations were greatly reduced.
abundance to the point where it is no longer a “weed”, but just another plant in the landscape. When the target weed becomes rare, so too will the biological control agents which depend on it for survival. In contrast to chemical control with pesticides, biological control can result in permanent control with fewer environmental impacts. Also, because it is self-sustaining, in the long run it can be much more economical.
Safety
Introducing alien organisms to solve the problems created by an invasive weed may seem like a risky proposition, but stringent measures are in place to double-check the safety and potential efficacy of each biological control agent introduced to make sure that it will not harm any species other than the one it is intended to control. Many scientists are involved in discovering and testing prospective biological control agents. Agents must be approved by both state and federal agencies before they are permitted to be released.
Figure 8. Banded seedhead fly (U. affinis) on diffuse knapweed.
USDA-ARS
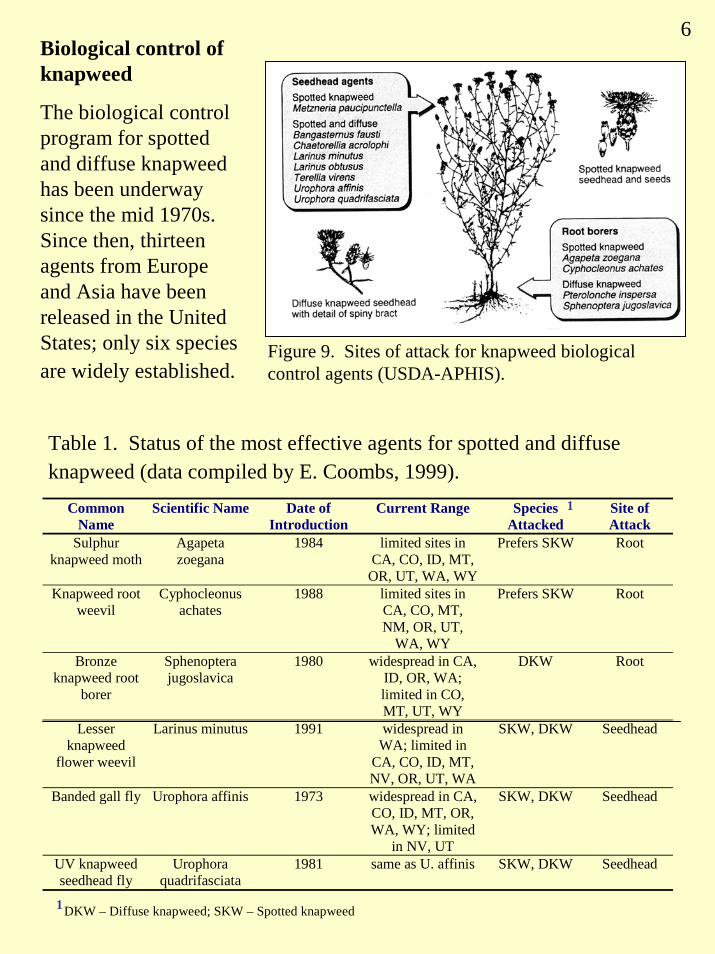
6Biological control of knapweed
The biological control program for spotted and diffuse knapweed has been underway since the mid 1970s. Since then, thirteen agents from Europe and Asia have been released in the United States; only six species are widely established.
Figure 9. Sites of attack for knapweed biological control agents (USDA-APHIS).
Table 1. Status of the most effective agents for spotted and diffuse knapweed (data compiled by E. Coombs, 1999).
Common Name
Scientific Name Date of Introduction
Current Range Species Attacked
Site of Attack
Sulphur knapweed moth
Agapeta zoegana
1984 limited sites in CA, CO, ID, MT,
OR, UT, WA, WY
Prefers SKW Root
Knapweed root weevil
Cyphocleonus achates
1988 limited sites in CA, CO, MT, NM, OR, UT,
WA, WY
Prefers SKW Root
Bronze knapweed root
borer
Sphenoptera jugoslavica
1980 widespread in CA, ID, OR, WA; limited in CO, MT, UT, WY
DKW Root
Lesser knapweed
flower weevil
Larinus minutus 1991 widespread in WA; limited in
CA, CO, ID, MT, NV, OR, UT, WA
SKW, DKW Seedhead
Banded gall fly Urophora affinis 1973 widespread in CA, CO, ID, MT, OR, WA, WY; limited
in NV, UT
SKW, DKW Seedhead
UV knapweed seedhead fly
Urophora quadrifasciata
1981 same as U. affinis SKW, DKW Seedhead
1
1DKW – Diffuse knapweed; SKW – Spotted knapweed
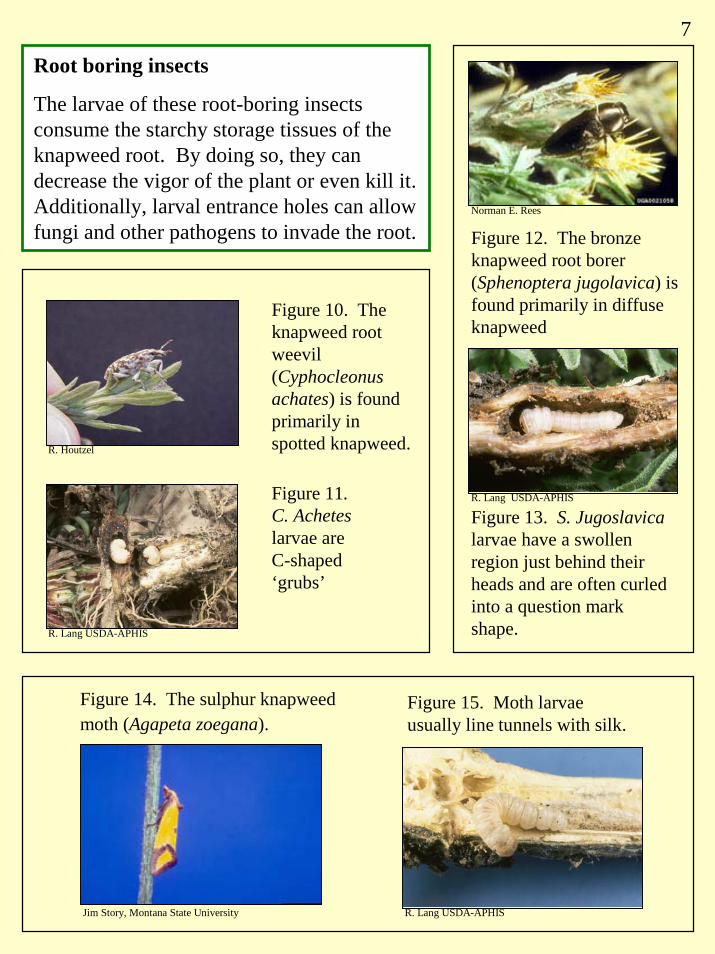
7
Root boring insects
The larvae of these root-boring insects consume the starchy storage tissues of the knapweed root. By doing so, they can decrease the vigor of the plant or even kill it. Additionally, larval entrance holes can allow fungi and other pathogens to invade the root. Figure 12. The bronze
knapweed root borer (Sphenoptera jugolavica) is found primarily in diffuse knapweed
Figure 13. S. Jugoslavicalarvae have a swollen region just behind their heads and are often curled into a question mark shape.
Norman E. Rees
R. Lang USDA-APHIS
Figure 10. The knapweed root weevil (Cyphocleonus achates) is found primarily in spotted knapweed.
Figure 11. C. Acheteslarvae are C-shaped ‘grubs’
R. Houtzel
R. Lang USDA-APHIS
Figure 14. The sulphur knapweed moth (Agapeta zoegana).
Figure 15. Moth larvae usually line tunnels with silk.
Jim Story, Montana State University R. Lang USDA-APHIS
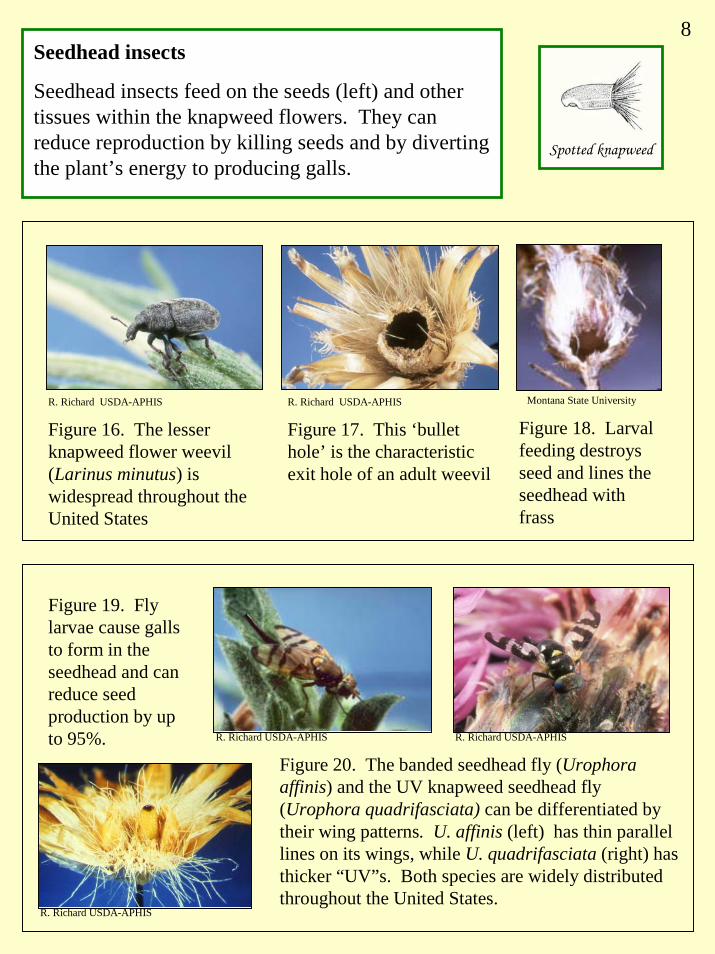
8Seedhead insects
Seedhead insects feed on the seeds (left) and other tissues within the knapweed flowers. They can reduce reproduction by killing seeds and by diverting the plant’s energy to producing galls.
Spotted knapweed
Figure 16. The lesser knapweed flower weevil (Larinus minutus) is widespread throughout the United States
Figure 17. This ‘bullet hole’ is the characteristic exit hole of an adult weevil
Montana State University
Figure 18. Larval feeding destroys seed and lines the seedhead with frass
R. Richard USDA-APHIS R. Richard USDA-APHIS
Figure 20. The banded seedhead fly (Urophora affinis) and the UV knapweed seedhead fly (Urophora quadrifasciata) can be differentiated by their wing patterns. U. affinis (left) has thin parallel lines on its wings, while U. quadrifasciata (right) has thicker “UV”s. Both species are widely distributed throughout the United States.
Figure 19. Fly larvae cause galls to form in the seedhead and can reduce seed production by up to 95%. R. Richard USDA-APHIS R. Richard USDA-APHIS
R. Richard USDA-APHIS
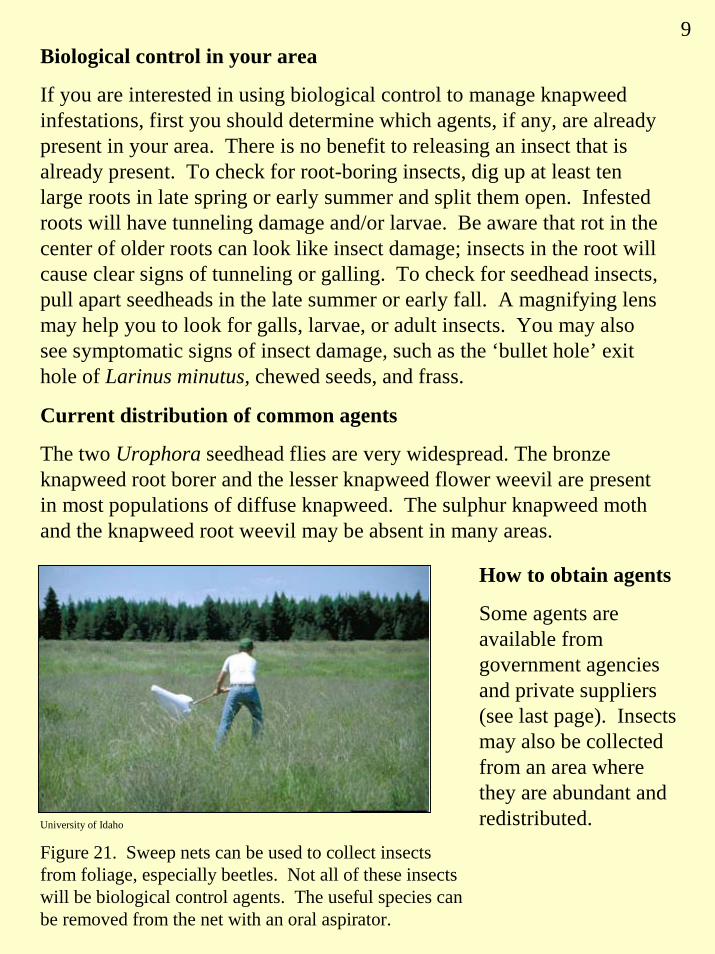
9Biological control in your area
If you are interested in using biological control to manage knapweed infestations, first you should determine which agents, if any, are already present in your area. There is no benefit to releasing an insect that is already present. To check for root-boring insects, dig up at least ten large roots in late spring or early summer and split them open. Infested roots will have tunneling damage and/or larvae. Be aware that rot in the center of older roots can look like insect damage; insects in the root will cause clear signs of tunneling or galling. To check for seedhead insects, pull apart seedheads in the late summer or early fall. A magnifying lens may help you to look for galls, larvae, or adult insects. You may also see symptomatic signs of insect damage, such as the ‘bullet hole’ exit hole of Larinus minutus, chewed seeds, and frass.
Current distribution of common agents
The two Urophora seedhead flies are very widespread. The bronze knapweed root borer and the lesser knapweed flower weevil are present in most populations of diffuse knapweed. The sulphur knapweed moth and the knapweed root weevil may be absent in many areas.
How to obtain agents
Some agents are available from government agencies and private suppliers (see last page). Insects may also be collected from an area where they are abundant and redistributed. University of Idaho
Figure 21. Sweep nets can be used to collect insects from foliage, especially beetles. Not all of these insects will be biological control agents. The useful species can be removed from the net with an oral aspirator.
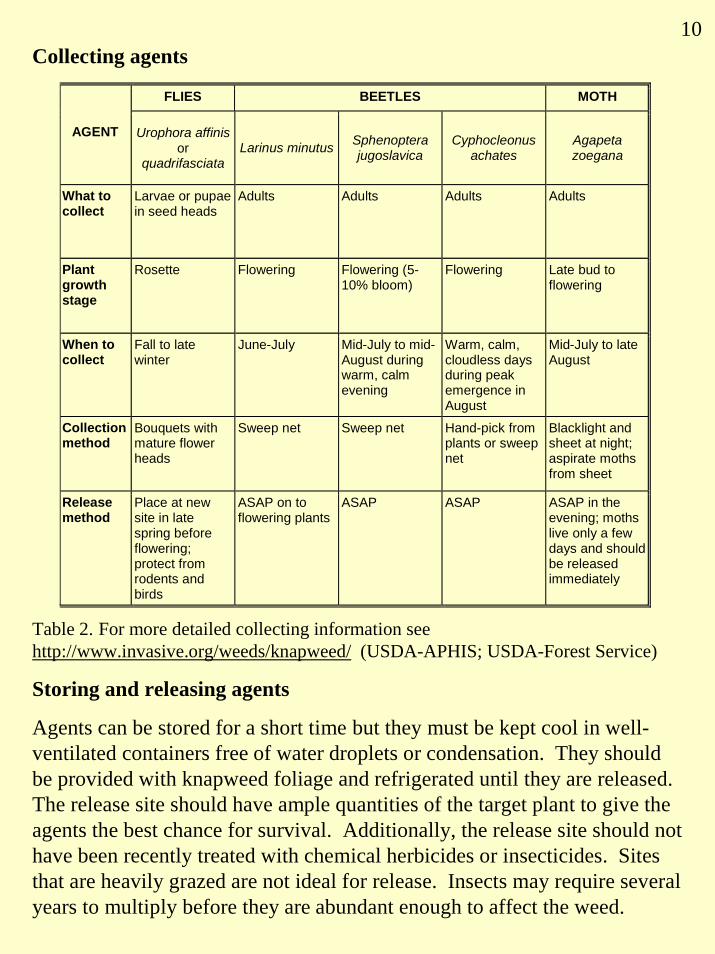
10Collecting agents
Table 2. For more detailed collecting information see http://www.invasive.org/weeds/knapweed/ (USDA-APHIS; USDA-Forest Service)
FLIES BEETLES MOTH
AGENT Urophora affinis or
quadrifasciata Larinus minutus Sphenoptera
jugoslavica Cyphocleonus
achates Agapeta zoegana
What to collect
Larvae or pupae in seed heads
Adults Adults Adults Adults
Plant growth stage
Rosette Flowering Flowering (5-10% bloom)
Flowering Late bud to flowering
When to collect
Fall to late winter
June-July Mid-July to mid-August during warm, calm evening
Warm, calm, cloudless days during peak emergence in August
Mid-July to late August
Collection method
Bouquets with mature flower heads
Sweep net Sweep net Hand-pick from plants or sweep net
Blacklight and sheet at night; aspirate moths from sheet
Release method
Place at new site in late spring before flowering; protect from rodents and birds
ASAP on to flowering plants
ASAP ASAP ASAP in the evening; moths live only a few days and should be released immediately
Storing and releasing agents
Agents can be stored for a short time but they must be kept cool in well-ventilated containers free of water droplets or condensation. They should be provided with knapweed foliage and refrigerated until they are released.The release site should have ample quantities of the target plant to give the agents the best chance for survival. Additionally, the release site should not have been recently treated with chemical herbicides or insecticides. Sites that are heavily grazed are not ideal for release. Insects may require several years to multiply before they are abundant enough to affect the weed.

11Integrated management
Biological control is not the only tool available to control spotted and diffuse knapweed. Other control methods include herbicides, timed grazing, and physical removal of plants before they flower. Integrated use of a variety of methods may be more effective than any one method by itself. It is important to have specific management objectives in mind when designing a control program, and to develop strategies that fit the characteristics of the site. No matter which methods are used, control will be most effective and long-lasting if a healthy, competitive plant community is established.
Conclusion
Biological control can provide a lasting, economical, and environmentally benign means of controlling invasive weeds. However, the best control is prevention. The first priority in any management plan is preventing further spread of the weed. Secondly, alert monitoring will enable you to remove small numbers of plants from new infestations before theybecome a problem. Remaining resources can be used for long-term management of large infestations. Only by using an integrated strategy of monitoring and control will we be able to effectively manage these noxious weeds.
Lincoln Smith USDA-ARS Lincoln Smith USDA-ARS
B - 2004A - 2000
Figure 22. Grassland near Colorado Springs before (A) and 4 years after (B) the introduction of biological control agents. The grayish foliage in the mid-ground of 22-A is spotted knapweed. The community in 22-B is dominated by grasses.
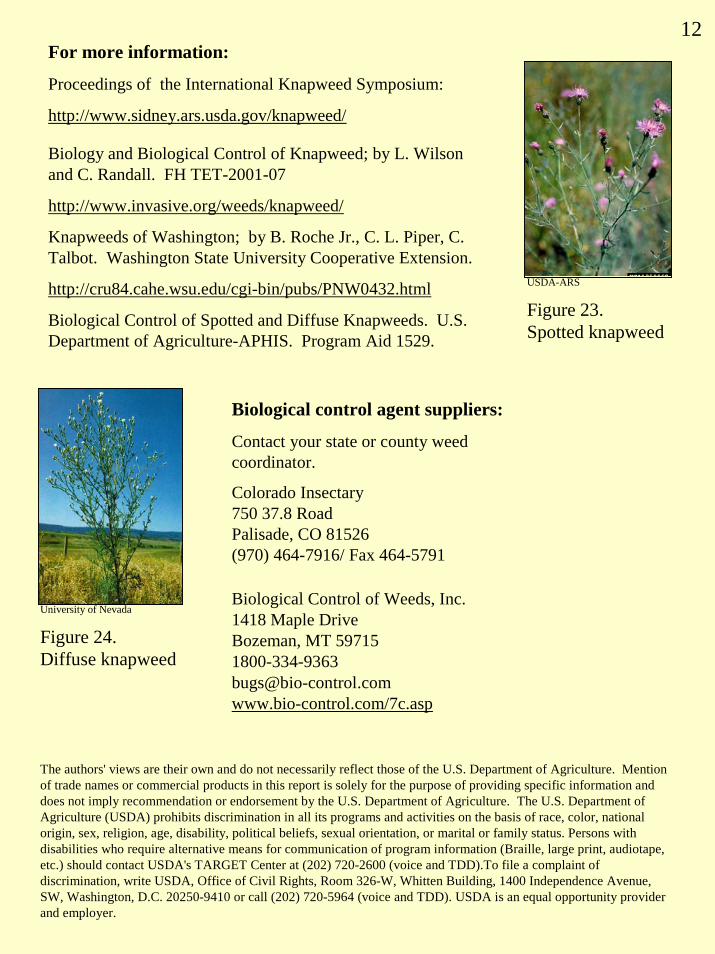
12For more information:
Proceedings of the International Knapweed Symposium:
http://www.sidney.ars.usda.gov/knapweed/
Biology and Biological Control of Knapweed; by L. Wilson and C. Randall. FH TET-2001-07
http://www.invasive.org/weeds/knapweed/
Knapweeds of Washington; by B. Roche Jr., C. L. Piper, C. Talbot. Washington State University Cooperative Extension.
http://cru84.cahe.wsu.edu/cgi-bin/pubs/PNW0432.html
Biological Control of Spotted and Diffuse Knapweeds. U.S. Department of Agriculture-APHIS. Program Aid 1529.
USDA-ARS
Figure 23. Spotted knapweed
University of Nevada
Figure 24. Diffuse knapweed
Biological control agent suppliers:
Contact your state or county weed coordinator.
Colorado Insectary750 37.8 RoadPalisade, CO 81526(970) 464-7916/ Fax 464-5791
Biological Control of Weeds, Inc.1418 Maple DriveBozeman, MT [email protected]/7c.asp
The authors' views are their own and do not necessarily reflect those of the U.S. Department of Agriculture. Mention of trade names or commercial products in this report is solely for the purpose of providing specific information and does not imply recommendation or endorsement by the U.S. Department of Agriculture. The U.S. Department of Agriculture (USDA) prohibits discrimination in all its programs and activities on the basis of race, color, national origin, sex, religion, age, disability, political beliefs, sexual orientation, or marital or family status. Persons with disabilities who require alternative means for communication of program information (Braille, large print, audiotape, etc.) should contact USDA's TARGET Center at (202) 720-2600 (voice and TDD).To file a complaint of discrimination, write USDA, Office of Civil Rights, Room 326-W, Whitten Building, 1400 Independence Avenue, SW, Washington, D.C. 20250-9410 or call (202) 720-5964 (voice and TDD). USDA is an equal opportunity provider and employer.