Embed Size (px)
Citation preview

Artículo recibido el día: 20/05/2016 Artículo aceptado definitivamente el día: 18/11/2016
Estudios de Fonética Experimental, ISSN 1575-5533, XXVI, 2017, pp. 133-163
INTENSITY THRESHOLD: BEYOND PURE TONES
UMBRAL DE INTENSIDAD:
MÁS ALLÁ DE LOS TONOS PUROS
JOSEFA DORTA Universidad de La Laguna
JOSÉ ANTONIO MARTÍN Universidad de La Laguna
CAROLINA JORGE Universidad de La Laguna


Intensity threshold: beyond pure tones 135
EFE, ISSN 1575-5533, XXVI, 2017, pp. 133-163
ABSTRACT
The objective of this study is to determine an intensity threshold based on perceptive discrimination in a manner similar to how the F0 threshold of 1.5-2 St was established (Rietveld & Gussenhoven, 1985; Toledo, 2000b; Pamies et al., 2002). In previous studies, an intensity threshold of 3 dB (v. gr. Dorta & Hernández, 2005:99-100) has been used, but it has not been proven that this is the appropriate threshold for the discrimination of normal speech sounds. Therefore, we have designed a discrimination-type perception test in order to determine the minimum intensity necessary to differentiate sounds in a formal context of controlled speech, as opposed to using pure tones as is typical of audiometry studies. The test was conducted on a set of 74 listeners or judges who compared and determined whether or not there were differences between proximal stimuli differentiated by their intensity levels. Our initial hypothesis suggests that the results of this perception test shall permit us to establish a threshold from 3-5 dB. The results and the statistical analysis of the data confirm our hypothesis, establishing the intensity threshold at 4 dB.
Keywords: perceptive threshold, intensity, perception test, auditory discrimination.
RESUMEN
El objetivo de este trabajo es determinar un umbral de intensidad a partir de la discriminación perceptiva de manera análoga a como se ha establecido en la F0 el umbral de 1,5-2 St (Rietveld y Gussenhoven, 1985; Toledo, 2000b; Pamies et al., 2002). En estudios anteriores se ha utilizado un umbral de intensidad de 3 dB (v. gr. Dorta y Hernández, 2005:99-100) pero no está probado que dicho umbral sea apropiado en la discriminación de sonidos del habla normal. Por ello, hemos diseñado un test de percepción de tipo discriminante con el propósito de determinar la intensidad mínima necesaria para diferenciar sonidos en un contexto controlado de habla próximo al estilo formal, en lugar de discriminar entre tonos puros como se suele hacer en los estudios de audiometría. El test se aplicó a un conjunto de 74 auditores o jueces que debían comparar y decidir si se dan diferencias entre estímulos próximos diferenciados por distintos niveles de intensidad. Nuestra hipótesis de partida plantea que los resultados del test perceptivo permitirían establecer un umbral que oscile entre 3-5 dB. Los resultados y el análisis estadístico de los datos permiten confirmar la hipótesis y establecer el umbral de intensidad en 4 dB.
Palabras clave: umbral perceptivo, intensidad, test de percepción, discriminación auditiva.

136 J. Dorta, J. A. Martín, C. Jorge
EFE, ISSN 1575-5533, XXVI, 2017, pp. 133-163
1. INTRODUCTION Measurements of acoustic phonetic parameters are based on linear scales and very precise measurements. However, human perception, via hearing, often performs differently and therefore it is necessary to determine whether or not seemingly acceptable differences in acoustic measurements are perceptually relevant. Therefore, researchers should be aware that certain differences, observed via different acoustic analysis devices and programs, may hide perceptive relevance and are susceptible to analysis based on phonological theory given their potential influence on communication. Small differences in the three physical properties of sound, that is, in intensity, duration and frequency, may indicate different emotions, focus and may even allow to differentiate between sentence modalities. Based on a study by Rietveld and Gussenhoven (1985), which established the tonal threshold of 1.5 Semitones (St1), one of the studies on Spanish regarding the determination of a tonal threshold based on auditory perception was conducted by Pamies et al. (2002). This work considers that:
Aunque los movimientos tonales a lo largo de un enunciado son un continuo, la verificación y/o aplicación de cualquier teoría fonológica necesita delimitar un umbral a partir del cual una prominencia tonal puede ser realmente interpretada como tal: las llamadas diferencias mínimas perceptibles. (2002:272)
This study, an important precedent for the design of our experiment on intensity, allows us to determine when the tonal inflection is sufficient to be heard by the human ear and the extent to which it is phonologically relevant. The authors of the work (Pamies et al., 2002) concluded that the threshold of 1.5 St previously found by Rietveld and Gussenhoven (1985) and Toledo (2000b) is valid for the Spanish language, given that:
[…] aunque hay indicios de que el umbral perceptivo sea de 1#, el umbral funcional se sitúa a medio camino entre el mínimo perceptible (1#) y el máximo imperceptible (2#), lo cual, interpretado de forma categorial y discreta, confirma que 1,5# sería la unidad mínima potencialmente relevante desde el punto de vista prosódico. (2002:277)
This threshold of 1.5 St has been applied in various studies that have employed the labeling of the Sp_ToBI system, such as, for example, in Fernández Planas and Martínez Celdrán (2003), Roseano and Fernández Planas (2013) and in the review
1 Musical measure used in phonetic studies to relativize F0 data in Hertz.

Intensity threshold: beyond pure tones 137
EFE, ISSN 1575-5533, XXVI, 2017, pp. 133-163
proposed by Dorta (2013), as it permits the labeling of different tonal inflections based on objective criteria, removing researcher subjectivity, one of the main problems of prosodic labeling. In the study of duration, different thresholds have also been used. Specifically considering the Spanish language, Toledo (1988, 2000a), as well as other authors, established that for Spanish listeners, the Just Noticeable Differences (JND) in duration occur at 30-40 ms. Later, Fernández Planas and Martínez Celdrán (2003) considered the perceptive threshold of one third of the difference, affirming that “The differences in duration in 50% of the cases are below the perceptive threshold. That is, they are not large enough to be detected by the ear as significant” (p. 198). Pamies Bertrán and Fernández Planas (2006) found a slightly higher perceptive threshold, situated at 36%, which was used by Dorta (2013) as well. These thresholds allow the authors to distinguish between a long and short syllable or to compare, for example, whether or not the extended duration of the tonic syllable may be perceived in comparison to the unstressed surrounding syllables. In the intensity parameter, no unanimous agreement has been reached regarding a definitive differential threshold. This may be due to the limited number of works that have analyzed intensity from a perception perspective, Stevens (2000) refers to several studies focused on finding JND between different stimuli, though almost all of these works study the perception of loudness in pure tones or wide-band noises. Precisely, from this perspective, Marrero (2008:218) suggested that:
La capacidad para percibir cambios de intensidad en el oído humano normal crece logarítmicamente más de cien veces desde el umbral de audición (0 dB en la mayoría, aunque algunas personas alcancen los -10 dB) hasta el umbral del dolor (110-120 dB). La proporción entre el sonido más intenso previo al dolor, y el más débil que podemos percibir es de 1.000.000.000.000/1, o lo que es lo mismo, 10/1.
At this respect, Raphael, Borden, and Harris (2007:45) explain:
Why use a logarithmic scale for sound intensity? There are two reasons: First, the human ear is sensitive to a large intensity range, as many as 1013 (10 followed by 12 zeros, or 10 trillion) units of intensity in a linear scale. That number is unmanageably large, but on a condensed logarithmic scale, the number is reduced to 130 dB. The second reason is that the logarithmic scale more nearly approximates the way human ears judge loudness.

138 J. Dorta, J. A. Martín, C. Jorge
EFE, ISSN 1575-5533, XXVI, 2017, pp. 133-163
Johnson (2003:48) includes the following table 1 to illustrate the different scales:
Typical experience Pressure (µPa) Decibel level (SPL) Absolute threshold 20 0 Faint whisper 200 20 Quiet office 2,000 40 Conversation 20,000 60 City bus 200,000 80 Subway train 2,000,000 100 Loud thunder 20,000,000 120 Pain and damage 200,000,000 140
Table 1. A comparison of the typical maximum pressure fluctuations (given in both micro Pascals (µPa), and decibels SPL) of some common sounds (adapted from Johnson, 2003).
Within this wide range of perception however, it is necessary to determine how many dB are needed at any point in order to go from perceiving two sounds as being the same to being different, something that has not been tested for the Spanish language. Within the AMPER (Multi-media Atlas of Prosody of the Romanesque Space) project, the three mentioned prosodic parameters are examined (F0, duration and intensity). In this framework is required the establishment of a clear intensity threshold which is applicable to different studies in order to achieve, for example, a way of differentiating between tonic and atonic syllables or to verify to what extent the loss of intensity of the last syllable in declarative sentences is really significant. 2. MOTIVATION The main aim of this paper is to determine the minimum intensity required to differentiate between sounds in a formal, controlled context of nearby speech, as opposed to discriminating between pure tones as is typically done in audiometry, as we can see in the guidelines of the American Speech, Language and Hearing Association (1988). Our initial hypothesis is that the perceptive results shall allow us to establish a threshold ranging between 3-5 dB.

Intensity threshold: beyond pure tones 139
EFE, ISSN 1575-5533, XXVI, 2017, pp. 133-163
3. METHOD: THE PERCEPTION TEST 3.1. Procedure In order to attempt to establish a differential perceptive threshold for intensity, a closed response test was designed based on some ideas defended by Marrero (2013). In the designed test, judges are requested to signal whether each pair of presented stimuli are the same or different; this is an AX-type test, where listeners are expected to differentiate between an stimulus that is always the same (A) and another that can be equal or different from A. This type of test, based on auditory discrimination, force the judges to focus on the signal, since they do not need to categorize the presented stimuli, but rather, to focus their attention on perceiving subtle differences. In this type of test it is considered to be necessary to avoid random answers (roughly 50%) therefore the judges have been instructed to always respond to what they believe that they hear, avoiding guessing. Furthermore, there is repetition of stimuli, that allows to evaluate the internal coherence of the listener. In other words, the same set of stimuli is repeated several times in order to measure the consistency of each judge over time. These two measures help to prevent the need to use an error control formula to correct the results. A final measure used to add reliability to this type of test is seen in table 2, designed by Pamies et al. (2002), in which they made a comparison between the different elements, but also between the same items. This comparison of like elements acts as a control given that it is anticipated that the judge, if paying enough attention to the test, shall always report these elements as being identical. As for the design of the stimuli, it should be considered that our objective is not to conduct a study on stress perception– where the three prosodic parameters of F0, duration and intensity, are involved–, but rather, to study the perception of intensity differences, thereby leaving F0 and duration untouched. On the other hand, given that the threshold that we are attempting to determine shall serve to discriminate real speech, we have preferred to use this sort of stimuli instead of pure tones. Thus, as in Pamies et al. (2002), we use a single syllable /ba/ for each gender, which is later duplicated using the Praat program to generate the different stimuli of the test. These always have the same duration and F0, but their intensity is modified using the command: modify> multiply in this program, as shown in figure 1. Therefore, one of the syllables always registers +0 dB (its intensity does

140 J. Dorta, J. A. Martín, C. Jorge
EFE, ISSN 1575-5533, XXVI, 2017, pp. 133-163
not increase), as opposed to another in which this parameter is modified; 25 ms is always left between the two syllables of the pair.
Male voice Female voice 110Hz-110Hz (+0#) 220Hz-220Hz (+0#)
110Hz-113,5Hz (+0,54#) 220Hz-226Hz (+0,47#) 110Hz-116,5Hz (+0,99#) 220Hz-233Hz (+0,99#) 110Hz-120Hz (+1,51#) 220Hz-240Hz (+1,51#) 110Hz-124Hz (+2,07#) 229Hz-246,5Hz (+1,97#)
116,5Hz-110Hz (-0,99#) 226Hz-220Hz (-0,47#) 113,5Hz-110Hz (-0,54#) 233Hz-220Hz (-0,99#) 120Hz-110Hz (-1,51#) 240Hz-220Hz (-1,51#) 124Hz-110Hz (-2,07#) 246,5Hz-229Hz (-1,97#)
Table 2. Gradation of tonal stimuli in Hz and in St (adapted from Pamies et al., 2002).
Figure 1. Original and manipulated syllables [ba] at 4 and 9 dB.
Based on the described design, table 3 was created for the stimuli in which there is an increase in the intensity of one of the syllables from +0 dB to +9dB. This gradation has been included both for the initial and the final syllable (marked in small caps). In each case the intensity of one syllable (1st or 2nd) has been modified while the other maintains the original intensity. The first column of the table shows the number of correct responses or discriminations that were expected to be found in accordance with our own perception: the greater rate of incorrect responses is anticipated in the range from +1 to +4 dB, as above this range, the difference was acoustically clearer.

Intensity threshold: beyond pure tones 141
EFE, ISSN 1575-5533, XXVI, 2017, pp. 133-163
Expected discrimination BA-Ba Ba-BA Control phase: large percentage of correct responses +0 +0 +0 +0
Phase of great similarity: large percentage of “equal” responses
+1 +0 +0 +1 +2 +0 +0 +2
Phase of good discrimination: large degree of discrimination as the intensity increases
+3 +0 +0 +3 +4 +0 +0 +4 +5 +0 +0 +5 +6 +0 +0 +6
Phase of very good discrimination: discrimination values approaching 100%
+7 +0 +0 +7 +8 +0 +0 +8 +9 +0 +0 +9
Table 3. Gradation of stimuli and anticipated discrimination. The limit of the gradation of stimuli has been established at +9 dB since in previous studies (see Dorta, 2013), there is evidence that the largest differences between the tonic syllable and the adjacent syllables was found around this level (see table 4). Tonic-pre-tonic in the NP
Declaratives Interrogatives Ca Cc Me Bo Ca Cc Me Bo
Oxytones 4 -2 4 -2 4 1 5 -2 Paroxytones 4 -2 -3 -3 4 -9 -6 -4 Proparoxytones 1 -1 8 0 0 -2 8 -3
Table 4. Differences in intensity in dB between the tonic and the pre-tonic syllables in the SN in the Canary Islands and regions of Venezuela (Ca = Canary, Cc = Caracas, Me = Mérida, Bo = Bolívar) (adapted from Dorta, 2013:239).
The judges were asked the question “Are the two syllables [ba-ba] equal in intensity?” and they were requested to select one of the two options presented: “the same” or “different”. Each listener heard a set of 60 stimuli, given that the complete block of 20 stimuli (2 control + 18 with the 9 gradations –from +1 to +9– for each modified syllable) was repeated 3 times to ensure increased reliability. Finally, it is noted that the presentation of stimuli was random and different for each judge; each stimulus, due to its briefness, could be reheard up to four times.

142 J. Dorta, J. A. Martín, C. Jorge
EFE, ISSN 1575-5533, XXVI, 2017, pp. 133-163
This audition was always carried out using computers and with Sennheiser HD 407 headphones. 3.2. Program used The TP program (Rodrigues dos Santos et al., 2013) was used to design and carry out the perception test in a simple interface. The program automatically saves the responses of the judges in an Excel sheet, specifying the date and time of the response, duration of the test and percentage of correct responses, among other data. 3.3. Participants: group of judges or auditors There were 74 judges taking part in the perception experiment (49 women and 25 men), with ages ranging between 21 and 60. They were all Spanish speakers. The most heterogeneous possible group of judges was sought out (including judges of both genders and of different ages and socio-economic characteristics) in order to better represent the population. 4. RESULTS In sections 4.1 and 4.2, we present the results, taking into consideration three variables: the production of the stimuli (male or female voice), the gender of the judges (men and women) and the syllable modified (1st or 2nd) –the 1st shall be the second to last (Ba-Ba) and the 2nd is the last (Ba-Ba)–. In section 4.3 we collectively analyze the results from the judges. Finally, in section 4.4 we present some final considerations based on the results that were obtained. Thanks to an explanation given prior to test completion and the judges’ possibility to re-listen to the stimuli, there was a great time coherence found in the subjects, as there were not more errors at the start of the test than in the middle or at the end; to the contrary, the errors were distributed quite equally throughout the entire test. Taking this into account, the possibility of the judges erring more in the early stimuli has been discarded (which would mean removing this data). Taking into account that we attempt to obtain a reliable intensity threshold, we have considered two areas of discrimination according to the percentage of correct

Intensity threshold: beyond pure tones 143
EFE, ISSN 1575-5533, XXVI, 2017, pp. 133-163
responses for each stimuli. The percentages of correct responses are shown in the number with a decimal over each column. The columns represent each of the created stimuli. Under each column, in two rows, there is the identification of the discriminated voice (H= male) and the pair of stimuli that are heard by the listener: when the modified stimulus is the second syllable, in the first row, the following appears: Ba+0 (first syllable not modified) and in the second row, the modified syllable appears (v. gr. Ba+5 indicates that 5 dB has been added to the original syllable). If, on the other hand, the first syllable is modified, the order of the rows is the opposite.
The first area, of poor discrimination, extends to 50% of the correct answers given by the judges; the second, of good discrimination, is situated from 50% upwards. This is the point at which correct guesses become more frequent than errors as well as the steepest point, which Pamies Bertrán y Fernández Planas (2006) considers to be key in order to find the perceptive threshold for duration. Furthermore, results show that a more pronounced modification of intensity is related to a higher percentage of correct guesses; and in the majority of cases, discrimination keeps getting better up to +9 dB. In the graphs that we have created to illustrate our results, these areas are shown in the color of the columns, getting darker as they advance from the worse to better discrimination area. The first bar that appears at the start of each graph represents the percentage of correct responses for the control stimuli (with no modification).
4.1. Discrimination of the male voice
4.1.1. Results in women
The percentage of correct responses in the control stimuli (+0+0) is very high (83.3%), corroborating that the two syllables presented are considered equal for the most part and avoiding any random responses made by the judges, that is, any false errors (see figures 2 and 3; the percentage of control stimuli is the same in the two figures –83.3%– given that no syllable was modified HBa+0).

144 J. Dorta, J. A. Martín, C. Jorge
EFE, ISSN 1575-5533, XXVI, 2017, pp. 133-163
Figure 2. Percentage of correct responses by women discriminating the male voice.
Figure 3. Percentage of correct responses by women discriminating the male voice.

Intensity threshold: beyond pure tones 145
EFE, ISSN 1575-5533, XXVI, 2017, pp. 133-163
If we are to consider the modified stimuli, the graphs reveal a clear increasing pattern for the percentage of correct answers as decibels are added, although towards the end the increase slows (figure 2) and even stabilizes (figure 3). It is seen that the discrimination is low up until 3 decibels and improves significantly in the stimuli that adds 4 dB (61.2% correct responses in both graphs). Also up to 6 dB, the correct responses revealed a slight increase, in the stimuli that add +7dB, it greatly exceeds 80% of the correct responses (87.8% and 86.4% in each graph, respectively). Finally, the stimuli that add 8 and 9 dB do not substantially improve the discrimination of the syllables, with the ceiling remaining at 91.8% when increasing the intensity of the second syllable and at 87.8% in the first.
In table 5, we reveal the percentages of correct responses by discrimination area. It is found that in the perception of women, the modification of either the 1st or 2nd syllable is not overly important when attempting to discriminate male voice according to their intensity. The mean percentage of the good discrimination area, in this case, between 4 and 6 dB, exceeds 65% of the correct responses in the two cases (66% and 67.4%), suggesting that the judges in this range can perceive a change in intensity.
Increase in intensity 2nd syllable 1st syllable
Area of poor discrimination 29.3% 28.6%
Area of good discrimination 77,8% 77.4%
Total of correct responses 61.6% 61.1%
Table 5. Percentages of correct responses in each area of discrimination (women discriminating male voice).
The total of correct responses in the two cases is practically the same and reaches the area of good discrimination as of 60%.
4.1.2. Results in men Like the women, the men offered correct responses in over 80% of the cases for the control stimuli (+0) with the male voice (first bar in figures 4 and 5). However, the percentage of correct responses increased considerably more quickly in the men than in the women (see figures 2 and 3). On the other hand, like the women, the men had a low percentage of correct responses up to 3 dB and in the +4dB stimuli, it exceeded 60% of the correct responses. In the column corresponding to +5dB it was seen that the percentage of correct responses of the men is very high, regardless of which syllable is modified, whereas the women did not exceed 80% correct responses until +7dB.

146 J. Dorta, J. A. Martín, C. Jorge
EFE, ISSN 1575-5533, XXVI, 2017, pp. 133-163
Figure 4. Percentage of correct responses in men discriminating the male voice.
Figure 5. Percentage of correct responses in men discriminating the male voice.

Intensity threshold: beyond pure tones 147
EFE, ISSN 1575-5533, XXVI, 2017, pp. 133-163
In figure 4, the gradation in the percentage of correct responses is not completely ascending in the good discrimination phase, with it being found that the increase of 7 dB is somewhat less than that of 6 dB, or at 9 dB as compared to 8 dB. However, this is to be expected if we consider that in this range, the intensity differences between the syllables are quite clear therefore the correct identification of the stimuli is very good regardless. When considering the percentage of overall correct responses, it is found (see table 6) that the men discriminated approximately 5% better than women (see table 5).
Increase in intensity 2nd syllable 1st syllable
Area of poor discrimination 32.9% 28.4%
Area of good discrimination 80,5% 76.2%
Total of correct responses 66.5% 66.2%
Table 6. Percentages of correct responses in each area of discrimination (men discriminating the male voice).
On the other hand, although the percentages of correct responses in the areas of poor and good discrimination are greater when the intensity of the 2nd syllable increases, both syllables have a virtually identical percentage of total correct responses (66.5% and 66.2%). 4.1.3. Statistical analysis Given that the end goal of this study is to establish an intensity-related perceptive threshold, we have undertaken a statistical analysis of available data, which relativizes the number of errors. Results from those analyses are shown in figures 6-9, which show the point where correct answers start becoming more frequent than wrong answers, which also coincides with the steepest slope. Following Pamies Bertrán and Fernández Planas (2006), who pursue a similar objective although focused on duration, we have applied linear interpolation in order to obtain the exact point at which the threshold is located according to our judges: D= xi+[(x2-x1 / y2-y1) · (y3-y1)] 2
2 In this formula, the value of y3 corresponds to the crossing between error and success rate.

148 J. Dorta, J. A. Martín, C. Jorge
EFE, ISSN 1575-5533, XXVI, 2017, pp. 133-163
Figures 6-9. Percentage of correct and incorrect responses according to the syllable and the intensity (modified in dB).
Table 7 is obtained from the above-mentioned formula, which shows the amount of dB judges need in order to differentiate sufficiently between one syllable and the other; this point is located at the 50% where the number of correct and incorrect responses becomes equal. There are slight differences depending on the gender of judges and the order of the modified syllable; however, these results may be averaged out to obtain a value that indicates the amount of dB needed to differentiate two syllables according to their intensity.
Women-male voice
2nd syl.
Women-male voice 1st syl.
Men-male voice 2nd syl.
Men-male voice 1st syl.
3.42 3.54 3.06 3.32
Table 7. Required intensity increase (in dB) for correct responses surpassing incorrect responses.

Intensity threshold: beyond pure tones 149
EFE, ISSN 1575-5533, XXVI, 2017, pp. 133-163
4.2. Discrimination of the female voice 4.2.1. Results in women
In this section, we look at how the female judges discriminated the female voice stimuli. The percentage of correct responses of the like stimuli (+0), represented by the first bar, was once again over 80% as in the previous case and it was slightly greater than the percentage obtained in the male voice discrimination by the same women (86.1% vs. 83.3%). On the other hand, in this case, the modified syllable (1st or 2nd) does affect the percentage of correct discrimination: when changing the intensity of the second syllable (see figure 10) discrimination was much better than when the first syllable was modified (see figure 11). Figure 10 shows that there was a considerable percentage of correct responses as of the stimuli adding 3 dB (63.3%), meaning that the area of good discrimination proceeds from this point onward. Furthermore, as of +5dB, the percentage of correct responses begins to surpass 80%, whereas for the male voice (figure 2) this percentage was not surpassed until reaching the stimuli with +7dB.
Figure 10. Percentage of correct responses of women discriminating the female voice.
150 J. Dorta, J. A. Martín, C. Jorge
EFE, ISSN 1575-5533, XXVI, 2017, pp. 133-163
Figure 11. Percentage of correct responses of women discriminating the female voice.
To the contrary, the percentages of correct responses when increasing the intensity of the first syllable (see figure 11) are very low in the first stimuli and the correct responses almost reach 50% adding +4dB. This suggests that in order to achieve a good percentage of correct responses, the women need one additional decibel when discriminating the female voice (as compared to the male voice) and two decibels more when the modification is made on the second syllable (as compared to the first syllable; see figure 10). Figure 10 also reveals that the percentage of correct responses remains very high as of +7dB, whereas figure 11 shows a rapid increase from slightly over 70% (+6dB) to 91.2% in the final stimuli (+9dB).
Increase in intensity 2nd syllable 1st syllable
Area of poor discrimination 36.1% 27.4%
Area of good discrimination 79.2% 76.3%
Total of correct responses 73.2% 55.6%
Table 8. Percentages of correct responses in each area of discrimination (women discriminating the female voice).
Taking into account that the percentages of total correct responses by areas (see table 8) suggests that the increase in intensity in the second syllable specifically

Intensity threshold: beyond pure tones 151
EFE, ISSN 1575-5533, XXVI, 2017, pp. 133-163
affects the area of poor discrimination, the percentage of correct responses is somewhat higher (36.1%) than when the first syllable is modified (27.4%). Meanwhile, it is most noteworthy that if we consider the total number of correct responses in both areas, the percentage resulting with the modification of the second syllable (73.2%)3 is considerably higher than with the modification of the first syllable (55.6%). 4.2.2. Results in men
The men behaved similarly to the women when discriminating the female voice. The percentage of correct responses of the stimuli +0 is practically the same in both genders and similar to that obtained in the discrimination of the male voice by men and women.
Figure 12. Percentage of correct responses in men discriminating the female voice.
On the other hand, the percentages of correct responses once again increase rapidly when modifying the second syllable (figure 12) as compared to the first (figure 13) for all of the stimuli.
3 This percentage was only slightly exceeded in the case of the men interpreting the stimuli of the female voice –73.6%– also in the second syllable.

152 J. Dorta, J. A. Martín, C. Jorge
EFE, ISSN 1575-5533, XXVI, 2017, pp. 133-163
Figure 13. Percentage of correct responses in men discriminating the female voice.
Therefore, it appears that the position in which the intensity increases plays a role in the perception of the same when the stimuli come from a female voice. On the other hand, the only case in which there was 100% correct responses in a stimuli is seen in figure 12, with the 3 repetitions of this stimuli in the 25 men, receiving no incorrect responses, suggesting that an intensity increase of 9 dB is quite relevant for human hearing.
Increase in intensity 2nd syllable 1st syllable
Area of poor discrimination 32.7% 29.3%
Area of good discrimination 79.9% 86.0%
Total of correct responses 73.6% 58.7%
Table 9. Percentages of correct responses in each area of discrimination (men discriminating the female voice).
If we consider the total percentages of correct discrimination (see table 9), the behavior is also similar to that which has been seen in the women (see table 8): it is also noteworthy that the percentage of correct responses in which the second

Intensity threshold: beyond pure tones 153
EFE, ISSN 1575-5533, XXVI, 2017, pp. 133-163
syllable was altered is much greater as compared to when the first syllable was changed. 4.2.3. Statistical analysis In the case of the female voice (table 10), there are larger differences than in the case of the male voice as regards the dB values needed to reach 50% of correct guesses (figures 14-17). For instance, women discriminating the female voice where the intensity of the second syllable is increased need a small intensity increase for correct responses being higher than incorrect responses; whereas when the first syllable is modified, the intensity increase required to achieve the same number of correct guesses is much higher. Still, it is possible to estimate an average value that represents the minimum perceptive threshold for the female voice, regardless of which syllable is being modified.
Figures 14-17. Percentage of correct and incorrect responses according to the syllable and the intensity (modified in dB).

154 J. Dorta, J. A. Martín, C. Jorge
EFE, ISSN 1575-5533, XXVI, 2017, pp. 133-163
Women-female voice
2nd syl.
Women-female voice 1st syl.
Men-female voice
2nd syl.
Men-female voice 1st syl.
2.28 4.06 2.47 3.88
Table 10. Required intensity increase (in dB) for correct responses surpassing incorrect responses.
4.3. Collective results of all of the judges
Having stated and compared the perceptive results of the men and women separately, we now present the results of the collective group of 74 judges, considering two variables: the voice used in the production of the stimuli (male and female) and the two modified syllables (1st and 2nd).
4.3.1. Discrimination of the male voice Figures 18 and 19 reveal that when the increase in intensity is of +4dB, there is an increase in the percentage of correct responses (roughly 20%) which separates the areas of poor and good discrimination, with the latter beginning at over 50% correct responses. If we increase by only 1 dB, that is, +5dB, the index of correct responses exceeds 70% in both the first and second syllable.
Figure 18. Percentage of correct responses in the set of auditors discriminating the male voice.

Intensity threshold: beyond pure tones 155
EFE, ISSN 1575-5533, XXVI, 2017, pp. 133-163
Figure 19. Percentage of correct responses in the set of auditors discriminating the male voice.
Table 11 includes the percentages of correct responses by area of discrimination and the average for both areas. It may be seen that the modified syllable does not seem to affect the percentage of correct responses in any discrimination area considered, or in any of the correct responses.
Increase in intensity 2nd syllable 1st syllable
Area of poor discrimination 30.5% 28.5%
Area of good discrimination 79.7% 76.5%
Total of correct responses 63.3% 62.8%
Table 11. Percentages of correct responses in all of the judges discriminating the male voice.
4.3.2. Discrimination of the female voice The female voice seems to lead to greater differences than the male voice when it comes to the modification of intensity in the second syllable. Therefore, in figure 20 it is noted that the percentage of discrimination is considerable as of the stimuli +3dB, and even more so in that of +4dB.

156 J. Dorta, J. A. Martín, C. Jorge
EFE, ISSN 1575-5533, XXVI, 2017, pp. 133-163
Figure 20. Percentages of correct responses of the set of listeners discriminating the female voice.
Figure 21. Percentages of correct responses of the set of listeners discriminating the female voice.

Intensity threshold: beyond pure tones 157
EFE, ISSN 1575-5533, XXVI, 2017, pp. 133-163
On the other hand, when it is the first syllable that is modified (see figure 21), the correct response rate of 50% is surpassed with +4dB. There is a large increase in the percentage of correct responses as compared to +3dB (21.2%), where discrimination is poor. In table 12 it is shown that, unlike what occurred with the discrimination of the male voice (see table 9), there were considerable differences according to the syllable modified in the total number of correct responses given that the response obtained in the second syllable exceeded the first by 16.7%.
Increase in intensity 2nd syllable 1st syllable
Area of poor discrimination 34.9% 28.0%
Area of good discrimination 68.0% 69.4%
Total of correct responses 73.3% 56.6%
Table 12. Percentages of correct responses in all of the judges discriminating the female voice.
This difference occurs in men and women when interpreting the female voice. This may be due to the difference in the fundamental tone of the stimuli, given that the original syllable produced by the male had 113 Hz on average whereas that of the women reached 190 Hz, that is, a difference of 9 St. Given that this tonal difference is maintained in the syllables that are modified only in intensity, we may conclude that this leads to differences in perception of the stimuli. So, according to the test results, the female voice is distinguished better than the male voice, but only when using stimuli in which the increase in intensity is made on the last syllable. 4.3.3. Statistical analysis Figures 22-23 show the average result from all responses by judges for both voices combined; therefore only differences due to modifying the syllable may be seen. It may be considered that the mean of discrimination for the first syllable is representative enough of the increase in the number of dB a listener needs to distinguish between two syllables that are similar with respect to the rest of characteristics.

158 J. Dorta, J. A. Martín, C. Jorge
EFE, ISSN 1575-5533, XXVI, 2017, pp. 133-163
Figures 22-23. Percentage of correct and incorrect responses according to the syllable and the intensity (modified in dB).
Discrimination 2nd syl. Discrimination 1st syl.
2.69 3.68
Table 13. Required intensity increase (in dB) for correct responses surpassing incorrect responses in the considered combinations of judges and voices.
5. FINAL CONSIDERATIONS REGARDING THE RESULTS In this section we shall compare some of the data of interest in order to reach some relevant conclusions. Table 14 includes the percentages of overall correct responses that we saw in tables 5, 6, 8, 9, 11 and 12. It is seen that the male listeners gave correct responses somewhat more often than the female listeners (a mean of 3.5%), especially when the discriminated voice was from a male. Female voice Male voice
Mean Syllable 2 Syllable 1 Syllable 2 Syllable 1
Women 73.2 55.6 61.6 61.1 62.8%
Men 73.6 58.7 66.5 66.2 66.3%
Table 14. Total percentages of discrimination according to gender. On the other hand, in order to be able to decide on the differential intensity threshold (in dB), we have considered the following:
Intensity threshold: beyond pure tones 159
EFE, ISSN 1575-5533, XXVI, 2017, pp. 133-163
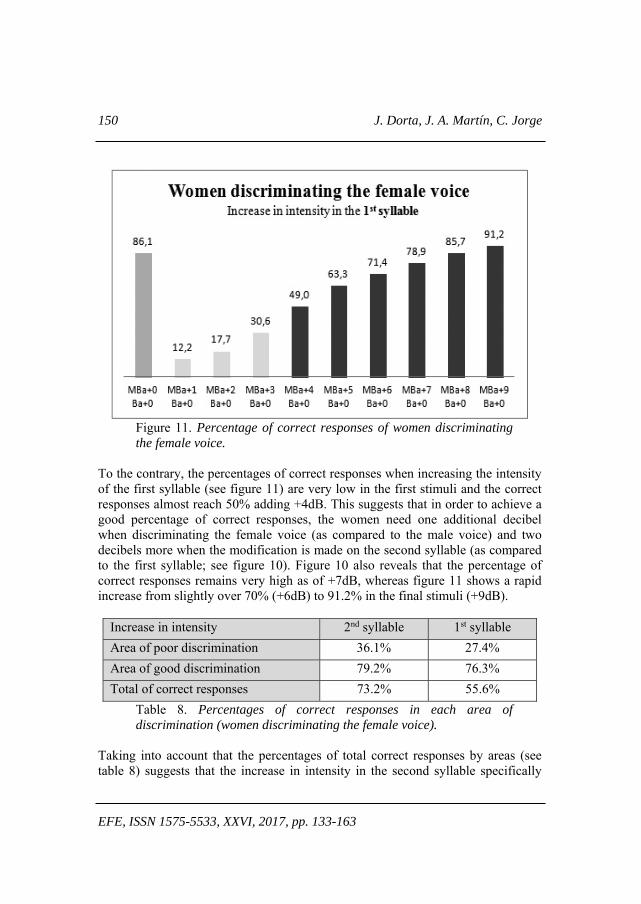
1st) In previous studies (Dorta, 2013) a threshold of 3 dB was used. Therefore, it appears convenient to consider this information as a starting point. 2nd) It has been seen that when approaching +9dB, the percentage of correct responses is even greater, but not much more than 90% in most cases and only in one case (figure 12) was 100% correct responses attained. 3rd) The fact that the judges are capable of discriminating intensity, a parameter which, on its own, has no linguistic relevance in the Spanish language, is to be valued. In stress, intensity is accompanied by duration and F0 therefore it is clearly difficult for the judges to focus solely on this difference. 4th) Finally, this perception study allows us to verify whether or not the results of good discrimination (from 50% of the correct responses) appear in the majority of the cases at +4dB4, and to a lesser degree, at +3dB and +5dB. Based on the previous, and especially, the fourth, we have found an average percentage of correct responses in all contexts in which the stimuli were differentiated by 3, 4 and 5 dB. The results may be seen in table 15.
+3dB +4dB +5dB HBa+0 Ba+3 49.3% HBa+0 Ba+4 65.3% HBa+0 Ba+5 78.7% HBa+3 Ba+0 44.0% HBa+4 Ba+0 62.7% HBa+5 Ba+0 80.0% MBa+0 Ba+3 60.0% MBa+0 Ba+4 74.7% MBa+0 Ba+5 85.3% MBa+3 Ba+0 29.3% MBa+4 Ba+0 53.3% MBa+5 Ba+0 66.7% HBa+0 Ba+3 44.6% HBa+0 Ba+4 62.6% HBa+0 Ba+5 68.9% HBa+3 Ba+0 39.6% HBa+4 Ba+0 61.7% HBa+5 Ba+0 69.8% MBa+0 Ba+3 62.2% MBa+0 Ba+4 73.9% MBa+0 Ba+5 82.9% MBa+3 Ba+0 30.2% MBa+4 Ba+0 50.5% MBa+5 Ba+0 64.4% Mean 44.9% Mean 63.1% Mean 74.6%
Table 15. Total percentages of correct discrimination of the differences of 3, 4 and 5 dB in all contexts.
The results of the previous table indicate that only with 4 dB is the area of good discrimination reached (over 50%) and with 5 dB, there is discrimination of 75% as seen in figure 24.
4 In Figures 4 and 11, there are 49% of correct answers at +4dB. We consider that this value reaches the threshold.

160 J. Dorta, J. A. Martín, C. Jorge
EFE, ISSN 1575-5533, XXVI, 2017, pp. 133-163
Figure 24. Percentage of discrimination between +3 and +5dB.
6. DISCUSSION
The study conducted with a satisfactory number of judges (74 in all) allows us to reach reliable conclusions and, above all, to establish a differential intensity threshold, the main goal of our research. When considering the variable gender, it has been seen that men and women discriminate almost identically, given that the mean difference in the perception of intensity is only 3.5% better in men. As for the syllable variable, the modification of the intensity in the next to last or last syllable as presented in the test did not appear to affect the discrimination of men and women when a male voice was being discriminated. However, when the voice was female, both genders discriminated considerably better, but only if the last syllable was the one that was modified. It was verified that intensity, unlike F0 (Rietveld & Gussenhoven, 1985; Pamies et al., 2002; Toledo, 2000b; Fernández Planas & Martínez Celdrán, 2003; Roseano & Fernández Planas, 2013; Dorta, 2013), having no linguistic value on its own in the Spanish language, provides an added difficulty for the judges; thus, even with differences of 9 dB, only in one single case were 100% correct responses achieved. Our initial hypothesis that the perceptive results allow for the establishment of a threshold ranging between 3 and 5 dB was affirmed. However, if we consider the percentages of correct responses seen in table 15, it may be concluded that a difference of 3 dB (Dorta, 2013) was insufficient to establish a differential threshold, located at 50%.

Intensity threshold: beyond pure tones 161
EFE, ISSN 1575-5533, XXVI, 2017, pp. 133-163
7. CONCLUSION Discrimination at +4dB exceeded the minimum expected percentage (63.1%, table 15) placing it in the area that we considered to be good discrimination. This percentage is quite high, considering the difficulties that the judges had in focusing on the differences in intensity and given that the discrimination ceiling is 93.8% in +9dB (the mean for discrimination of the 74 judges in the +9dB segment is made in any context). The stimuli at this distance may be always heard clearly and yet the judges continued to give incorrect responses at times, suggesting that the discrimination of intensity without the support of other parameters is a complicated task in the Spanish language. According to the statistical analyses of global data (section 4.3.3), the perceptive threshold, if we consider 50% of correct guesses to be the point where good discrimination5 begins, would be situated between 2.71 and 3.68 dB, depending on the modified syllable. Bearing these results in mind, we consider that a threshold of 4 dB ensures a correct discrimination by average listeners. ACKNOWLEDGEMENTS: The authors wish to acknowledge the collaboration of the subjects who participated as judges in the perception test. This study was carried out in the Phonetics Laboratory of the Universidad de La Laguna (Canary Islands, Spain) under the framework of the project Comparative study of intonation and accent in Spanish border areas (FFI2014-52716-P), and I+D project of the Government Program on the Promotion of Scientific and Technical Research of Excellence of the Spanish Ministry of Economics and Competitiveness (2015-2017, convened in 2014). 8. REFERENCES AMERICAN SPEECH, LANGUAGE AND HEARING ASSOCIATION (1988): Determining
Threshold Level for Speech [Guidelines]. www.asha.org/policy [11/2/2016]. DORTA, J. & B. HERNÁNDEZ (2005): «Análisis prosódico de un corpus de habla
experimental: interrogativas absolutas con expansión en el objeto vs. sin expansión», Estudios de Fonética Experimental, XIV, pp. 67-123.
5 As mentioned earlier, this work aims at finding the minimum perceptive threshold.

162 J. Dorta, J. A. Martín, C. Jorge
EFE, ISSN 1575-5533, XXVI, 2017, pp. 133-163
DORTA, J. (ed.) (2013): Estudio comparativo preliminar de la entonación de Canarias, Cuba y Venezuela, Madrid / Santa Cruz de Tenerife, La Página Ediciones.
FERNÁNDEZ PLANAS, A. M. & E. MARTÍNEZ CELDRÁN (2003): «El tono
fundamental y la duración: dos aspectos de la taxonomía prosódica en dos modalidades de habla (enunciativa e interrogativa) del español», Estudios de Fonética Experimental, XII, pp. 165-200.
JOHNSON, K. (2003): Acoustic and Auditory Phonetics, Cambridge, Blackwell
Publishing. MARRERO, V. (2008): «La fonética perceptiva: trascendencia lingüística de
mecanismos neuropsicofisiológicos», Estudios de Fonética Experimental, XVII, pp. 207-245.
MARRERO, V. (2013): «Metodología de investigación en fonética perceptiva:
posibles aportaciones para el estudio de la prosodia dialectal», Simposio Metodoloxía para o estudo perceptivo da variación prosódica dialectal, Universidad de Santiago de Compostela, Santiago de Compostela.
PAMIES, A.; A. M. FERNÁNDEZ PLANAS, E. MARTÍNEZ CELDRÁN, A. ORTEGA
ESCANDELL & M. C. AMORÓS CÉSPEDES (2002): «Umbrales tonales en español peninsular», in J. Díaz García (ed.): Actas del II Congreso Nacional de Fonética Experimental , Sevilla, Universidad de Sevilla, pp. 272-278.
PAMIES BERTRÁN, A. & A. M. FERNÁNDEZ PLANAS (2006): «La percepción de la
duración vocálica en español», in J. Luque Durán (ed.): Actas del V Congreso Andaluz de Lingüística General. Homenaje al Profesor José Andrés de Molina Redondo, Granada, Método, pp. 501-512.
RAPHAEL, L. J.; G. J. BORDEN & K. S. HARRIS (2007): Speech Science Primer:
Physiology, Acoustics, and Perception of Speech, Baltimore- Philadelphia, Lippincott Williams & Wilkins.
RIETVELD, T. & C. GUSSENHOVEN (1985): «On the relation between pitch
excursion size and prominence», Journal of Phonetics, 13, pp. 299-308. RODRIGUES DOS SANTOS, G.; A. SCHURT RAUBER, A. RATO, D. C. KLUGE & M.
GUILHERME DE FIGUEIREDO (2013): «TP (v. 3.1): Una herramienta para

Intensity threshold: beyond pure tones 163
EFE, ISSN 1575-5533, XXVI, 2017, pp. 133-163
experimentos de percepción», Estudios de Fonética Experimental, XXII, pp. 335-366.
ROSEANO, P. & A. M. FERNÁNDEZ PLANAS (2013): «Transcripció fonètica i
fonológica de l’entonació: una proposta d’etiquetatge automàtic», Estudios de Fonética Experimental, XXII, pp. 275-332.
STEVENS, K. N. (2000): Acoustic Phonetics, Cambrigde, MIT Press. TOLEDO, G. A. (1988): El Ritmo en el Español. Estudio Fonético con Base
Computacional, Madrid, Gredos. TOLEDO, G. A. (2000a): «Acentos en español: habla espontánea», Estudios
Filológicos, 35, pp. 125-137. TOLEDO, G. A. (2000b): «Taxonomía tonal en español», Language Design:
Journal of Theoretical and Experimental Linguistics, 3, pp. 1-20.