Embed Size (px)
Citation preview
Interim presentationSecond quarter 2018
Sverre Hurum, CEOErik Stubø, CFO24 August 2018
Highlights in the quarter
o Revenue and EBIT• Operating revenues increased by 17.6 percent
to NOK 453.7 million (y‐o‐y)• EBIT increased by 51.5 percent to NOK 55.7
million (y‐o‐y)
o 1 304 employees• Up 44 from Q1’18• An increase of 138 in the past 12 months
o Strong market
Revenue and number of employees
0
200
400
600
800
1000
1200
1400
Q2'13 Q2'14 Q2'15 Q2'16 Q2'17 Q2'18
MNOK and number
050100150200250300350400450500
Q2'13 Q2'14 Q2'15 Q2'16 Q2'17 Q2'18
2

Operational Review
3
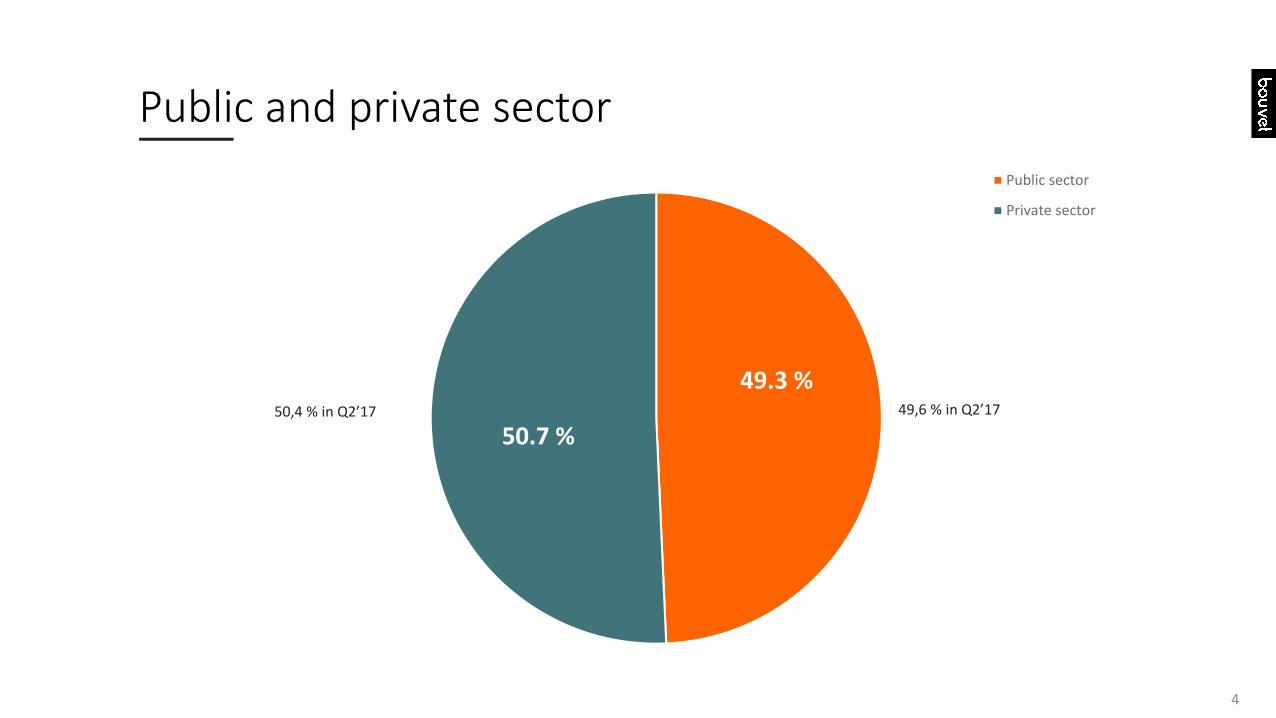
Public and private sector
4
49.3 %
50.7 %
Public sector
Private sector
49,6 % in Q2’1750,4 % in Q2’17

4.0 %
10.0 %
2.7 %
4.3 %
5.6 %
26.2 %
25.1 %
5.4 %
8.2 %
6.1 %2.4 % Power supply
Health
Industry
Info and communication
Public admin
Oil & gas
Service industry
Transportation
Retail
Business sectors Q2 2018Bank & financeOther
5
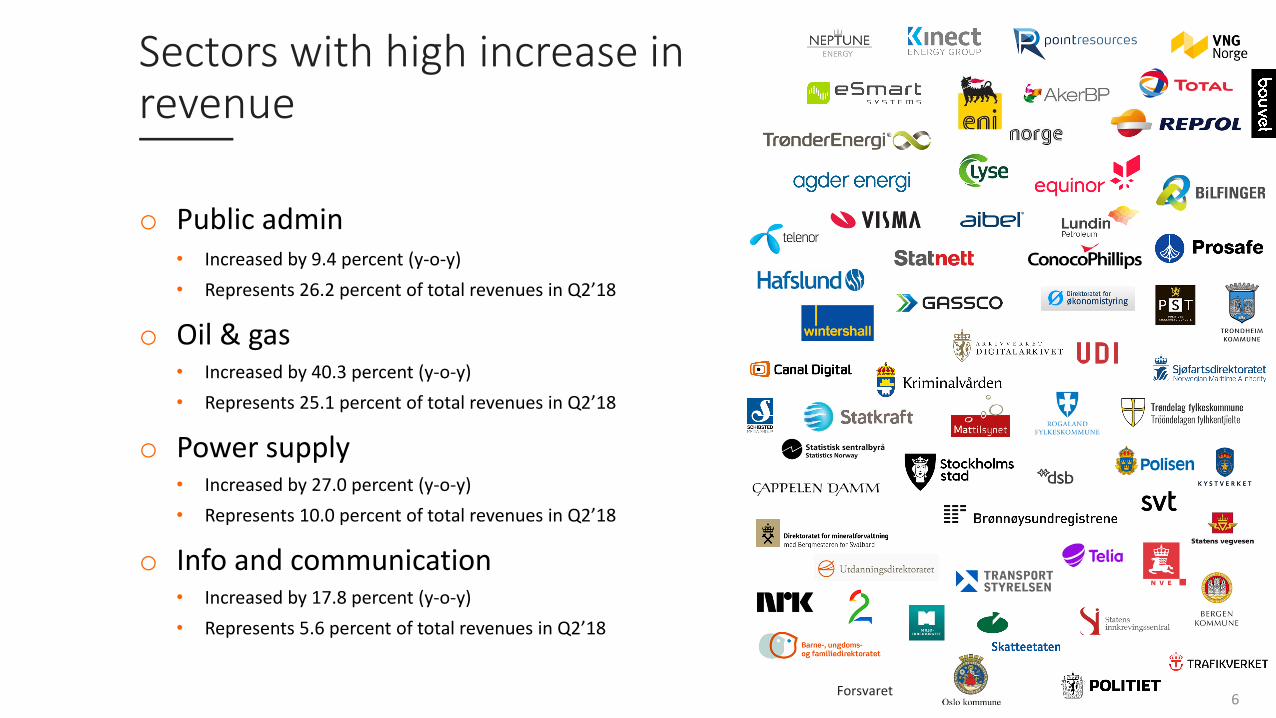
o Public admin• Increased by 9.4 percent (y‐o‐y)• Represents 26.2 percent of total revenues in Q2’18
o Oil & gas• Increased by 40.3 percent (y‐o‐y)• Represents 25.1 percent of total revenues in Q2’18
o Power supply• Increased by 27.0 percent (y‐o‐y)• Represents 10.0 percent of total revenues in Q2’18
o Info and communication• Increased by 17.8 percent (y‐o‐y)• Represents 5.6 percent of total revenues in Q2’18
Sectors with high increase in revenue
6Forsvaret

HoloLens app developed for eSmart Systems
7
o Connected drone mission analysis PoC• Part of eSmart’s Connected Drone Program• Rich data visualisation of AI findings• Workflow for resolving issues and creating
work orders
o Fully developed in‐house by Bouvet’sHoloLens team
8
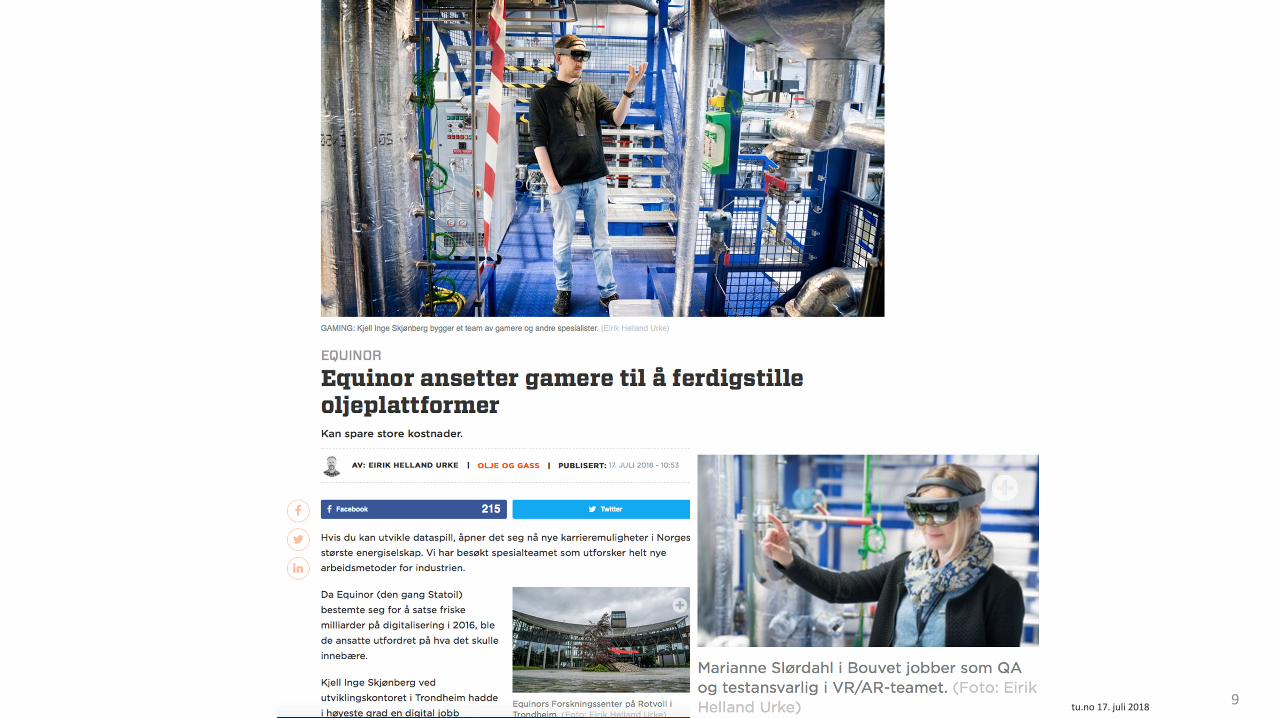
9tu.no 17. juli 2018
Customer and project mix
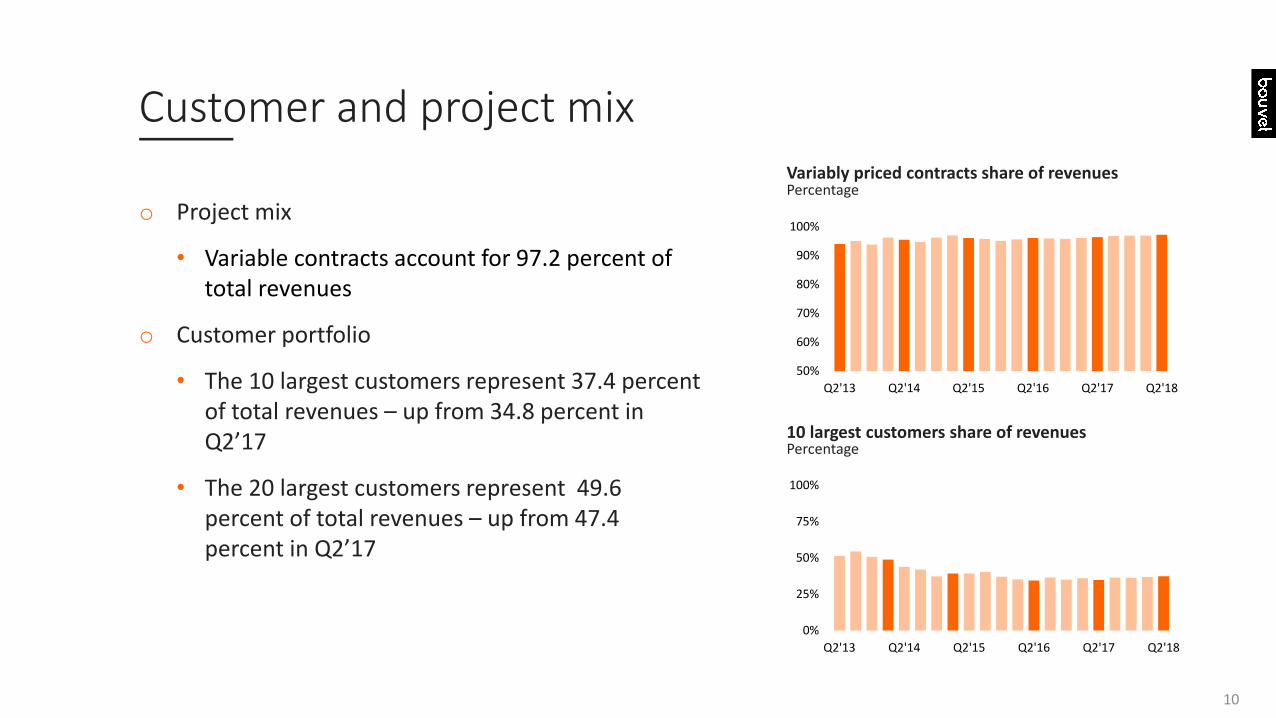
o Project mix
• Variable contracts account for 97.2 percent of total revenues
o Customer portfolio
• The 10 largest customers represent 37.4 percent of total revenues – up from 34.8 percent in Q2’17
• The 20 largest customers represent 49.6 percent of total revenues – up from 47.4 percent in Q2’17
50%
60%
70%
80%
90%
100%
Q2'13 Q2'14 Q2'15 Q2'16 Q2'17 Q2'18
Variably priced contracts share of revenues
10 largest customers share of revenues
0%
25%
50%
75%
100%
Q2'13 Q2'14 Q2'15 Q2'16 Q2'17 Q2'18
10
Percentage
Percentage
Customer development
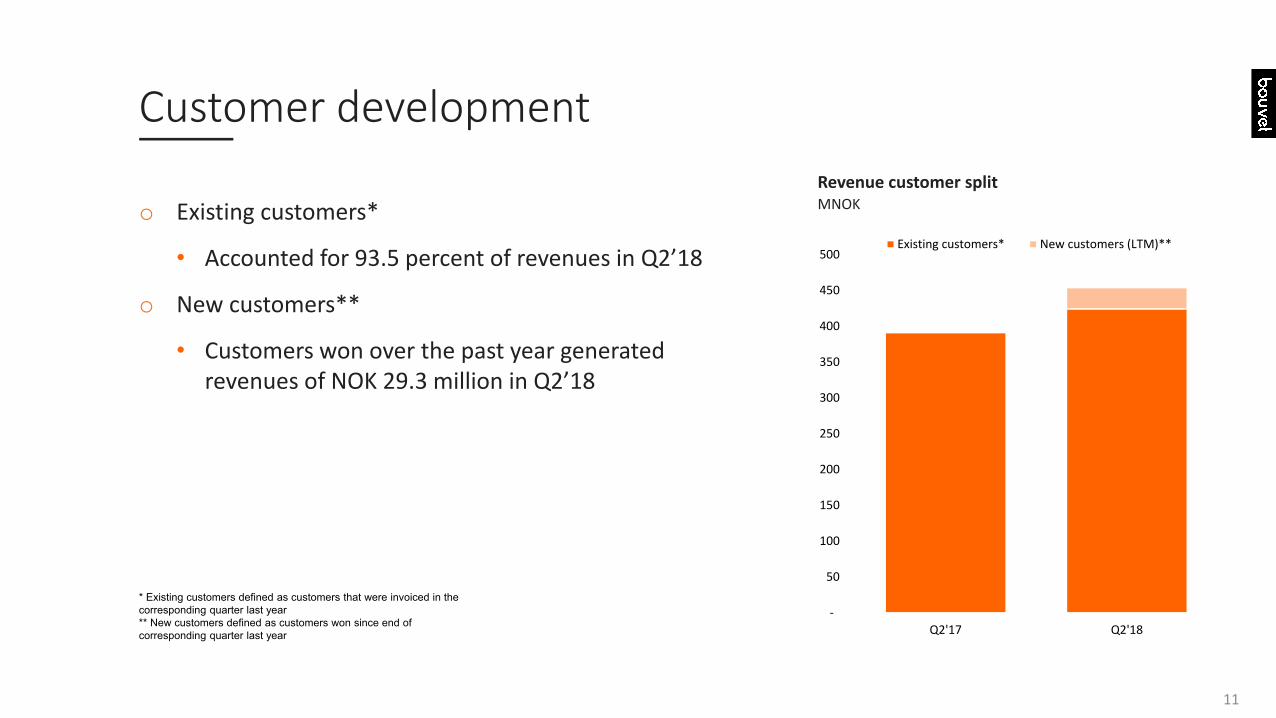
o Existing customers*
• Accounted for 93.5 percent of revenues in Q2’18
o New customers**
• Customers won over the past year generated revenues of NOK 29.3 million in Q2’18
Revenue customer split
‐
50
100
150
200
250
300
350
400
450
500
Q2'17 Q2'18
Existing customers* New customers (LTM)**
* Existing customers defined as customers that were invoiced in the corresponding quarter last year** New customers defined as customers won since end of corresponding quarter last year
11
MNOK

Regional organisation
Trondheim
Bergen
Haugesund
KristiansandArendal
Skien
Sandefjord
OsloSandvikaØrebro Stockholm
110ansatte
Bouvet Nord
502ansatte
Bouvet Øst
30ansatte
Sesam
76ansatte
Bouvet Sverige
64ansatte
Bouvet Sør
422ansatte
Bouvet Rogaland
78ansatte
Bouvet Bergen
22ansatte
Konsernstab
Borlänge
Stavanger
Enthusiastic and competent employees
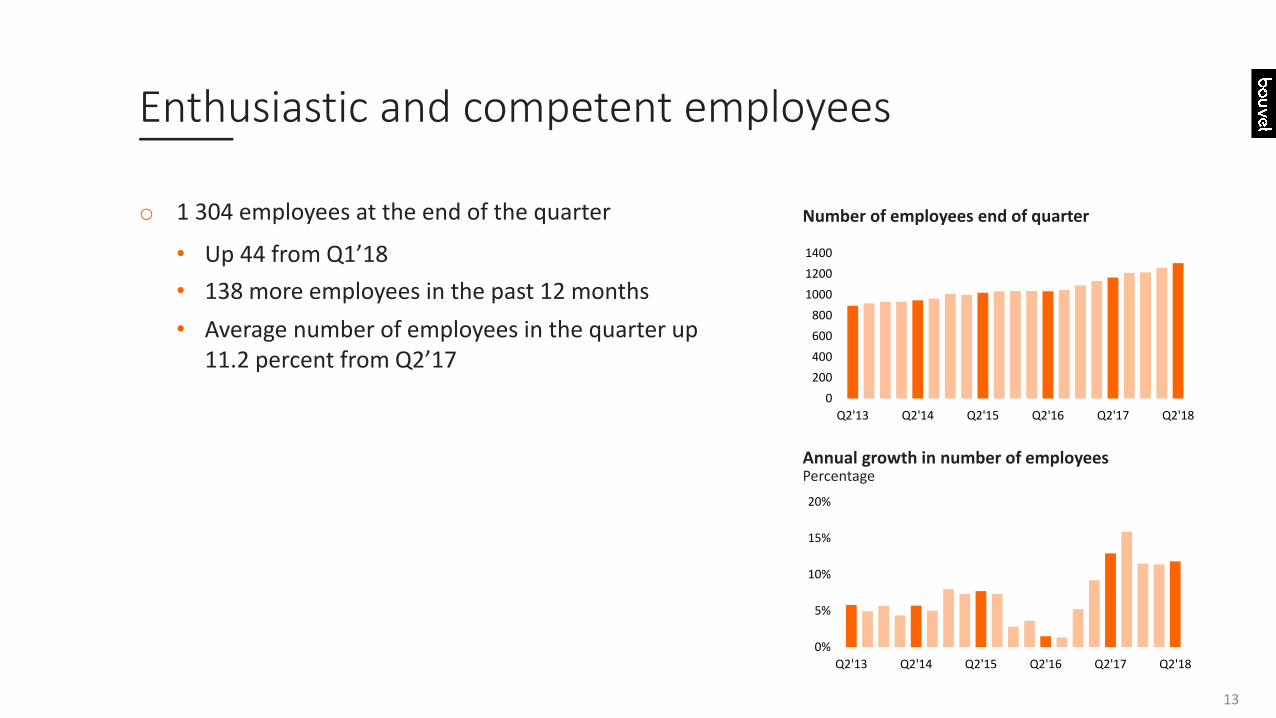
o 1 304 employees at the end of the quarter
• Up 44 from Q1’18• 138 more employees in the past 12 months• Average number of employees in the quarter up
11.2 percent from Q2’17
Number of employees end of quarter
Annual growth in number of employees
0200400600800
1000
12001400
Q2'13 Q2'14 Q2'15 Q2'16 Q2'17 Q2'18
0%
5%
10%
15%
20%
Q2'13 Q2'14 Q2'15 Q2'16 Q2'17 Q2'18
13
Percentage
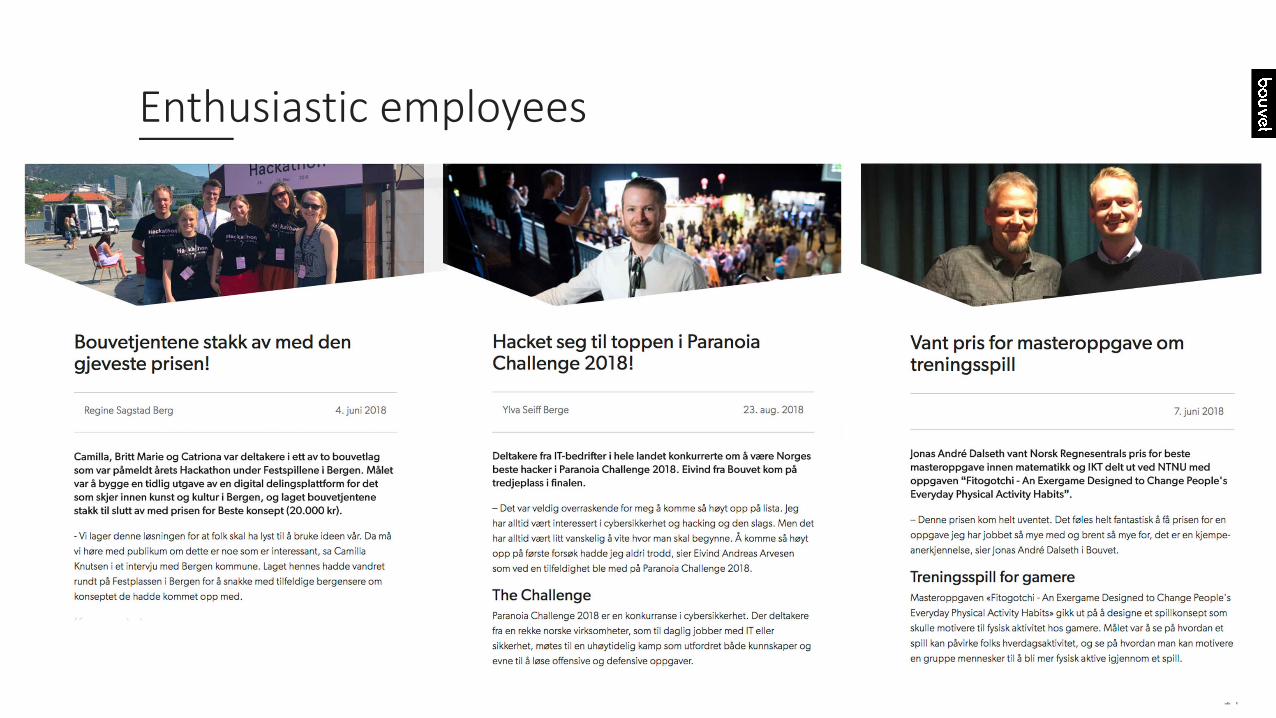
Enthusiastic employees
14

Financial Review
15
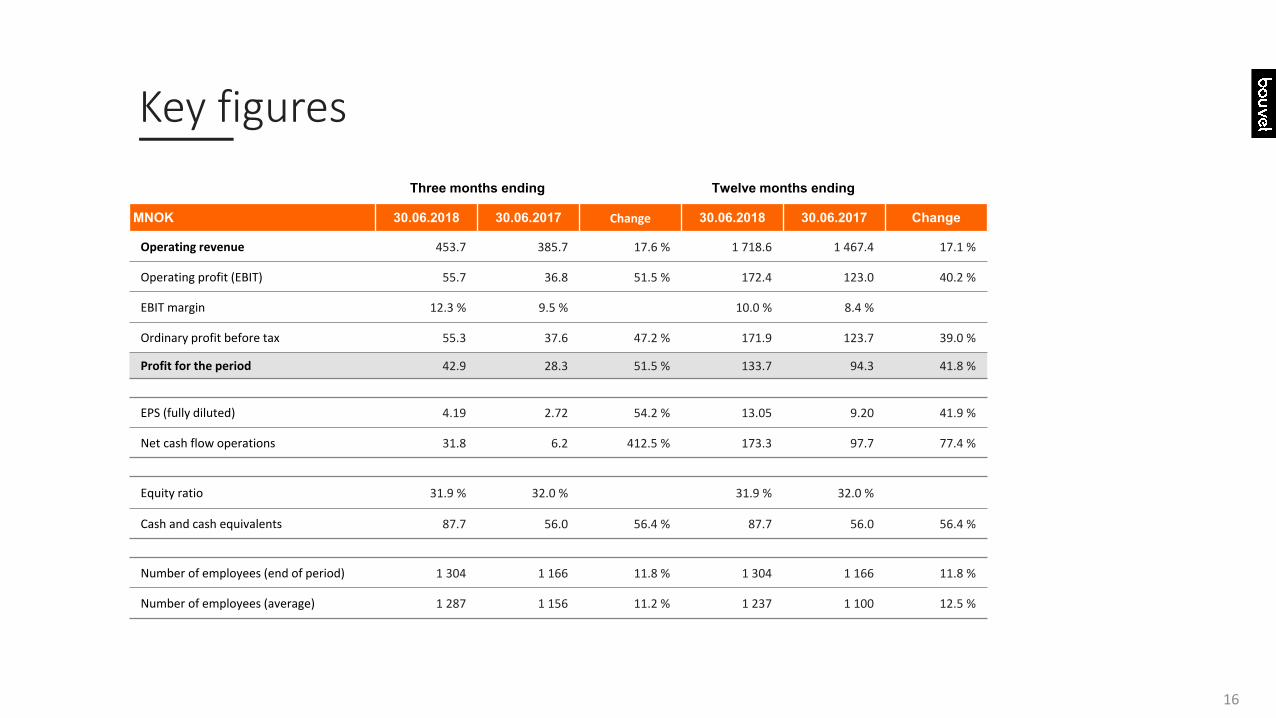
Key figuresThree months ending Twelve months ending
MNOK 30.06.2018 30.06.2017 Change 30.06.2018 30.06.2017 Change
Operating revenue 453.7 385.7 17.6 % 1 718.6 1 467.4 17.1 %
Operating profit (EBIT) 55.7 36.8 51.5 % 172.4 123.0 40.2 %
EBIT margin 12.3 % 9.5 % 10.0 % 8.4 %
Ordinary profit before tax 55.3 37.6 47.2 % 171.9 123.7 39.0 %
Profit for the period 42.9 28.3 51.5 % 133.7 94.3 41.8 %
EPS (fully diluted) 4.19 2.72 54.2 % 13.05 9.20 41.9 %
Net cash flow operations 31.8 6.2 412.5 % 173.3 97.7 77.4 %
Equity ratio 31.9 % 32.0 % 31.9 % 32.0 %
Cash and cash equivalents 87.7 56.0 56.4 % 87.7 56.0 56.4 %
Number of employees (end of period) 1 304 1 166 11.8 % 1 304 1 166 11.8 %
Number of employees (average) 1 287 1 156 11.2 % 1 237 1 100 12.5 %
16

Revenue
o Revenues increased by 17.6 percent y‐o‐y
• Revenues from own consultants increased by 18.7 percent to NOK 377.9 million
• Revenues from sub‐contracted consultants increased by 10.8 percent to NOK 60.0 million
• Other revenues increased by 19.9 percent to NOK 15.8 million
Revenue split (quarterly figures)
Revenue split (12 months rolling average)
0
100
200
300
400
500
Q2'13 Q2'14 Q2'15 Q2'16 Q2'17 Q2'18
0
500
1000
1500
2000
Q2'13 Q2'14 Q2'15 Q2'16 Q2'17 Q2'18
Own consultants
Sub‐contracted consultants
Other
Own consultantsSub‐contracted consultantsOther
17
MNOK
MNOK
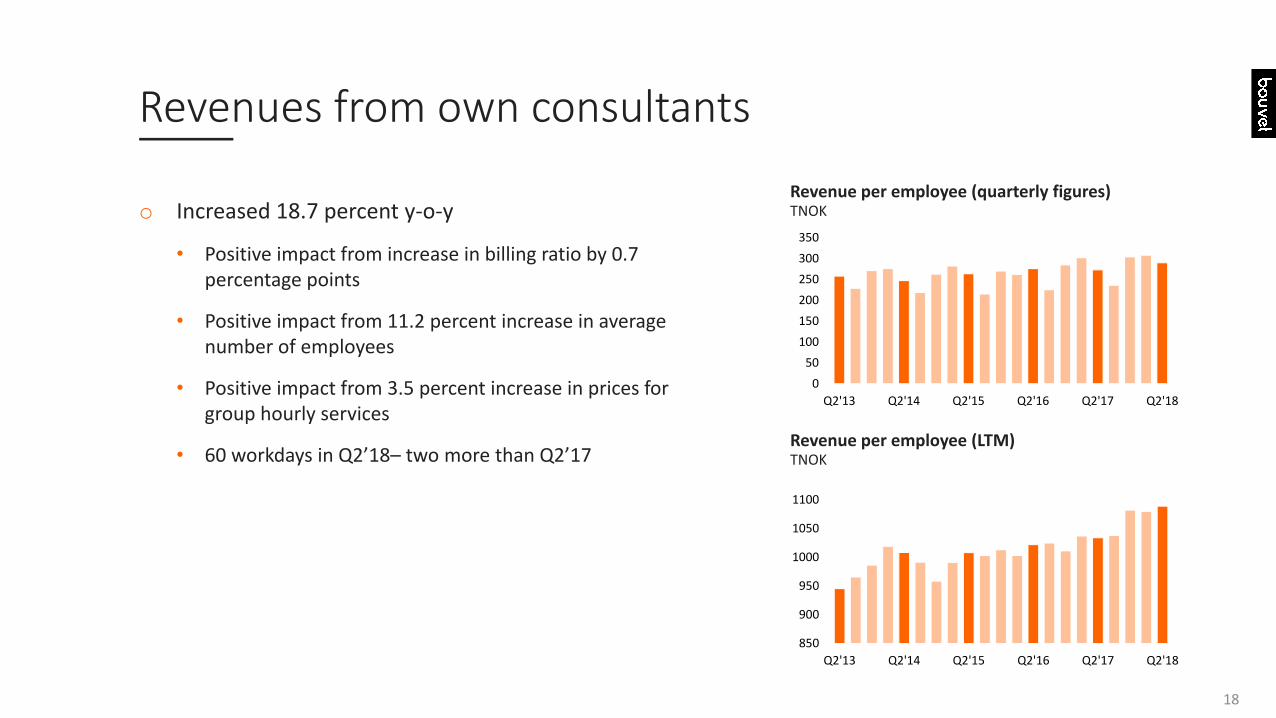
Revenues from own consultants
o Increased 18.7 percent y‐o‐y
• Positive impact from increase in billing ratio by 0.7 percentage points
• Positive impact from 11.2 percent increase in average number of employees
• Positive impact from 3.5 percent increase in prices for group hourly services
• 60 workdays in Q2’18– two more than Q2’17
Revenue per employee (quarterly figures)
Revenue per employee (LTM)
0
50
100
150
200
250
300
350
Q2'13 Q2'14 Q2'15 Q2'16 Q2'17 Q2'18
850
900
950
1000
1050
1100
Q2'13 Q2'14 Q2'15 Q2'16 Q2'17 Q2'18
18
TNOK
TNOK
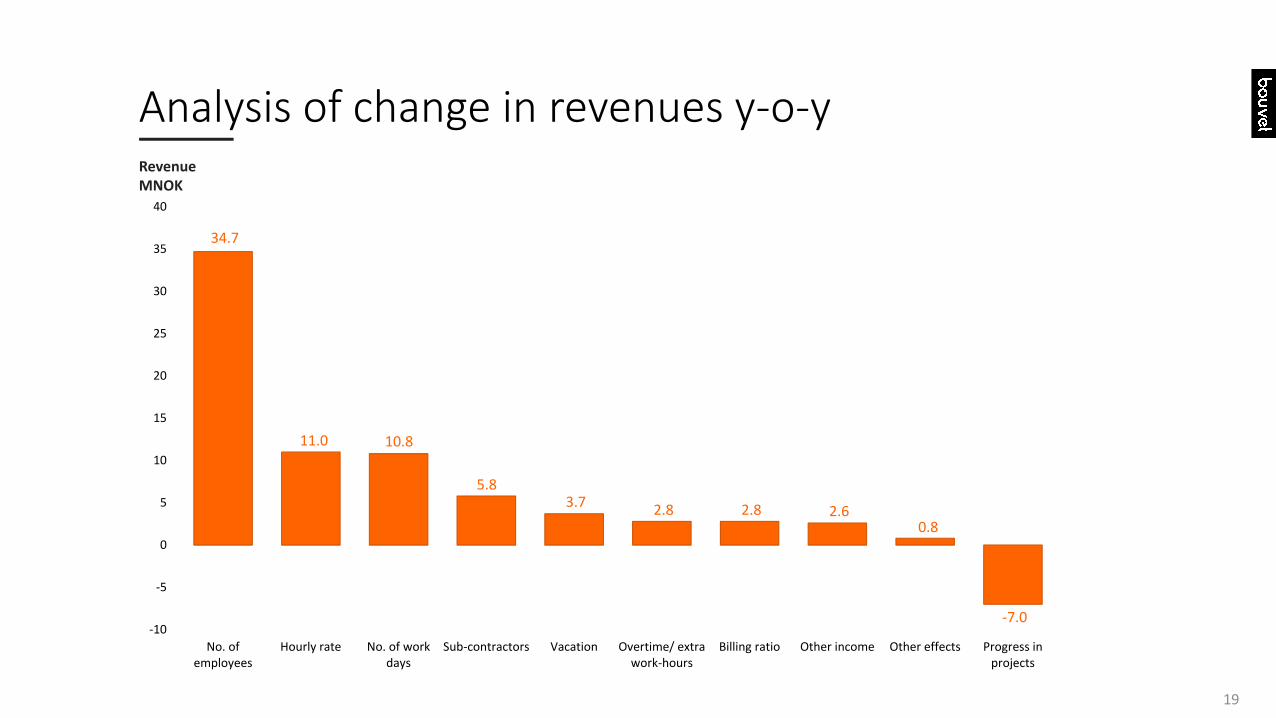
Analysis of change in revenues y‐o‐yRevenue MNOK
34.7
11.0 10.8
5.8 3.7 2.8 2.8 2.6
0.8
‐7.0 ‐10
‐5
0
5
10
15
20
25
30
35
40
No. ofemployees
Hourly rate No. of workdays
Sub‐contractors Vacation Overtime/ extrawork‐hours
Billing ratio Other income Other effects Progress inprojects
19
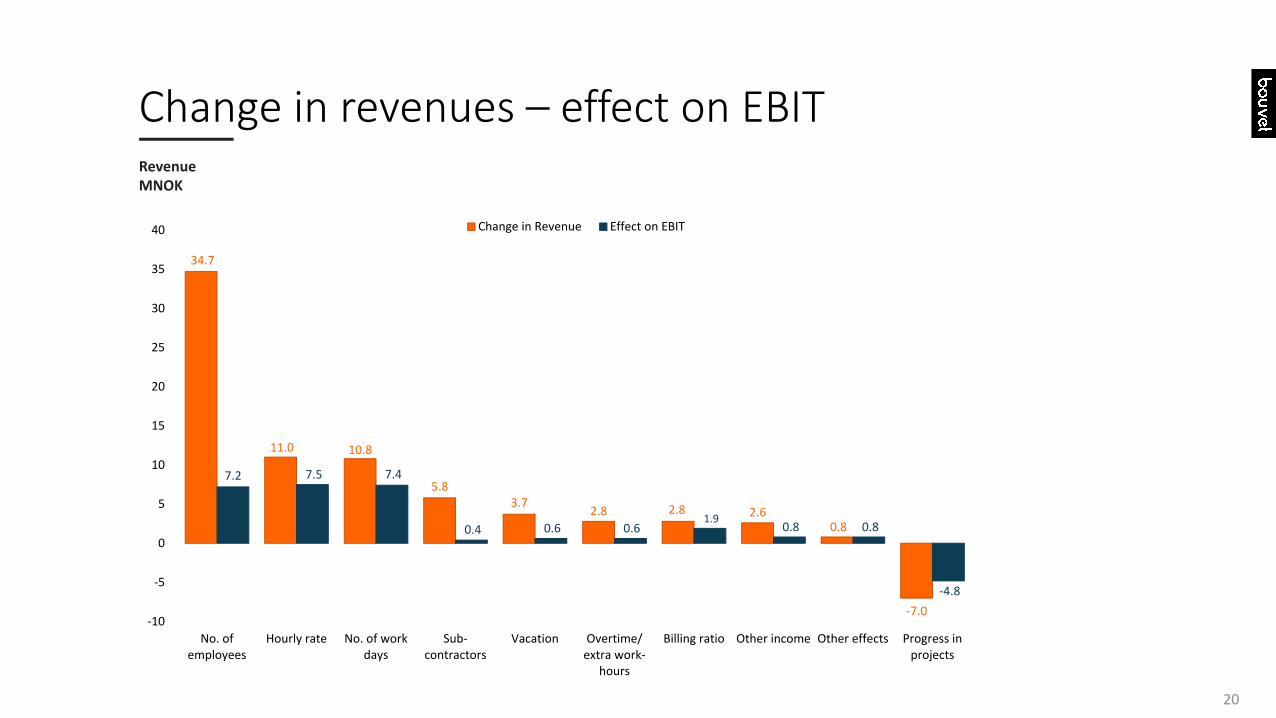
Change in revenues – effect on EBIT
34.7
11.0 10.8
5.8 3.7
2.8 2.8 2.6 0.8
‐7.0
7.2 7.5 7.4
0.4 0.6 0.6 1.9
0.8 0.8
‐4.8
‐10
‐5
0
5
10
15
20
25
30
35
40
No. ofemployees
Hourly rate No. of workdays
Sub‐contractors
Vacation Overtime/extra work‐
hours
Billing ratio Other income Other effects Progress inprojects
Change in Revenue Effect on EBIT
20
Revenue MNOK
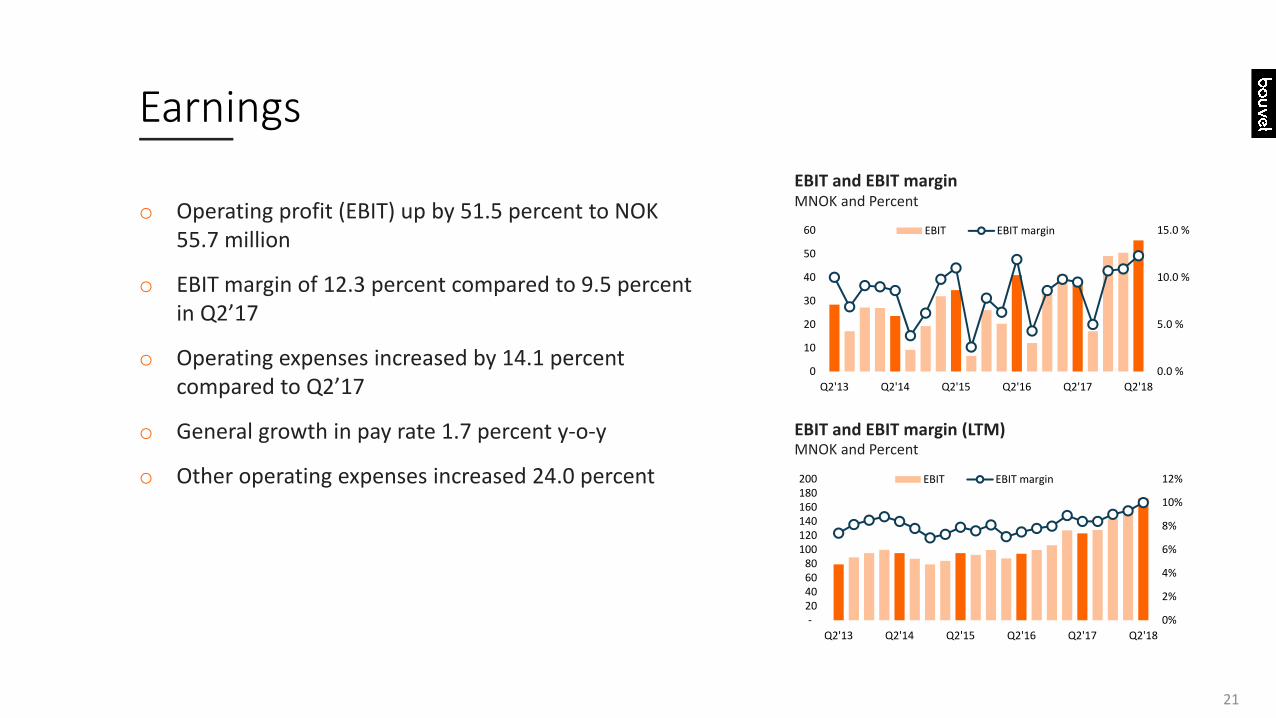
Earnings
o Operating profit (EBIT) up by 51.5 percent to NOK 55.7 million
o EBIT margin of 12.3 percent compared to 9.5 percent in Q2’17
o Operating expenses increased by 14.1 percent compared to Q2’17
o General growth in pay rate 1.7 percent y‐o‐y
o Other operating expenses increased 24.0 percent
EBIT and EBIT margin
EBIT and EBIT margin (LTM)
0%
2%
4%
6%
8%
10%
12%
‐ 20 40 60 80
100 120 140 160 180 200
Q2'13 Q2'14 Q2'15 Q2'16 Q2'17 Q2'18
EBIT EBIT margin
0.0 %
5.0 %
10.0 %
15.0 %
0
10
20
30
40
50
60
Q2'13 Q2'14 Q2'15 Q2'16 Q2'17 Q2'18
EBIT EBIT margin
21
MNOK and Percent
MNOK and Percent

Cash flow
o Cash flow from operations
• NOK 31.8 million in Q2’18 compared to NOK 6.2 million in Q2’17
o Last 12 months
• Operational cash flow over the last 12 months was NOK 173.3 million
o Cash flow from investing activities
• Negative NOK 16.0 million compared to negative NOK 6.5 million in Q2’17
MNOK
Cash flow from operations (LTM)
0
50
100
150
200
Q2'13 Q2'14 Q2'15 Q2'16 Q2'17 Q2'18
‐50
0
50
100
150
200
Q2'13 Q2'14 Q2'15 Q2'16 Q2'17 Q2'18
22
Cash flow from operations (per quarter)
MNOK

Outlook
23

Outlook
24
o High demand
o Increased demand for platform, IoT and cloud competence
o Increased use of virtual reality, augmented reality and mixed reality
o Too low delivery capacity in the IT consultancy sector
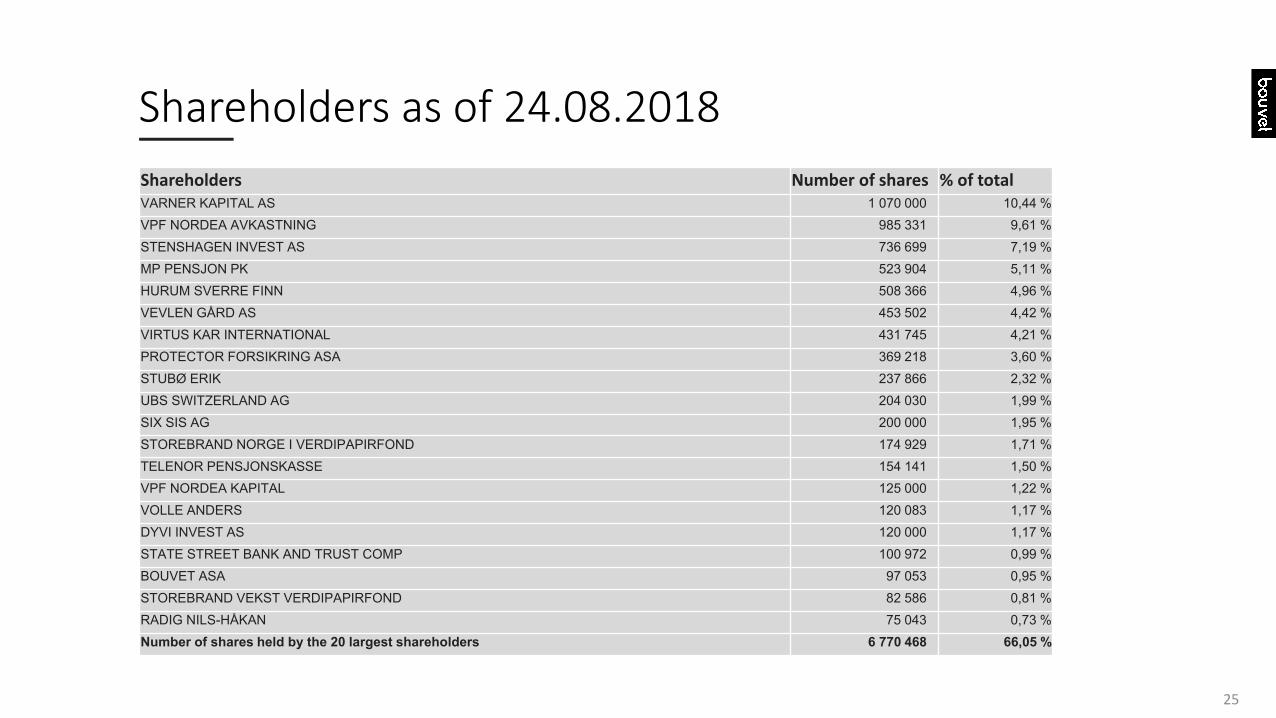
Shareholders as of 24.08.2018
25
Shareholders Number of shares % of totalVARNER KAPITAL AS 1 070 000 10,44 %VPF NORDEA AVKASTNING 985 331 9,61 %STENSHAGEN INVEST AS 736 699 7,19 %MP PENSJON PK 523 904 5,11 %HURUM SVERRE FINN 508 366 4,96 %VEVLEN GÅRD AS 453 502 4,42 %VIRTUS KAR INTERNATIONAL 431 745 4,21 %PROTECTOR FORSIKRING ASA 369 218 3,60 %STUBØ ERIK 237 866 2,32 %UBS SWITZERLAND AG 204 030 1,99 %SIX SIS AG 200 000 1,95 %STOREBRAND NORGE I VERDIPAPIRFOND 174 929 1,71 %TELENOR PENSJONSKASSE 154 141 1,50 %VPF NORDEA KAPITAL 125 000 1,22 %VOLLE ANDERS 120 083 1,17 %DYVI INVEST AS 120 000 1,17 %STATE STREET BANK AND TRUST COMP 100 972 0,99 %BOUVET ASA 97 053 0,95 %STOREBRAND VEKST VERDIPAPIRFOND 82 586 0,81 %RADIG NILS-HÅKAN 75 043 0,73 %Number of shares held by the 20 largest shareholders 6 770 468 66,05 %