Embed Size (px)
Citation preview
Interim Report
of Committee on Large Container Ship Safety
(English version)
In December 2013
Issued by
Committee on Large Container Ship Safety
Japan
2
Table of Contents
Page
Preamble ………………………………………………………………………………………………… 3
Overview ………………………………………………………………………………………………… 4
1. Outline of the Investigation Policy …………………………………………………………..… 7
2. Information regarding the accident …………………………………………………………..… 9
2.1 Outline of the Container Ship “MOL COMFORT” ……………………………………………… 9
2.2 Conformity with Rules/ Survey Conditions ……………………………………………… 10
3. State and Conditions at the time of the accident ……………………………………………….. 13
Presumptions on the origin of the Hull Damage ……………………………………………….. 14
4. Safety Inspections of The Sister Ships …………………………………………………………… 15
5. Evaluation of Hull Structural Strength …………………………………………………………… 20
5.1 State of the art of evaluations for Hull Structural Strength of Large Container Ships ……….. 20
5.2 Simulation of Hull Structural Strength …………………….……………………………………… 23
5.3 Consideration of possibility of Fatigue Cracks ………………………………………………… 32
6. Estimation of Acting Load ………………………………………………………………………….. 35
6.1 Clarification of Sea States based on the wave data ……………………………………… 35
6.2 Estimation of Acting Load ………………………………………………………………………… 36
6.3 Consideration of accuracy for Estimated Load and the effect of cargo weight ……………. 43
7. Presumptions on Accident Scenarios ………………………………………………………….. 48
8. Results of the Investigation and Future Tasks ……………………………………………….… 50
9. Recommended Safety Measures ……..…………………………………………….……………… 53
ANNEX 1 Deformation Distribution and Occurrence Frequency of Bottom Shell
plates of The 6 Sister Ships (refer to Section 4) ……….…….. 55
ANNEX 2 Hull Girder Strength Evaluation and Analyses (refer to Section 5.1.4) ……………... 57
ANNEX 3 Features of Implicit and Explicit Method in Non-linear
Elasto-plastic Analysis (refer to Section 5.1.4) …………..……………….. 59
ANNEX 4 Examination of Cracks in Butt Joints of Bottom Shell Plate
(non-destructive inspections) (refer to Section 5.3) …………………………… 60
ANNEX 5 In terms of errors in weather and sea data (refer to Section 6.1) ……………………. 62
ANNEX 6 Whipping Effect (refer to Section 8.3) ……….…………………………………………… 64
ANNEX 7 List of Committee Members ……..………………………………………………………… 66
3
Preamble
The Bahamian flagged large container ship (8,000 TEU class) "MOL COMFORT" (herein referred to
as “The Ship”) experienced a fracture amidships while transiting the Indian Ocean from Singapore to
Jeddah (Saudi Arabia) on 17 June 2013. Following this, The Ship split into two halves, which were adrift
before sinking. Thanks to the swift rescue efforts of ships navigating the area and Indian disaster relief
authorities, no loss of life occurred in this accident. We express our gratitude to those involved in this
rescue.
As The Ship’s builder, operator, and classification society (a third-party organization that carries out
such activities as surveys on hull construction) are all located in Japan and are able to closely share
information and discuss safety measures, the Maritime Bureau of Japan’s Ministry of Land, Infrastructure,
Transport and Tourism (MLIT) established the Committee on Large Container Ship Safety (the
Committee) composed of members from the maritime industry, experts with relevant knowledge and
experience, and the related research institution staffs, and issued this interim report of the Committee.
While this interim report is intended to inform the industry of the safety measures discussed by the
Committee, through the preparation of this English translation it is also meant to provide information to
The Ship’s flag State, which is tasked with investigating the accident, as well as to the International
Association of Classification Societies (IACS), which are responsible for international standards for hull
construction, and the International Maritime Organization (IMO).
4
Overview
Results of Investigation
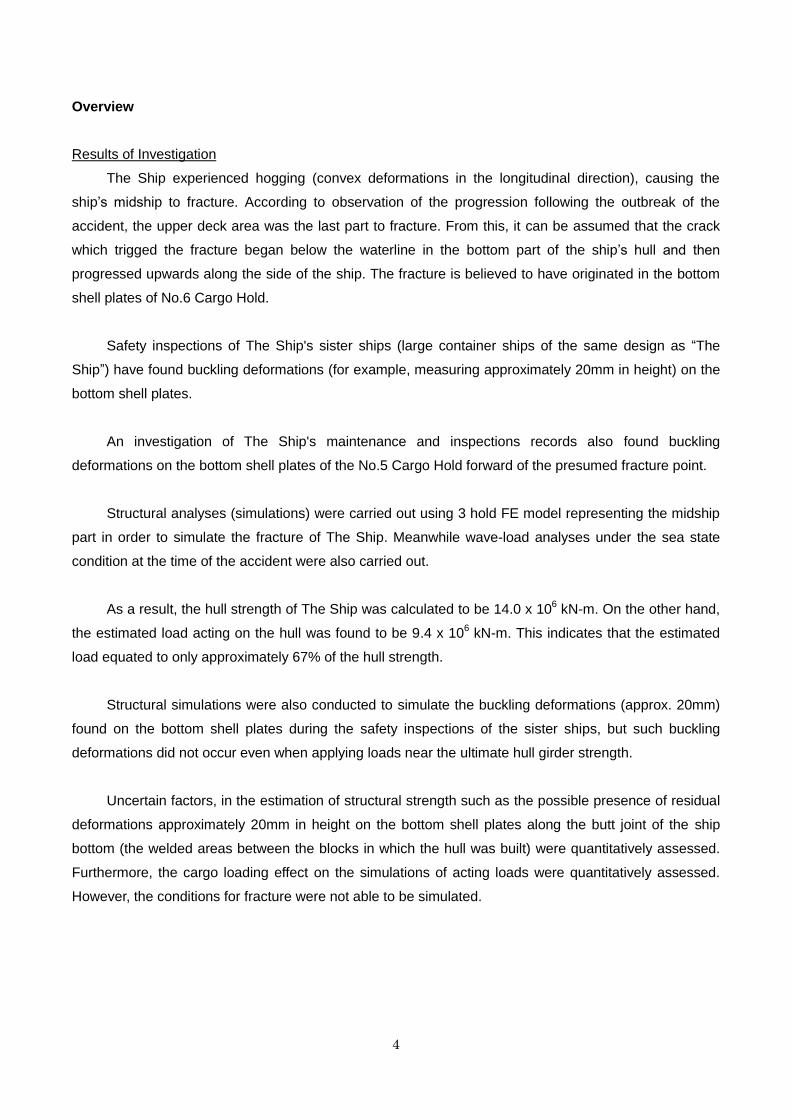
The Ship experienced hogging (convex deformations in the longitudinal direction), causing the
ship’s midship to fracture. According to observation of the progression following the outbreak of the
accident, the upper deck area was the last part to fracture. From this, it can be assumed that the crack
which trigged the fracture began below the waterline in the bottom part of the ship’s hull and then
progressed upwards along the side of the ship. The fracture is believed to have originated in the bottom
shell plates of No.6 Cargo Hold.
Safety inspections of The Ship's sister ships (large container ships of the same design as “The
Ship”) have found buckling deformations (for example, measuring approximately 20mm in height) on the
bottom shell plates.
An investigation of The Ship's maintenance and inspections records also found buckling
deformations on the bottom shell plates of the No.5 Cargo Hold forward of the presumed fracture point.
Structural analyses (simulations) were carried out using 3 hold FE model representing the midship
part in order to simulate the fracture of The Ship. Meanwhile wave-load analyses under the sea state
condition at the time of the accident were also carried out.
As a result, the hull strength of The Ship was calculated to be 14.0 x 10⁶ kN-m. On the other hand,
the estimated load acting on the hull was found to be 9.4 x 10⁶ kN-m. This indicates that the estimated
load equated to only approximately 67% of the hull strength.
Structural simulations were also conducted to simulate the buckling deformations (approx. 20mm)
found on the bottom shell plates during the safety inspections of the sister ships, but such buckling
deformations did not occur even when applying loads near the ultimate hull girder strength.
Uncertain factors, in the estimation of structural strength such as the possible presence of residual
deformations approximately 20mm in height on the bottom shell plates along the butt joint of the ship
bottom (the welded areas between the blocks in which the hull was built) were quantitatively assessed.
Furthermore, the cargo loading effect on the simulations of acting loads were quantitatively assessed.
However, the conditions for fracture were not able to be simulated.
5
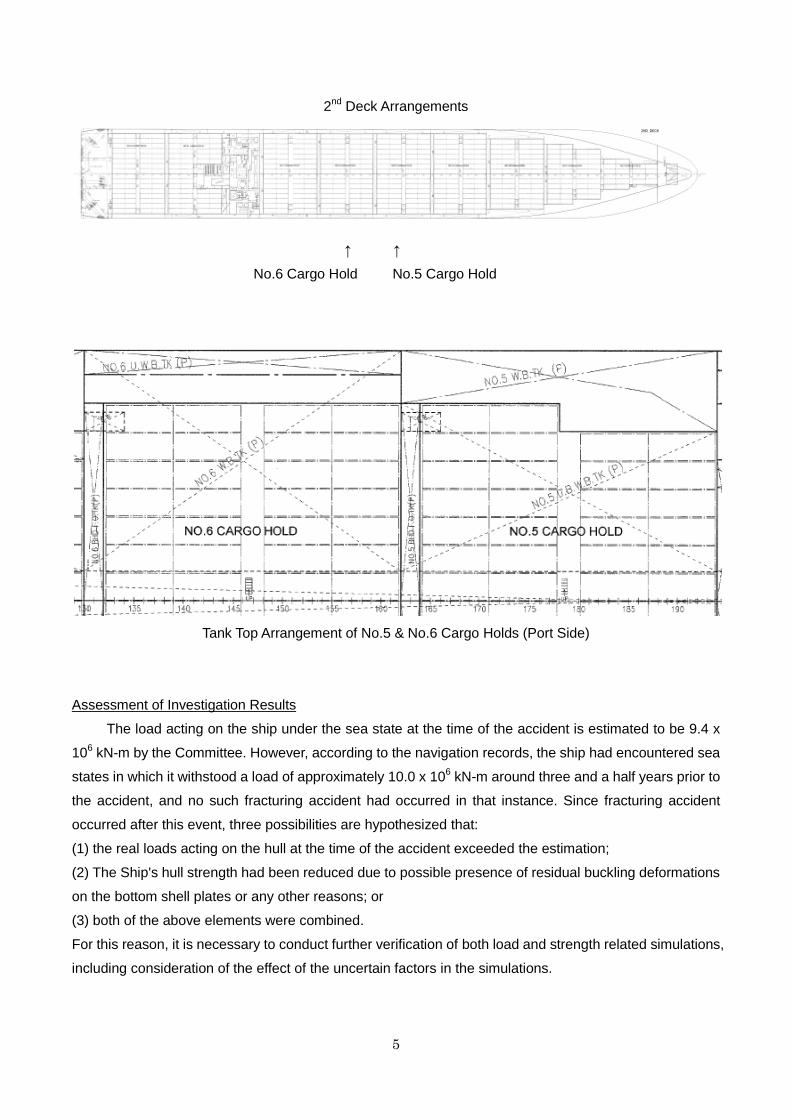
2nd
Deck Arrangements
↑ ↑
No.6 Cargo Hold No.5 Cargo Hold
Tank Top Arrangement of No.5 & No.6 Cargo Holds (Port Side)
Assessment of Investigation Results
The load acting on the ship under the sea state at the time of the accident is estimated to be 9.4 x
106 kN-m by the Committee. However, according to the navigation records, the ship had encountered sea
states in which it withstood a load of approximately 10.0 x 10⁶ kN-m around three and a half years prior to
the accident, and no such fracturing accident had occurred in that instance. Since fracturing accident
occurred after this event, three possibilities are hypothesized that:
(1) the real loads acting on the hull at the time of the accident exceeded the estimation;
(2) The Ship's hull strength had been reduced due to possible presence of residual buckling deformations
on the bottom shell plates or any other reasons; or
(3) both of the above elements were combined.
For this reason, it is necessary to conduct further verification of both load and strength related simulations,
including consideration of the effect of the uncertain factors in the simulations.
6
Furthermore, with regards to the fact that deformations of approximately 20mm were found on the
bottom shell plates during the safety inspections of the sister ships, given that the deformations could not
be simulated even when loads very close to the ultimate hull girder strength were applied, and that some
buckling deformations of the bottom shell plates of The Ship had been found even though she is
presumed not have encountered loads close to her hull strength, it is necessary to clarify the mechanism
of these buckling deformations by both full-scale stress measurements of actual ships and numerical
simulations.
Further Actions
Further investigations including numerical simulations of the wave loads and the hull structure
strength as well as full-scale stress measurements of sister ships will be carried out to clarify the cause of
the accident and to establish safety measures to prevent the occurrence of similar accidents.
Furthermore, in order to determine the scope of ships for safety measures, numerical simulations of
hull strength and acting loads, as well as full-scale stress measurements of actual ships will be carried out
on large container ships with designs other than The Ship.
Temporary Safety Measures
As stated above, while the Committee is still in the process of extrapolating the cause of the
accident scenario and developing upon safety measures, the Committee recommends that the following
actions be taken as temporary safety measures for existing container ships with loading capacities similar
to or greater than 8,000 TEU class.
A safety inspection on the bottom shell plates to the extent possible should be conducted in order to
verify the presence of buckling deformations. If such deformations are found during this inspection,
consult a classification society regarding the proper measures to be taken.
In accordance with the deliberations at the IMO related to the enforcement of container weight
verification prior to loading, verification of the actual weight of container cargoes provided by the shipper
is recommended in order to reduce uncertainty related to the still water bending moments of large
container ships.
7
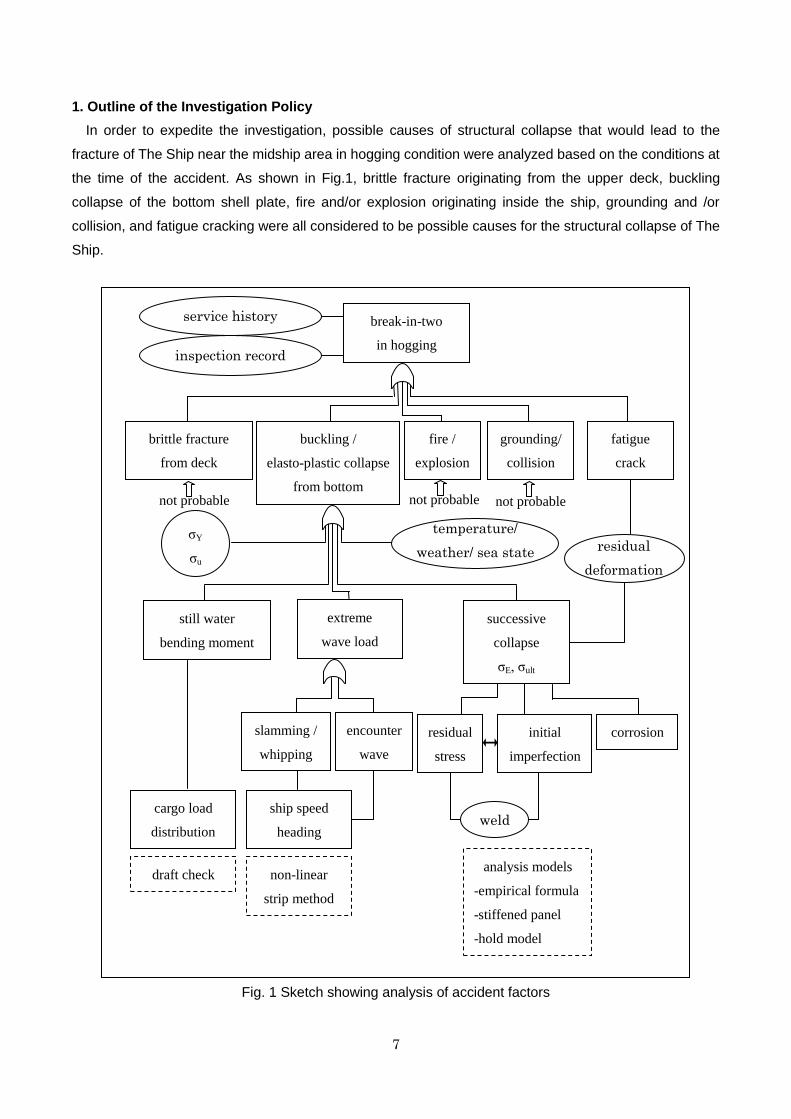
1. Outline of the Investigation Policy
In order to expedite the investigation, possible causes of structural collapse that would lead to the
fracture of The Ship near the midship area in hogging condition were analyzed based on the conditions at
the time of the accident. As shown in Fig.1, brittle fracture originating from the upper deck, buckling
collapse of the bottom shell plate, fire and/or explosion originating inside the ship, grounding and /or
collision, and fatigue cracking were all considered to be possible causes for the structural collapse of The
Ship.
Fig. 1 Sketch showing analysis of accident factors
cargo load
distribution
draft check
ship speed
heading
non-linear
strip method
still water
bending moment
corrosion
analysis models
-empirical formula
-stiffened panel
-hold model
σY
σu
service history break-in-two
in hogging
brittle fracture
from deck
buckling /
elasto-plastic collapse
from bottom
fire /
explosion
grounding/
collision
fatigue
crack
extreme
wave load
slamming /
whipping
successive
collapse
σE, σult
residual
stress
inspection record
encounter
wave
initial
imperfection
not probable not probable not probable
temperature/
weather/ sea state residual
deformation
weld
8
Among these potential causes, however, brittle fractures from the upper deck have been excluded from
the scope of this investigation as, based on the conditions at the time of the accident which are discussed
in depth later in the report, the fracture is considered to have originated in the bottom shell plates
amidships. Moreover, fire and/or explosion originating from inside the ship, as well as grounding and/or
collision, were also excluded from the scope of the investigation as no evidence of these events could be
found from the conditions of the accident.
Of the remaining potential causes, buckling of the bottom shell plates occurs when the load acting on
the hull girder exceeds the hull girder strength. Therefore analyses of both the loads acting on the hull and
hull girder strength (ultimate strength) were carried out to investigate the possibility of bottom shell
buckling.
Concerning the loads acting on the hull girder, the still water vertical bending moment derived from
loading weight distribution and wave loads determined from The Ship’s operating conditions including
ahead speed, course, and sea conditions were investigated. Loading conditions were analyzed based on
information provided by the operator of The Ship. The wave loads from the encountered sea conditions
were estimated with the effects of the whipping component using the non-linear strip method and sea
state data. In addition to confirming that The Ship’s design was in compliance with relevant rules, in order
to investigate buckling occurrence and hull girder strength (ultimate strength), elasto-plastic analyses of
the double bottom structure using “3 hold FE model” were carried out. In the analyses, factors that could
reduce ultimate strength such as initial imperfections were considered so as to reproduce the actual hull
girder structure. However corrosion was excluded from the scope of this study because The Ship had
been in service for only five years and no record of significant corrosion was found in class survey records
or similar.
Moreover, as fatigue can be a major cause of damage to welded structure in general, the possibility and
effects of fatigue cracking were also investigated as local factors that could be related to the fracture.
The information required for this investigation and for the publication of this report was collected with
the cooperation of the concerned.
9
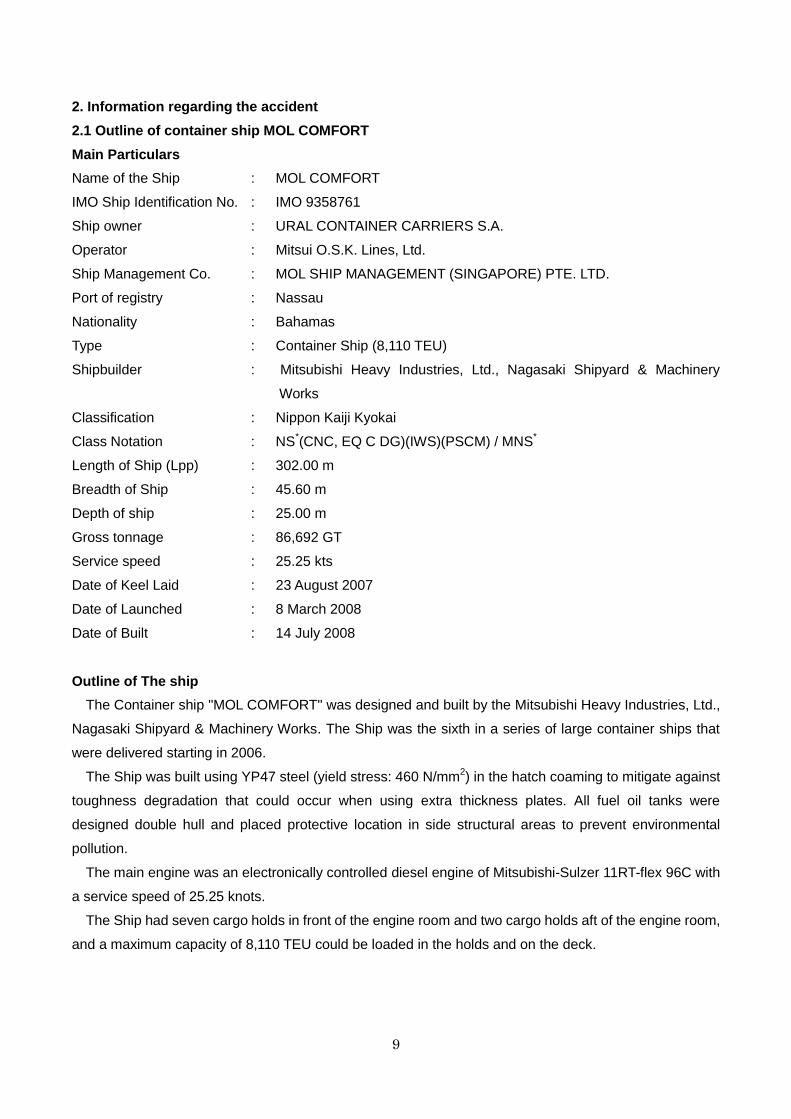
2. Information regarding the accident
2.1 Outline of container ship MOL COMFORT
Main Particulars
Name of the Ship : MOL COMFORT
IMO Ship Identification No. : IMO 9358761
Ship owner : URAL CONTAINER CARRIERS S.A.
Operator : Mitsui O.S.K. Lines, Ltd.
Ship Management Co. : MOL SHIP MANAGEMENT (SINGAPORE) PTE. LTD.
Port of registry : Nassau
Nationality : Bahamas
Type : Container Ship (8,110 TEU)
Shipbuilder : Mitsubishi Heavy Industries, Ltd., Nagasaki Shipyard & Machinery
Works
Classification : Nippon Kaiji Kyokai
Class Notation : NS*(CNC, EQ C DG)(IWS)(PSCM) / MNS
*
Length of Ship (Lpp) : 302.00 m
Breadth of Ship : 45.60 m
Depth of ship : 25.00 m
Gross tonnage : 86,692 GT
Service speed : 25.25 kts
Date of Keel Laid : 23 August 2007
Date of Launched : 8 March 2008
Date of Built : 14 July 2008
Outline of The ship
The Container ship "MOL COMFORT" was designed and built by the Mitsubishi Heavy Industries, Ltd.,
Nagasaki Shipyard & Machinery Works. The Ship was the sixth in a series of large container ships that
were delivered starting in 2006.
The Ship was built using YP47 steel (yield stress: 460 N/mm2) in the hatch coaming to mitigate against
toughness degradation that could occur when using extra thickness plates. All fuel oil tanks were
designed double hull and placed protective location in side structural areas to prevent environmental
pollution.
The main engine was an electronically controlled diesel engine of Mitsubishi-Sulzer 11RT-flex 96C with
a service speed of 25.25 knots.
The Ship had seven cargo holds in front of the engine room and two cargo holds aft of the engine room,
and a maximum capacity of 8,110 TEU could be loaded in the holds and on the deck.
10
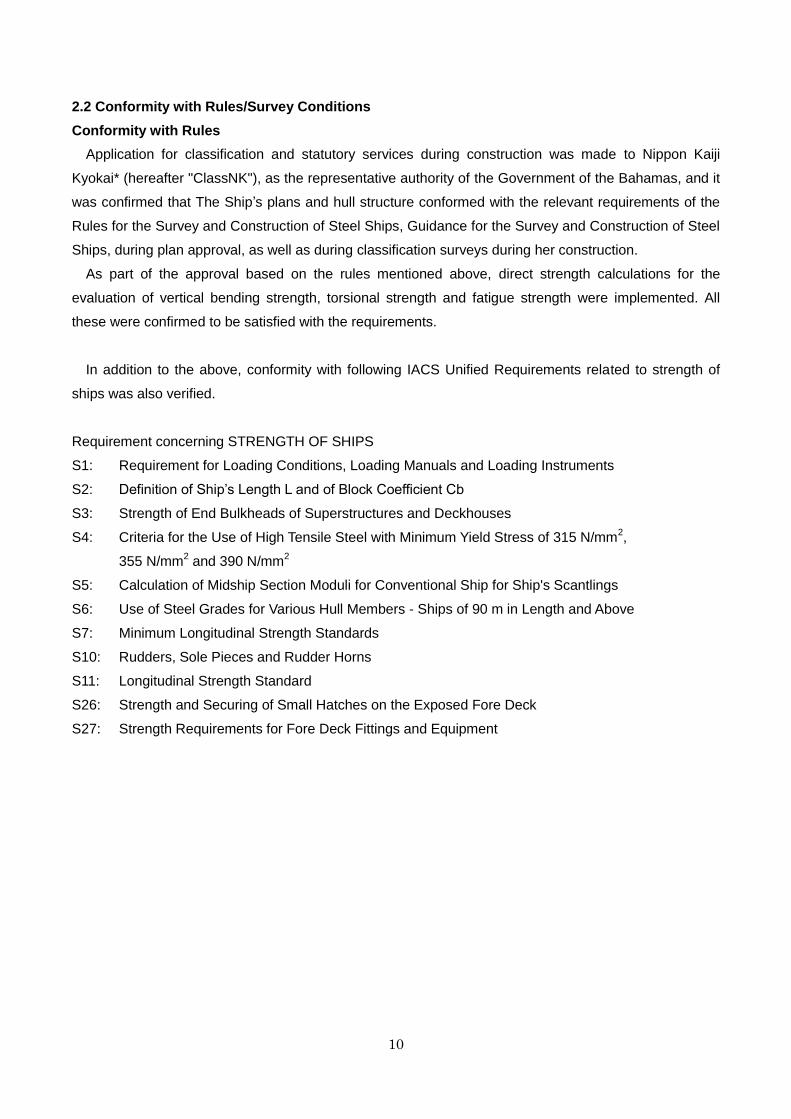
2.2 Conformity with Rules/Survey Conditions
Conformity with Rules
Application for classification and statutory services during construction was made to Nippon Kaiji
Kyokai* (hereafter "ClassNK"), as the representative authority of the Government of the Bahamas, and it
was confirmed that The Ship’s plans and hull structure conformed with the relevant requirements of the
Rules for the Survey and Construction of Steel Ships, Guidance for the Survey and Construction of Steel
Ships, during plan approval, as well as during classification surveys during her construction.
As part of the approval based on the rules mentioned above, direct strength calculations for the
evaluation of vertical bending strength, torsional strength and fatigue strength were implemented. All
these were confirmed to be satisfied with the requirements.
In addition to the above, conformity with following IACS Unified Requirements related to strength of
ships was also verified.
Requirement concerning STRENGTH OF SHIPS
S1: Requirement for Loading Conditions, Loading Manuals and Loading Instruments
S2: Definition of Ship’s Length L and of Block Coefficient Cb
S3: Strength of End Bulkheads of Superstructures and Deckhouses
S4: Criteria for the Use of High Tensile Steel with Minimum Yield Stress of 315 N/mm2,
355 N/mm2 and 390 N/mm
2
S5: Calculation of Midship Section Moduli for Conventional Ship for Ship's Scantlings
S6: Use of Steel Grades for Various Hull Members - Ships of 90 m in Length and Above
S7: Minimum Longitudinal Strength Standards
S10: Rudders, Sole Pieces and Rudder Horns
S11: Longitudinal Strength Standard
S26: Strength and Securing of Small Hatches on the Exposed Fore Deck
S27: Strength Requirements for Fore Deck Fittings and Equipment
11
Survey Status
The survey status of The Ship is shown in Table 2.2.1 below.
Table 2.2.1 Classification survey status of The Ship
Date Survey and location Remarks
23 August 2007
to 14 July 2008
Classification Survey during
Construction
(Nagasaki, Japan)
(No remarks)
22 January 2009 Occasional Survey (Hull)
(Singapore)
Outstanding
recommendation (Class)
was given related to damage
of shell plating of engine
room.
26 March 2009 Occasional Survey (Hull)
(Singapore)
Temporary repair for hull
damage mentioned above
was examined and the
outstanding
recommendation (Class)
was modified.
13 July 2009 Annual Survey
(Singapore)
Outstanding
recommendation (Class)
ongoing.
3 March 2010 Initial Survey of Anti-Fouling
System
(Singapore)
Outstanding
recommendation (Class)
ongoing.
5 June 2010 Annual Survey
(Singapore)
The temporary repair was
examined and the
Outstanding
recommendation was on
going.
26 May 2011 to 8 June 2011 Intermediate Survey
Docking Survey
(Guangzhou, China)
Permanent repair was
completed and the
Outstanding
recommendation (Class)
was cleared.
22, 23 May 2012 Annual Survey
(Singapore)
(No remarks)
12
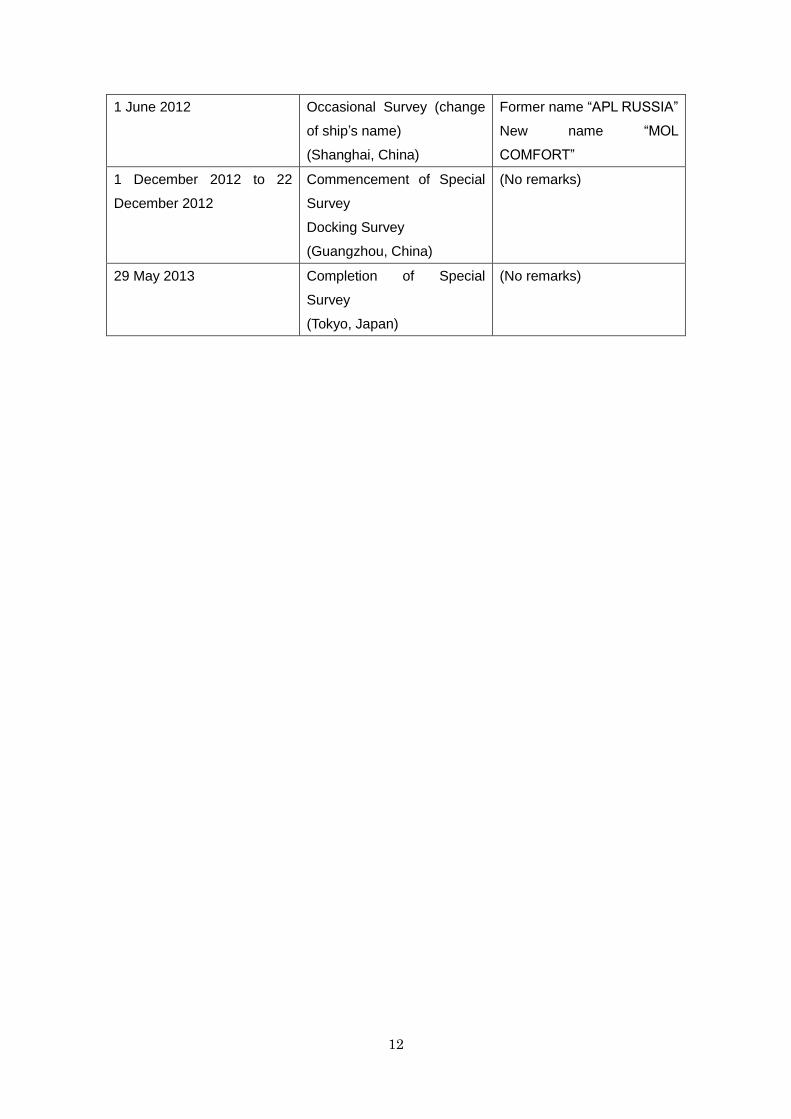
1 June 2012
Occasional Survey (change
of ship’s name)
(Shanghai, China)
Former name “APL RUSSIA”
New name “MOL
COMFORT”
1 December 2012 to 22
December 2012
Commencement of Special
Survey
Docking Survey
(Guangzhou, China)
(No remarks)
29 May 2013 Completion of Special
Survey
(Tokyo, Japan)
(No remarks)
13
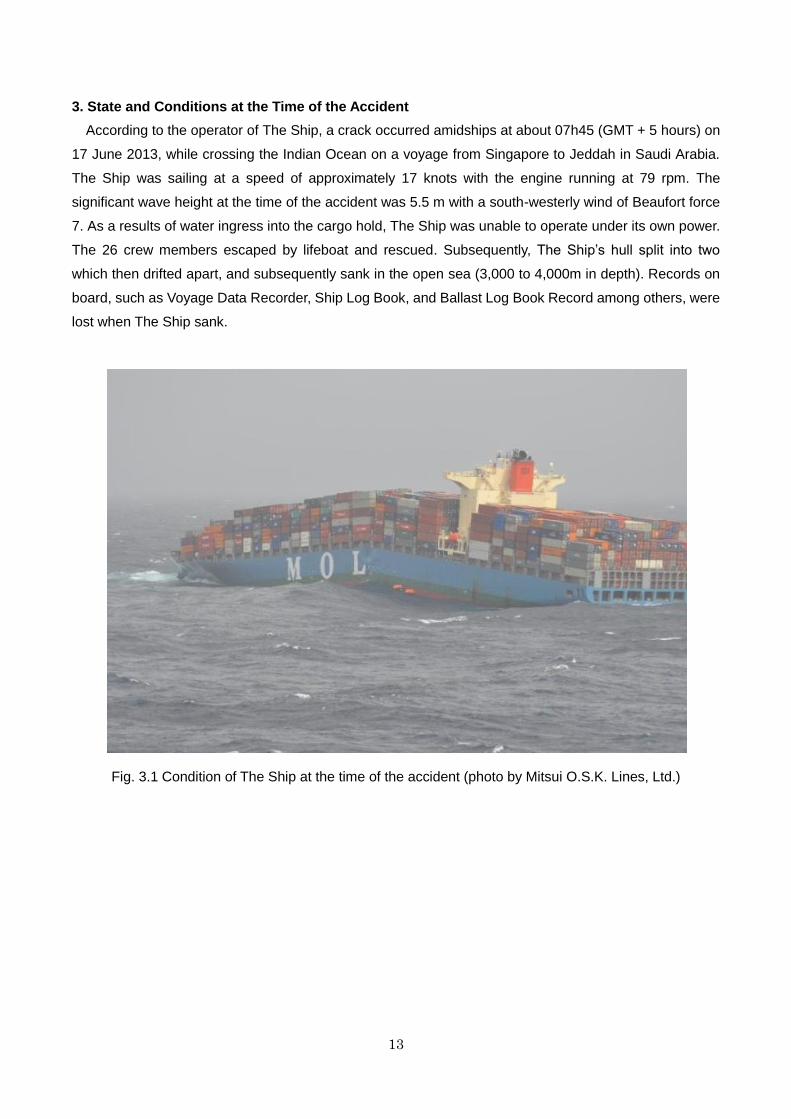
3. State and Conditions at the Time of the Accident
According to the operator of The Ship, a crack occurred amidships at about 07h45 (GMT + 5 hours) on
17 June 2013, while crossing the Indian Ocean on a voyage from Singapore to Jeddah in Saudi Arabia.
The Ship was sailing at a speed of approximately 17 knots with the engine running at 79 rpm. The
significant wave height at the time of the accident was 5.5 m with a south-westerly wind of Beaufort force
7. As a results of water ingress into the cargo hold, The Ship was unable to operate under its own power.
The 26 crew members escaped by lifeboat and rescued. Subsequently, The Ship’s hull split into two
which then drifted apart, and subsequently sank in the open sea (3,000 to 4,000m in depth). Records on
board, such as Voyage Data Recorder, Ship Log Book, and Ballast Log Book Record among others, were
lost when The Ship sank.
Fig. 3.1 Condition of The Ship at the time of the accident (photo by Mitsui O.S.K. Lines, Ltd.)
14
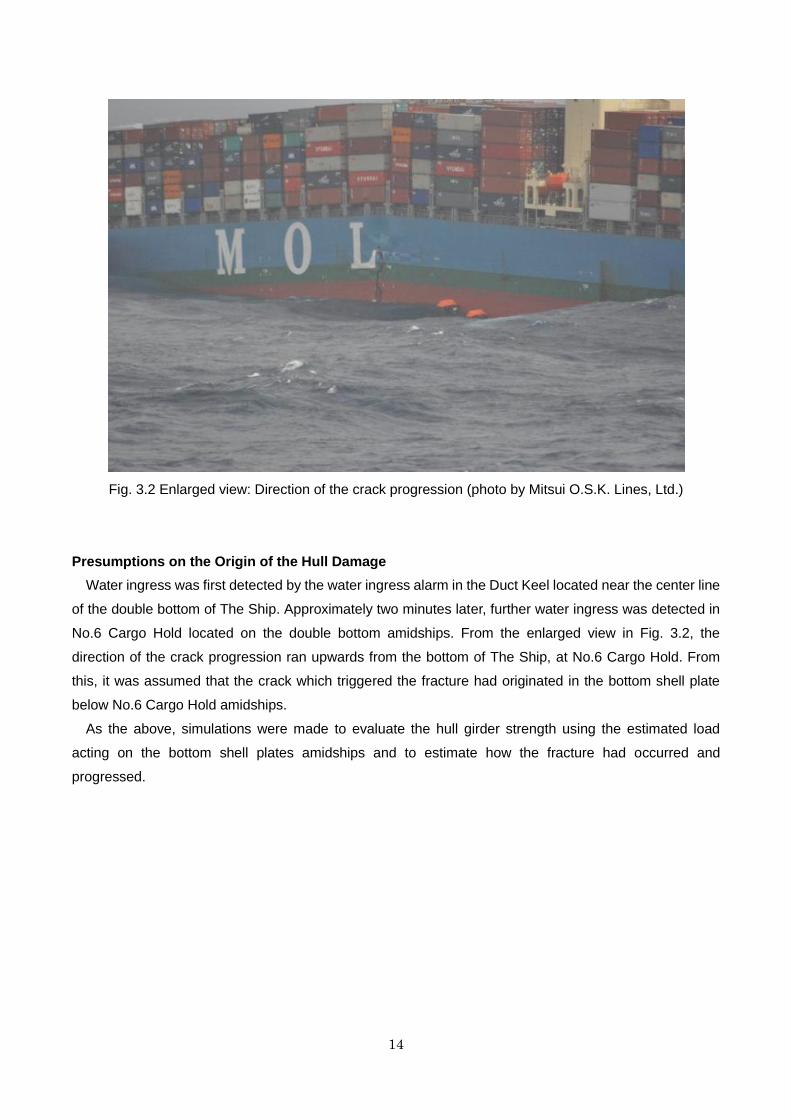
Fig. 3.2 Enlarged view: Direction of the crack progression (photo by Mitsui O.S.K. Lines, Ltd.)
Presumptions on the Origin of the Hull Damage
Water ingress was first detected by the water ingress alarm in the Duct Keel located near the center line
of the double bottom of The Ship. Approximately two minutes later, further water ingress was detected in
No.6 Cargo Hold located on the double bottom amidships. From the enlarged view in Fig. 3.2, the
direction of the crack progression ran upwards from the bottom of The Ship, at No.6 Cargo Hold. From
this, it was assumed that the crack which triggered the fracture had originated in the bottom shell plate
below No.6 Cargo Hold amidships.
As the above, simulations were made to evaluate the hull girder strength using the estimated load
acting on the bottom shell plates amidships and to estimate how the fracture had occurred and
progressed.
15
4. Safety Inspections of The Sister Ships
As the condition of the hull damage and the cargo loading could not be verified due to the sinking of
The Ship with on-board records, safety inspections of their bottom shell plates were conducted on The
Sister Ships to collect any information relevant to the accident. Upon results of the safety inspections
carried out on The Sister Ships, buckling deformations (concave and convex deformation of the bottom
shell plating) of up to a maximum of 20mm in height were observed near the center line of the transverse
section of the bottom shell plates amidships, for example. As a preventative safety measure for these
Sister Ships, significant reinforcements of the double bottom structure to increase hull girder strength
were carried out successively for each ship. Inspections of The 6 Sister Ships and four other ships similar
in size to The Ship were carried out with the cooperation of each operator in line with the Committee’s
objectives. As these ships were not Japanese flagged ships, no information about these ships will be
disclosed excluding information mentioned in this report. Although differences were observed in their
shape and frequency, deformations of the bottom shell plates, including minor deformations, were found
in 5 of The 6 Sister Ships operated by the same operator of The Ship, and found in 1 of The other 4
Similar Ships. No deformations were found on the remaining 1 Sister Ship operated by the same operator
of The Ship just delivered in 2013.
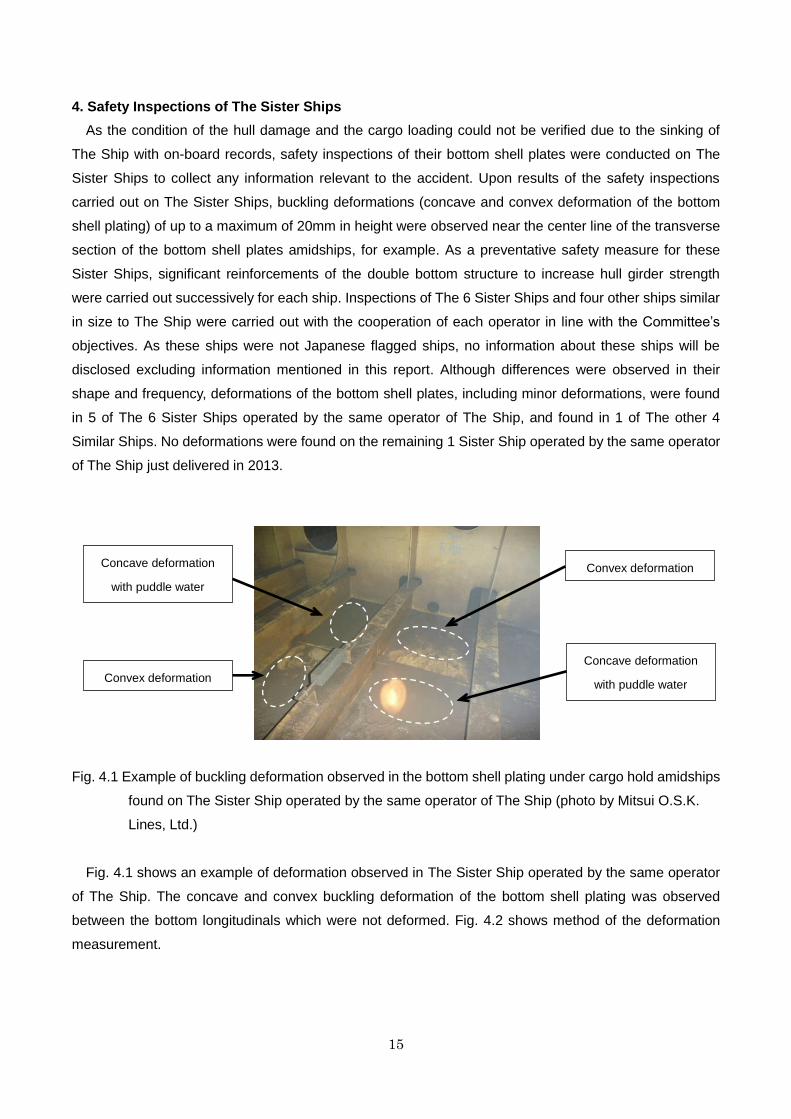
Fig. 4.1 Example of buckling deformation observed in the bottom shell plating under cargo hold amidships
found on The Sister Ship operated by the same operator of The Ship (photo by Mitsui O.S.K.
Lines, Ltd.)
Fig. 4.1 shows an example of deformation observed in The Sister Ship operated by the same operator
of The Ship. The concave and convex buckling deformation of the bottom shell plating was observed
between the bottom longitudinals which were not deformed. Fig. 4.2 shows method of the deformation
measurement.
Concave deformation
with puddle water
Convex deformation
Concave deformation
with puddle water
Convex deformation
16
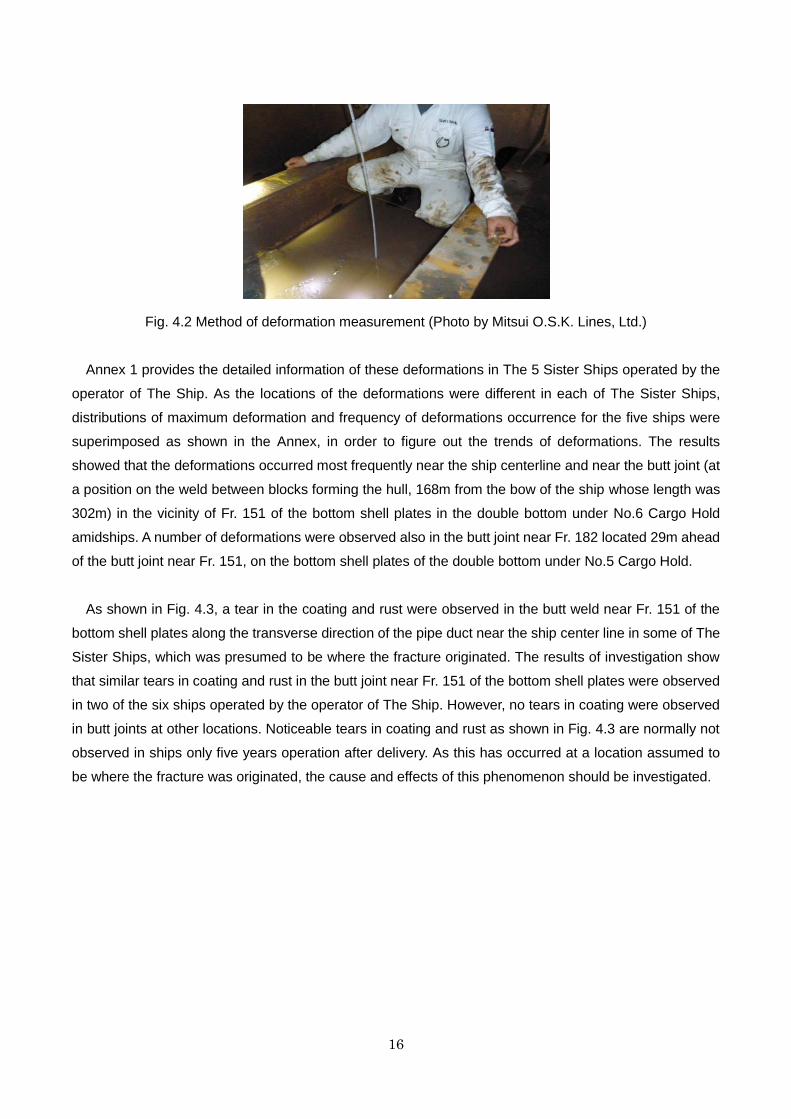
Fig. 4.2 Method of deformation measurement (Photo by Mitsui O.S.K. Lines, Ltd.)
Annex 1 provides the detailed information of these deformations in The 5 Sister Ships operated by the
operator of The Ship. As the locations of the deformations were different in each of The Sister Ships,
distributions of maximum deformation and frequency of deformations occurrence for the five ships were
superimposed as shown in the Annex, in order to figure out the trends of deformations. The results
showed that the deformations occurred most frequently near the ship centerline and near the butt joint (at
a position on the weld between blocks forming the hull, 168m from the bow of the ship whose length was
302m) in the vicinity of Fr. 151 of the bottom shell plates in the double bottom under No.6 Cargo Hold
amidships. A number of deformations were observed also in the butt joint near Fr. 182 located 29m ahead
of the butt joint near Fr. 151, on the bottom shell plates of the double bottom under No.5 Cargo Hold.
As shown in Fig. 4.3, a tear in the coating and rust were observed in the butt weld near Fr. 151 of the
bottom shell plates along the transverse direction of the pipe duct near the ship center line in some of The
Sister Ships, which was presumed to be where the fracture originated. The results of investigation show
that similar tears in coating and rust in the butt joint near Fr. 151 of the bottom shell plates were observed
in two of the six ships operated by the operator of The Ship. However, no tears in coating were observed
in butt joints at other locations. Noticeable tears in coating and rust as shown in Fig. 4.3 are normally not
observed in ships only five years operation after delivery. As this has occurred at a location assumed to
be where the fracture was originated, the cause and effects of this phenomenon should be investigated.
17
Fig. 4.3 Tears in coating and rust of butt joint (Photo by Mitsui O.S.K. Lines, Ltd.)
The maintenance records, as a part of Safety Management System, of The Ship were investigated. No
deformation was recorded in the bottom shell plates under No.6 Cargo Hold amidships, assumed to be
the part where the fracture originated, but showed buckling deformations as shown in Fig. 4.4 in bottom
shell plates on both the port and starboard sides near the butt weld in the vicinity of Fr. 182 under No.5
Cargo Hold at a more forward position. Some similar deformations were recorded after 4 January 2010.
The maintenance records mentioned deformations of about 20mm to 40mm, however, these
deformations were not accurately measured and recorded as seen in Fig. 4.2. Therefore, these
deformations cannot be simply compared to the deformations (Annex 1) observed in The Sister Ships.
Since no repairs were recorded, such deformations must be present in The Ship.
As the above paragraph was mentioned, such deformation cannot be always found and recorded. For
example, in maintenance inspections by ship's staff after 4 January 2010, no deformation was found in
the bottom shell plates near the butt weld in the vicinity of Fr.182.
There are no records regarding buckling deformations in the bottom shell plates during the periodic
classification surveys (Table 2.2.1).
18
Fig. 4.4 Deformation of bottom shell plate of The Ship
(area of butt weld in bottom shell plate near Fr.182 under the No.5 Cargo Hold)
(Photo by Mitsui O.S.K. Lines, Ltd.)
It was not clear whether deformation had occurred in the bottom shell plates under No.6 Cargo Hold
amidships (assumed to be where the fracture of The Ship originated), or whether a tear in the coating,
rust or cracks had occurred in the butt joint near Fr. 151 in the bottom shell plates.
(Other reference examples)
There was a case where significant deformation in the bottom shell plates of one of The 4 Similar Ships,
other than The Sister Ships operated by the same operator of The Ship, which required emergency
repairs, after the said ship sailing at 14 knots encountered head-on waves (mean wave period not known)
of significant wave height of 10m - 12m. This deformation was also observed in the bottom longitudinals,
and was a large deformation which was not observed in The Sister Ships as represented in Fig. 4.1. The
significant wave heights also differed considerably from those in the sea state encountered by The Ship. It
is necessary to understand that these conditions are distinguished from conditions at the time of the
fracture of The Ship. However, as this large deformation occurred in the butt joint near Fr. 151 in the
bottom shell plate under the No.6 Cargo Hold amidships (assumed to be where the fracture originated), it
should be taken as a reference example when performing hull girder strength evaluations.
The Classification Society requested complete repairs to the deformation in the said Similar Ship.
Temporary repairs and reinforcement were carried out until permanent repairs could be performed.
Condition monitoring and inspections were carried out to ensure that the deformation did not progress
and the ship continued on its voyage. After subsequent voyages over approximately one year, cracks (at
the intersection of the butt weld joint and the bottom longitudinals) were observed on the bottom shell at
outside of location where the temporary repairs had been carried out, and temporary repair was done
immediately. After one voyage, the permanent and complete repairs were implemented in dry-dock.
In order to identify whether deformation also occurred in the bottom shell plates of large container ships
19
with structural designs different from that of The Ship, inspections of the bottom shell plates of about 20
large container ships (8,000 TEU Class) of various structural designs were carried out, and inspection
data was collected with the cooperation of other operators. The outcome of these inspections was that,
although ships with double bottom structures housing fuel tanks could not be inspected, any kind of
deformation had not been reported in ships with double bottom structures housing ballast tanks.
20
5. Evaluation of hull structure strength
In order to evaluate the hull structure strength of The Ship, the latest state of evaluation procedures for
hull structure strength was confirmed, and numerical simulations of hull girder strength and studies on
fatigue cracks were carried out.
5.1 State of the art of evaluations for Hull Structural Strength of Large Container Ships
5.1.1 General hull structure strength evaluation at design and construction stage
(1) Initial design on structural arrangement, materials and scantlings of hull structures are determined
in compliance with IACS URs and the requirements and formulas of the Classification Society
concerned.
(2) Initial designs are also checked through direct strength analysis (FEM analysis) in accordance with
permissible stress, buckling and fatigue strength criteria required by the relevant rules of the
Classification Society concerned, and modified if found necessary.
(3) Scantlings of hull structures might be strengthened as a result of the comparison of specified
fatigue strength criteria with cyclic stress levels which are derived from design loads required by the
Classification Society concerned, together with the scantlings of hull structures or direct strength
analysis (elastic FEM analysis) model.
(4) Evaluation of torsional strength of hull girder is required on container ships due to the large hatch
openings. In accordance with the requirements of the Classification Society concerned, relative
deformations (between the hatch openings and the hatch covers) and fatigue strength of hatch
corners at fore end of the engine room in particular, are examined based on the results of torsional
strength analysis using a whole ship FE model, and if found necessary scantlings of hull structures
are strengthened.
(5) Strengthening of Bottom forward and Bow flare against slamming impact loads is one of the specific
design items of container ships. Structural arrangement, scantlings and materials of bottom forward
and bow flare areas might be modified as a result of the comparison of specified local strength
criteria with design impact loads required by the Classification Society concerned. The arrangement,
scantlings and material of forward deck structures might be modified as a result of the comparison
of specified local strength criteria with green sea impact loads required by the Classification Society
concerned.
5.1.2 Evaluation of hull structure strength in service
(1) Hull structure strength in service is confirmed through the periodic or occasional surveys of the
associated Classification Society and when found necessary repair works including renewal works
are to be conducted. As context to the above, it should be pointed that structural margin including
corrosion addition is considered in the evaluation of hull structure strength at design and
construction stage mentioned in (1) to (5) of Sec.5.1.1.
21
(2) There are cases where operation restrictions are put in place up to the period of implementation of
repairs by the Classification Society.
(3) Initiation and growth of fatigue cracks are checked through continuous monitoring including the
periodic surveys.
5.1.3 Latest evaluation procedures of hull structure strength for accident investigations
(1) Evaluation of Hull structure strength at design and construction stage is conducted according to the
design loads such as wave loads specified in the Classification Society's Rules based on statistical
data and the designed still water vertical bending moment determined from a condition, such as the
lightweight distribution, designed cargo weight. Consequently there is possibility that acting loads
on the hull structure might exceed the design loads including margins, and in such cases hull
structural damage might occur.
(2) When significant damages occur, hull structure strength including applied materials is to be
reassessed together with estimating the acting loads based on sea states at the time of the
accident in order to investigate the causes.
(3) In recent years, it is general to carry out structural strength calculations by elasto-plastic FEM
incorporating actual strength of steels and initial shape imperfection effects of actual welding
deformations for evaluating the hull structure strength, especially in case of damage that
accompanies elasto-plastic buckling.
(4) Researches on investigations into causes of damage such as mentioned above are conducted by
Classification Societies, and where necessary, the outcomes of the researches will be reflected in
the future amendments of the Rules.
5.1.4 Selection of Analysis method for Hull Structure Strength Evaluation: Elasto-plastic Analysis
by 3 Hold FE Model with full width double bottom structure
Based on the assumption that the fracture mentioned above started from the buckling, collapse and
fracture of the bottom shell part near the midship, hull structure strength simulations of The Ship were
carried out, analyzing the stages of deformation and damage due to loads acting on the double bottom
structure under the cargo holds using the non-linear elasto-plastic finite element method.
(1) Complex structural responses occur due to diverse loads on the double bottom structure of a
container ship. The main loads and the corresponding responses of structural members are as given
below.
Longitudinal stress arises in the double bottom structure due to vertical bending moment (mainly
hogging conditions), which is compressive stress uniformly distributed in the transverse direction.
In-plane compressive stress, local bending stress and local shearing stress occur both in the
longitudinal direction and in the transverse direction as local responses of the double bottom
structure by lateral sea pressure and container loads acting directly on the double bottom
22
structure, which are not uniform ones in the longitudinal and transverse directions of the ship.
Local bending stress due to lateral sea pressure also occurs in the bottom longitudinals and the
bottom shell plates between the longitudinals, which is not uniform one in the floor spaces and the
longitudinal spaces.
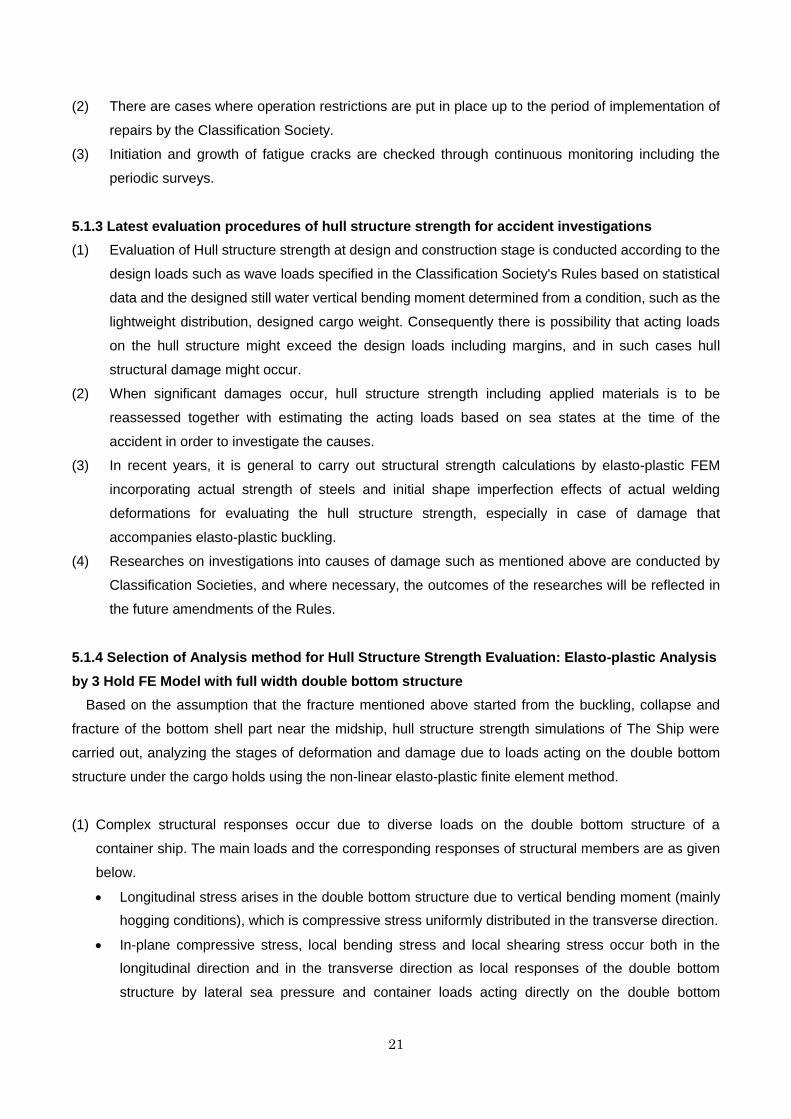
(2) A FE model with full-width and 3 hold range in the longitudinal direction (i.e. 3 hold FE model) was
prepared in order to make accurate simulations and grasp of the interaction between the local
structure responses and the global hull girder responses. Elasto-plastic structure analyses were
conducted by using the 3 hold FE Model applying lateral loads due to sea water pressure and
container loads. In the analyses, the shift of the horizontal neutral axis of the hull girder section could
be considered because of modeling the side structure and the upper deck structure including hatch
side coaming as well as the double bottom structure in the FE Model.
In order to accurately evaluate the actual strength of the hull structure and replicate the accident not
the minimum value specified in the Rules but mean value of the yield point of the steel plates was
used in the analyses. The true stress and true strain curve on the compression and tension sides
used in the analyses is shown in the figure below. Weight of ballast water and fuel oil in the tanks of
the double bottom, double sides and transverse bulkheads were ignored. Steel weight of hull
structures except the double bottom was also ignored. Furthermore additional mass caused by the
sea water was ignored. (For details of analysis conditions, refer to Annex 2.)
(3) Initial shape imperfections, which are unavoidable in the welded structure and affect buckling strength,
are appropriately modeled in the analyses.
(4) There are two methods for the elasto-plastic FE Analysis, the implicit method and the explicit method
and each method has merits and demerits individually (for details, see Annex 3). LS-DYNA Code was
used in the elasto-plastic analyses by 3 hold FE Model this time combining the implicit method and
explicit method.
23
(5) Assumed initial shape imperfection scenarios are as given below.
No initial shape imperfections
Bottom plate buckling mode deformation (4 half-waves with single amplitude of 4 mm), Euler
buckling and Lateral buckling deformation of bottom longitudinals
”Hungry-horse” mode and buckling mode deformation of bottom plate and Euler buckling and
Lateral buckling deformation of bottom longitudinals specified in the JSQS standard values
(Japanese Shipbuilding Quality Standards)
Initial shape imperfection of bottom plate simulating the buckling deformations at FR151+200mm
which were observed through the safety inspections of The Sister Ships (Initial shape
imperfection of bottom longitudinals is same to the above.)
Local convex/concave deformations of bottom plate located over the full width at the same
transverse section (Initial shape perfection of bottom longitudinals is same as the above.)
5.2 Simulation of Hull Structure Strength
5.2.1 Evaluation of Hull structure strength when The Ship was built
To evaluate the hull structure strength when the ship was built, simulations of hull structure strength
were carried out with the initial shape imperfections of “no initial shape imperfection”, “Bottom plate
buckling mode deformation (4 half-waves with amplitude of 4mm)” and “Hungry-horse mode deformation
specified in JSQS standard” among the initial shape imperfection conditions mentioned in (5) of Section
5.1.4.
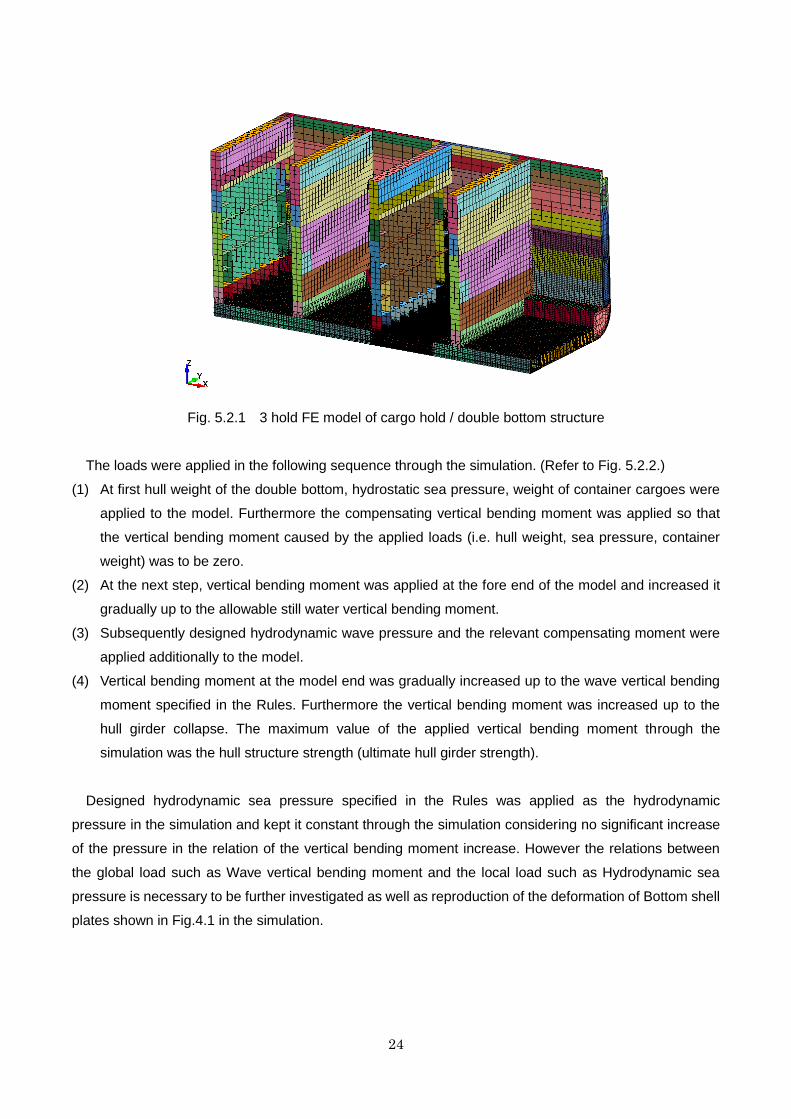
In modeling the cargo hold/double bottom structures, 3 hold FE Model with half width of the ship
composed of approx. 380,000 elements was made (see Fig.5.2.1). Scallop openings (openings to pass
through butt welding bead of bottom plate) on the webs of bottom longitudinals and girders were also
modeled at the crossing part of the butt welding joint and the longitudinal structure members in the hold
where the fracture was considered to be initiated. Loading and unloading through the simulation was
carried out watching the deformations of bottom shell plates. LS-Dyna was used for the simulation code.
This code is widely used in the industries for dynamic response analyses under impact loads such as
collision analysis of a vehicle.
24
Fig. 5.2.1 3 hold FE model of cargo hold / double bottom structure
The loads were applied in the following sequence through the simulation. (Refer to Fig. 5.2.2.)
(1) At first hull weight of the double bottom, hydrostatic sea pressure, weight of container cargoes were
applied to the model. Furthermore the compensating vertical bending moment was applied so that
the vertical bending moment caused by the applied loads (i.e. hull weight, sea pressure, container
weight) was to be zero.
(2) At the next step, vertical bending moment was applied at the fore end of the model and increased it
gradually up to the allowable still water vertical bending moment.
(3) Subsequently designed hydrodynamic wave pressure and the relevant compensating moment were
applied additionally to the model.
(4) Vertical bending moment at the model end was gradually increased up to the wave vertical bending
moment specified in the Rules. Furthermore the vertical bending moment was increased up to the
hull girder collapse. The maximum value of the applied vertical bending moment through the
simulation was the hull structure strength (ultimate hull girder strength).
Designed hydrodynamic sea pressure specified in the Rules was applied as the hydrodynamic
pressure in the simulation and kept it constant through the simulation considering no significant increase
of the pressure in the relation of the vertical bending moment increase. However the relations between
the global load such as Wave vertical bending moment and the local load such as Hydrodynamic sea
pressure is necessary to be further investigated as well as reproduction of the deformation of Bottom shell
plates shown in Fig.4.1 in the simulation.
25
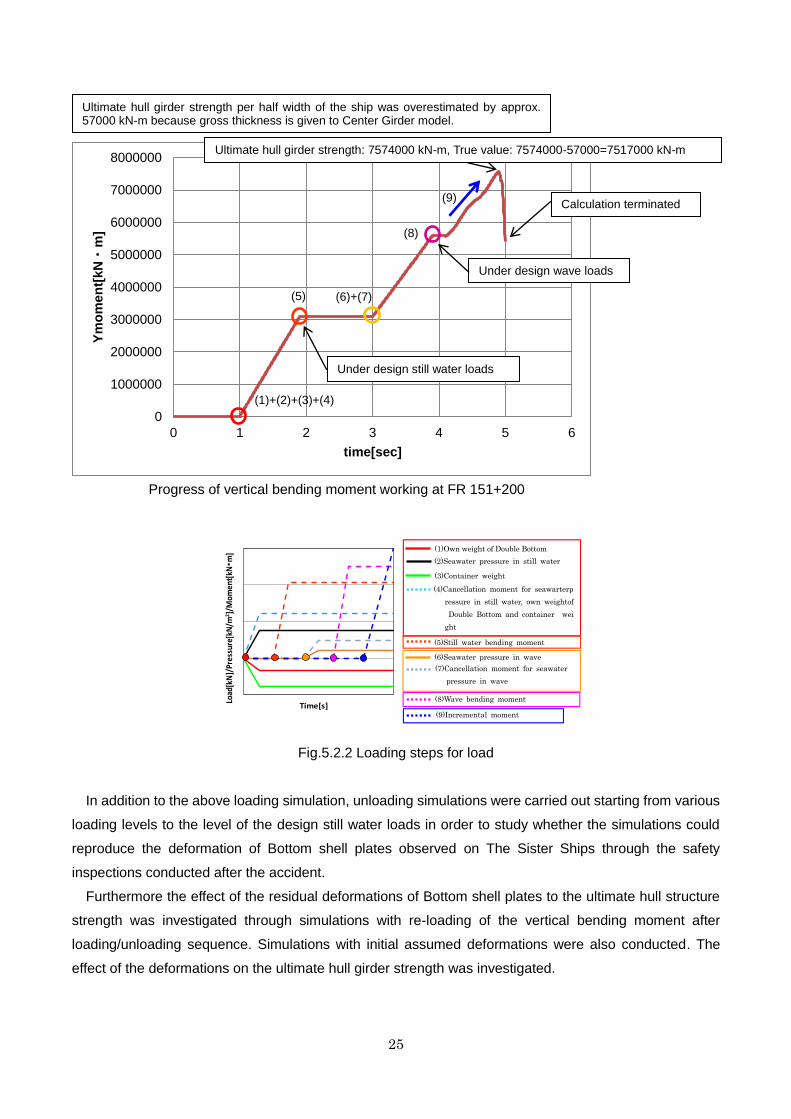
Progress of vertical bending moment working at FR 151+200
Fig.5.2.2 Loading steps for load
In addition to the above loading simulation, unloading simulations were carried out starting from various
loading levels to the level of the design still water loads in order to study whether the simulations could
reproduce the deformation of Bottom shell plates observed on The Sister Ships through the safety
inspections conducted after the accident.
Furthermore the effect of the residual deformations of Bottom shell plates to the ultimate hull structure
strength was investigated through simulations with re-loading of the vertical bending moment after
loading/unloading sequence. Simulations with initial assumed deformations were also conducted. The
effect of the deformations on the ultimate hull girder strength was investigated.
0
1000000
2000000
3000000
4000000
5000000
6000000
7000000
8000000
0 1 2 3 4 5 6
Ym
om
en
t[kN・
m]
time[sec]
Load
[kN
]/Pr
essu
re[k
N/m
2 ]/M
omen
t[kN・m
]
Time[s]
①二重底自重荷重
②静水圧
③コンテナ積載荷重
④自重+静水圧+コンテナ相殺モーメント
⑤静水中許容縦曲げモーメント
⑥波浪変動圧
⑦波浪変動圧相殺モーメント
⑧波浪設計縦曲げモーメント
⑨追加縦曲げモーメント
(1)Own weight of Double Bottom
(2)Seawater pressure in still water
(3)Container weight
(4)Cancellation moment for seawarterp
ressure in still water, own weightof
Double Bottom and container wei
ght
(5)Still water bending moment
(6)Seawater pressure in wave
(7)Cancellation moment for seawater
pressure in wave
(8)Wave bending moment
(9)Incremental moment
(1)+(2)+(3)+(4)
(5) (6)+(7)
(8)
(9)
Ultimate hull girder strength per half width of the ship was overestimated by approx. 57000 kN-m because gross thickness is given to Center Girder model.
Ultimate hull girder strength: 7574000 kN-m, True value: 7574000-57000=7517000 kN-m
Calculation terminated
Under design still water loads
Under design wave loads
26
The hull structure strength simulations concluded that the volume of hull structure strength (ultimate
hull girder strength) located in the range of 14.0×10⁶ kN-m to 15.0 ×10
6 kN-m, which depended on the
conditions of the initial shape imperfections of the simulations, and the hull girder strength (ultimate hull
girder strength) of the ship was considered as 14.0×10⁶ kN-m in the investigation this time (see Table
5.2.1) (Note). This value was considered to be reliable, comparing with the estimated value resulted from
another elasto-plastic analyses of bottom shell stiffened panels.
Table 5.2.1 Hull structure strength (ultimate hull girder strength) with initial shape imperfection assumed in
bottom shell plate (simulation results)
Initial shape imperfection assumed in bottom shell plate Hull structure strength
(Ultimate hull girder strength)
Hungry-horse mode deformation specified in JSQS
standard (max. deformation of 4 mm) 15.0×10
6 kN-m
Bottom plate buckling mode deformation
(4 half-waves with amplitude of 4mm) 14.0×10
6 kN-m
Note: In dynamic analysis by the explicit method, very small vibration components act as triggers leading
to buckling of bottom longitudinals without giving initial shape imperfection. On the other hand,
Hungry horse mode deformations (same direction and symmetric bottom longitudinals) had the
resistance to the buckling occurrence. Therefore by applying explicit method, the hull structure
strength without initial shape imperfection had a value of 14.4×10⁶
kN-m, which was the value
between Hungry-horse mode initial shape imperfection and Bottom plate buckling mode initial
shape imperfection. In case of applying implicit method, it is difficult to create the buckling without
initial shape imperfection, and it can be expected that the strength with Hungry-horse mode initial
imperfection would be less than the strength with no initial shape imperfection. It should be noted
that the present results depended on the characteristics of the explicit method.
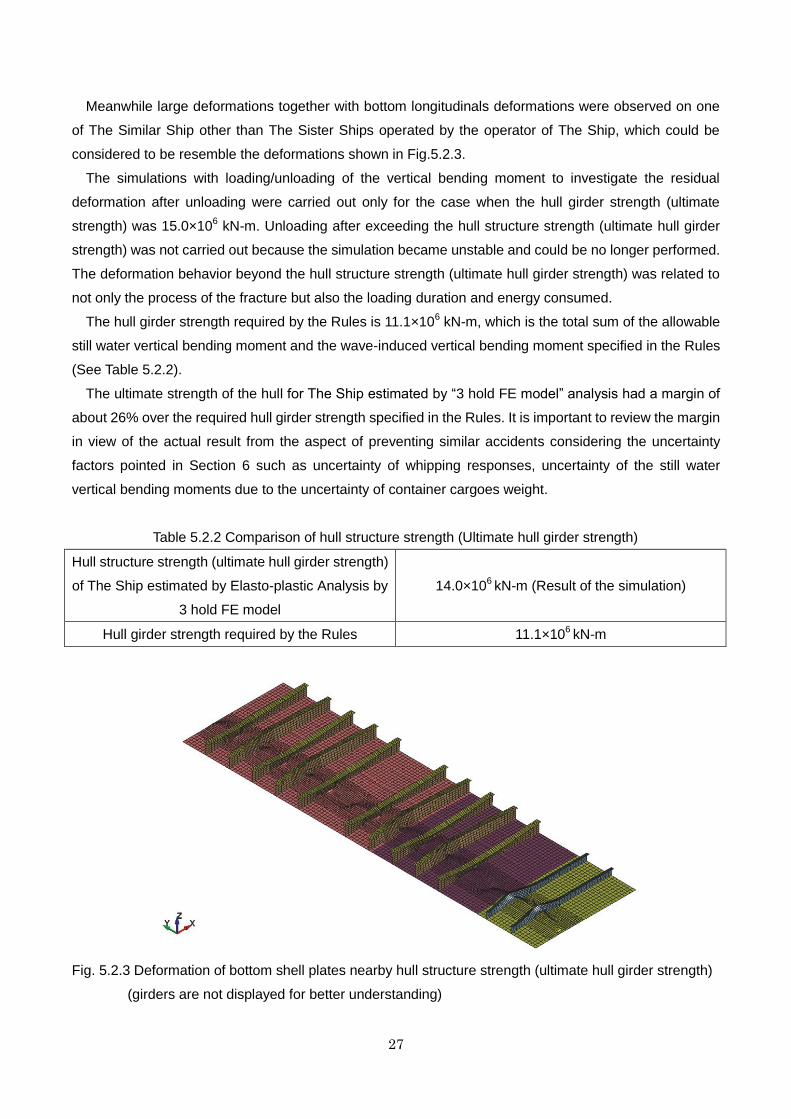
The hull structure strength simulation mentioned in the above showed large scale deformations of
Bottom shell plates on the butt joint along the transverse direction as shown in Fig.5.2.3, which were
different from the buckling deformations (shown in Fig.4.1 and Annex 1) observed on The Sister ships
operated by the same operator of The Ship. Furthermore the amount of the deformation of the hull
structure strength simulation was different from that observed on The Sister Ships, that is to say, the
deformation of the simulation was very small even though the applied moment was close to the hull
structure strength (ultimate hull girder strength) and the simulation could not reproduce the observed
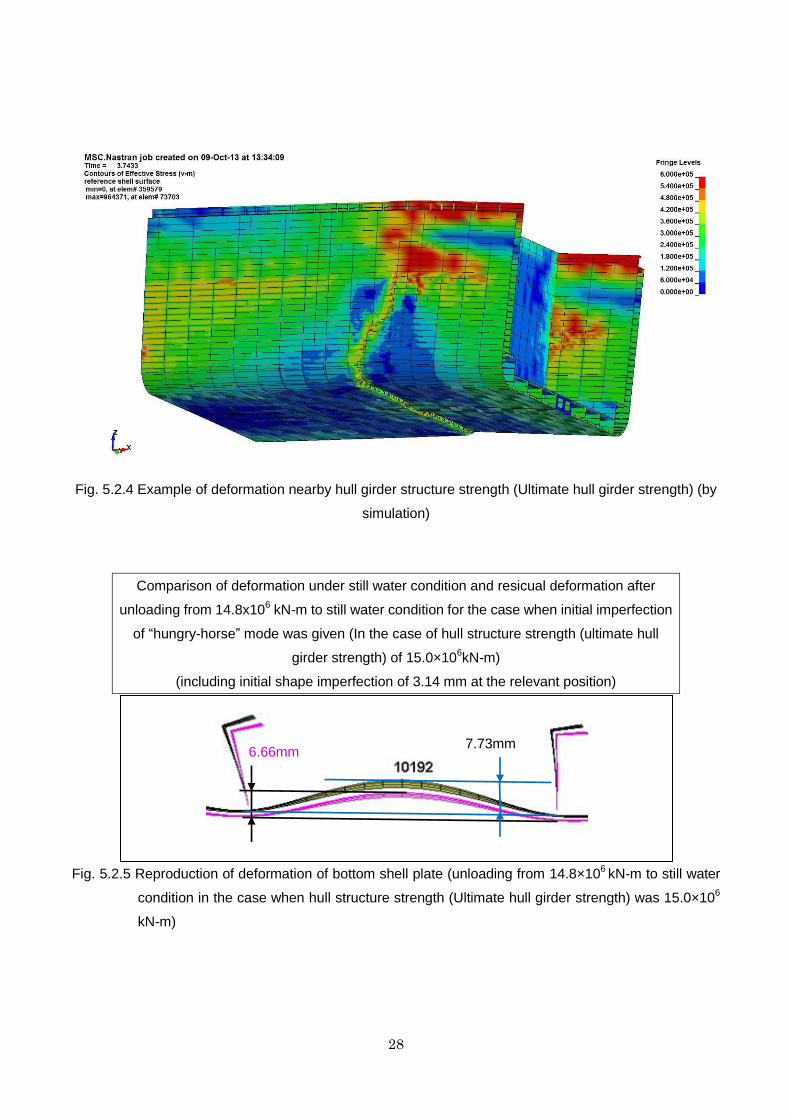
deformations. (As shown in Fig.5.2.5, the residual deformation was 1.07 mm in the case of loading the
vertical bending moment up to 14.8×10⁶ kN-m and unloading the moment to the still water moment in the
case of the hull structure strength (ultimate hull girder strength) being 15.0×10⁶ kN-m.
27
Meanwhile large deformations together with bottom longitudinals deformations were observed on one
of The Similar Ship other than The Sister Ships operated by the operator of The Ship, which could be
considered to be resemble the deformations shown in Fig.5.2.3.
The simulations with loading/unloading of the vertical bending moment to investigate the residual
deformation after unloading were carried out only for the case when the hull girder strength (ultimate
strength) was 15.0×10⁶ kN-m. Unloading after exceeding the hull structure strength (ultimate hull girder
strength) was not carried out because the simulation became unstable and could be no longer performed.
The deformation behavior beyond the hull structure strength (ultimate hull girder strength) was related to
not only the process of the fracture but also the loading duration and energy consumed.
The hull girder strength required by the Rules is 11.1×10⁶ kN-m, which is the total sum of the allowable
still water vertical bending moment and the wave-induced vertical bending moment specified in the Rules
(See Table 5.2.2).
The ultimate strength of the hull for The Ship estimated by “3 hold FE model” analysis had a margin of
about 26% over the required hull girder strength specified in the Rules. It is important to review the margin
in view of the actual result from the aspect of preventing similar accidents considering the uncertainty
factors pointed in Section 6 such as uncertainty of whipping responses, uncertainty of the still water
vertical bending moments due to the uncertainty of container cargoes weight.
Table 5.2.2 Comparison of hull structure strength (Ultimate hull girder strength)
Hull structure strength (ultimate hull girder strength)
of The Ship estimated by Elasto-plastic Analysis by
3 hold FE model
14.0×10⁶ kN-m (Result of the simulation)
Hull girder strength required by the Rules 11.1×10⁶ kN-m
Fig. 5.2.3 Deformation of bottom shell plates nearby hull structure strength (ultimate hull girder strength)
(girders are not displayed for better understanding)
28
Fig. 5.2.4 Example of deformation nearby hull girder structure strength (Ultimate hull girder strength) (by
simulation)
Comparison of deformation under still water condition and resicual deformation after
unloading from 14.8x10⁶ kN-m to still water condition for the case when initial imperfection
of “hungry-horse” mode was given (In the case of hull structure strength (ultimate hull
girder strength) of 15.0×10⁶kN-m)
(including initial shape imperfection of 3.14 mm at the relevant position)
Fig. 5.2.5 Reproduction of deformation of bottom shell plate (unloading from 14.8×10⁶ kN-m to still water
condition in the case when hull structure strength (Ultimate hull girder strength) was 15.0×10⁶
kN-m)
7.73mm 6.66mm
29
5.2.2 Effect of deformation of bottom shell plate on the hull structure strength
Strength simulations with the following initial shape imperfection conditions mentioned in Section
5.1.4(5) were carried out in order to investigate the effects of significant deformation of the bottom shell
plate on the hull structure strength.
Initial shape imperfection of bottom plate referring to the buckling deformations at FR151+200mm
which were observed in The Sister Ships
Local convex/concave deformations of bottom plate located over the full width at the same
transverse section
Simulation conditions excluding initial shape imperfection conditions were the same as those in Section
5.2.1. Although residual stress was considered to exist in the buckling deformations observed in The
Sister Ships, it was ignored in the simulation because it was difficult to accurately reproduce in the
modeling.
(1) Case of initial shape imperfection referring to the buckling deformations observed in The Sister Ships
Deformations of one-half wave mode in the longitudinal direction with amplitude decreasing gradually
from the ship centerline to the ship side along the transverse direction as shown in Fig. 5.2.6 were given
to the bottom shell plate between FR150 and FR154. Lateral buckling and Euler buckling deformations
were given to bottom longitudinals as same as the “JSQS standard" (“Hungry-horse" mode) conditions
mentioned in Section 5.2.1. The initial shape imperfection conditions of locations other than FR150 to
FR154 were the same as the “JSQS standard" (“Hungry- horse" mode) of Section 5.2.1.
In the case of initial shape imperfection referring to the buckling deformations observed in The Sister
Ships, the hull structure strength (ultimate hull girder strength) was 14.9×10⁶ kN-m as shown in Fig. 5.2.7,
which was practically the same as the ultimate hull girder strength of the "JSQS standard"
(“Hungry-horse" mode) of Section 5.2.1. However this was the result of assuming one-half wave mode in
the longitudinal direction, and further investigation of the case where local convex/concave deformations
exist in the longitudinal direction is needed.
30
(((
Fig.5.2.6 Initial shape imperfection referring to deformations observed in The Sister Ships
Progress of vertical bending moment working at FR 151+200
Fig.5.2.7 Loading steps in the case of initial shape imperfection referring to deformations observed in The
Sister Ships
-15
-10
-5
0
5
10
15
20
25
BL-19 BL-17 No.15 SG BL-13 BL-11 No.9 SG BL-7 BL-5 No.3 SG BL-1 BL-1 No.3 SG BL-5 BL-7 No.9 SG BL-11 BL-13 No.15 SG BL-17De
form
atio
n(m
m)
0
1000000
2000000
3000000
4000000
5000000
6000000
7000000
8000000
0 1 2 3 4 5 6
Ym
om
en
t[kN・
m]
time[sec]
( ) indicates observed deformation along the transverse direction nearby Fr.151.
(▬) shows initial shape imperfection amplitude given to bottom shell plate elements of the elasto-plastic FE model.
BL-17 No.15SG BL-13 BL-11 No.9SG BL-7 BL-5 No.3SG BL-1 C.L. BL-1 No.3SG BL-5 BL-7 No.9SG BL-11 BL-13 No.15SG BL-17
JSQS Standard (4mm)
outside No.15 SG
Linear between BL-1
and No.15 SG
20mm between BL-1
and Centerline 6mm between BL-14
and No.15 SG
Ultimate hull girder strength per half width of the ship was overestimated by approx. 57,000 kN-m because gross thickness is given to Center Girder model.
Ultimate hull girder strength: 7,537,000 kN-m, True value: 7,537,000-57,000=7,480,000 kN-m
Calculation terminated
Under design wave loads
Under design still water loads
(1)+(2)+(3)+(4)
(5) (6)+(7)
(8)
(9)
31
(2) Case of local convex/concave deformations of Bottom plate located over the full width
In order to investigate the effects of deformations on the hull structure strength (ultimate hull girder
strength), structure simulation with the local circular-shaped deformations (max. deformation 30mm) on
either side of the butt joint was conducted as an extreme case. The local deformations were located
between FR150 and FR154 over full width of the ship in the transverse direction as shown in Fig. 5.2.8.
Buckling mode deformation (4 half-waves with single amplitude of 4 mm) was given to the bottom shell
plates in areas outside FR150 to FR154. Lateral buckling and Euler buckling deformations of “JSQS
standard" (“Hungry-horse” mode) of Section 5.2.1 were given bottom longitudinals.
The results of simulation gave hull structure strength (ultimate hull girder strength) as 13.4×10⁶ kN-m,
which shows that the hull structure strength became lower than the analyzed results mentioned in Section
5.2.1. This simulation assumed an extreme case of 30mm local deformations existing over the full width in
the transverse direction. However, if such local deformations exist continuously along the transverse
direction, the ultimate hull girder strength may show a tendency to be decreased.
To study the trend of reduction in hull structure strength (ultimate hull girder strength) due to this
deformation shape, it is necessary to apply appropriate initial shape imperfections and deformation
pattern such as of “Hungry- horse” mode and the buckling mode, compare the conditions of occurrence of
deformations in the first place and the loads acting on the hull, and clarify the reproducibility of the
deformation observed in The Sister Ships by simulation.
Fig.5.2.8 Case in which local circular deformation existed over the full width in the transverse direction
850 850
Initial shape imperfection (Circular-shape deformation)
(Length: 850mm / all directions: convex/concave)
(Maximum deformation: 30mm from the center of circle)
Butt joint
Floor Floor
B.Long.
B.Long.
B.Long.
B.Long.
B.Long.
B.Long.
32
With regard to deformation pattern, out-of-plane of plate panel due to uni-axial thrust in the longitudinal
direction and out-of-plane deformation of panel due to bi-axial thrust in the longitudinal and transverse
directions must be considered. Out-of-plane deformation of the plate panel is also affected by the aspect
ratio, therefore, the conditions of occurrence of deformation must be studied and confirmed.
5.3 Consideration of Possibility of Fatigue Cracks
The possibility of fatigue crack occurrence and its effects were investigated in addition to evaluation of
hull structure strength, inclusive of the perspective of local phenomena that could be related to the
fracture. More specifically, crossing part of butt joint on the bottom shell plates and bottom longitudinals
was investigated referring to Fig.4.1 and Fig.4.3. The investigation was made on fatigue cracks at the butt
joint welding beads and fillet welding toes of scallops (openings to pass through welding beads of butt
joints) on the bottom shell plate. In both investigations, two cases with and without deformations of bottom
shell plate were considered.
On-destructive inspections to detect cracks in way of butt joint welding beads on bottom shell plate near
FR151 were carried out by the Shipbuilder on The Sister Ships operated by the same operator as The
Ship. The results showed no defect (see Annex 4).
Possibility of initial of fatigue cracks
In order to evaluate the stress working in the bottom shell with out-of-plane deformation, stress
evaluations were conducted by a simple plate model with an initial circular deformation which has a
maximum height of 20mm (see Fig.5.3.1).
Stresses working in the bottom shell plate are defined by referring to the values of hull girder vertical
bending stress specified in the Rules (equivalent to 11.1×10⁶ kN-m of hull structure strength simulation
which is inclusive of dynamic component due to wave loads). (see Fig.5.3.2)
Fig.5.3.1 Investigation of fatigue crack initial by simple plate model
Out of plane Deformation
Bottom Shell Plate
Floor Floor
B.Longl.
B.Longl.
B.Longl.
Out of plane
Deformation
Out of plane
Deformation
33
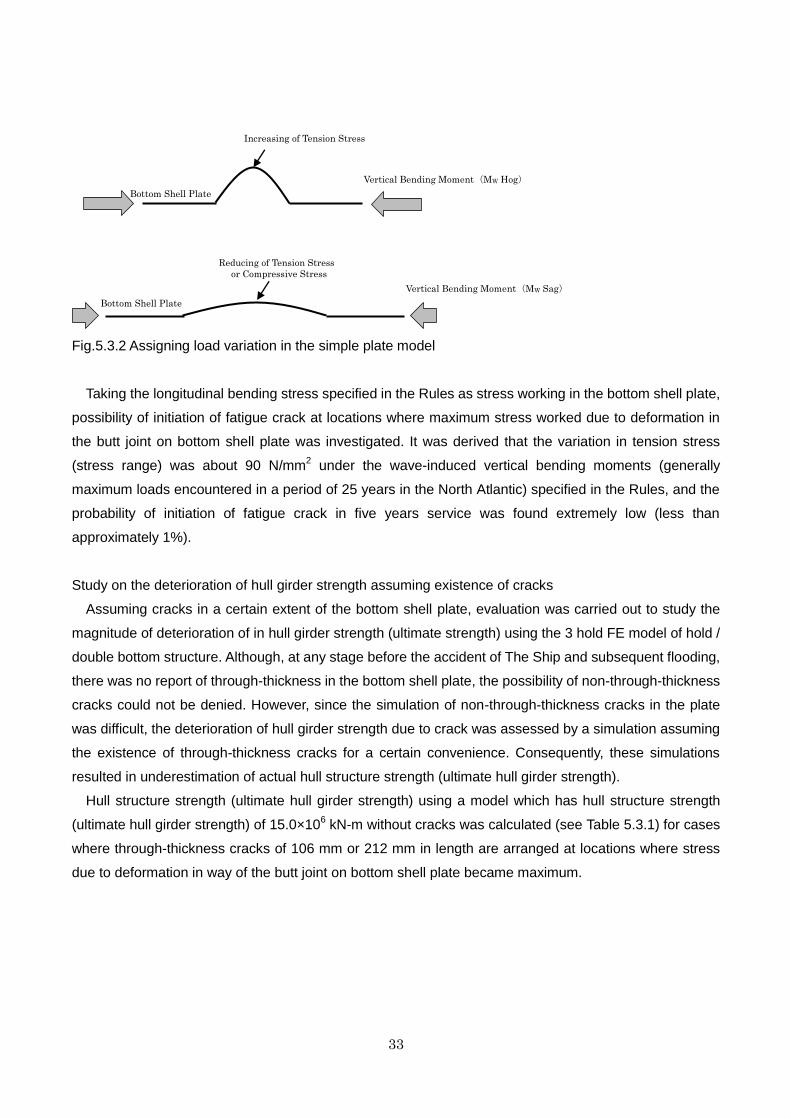
Fig.5.3.2 Assigning load variation in the simple plate model
Taking the longitudinal bending stress specified in the Rules as stress working in the bottom shell plate,
possibility of initiation of fatigue crack at locations where maximum stress worked due to deformation in
the butt joint on bottom shell plate was investigated. It was derived that the variation in tension stress
(stress range) was about 90 N/mm2 under the wave-induced vertical bending moments (generally
maximum loads encountered in a period of 25 years in the North Atlantic) specified in the Rules, and the
probability of initiation of fatigue crack in five years service was found extremely low (less than
approximately 1%).
Study on the deterioration of hull girder strength assuming existence of cracks
Assuming cracks in a certain extent of the bottom shell plate, evaluation was carried out to study the
magnitude of deterioration of in hull girder strength (ultimate strength) using the 3 hold FE model of hold /
double bottom structure. Although, at any stage before the accident of The Ship and subsequent flooding,
there was no report of through-thickness in the bottom shell plate, the possibility of non-through-thickness
cracks could not be denied. However, since the simulation of non-through-thickness cracks in the plate
was difficult, the deterioration of hull girder strength due to crack was assessed by a simulation assuming
the existence of through-thickness cracks for a certain convenience. Consequently, these simulations
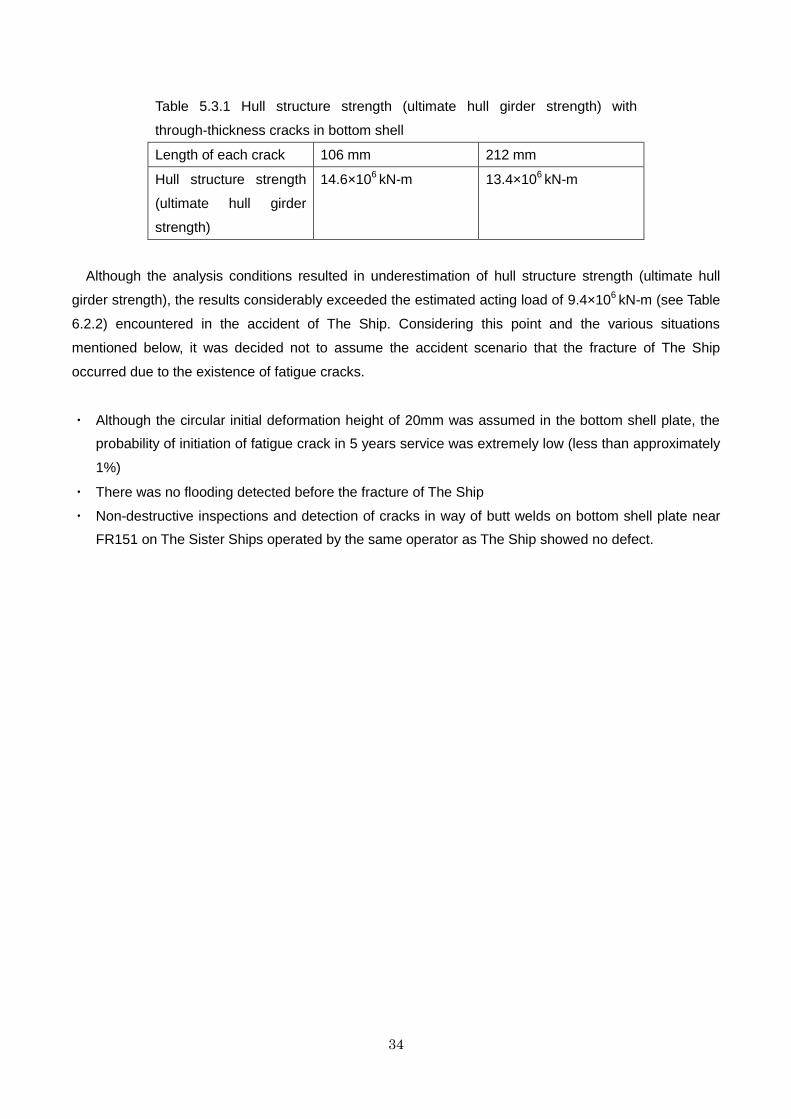
resulted in underestimation of actual hull structure strength (ultimate hull girder strength).
Hull structure strength (ultimate hull girder strength) using a model which has hull structure strength
(ultimate hull girder strength) of 15.0×10⁶ kN-m without cracks was calculated (see Table 5.3.1) for cases
where through-thickness cracks of 106 mm or 212 mm in length are arranged at locations where stress
due to deformation in way of the butt joint on bottom shell plate became maximum.
Bottom Shell Plate
Increasing of Tension Stress
Vertical Bending Moment(MW Hog)
Reducing of Tension Stress
or Compressive Stress
Vertical Bending Moment(MW Sag)
Bottom Shell Plate
34
Table 5.3.1 Hull structure strength (ultimate hull girder strength) with
through-thickness cracks in bottom shell
Length of each crack 106 mm 212 mm
Hull structure strength
(ultimate hull girder
strength)
14.6×10⁶ kN-m 13.4×10
6 kN-m
Although the analysis conditions resulted in underestimation of hull structure strength (ultimate hull
girder strength), the results considerably exceeded the estimated acting load of 9.4×10⁶ kN-m (see Table
6.2.2) encountered in the accident of The Ship. Considering this point and the various situations
mentioned below, it was decided not to assume the accident scenario that the fracture of The Ship
occurred due to the existence of fatigue cracks.
・ Although the circular initial deformation height of 20mm was assumed in the bottom shell plate, the
probability of initiation of fatigue crack in 5 years service was extremely low (less than approximately
1%)
・ There was no flooding detected before the fracture of The Ship
・ Non-destructive inspections and detection of cracks in way of butt welds on bottom shell plate near
FR151 on The Sister Ships operated by the same operator as The Ship showed no defect.
35
6. Estimation of Acting Loads
The load that acted on The Ship under the actual sea conditions, and the cargo loading conditions were
investigated.
6.1 Clarification of Sea State Data based on the wave data
The statement related to the accident, provided by the Bahamas as Flag State at the 92nd meeting of
the IMO/MSC in June 2013, said “high winds and sea conditions which were estimated to be of the order
of 5-6 m wave height. The ship was hit by an abnormal large wave which resulted in water ingress into
one cargo hold and several tank spaces.” (in Annex 46 of MSC 92/26/Add.3). For collection of the sea
state data to be used in the simulation of loads acting on The Ship batch data was acquired for the
relevant period from two private data sources. These data sets are known to include errors in significant
wave heights from 0.5 m to 2.0 m approximately and in average wave periods from 0.5 to 2.0 seconds
approximately (See Annex 5).
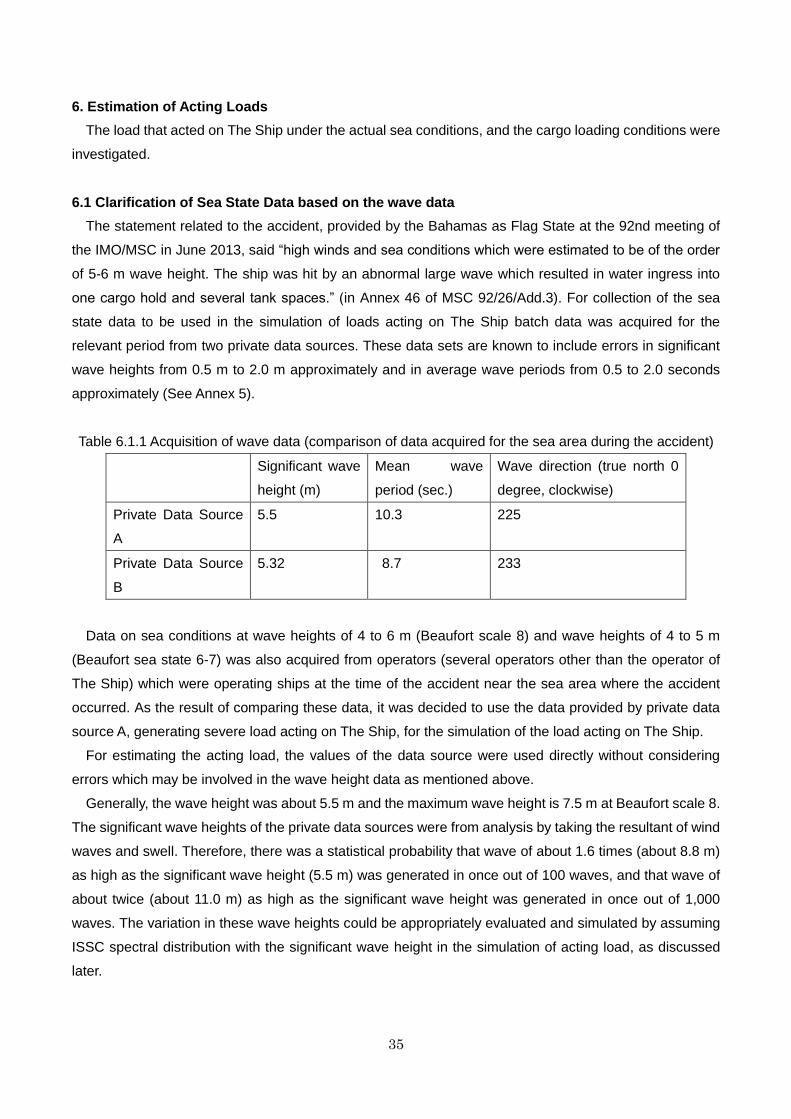
Table 6.1.1 Acquisition of wave data (comparison of data acquired for the sea area during the accident)
Significant wave
height (m)
Mean wave
period (sec.)
Wave direction (true north 0
degree, clockwise)
Private Data Source
A
5.5 10.3 225
Private Data Source
B
5.32 8.7 233
Data on sea conditions at wave heights of 4 to 6 m (Beaufort scale 8) and wave heights of 4 to 5 m
(Beaufort sea state 6-7) was also acquired from operators (several operators other than the operator of
The Ship) which were operating ships at the time of the accident near the sea area where the accident
occurred. As the result of comparing these data, it was decided to use the data provided by private data
source A, generating severe load acting on The Ship, for the simulation of the load acting on The Ship.
For estimating the acting load, the values of the data source were used directly without considering
errors which may be involved in the wave height data as mentioned above.
Generally, the wave height was about 5.5 m and the maximum wave height is 7.5 m at Beaufort scale 8.
The significant wave heights of the private data sources were from analysis by taking the resultant of wind
waves and swell. Therefore, there was a statistical probability that wave of about 1.6 times (about 8.8 m)
as high as the significant wave height (5.5 m) was generated in once out of 100 waves, and that wave of
about twice (about 11.0 m) as high as the significant wave height was generated in once out of 1,000
waves. The variation in these wave heights could be appropriately evaluated and simulated by assuming
ISSC spectral distribution with the significant wave height in the simulation of acting load, as discussed
later.
36
6.2 Estimation of Acting Load
6.2.1 Overview
To study the safety measures while estimating causes of the accident, assumptions must be made for
hull girder strength focusing on the midship double bottom based on photos of the MOL Comfort accident
and safety inspections of The Sister Ships, and for acting load with the focus on sea conditions. Based on
the comparisons, the conditions that may have led to the fracture must be estimated.
Explanations on calculation tools used to calculate acting load are given later.
Input data necessary for calculating acting load include variable data such as significant wave height,
wave direction, wave period, ship speed, ballast weight and cargo weight besides the hull form data.
Three cases were assumed for variable data: data during the fracture in the Indian Ocean, the maximum
significant wave height after docking (December 2012) and the maximum significant wave height since
coming into service.
6.2.2 Calculation Method
The non-linear strip method NMRIW (Nonlinear Motion in Regular and Irregular Waves) developed and
owned by the National Maritime Research Institute was used for calculations. This is a time domain
analysis method based on the non-linear strip method, and Non-linearity (shape) corresponding to wave
height is considered by calculating the buoyant force, Froude-Krylov force, radiation fluid force and
diffraction fluid force based on the submerged part in each time step. Calculations considering impact
force are also performed based on the potential of each time step and the time variation in fluid force.
Moreover, vertical bending vibration (two-node and three-node vibrations) of the hull can be calculated
based on the hull beam theory.
Analysis results gained from the comparisons between towing tank tests and relevant programs using
this method have been published in international journals and announced at international conferences.
Benchmark calculations carried out by the International Towing Tank Conference (ITTC) in 2010 and
benchmark calculations used in the research project (P27, 2010-2012) of the Japan Society of Naval
Architects and Ocean Engineers have been carried out using the NMRIW method, verifying that this
method can provide robust calculations as well as clear explanations of the experimental findings
6.2.3 Calculation Conditions
The load acting on the hull was estimated for the following three cases mentioned below according to
the ship speed, sea conditions encountered by The Ship through the period in service until the time of the
accident.
A. At the time of the accident,
B. Sea conditions in which the wave height was maximum as observed after surveys by the
Classification Society, and
C. Sea conditions in which the wave height was maximum as observed in The Ship.
37
Table 6.2.1 shows sea conditions for these three cases. According to the data of sea conditions, The
Ship was generally operating in calm sea conditions at times other than these three cases.
Table 6.2.1 Assumed sea conditions
Ship
speed
(knots)
Significant
wave
height
(m)
Mean
wave
period
(sec.)
Wave direction
(degree,
Relative to bow,
clockwise positive)
A: At the time of the
fracture in the Indian
Ocean
17.0 5.5 10.3 -66
(before port side heel)
B: When significant
wave height was at
maximum after entering
dry-dock
13.8 6.4 15.1 +107
(after starboard heel)
C: When significant
wave height was
maximum after ship in
service
13.0 7.1 11.3 +01
(head seas)
Short-term sea state in the assumed sea condition, which is, two-hour long crested irregular waves
were reproduced numerically, and time domain analysis for wave loads was carried out. The phases of
the component waves constituting irregular waves were generated by random numbers. For each sea
state, time domain analysis was carried out ten times based on the combination of ten types of phases.
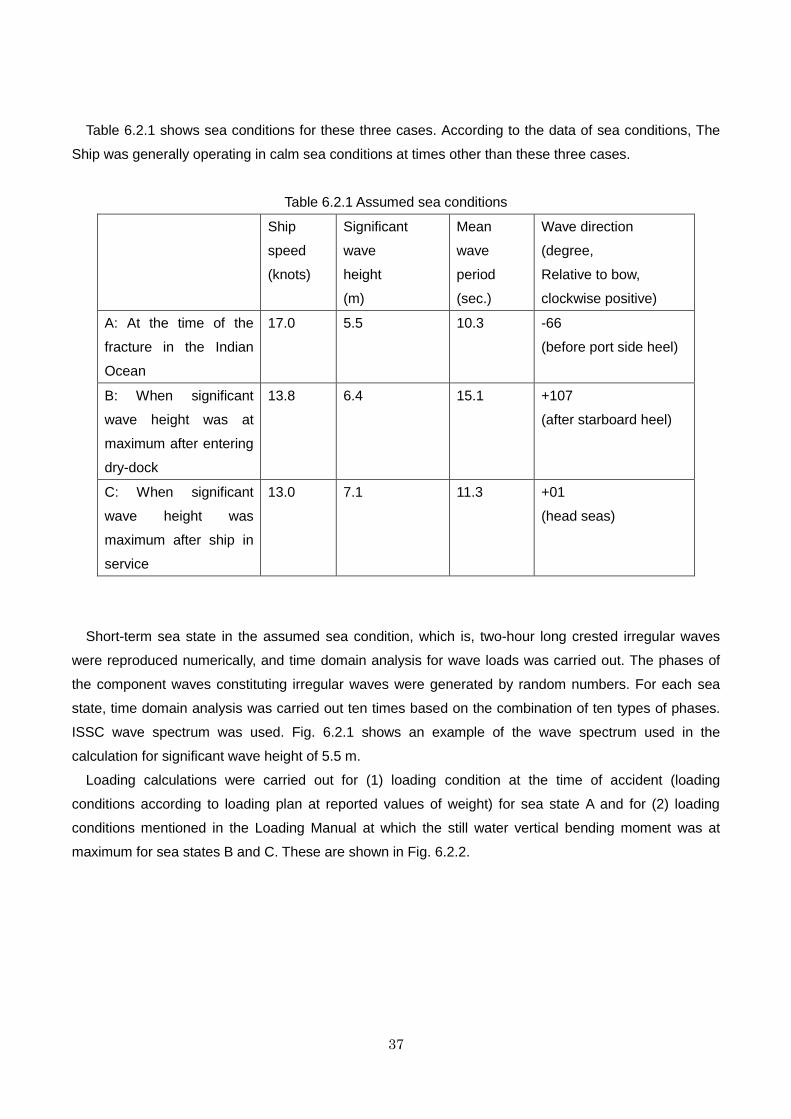
ISSC wave spectrum was used. Fig. 6.2.1 shows an example of the wave spectrum used in the
calculation for significant wave height of 5.5 m.
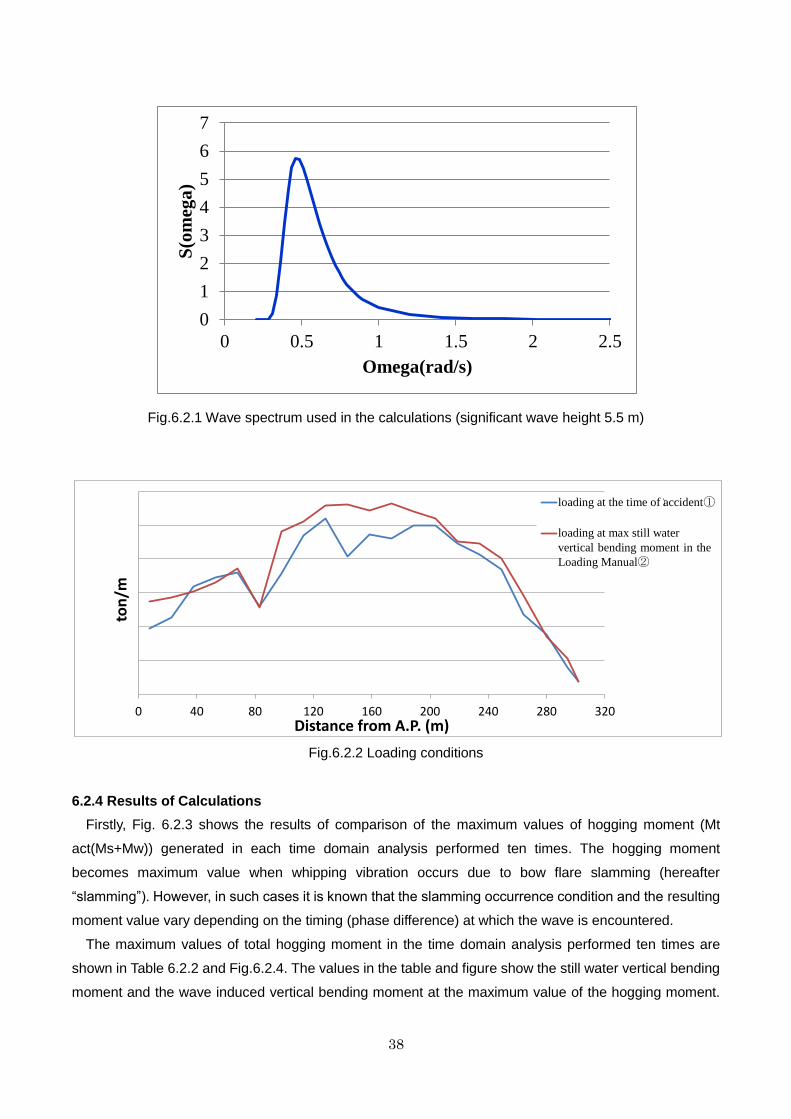
Loading calculations were carried out for (1) loading condition at the time of accident (loading
conditions according to loading plan at reported values of weight) for sea state A and for (2) loading
conditions mentioned in the Loading Manual at which the still water vertical bending moment was at
maximum for sea states B and C. These are shown in Fig. 6.2.2.
38
Fig.6.2.1 Wave spectrum used in the calculations (significant wave height 5.5 m)
Fig.6.2.2 Loading conditions
6.2.4 Results of Calculations
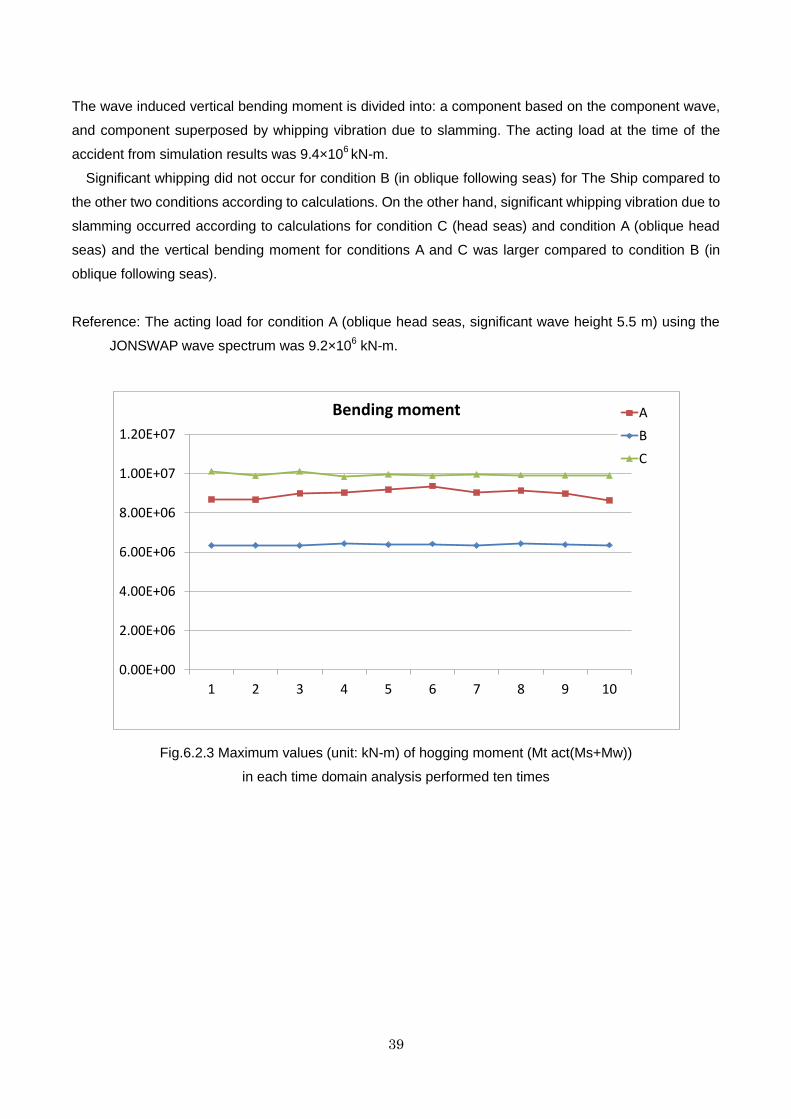
Firstly, Fig. 6.2.3 shows the results of comparison of the maximum values of hogging moment (Mt
act(Ms+Mw)) generated in each time domain analysis performed ten times. The hogging moment
becomes maximum value when whipping vibration occurs due to bow flare slamming (hereafter
“slamming”). However, in such cases it is known that the slamming occurrence condition and the resulting
moment value vary depending on the timing (phase difference) at which the wave is encountered.
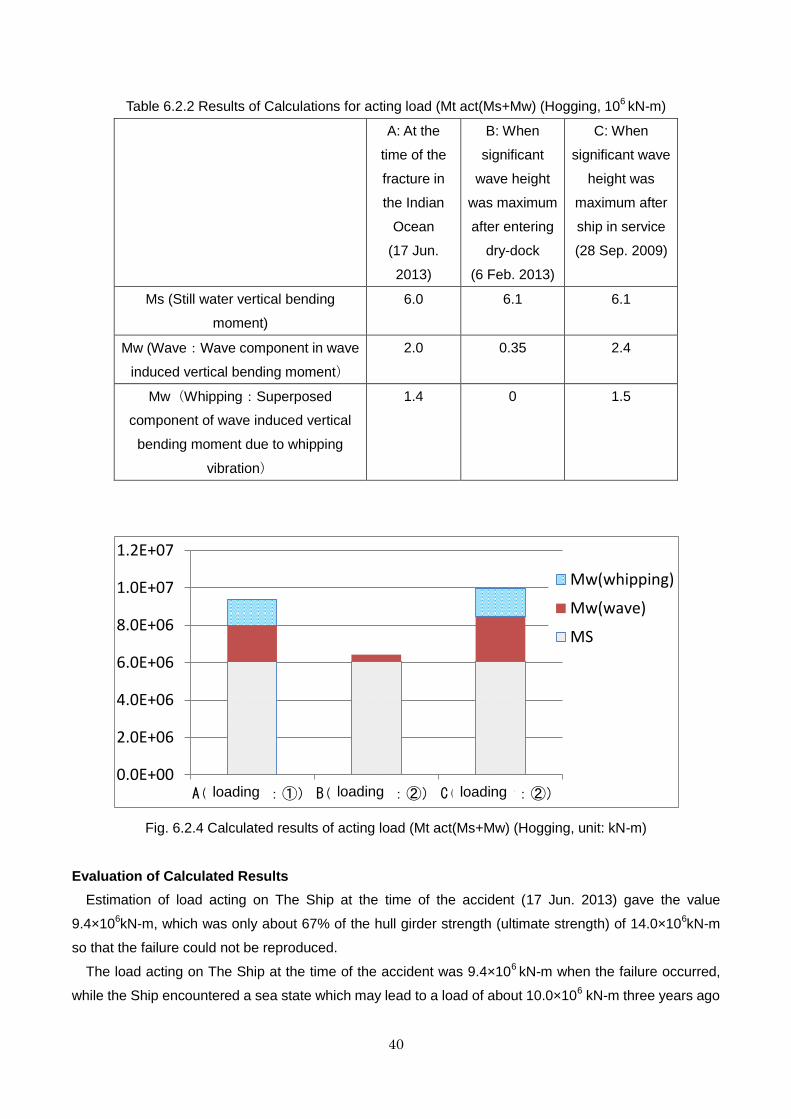
The maximum values of total hogging moment in the time domain analysis performed ten times are
shown in Table 6.2.2 and Fig.6.2.4. The values in the table and figure show the still water vertical bending
moment and the wave induced vertical bending moment at the maximum value of the hogging moment.
0
1
2
3
4
5
6
7
0 0.5 1 1.5 2 2.5
S(o
meg
a)
Omega(rad/s)
0 40 80 120 160 200 240 280 320
ton
/m
Distance from A.P. (m)
事故直前積み付け①
積み付け計算書のうち,静水
曲げモーメント最大②
loading at the time of accident①
loading at max still water
vertical bending moment in the
Loading Manual②
39
The wave induced vertical bending moment is divided into: a component based on the component wave,
and component superposed by whipping vibration due to slamming. The acting load at the time of the
accident from simulation results was 9.4×10⁶ kN-m.
Significant whipping did not occur for condition B (in oblique following seas) for The Ship compared to
the other two conditions according to calculations. On the other hand, significant whipping vibration due to
slamming occurred according to calculations for condition C (head seas) and condition A (oblique head
seas) and the vertical bending moment for conditions A and C was larger compared to condition B (in
oblique following seas).
Reference: The acting load for condition A (oblique head seas, significant wave height 5.5 m) using the
JONSWAP wave spectrum was 9.2×10⁶ kN-m.
Fig.6.2.3 Maximum values (unit: kN-m) of hogging moment (Mt act(Ms+Mw))
in each time domain analysis performed ten times
0.00E+00
2.00E+06
4.00E+06
6.00E+06
8.00E+06
1.00E+07
1.20E+07
1 2 3 4 5 6 7 8 9 10
試行回数
Bending moment A
B
C
Number of trial
40
Table 6.2.2 Results of Calculations for acting load (Mt act(Ms+Mw) (Hogging, 106 kN-m)
A: At the
time of the
fracture in
the Indian
Ocean
(17 Jun.
2013)
B: When
significant
wave height
was maximum
after entering
dry-dock
(6 Feb. 2013)
C: When
significant wave
height was
maximum after
ship in service
(28 Sep. 2009)
Ms (Still water vertical bending
moment)
6.0 6.1 6.1
Mw (Wave:Wave component in wave
induced vertical bending moment)
2.0 0.35 2.4
Mw(Whipping:Superposed
component of wave induced vertical
bending moment due to whipping
vibration)
1.4 0 1.5
Fig. 6.2.4 Calculated results of acting load (Mt act(Ms+Mw) (Hogging, unit: kN-m)
Evaluation of Calculated Results
Estimation of load acting on The Ship at the time of the accident (17 Jun. 2013) gave the value
9.4×10⁶kN-m, which was only about 67% of the hull girder strength (ultimate strength) of 14.0×10
6kN-m
so that the failure could not be reproduced.
The load acting on The Ship at the time of the accident was 9.4×10⁶ kN-m when the failure occurred,
while the Ship encountered a sea state which may lead to a load of about 10.0×10⁶ kN-m three years ago
0.0E+00
2.0E+06
4.0E+06
6.0E+06
8.0E+06
1.0E+07
1.2E+07
A(積み付け:①) B(積み付け:②) C(積み付け:②)
Mw(whipping)
Mw(wave)
MS
loading loading loading
41
without failure. From these results, following possibilities may exist (1) the real loads acting on the hull at
the time of the accident exceeded the estimation; (2) the Ship's hull girder strength had been reduced due
to possible presence of residual buckling deformations on the bottom shell plates or any other reasons; or
(3) the both combined. Thus, it is necessary to conduct further verification of both load and strength
related simulations, taking into consideration of the effect of the uncertain factors in the simulations.
It was clarified that deformations of approximately 20mm were found on the bottom shell plates during
the safety inspections of The Sister Ships. However, the deformations could not be simulated even when
loads very close to the ultimate hull girder strength were applied. Furthermore, some buckling
deformations of the bottom shell plates of The Ship had been found even though she is presumed not
have encountered loads close to her hull strength. Based on these findings it is necessary to clarify the
mechanism of the buckling deformations by both full-scale stress measurements of actual ships and
numerical simulations.
As it was ascertained that uncertain factors existed in both the simulation of the hull girder strength and
the simulation of load acting on the hull or in either of the two simulations, it is necessary to validate the
reproduction of the events caused by these simulations with actual measurements of loads acting on the
hull and stress in the hull henceforth.
Uncertain factors, such as errors related to simulation of acting load, are studied in Section 6.3.
Simulations carried out on one of The 4 Similar Ships other than The 6 Sister Ships being operated by
the operator of The Ship showed that the load acting on the hull was 14.1×10⁶ kN-m when the mean wave
period was assumed as 12 seconds at head seas (mean wave period not known) of significant wave
height of 10-12 m encountered by the ship travelling at a speed of 14 knots. The acting load may
sometimes exceed the hull girder strength (ultimate strength 14.0×10⁶
kN-m), depending on the sea
conditions. Weather routing and speed reduction are necessary in rough seas.
Hull girder strength simulations and simulations of the load acting on the hull were carried out on The
Ship, however, deformation has not been observed in large container ships with structural design that
differs from that of The Ship during safety inspections of the bottom shell plates. Although it is necessary
to examine and compare structural rules of the Classification Society to prevent the fractures and similar
events, hull girder strength, simulations of load acting on the ship and actual stress measurements of
acting load must be carried out for large container ships of structural design different from that of The Ship,
in addition to actual stress measurements of acting load on The Sister Ships to The Ship. The scope of
development for structural rules of the classification society must be also studied.
6.2.5 Variation in the Acting Load due to Sea Conditions
Sea conditions assumed in Table 6.2.1 were varied and acting loads were calculated in order to
understand the trend of effects of the changes in sea conditions on the loads acting on the hull. Table
6.2.3 shows the assumed sea conditions. The underlined conditions in the table are conditions that are
42
different from those in Table 6.2.1. Here, significant wave height of 3 m was added after fixing the ship
speed at 17 knots and wave direction at head seas. Table 6.2.4 and Fig.6.2.5 show the calculation results
of acting load. These results show the maximum values of each case calculated ten times similar to
Fig.6.2.3.
Table 6.2.3 Assumed sea conditions
Ship speed (knots) Significant wave
height (m)
Mean wave period
(seconds)
Wave direction
Condition A’ 17.0 8.5 10.3 Head seas
Condition B’ 17.0 9.4 15.1 Head seas
Condition C’ 17.0 10.1 11.3 Head seas
Table 6.2.4 Calculated results of acting load (Hogging, 106 kN-m)
Condition A’ Condition B’ Condition C’
Ms (Still water vertical bending moment) 6.0 6.1 6.1
Mw (Wave:Wave component in wave
induced vertical bending moment)
3.4 3.8 3.5
Mw (Whipping:Superposed component
of wave induced vertical bending
moment due to whipping vibration)
1.4 1.4 1.6
Fig. 6.2.5 Calculation of acting load (Hogging, 106kN-m)
Comparison of Conditions B’ and C’ shows that although the wave height for Condition B’ was lower,
43
the acting load calculated was slightly higher. This is attributed to the sea conditions in which vertical load
was higher in sea conditions close to the wave period (about 14 seconds) where the wave length was
roughly 300 m, almost equivalent to the ship’s length. The load is 11.3 ×10⁶
kN-m, and this value is
equivalent to 11.1×10⁶ k N-m, the strength required in the classification society rules given in Table 5.2.2.
Even when sea conditions, that is, the wave height is not radically high, depending on the combination of
the wave period and ship speed, the superposition of the load from ship motions and the load from hull
vibrations (whipping load) due to slamming impact can contribute significantly to the load acting on the
hull. Thus, evaluation and validation are necessary from the perspective of hull construction rules.
6.3 Consideration of accuracy for Estimated Load and the effect of cargo weight
The accuracy in the simulation of acting load in itself, the effects of errors in the significant wave height
and mean wave period included in the input data for simulation, and the difference in the reported values
of weight and loading plan of container cargo and the actual weight and loading (effects of loading) are
considered as factors that cause errors in the estimated values by simulation of acting load.
Instances of evaluation making use of time domain analysis have been increasing in recent years so
that whipping loads can be considered in the simulation instead of the conventional linear calculation
methods in the frequency range. Four calculation programs (T. Fukasawa et al, 2012) used in major
institutions in Japan were examined at the research project P27 by the Japan Society of Naval Architects
and Ocean Engineers. The four calculation programs that include NMRIW used by the committee recently
gave consistent results on the simulation of ship motions and bending moment due to waves. However,
the simulation results of whipping load showed significant variation.
Analysis of the slamming phenomenon that causes whipping loads is not easy, although many
mathematical models that express whipping load exist. Therefore, such an analysis has not been
adequately established as of today. Although many research examples within and outside Japan have
shown that the present calculation methods are practical based on the comparison of towing tank tests
and calculations (for instance, Y. Ogawa et al, 2012), further research is necessary to clarify the
phenomena in the actual plying area.
The combination of phases of component waves generated in the time domain analysis considering
similar whipping loads is also important. Generally, the spectrum is divided into 50 to 100 parts, and
calculations are carried out to generate component waves. For this purpose, even for merely combining
the wave components, 50 to 100 factorials may be necessary. It is impractical to simulate such a large
volume of combinations. However, it is necessary to take precautions against errors in the calculated
results obtained by combining phases of these component waves.
Moreover, while waves in the actual plying area are short crested irregular waves, towing tank tests and
simulations are carried out using long crested irregular waves. This could be a cause of errors.
Furthermore, the two component waves, namely wind waves and swell often strike the ship from different
+directions in the actual plying area. The evaluation of load and structural strength when the ship
encounters these types of two-directional waves has not been adequately investigated as of yet.
44
6.3.1 Effects of Loading
While there have been debates at the International Maritime Organization (IMO) related to enforcement
of container weight verification prior to loading, the container cargoes on The Ship were lost when it sank.
Therefore, the actual weight of cargo in each container and its loading position cannot be verified. Data
was collected in order to understand the trend of the relationship between the estimated hull deflection
from measured draught values and the still water vertical bending moment, including data of The Sister
Ships so as to study the effects of loading of container cargoes.
Study for The Ship
The deflection of the hull obtained by reading the measured draught values was 0.63 m at the time of
departure of The Ship before the accident. The still water vertical bending moment estimated using the
loading calculator when the container cargoes were loaded in accordance with the declared container
weights and loading plan was 103% of the allowable design value. On the other hand, the still water
bending moment estimated by direct calculation using full-ship FEM model for hull deflection (0.63 m) was
126% of the allowable value. (If the effect of buoyant force due to deflection was considered, the result
obtained was 118% of the allowable value.) The considerations below were made with regard to the
relationship among cargo weight, hull deflection, and still water vertical bending moment.
Firstly, the difference in magnitude of the loaded weight of container cargoes from the declared value
was calculated so as to reach the still water bending moment to 126% of the allowable value. The results
of the calculation showed that when the total cargo weight was the same as the declared total weight, if
the weight near amidships was reduced by 14%, the weight near the stern and near the bow was each
increased by 13%, then the still water vertical bending moment became equal to 126% of the allowable
value (see Fig.6.3.1). On the other hand, there was also the viewpoint that it was difficult to imagine that
the actual loading on The Ship was considerably different from the declared cargo weight and the loading
plan. The actual loading in The Ship could not be verified due to the sinking. Moreover, there could be
errors in draught measurements, and effects of heeling of the ship, therefore, investigations and validation
studies using The Sister Ships are necessary henceforth.
45
Fig. 6.3.1 Example of loading at which the still water vertical bending moment became 126% of allowable
value
For reference, if hull deflection of 0.55m was occurred at draught reading, the value of still water vertical
bending moment, obtained from direct calculation by full-ship FEM model, becomes 115% of allowable
value. In order to become the still water bending moment 115% of the allowable value, a decrease of 7%
in weight near the midship, an increase of 5% at the aft, and an increase of 7% at the forward part were
necessary based on the results of studies (see Fig.6.3.2). When the cargo weight was increased
uniformly by 5%, the increase in still water bending moment became 1.2%; when it was increased
uniformly by 10%, the increase in still water bending moment became 2.4%.
Fig. 6.3.2 Example of loading at which still water vertical bending moment becomes 115% of allowable
value
If the acting load was simulated when the cargo weight and loading are as in Fig.6.3.1 and Fig.6.3.2,
then the acting load was simulated as shown in Table 6.3.1.
Table 6.3.1 Calculated results of acting load (Hogging, 106 kN-m)
A: At the time of the fracture
in the Indian Ocean
B: When significant wave
height was maximum after
the dry-dock
C: When significant wave
height was maximum after
ship in service
Fig.6.3.1 10.4 8.1 11.1
Fig.6.3.2 10.1 7.5 10.5
Analysis of still water vertical bending moment and hull deflection in actual ship using The Sister
Ships
The still water vertical bending moment and hull deflection in an actual ship were analyzed using The
++14% +13% -14%
+5% -7% ++7%
46
Sister Ships. The still water vertical bending moments which are blue plotted points in Fig.6.3.3 are
values calculated by the loading calculator when the declared container cargo weights are loaded
according to the loading plan. Hull deflection values have been calculated from draught measurement of
forward, midship and aft draught marks.
According to the blue plotted points, hull deflection values found large differences between almost
same still water vertical bending moments, and it can be expected that the cause is the difference in
declared and actual cargo weight. Therefore, draught measurement at different ballast conditions, i.e.
lightest and heavy ballast conditions on the same ship, was carried out, and the results were plotted by
green point. For the sake of comparison, the hull deflections were calculated from the full-ship FEM model
for still water bending moments corresponding to green plotted points and the results were plotted by the
red points. Since ballast weight can be accurately determined from tank soundings, the difference
between green and red points is considered to be due to effects such as accuracy of draught reading and
tolerance of hull girder alignment in each ship.
Fig.6.3.3 Still water vertical bending moment and hull deflection
Fig.6.3.3 shows that it is difficult to assess the effect of the uncertainty of container cargo weight on the
still water vertical bending moment by the hull deflection obtained through draught measurements at the
time of departure of a container ship. The maximum still water vertical bending moment (hogging) in the
loading plan can become approximately the same as the allowable loading capacity at a fairly high
frequency during actual operations of a large container ship, especially one of the 8,000 TEU class or
over. For this reason, considering Fig.6.3.1 and Fig.6.3.2, in accordance with the deliberations at the IMO
related to the enforcement of container weight verification prior to loading, verification of the actual weight
full - ship FEM : No cargo, ballasting 1
deflection(m)
measurement : No cargo, ballasting 2
measurement :
No cargo, ballasting 1
full - ship FEM : No cargo, ballasting 2
sister ship A
sister ship B
sister ship C
sister ship D
results of measurement
47
of container cargoes provided by the shipper is recommended, as a safety measure for large container
ships.
6.3.2 Investigation into the trend of still water vertical bending moment
About ballast filling
(1) Stability performance in container ships up to the Panamax class ships was severe since the
maximum breadth was restricted to 32.2 m. Counter ballast had to be filled especially in the double
bottom tanks when large numbers of container cargoes were stowed at a high position on the deck.
(2) Due to the circumstances of container ships up to the Panamax class ships mentioned in (1) above,
the hogging moment in still water is reduced by filling counter ballast. Therefore, in practice, the
maximum still water bending moment in the loading plan during operation reached 80 to 85% of the
allowable value at high frequently.
(3) On the other hand, in over-Panamax class ships, especially in large container ships of the 8,000
TEU class and over, the breadth increased over 45 m and stability became improved. As a result,
even when a large number of container cargoes were stowed at high locations on the deck, the
need for filling counter ballast in ballast tanks, especially double bottom ballast tanks reduced.
(4) Consequently, over-Panamax class ships, especially in large container ships of the 8,000 TEU class
and over, the maximum permissible still water vertical bending moment (hogging) in the loading plan
during actual operation could become approximately the same as the allowable loading capacity at
a fairly high frequency.
(5) Generally, cases where full load of container cargoes corresponding to almost the scantling draught
are rare in container ships. Even for over-Panamax class ships, the safety margin in still water
vertical bending moment can be ensured by filling ballast in double bottoms, however this decision
is up to the operator, as fuel consumption generally deteriorates if additional ballast is filled for the
voyage.
(6) The structural design of the MOL COMFORT was carried out taking into account the maximum
permissible still water vertical bending moment (hogging) calculated based on various types of
loading conditions. The maximum permissible still water vertical bending moment during the
accident was almost the same as the allowable value.
(7) The bridge in very large container ships of 10,000 TEU class and over is generally arranged in the
midship area due to visibility. Moreover, as containers cannot be stowed under the bridge, fuel
tanks and other installations are instead arranged together directly underneath the bridge.
Sometimes, the engine room may be arranged in the same location. The result is that the
transverse hull section modulus of the midship area becomes larger, and the still water vertical
bending moment (hogging) tends to become more relaxed because weight is concentrated on the
midship area.
48
7. Assumptions of Accident Scenario
The Committee tried to examine the following accident scenario and to evaluate the effects (if any) on
the deformation of the bottom shell plates.
Scenario: Acting load exceeds the hull girder strength (ultimate strength) causing damage to the hull,
leading to water ingress and subsequent fracture.
Relationship between hull girder strength and acting load in this scenario
While the hull girder strength (ultimate strength) during the accident was 14.0×10⁶ kN-m, the estimated
load acting on the hull was 9.4×10⁶ kN-m. The estimated load reached only about 67% of the hull girder
strength (ultimate strength). The result of the calculation did not fulfill the conditions for the fracture. (The
hull girder strength (ultimate strength) was in the range of 14.0×10⁶
kN-m to 15.0×10⁶
kN-m due to the
initial shape imperfection assumed in the bottom shell plates.)
Calculations were also carried out for buckling deformation (approximately 20 mm) of bottom shell
plates found during the safety inspections on The Sister Ships. However, even when loads close to the
hull girder strength were applied, buckling deformation could not be reproduced.
Various kinds of examinations were carried out including numerical simulations of acting loads, effect of
loading, as well as the effect of residual deformation of roughly 20 mm height in the bottom shell plates
along bottom butt welds, however the fracture could not be reproduced.
10.0 15.00
船体強度シミュレーション
作用荷重シミュレーション
14.0~15.0
Ms Mwave whi-
pping
折損を再現していない
積荷の影響を含むシミュレーションの不確定要因
(x106kN-m)
M
Fig.7.1 Relationship between load and strength in this study
Not reproducing of the fracture
uncertainty factors of the simulation, in addition to effect from actual cargo distribution
Acting load simulation hull girder strength simulation
49
The load acting on the ship under the sea state at the time of the accident is estimated to be 9.4 x 10⁶
kN-m by the Committee. However, according to the navigation records, the Ship had encountered sea
states in which it withstood a load of approximately 10.0 x 10⁶ kN-m around three and a half years prior to
the accident, and no such fracturing accident had occurred in that instance.
Since the fracturing accident occurred after this event, three possibilities are hypothesized that:
(1) the real loads acting on the hull at the time of the accident exceeded the estimation;
(2) The Ship's hull girder strength had been reduced due to possible presence of residual buckling
deformations on the bottom shell plates or any other reasons; or
(3) both of the above elements combined.
For this reason, it is necessary to conduct further verification of both load and strength related
simulations, including considering the effects of the uncertain factors in the simulations.
In regards to the buckling deformations (approximately 20 mm) observed on the outer bottom shell
plates of The Sister Ships during inspections, calculations were carried out using loads close to hull girder
strength (ultimate strength), however the deformation could not be reproduced. Although The Ship is
assumed not to have encountered loads close to the hull girder strength (ultimate strength), buckling
deformation on the outside bottom plate was confirmed. Therefore, it is necessary to clarify the
mechanism of these buckling deformations by carrying out both full-scale stress measurements of actual
ships and numerical simulations from here on.
Further investigations, including numerical simulations of the wave loads and the hull structure strength
as well as full-scale stress measurements of The Sister Ships, will be carried out to clarify the cause of the
accident and to establish safety measures to prevent the occurrence of similar accidents in the future.
50
8. Results of the Investigation and Future Tasks
Based on the consideration of the estimation of the acting load based on conditions at the time of
the accident, the evaluation of the hull strength based on safety inspections of The Ship’s sister ships,
and the consideration of accident occurrence scenarios, the results and future tasks are presented in the
following sections.
8.1 Weight Distribution and Still Water Bending Moment
Investigation Results
Since it was difficult to make an estimation of the weight distribution based on certain assumptions
with respect to the presence of cargo in excess of its manifested weight and uneven weight distribution,
simulations for acting loads were conducted by using the declared weights for the cargo loading. In this
case, the still water bending moment would be equal to Ms=6.0x10⁶ kN-m.
Future Tasks
With regards to the proper management of cargo weight on the hull for large container ships in the
8,000 TEU class and over in particular, cargo loading planning for actual voyages could be frequently
reached to the maximum permissible still water vertical bending moment (hogging condition). In
accordance with the deliberations at the IMO related to the enforcement of container weight verification
prior to loading, verification of the actual weight of container cargoes provided by the shipper is
recommended as a safety measure for large container ships.
(see Sections 6.2 and 6.3)
8.2 Sea State Conditions at the time of the Accident and Wave Bending Moment
Investigation Results
Based on the estimation in the long crested irregular waves under the sea conditions at the time of
the accident (significant wave height: 5.5m, mean wave period: 10.3 seconds), the maximum load at the
time of the accident was Mw=2.0x10⁶ kN-m (wave), and Mwhip=1.4x10
6 kN-m (whipping),
Mw+Mwhip=3.4x10⁶ kN-m in total. Therefore the estimated bending moment is Ms+Mw+Mwhip=9.4x10
6 kN-m
in total, by combining the still water bending moment with the wave induced vertical bending moment.
Future Tasks
Even though The Ship encountered sea states that generated loads of approximately 10.0x10⁶
kN-m three and a half years prior to this accident, no such fracturing occurred in that instance. This
means that (1) the possibility of loads acting on the hull exceeding the estimated values at the time of the
accident, (2) the possibility of the weakening of the hull strength due to the extent of buckling deformation
on the bottom shell plates and/or any other reasons, and (3) both (1) and (2) may be taken into
consideration, so that further investigations are necessary to verify the effects of uncertainties involved in
the strength and acting load simulations.
51
Moreover, the following uncertain factors and technical challenges may exist in the simulations and
it is important to upgrade the technology of evaluation and to calibrate it by full-scale stress
measurements of ships;
・Accuracy of estimation of whipping effect on wave loads in the simulation
・The variation of estimated wave loads due to the difference of the phase angle of each component
waves in the time domain analysis
・The difference of wave directional spectrum between short crested irregular waves (real sea state) and
long crested irregular waves (in simulation and model tests)
・Development of the method for estimating load under multi-directional waves and for simulating
structural strength in that wave condition.
(see Sections 6.2 and 6.3)
8.3 Whipping Effect on Bending Moment
Investigation Results
Even in cases where wave height is not considerably high, superposition of the load due to ship
motion and hull girder vibration (whipping load) may be substantial depending on the wave period. While
conventional rules for hull structure do not consider the effect of whipping on vertical bending moments
explicitly, the effect of whipping accounted for 70% of the wave induced vertical bending moment in the
present case.
Future Tasks
Effect of the load due to hull girder vibration (whipping load) superposed on the load from ship
motions shall be evaluated from the view point of hull structure rules as well as through the full-scale
stress measurements of ships.
For example, the load simulation only takes into account long crested and single-directional long
crested waves. However, as observed in Annex 6 with regard to whipping effect, actual ships also
encounter short crested and multi-directional waves.
Furthermore, technical knowledge with regards to the behavior of hull collapse caused by whipping
loads with limited energy of this kind is very restricted at the present, and should be clarified in the near
future along with the development of a reasonable method of evaluating strength. (If some confirmative
findings are gained from full-scale stress measurements of sister ships, this could be a possible
explanation as a mechanism for generating the buckling deformation detected in the bottom shell plate of
the sister ships.)
(see Section 6.2)
52
8.4 Ultimate Hull Girder Strength
Investigation Results
The ultimate hull girder strength simulations with the following four initial shape imperfection cases
were carried out on a three-hold model, which showed ultimate strength range of Mult=14.0~15.0x 10⁶
kN-m.
Case 1: No initial shape imperfection
Case 2: Initial shape imperfection with 4mm amplitude in plate buckling mode
Case 3: Initial shape imperfection in “hungry-horse” mode of plate with standard amplitude level
specified in JSQS (Japanese Shipbuilding Quality Standard: the acceptable range of
construction accuracy used by Japanese shipbuilders)
Case 4: Initial shape imperfection taking into account the concave/convex deformation observed in the
inspection of sister ships
With regards to the buckling deformations detected on the bottom shell plate during the inspections
of the sister ships, as only very minimal deformation was calculated in the simulations of hull girder
strength at loads close to the ultimate strength, the residual deformations were not reproduced by the
simulations.
Further, in the case where a local wavy deflection in a circular shape with 30mm amplitude across
butt joint was assumed in full breadth on the bottom shell plate, the ultimate strength was weaken down to
13.4x10⁶ kN-m.
Future Tasks
Although buckling residual deformation on the bottom shell plate was not simulated, deformations
were actually observed even though The Ship was not thought to have encountered loads close to the
hull girder strength (ultimate strength). Therefore, it is necessary to clarify the mechanisms for generating
buckling residual deformation on the bottom shell based on full-scale stress measurements on ship and
simulations. Investigations are necessary for the out-of-plane deformation regarding the cause of its
generation and the resulting effects (possibly by comparing the aspect ratio of plating).
In order to evaluate reduction of hull girder strength due to initial deformation, it is necessary to
conduct verification using three hold model for double bottom structure along with the sensitivity
screening of deformation shapes. Potential causes for generating such residual deformation should also
be investigated from the view points of both structural strength and acting loads.
(see Section 5.1 and 5.2)
8.5 Uncertainty Factors involved in the Evaluation of Ultimate Hull Girder Strength and Required
Rule Values
Investigation Results
In the present investigation, acting loads based on the non-linear strip method were estimated at
53
Ms+Mw+Mwhip=9.4x10⁶ kN-m, while the ultimate hull girder strength based on the three hold model
analysis (simulation) was calculated as Mult=14.0~15.0x10⁶ kN-m, so that the fracturing conditions were
not met. The estimated ultimate strength of The Ship was found to be around 126% of the strength
required by the classification rules (a surplus margin of 26%).
Future Tasks
With regards to the following uncertain factors and the not fully established quantitative measures
involved, the appropriateness of the safety margins, which current classification rule requirements ensure,
should be reviewed as to whether the margin is satisfactory, and also comparisons of large container
ships with designs other than The Ship should be carried out.
・The whipping effect on wave bending moment
・Surplus margin of wave bending moment required by classification rules for whipping component
・The uncertainty in still water bending moment due to the uncertainty of container weight distribution
・Ultimate strength taking into account of transverse load (bottom and side water pressure, container
load, in particular, the asymmetrical water pressure distribution due to oblique waves and
two-directional waves), etc.
・Variability of the material properties and effect of welding residual stress
9. Recommended Safety Measures
Further Actions
As the cause of this accident has not yet fully been clarified quantitatively, measurements of acting
loads on The Ship’s sister ships will be carried out in order to verify the investigation results as well as the
acting load and strength simulations including uncertain factors, more accurately reproduce the accident
conditions, and develop safety measures to prevent the occurrence of similar accidents.
(see Section 8.5)
Furthermore, in order to determine the range of ship scale for which these safety measures should
be applied, simulations of hull strength and acting loads, as well as full-scale stress measurements of
actual ships will be carried out on large container ships with designs other than The Ship.
(see Section 8.5)
Temporary Safety Measures (Ships in service)
While the Committee is still in the process of extrapolating the accident scenario and developing
upon safety measures, the Committee recommends that the following actions be carried out on ships with
loading capacities similar to or greater than 8,000 TEU class as temporary safety measures.
54
A visual safety inspections on the bottom shell plates to the extent possible should be conducted on
large container ships which do not require ballast water to maintain stability (primarily ships over 45m
breadth, carrying 8000 TEU or greater) to confirm the presence of buckling deformations. Where the
deformations are found, consult with a classification society regarding the proper measures to be
taken. (see Section 8.4)
With regards to the proper management of cargo weight on the hull for large container ships in the
8,000 TEU class and over in particular, cargo loading planning for actual voyages could be frequently
reached to the maximum permissible still water bending moment (hogging condition). In accordance
with the deliberations at the IMO related to the enforcement of container weight verification prior to
loading, verification of the actual weight of container cargoes provided by the shipper is
recommended as a safety measure for large container ships. (see Section 8.1)
Other general items for caution include rough sea avoidance maneuvers such as speed reduction.
(see Section 6.2.4)
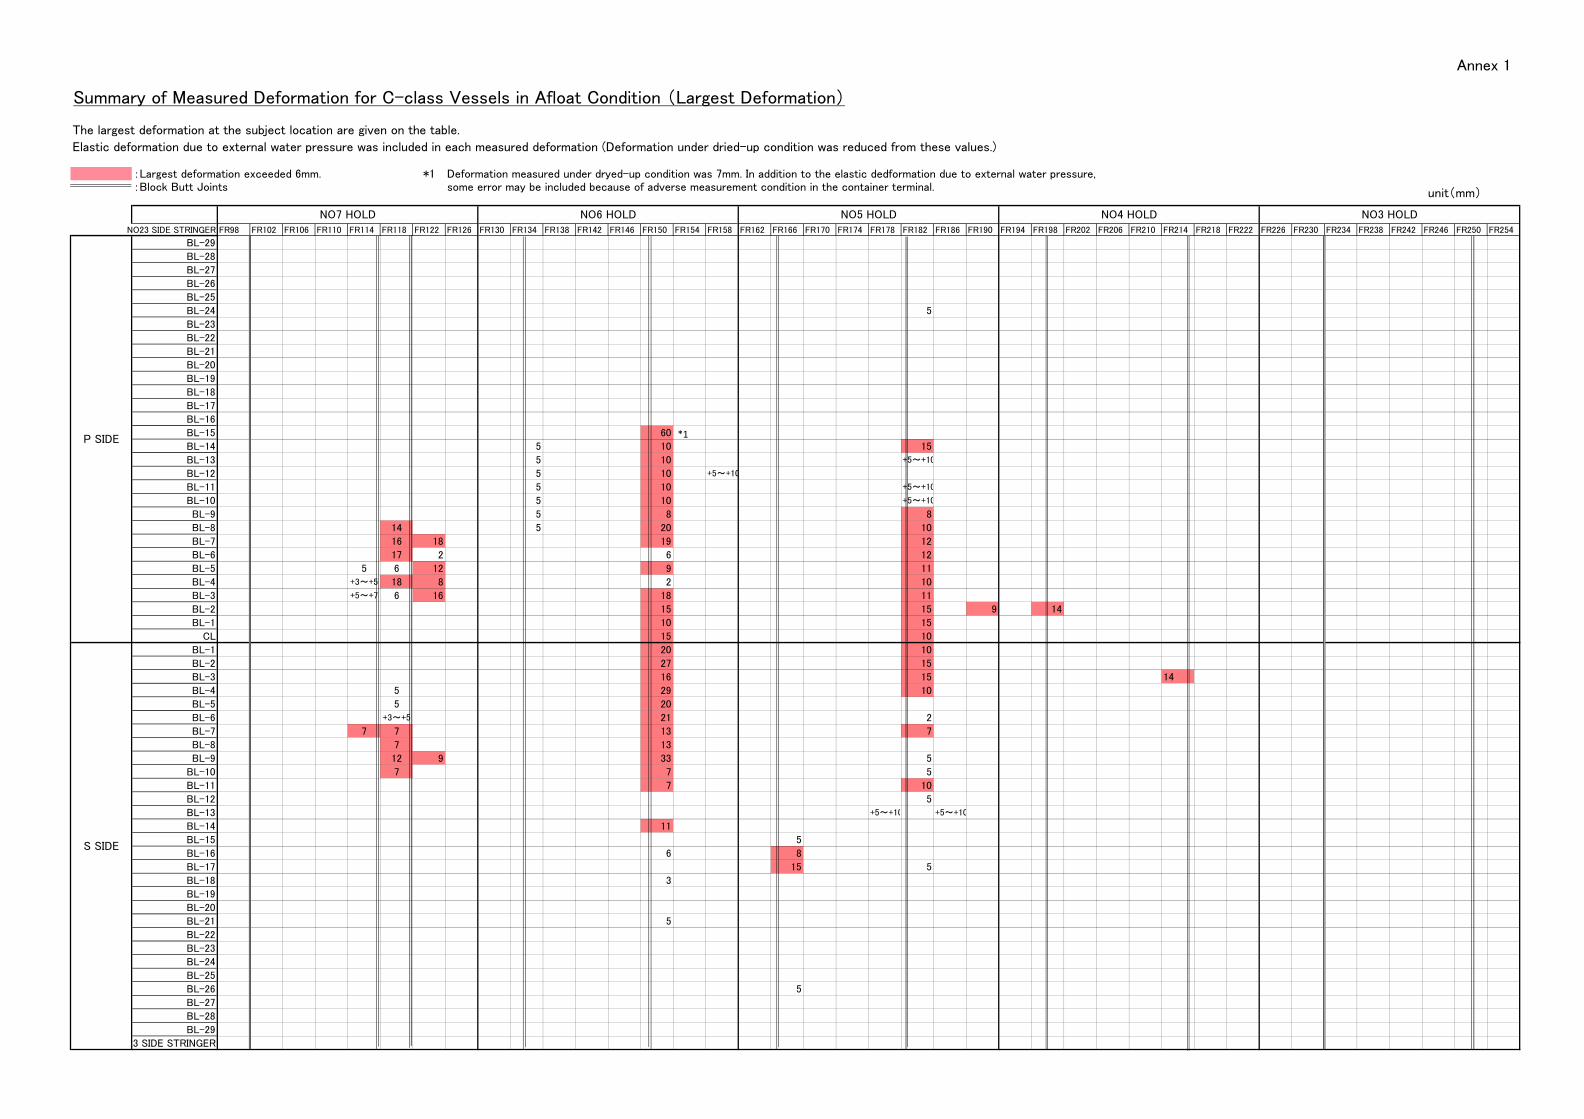
Annex 1 aaaa
Summary of Measured Deformation for C-class Vessels in Afloat Condition (Largest Deformation)
The largest deformation at the subject location are given on the table.
Elastic deformation due to external water pressure was included in each measured deformation (Deformation under dried-up condition was reduced from these values.)
:Largest deformation exceeded 6mm. *1 Deformation measured under dryed-up condition was 7mm. In addition to the elastic dedformation due to external water pressure,:Block Butt Joints some error may be included because of adverse measurement condition in the container terminal.
NO23 SIDE STRINGER FR98 FR102 FR106 FR110 FR114 FR118 FR122 FR126 FR130 FR134 FR138 FR142 FR146 FR150 FR154 FR158 FR162 FR166 FR170 FR174 FR178 FR182 FR186 FR190 FR194 FR198 FR202 FR206 FR210 FR214 FR218 FR222 FR226 FR230 FR234 FR238 FR242 FR246 FR250 FR254
BL-29 0 0 0 0 0 0 0 0 0 0 0 0 0 0 0 0 0 0 0 0 0 0 0 0 0 0 0 0 0 0 0 0 0 0 0 0 0 0 0 0
BL-28 0 0 0 0 0 0 0 0 0 0 0 0 0 0 0 0 0 0 0 0 0 0 0 0 0 0 0 0 0 0 0 0 0 0 0 0 0 0 0 0
BL-27 0 0 0 0 0 0 0 0 0 0 0 0 0 0 0 0 0 0 0 0 0 0 0 0 0 0 0 0 0 0 0 0 0 0 0 0 0 0 0 0
BL-26 0 0 0 0 0 0 0 0 0 0 0 0 0 0 0 0 0 0 0 0 0 0 0 0 0 0 0 0 0 0 0 0 0 0 0 0 0 0 0 0
BL-25 0 0 0 0 0 0 0 0 0 0 0 0 0 0 0 0 0 0 0 0 0 0 0 0 0 0 0 0 0 0 0 0 0 0 0 0 0 0 0 0
BL-24 0 0 0 0 0 0 0 0 0 0 0 0 0 0 0 0 0 0 0 0 0 5 0 0 0 0 0 0 0 0 0 0 0 0 0 0 0 0 0 0
BL-23 0 0 0 0 0 0 0 0 0 0 0 0 0 0 0 0 0 0 0 0 0 0 0 0 0 0 0 0 0 0 0 0 0 0 0 0 0 0 0 0
BL-22 0 0 0 0 0 0 0 0 0 0 0 0 0 0 0 0 0 0 0 0 0 0 0 0 0 0 0 0 0 0 0 0 0 0 0 0 0 0 0 0
BL-21 0 0 0 0 0 0 0 0 0 0 0 0 0 0 0 0 0 0 0 0 0 0 0 0 0 0 0 0 0 0 0 0 0 0 0 0 0 0 0 0
BL-20 0 0 0 0 0 0 0 0 0 0 0 0 0 0 0 0 0 0 0 0 0 0 0 0 0 0 0 0 0 0 0 0 0 0 0 0 0 0 0 0
BL-19 0 0 0 0 0 0 0 0 0 0 0 0 0 0 0 0 0 0 0 0 0 0 0 0 0 0 0 0 0 0 0 0 0 0 0 0 0 0 0 0
BL-18 0 0 0 0 0 0 0 0 0 0 0 0 0 0 0 0 0 0 0 0 0 0 0 0 0 0 0 0 0 0 0 0 0 0 0 0 0 0 0 0
BL-17 0 0 0 0 0 0 0 0 0 0 0 0 0 0 0 0 0 0 0 0 0 0 0 0 0 0 0 0 0 0 0 0 0 0 0 0 0 0 0 0
BL-16 0 0 0 0 0 0 0 0 0 0 0 0 0 0 0 0 0 0 0 0 0 0 0 0 0 0 0 0 0 0 0 0 0 0 0 0 0 0 0 0
BL-15 0 0 0 0 0 0 0 0 0 0 0 0 0 60 0 0 0 0 0 0 0 0 0 0 0 0 0 0 0 0 0 0 0 0 0 0 0 0 0 0
BL-14 0 0 0 0 0 0 0 0 0 5 0 0 0 10 0 0 0 0 0 0 0 15 0 0 0 0 0 0 0 0 0 0 0 0 0 0 0 0 0 0
BL-13 0 0 0 0 0 0 0 0 0 5 0 0 0 10 0 0 0 0 0 0 0 +5~+10 0 0 0 0 0 0 0 0 0 0 0 0 0 0 0 0 0 0
BL-12 0 0 0 0 0 0 0 0 0 5 0 0 0 10 0 +5~+10 0 0 0 0 0 0 0 0 0 0 0 0 0 0 0 0 0 0 0 0 0 0 0 0
BL-11 0 0 0 0 0 0 0 0 0 5 0 0 0 10 0 0 0 0 0 0 0 +5~+10 0 0 0 0 0 0 0 0 0 0 0 0 0 0 0 0 0 0
BL-10 0 0 0 0 0 0 0 0 0 5 0 0 0 10 0 0 0 0 0 0 0 +5~+10 0 0 0 0 0 0 0 0 0 0 0 0 0 0 0 0 0 0
BL-9 0 0 0 0 0 0 0 0 0 5 0 0 0 8 0 0 0 0 0 0 0 8 0 0 0 0 0 0 0 0 0 0 0 0 0 0 0 0 0 0
BL-8 0 0 0 0 0 14 0 0 0 5 0 0 0 20 0 0 0 0 0 0 0 10 0 0 0 0 0 0 0 0 0 0 0 0 0 0 0 0 0 0
BL-7 0 0 0 0 0 16 18 0 0 0 0 0 0 19 0 0 0 0 0 0 0 12 0 0 0 0 0 0 0 0 0 0 0 0 0 0 0 0 0 0
BL-6 0 0 0 0 0 17 2 0 0 0 0 0 0 6 0 0 0 0 0 0 0 12 0 0 0 0 0 0 0 0 0 0 0 0 0 0 0 0 0 0
BL-5 0 0 0 0 5 6 12 0 0 0 0 0 0 9 0 0 0 0 0 0 0 11 0 0 0 0 0 0 0 0 0 0 0 0 0 0 0 0 0 0
BL-4 0 0 0 0 +3~+5 18 8 0 0 0 0 0 0 2 0 0 0 0 0 0 0 10 0 0 0 0 0 0 0 0 0 0 0 0 0 0 0 0 0 0
BL-3 0 0 0 0 +5~+7 6 16 0 0 0 0 0 0 18 0 0 0 0 0 0 0 11 0 0 0 0 0 0 0 0 0 0 0 0 0 0 0 0 0 0
BL-2 0 0 0 0 0 0 0 0 0 0 0 0 0 15 0 0 0 0 0 0 0 15 0 9 0 14 0 0 0 0 0 0 0 0 0 0 0 0 0 0
BL-1 0 0 0 0 0 0 0 0 0 0 0 0 0 10 0 0 0 0 0 0 0 15 0 0 0 0 0 0 0 0 0 0 0 0 0 0 0 0 0 0
CL 0 0 0 0 0 0 0 0 0 0 0 0 0 15 0 0 0 0 0 0 0 10 0 0 0 0 0 0 0 0 0 0 0 0 0 0 0 0 0 0
BL-1 0 0 0 0 0 0 0 0 0 0 0 0 0 20 0 0 0 0 0 0 0 10 0 0 0 0 0 0 0 0 0 0 0 0 0 0 0 0 0 0
BL-2 0 0 0 0 0 0 0 0 0 0 0 0 0 27 0 0 0 0 0 0 0 15 0 0 0 0 0 0 0 0 0 0 0 0 0 0 0 0 0 0
BL-3 0 0 0 0 0 0 0 0 0 0 0 0 0 16 0 0 0 0 0 0 0 15 0 0 0 0 0 0 0 14 0 0 0 0 0 0 0 0 0 0
BL-4 0 0 0 0 0 5 0 0 0 0 0 0 0 29 0 0 0 0 0 0 0 10 0 0 0 0 0 0 0 0 0 0 0 0 0 0 0 0 0 0
BL-5 0 0 0 0 0 5 0 0 0 0 0 0 0 20 0 0 0 0 0 0 0 0 0 0 0 0 0 0 0 0 0 0 0 0 0 0 0 0 0 0
BL-6 0 0 0 0 0 +3~+5 0 0 0 0 0 0 0 21 0 0 0 0 0 0 0 2 0 0 0 0 0 0 0 0 0 0 0 0 0 0 0 0 0 0
BL-7 0 0 0 0 7 7 0 0 0 0 0 0 0 13 0 0 0 0 0 0 0 7 0 0 0 0 0 0 0 0 0 0 0 0 0 0 0 0 0 0
BL-8 0 0 0 0 7 0 0 0 0 0 0 0 13 0 0 0 0 0 0 0 0 0 0 0 0 0 0 0 0 0 0 0 0 0 0 0 0 0 0
BL-9 0 0 0 0 0 12 9 0 0 0 0 0 0 33 0 0 0 0 0 0 0 5 0 0 0 0 0 0 0 0 0 0 0 0 0 0 0 0 0 0
BL-10 0 0 0 0 0 7 0 0 0 0 0 0 0 7 0 0 0 0 0 0 0 5 0 0 0 0 0 0 0 0 0 0 0 0 0 0 0 0 0 0
BL-11 0 0 0 0 0 0 0 0 0 0 0 0 0 7 0 0 0 0 0 0 0 10 0 0 0 0 0 0 0 0 0 0 0 0 0 0 0 0 0 0
BL-12 0 0 0 0 0 0 0 0 0 0 0 0 0 0 0 0 0 0 0 0 0 5 0 0 0 0 0 0 0 0 0 0 0 0 0 0 0 0 0 0
BL-13 0 0 0 0 0 0 0 0 0 0 0 0 0 0 0 0 0 0 0 0 +5~+10 0 +5~+10 0 0 0 0 0 0 0 0 0 0 0 0 0 0 0 0 0
BL-14 0 0 0 0 0 0 0 0 0 0 0 0 0 11 0 0 0 0 0 0 0 0 0 0 0 0 0 0 0 0 0 0 0 0 0 0 0 0 0 0
BL-15 0 0 0 0 0 0 0 0 0 0 0 0 0 0 0 0 0 5 0 0 0 0 0 0 0 0 0 0 0 0 0 0 0 0 0 0 0 0 0 0
BL-16 0 0 0 0 0 0 0 0 0 0 0 0 0 6 0 0 0 8 0 0 0 0 0 0 0 0 0 0 0 0 0 0 0 0 0 0 0 0 0 0
BL-17 0 0 0 0 0 0 0 0 0 0 0 0 0 0 0 0 0 15 0 0 0 5 0 0 0 0 0 0 0 0 0 0 0 0 0 0 0 0 0 0
BL-18 0 0 0 0 0 0 0 0 0 0 0 0 0 3 0 0 0 0 0 0 0 0 0 0 0 0 0 0 0 0 0 0 0 0 0 0 0 0 0 0
BL-19 0 0 0 0 0 0 0 0 0 0 0 0 0 0 0 0 0 0 0 0 0 0 0 0 0 0 0 0 0 0 0 0 0 0 0 0 0 0 0 0
BL-20 0 0 0 0 0 0 0 0 0 0 0 0 0 0 0 0 0 0 0 0 0 0 0 0 0 0 0 0 0 0 0 0 0 0 0 0 0 0 0 0
BL-21 0 0 0 0 0 0 0 0 0 0 0 0 0 5 0 0 0 0 0 0 0 0 0 0 0 0 0 0 0 0 0 0 0 0 0 0 0 0 0 0
BL-22 0 0 0 0 0 0 0 0 0 0 0 0 0 0 0 0 0 0 0 0 0 0 0 0 0 0 0 0 0 0 0 0 0 0 0 0 0 0 0 0
BL-23 0 0 0 0 0 0 0 0 0 0 0 0 0 0 0 0 0 0 0 0 0 0 0 0 0 0 0 0 0 0 0 0 0 0 0 0 0 0 0 0
BL-24 0 0 0 0 0 0 0 0 0 0 0 0 0 0 0 0 0 0 0 0 0 0 0 0 0 0 0 0 0 0 0 0 0 0 0 0 0 0 0 0
BL-25 0 0 0 0 0 0 0 0 0 0 0 0 0 0 0 0 0 0 0 0 0 0 0 0 0 0 0 0 0 0 0 0 0 0 0 0 0 0 0 0
BL-26 0 0 0 0 0 0 0 0 0 0 0 0 0 0 0 0 0 5 0 0 0 0 0 0 0 0 0 0 0 0 0 0 0 0 0 0 0 0 0 0
BL-27 0 0 0 0 0 0 0 0 0 0 0 0 0 0 0 0 0 0 0 0 0 0 0 0 0 0 0 0 0 0 0 0 0 0 0 0 0 0 0 0
BL-28 0 0 0 0 0 0 0 0 0 0 0 0 0 0 0 0 0 0 0 0 0 0 0 0 0 0 0 0 0 0 0 0 0 0 0 0 0 0 0 0
BL-29 0 0 0 0 0 0 0 0 0 0 0 0 0 0 0 0 0 0 0 0 0 0 0 0 0 0 0 0 0 0 0 0 0 0 0 0 0 0 0 0
23 SIDE STRINGER 0 0 0 0 0 0 0 0 0 0 0 0 0 0 0 0 0 0 0 0 0 0 0 0 0 0 0 0 0 0 0 0 0 0 0 0 0 0 0 0
unit(mm)
NO3 HOLD
P SIDE
S SIDE
NO7 HOLD NO6 HOLD NO5 HOLD NO4 HOLD
*1
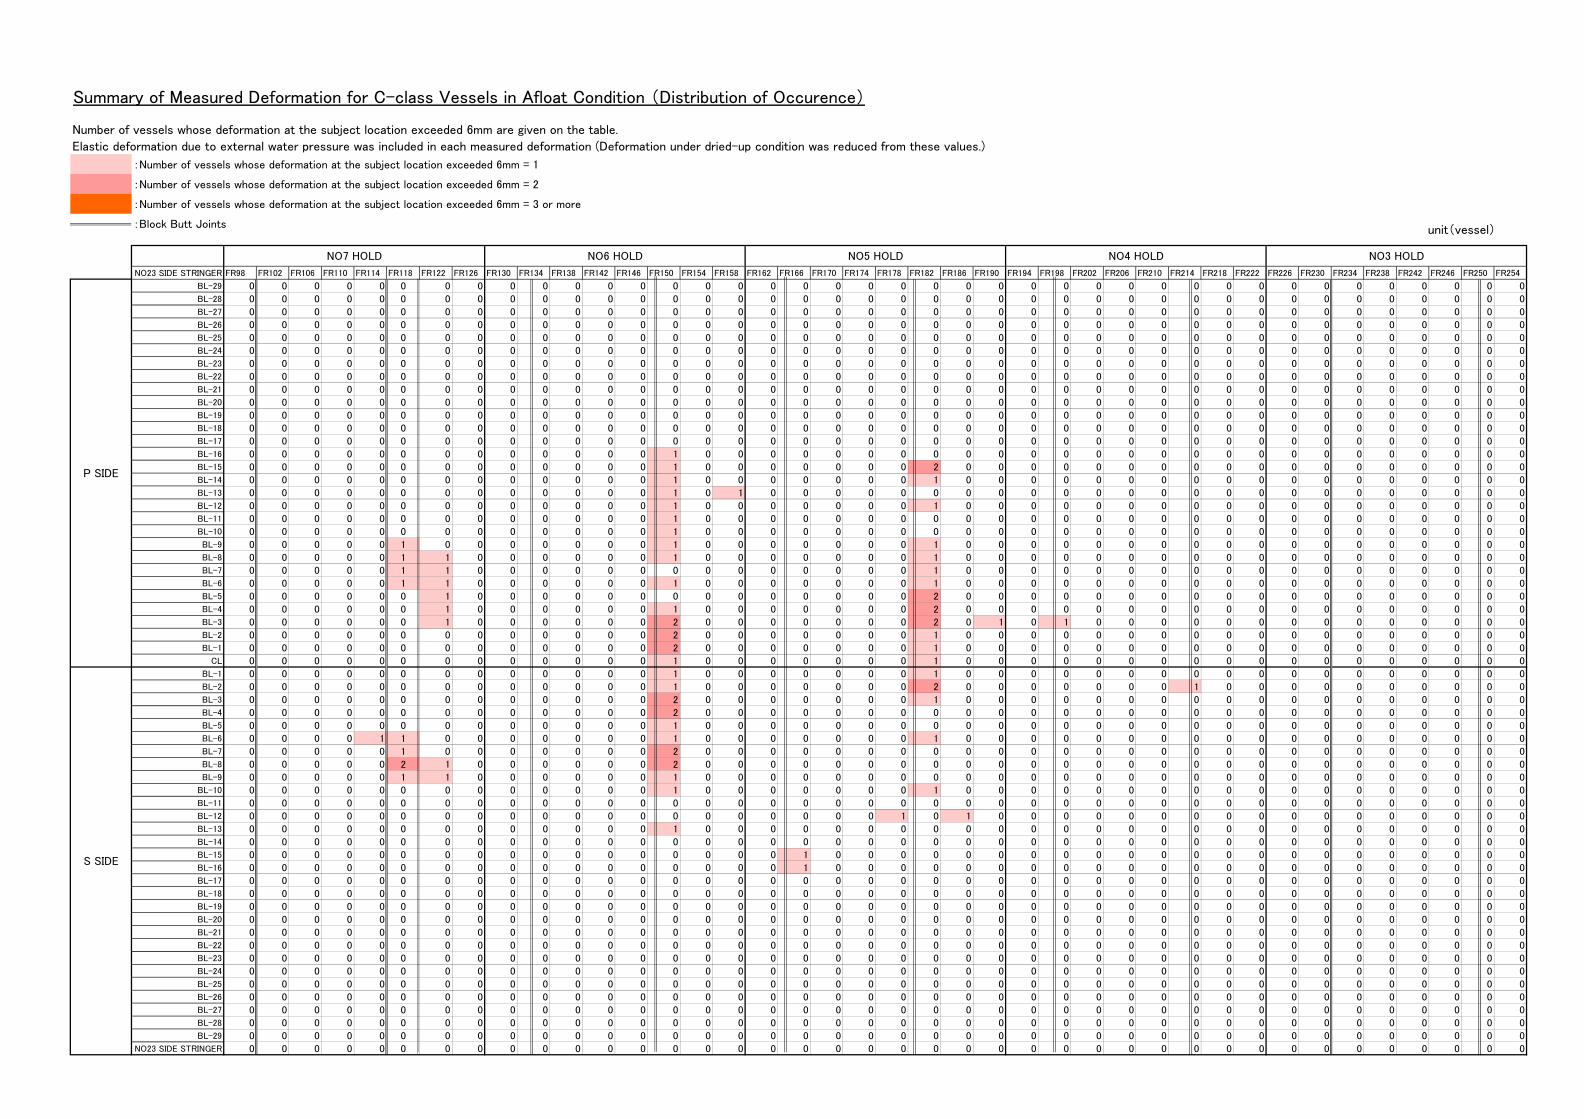
Summary of Measured Deformation for C-class Vessels in Afloat Condition (Distribution of Occurence)
Number of vessels whose deformation at the subject location exceeded 6mm are given on the table.
Elastic deformation due to external water pressure was included in each measured deformation (Deformation under dried-up condition was reduced from these values.)
:Number of vessels whose deformation at the subject location exceeded 6mm = 1
:Number of vessels whose deformation at the subject location exceeded 6mm = 2
:Number of vessels whose deformation at the subject location exceeded 6mm = 3 or more
:Block Butt Joints
NO23 SIDE STRINGER FR98 FR102 FR106 FR110 FR114 FR118 FR122 FR126 FR130 FR134 FR138 FR142 FR146 FR150 FR154 FR158 FR162 FR166 FR170 FR174 FR178 FR182 FR186 FR190 FR194 FR198 FR202 FR206 FR210 FR214 FR218 FR222 FR226 FR230 FR234 FR238 FR242 FR246 FR250 FR254
BL-29 0 0 0 0 0 0 0 0 0 0 0 0 0 0 0 0 0 0 0 0 0 0 0 0 0 0 0 0 0 0 0 0 0 0 0 0 0 0 0 0BL-28 0 0 0 0 0 0 0 0 0 0 0 0 0 0 0 0 0 0 0 0 0 0 0 0 0 0 0 0 0 0 0 0 0 0 0 0 0 0 0 0BL-27 0 0 0 0 0 0 0 0 0 0 0 0 0 0 0 0 0 0 0 0 0 0 0 0 0 0 0 0 0 0 0 0 0 0 0 0 0 0 0 0BL-26 0 0 0 0 0 0 0 0 0 0 0 0 0 0 0 0 0 0 0 0 0 0 0 0 0 0 0 0 0 0 0 0 0 0 0 0 0 0 0 0BL-25 0 0 0 0 0 0 0 0 0 0 0 0 0 0 0 0 0 0 0 0 0 0 0 0 0 0 0 0 0 0 0 0 0 0 0 0 0 0 0 0BL-24 0 0 0 0 0 0 0 0 0 0 0 0 0 0 0 0 0 0 0 0 0 0 0 0 0 0 0 0 0 0 0 0 0 0 0 0 0 0 0 0BL-23 0 0 0 0 0 0 0 0 0 0 0 0 0 0 0 0 0 0 0 0 0 0 0 0 0 0 0 0 0 0 0 0 0 0 0 0 0 0 0 0BL-22 0 0 0 0 0 0 0 0 0 0 0 0 0 0 0 0 0 0 0 0 0 0 0 0 0 0 0 0 0 0 0 0 0 0 0 0 0 0 0 0BL-21 0 0 0 0 0 0 0 0 0 0 0 0 0 0 0 0 0 0 0 0 0 0 0 0 0 0 0 0 0 0 0 0 0 0 0 0 0 0 0 0BL-20 0 0 0 0 0 0 0 0 0 0 0 0 0 0 0 0 0 0 0 0 0 0 0 0 0 0 0 0 0 0 0 0 0 0 0 0 0 0 0 0BL-19 0 0 0 0 0 0 0 0 0 0 0 0 0 0 0 0 0 0 0 0 0 0 0 0 0 0 0 0 0 0 0 0 0 0 0 0 0 0 0 0BL-18 0 0 0 0 0 0 0 0 0 0 0 0 0 0 0 0 0 0 0 0 0 0 0 0 0 0 0 0 0 0 0 0 0 0 0 0 0 0 0 0BL-17 0 0 0 0 0 0 0 0 0 0 0 0 0 0 0 0 0 0 0 0 0 0 0 0 0 0 0 0 0 0 0 0 0 0 0 0 0 0 0 0BL-16 0 0 0 0 0 0 0 0 0 0 0 0 0 1 0 0 0 0 0 0 0 0 0 0 0 0 0 0 0 0 0 0 0 0 0 0 0 0 0 0BL-15 0 0 0 0 0 0 0 0 0 0 0 0 0 1 0 0 0 0 0 0 0 2 0 0 0 0 0 0 0 0 0 0 0 0 0 0 0 0 0 0BL-14 0 0 0 0 0 0 0 0 0 0 0 0 0 1 0 0 0 0 0 0 0 1 0 0 0 0 0 0 0 0 0 0 0 0 0 0 0 0 0 0BL-13 0 0 0 0 0 0 0 0 0 0 0 0 0 1 0 1 0 0 0 0 0 0 0 0 0 0 0 0 0 0 0 0 0 0 0 0 0 0 0 0BL-12 0 0 0 0 0 0 0 0 0 0 0 0 0 1 0 0 0 0 0 0 0 1 0 0 0 0 0 0 0 0 0 0 0 0 0 0 0 0 0 0BL-11 0 0 0 0 0 0 0 0 0 0 0 0 0 1 0 0 0 0 0 0 0 0 0 0 0 0 0 0 0 0 0 0 0 0 0 0 0 0 0 0BL-10 0 0 0 0 0 0 0 0 0 0 0 0 0 1 0 0 0 0 0 0 0 0 0 0 0 0 0 0 0 0 0 0 0 0 0 0 0 0 0 0BL-9 0 0 0 0 0 1 0 0 0 0 0 0 0 1 0 0 0 0 0 0 0 1 0 0 0 0 0 0 0 0 0 0 0 0 0 0 0 0 0 0BL-8 0 0 0 0 0 1 1 0 0 0 0 0 0 1 0 0 0 0 0 0 0 1 0 0 0 0 0 0 0 0 0 0 0 0 0 0 0 0 0 0BL-7 0 0 0 0 0 1 1 0 0 0 0 0 0 0 0 0 0 0 0 0 0 1 0 0 0 0 0 0 0 0 0 0 0 0 0 0 0 0 0 0BL-6 0 0 0 0 0 1 1 0 0 0 0 0 0 1 0 0 0 0 0 0 0 1 0 0 0 0 0 0 0 0 0 0 0 0 0 0 0 0 0 0BL-5 0 0 0 0 0 0 1 0 0 0 0 0 0 0 0 0 0 0 0 0 0 2 0 0 0 0 0 0 0 0 0 0 0 0 0 0 0 0 0 0BL-4 0 0 0 0 0 0 1 0 0 0 0 0 0 1 0 0 0 0 0 0 0 2 0 0 0 0 0 0 0 0 0 0 0 0 0 0 0 0 0 0BL-3 0 0 0 0 0 0 1 0 0 0 0 0 0 2 0 0 0 0 0 0 0 2 0 1 0 1 0 0 0 0 0 0 0 0 0 0 0 0 0 0BL-2 0 0 0 0 0 0 0 0 0 0 0 0 0 2 0 0 0 0 0 0 0 1 0 0 0 0 0 0 0 0 0 0 0 0 0 0 0 0 0 0BL-1 0 0 0 0 0 0 0 0 0 0 0 0 0 2 0 0 0 0 0 0 0 1 0 0 0 0 0 0 0 0 0 0 0 0 0 0 0 0 0 0
CL 0 0 0 0 0 0 0 0 0 0 0 0 0 1 0 0 0 0 0 0 0 1 0 0 0 0 0 0 0 0 0 0 0 0 0 0 0 0 0 0BL-1 0 0 0 0 0 0 0 0 0 0 0 0 0 1 0 0 0 0 0 0 0 1 0 0 0 0 0 0 0 0 0 0 0 0 0 0 0 0 0 0BL-2 0 0 0 0 0 0 0 0 0 0 0 0 0 1 0 0 0 0 0 0 0 2 0 0 0 0 0 0 0 1 0 0 0 0 0 0 0 0 0 0BL-3 0 0 0 0 0 0 0 0 0 0 0 0 0 2 0 0 0 0 0 0 0 1 0 0 0 0 0 0 0 0 0 0 0 0 0 0 0 0 0 0BL-4 0 0 0 0 0 0 0 0 0 0 0 0 0 2 0 0 0 0 0 0 0 0 0 0 0 0 0 0 0 0 0 0 0 0 0 0 0 0 0 0BL-5 0 0 0 0 0 0 0 0 0 0 0 0 0 1 0 0 0 0 0 0 0 0 0 0 0 0 0 0 0 0 0 0 0 0 0 0 0 0 0 0BL-6 0 0 0 0 1 1 0 0 0 0 0 0 0 1 0 0 0 0 0 0 0 1 0 0 0 0 0 0 0 0 0 0 0 0 0 0 0 0 0 0BL-7 0 0 0 0 0 1 0 0 0 0 0 0 0 2 0 0 0 0 0 0 0 0 0 0 0 0 0 0 0 0 0 0 0 0 0 0 0 0 0 0BL-8 0 0 0 0 0 2 1 0 0 0 0 0 0 2 0 0 0 0 0 0 0 0 0 0 0 0 0 0 0 0 0 0 0 0 0 0 0 0 0 0BL-9 0 0 0 0 0 1 1 0 0 0 0 0 0 1 0 0 0 0 0 0 0 0 0 0 0 0 0 0 0 0 0 0 0 0 0 0 0 0 0 0
BL-10 0 0 0 0 0 0 0 0 0 0 0 0 0 1 0 0 0 0 0 0 0 1 0 0 0 0 0 0 0 0 0 0 0 0 0 0 0 0 0 0BL-11 0 0 0 0 0 0 0 0 0 0 0 0 0 0 0 0 0 0 0 0 0 0 0 0 0 0 0 0 0 0 0 0 0 0 0 0 0 0 0 0BL-12 0 0 0 0 0 0 0 0 0 0 0 0 0 0 0 0 0 0 0 0 1 0 1 0 0 0 0 0 0 0 0 0 0 0 0 0 0 0 0 0BL-13 0 0 0 0 0 0 0 0 0 0 0 0 0 1 0 0 0 0 0 0 0 0 0 0 0 0 0 0 0 0 0 0 0 0 0 0 0 0 0 0BL-14 0 0 0 0 0 0 0 0 0 0 0 0 0 0 0 0 0 0 0 0 0 0 0 0 0 0 0 0 0 0 0 0 0 0 0 0 0 0 0 0BL-15 0 0 0 0 0 0 0 0 0 0 0 0 0 0 0 0 0 1 0 0 0 0 0 0 0 0 0 0 0 0 0 0 0 0 0 0 0 0 0 0BL-16 0 0 0 0 0 0 0 0 0 0 0 0 0 0 0 0 0 1 0 0 0 0 0 0 0 0 0 0 0 0 0 0 0 0 0 0 0 0 0 0BL-17 0 0 0 0 0 0 0 0 0 0 0 0 0 0 0 0 0 0 0 0 0 0 0 0 0 0 0 0 0 0 0 0 0 0 0 0 0 0 0 0BL-18 0 0 0 0 0 0 0 0 0 0 0 0 0 0 0 0 0 0 0 0 0 0 0 0 0 0 0 0 0 0 0 0 0 0 0 0 0 0 0 0BL-19 0 0 0 0 0 0 0 0 0 0 0 0 0 0 0 0 0 0 0 0 0 0 0 0 0 0 0 0 0 0 0 0 0 0 0 0 0 0 0 0BL-20 0 0 0 0 0 0 0 0 0 0 0 0 0 0 0 0 0 0 0 0 0 0 0 0 0 0 0 0 0 0 0 0 0 0 0 0 0 0 0 0BL-21 0 0 0 0 0 0 0 0 0 0 0 0 0 0 0 0 0 0 0 0 0 0 0 0 0 0 0 0 0 0 0 0 0 0 0 0 0 0 0 0BL-22 0 0 0 0 0 0 0 0 0 0 0 0 0 0 0 0 0 0 0 0 0 0 0 0 0 0 0 0 0 0 0 0 0 0 0 0 0 0 0 0BL-23 0 0 0 0 0 0 0 0 0 0 0 0 0 0 0 0 0 0 0 0 0 0 0 0 0 0 0 0 0 0 0 0 0 0 0 0 0 0 0 0BL-24 0 0 0 0 0 0 0 0 0 0 0 0 0 0 0 0 0 0 0 0 0 0 0 0 0 0 0 0 0 0 0 0 0 0 0 0 0 0 0 0BL-25 0 0 0 0 0 0 0 0 0 0 0 0 0 0 0 0 0 0 0 0 0 0 0 0 0 0 0 0 0 0 0 0 0 0 0 0 0 0 0 0BL-26 0 0 0 0 0 0 0 0 0 0 0 0 0 0 0 0 0 0 0 0 0 0 0 0 0 0 0 0 0 0 0 0 0 0 0 0 0 0 0 0BL-27 0 0 0 0 0 0 0 0 0 0 0 0 0 0 0 0 0 0 0 0 0 0 0 0 0 0 0 0 0 0 0 0 0 0 0 0 0 0 0 0BL-28 0 0 0 0 0 0 0 0 0 0 0 0 0 0 0 0 0 0 0 0 0 0 0 0 0 0 0 0 0 0 0 0 0 0 0 0 0 0 0 0BL-29 0 0 0 0 0 0 0 0 0 0 0 0 0 0 0 0 0 0 0 0 0 0 0 0 0 0 0 0 0 0 0 0 0 0 0 0 0 0 0 0
NO23 SIDE STRINGER 0 0 0 0 0 0 0 0 0 0 0 0 0 0 0 0 0 0 0 0 0 0 0 0 0 0 0 0 0 0 0 0 0 0 0 0 0 0 0 0
unit(vessel)
NO3 HOLD
P SIDE
S SIDE
NO7 HOLD NO6 HOLD NO5 HOLD NO4 HOLD
57
Annex 2: Hull girder strength evaluation and analysis (related to Section 5.1.4)
1) The mean actual stress values for yield stress of steels in the table below were used for simulation
calculation of hull girder strength rather than the minimum standards specified in the Classification
Rules.
Type of steel Minimum standard specified in
classification rules
Yield stress used in this
simulation calculation
HT32 315 N/mm2 380 N/mm
2
HT36 355 N/mm2 410 N/mm
2
HT40 390 N/mm2 430 N/mm
2
HT47 460 N/mm2 510 N/mm
2
2) In addition, the main analysis conditions input in the simulation are summarized in the table below.
Item Input Value Remarks
Draft 14.5 m Ship’s scantling draft
Wave induced load Figure 4.1 in Annex 4 According to Guidelines for Container
Carrier Structures, ClassNK
Container unit weight 20.46t (in cargo hold)
13.75t (on deck)
Mean value based on loading information at
time of the accident
Still water vertical
bending moment 3.08×10
6 kN-m
Allowable design value (for one side)
(almost the same as at the time of accident)
Wave induced vertical
bending moment 2.49×10
6 kN-m Value in Rules (for one side)
Ballast weight
to double bottom and
double skin side
None Ballast tank near midship area
Empty hold conditions
Fuel oil weight
to transverse bulkhead None Ignored as the effect on results was minimal
58
Figure 2.1 Wave induced load used in simulation (according to NK Guidelines)
Hydrostatic
load
Wave induce
load
146 kN/m2
12 kN/m2
21 kN/m2
(at bottom of bilge plate)
27 kN/m2
(at top of bilge plate)
34 kN/m2
(at water line)
3.4m above water line
59
Annex 3: Features of implicit and explicit methods in non-linear elasto-plastic analysis (related to
Section 5.1.4)
1) Although the accuracy of the implicit method is high, (1) the calculation time increases in proportion to
the square of the number of finite elements, (2) buckling strength might be evaluated as excessively
high if the initial shape imperfection (trigger) is not provided to form the buckling mode and also (3)
convergence is difficult and calculation may not proceed when the deformation due to buckling and
collapse becomes large.
2) On the other hand, although the problem of cumulative error occurs, explicit method is suited to
large-scale calculations since the calculation time increases in linear proportion to the number of finite
elements and parallel computations using multiple CPUs can be adopted unlike the implicit method.
However, as time steps are determined in proportion to the smallest element among all the finite
elements, special processing such as mass scaling is necessary for small-sized finite elements.
The explicit method is suited to dynamic and impact structural response simulations and local
vibrations occur in the finite element model with loading. Buckling and collapse may be accelerated by
the additional vibration response if internal damping is not provided. In that case, additional vibration
response may be minimized. However, buckling strength is generally not overestimated significantly
without providing initial shape imperfection of buckling mode. This is because local vibration provides
initial shape imperfection (trigger).
3) In recent years, the implicit method may generally be switched to the explicit method, and the explicit
method is used within one elasto-plastic strength calculation in consideration of the advantages of
each method.
60
Annex 4: Examination of cracks in butt joints of bottom shell plates (non-destructive inspection)
(Related to Section 5.3)
Welding beads at the butt joints on the bottom shell were examined by ultrasonic tests from inside of
double bottom. Neither crack nor defect similar flaw was detected. Furthermore, no flaw similar to a
crack were found using radiographic tests in the range over which indications (image or value displayed
on instrument for non-destructive inspection, pattern displayed on test specimen) were observed by the
ultrasonic tests. Flaws Defects other than cracks were evaluated according to the standards shown
below using the ultrasonic test. The observed length of indication that exceeded the standard echo
height (echo: indication seen on the display of the flaw detector of pulse received after reflection from
boundary surface, bottom surface or defect in the specimen. Echo height: Height of echo reflected in the
display; may be expressed in dB as a ratio with standard level.) was less than 10% of the overall
inspected length.
The range of echo heights and the section areas of echo heights for evaluation were taken as Area I
below L line, Area II above L line but below M line, Area III above M line but below H line and Area IV
above H line. The detection level was prepared according to the procedure below.
1) Using a standard test piece, the standard hole (RB-41No.1φ3.0mm) is detected from the point where
the beam axis is reflected from the back face of plate. The sensitivity is adjusted until the height at
which maximum echo detected reaches 80%. This point is taken as the origin of the H line.
2) The echo height with sensitivity reduced by 6 dB from 1 is taken as the origin of M line; and the echo
height with sensitivity reduced by 12 dB is taken as the origin of L line.
3) Similarly, the echo height at the point where the beam reflected from the back surface reaches and the
echo height at the point where the reflected beam is further reflected at the back surface are both
joined.
The judgment on whether the standard echo height was exceeded or not was made taking the scan
distance equivalent to plate thickness for the M detection level at locations where Area III echoes are
detected; taking the scan distance equivalent to plate thickness for L detection level at locations where
Area II and Area III echoes are detected; and scan distance equivalent to half the plate thickness for M
or L detection level at locations where Area IV echoes are detected.
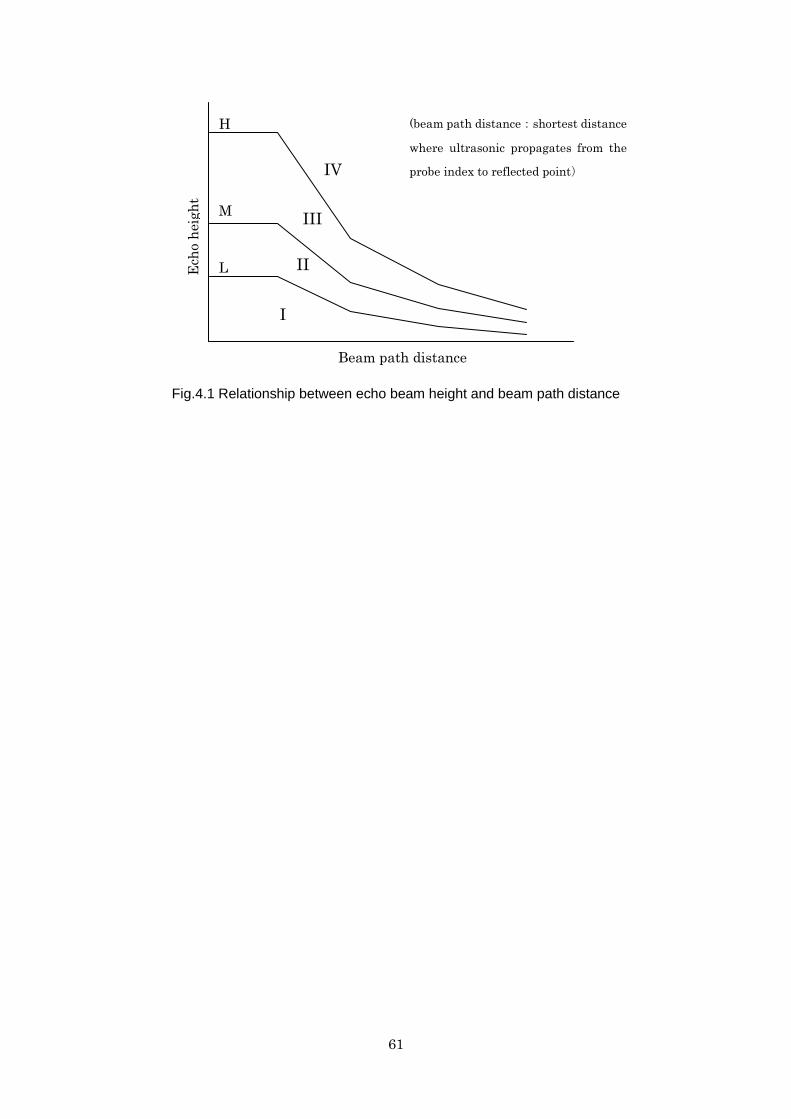
61
Fig.4.1 Relationship between echo beam height and beam path distance
Ech
o h
eig
ht
Beam path distance
L
M
H
I
II
III
IV
(beam path distance:shortest distance
where ultrasonic propagates from the
probe index to reflected point)
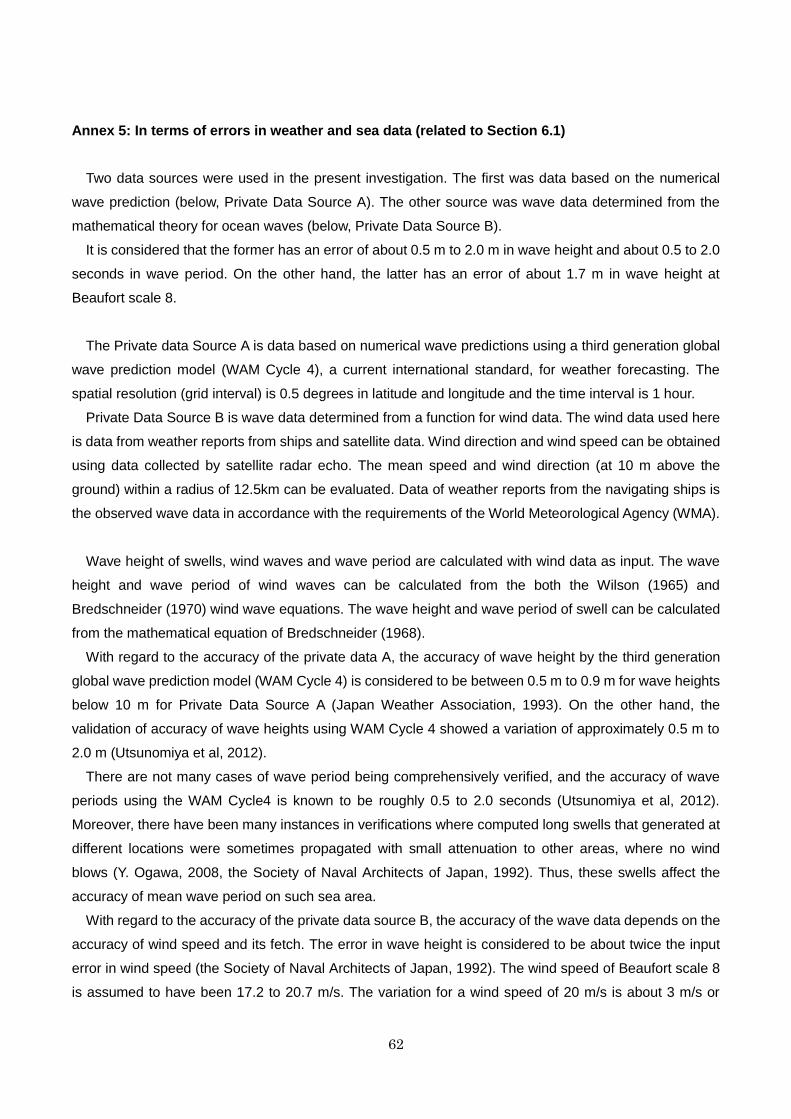
62
Annex 5: In terms of errors in weather and sea data (related to Section 6.1)
Two data sources were used in the present investigation. The first was data based on the numerical
wave prediction (below, Private Data Source A). The other source was wave data determined from the
mathematical theory for ocean waves (below, Private Data Source B).
It is considered that the former has an error of about 0.5 m to 2.0 m in wave height and about 0.5 to 2.0
seconds in wave period. On the other hand, the latter has an error of about 1.7 m in wave height at
Beaufort scale 8.
The Private data Source A is data based on numerical wave predictions using a third generation global
wave prediction model (WAM Cycle 4), a current international standard, for weather forecasting. The
spatial resolution (grid interval) is 0.5 degrees in latitude and longitude and the time interval is 1 hour.
Private Data Source B is wave data determined from a function for wind data. The wind data used here
is data from weather reports from ships and satellite data. Wind direction and wind speed can be obtained
using data collected by satellite radar echo. The mean speed and wind direction (at 10 m above the
ground) within a radius of 12.5km can be evaluated. Data of weather reports from the navigating ships is
the observed wave data in accordance with the requirements of the World Meteorological Agency (WMA).
Wave height of swells, wind waves and wave period are calculated with wind data as input. The wave
height and wave period of wind waves can be calculated from the both the Wilson (1965) and
Bredschneider (1970) wind wave equations. The wave height and wave period of swell can be calculated
from the mathematical equation of Bredschneider (1968).
With regard to the accuracy of the private data A, the accuracy of wave height by the third generation
global wave prediction model (WAM Cycle 4) is considered to be between 0.5 m to 0.9 m for wave heights
below 10 m for Private Data Source A (Japan Weather Association, 1993). On the other hand, the
validation of accuracy of wave heights using WAM Cycle 4 showed a variation of approximately 0.5 m to
2.0 m (Utsunomiya et al, 2012).
There are not many cases of wave period being comprehensively verified, and the accuracy of wave
periods using the WAM Cycle4 is known to be roughly 0.5 to 2.0 seconds (Utsunomiya et al, 2012).
Moreover, there have been many instances in verifications where computed long swells that generated at
different locations were sometimes propagated with small attenuation to other areas, where no wind
blows (Y. Ogawa, 2008, the Society of Naval Architects of Japan, 1992). Thus, these swells affect the
accuracy of mean wave period on such sea area.
With regard to the accuracy of the private data source B, the accuracy of the wave data depends on the
accuracy of wind speed and its fetch. The error in wave height is considered to be about twice the input
error in wind speed (the Society of Naval Architects of Japan, 1992). The wind speed of Beaufort scale 8
is assumed to have been 17.2 to 20.7 m/s. The variation for a wind speed of 20 m/s is about 3 m/s or
63
about 15%. For instance, if wind speeds with such variations are input, the variation of predicted wave
height will become approximately 30%. That is, if the wave height is taken as 5.5 m, a variation of about
1.7 m should arise.
The wave data in the accident according to these data sources A and B is shown in the table below.
Taking into account of the above mentioned errors, both kinds of data have almost equivalent values.
Significant
wave height (m)
Mean wave
period (sec.)
Wave direction
(true north 0 degree, clockwise)
Private data source A 5.5 10.3 225
Private data source B 5.32 8.7 233
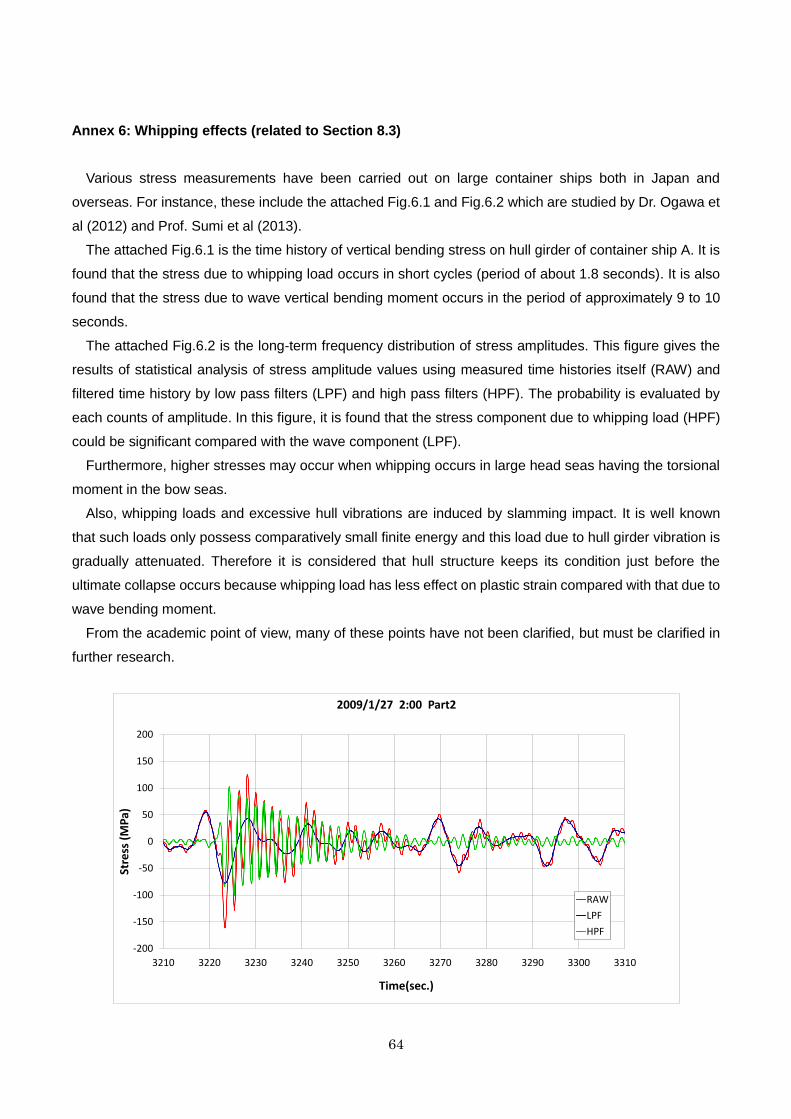
64
Annex 6: Whipping effects (related to Section 8.3)
Various stress measurements have been carried out on large container ships both in Japan and
overseas. For instance, these include the attached Fig.6.1 and Fig.6.2 which are studied by Dr. Ogawa et
al (2012) and Prof. Sumi et al (2013).
The attached Fig.6.1 is the time history of vertical bending stress on hull girder of container ship A. It is
found that the stress due to whipping load occurs in short cycles (period of about 1.8 seconds). It is also
found that the stress due to wave vertical bending moment occurs in the period of approximately 9 to 10
seconds.
The attached Fig.6.2 is the long-term frequency distribution of stress amplitudes. This figure gives the
results of statistical analysis of stress amplitude values using measured time histories itself (RAW) and
filtered time history by low pass filters (LPF) and high pass filters (HPF). The probability is evaluated by
each counts of amplitude. In this figure, it is found that the stress component due to whipping load (HPF)
could be significant compared with the wave component (LPF).
Furthermore, higher stresses may occur when whipping occurs in large head seas having the torsional
moment in the bow seas.
Also, whipping loads and excessive hull vibrations are induced by slamming impact. It is well known
that such loads only possess comparatively small finite energy and this load due to hull girder vibration is
gradually attenuated. Therefore it is considered that hull structure keeps its condition just before the
ultimate collapse occurs because whipping load has less effect on plastic strain compared with that due to
wave bending moment.
From the academic point of view, many of these points have not been clarified, but must be clarified in
further research.
-200
-150
-100
-50
0
50
100
150
200
3210 3220 3230 3240 3250 3260 3270 3280 3290 3300 3310
Stre
ss (
MP
a)
Time(sec.)
2009/1/27 2:00 Part2
RAW
LPF
HPF
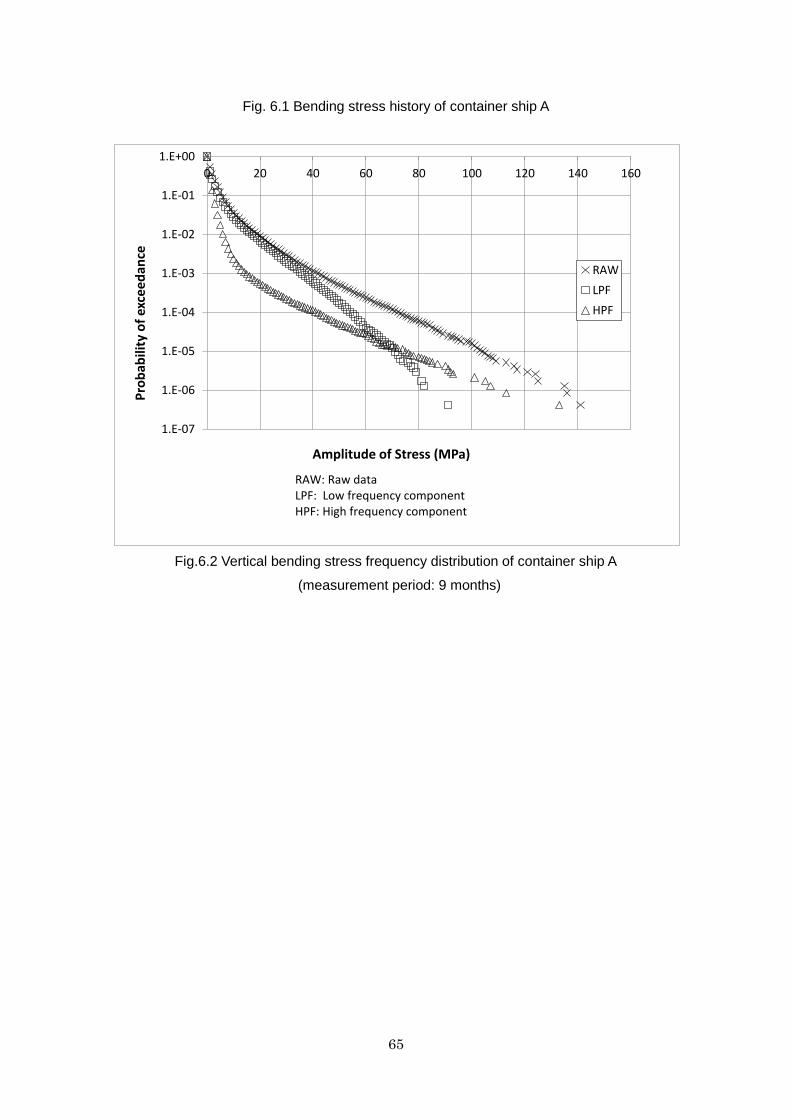
65
Fig. 6.1 Bending stress history of container ship A
Fig.6.2 Vertical bending stress frequency distribution of container ship A
(measurement period: 9 months)
1.E-07
1.E-06
1.E-05
1.E-04
1.E-03
1.E-02
1.E-01
1.E+00
0 20 40 60 80 100 120 140 160
Pro
bab
ility
of
exce
ed
ance
Amplitude of Stress (MPa)
RAW
LPF
HPF
RAW: Raw data LPF: Low frequency componentHPF: High frequency component
66
Annex 7
Committee on Large Container Ship Safety
Members List
Chair Person
Professor, Dr. Eng, Yoichi SUMI Yokohama National University
Members (Alphabetical order)
Professor, Dr. Eng, Masahiko FUJIKUBO Osaka University
Mr. Yoshikazu KAWAGOE Executive Officer, Mitsui O.S.K. Lines, Ltd.
Mr. Mitsuhiko KIDOGAWA Operating Officer,
General Manager of Hull Department
NIPPON KAIJI KYOKAI (ClassNK)
Mr. Kazuya KOBAYASHI Associate Officer, General Manager, Engineering
Division, Ship & Offshore Structure Company
Kawasaki Heavy Industries, Ltd.
Mr. Yoshiyuki NAKAJIMA General Manager of Planning & Development
Department
Japan Marine United Corporation
Mr. Toyohisa NAKANO General Manager, Technical Group
KAWASAKI KISEN KAISHA, LTD.
Mr. Mitsuhiko SUNOUCHI General Manager, Technical Group,
Nippon Yusen Kabushiki Kaisha
Dr. Eng, Kenkichi TAMURA National Maritime Research Institute
Mr. Naoki UEDA Senior General Manager
Ship & Ocean Engineering Department
Shipbuilding & Ocean Development Division
Commercial Aviation & Transportation Systems
Mitsubishi Heavy Industries, Ltd.
Secretary
Safety Policy Division, Maritime Bureau,
Ministry of Land, Infrastructure, Transport and Tourism