Embed Size (px)
Citation preview

1
Interleaved Parallelogram Fin ModuleTechnology Applied in Whitley platform
Auras Technology Inc.R&D III director
Chen, Hong-Long Ph.D陳恆隆 博士3 Oct, 2018
Icelake Intel design guide(Feb. 2018)
2 p Auras Confidential
Icelake Intel technical forum reference design(June. 2018)
I.P.F.M. technologyI.P.F.M. technologyI.P.F.M. technologyI.P.F.M. technologyIIIINTERLEAVED NTERLEAVED NTERLEAVED NTERLEAVED PPPPARALLEOGRAM ARALLEOGRAM ARALLEOGRAM ARALLEOGRAM FFFFin in in in MMMModule odule odule odule
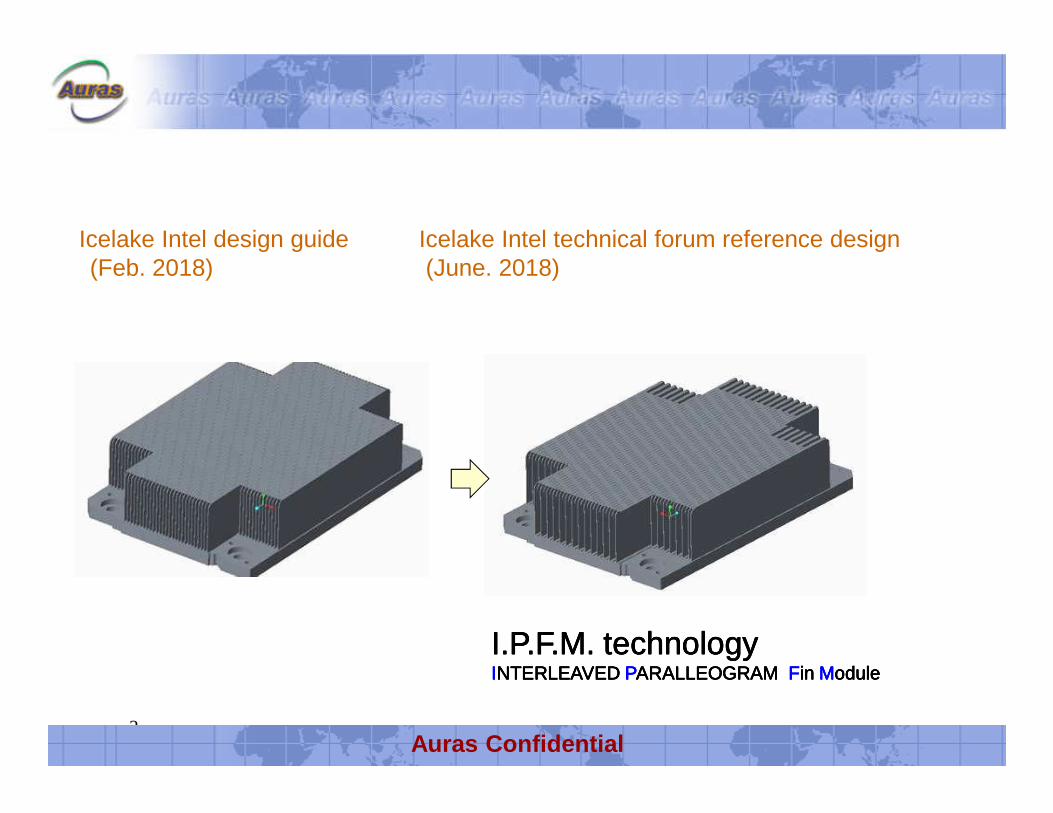
Schematics of IPFM vs. regular fin module
Remove triangular section byInterleaved pattern
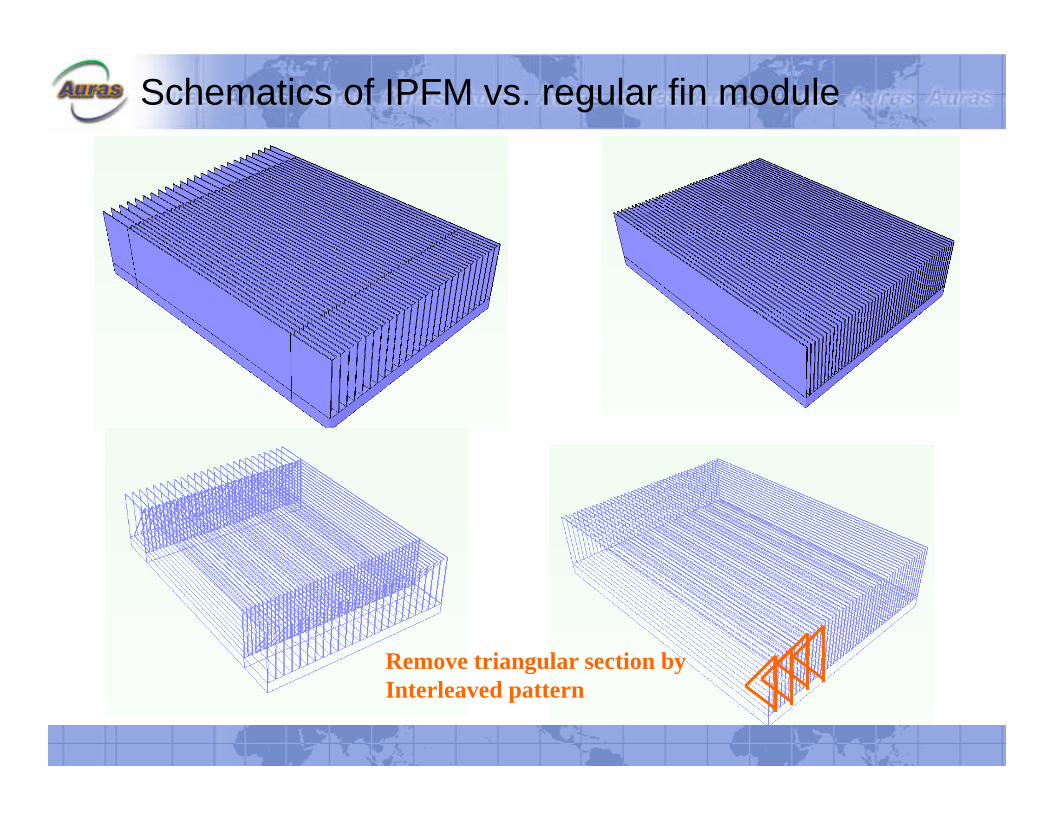
Icelake regular design
4 p Auras Confidential
Icelake IPFM design

Uniform finmore surface area
Better performance!!
IPFMLess surface area
Better performance!!
Summary:� IPFM performs better in lower CFM region� Uniform fin performs better in higher CFM region
If equal dP is considered:� IPFM may outperforms uniform fin for high/low CFM� Due to less dP to gain 5% more airflow
Test Result Analysis

Test of constant CFM vs. constant dP
IPFMOutperform uniform fin
In low & high CFM region!!
IPFM advantage than uniform fin:� The lower CFM, the lower Rth� Lower dP about 5-6%� More airflow about 6-7%� Lighter by 3-4 %
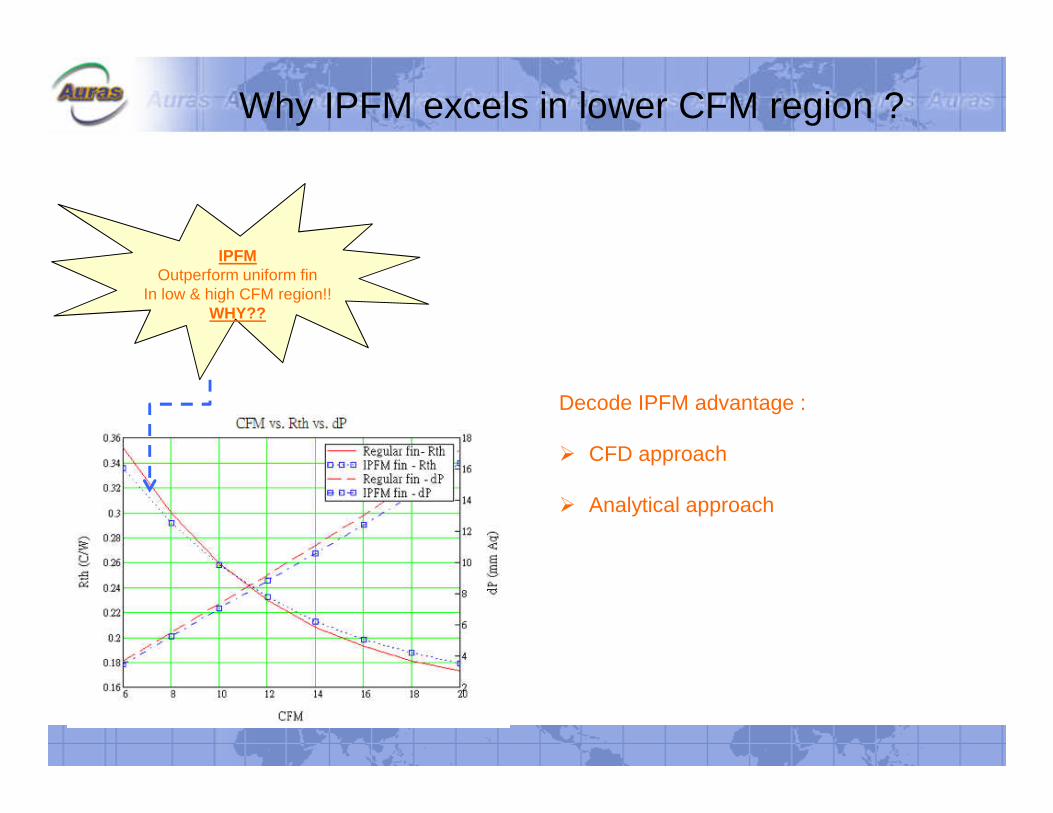
Why IPFM excels in lower CFM region ?
IPFMOutperform uniform fin
In low & high CFM region!!WHY??
Decode IPFM advantage :
� CFD approach
� Analytical approach
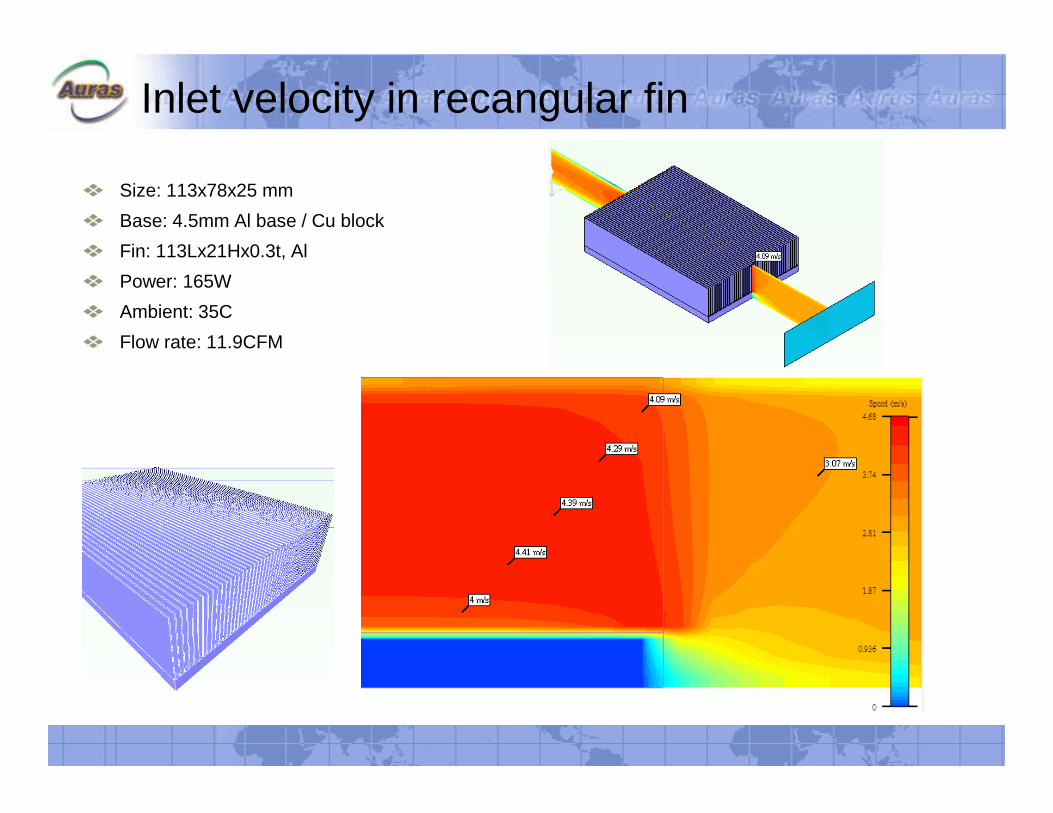
Size: 113x78x25 mm
Base: 4.5mm Al base / Cu block
Fin: 113Lx21Hx0.3t, Al
Power: 165W
Ambient: 35C
Flow rate: 11.9CFM
Inlet velocity in recangular fin
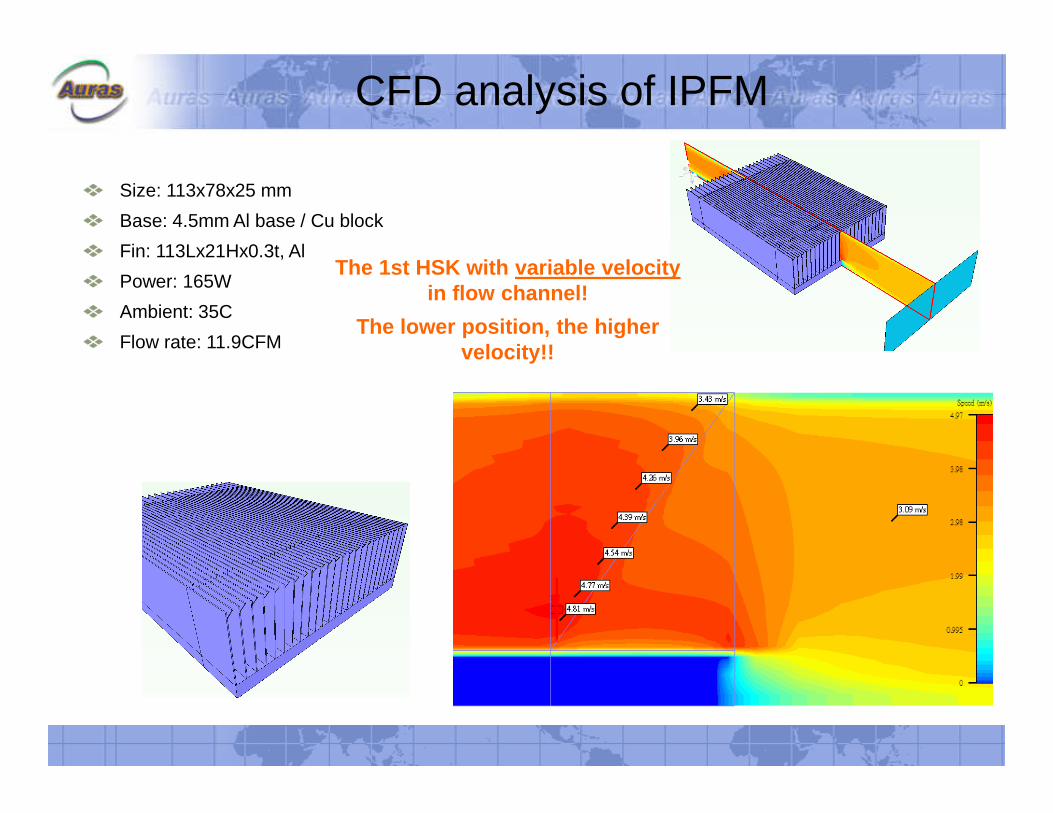
CFD analysis of IPFM
The 1st HSK with variable velocityin flow channel!
The lower position, the higher velocity!!
Size: 113x78x25 mm
Base: 4.5mm Al base / Cu block
Fin: 113Lx21Hx0.3t, Al
Power: 165W
Ambient: 35C
Flow rate: 11.9CFM
p 10
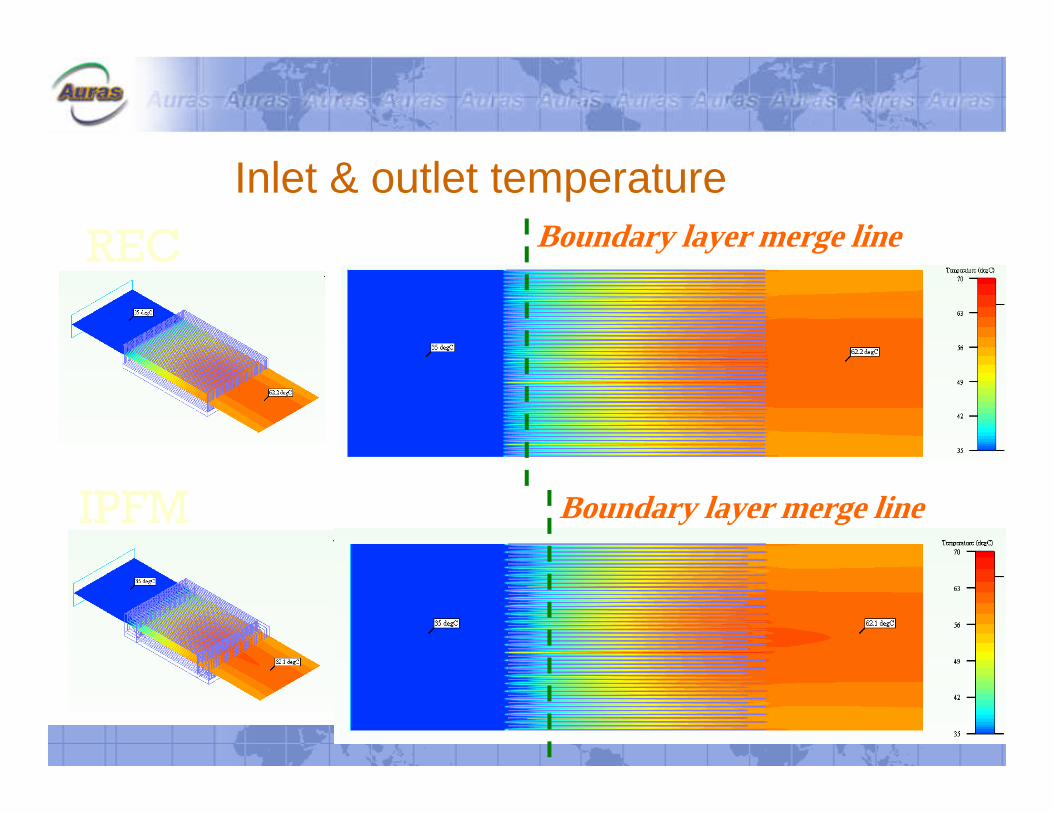
Inlet & outlet temperature
IPFM
REC Boundary layer merge line
Boundary layer merge line

p 11
Inlet & outlet temperature
IPFM
REC
p 12
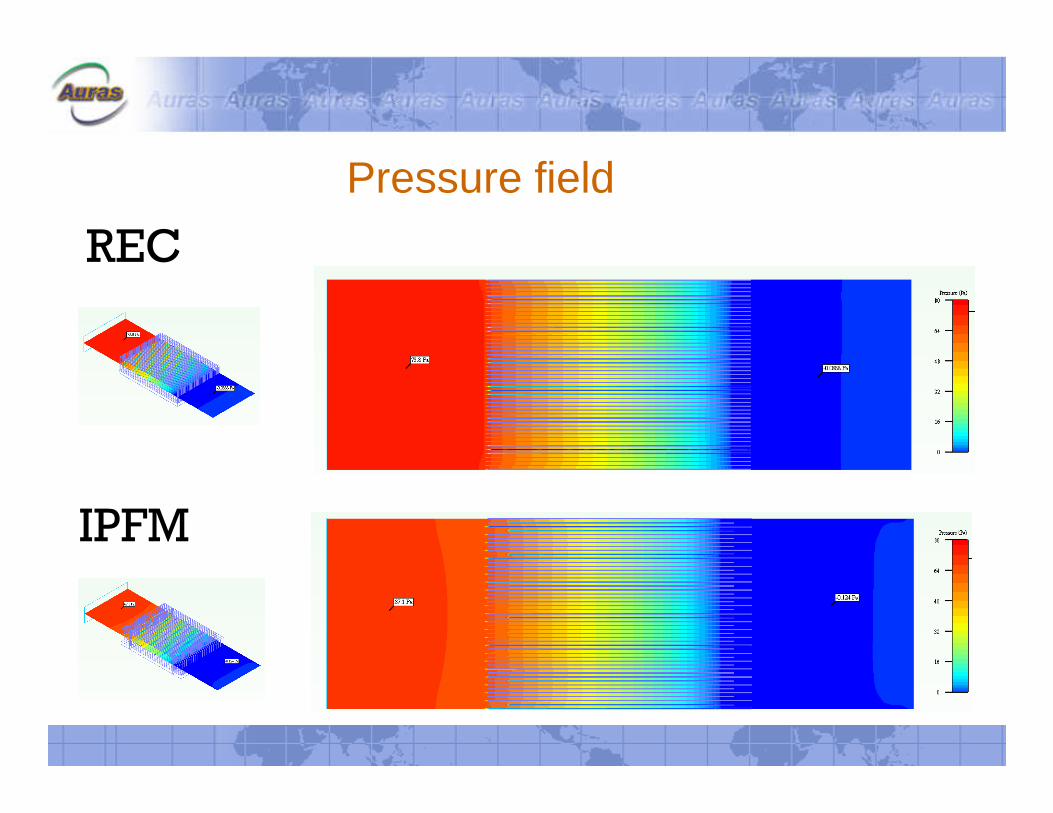
Pressure field
IPFM
REC

Pressure Drops of fin module
p Auras Confidential
• Inlet pressure drop
• Developing pressure drop
• Fully developed pressure drop
• Expansion pressure drop
• Acceleration pressure drop
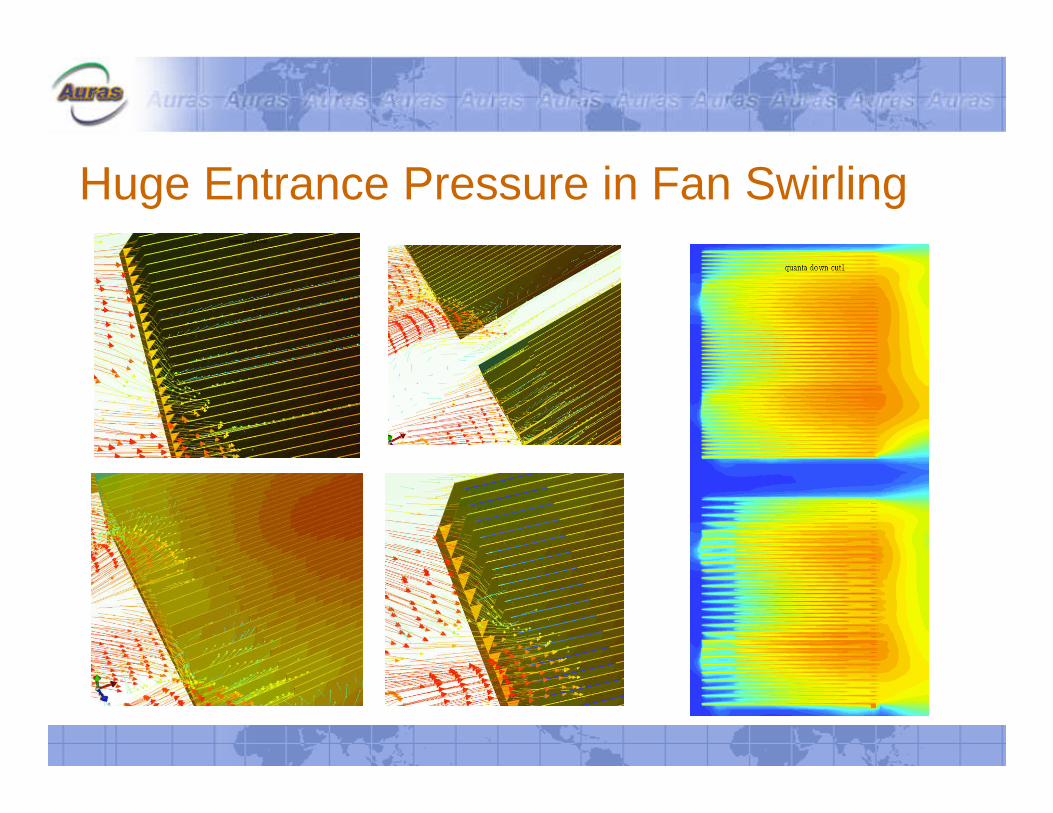
Huge Entrance Pressure in Fan Swirling
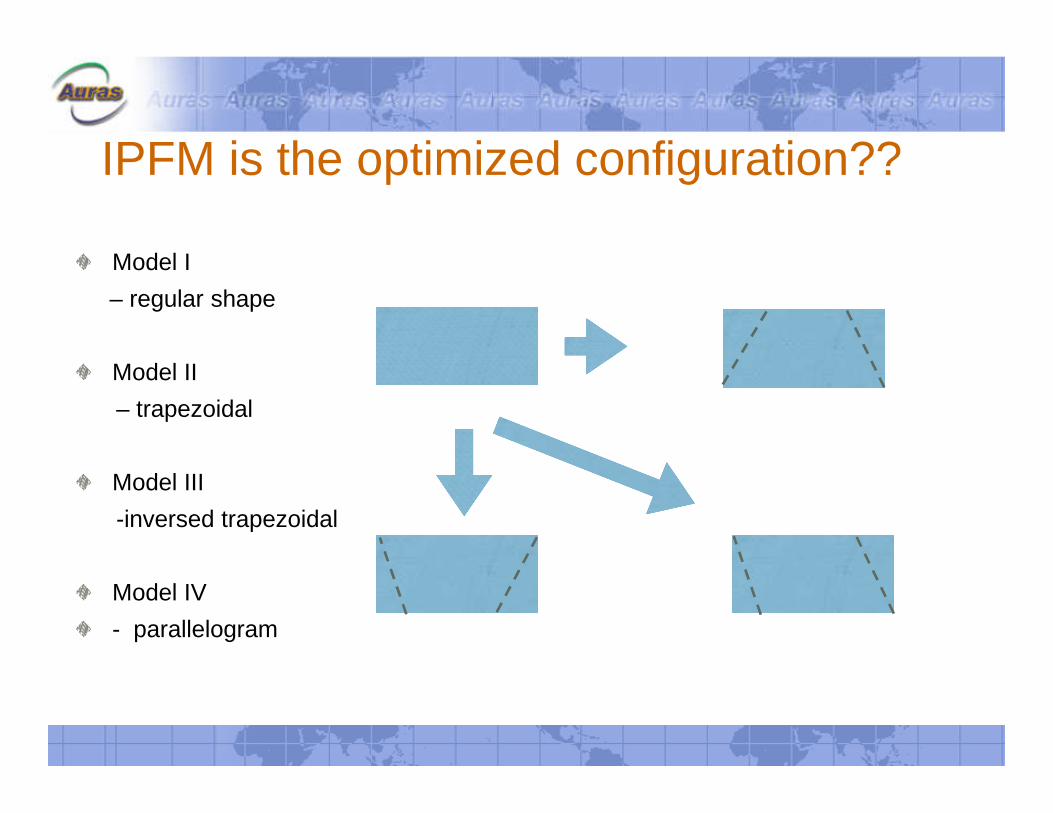
IPFM is the optimized configuration??
Model I
– regular shape
Model II
– trapezoidal
Model III
-inversed trapezoidal
Model IV
- parallelogram
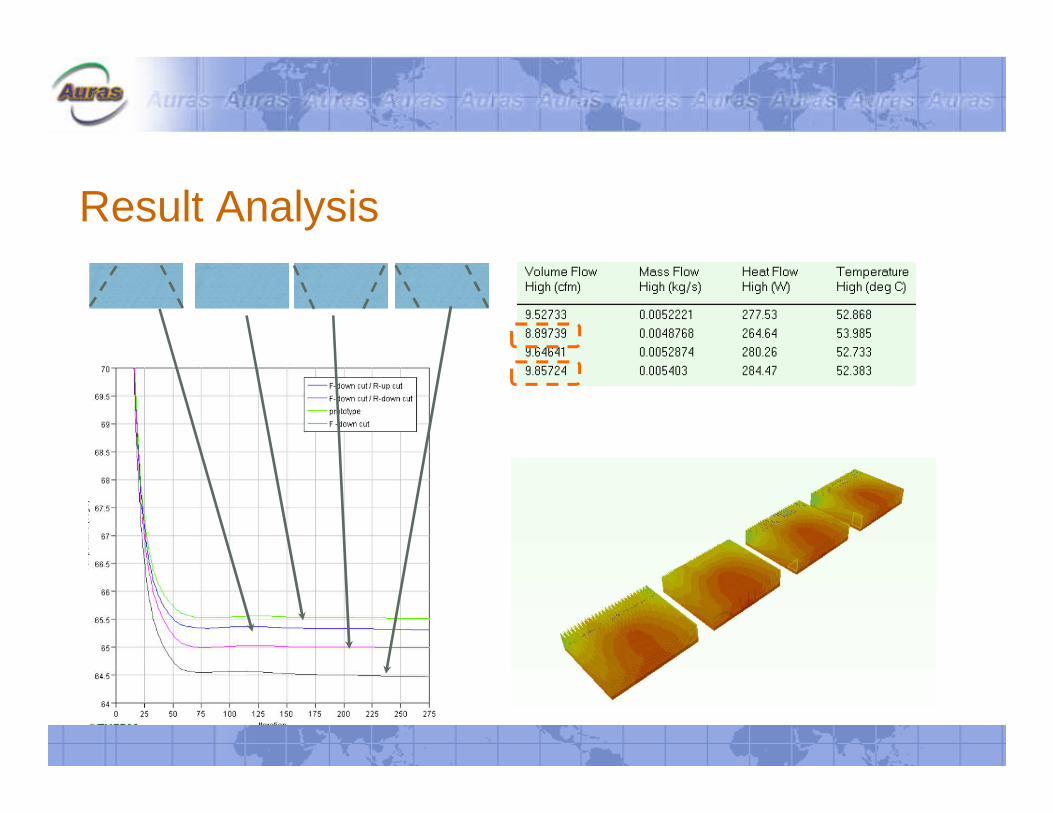
Result Analysis
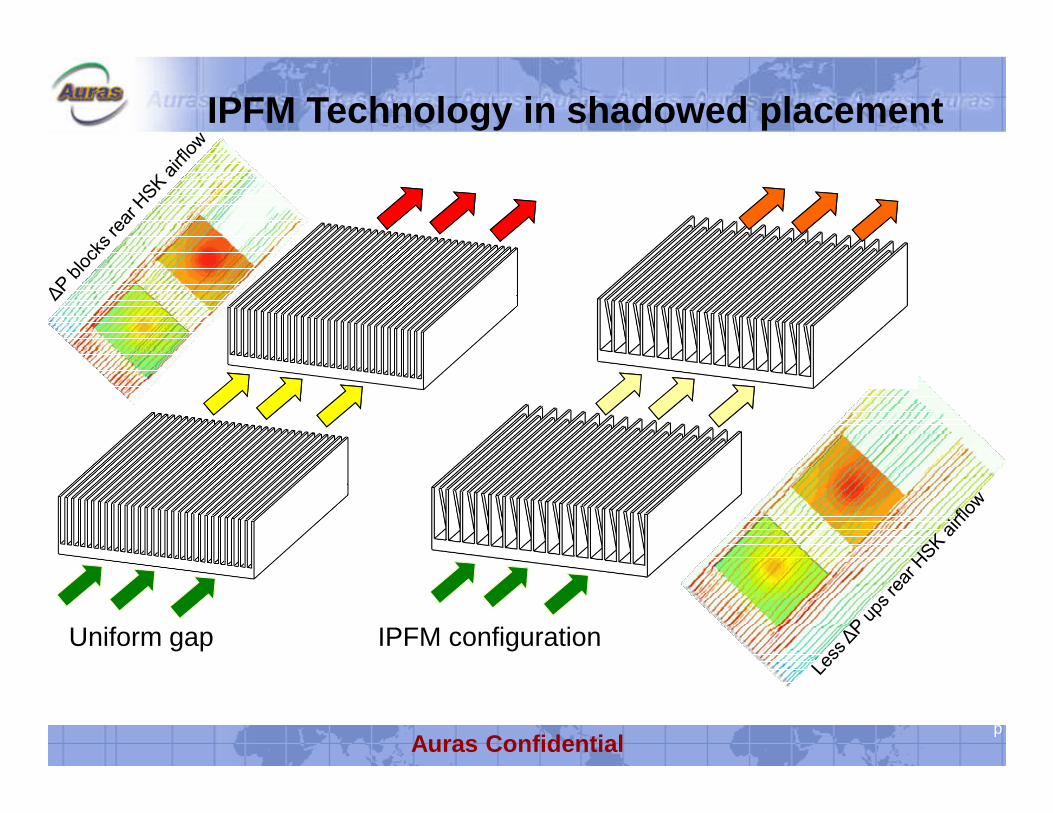
IPFM Technology in shadowed placement
p Auras Confidential
Uniform gap IPFM configuration
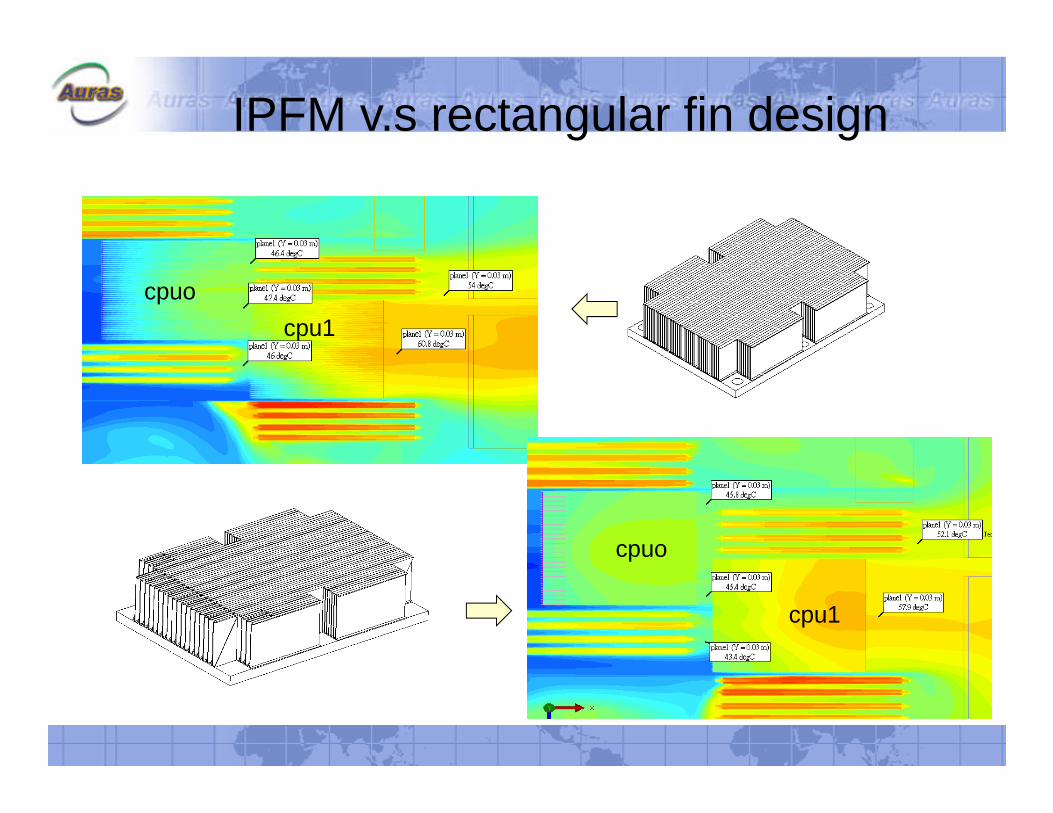
IPFM v.s rectangular fin design
cpuo
cpu1
cpuo
cpu1
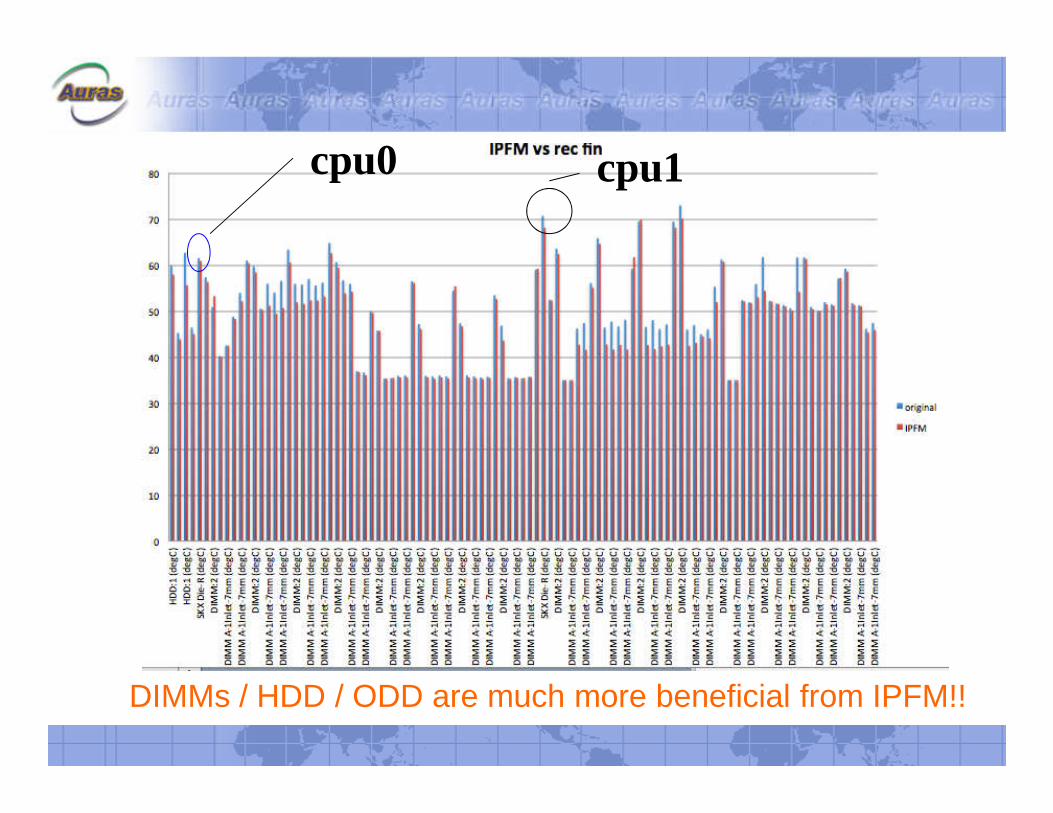
cpu0 cpu1
DIMMs / HDD / ODD are much more beneficial from IPFM!!

Theoretical / Mathematical Analysis
CFD hard to see the trend?

Pressure drop calculation process
p Auras Confidential
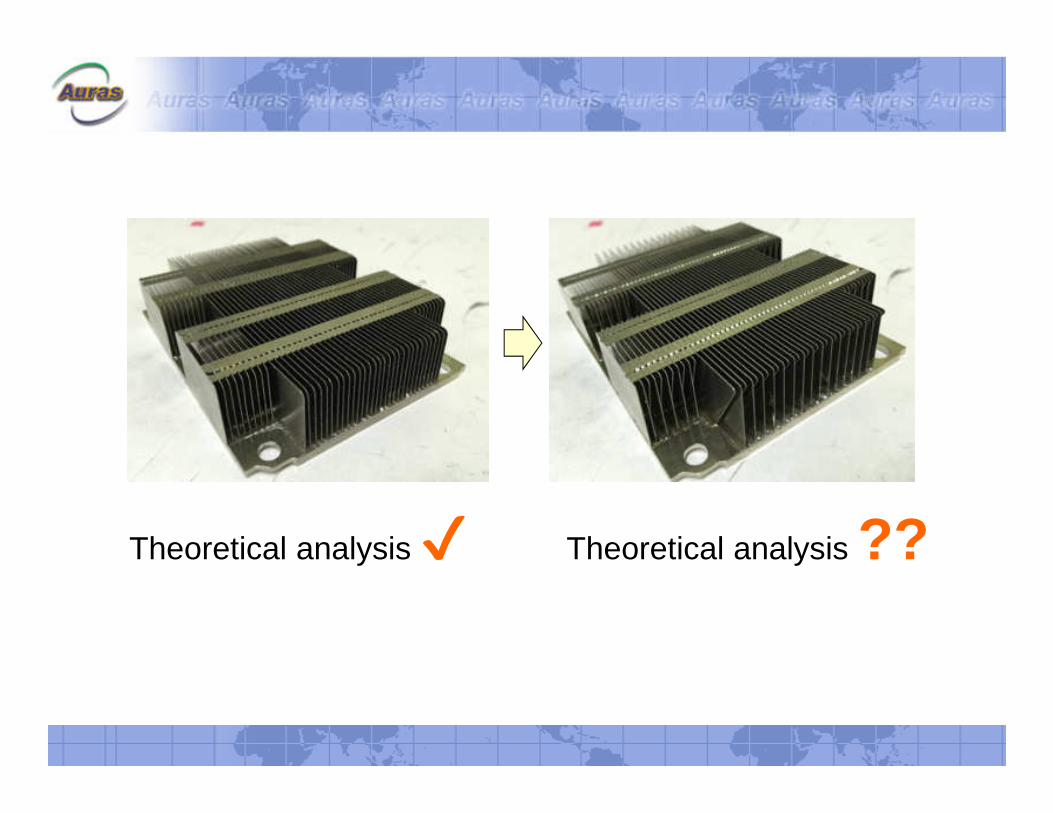
Theoretical analysis✔ Theoretical analysis ??

Uniform gap
Non-uniform gap


Comparison of theoretical & experimental result
CFM
5 10 15 20 25
P (
Pa)
0
20
40
60
80
100
120
Original theoreticalIPFM theoreticalOriginal experimentalIPFM experimental
Comparison of analytical & experimental results
Derived analytical estimation is closeto experimental results within acceptableaccuracy!
This derived algorithm can be used to predictThe relationship of cutting angle vs. dP vs. Rth

Wind tunnel test data
CFM
5 10 15 20 25
Rth
o C/W
0.15
0.20
0.25
0.30
0.35
0.40
0.45
0.50
Original designIPFM design
Comparison of analytical and experimental results
CFM
5 10 15 20 25
Rth
o C/W
0.15
0.20
0.25
0.30
0.35
0.40
0.45
0.50
Original experimentalIPFM experimentalOriginal analyticalIPFM analytical
Comparison of analytical results
CFM
5 10 15 20 25
Rth
o C/W
0.15
0.20
0.25
0.30
0.35
0.40
0.45
0.50
Original designIPFM design
Derived analytical estimation is closeto experimental results within acceptableaccuracy!
This derived algorithm can be used to predictThe relationship of CFM vs. Rth
Relationship of CFM vs. Rth

Relationship of cutting angle vs. fins vs. dP vs. Rth

Nu =C*Rem *Prn
Re=(V*2s)/ν
Reasons of IPFM unique characteristics for h value
Why IPFM is better?
h (W
/m2 C
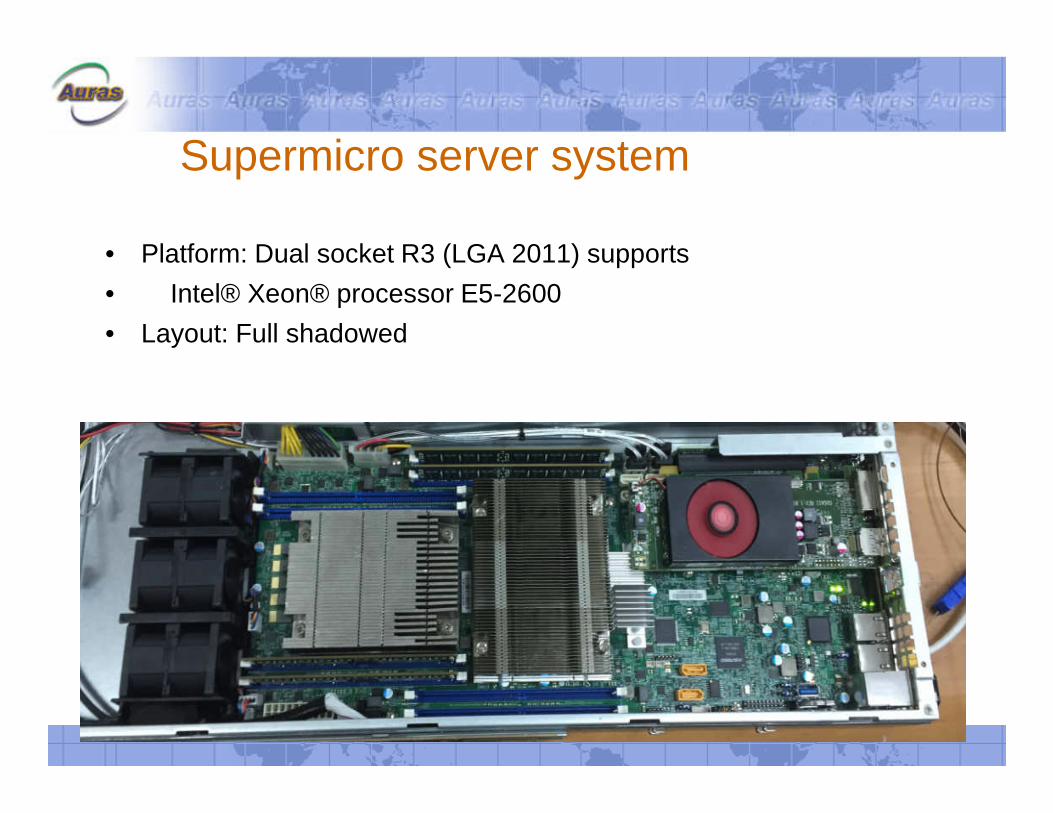
Supermicro server system
• Platform: Dual socket R3 (LGA 2011) supports
• Intel® Xeon® processor E5-2600
• Layout: Full shadowed

Test of velocity
Flow testFlow (m/s) Super micro Standard fin IPFM
Fan 1.3 1.11 1.22Front 2.42 2.58 2.7Mid 2.16 2.34 2.6Rear 1.88 2.18 2.45 0
0.5
1
1.5
2
2.5
3
Fan Front Mid Rear
Flow at each location Super micro Standard finIPFM

p 31
Thanks for your attention!