Embed Size (px)
Citation preview
中国科技论文在线 http://www.paper.edu.cn
International Journal of Machine Tools & Manufacture 53 (2012) 127–140
Contents lists available at SciVerse ScienceDirect
International Journal of Machine Tools & Manufacture
0890-69
doi:10.1
n Corr
E-m
journal homepage: www.elsevier.com/locate/ijmactool
Milling stability analysis with simultaneously considering the structuralmode coupling effect and regenerative effect
Xiao Jian Zhang a, Cai Hua Xiong a,n, Ye Ding b, Ming Jun Feng c, You Lun Xiong a
a State Key Laboratory of Digital Manufacturing Equipment and Technology, School of Mechanical Science and Engineering,
Huazhong University of Science and Technology, Wuhan 430074, Chinab State Key Laboratory of Mechanical System and Vibration, School of Mechanical Engineering, Shanghai Jiao Tong University, Shanghai 200240, Chinac Modern Manufacture Engineering Center, Heilongjiang Institute of Science and Technology, Harbin 150027, China
a r t i c l e i n f o
Article history:
Received 18 May 2011
Received in revised form
14 October 2011
Accepted 18 October 2011Available online 25 October 2011
Keywords:
Stability prediction
Milling
Mode coupling
Cross coupled terms
Cross modal function
Regenerative effect
55/$ - see front matter & 2011 Elsevier Ltd. A
016/j.ijmachtools.2011.10.004
esponding author.
ail address: [email protected] (C.H. X
a b s t r a c t
Machining stability analysis is important for chatter avoidance and machining efficiency improvement.
To accurately predict the stability, the chatter mechanism must be recognized. Chatter is a kind of self-
excited vibrations and the two most widely used theories explaining chatter in milling are the
regenerative effect and the mode coupling effect. However, these two mechanisms are always
separately considered in the previous stability researches, and none of them can explain the great
difference between the stability prediction results with the classical model and the experimental
results in many cases. This paper investigates the structural mode coupling effect in the regenerative
milling stability analysis. Based on lots of experimental data, we found that these two mechanisms
actually co-exist during the practical milling process, and the usually neglected structural mode
coupling effect has a great effect on the stability lobe diagram in many practical milling cases. The
theoretical prediction taking the cross coupled terms into account alters the stability boundary and
such prediction is verified by the chatter experimental results.
& 2011 Elsevier Ltd. All rights reserved.
1. Introduction
Chatter stability predictions are appreciated during manymachining operations in modern automotive and aerospace indus-try. To accurately predict the stability lobe diagram is veryimportant to avoid the machining chatter and improve the pro-ductivity. There are vast researches about the stability predictionand various mechanisms are proposed to explain the self-excitedchatter in turning and milling. The two most widely used theoriesare the regenerative effect and the mode coupling effect [1,2].
The regenerative effect is based on the fact that the tool cuts asurface already cut during the previous revolution, the cuttingforce varies as well as the chip thickness, leading to the time delayof the dynamic equation. The classical regenerative vibrationmodel plays an essential role in machine tool vibrations. For mostcases taking the regenerative effect into account, the structuralmode coupling effect is neglected. The frequency response func-tion (FRF) matrix of the most flexible structure (machine–tool) isassumed diagonal, i.e. the vibration modes in different directionsare assumed uncoupled and the cross FRFs are considered as zeros.For the frequency domain methods [3–5], such simplification
ll rights reserved.
iong).
leads to the analytic expression of the solution [6]. There are alsomany other methods handling the stability prediction of theregenerative chatter besides the frequency domain methods, suchas the time domain methods [7–12], the numerical simulationmethod [13,14], the semi-discretization method [15,16], theLambert function based method [17,18], the Chebyshev colloca-tion method [19], the full-discretization method [20], etc.
In fact, the real multiple degree-of-freedom (DOF) systemvibrates simultaneously in many directions, with different ampli-tudes and phases, which is mode coupling. Mode-couplinginstability can occur when successive passes of the tool do notoverlap, and results from a particular motion of the tool relativeto the workpiece in the presence of closely coupled modes ofvibration of the structure. Its vibration amplitude has no fixeddirection because the tool follows an elliptical path relative to theworkpiece, which is different from the regenerative chatter whosevibration amplitude has a fixed direction. The mode coupledmechanism can explain the instability vibration when successivepasses of the tool do not overlap, while the regenerative cannot.The theory of mode coupled demonstrates that the cuttingstability of the machine tool is not only dependent on the stiffnessand damping, but also influenced by the variation and orientationof the interaction of the modes, and the theory is successfullyapplied to some practical cases to improve the cutting stabilitywithout increasing the weight of the machine tool much [21,22].
转载
中国科技论文在线 http://www.paper.edu.cn
x
y
kxt
cxt
cytkyt
Ft
�
X.J. Zhang et al. / International Journal of Machine Tools & Manufacture 53 (2012) 127–140128
However, this type of instability will not be significant forconditions where successive passes of the cutting tool overlapeach other [22]. Therefore, it is believed that instability usuallytakes place as a result of ‘‘regeneration principle’’ earlier than bymode coupling in most machining cases [23]. Moreover, the crossFRFs of the machine–tool structure are neglected since thecoupling dynamics (cross coupled terms) are always being con-sidered to have little influence on the cutting stability for acomputer numerically controlled (CNC) machine, due to the factthat the structure stiffness is usually hundreds of times of themachining process stiffness [24].
Parallel to the research of the regenerative chatter, there arealso many works on the mode coupling chatter analysis. Ismailand Vadari [25] improved their chatter performance in slotting bymodifying the regular slender end mills to weaken the contribu-tion of the mode coupling mechanism to chatter. Gasparetto[26,27] analyzed the mode coupling chatter in turning from theviewpoint of the system theory. Gallina and Trevisani [28]explored the mode coupling phenomenon using the state-spaceform for a wood milling process. Pan et al. [24] analyzed the modecoupling chatter of robot machining, and gave the availableexplanation that mode coupling chatter may happen if thestructure stiffness is not significantly higher than machiningprocess stiffness. Iturrospe et al. [29] proposed a state-spaceanalysis method for mode coupling in orthogonal metal cutting.Hoffmann and Gaul [30] investigated the relationship betweenthe mode coupling instability and the viscous damping of struc-ture. In these works, the mode coupling chatter is analyzed, butthe regenerative effect is neglected.
The regenerative effect and the mode coupling effect are alwaysseparately considered in the previous researches to explain the self-excited vibrations. To the best of the knowledge of the authors, thereare few works in machining about the combination between theregenerative chatter analysis and structural mode-coupled chatteranalysis. Kalmar-Nagy and Moon [31] examined the couplingbetween multiple DOF tool dynamics and the regenerative effectin turning, and the numerical simulation shows the mode-couplednonconservative cutting tool model with time delay can producenew regions of instability. Gradisek et al. [32] conducted somenumerical simulation, and the result reveals that even weak modecoupling influence the predicted stability boundary greatly.
According to lots of milling experimental results in differentmachine tools, we found that there is still a great difference betweenthe stability prediction with the classical model and the experi-mental results in many cases, even when lots of factors are excluded,such as big cutter runout (tooth jump-out) [33,34], low speedprocess damping [35], big impact testing uncertainty [36], etc.
This paper investigates the milling stability with the structuralmode coupling effect and the regenerative effect simultaneouslyand tries to explain the great difference between the stabilityprediction with the classical model and the experimental results.Compared with the previous stability analysis, the main contribu-tions of the paper lie in the fact that these two mechanisms,which actually co-exist during the practical milling process, arepointed out and verified by the experimental results, and theusually neglected structural mode coupling effect is explored tohave a great effect on the stability analysis in many milling cases.Therefore, the structural coupling effect needs to be considered inthe regenerative milling stability analysis and such predictionagrees well with the actual milling experimental results. Weconsider the mode coupled effect in the regenerative chattermainly based on the following facts:
Fn
vfz
�
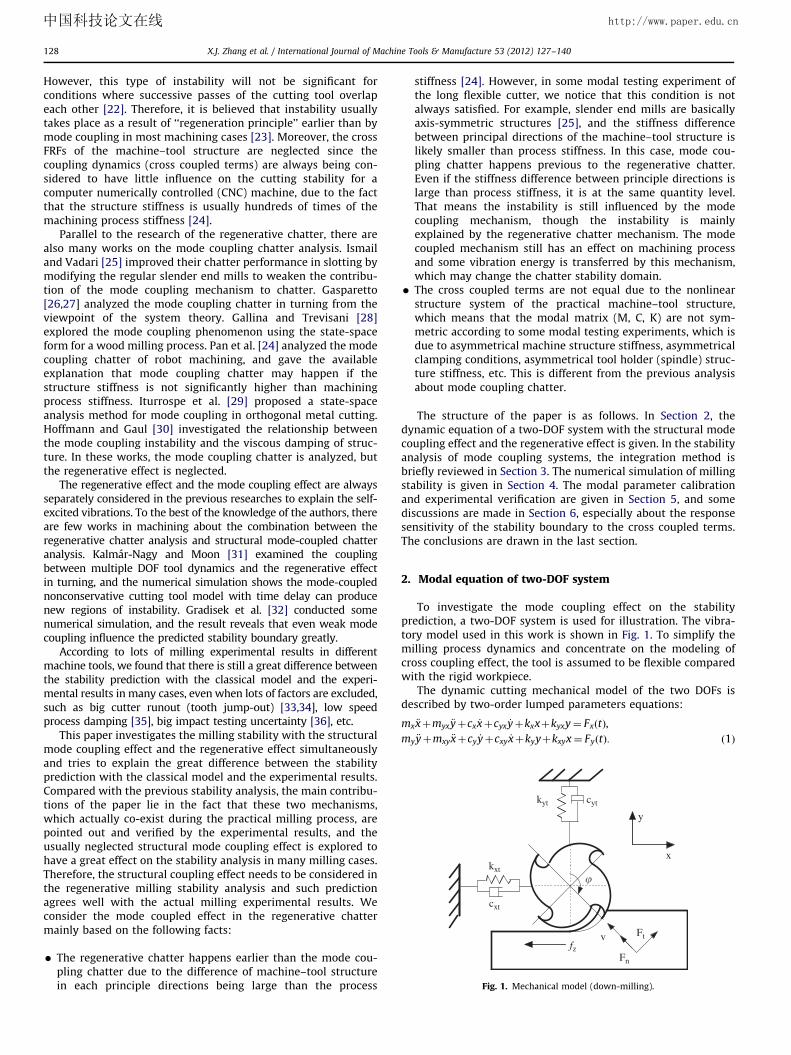
Fig. 1. Mechanical model (down-milling).
The regenerative chatter happens earlier than the mode cou-pling chatter due to the difference of machine–tool structurein each principle directions being large than the process
stiffness [24]. However, in some modal testing experiment ofthe long flexible cutter, we notice that this condition is notalways satisfied. For example, slender end mills are basicallyaxis-symmetric structures [25], and the stiffness differencebetween principal directions of the machine–tool structure islikely smaller than process stiffness. In this case, mode cou-pling chatter happens previous to the regenerative chatter.Even if the stiffness difference between principle directions islarge than process stiffness, it is at the same quantity level.That means the instability is still influenced by the modecoupling mechanism, though the instability is mainlyexplained by the regenerative chatter mechanism. The modecoupled mechanism still has an effect on machining processand some vibration energy is transferred by this mechanism,which may change the chatter stability domain.
� The cross coupled terms are not equal due to the nonlinearstructure system of the practical machine–tool structure,which means that the modal matrix (M, C, K) are not sym-metric according to some modal testing experiments, which isdue to asymmetrical machine structure stiffness, asymmetricalclamping conditions, asymmetrical tool holder (spindle) struc-ture stiffness, etc. This is different from the previous analysisabout mode coupling chatter.
The structure of the paper is as follows. In Section 2, thedynamic equation of a two-DOF system with the structural modecoupling effect and the regenerative effect is given. In the stabilityanalysis of mode coupling systems, the integration method isbriefly reviewed in Section 3. The numerical simulation of millingstability is given in Section 4. The modal parameter calibrationand experimental verification are given in Section 5, and somediscussions are made in Section 6, especially about the responsesensitivity of the stability boundary to the cross coupled terms.The conclusions are drawn in the last section.
2. Modal equation of two-DOF system
To investigate the mode coupling effect on the stabilityprediction, a two-DOF system is used for illustration. The vibra-tory model used in this work is shown in Fig. 1. To simplify themilling process dynamics and concentrate on the modeling ofcross coupling effect, the tool is assumed to be flexible comparedwith the rigid workpiece.
The dynamic cutting mechanical model of the two DOFs isdescribed by two-order lumped parameters equations:
mx €xþmyx €yþcx _xþcyx _yþkxxþkyxy¼ FxðtÞ,
my €yþmxy €xþcy _yþcxy _xþkyyþkxyx¼ FyðtÞ: ð1Þ
中国科技论文在线 http://www.paper.edu.cn
X.J. Zhang et al. / International Journal of Machine Tools & Manufacture 53 (2012) 127–140 129
Eq. (1) can be re-presented in the matrix form as
mx myx
mxy my
" #€x
€y
" #þ
cx cyx
cxy cy
" #_x
_y
" #þ
kx kyx
kxy ky
" #x
y
" #¼
FxðtÞ
FyðtÞ
" #
ð2Þ
where m, c, k are the modal mass, modal damping and modalstiffness, respectively. The cross components indicate the crossmodal mass, cross modal damping and cross modal stiffness,which characterizes the occurrence of the vibration in onedirection excited by the force in another direction. The subscript‘yx’ denotes the vibration in the y direction is caused by the forcein the x direction, and the subscript ‘xy’ indicates the response inthe x direction from the excitation in the y direction. Fx (t) and Fy
(t) are the time-dependent cutting forces due to the tool rotation.
KcðtÞ ¼1
2Ktc
XN
j ¼ 1
Z ap
0
�gj½sin2fjþKrð1�cos2fjÞ� �gj½1þcos2fjþKr sin2fj�
gj½ð1�cos2fjÞ�Kr sin2fj� gj½sin2fj�Krð1þcos2fjÞ�
" #dz, Kr ¼
Knc
Ktc
F0 ¼
XN
j ¼ 1
Z ap
0gðt,zÞ½f z sinðjjÞðKtc cosjjþKnc sinjjÞþðKte cosjjþKne sinjjÞ�dz
XN
j ¼ 1
Z ap
0gðt,zÞ½f z sinðjjÞð�Ktc sinjjþKnc cosjjÞþð�Kte sinjjþKne cosjjÞ�dz
26666664
37777775
, qðtÞ ¼xðtÞ
yðtÞ
" #:
If the helix angle ‘b’ is considered, the differential disk force of thej-th tooth along the depth of cut can be expressed as
dFjxðt,zÞ ¼ dFjtðt,zÞcosjjðt,zÞþdFjnðt,zÞsinjjðt,zÞ,
dFjyðt,zÞ ¼�dFjtðt,zÞsinjjðt,zÞþdFjnðt,zÞcosjjðt,zÞ: ð3Þ
where
jjðt,zÞ ¼2pO60
t�ztanb
Rþ j
2pN
, ð4Þ
where O is the spindle speed in (rpm), z denotes the axialdirection, R is the radius of the tool and N is the number of teeth.The helix angle is not considered in this research for simplifica-tion according to Ref. [23] that the axial depth is small comparedwith the diameter of the tool. The tangential and the normalforces acting on this differential element are
dFjtðt,zÞ ¼ gðjjðt,zÞÞ½Ktcðf jðt,zÞÞdzþKtedz�,
dFjnðt,zÞ ¼ gðjjðt,zÞÞ½Kncðf jðt,zÞÞdzþKnedz�:ð5Þ
where Ktc and Knc are the tangential and the normal cuttingcoefficients, Kte and Kne are the tangential and the normal edgecoefficients, respectively, and fj(t, z) is the instantaneous chipthickness of the j-th tooth. The function g(t) is the screen function,which is equal to 1, if the j-th tooth is in cut, and is 0, if not. Thechip thickness f jðt,zÞ in Eq. (5) can be expressed as
f jðt,zÞ ¼ ðf zþxðt�TÞ�xðtÞÞsinðjjðt,zÞÞþðyðt�TÞ�yðtÞÞcosðjjðt,zÞÞ,
ð6Þ
where fz is the nominal feed per tooth and T¼60/(NO) is thenominal tooth passing period.
The resultant forces are the sum of the forces acting on theteeth
FxðtÞ ¼XN
j ¼ 1
FjxðtÞ ¼XN
j ¼ 1
Z ap
0dFjxðt,zÞ
¼XN
j ¼ 1
Z ap
0gðjjðt,zÞÞðf jðt,zÞÞðKtc cosjjðt,zÞþKnc sinjjðt,zÞÞdz
þXN
j ¼ 1
Z ap
0gðjjðt,zÞÞðKte cosjjðt,zÞþKne sinjjðt,zÞÞdz,
FyðtÞ ¼XN
j ¼ 1
FjyðtÞ ¼XN
j ¼ 1
Z ap
0dFjyðt,zÞ
¼XN
j ¼ 1
Z ap
0gðjjðt,zÞÞðf jðt,zÞÞð�Ktc sinjjðt,zÞþKnc cosjjðt,zÞÞdz
þXN
j ¼ 1
Z ap
0gðjjðt,zÞÞð�Kte sinjjðt,zÞþKne cosjjðt,zÞÞdz, ð7Þ
where ap is the axial depth of cut.By substituting Eq.(7) into Eq. (2), the equations of motion can
be written as follows:
M €qðtÞþC _qðtÞþKqðtÞ ¼KcðtÞ½qðtÞ�qðt�TÞ�þF0, ð8Þ
where
It can be seen that the F(t) is the excitation with theregenerative effect and the term F0 is the steady force excitation,which is relative to the surface location error [37]. Since thesteady force excitation is unrelated to the linear chatter stabilityprediction, so the F0 can be dropped.
By transformation pðtÞ ¼M _qðtÞþCqðtÞ=2 and xðtÞ ¼ ½qðtÞ=pðtÞ�T ,Eq. (8) can be re-written as
_xðtÞ ¼ AxðtÞþBðtÞ½xðtÞ�xðt�TÞ� ð9Þ
where
A¼�M�1
ðC=2Þ M�1
CM�1ðC=4Þ�K �CðM�1=2Þ
" #and BðtÞ ¼
0 0
KcðtÞ 0
" #:
3. Integration method and stability analysis
The solution of Eq. (9) can be expressed in the integrationform:
xðtÞ ¼ eAðt�t0Þxðt0Þþ
Z t
t0
feAðt�xÞBðxÞ½xðxÞ�xðx�TÞ�gdx, ð10Þ
where xðt0Þ is the state value at time t0. To solve this equation, theintegration method is used to analyze the stability analysisbecause it has better numerical accuracy and calculation effi-ciency, especially in the low immersion cases [38]. This method[38] is briefly presented here only for completeness and clarity ofthis paper. The tooth passing period interval T is divided into twoparts: the free vibration interval tf and the forced vibrationinterval (T�tf). At the end of the free vibration, the state value is
xðt0þtf Þ ¼ eAtf xðt0Þ: ð11Þ
When in the time of forced vibration interval, the cutting time(T�tf) is equally divided as n small subintervals, and the time stepis t¼ ðT�tf Þ=n. For the corresponding discretized time pointsti ¼ t0þtf þði�1Þt (i¼ 1,. . .,nþ1 and xðt1Þ ¼ xðt0þtf Þ), xðtiÞ is
中国科技论文在线 http://www.paper.edu.cn
X.J. Zhang et al. / International Journal of Machine Tools & Manufacture 53 (2012) 127–140130
approximated by Newton–Cotes formulas according to Ref. [38].
xðtiÞ ¼ eAðti�ti�1Þxðti�1Þþt2
eAðti�ti�1ÞBðti�1Þðxðti�1Þ�xðti�1�TÞÞ
þBðtiÞðxðtiÞ�xðti�TÞÞ
" #
ð12Þ
Then, by combining the free vibration and forced vibration, thediscrete dynamical map can be deduced from Eqs. (11) and (12)
I�CIM�t2
DIM
� � xðt1Þ
^
xðtnþ1Þ
264
375¼ � t
2DIMþEIM
� � xðt1�TÞ
^
xðtnþ1�TÞ
264
375, ð13Þ
where
CIM ¼
0
eAt 0
eAt 0
& &
eAt 0
26666664
37777775
,
DIM ¼
0
eAtB1 B2
eAtB2 B3
& &
eAtBn Bnþ1
26666664
37777775
,
EIM ¼
0 � � � 0 eAtf
0 � � � 0 0
^ & ^ ^
0 � � � 0 0
26664
37775:
Thereafter, the Floquet transition matrix U on one toothpassing period can be expressed as
U¼ I�CIM�t2
DIM
� ��1�t2
DIMþEIM
� �: ð14Þ
Finally, the chatter stability can be determined via Floquettheory [39].
Table 1Modal parameters of the diagonal matrix elements.
Diagonal matrix elements xx yy
Mass M (g) 20.1 19.9
Damping C (kg/s) 1.56 1.60
Stiffness K (kN/m) 414 409
Spindle Speed [rpm]
Axi
al D
epth
[m]
1 1.5 2 2.5 3 3.50
2
4
6
8
x 10-3
no cross functionwith cross function
x 104
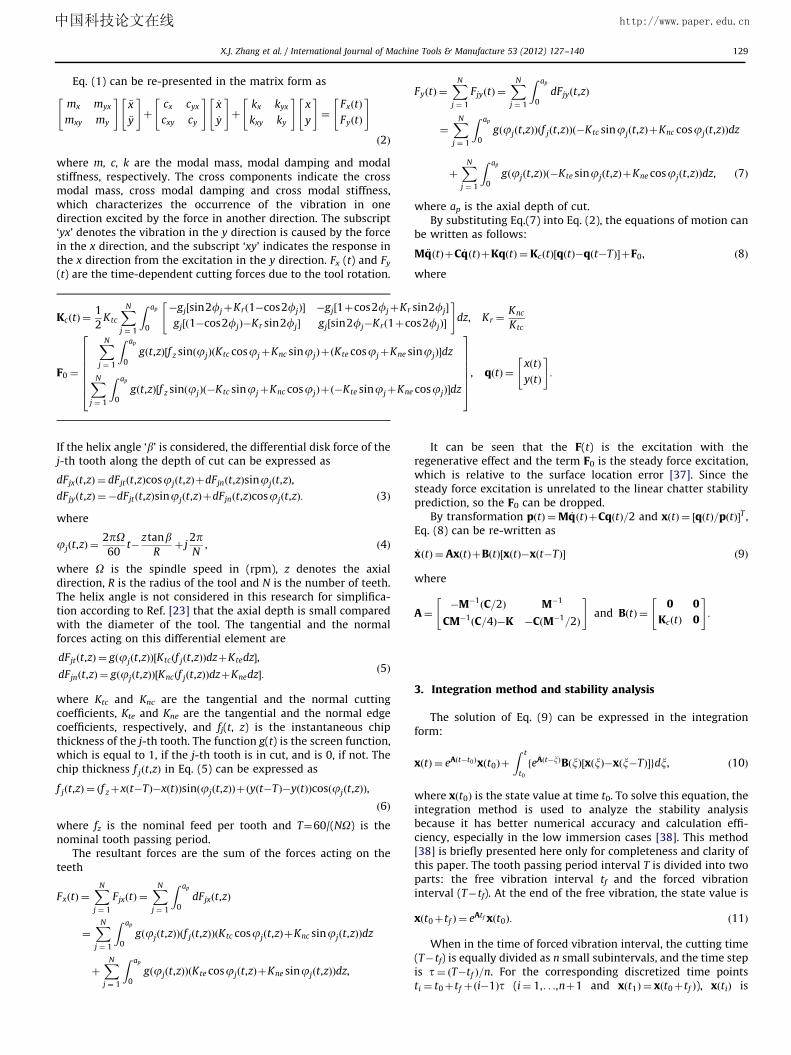
Fig. 2. Cutting parameters: up-milling, single tooth, a¼0.1D, Ktc¼644 MPa, Kr¼
cxy¼cyx¼0.032 kg/s and kxy¼kyx¼8.2 kN/m (Ref.[32]). The symbols are as follows: (1)
4. Numerical simulation and comparison
It is noted that the integration method has no restrictions formodal parameters, i.e. modal mass matrix M, modal dampingmatrix C and modal stiffness matrix K can have any crosscomponents that stands for structural mode coupling effect. Itmust be noted that other stability prediction methods[3,4,11,16,20] also can simultaneously deal with the mode cou-pling effect and the regenerative effect on stability prediction.Here a numerical simulation case is given to illustrate thedifference in milling stability between the mode coupling effectand without mode coupling effect.
To illustrate the influence of mode coupling effect, the techni-cal parameters from Ref. [32] are used for the simulation case,listed in Table 1. The algorithm used here is the integrationmethod [38].
Modal parameters without cross function:
M¼0:0201 0
0 0:0199
� �kg, K¼
4:14� 105 0
0 4:09� 105
" #N=m,
C¼1:56 0
0 1:60
� �Ns=m:
Modal parameters with cross modal functions (structuralmode coupling effect):
M¼0:0201 4� 10�5
4� 10�5 0:0199
" #kg, K¼
4:14� 105 8:2� 103
8:2� 103 4:09� 105
" #N=m,
C¼1:56 0:032
0:032 1:60
� �Ns=m:
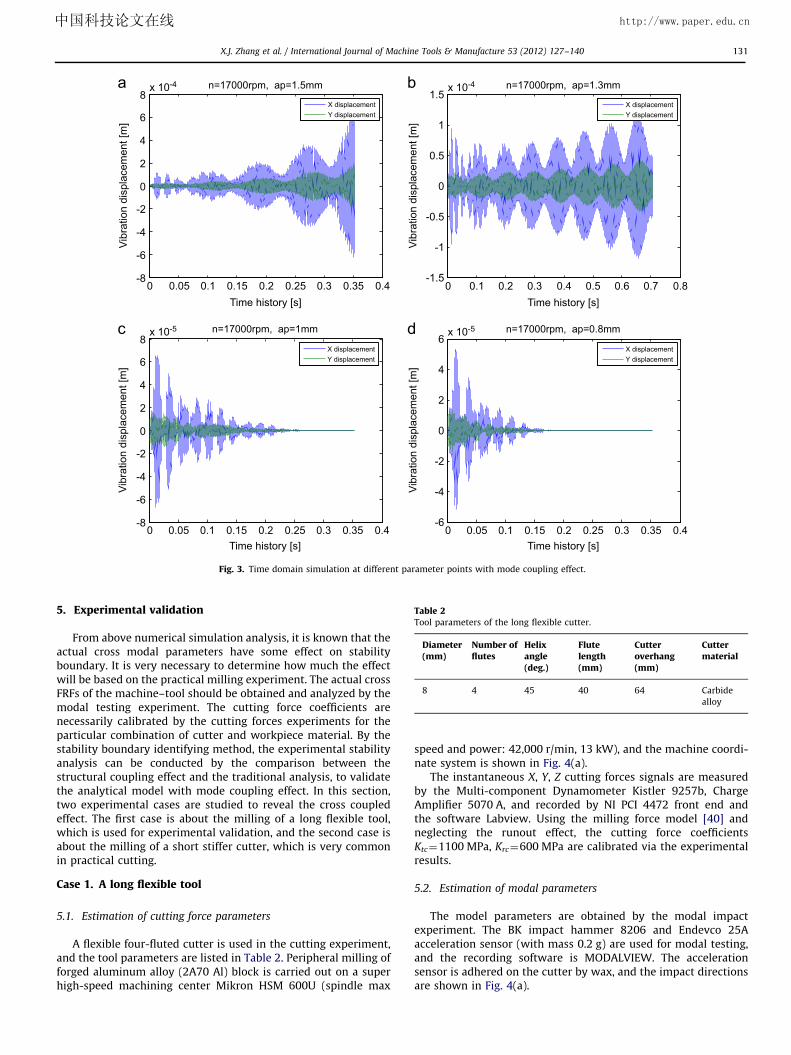
Simulations are performed using the integration method withn¼15 over a 200�150 sized grid for up-milling with radial depthof cut ratios a=D¼ 0:1, and the stability lobes can be seen in Fig. 2.It is noted that the cross modal parameters are small comparedwith the diagonal matrix elements, which means that the weakmode coupling influences the stability a lot according to thestability comparison analysis. The computational precision is alsotested by the time domain simulation (using Matlab routinedde23). Several parameter points are calculated to identify theirstability boundary, the initial condition is [10 mm; 10 mm; 0 m/s;0 m/s]. As can be seen in Fig. 3, the points (17,000 rpm, 0.8 mm)and (17,000 rpm, 1 mm) are unstable by the analysis neglectingthe mode coupling effect, but they are stable with mode couplingeffect being considered. The points (17,000 rpm, 1.3 mm) and(17,000 rpm, 1.5 mm) are unstable by the analysis, which isconsistent with the time domain simulation.
Spindle Speed [rpm]
Axi
al D
epth
[m]
1.5 1.55 1.6 1.65 1.7 1.75 1.8 1.85 1.90
0.5
1
1.5
2
2.5
3x 10⁻³
no cross functionwith cross function
DC
AB
x 104
Knc/Ktc¼0.37. Diagonal modal parameters in Table 1 and mxy¼myx¼0.04 g,J is stable case; (2) � is unstable case.
中国科技论文在线 http://www.paper.edu.cn
0 0.05 0.1 0.15 0.2 0.25 0.3 0.35 0.4-8
-6
-4
-2
0
2
4
6
8x 10⁻⁴
Time history [s]
Vibr
atio
n di
spla
cem
ent [
m]
n=17000rpm, ap=1.5mm
X displacementY displacement
0 0.1 0.2 0.3 0.4 0.5 0.6 0.7 0.8-1.5
-1
-0.5
0
0.5
1
1.5x 10⁻⁴
Time history [s]
Vibr
atio
n di
spla
cem
ent [
m]
n=17000rpm, ap=1.3mm
X displacementY displacement
0 0.05 0.1 0.15 0.2 0.25 0.3 0.35 0.4-8
-6
-4
-2
0
2
4
6
8x 10⁻⁵
Time history [s]
Vibr
atio
n di
spla
cem
ent [
m]
n=17000rpm, ap=1mm
X displacementY displacement
0 0.05 0.1 0.15 0.2 0.25 0.3 0.35 0.4-6
-4
-2
0
2
4
6x 10⁻⁵
Time history [s]
Vibr
atio
n di
spla
cem
ent [
m]
n=17000rpm, ap=0.8mm
X displacementY displacement
Fig. 3. Time domain simulation at different parameter points with mode coupling effect.
Table 2Tool parameters of the long flexible cutter.
Diameter(mm)
Number offlutes
Helixangle(deg.)
Flutelength(mm)
Cutteroverhang(mm)
Cuttermaterial
8 4 45 40 64 Carbide
alloy
X.J. Zhang et al. / International Journal of Machine Tools & Manufacture 53 (2012) 127–140 131
5. Experimental validation
From above numerical simulation analysis, it is known that theactual cross modal parameters have some effect on stabilityboundary. It is very necessary to determine how much the effectwill be based on the practical milling experiment. The actual crossFRFs of the machine–tool should be obtained and analyzed by themodal testing experiment. The cutting force coefficients arenecessarily calibrated by the cutting forces experiments for theparticular combination of cutter and workpiece material. By thestability boundary identifying method, the experimental stabilityanalysis can be conducted by the comparison between thestructural coupling effect and the traditional analysis, to validatethe analytical model with mode coupling effect. In this section,two experimental cases are studied to reveal the cross coupledeffect. The first case is about the milling of a long flexible tool,which is used for experimental validation, and the second case isabout the milling of a short stiffer cutter, which is very commonin practical cutting.
Case 1. A long flexible tool
5.1. Estimation of cutting force parameters
A flexible four-fluted cutter is used in the cutting experiment,and the tool parameters are listed in Table 2. Peripheral milling offorged aluminum alloy (2A70 Al) block is carried out on a superhigh-speed machining center Mikron HSM 600U (spindle max
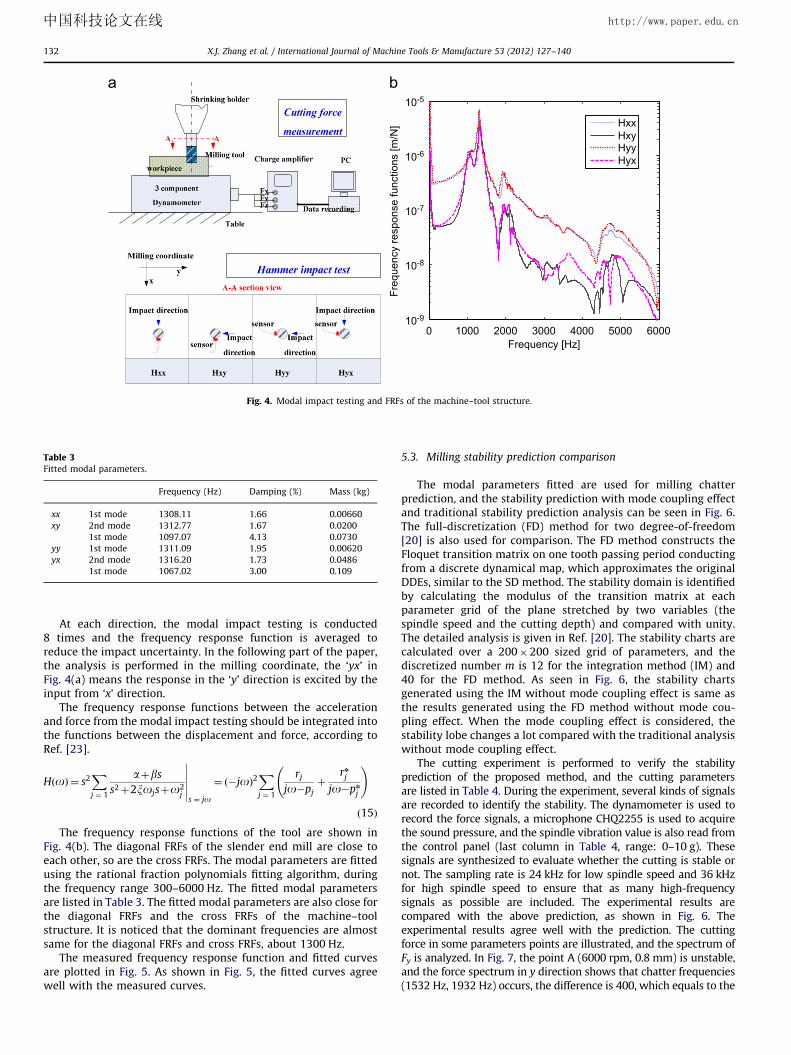
speed and power: 42,000 r/min, 13 kW), and the machine coordi-nate system is shown in Fig. 4(a).
The instantaneous X, Y, Z cutting forces signals are measuredby the Multi-component Dynamometer Kistler 9257b, ChargeAmplifier 5070 A, and recorded by NI PCI 4472 front end andthe software Labview. Using the milling force model [40] andneglecting the runout effect, the cutting force coefficientsKtc¼1100 MPa, Krc¼600 MPa are calibrated via the experimentalresults.
5.2. Estimation of modal parameters
The model parameters are obtained by the modal impactexperiment. The BK impact hammer 8206 and Endevco 25Aacceleration sensor (with mass 0.2 g) are used for modal testing,and the recording software is MODALVIEW. The accelerationsensor is adhered on the cutter by wax, and the impact directionsare shown in Fig. 4(a).
中国科技论文在线 http://www.paper.edu.cn
0 1000 2000 3000 4000 5000 600010-9
10-8
10-7
10-6
10-5
Frequency [Hz]
Freq
uenc
y re
spon
se fu
nctio
ns [m
/N] Hxx
HxyHyyHyx
Fig. 4. Modal impact testing and FRFs of the machine–tool structure.
Table 3Fitted modal parameters.
Frequency (Hz) Damping (%) Mass (kg)
xx 1st mode 1308.11 1.66 0.00660
xy 2nd mode 1312.77 1.67 0.0200
1st mode 1097.07 4.13 0.0730
yy 1st mode 1311.09 1.95 0.00620
yx 2nd mode 1316.20 1.73 0.0486
1st mode 1067.02 3.00 0.109
X.J. Zhang et al. / International Journal of Machine Tools & Manufacture 53 (2012) 127–140132
At each direction, the modal impact testing is conducted8 times and the frequency response function is averaged toreduce the impact uncertainty. In the following part of the paper,the analysis is performed in the milling coordinate, the ‘yx’ inFig. 4(a) means the response in the ‘y’ direction is excited by theinput from ‘x’ direction.
The frequency response functions between the accelerationand force from the modal impact testing should be integrated intothe functions between the displacement and force, according toRef. [23].
HðoÞ ¼ s2Xj ¼ 1
aþbs
s2þ2xojsþo2j
������s ¼ jo
¼ ð�joÞ2Xj ¼ 1
rj
jo�pj
þrnj
jo�pn
j
!
ð15Þ
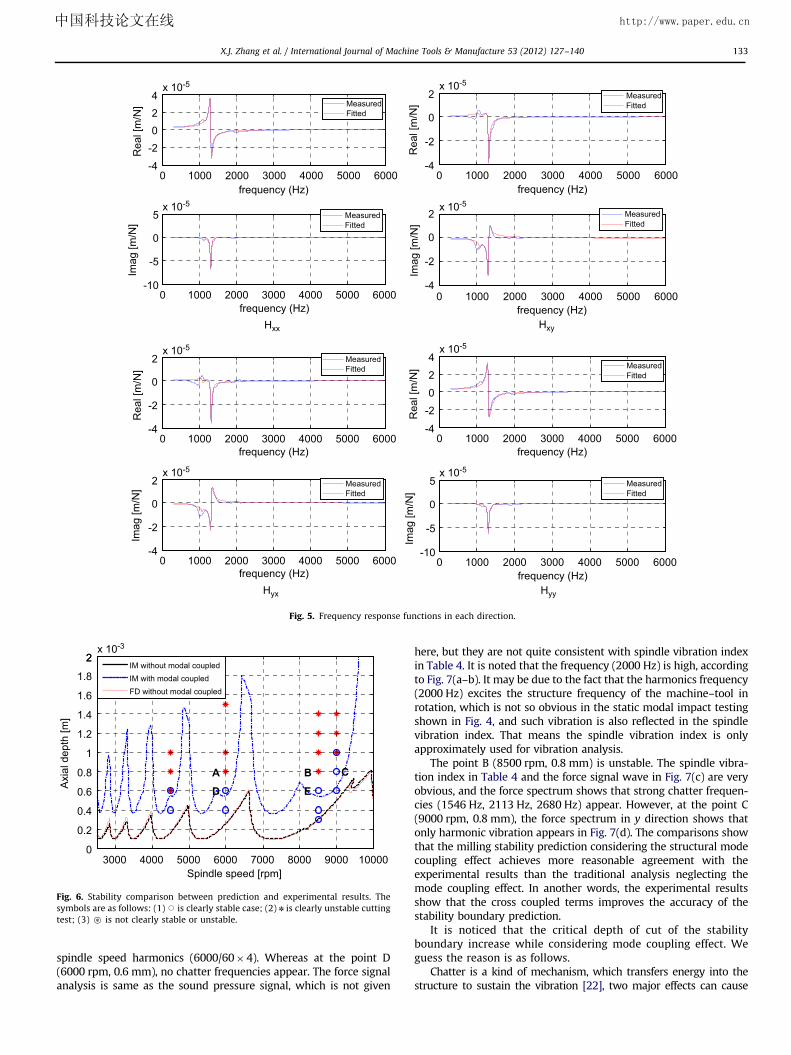
The frequency response functions of the tool are shown inFig. 4(b). The diagonal FRFs of the slender end mill are close toeach other, so are the cross FRFs. The modal parameters are fittedusing the rational fraction polynomials fitting algorithm, duringthe frequency range 300–6000 Hz. The fitted modal parametersare listed in Table 3. The fitted modal parameters are also close forthe diagonal FRFs and the cross FRFs of the machine–toolstructure. It is noticed that the dominant frequencies are almostsame for the diagonal FRFs and cross FRFs, about 1300 Hz.
The measured frequency response function and fitted curvesare plotted in Fig. 5. As shown in Fig. 5, the fitted curves agreewell with the measured curves.
5.3. Milling stability prediction comparison
The modal parameters fitted are used for milling chatterprediction, and the stability prediction with mode coupling effectand traditional stability prediction analysis can be seen in Fig. 6.The full-discretization (FD) method for two degree-of-freedom[20] is also used for comparison. The FD method constructs theFloquet transition matrix on one tooth passing period conductingfrom a discrete dynamical map, which approximates the originalDDEs, similar to the SD method. The stability domain is identifiedby calculating the modulus of the transition matrix at eachparameter grid of the plane stretched by two variables (thespindle speed and the cutting depth) and compared with unity.The detailed analysis is given in Ref. [20]. The stability charts arecalculated over a 200�200 sized grid of parameters, and thediscretized number m is 12 for the integration method (IM) and40 for the FD method. As seen in Fig. 6, the stability chartsgenerated using the IM without mode coupling effect is same asthe results generated using the FD method without mode cou-pling effect. When the mode coupling effect is considered, thestability lobe changes a lot compared with the traditional analysiswithout mode coupling effect.
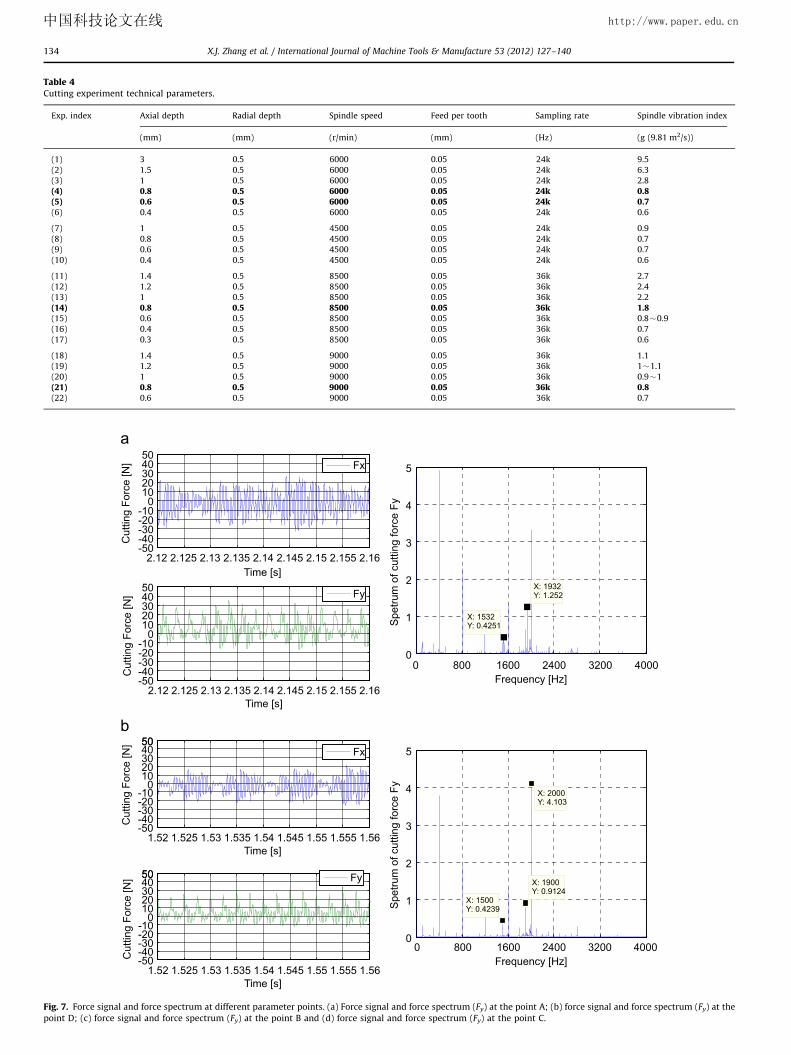
The cutting experiment is performed to verify the stabilityprediction of the proposed method, and the cutting parametersare listed in Table 4. During the experiment, several kinds of signalsare recorded to identify the stability. The dynamometer is used torecord the force signals, a microphone CHQ2255 is used to acquirethe sound pressure, and the spindle vibration value is also read fromthe control panel (last column in Table 4, range: 0–10 g). Thesesignals are synthesized to evaluate whether the cutting is stable ornot. The sampling rate is 24 kHz for low spindle speed and 36 kHzfor high spindle speed to ensure that as many high-frequencysignals as possible are included. The experimental results arecompared with the above prediction, as shown in Fig. 6. Theexperimental results agree well with the prediction. The cuttingforce in some parameters points are illustrated, and the spectrum ofFy is analyzed. In Fig. 7, the point A (6000 rpm, 0.8 mm) is unstable,and the force spectrum in y direction shows that chatter frequencies(1532 Hz, 1932 Hz) occurs, the difference is 400, which equals to the
中国科技论文在线 http://www.paper.edu.cn
0 1000 2000 3000 4000 5000 6000-4
-2024
x 10-5
frequency (Hz)
Rea
l [m
/N] Measured
Fitted
0 1000 2000 3000 4000 5000 6000-10
-5
0
5x 10⁻⁵
frequency (Hz)
Imag
[m/N
]
MeasuredFitted
0 1000 2000 3000 4000 5000 6000-4
-2
0
2x 10⁻⁵
frequency (Hz)
Rea
l [m
/N]
MeasuredFitted
0 1000 2000 3000 4000 5000 6000-4
-2
0
2x 10⁻⁵
frequency (Hz)
Imag
[m/N
]
MeasuredFitted
Hxx Hxy
0 1000 2000 3000 4000 5000 6000-4
-2
0
2x 10⁻⁵
frequency (Hz)
Rea
l [m
/N]
MeasuredFitted
0 1000 2000 3000 4000 5000 6000-4
-2
0
2x 10⁻⁵
frequency (Hz)
Imag
[m/N
] MeasuredFitted
0 1000 2000 3000 4000 5000 6000-4
-2
0
2
4x 10⁻⁵
frequency (Hz)
Rea
l [m
/N] Measured
Fitted
0 1000 2000 3000 4000 5000 6000-10
-5
0
5x 10⁻⁵
frequency (Hz)
Imag
[m/N
]
MeasuredFitted
Hyx Hyy
Fig. 5. Frequency response functions in each direction.
Spindle speed [rpm]
Axi
al d
epth
[m]
3000 4000 5000 6000 7000 8000 9000 100000
0.2
0.4
0.6
0.8
1
1.2
1.4
1.6
1.8
22x 10-3
IM without modal coupledIM with modal coupledFD without modal coupled
B CA
ED
Fig. 6. Stability comparison between prediction and experimental results. The
symbols are as follows: (1) J is clearly stable case; (2) n is clearly unstable cutting
test; (3) , is not clearly stable or unstable.
X.J. Zhang et al. / International Journal of Machine Tools & Manufacture 53 (2012) 127–140 133
spindle speed harmonics (6000/60�4). Whereas at the point D(6000 rpm, 0.6 mm), no chatter frequencies appear. The force signalanalysis is same as the sound pressure signal, which is not given
here, but they are not quite consistent with spindle vibration indexin Table 4. It is noted that the frequency (2000 Hz) is high, accordingto Fig. 7(a–b). It may be due to the fact that the harmonics frequency(2000 Hz) excites the structure frequency of the machine–tool inrotation, which is not so obvious in the static modal impact testingshown in Fig. 4, and such vibration is also reflected in the spindlevibration index. That means the spindle vibration index is onlyapproximately used for vibration analysis.
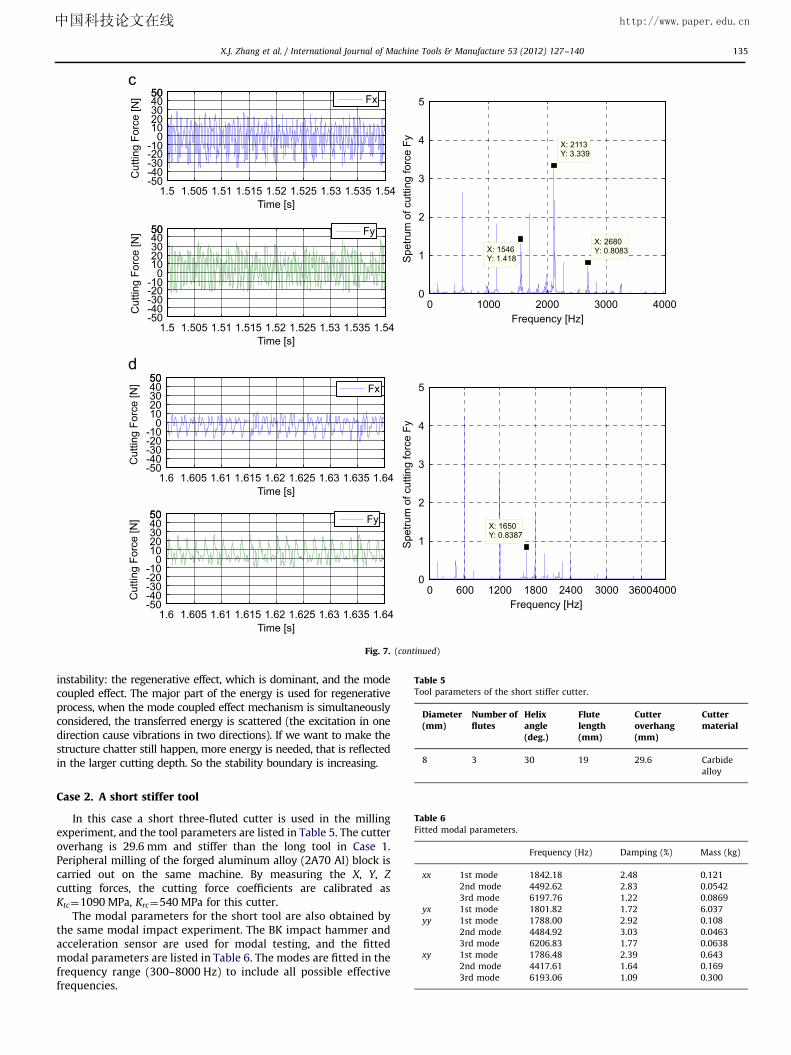
The point B (8500 rpm, 0.8 mm) is unstable. The spindle vibra-tion index in Table 4 and the force signal wave in Fig. 7(c) are veryobvious, and the force spectrum shows that strong chatter frequen-cies (1546 Hz, 2113 Hz, 2680 Hz) appear. However, at the point C(9000 rpm, 0.8 mm), the force spectrum in y direction shows thatonly harmonic vibration appears in Fig. 7(d). The comparisons showthat the milling stability prediction considering the structural modecoupling effect achieves more reasonable agreement with theexperimental results than the traditional analysis neglecting themode coupling effect. In another words, the experimental resultsshow that the cross coupled terms improves the accuracy of thestability boundary prediction.
It is noticed that the critical depth of cut of the stabilityboundary increase while considering mode coupling effect. Weguess the reason is as follows.
Chatter is a kind of mechanism, which transfers energy into thestructure to sustain the vibration [22], two major effects can cause
中国科技论文在线 http://www.paper.edu.cn
Table 4Cutting experiment technical parameters.
Exp. index Axial depth Radial depth Spindle speed Feed per tooth Sampling rate Spindle vibration index
(mm) (mm) (r/min) (mm) (Hz) (g (9.81 m2/s))
(1) 3 0.5 6000 0.05 24k 9.5
(2) 1.5 0.5 6000 0.05 24k 6.3
(3) 1 0.5 6000 0.05 24k 2.8
(4) 0.8 0.5 6000 0.05 24k 0.8(5) 0.6 0.5 6000 0.05 24k 0.7(6) 0.4 0.5 6000 0.05 24k 0.6
(7) 1 0.5 4500 0.05 24k 0.9
(8) 0.8 0.5 4500 0.05 24k 0.7
(9) 0.6 0.5 4500 0.05 24k 0.7
(10) 0.4 0.5 4500 0.05 24k 0.6
(11) 1.4 0.5 8500 0.05 36k 2.7
(12) 1.2 0.5 8500 0.05 36k 2.4
(13) 1 0.5 8500 0.05 36k 2.2
(14) 0.8 0.5 8500 0.05 36k 1.8(15) 0.6 0.5 8500 0.05 36k 0.8�0.9
(16) 0.4 0.5 8500 0.05 36k 0.7
(17) 0.3 0.5 8500 0.05 36k 0.6
(18) 1.4 0.5 9000 0.05 36k 1.1
(19) 1.2 0.5 9000 0.05 36k 1�1.1
(20) 1 0.5 9000 0.05 36k 0.9�1
(21) 0.8 0.5 9000 0.05 36k 0.8(22) 0.6 0.5 9000 0.05 36k 0.7
0 800 1600 2400 3200 40000
1
2
3
4
5
X: 1932Y: 1.252
X: 1532Y: 0.4251
Frequency [Hz]
Spe
trum
of c
uttin
g fo
rce
Fy
0 800 1600 2400 3200 40000
1
2
3
4
5
X: 2000Y: 4.103
Frequency [Hz]
Spe
trum
of c
uttin
g fo
rce
Fy
X: 1900Y: 0.9124
X: 1500Y: 0.4239
1.52 1.525 1.53 1.535 1.54 1.545 1.55 1.555 1.56-50-40-30-20-10
0102030405050
Time [s]
Cut
ting
Forc
e [N
]
Fx
1.52 1.525 1.53 1.535 1.54 1.545 1.55 1.555 1.56-50-40-30-20-10
0102030405050
Time [s]
Cut
ting
Forc
e [N
] Fy
2.12 2.125 2.13 2.135 2.14 2.145 2.15 2.155 2.16-50-40-30-20-10
01020304050
Time [s]
Cut
ting
Forc
e [N
] Fx
2.12 2.125 2.13 2.135 2.14 2.145 2.15 2.155 2.16-50-40-30-20-10
01020304050
Time [s]
Cut
ting
Forc
e [N
] Fy
Fig. 7. Force signal and force spectrum at different parameter points. (a) Force signal and force spectrum (Fy) at the point A; (b) force signal and force spectrum (Fy) at the
point D; (c) force signal and force spectrum (Fy) at the point B and (d) force signal and force spectrum (Fy) at the point C.
X.J. Zhang et al. / International Journal of Machine Tools & Manufacture 53 (2012) 127–140134
中国科技论文在线 http://www.paper.edu.cn
0 1000 2000 3000 40000
1
2
3
4
5
X: 2113Y: 3.339
Frequency [Hz]
Spe
trum
of c
uttin
g fo
rce
Fy
X: 1546Y: 1.418
X: 2680Y: 0.8083
0 600 1200 1800 2400 3000 360040000
1
2
3
4
5
X: 1650Y: 0.8387
Frequency [Hz]
Spe
trum
of c
uttin
g fo
rce
Fy
1.5 1.505 1.51 1.515 1.52 1.525 1.53 1.535 1.54-50-40-30-20-10
0102030405050
Time [s]
Cut
ting
Forc
e [N
] Fx
1.5 1.505 1.51 1.515 1.52 1.525 1.53 1.535 1.54-50-40-30-20-10
0102030405050
Time [s]
Cut
ting
Forc
e [N
] Fy
1.6 1.605 1.61 1.615 1.62 1.625 1.63 1.635 1.64-50-40-30-20-10
0102030405050
Time [s]
Cut
ting
Forc
e [N
] Fx
1.6 1.605 1.61 1.615 1.62 1.625 1.63 1.635 1.64-50-40-30-20-10
0102030405050
Time [s]
Cut
ting
Forc
e [N
] Fy
Fig. 7. (continued)
Table 5Tool parameters of the short stiffer cutter.
Diameter(mm)
Number offlutes
Helixangle(deg.)
Flutelength(mm)
Cutteroverhang(mm)
Cuttermaterial
8 3 30 19 29.6 Carbide
alloy
Table 6Fitted modal parameters.
Frequency (Hz) Damping (%) Mass (kg)
xx 1st mode 1842.18 2.48 0.121
2nd mode 4492.62 2.83 0.0542
3rd mode 6197.76 1.22 0.0869
yx 1st mode 1801.82 1.72 6.037
yy 1st mode 1788.00 2.92 0.108
2nd mode 4484.92 3.03 0.0463
3rd mode 6206.83 1.77 0.0638
xy 1st mode 1786.48 2.39 0.643
2nd mode 4417.61 1.64 0.169
3rd mode 6193.06 1.09 0.300
X.J. Zhang et al. / International Journal of Machine Tools & Manufacture 53 (2012) 127–140 135
instability: the regenerative effect, which is dominant, and the modecoupled effect. The major part of the energy is used for regenerativeprocess, when the mode coupled effect mechanism is simultaneouslyconsidered, the transferred energy is scattered (the excitation in onedirection cause vibrations in two directions). If we want to make thestructure chatter still happen, more energy is needed, that is reflectedin the larger cutting depth. So the stability boundary is increasing.
Case 2. A short stiffer tool
In this case a short three-fluted cutter is used in the millingexperiment, and the tool parameters are listed in Table 5. The cutteroverhang is 29.6 mm and stiffer than the long tool in Case 1.Peripheral milling of the forged aluminum alloy (2A70 Al) block iscarried out on the same machine. By measuring the X, Y, Z
cutting forces, the cutting force coefficients are calibrated asKtc¼1090 MPa, Krc¼540 MPa for this cutter.
The modal parameters for the short tool are also obtained bythe same modal impact experiment. The BK impact hammer andacceleration sensor are used for modal testing, and the fittedmodal parameters are listed in Table 6. The modes are fitted in thefrequency range (300–8000 Hz) to include all possible effectivefrequencies.
中国科技论文在线 http://www.paper.edu.cn
X.J. Zhang et al. / International Journal of Machine Tools & Manufacture 53 (2012) 127–140136
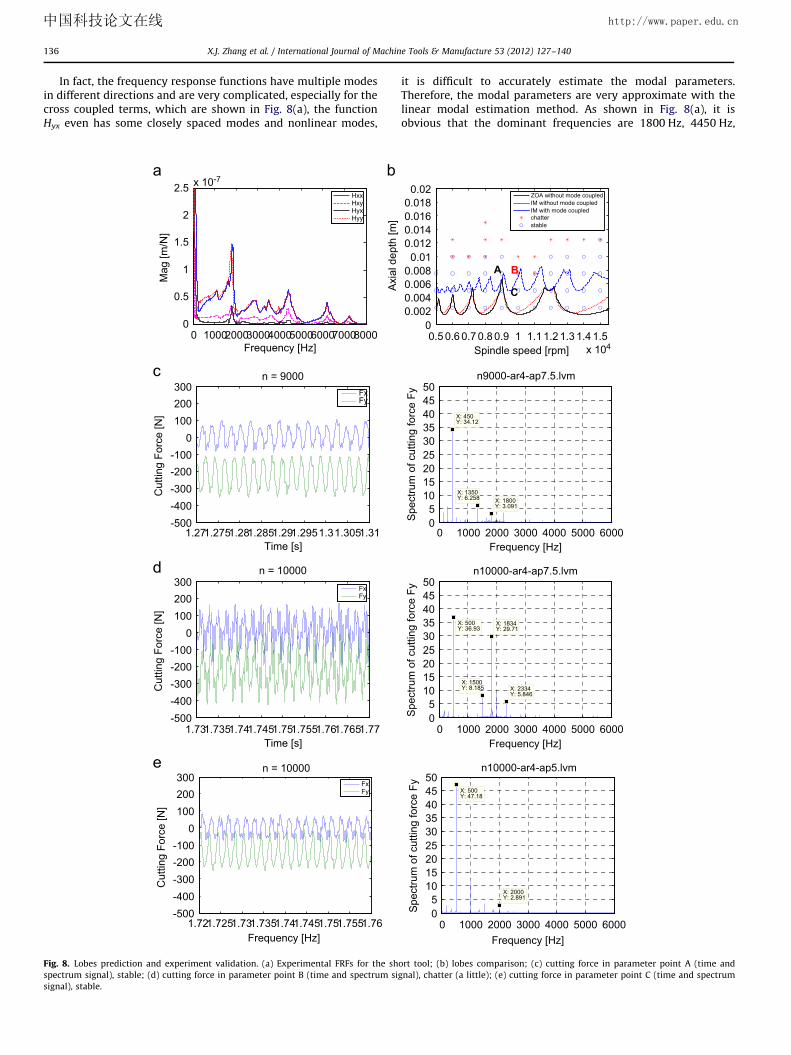
In fact, the frequency response functions have multiple modesin different directions and are very complicated, especially for thecross coupled terms, which are shown in Fig. 8(a), the functionHyx even has some closely spaced modes and nonlinear modes,
1.731.7351.741.7451.751.7551.761.7651.77-500-400-300-200-100
0100200300
n = 10000
Time [s]
Cut
ting
Forc
e [N
]
FxFy
0 100020003000400050006000700080000
0.5
1
1.5
2
2.5 x 10⁻⁷
Frequency [Hz]
Mag
[m/N
]
HxxHxyHyxHyy
1.271.2751.281.2851.291.2951.31.3051.31-500-400-300-200-100
0100200300
n = 9000
Time [s]
Cut
ting
Forc
e [N
]
FxFy
Axi
al d
epth
[m]
1.721.7251.731.7351.741.7451.751.7551.76-500-400-300-200-100
0100200300
n = 10000
Frequency [Hz]
Cut
ting
Forc
e [N
]
FxFy
Fig. 8. Lobes prediction and experiment validation. (a) Experimental FRFs for the sh
spectrum signal), stable; (d) cutting force in parameter point B (time and spectrum si
signal), stable.
it is difficult to accurately estimate the modal parameters.Therefore, the modal parameters are very approximate with thelinear modal estimation method. As shown in Fig. 8(a), it isobvious that the dominant frequencies are 1800 Hz, 4450 Hz,
0 1000 2000 3000 4000 5000 600005
101520253035404550
X: 450Y: 34.12
Frequency [Hz]
Spe
ctru
m o
f cut
ting
forc
e Fy
n9000-ar4-ap7.5.lvm
X: 1350Y: 6.258 X: 1800
Y: 3.091
0 1000 2000 3000 4000 5000 600005
101520253035404550
X: 500Y: 36.93
Frequency [Hz]
Spe
ctru
m o
f cut
ting
forc
e Fy
n10000-ar4-ap7.5.lvm
X: 1834Y: 29.71
X: 1500Y: 8.185 X: 2334
Y: 5.846
0.5 0.6 0.7 0.8 0.9 1 1.1 1.2 1.3 1.4 1.5x 10⁴
00.0020.0040.0060.008
0.010.0120.0140.0160.018
0.02
Spindle speed [rpm]
ZOA without mode coupledIM without mode coupledIM with mode coupledchatterstable
BA
C
0 1000 2000 3000 4000 5000 600005
101520253035404550
X: 500Y: 47.18
Frequency [Hz]
Spe
ctru
m o
f cut
ting
forc
e Fy
n10000-ar4-ap5.lvm
X: 2000Y: 2.891
ort tool; (b) lobes comparison; (c) cutting force in parameter point A (time and
gnal), chatter (a little); (e) cutting force in parameter point C (time and spectrum
中国科技论文在线 http://www.paper.edu.cn
X.J. Zhang et al. / International Journal of Machine Tools & Manufacture 53 (2012) 127–140 137
1000 Hz and 6200 Hz. By stability calculation and comparison, itis known that two modes (1800 Hz and 4450 Hz) in the diagonalmatrix are dominant when mode coupled effect is not considered.Hxy also has the dominant frequencies 1800 Hz and 4450 Hz,while Hyx has single dominant frequency 1800 Hz. For the shortcutter, it is noticed that the dominant frequencies are almostsame for the diagonal FRFs and cross FRFs (about 1800 Hz and4450 Hz except the Hyx). Compared with the long cutter, it meansthe modal coupled effect is mainly dependent on the cutter. Thecutter seems axisymmetric, but actually its principal vibrationdirection of the section of the cutter is varying periodically alongthe axial direction due to the existence of the helix flutes. Whenone direction is excited, the vibration in the normal direction willoccur due to such ‘‘twisted’’ structure. In addition, the cutter isthe most flexible part of the tool-spindle system.
Here, we use the dominant frequencies in Table 6 for thestability prediction. The stability prediction limits with crosscoupled terms and without cross coupled effect are plotted inFig. 8(b), from which it can be seen that the difference is huge.The lowest stability limit without cross coupled effect consideredis about 1.5 mm, while the lowest stability limit with crosscoupled terms is high up to 5 mm. As shown in Fig. 8(b), ZOAmethod is the frequency domain method in Ref. [3] and thelowest stability lobe is generated using this method withoutmode coupled effect. The prediction with considering all modesin both the normal directions (7 modes in the x direction and5 modes in the y direction) is quite same with the stabilityboundary with only dominant modes considered, and two pre-dictions coincide in the ‘ZOA without mode coupled’. Besides, theprediction with the ZOA method is almost same as the resultgenerated by the IM method with only the dominant modesconsidered (the difference is from the algorithms themselves).
The cutting experiment is also conducted to test the predic-tion. The cutting parameters are listed in Table 7. The feed pertooth is 0.05 mm, and the sampling rate is 40 k/s for the soundand force measurement. Three parameter points in the stabilitylobe are listed in Fig. 8(b) for illustration, point A (9000 rpm,7.5 mm) is stable, and the force time wave and the spectrum
Table 7Cutting parameters.
Axial depth
(mm)
Radial depth
(mm)
Spindle speed
(r/min)
Feed per tooth
(mm)
2.5, 5, 7.5, 10, 12.5, 15 4 5000�15000 0.05
50010-9
10-8
10-7
10-6
10-5
10-4
Freq
uenc
y R
espo
nse
Func
tions
[m/N
]
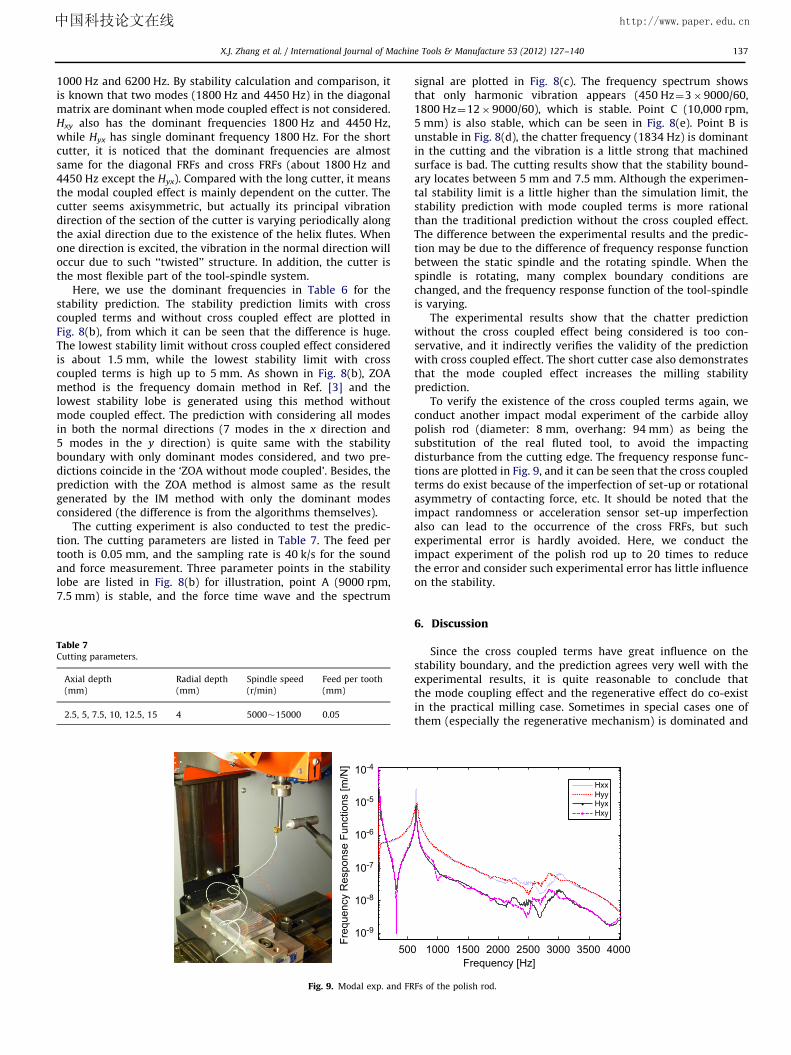
Fig. 9. Modal exp. and FR
signal are plotted in Fig. 8(c). The frequency spectrum showsthat only harmonic vibration appears (450 Hz¼3�9000/60,1800 Hz¼12�9000/60), which is stable. Point C (10,000 rpm,5 mm) is also stable, which can be seen in Fig. 8(e). Point B isunstable in Fig. 8(d), the chatter frequency (1834 Hz) is dominantin the cutting and the vibration is a little strong that machinedsurface is bad. The cutting results show that the stability bound-ary locates between 5 mm and 7.5 mm. Although the experimen-tal stability limit is a little higher than the simulation limit, thestability prediction with mode coupled terms is more rationalthan the traditional prediction without the cross coupled effect.The difference between the experimental results and the predic-tion may be due to the difference of frequency response functionbetween the static spindle and the rotating spindle. When thespindle is rotating, many complex boundary conditions arechanged, and the frequency response function of the tool-spindleis varying.
The experimental results show that the chatter predictionwithout the cross coupled effect being considered is too con-servative, and it indirectly verifies the validity of the predictionwith cross coupled effect. The short cutter case also demonstratesthat the mode coupled effect increases the milling stabilityprediction.
To verify the existence of the cross coupled terms again, weconduct another impact modal experiment of the carbide alloypolish rod (diameter: 8 mm, overhang: 94 mm) as being thesubstitution of the real fluted tool, to avoid the impactingdisturbance from the cutting edge. The frequency response func-tions are plotted in Fig. 9, and it can be seen that the cross coupledterms do exist because of the imperfection of set-up or rotationalasymmetry of contacting force, etc. It should be noted that theimpact randomness or acceleration sensor set-up imperfectionalso can lead to the occurrence of the cross FRFs, but suchexperimental error is hardly avoided. Here, we conduct theimpact experiment of the polish rod up to 20 times to reducethe error and consider such experimental error has little influenceon the stability.
6. Discussion
Since the cross coupled terms have great influence on thestability boundary, and the prediction agrees very well with theexperimental results, it is quite reasonable to conclude thatthe mode coupling effect and the regenerative effect do co-existin the practical milling case. Sometimes in special cases one ofthem (especially the regenerative mechanism) is dominated and
1000 1500 2000 2500 3000 3500 4000Frequency [Hz]
HxxHyyHyxHxy
Fs of the polish rod.
中国科技论文在线 http://www.paper.edu.cn
X.J. Zhang et al. / International Journal of Machine Tools & Manufacture 53 (2012) 127–140138
that can explain why the mode coupling effect is neglected in theprevious researches.
Due to the general great effect of the mode coupling mechan-ism, it is necessary to analyze the sensitivity of the boundary todetermine which factor of the cross coupled terms is preponder-ant or dominant. To facilitate the analysis, some assumptions aremade. First, the two cross coupled transfer function are assumedequal, which means that
YðsÞ
Fx,cðsÞ¼
XðsÞ
Fy,cðsÞ: ð16Þ
Eq. (16) is rational theoretically according to the reciprocaltheory of the linear system. Since from Eq. (1), myx €yþcyx _yþkyxy¼ Fx,cðtÞ,mxy €xþcxy _xþkxyx¼ Fy,cðtÞ, where Fx,cðtÞ,Fy,cðtÞ are partof FxðtÞ and FyðtÞ, respectively.
Then, ð1=myxs2þcyxsþkyxÞ ¼ ð1=mxys2þcxysþkxyÞ andmyx ¼mxy,cyx ¼ cxy and kyx ¼ kxy are obtained. Further, if the diag-onal transfer functions are assumed to be equal (which is alsorational when the cutter tool is very flexible compared with thestiffer tool holder), then we can get
mx ¼my ¼m,
cx ¼ cy ¼ c,
kx ¼ ky ¼ k: ð17Þ
Eq. (2) can be re-expressed as
m1 mr
mr 1
" #€x
€y
" #þc
1 cr
cr 1
" #_x
_y
" #þk
1 kr
kr 1
" #x
y
" #¼
FxðtÞ
FyðtÞ
" #,
ð18Þ
where
mr ¼mxy
m¼
myx
m,cr ¼
cxy
c¼
cyx
c,kr ¼
kxy
k¼
kyx
k:
If the damping is proportional damping, the dynamic equationcan be transformed into the modal coordinate and Eq. (2) can bedecoupled, and a primary mode orientation can be determined[7,41]. It is noticed there are three coefficients mr, cr, kr indicatingthe cross coupled terms compared with the diagonal elements. Todetermine the sensitivity of the stability boundary, three deriva-tives ðdap lim=dmrÞ, ðdap lim=dcrÞ and ðdap lim=dkrÞ are needed to becalculated.
6.1. Analysis of the sensitivity
It is known that the stability boundary is corresponding to thefollowing equation:
9lmax½Uðap lim,mr ,cr ,krÞ�9¼ 1 ð19Þ
Herein, ðdap lim=dmrÞ is only deduced for detailed analysis,other two derivatives can be calculated by the same way.According to the similar calculation in Ref. [42], and from Eq.(19), the following is obtained by differentiation:
@9lmax9@ap
dap limþ@9lmax9@mr
dmr ¼ 0,
and
dap
dmr
����mr
ap ¼ ap lim
¼�@ l�� ��
max
@mr
�����mr
ap ¼ ap lim
,@ l�� ��
max
@ap
�����mr
ap ¼ ap lim
since
9lmax92¼ lmaxl
0
max so@9lmax9@z
¼lmax @l
0
max=@z� �
þl0max @lmax=@z� �
29lmax9:
The derivatives can be determined according to Ref. [43]
@lmax
@z¼
vT @U=@z� �
u
vT u,
@l0max
@z¼ðu0ÞT @U0=@z
� �ðv0Þ
ðu0ÞT ðv0Þ:
Let W¼ I�CIM�apt2 DIM, C¼� apt
2 DIMþEIM, then U¼W�1C,and after long tedious calculation, the following is obtained:
@U@ap¼W�1
�t2
DIMþt2
DIMW�1C� �
,
@U@mr¼W�1 W�1 @CIM
@mrCþW�1 @ðaptDIMÞ
2@mrC�
1
2
@ðaptDIMÞ
@mrþ@EIM
@mr
� �,
where
@CIM@mr¼
@ðeAtÞ@mr
diagðn,�1Þ
¼ eAt @A@mr
tdiagðn,�1Þ,
diagðn,�1Þ ¼
0
1 0
1 0
& &
1 0
26666664
37777775
,
@A
@mr¼
@M2@mr
M�2C � @M@mr
M�2
� C4@M@mr
M�2C � 12@M@mr
M�2C
24
35,
@M
@mr¼
0 1
1 0
� �m0 �m0
�21 mr
mr 1
" #�2
,
@ðaptDIMÞ
@mr¼@ap
@mrtDIMþapt
@DIM
@mr,
@DIM
@mr¼ eAt @A
@mrt
� �0
B1 0
B2 0
& &
Bn 0
26666664
37777775
,
@EIM
@mr¼
0 1
& 0
" #@ðeAtf Þ
@mr¼
0 1
& 0
" #eAtf
@A
@mrtf
� �:
It can be seen that the sensitivity of the boundary aredetermined by many factors and very complicated, so the numer-ical simulation method are used for simple illustration. In fact, thediagonal transfer functions are different due to the asymmetricalmachine structure stiffness, asymmetrical clamping conditions,asymmetrical tool holder (spindle) structure stiffness, etc. In suchcases, the dynamic equation (Eq. (2)) cannot be decoupled by realmode analysis, but can be decoupled by complex mode analysis,though the modal coordinate is not in accordance with thephysical coordinate [44]. So the sensitivity analysis will be morecomplex. Herein, the numerical method is adopted to explore theinfluence of stability boundary by the cross coupled terms.
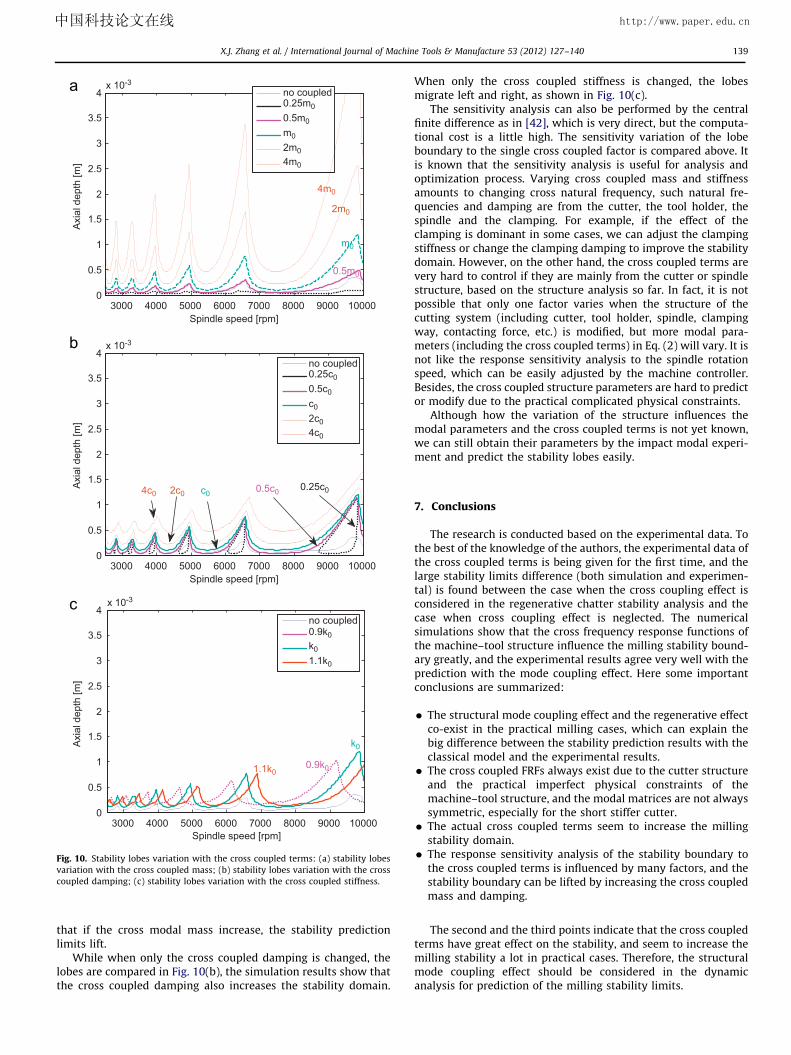
The modal parameters adopted for simulation are similar tothose in Case 1 in Section 5. The modal parameters arem¼0.0066 kg, c¼0.0166, k¼4.46�105 N/m, mr¼3, cr¼2.47,kr¼3. The stability lobes variation with the cross coupled termsare compared in Fig. 10, where ‘pm0’ in Fig. 10(a) stands for thecross coupled modal mass (mxy and myx) multiplied by ‘p’ whileother parameters remain unchanged. If ‘p’ is different, then thelobe’s boundary changes, as shown in Fig. 10(a). When ‘p’ is equalto 0.5, the lobe’s boundary is almost the same as the predictedboundary neglecting the cross coupled effects. If ‘p’ is larger than0.5, the stability boundary is lifted, and vice versa. The numericalsimulation is based on the following hypothesis: the crosscoupled damping and the stiffness remains unchanged, and onlythe cross coupled mass is changed. The simulation results show
中国科技论文在线 http://www.paper.edu.cn
Spindle speed [rpm]
Axi
al d
epth
[m]
3000 4000 5000 6000 7000 8000 9000 100000
0.5
1
1.5
2
2.5
3
3.5
4x 10⁻³
no coupled0.25m00.5m0m02m04m0
4m0
2m0
m0
0.5m0
Spindle speed [rpm]
Axi
al d
epth
[m]
3000 4000 5000 6000 7000 8000 9000 100000
0.5
1
1.5
2
2.5
3
3.5
4x 10⁻³
no coupled0.25c00.5c0c02c04c0
4c0 2c0 c0 0.5c0 0.25c0
Spindle speed [rpm]
Axi
al d
epth
[m]
3000 4000 5000 6000 7000 8000 9000 100000
0.5
1
1.5
2
2.5
3
3.5
4x 10⁻³
no coupled0.9k0k01.1k0
0.9k01.1k0
k0
Fig. 10. Stability lobes variation with the cross coupled terms: (a) stability lobes
variation with the cross coupled mass; (b) stability lobes variation with the cross
coupled damping; (c) stability lobes variation with the cross coupled stiffness.
X.J. Zhang et al. / International Journal of Machine Tools & Manufacture 53 (2012) 127–140 139
that if the cross modal mass increase, the stability predictionlimits lift.
While when only the cross coupled damping is changed, thelobes are compared in Fig. 10(b), the simulation results show thatthe cross coupled damping also increases the stability domain.
When only the cross coupled stiffness is changed, the lobesmigrate left and right, as shown in Fig. 10(c).
The sensitivity analysis can also be performed by the centralfinite difference as in [42], which is very direct, but the computa-tional cost is a little high. The sensitivity variation of the lobeboundary to the single cross coupled factor is compared above. Itis known that the sensitivity analysis is useful for analysis andoptimization process. Varying cross coupled mass and stiffnessamounts to changing cross natural frequency, such natural fre-quencies and damping are from the cutter, the tool holder, thespindle and the clamping. For example, if the effect of theclamping is dominant in some cases, we can adjust the clampingstiffness or change the clamping damping to improve the stabilitydomain. However, on the other hand, the cross coupled terms arevery hard to control if they are mainly from the cutter or spindlestructure, based on the structure analysis so far. In fact, it is notpossible that only one factor varies when the structure of thecutting system (including cutter, tool holder, spindle, clampingway, contacting force, etc.) is modified, but more modal para-meters (including the cross coupled terms) in Eq. (2) will vary. It isnot like the response sensitivity analysis to the spindle rotationspeed, which can be easily adjusted by the machine controller.Besides, the cross coupled structure parameters are hard to predictor modify due to the practical complicated physical constraints.
Although how the variation of the structure influences themodal parameters and the cross coupled terms is not yet known,we can still obtain their parameters by the impact modal experi-ment and predict the stability lobes easily.
7. Conclusions
The research is conducted based on the experimental data. Tothe best of the knowledge of the authors, the experimental data ofthe cross coupled terms is being given for the first time, and thelarge stability limits difference (both simulation and experimen-tal) is found between the case when the cross coupling effect isconsidered in the regenerative chatter stability analysis and thecase when cross coupling effect is neglected. The numericalsimulations show that the cross frequency response functions ofthe machine–tool structure influence the milling stability bound-ary greatly, and the experimental results agree very well with theprediction with the mode coupling effect. Here some importantconclusions are summarized:
�
The structural mode coupling effect and the regenerative effectco-exist in the practical milling cases, which can explain thebig difference between the stability prediction results with theclassical model and the experimental results. � The cross coupled FRFs always exist due to the cutter structureand the practical imperfect physical constraints of themachine–tool structure, and the modal matrices are not alwayssymmetric, especially for the short stiffer cutter.
� The actual cross coupled terms seem to increase the millingstability domain.
� The response sensitivity analysis of the stability boundary tothe cross coupled terms is influenced by many factors, and thestability boundary can be lifted by increasing the cross coupledmass and damping.
The second and the third points indicate that the cross coupledterms have great effect on the stability, and seem to increase themilling stability a lot in practical cases. Therefore, the structuralmode coupling effect should be considered in the dynamicanalysis for prediction of the milling stability limits.
中国科技论文在线 http://www.paper.edu.cn
X.J. Zhang et al. / International Journal of Machine Tools & Manufacture 53 (2012) 127–140140
Additionally, it is very necessary to predict or change the crosscoupled terms based on the structure analysis, which could beused for structure optimization to increase the stability; however,the cross coupled terms are very hard to control so far, becausethe practical complicated physical constraints can hardly bemodeled accurately and the modification of the structure willalso change other structure parameters simultaneously. In theexperiment, many other actual factors are not obvious, likerunout effect, so the experimental results agree well with theprediction. However, such analysis with actual factors is neces-sary and important according to many researchers. It is also notedthat the mode coupling effect occurs not only from tool structuralcross functions, but also can be from cutting force [45,46] orworkpiece [45,47]. Further research will focus on these problems.
Acknowledgment
This work was partially supported by the National Key BasicResearch Program (Grant 2011CB706804), the National NaturalScience Foundation of China (Grant 50835004) and the NationalFunds for Distinguished Young Scientists of China (Grant51025518). The authors would like to thank the editors and theanonymous reviewers for their insightful comments and con-structive suggestions to improve the manuscript.
References
[1] S. Tobias, W. Fishwick, Theory of regenerative machine tool chatter,The Engineer 205 (1958) 16–23.
[2] J. Tlusty, M. Polacek, The stability of machine tools against self excitedvibrations in machining, International Research in Production Engineering(1963) 465–474.
[3] Y. Altintas, E. Budak, Analytical prediction of stability lobes in milling, CIRPAnnals—Manufacturing Technology 44 (1) (1995) 357–362.
[4] S.D. Merdol, Y. Altintas, Multi frequency solution of chatter stability for lowimmersion milling, Journal of Manufacturing Science and Engineering,Transactions of the ASME 126 (3) (2004) 459–466.
[5] I. Minis, R. Yanushevsky, A new theoretical approach for the prediction ofmachine tool chatter in milling, Journal of Engineering for Industry 115 (1)(1993) 1–8.
[6] M. Wiercigroch, E. Budak, Sources of nonlinearities, chatter generation andsuppression in metal cutting, Philosophical Transactions of the Royal Societyof London Series A: Mathematical, Physical and Engineering Sciences 359(1781) (2001) 663.
[7] J. Tlusty, F. Ismail, Basic non-linearity in machining chatter, CIRPAnnals—Manufacturing Technology 30 (1) (1981) 299–304.
[8] J. Tlusty, Dynamics of high speed milling, ASME Journal of Engineering forIndustry 108 (2) (1986) 59–67.
[9] S. Smith, J. Tlusty, Efficient simulation programs for chatter in milling, CIRPAnnals 42 (1) (1993) 463–466.
[10] M.A. Davies, J.R. Pratt, B.S. Dutterer, T.J. Burns, Stability of low radialimmersion milling, CIRP Annals—Manufacturing Technology 49 (1) (2000)37–40.
[11] P.V. Bayly, J.E. Halley, B.P. Mann, M.A. Davies, Stability of interrupted cuttingby temporal finite element analysis, in: Proceedings of the ASME DesignEngineering Technical Conference, 2001, American Society of MechanicalEngineers.
[12] M.L. Campomanes, Y. Altintas, An improved time domain simulation fordynamic milling at small radial immersions, Journal of ManufacturingScience and Engineering, Transactions of the ASME 125 (3) (2003) 416–422.
[13] J.W. Sutherland, R.E. DeVor, An improved method for cutting force andsurface error prediction in flexible end milling systems, Journal of Engineer-ing for Industry 108 (4) (1986) 269–279.
[14] B. Balachandran, Nonlinear dynamics of milling processes, PhilosophicalTransactions: Mathematical, Physical and Engineering Sciences (2001)793–819.
[15] T. Insperger, G. Stepan, Semi-discretization method for delayed systems,International Journal for Numerical Methods in Engineering 55 (5) (2002)503–518.
[16] T. Insperger, G. Stepan, Updated semi-discretization method for periodicdelay-differential equations with discrete delay, International Journal forNumerical Methods in Engineering 61 (1) (2004) 117–141.
[17] F.MAGHAMI ASL, A.GALIP ULSOY, Analysis of a system of linear delaydifferential equations, Journal of Dynamic Systems, Measurement, andControl 125 (2) (2003) 215–223.
[18] S. Yi, P. Nelson, A. Ulsoy, Delay differential equations via the matrix LambertW function and bifurcation analysis: application to machine tool chatter,Mathematical Biosciences and Engineering 4 (2) (2007) 355–368.
[19] E. Butcher, O. Bobrenkov, E. Bueler, P. Nindujarla, Analysis of millingstability by the Chebyshev collocation method: algorithm and optimal stable
immersion levels, Journal of Computational and Nonlinear Dynamics 4 (3)(2009) 1–12.
[20] Y. Ding, L. Zhu, X. Zhang, H. Ding, A full-discretization method for predictionof milling stability, International Journal of Machine Tools and Manufacture50 (5) (2010) 502–509.
[21] S.A. Tobias, A. Burton, Machine–tool Vibration, Blackie, 1965.[22] G. Boothroyd, W. Knight, Fundamentals of Machining and Machine Tools,
second ed., Marcel Dekker, Inc., New York, 1989 (p. 542).[23] Y. Altintas, Manufacturing Automation: Metal Cutting Mechanics, Machine
Tool Vibrations, and CNC Design, Cambridge University Press, Cambridge,2000.
[24] Z. Pan, H. Zhang, Z. Zhu, J. Wang, Chatter analysis of robotic machiningprocess, Journal of Materials Processing Technology 173 (3) (2006) 301–309.
[25] F. Ismail, V. Vadari, Machining chatter of end mills with unequal modes,ASME Journal of Engineering for Industry 112 (1990) 229–235.
[26] A. Gasparetto, A system theory approach to mode coupling chatter inmachining, Journal of Dynamic Systems, Measurement, and Control 120 (4)(1998) 545–547.
[27] A. Gasparetto, Eigenvalue analysis of mode-coupling chatter for machine–tool stabilization, Journal of Vibration and Control 7 (2) (2001) 181–197.
[28] P. Gallina, A. Trevisani, On the stabilizing and destabilizing effects of dampingin wood cutting machines, International Journal of Machine Tools and
Manufacture 43 (9) (2003) 955–964.[29] A. Iturrospe, V. Atxa, J. Abete, State-space analysis of mode-coupling in
orthogonal metal cutting under wave regeneration, International Journal ofMachine Tools and Manufacture 47 (10) (2007) 1583–1592.
[30] N. Hoffmann, L. Gaul, Effects of damping on mode-coupling instability infriction induced oscillations, ZAMM—Journal of Applied Mathematics andMechanics/Zeitschrift fur Angewandte Mathematik und Mechanik 83 (8)
(2003) 524–534.[31] T. Kalmar-Nagy, F. Moon, Mode-Coupled Regenerative Machine Tool Vibra-
tions, Nonlinear Dynamics of Production Systems, Wiley-VCH Verlag GmbH& Co. KGaA, Weiheim, 2004 (pp. 129–151).
[32] J. Gradisek, M. Kalveram, T. Insperger, K. Weinert, G. Stepan, E. Govekar,I. Grabec, On stability prediction for milling, International Journal of MachineTools and Manufacture 45 (7–8) (2005) 769–781.
[33] W. Kline, R. DeVor, The effect of runout on cutting geometry and forces in endmilling, International Journal of Machine Tool Design & Research 23 (2–3)
(1983) 123–140.[34] T.L. Schmitz, J. Couey, E. Marsh, N. Mauntler, D. Hughes, Runout effects in
milling: surface finish, surface location error, and stability, InternationalJournal of Machine Tools and Manufacture 47 (2007) 841–851 (5 SPEC. ISS.).
[35] Y. Kurata, S.D. Merdol, Y. Altintas, N. Suzuki, E. Shamoto, Chatter stability inturning and milling with in process identified process damping, Journal ofAdvanced Mechanical Design, Systems, and Manufacturing 4 (6) (2010)
1107–1118.[36] H. Kim, T. Schmitz, Bivariate uncertainty analysis for impact testing, Mea-
surement Science and Technology 18 (2007) 3565–3571.[37] T.L. Schmitz, B.P. Mann, Closed-form solutions for surface location error in
milling, International Journal of Machine Tools and Manufacture 46 (12–13)(2006) 1369–1377.
[38] Y. Ding, L.M. Zhu, X.J. Zhang, H. Ding, Numerical integration method forprediction of milling stability, Journal of Manufacturing Science and Engi-neering 133 (2011) 031005.
[39] M. Farkas, Periodic Motions, Springer-Verlag, New York, 1994.[40] E. Budak, Y. Altintas, E.J.A. Armarego, Prediction of milling force coefficients
from orthogonal cutting data, Journal of Manufacturing Science and Engi-neering, Transactions of the ASME 118 (2) (1996) 216–224.
[41] T. Caughey, M. OKelly, Classical normal modes in damped linear dynamicsystems, ASME Journal of Applied Mechanics 32 (1965) 583–588.
[42] M.H. Kurdi, R.T. Haftka, T.L. Schmitz, B.P. Mann, A robust semi-analyticalmethod for calculating the response sensitivity of a time delay system,Journal of Vibration and Acoustics 130 (6) (2008) 064504.
[43] P. Lancaster, On eigenvalues of matrices dependent on a parameter, Numer-ische Mathematik 6 (1) (1964) 377–387.
[44] K.A. Foss, Co-ordinates which uncouple the equations of motion of dampedlinear dynamic systems, Transactions of the American Society of Mechanical
Engineers, Journal of Applied Mechanics 25 (1958) 361–364.[45] S. Seguy, G. Dessein, L. Arnaud, Surface roughness variation of thin wall
milling, related to modal interactions, International Journal of Machine Toolsand Manufacture 48 (3–4) (2008) 261–274.
[46] C. Huang, J. Wang, Mode coupling behavior in end milling, in: Proceedings ofthe ASME 2009 International Mechanical Engineering Congress and Exposi-tion (IMECE 2009), 2009, Lake Buena Vista, Florida, USA, ASME.
[47] W.B.S. Ferry, Virtual Five-Axis Flank Milling of Jet Engine Impellers,University of British Columbia, Vancouver, 2008.