Embed Size (px)
Citation preview
1 | Market Insights
Investing in CLOs Spring 2017
•
The fundamentals of CLO investing are
largely unchanged since the earliest
days of the market. Analysts must make
judgments about the three key
components of any CLO: portfolio,
structure and manager. Each of these
components presents a complex mix of
risk and value that should be evaluated
as an integrated whole. The challenges
inherent in making such holistic
judgments can be daunting in the best
of circumstances given the complexities
of loan portfolios, CLO structures and
legal documents, in the context of a
market defined by sudden shifts in risk
and relative value.
At Ares, we rely on a rigorous
investment process that we have honed
over nearly twenty years of CLO
investing experience. Our process
establishes an analytical framework
within which we maintain a consistent
standard while still allowing for
subjectivity and our experience in order
to adapt to different strategies and
market conditions.
Investment processes are often described
as a series of steps, or diagrammed as
flow charts or decision trees. At the heart
of our investment process are hundreds
of questions that we ask and answer –
questions that are intended to reveal risk
and value.
To help us answer these, and hundreds of
other questions, we rely on a proprietary
set of analytical tools and systems, called
INsight. This technology platform was
designed and built by our investment
team specifically to invest in structured
credit. Without such resources, we would
find investing in the CLO market a
formidable challenge given the wide
range of risks present in today’s market.
This paper is intended to provide a
window into our investment process. We
highlight what we believe are some of the
key questions that investors should be
asking today as they participate in this
established, yet evolving, asset class.
Key Considerations for Today’s Market
Keith Ashton Portfolio Manager
HEADQUARTERS Ares Management, L.P.
2000 Avenue of the Stars
12th Floor Los Angeles, CA 90067
www.aresmgmt.com
Company Locations
U.S. Los Angeles, New York, Chicago, Boston,
Atlanta, Washington D.C., Dallas, San Francisco Europe/Middle East London, Paris, Frankfurt,
Stockholm, Luxembourg, Dubai
Asia/Australia Shanghai, Hong Kong, Chengdu, Sydney
Please see the Endnotes and Legal Notice and Disclaimers beginning on page 21.
2 | Market Insights
Table of Contents
Introduction ............................................................................... 2
Questions about CLO Portfolios ................................................. 2
Questions about CLO Structures ................................................ 6
Questions about CLO Managers ................................................ 10
Factors Related to CLO Supply .................................................. 13
Amortization and New Issue Dynamics .................................... 15
CLO Models ................................................................................ 15
Key Issues in European CLOs .................................................... 16
Introduction
The fundamentals of CLO investing are largely unchanged since
the earliest days of the market. Analysts must still make
judgments about the three key components of any CLO:
portfolio, structure and manager. Each of these components
presents a complex mix of risk and value that must then be
evaluated holistically – in aggregate.
The challenges inherent in making such judgments can be
daunting. Each CLO references a diversified loan portfolio
typically consisting of several hundred individual positions.
Each loan portfolio itself comprises a unique subset of the
investible loan universe. After investing in as few as fifteen CLO
securities, an investor may find himself exposed to well over
1,000 unique corporate credits of varying quality and value.
Each CLO is designed (structured) largely according to rating
agency criteria that stipulate minimum credit enhancement
levels necessary to achieve target debt ratings (e.g. AAA, AA, A,
BBB, BB, B). Rating agency criteria adapt (somewhat) to desired
portfolio characteristics such that a more aggressive loan
portfolio is likely to require higher levels of credit enhancement
to achieve target tranche ratings. Certain structural features
can also be a matter of negotiation with investors and the
manager alike each seeking terms that may enhance the quality
or value of their position. Consequently, no two CLOs are
identical. While many of the differences may seem trivial, some
can become critical factors in certain scenarios.
Each CLO is managed by a professional credit manager who not
only constructs the initial loan portfolio but also actively trades
the portfolio throughout the CLO’s life. The manager makes
many other decisions that can affect the quality and
performance of the portfolio over time. In our view, CLO
managers differ markedly from one another in terms of their
credit selectivity, investment process and competency in
different market environments. Most CLO managers today also
have a track record of performance through the recent default
cycle. Their performance reveals not only skill in managing
credit, but also competency in managing the CLO structure
itself. Consequently, most managers have earned reputations
among CLO investors, and are thereby perceived differently in
the market.
As CLO investors, our job is to make risk and value judgments
about a given CLO’s portfolio, structure and manager, including
a judgment as to how these three components aggregate to
affect the risk and value of a given CLO investment. Such
judgments rely heavily on our team’s experience and skill in
synthesizing volumes of data and other information into an
investment thesis that can withstand the scrutiny of our
investment committee.
At Ares, we rely on a rigorous investment process that we have
honed over more than sixteen years of CLO investing
experience. This process establishes an analytical framework
within which we can maintain a consistent standard, while
allowing us to adapt our analysis based on our qualitative views
on different investment strategies and market conditions.
At the heart of our investment process are hundreds of
questions that we ask and answer – questions that are intended
to reveal risk and value. To help us answer these, and hundreds
of other questions, we rely on a proprietary set of tools and
systems, called INsight. This technology platform was designed
and built by our investment team specifically to invest in
structured credit. Without such resources, we would find
investing in the CLO market a daunting challenge given the wide
range of risks present in today’s market.
What follows is an overview of what we consider the key
questions that we are asking today as CLO investors.
Questions about CLO Portfolios
For CLOs to generate equity returns, the underlying loan
portfolio must generate interest income (called excess spread)
that is meaningfully greater than the amount required to pay all
debt tranche interest payments and fund expenses (including
management fees). Excess spread is an inherent feature of CLO
structures as the average cost of debt capital in the CLO liability
structure is lower than the average interest coupon earned on
the underlying loan portfolio. This is what is often referred to

| Market Insights 3
as “CLO arbitrage.” Figure 1 illustrates this arbitrage condition
in terms of an income statement.
The quality of the arbitrage (i.e. the volume of excess spread)
will vary during the life of the CLO. This is largely due to changes
in the underlying loan portfolio over time. While CLO liabilities
are set (fixed) for the life of the CLO, the assets are in a
continual state of flux. Loans prepay, the CLO manager actively
trades the loan portfolio, and market conditions change such
that the CLO’s loan portfolio may generate materially higher or
lower interest income at different times.
One of the key objectives of the CLO manager is to manage the
quality of the arbitrage. This has an obvious benefit to equity
investors as they may expect a more consistent stream of
quarterly distributions. Debt investors also care deeply about
the quality of the arbitrage. Debt investors can benefit from the
‘trapping’ of excess spread as the CLO structure works to
protect (and replenish) credit enhancement levels in times of
stress.
CLO managers can enhance the arbitrage by investing in loans
that have higher interest coupons. Subject to certain
investment guidelines and constraints, managers generally
have latitude to construct and manage the CLO’s loan portfolio
based on their preferences. Higher interest coupons are
typically associated with riskier loans; consequently, managers
must weigh the trade‐off between enhancing the arbitrage
(current distribution rates to equity) and the potential for
defaults and losses inherent in riskier credits.
Each manager assesses this trade‐off a little differently. Each
works to capture value in the loan market through allocations
to a range of credit risks. This results in a relatively wide range
of CLO loan portfolio credit profiles, with some reflecting a
more aggressive posture in credit and others a more
conservative posture.
One of the challenges facing CLO managers today stems from
the strong investor demand for loans. Whether in the form of
retail funds or institutional allocations, the loan market has
experienced – and continues to experience – a tremendous
volume of capital inflows. Consequently, loan spreads have
contracted, putting pressure on the quality of CLO arbitrage.
We have found that most CLO managers respond in predictable
ways, by reassessing and refining their credit strategies. Many
CLO managers have found value in second lien loans, high yield
bonds, smaller cap credits, more leveraged credits, cyclical or
out‐of‐favor sectors. Other CLO managers have found value in
primary markets, or among non‐US credits. In our view, every
CLO manager feels at least some pressure to stretch a little, to
become more creative, or to dig a little deeper into the market
to protect the arbitrage.
Question 1: Where is the stretch?
A common topic found within CLO research articles is the
degree to which CLOs tend to own many of the same loans… in
other words, credit overlap. Credit overlap is useful analysis in
the sense that it suggests a degree of ‘beta’ within CLO
portfolios as an asset class. Overlap tends to be very high within
the 2.0 CLOs of a given manager, typically over 90%. However
overlap drops to around 50% when comparing loan portfolios
across managers. That is, when comparing two CLOs from two
different managers, only about half of the credits will be held in
common. Finally, when comparing a given CLO’s loan portfolio
to a larger number of other CLOs (by different managers), one
typically finds only about 10‐20% of the credits are ‘unique’ to
that CLO.
While high levels of overlap are important indicators of
correlation (real correlation, not merely statistical), non‐
overlapping credits can be important indicators of what we call
“the stretch” – the allocation to credits that represents a higher
level of risk in the portfolio, and which tend to contribute
disproportionately to the arbitrage.
One way to analyze the quality of a CLO’s arbitrage is to
evaluate each underlying asset’s contribution to equity
distributions. What we typically find is that anywhere from 10%
to 30% of a typical 2.0 CLO loan portfolio contributes very little
to equity distributions – the spread of these assets tends to just
barely cover the CLO’s inherent costs. The manager in many
cases is compelled to own such assets to meet portfolio quality
criteria such as WARF, S&P Recovery Rating, and diversity
requirements. The largest share of loan assets, typically 50% to
75%, contributes meaningfully to the arbitrage but are
insufficient to produce acceptable equity returns.
In every CLO, some minor portion of the assets makes up the
difference and then some. In fact, in most CLOs we have
analyzed with this methodology, more than 40% of the equity
distributions can be attributed to only 10%‐20% of the loan
assets. These tend to be the riskier credits with the highest
spreads; they also tend to be the least overlapping credits.
These represent ‘the stretch.’
Put another way, the performance of this relatively small subset
of credits has a disproportionate impact on the performance

4 | Market Insights
and quality of the CLO. Consequently, in our view, one can learn
a great deal about the manager’s credit strategies and the
quality of a CLO’s arbitrage by focusing on ‘the stretch.’
Question 2: Has there been a shift in credit strategy
or discipline?
Credit strategies either shift or lack definition more often than
many CLO managers are willing to admit. In our experience, it
is fairly rare to find a manager who can not only articulate a
clear strategy for investing within a CLO, but can then also
execute on that strategy consistently over time. That isn’t to
suggest that there’s a lack of credit discipline or process,
however. Most investment processes among CLO managers can
be articulated and described in great detail, and are followed as
a matter of tradition (good or bad).
Strategy is a different matter altogether and speaks to the
overall challenges and goals of a given CLO. An example of a
strategy may be the observation that a given CLO has been
negatively affected by loan refinancings or repricings, resulting
in a weaker arbitrage and reduced distributions to equity. A
manager’s credit strategy for such a CLO might include a plan
to replenish spread in the portfolio through rebalancing and
trading, or even changing the risk profile of the loan portfolio.
While the manager’s investment process produces various
investment ideas, the credit strategy should identify which of
these investment ideas are best suited to improve the
arbitrage.
In reality, most CLO managers tend to focus their time on
assessing credit and give short shrift to fund strategy until
there’s a real problem confronting them that must be
addressed. There is perhaps no better example of this
phenomenon than to observe managers’ behavior in response
to WAL Test pressures among 1.0 CLOs between 2011 and
2013.
Many factors contributed to the erosion of WAL Test cushions
in 1.0 CLOs, all of them identifiable. Notwithstanding, WAL Test
cushions were almost universally ignored, despite being one of
the most easily anticipated and most significant constraints that
CLO managers faced as 1.0 CLOs neared the end of their
reinvestment period. Typically buried on the third or fourth
page of a trustee report, the WAL test simply wasn’t on the
radar for the vast majority of CLO managers until it was
suddenly the most significant constraint on their ability to
invest… at which point it was almost too late to do anything
about it. Few managers, even those with better foresight, could
articulate a strategy for managing around this constraint. Those
managers who studied the issue seriously and developed a
strategy for dealing with it strongly outperformed those who
did not.
In our experience, credit strategies tend to drift over time in
most CLOs for three reasons: (a) they are not well defined or
articulated; (b) there is a lack of follow‐through or execution; or
(c) clear goals or objectives are not established. Monitoring the
drift, and its causes, is a key element to CLO surveillance as it
not only reveals a changing risk profile but may also reveal a
lack of focus or discipline by the manager.
While a manager’s credit strategy should be an important
consideration for both debt and equity investors alike, we find
few CLO investors are even thinking about CLO managers, CLO
portfolios and risk in these terms. One likely explanation is that
identifying and tracking strategy is difficult in the best of
circumstances, and therefore may be too costly (resources,
time) for most CLO investors. However, we think this is one area
where managers can be effectively differentiated. To the extent
that most investors in the market have difficulty making such
differentiations, it creates an opportunity for those who can to
add value.
Question 3: How big are the tails?
Many factors combine within a CLO to create an uneven
distribution of risk. Structural features can spring (or not) to
shift risk and value within the CLO; credit risk is distributed
unevenly across CLO tranches; and loan portfolios (as described
above) contain a range of risks, not all of which are quantifiable
in terms of ratings, spreads and recoveries.
One of the biggest challenges facing CLO investors is how to
evaluate this distribution of risk within a given CLO, and then
across various CLOs. The problem is complicated by the fact
that the CLO market presents investors with a number of trade‐
offs to evaluate. For example, a CLO analyst has to determine
how much more credit enhancement is sufficient to offset the
risk of a more aggressive portfolio. We employ very
sophisticated quantitative methods to systematically evaluate
“risk adjusted” tranche value. These methods consist of highly
effective tools of differentiation, such as risk ranking.
However, such an evaluation also needs to consider qualitative
factors or judgments about concentrations of risk that some
quantitative methodologies can understate. Inevitably, in our
experience, this becomes a matter of evaluating tail risks. Tail
risks, which include both risk concentrations and sudden shifts

| Market Insights 5
in credit correlation, require a careful, rigorous approach to
identify, quantify and monitor.
Many investors assume that as long as concentrations, or tail
risks, do not present a threat to principal (i.e. there is sufficient
credit enhancement to protect their investment from loss),
then there is little to worry about. From a pure ‘principal loss
analysis’ perspective, perhaps this is an appropriate conclusion.
However, the development of such risks does pose a threat to
market price, liquidity and possibly also ratings. Within an
actively‐managed portfolio, especially one focused on
producing both absolute and total returns, tail risks should
never be ignored.
Question 4: How does credit risk compare to other CLOs?
To many CLO investors, one of the most surprising
developments during the financial crisis was the degree to
which CLO portfolios began to differ from one another. Before
the crisis, virtually all CLO loan portfolios were free from
defaulted or distressed credits. The average market price of
CLO loan portfolios was close to par, and there was very little
distinction from one CLO to another in terms of the average
market price of the underlying loan portfolio. In fact, one may
have reasonably concluded that CLO portfolios were largely
indistinguishable from one other, an inference many investors
made if CLO tranche spreads during that period of time are any
indication. There was very little, if any, difference in debt
spreads across the entire market during the first half of 2007,
evidence perhaps that the market saw little, if any, difference
in risk among tranches of a comparable rating.
The onset of the market cycle created a completely different
picture. Investors began to see just how different each CLO
portfolio really was. We observed enormous ranges in exposure
to different indicators of risk. Exposures to triple‐C rated assets
ranged from under 5% to over 25%. Average market prices of
loan portfolios ranged from over 95 to below 65. Exposure to
distressed or defaulted credits ranged from under 10% to over
30%. These wide ranges shattered the perception that CLO loan
portfolios were largely homogeneous in terms of risk. Before
the crisis, all of the real differences in credit risk were hidden
from view, buried within the financial statements of each credit
facility.
One of the most important functions of a CLO analyst is to
differentiate the credit quality of a given CLO portfolio on both
an absolute and relative basis. Doing so requires an integrated
approach that synthetizes both fundamental credit and market
information.
We believe there are significant differences in credit quality
across CLO portfolios today – every bit as significant as existed
within CLO portfolios in early 2007 – and similarly hidden within
the financial statements of underlying credit facilities. The
market today does only a slightly better job of both identifying
and evaluating (through market spreads) these differences…
which is to say, not well at all.
It requires a concerted effort, a significant amount of data and
resources, and a fundamental credit approach to draw
meaningful conclusions about credit risks in CLOs. We believe
the lack of differentiation in the market today is once again a
source of tremendous opportunity for investors who can
positively select and construct high quality portfolios.
Question 5: What trends are developing within the portfolio?
The investment guidelines and other eligibility criteria that
govern the type and quality of loans that a manager can
purchase into a given CLO nonetheless provide the manager
significant latitude and discretion. A manager can change the
credit complexion of a CLO portfolio meaningfully without
breaching guidelines designed to govern exposure.
CLO investors who rely on trustee reports alone to monitor
collateral quality will almost certainly miss trends that can
develop even while the manager is fully compliant with
collateral quality tests.
Trends can reveal shifting strategies, growing exposures or
concentrations to certain risks, or even trading behavior that
primarily benefits certain investors in the CLO, like equity. By
comparing the nature and pace of developing trends across
CLOs and managers, one can start to identify managers who are
behaving “differently” from their peers. This in turn can reveal
potential value or risks that would otherwise remain hidden
from view.
While trend analysis is inherently backward looking, we believe
that certain patterns can nonetheless become leading
indicators for larger scale changes in credit quality, risk or value.
In that sense, it matters whether one is watching leading or
lagging indicators, and if one is able to monitor data that others
in the market are not, or cannot.
Question 6: What risks does the given portfolio amplify or
diversify within the overall fund?
New investments introduced into a CLO portfolio should be
evaluated not only for their quality and integrity as stand‐alone

6 | Market Insights
investments, but also for their contribution to risk and value
within the context of an overall portfolio of CLO securities.
Until we developed the INsight platform in 2008, there was no
effective way to aggregate credit exposure data across a
portfolio of CLO tranches and assess risk that simultaneously
accounted for both credit quality and CLO structure. That
tremendous innovation unlocked the ability to construct and
manage CLO portfolios toward specific risk goals.
Even without the enormous benefits of such technology and
data, there are still important considerations when evaluating
a particular CLO security for inclusion into a larger portfolio.
Many of the questions asked above, especially those related to
tail risks, credit overlap, trends and credit strategies can be
evaluated in a non‐quantitative way to still reveal the build‐up
of certain exposures or concentrations across a portfolio.
Most investors, given the time and trouble it requires to
conduct such analysis, rely on principles of diversification,
rating allocations and manager selection to help mitigate the
inevitable amplification of certain (undesired) risks within CLO
portfolios.
Questions about CLO Structures
CLO structure encompasses all of the features of the liabilities,
including the priority of payments (i.e. waterfall), credit
enhancement, triggers and tests, intercreditor rights and
control rights. All cash flow CLO structures share similar,
essential features that, in our opinion, have been key to the
success of the CLO market across multiple default cycles and
market environments.
Nearly all CLO structures include the credit tranching of risk into
rated debt securities. The most senior tranches benefit from
the subordination and overcollateralization of more junior
tranches, and therefore have less exposure to risks present in
the underlying portfolio. The typical CLO structure is illustrated
in Figure 2 with five debt tranches and an equity tranche.
Nearly all CLO structures establish three major periods between
issue date and legal maturity date. These include (i) a ramp‐up
period; (ii) a reinvestment period; and (iii) an amortization
period (see Figure 3). Various rules and constraints govern each
period in the life of a CLO, and investors are subject to certain
risks that are somewhat unique to each period. The average life
of a CLO security, as well as its expected principal window, is
largely governed by the specific features of each period.
It is both a blessing and curse that despite basic similarities
among CLOs, no two CLO structures are identical. Structures
evolve and adapt over time in response to both market
conditions, rating agency criteria, and changes in collateral
composition. Even CLOs issued in the same market
environment can differ markedly from one another as a
function of negotiation among investors and the manager alike.
The lack of standardization in the CLO market is perhaps the
most important reason why CLOs have not been adopted more
broadly in the market as have other asset‐backed securities,
including ABS, CMBS, and RMBS.
While there have been various attempts at standardization over
the 20 year history of the CLO market, all have failed to garner
the support of CLO market participants. Unlike the
securitization asset classes whose structures and terms have
become highly standardized, CLOs are unique in that they
reference an actively managed portfolio of liquid, rated assets.
Standardization in securitization seems to work best when the
assets are a homogeneous, static pool. A ‘one‐size‐fits‐all’
approach to CLO structures would, in our opinion, fail to
address the lack of standardization found in CLO portfolios and
credit strategies. In building portfolios of CLO securities, we find
tremendous value in the ability to select CLOs with structural
features we prefer for a given strategy or risk profile.
The role of rating agencies in the establishment of a CLO
structure cannot be overstated. A key difference in today’s CLO
market is the preponderance of tranches rated by a single
rating agency. Prior to 2008, nearly all CLO debt tranches were
rated by at least two rating agencies (usually Moody’s and S&P).
The few CLO tranches rated by a single agency that were issued
pre‐cycle were generally not well received by the market. Most
such CLOs were structured in an unusual way (e.g. synthetic
tranches, or very high leverage) that did not allow them to pass
the criteria by the other agencies. By contrast, today nearly all
CLO debt tranches (except for AAA tranches) are rated by a
single agency; the market fully accepts this single‐rating
convention.
Rating agency criteria, reflected in CLO structures since the
beginning of the market, have been generally consistent over
time with some notable exceptions. During the financial crisis,
and the period of intense market and political pressure that
followed, rating agencies temporarily revised their rating
criteria. This triggered a wave of downgrades across the CLO
market. Nearly every CLO tranche, with only a few exceptions
among AAA tranches, was downgraded at least two notches.
Most ratings fell between four and seven notches (i.e. one to

| Market Insights 7
two rating categories). Key changes to criteria included revised
scenarios that imposed extreme stress on the underlying loan
portfolios including unprecedented and sustained default rates,
high rates of default correlation, and significantly lower
recovery rates.
Market participants generally viewed these new criteria as
unrealistic and unreasonable. Eventually even the rating
agencies came to a similar conclusion. Within two years, the
agencies re‐revised their criteria and triggered a second wave
of rating actions: this time, upgrades. The large majority of CLO
tranches were restored to their original ratings by one of the
agencies. This created a large market of “split‐rated” CLO
tranches that persists to a large degree even today. In our view,
the rating agencies’ handling of criteria through the cycle
undermined the confidence that investors once had in the
rating process.
Today’s CLO market is dominated by Moody’s and S&P in the
US, and Fitch and S&P in Europe. Each agency takes a similar
approach to establishing credit enhancement levels. However,
each agency has introduced certain features that are somewhat
unique to its criteria. These differences in criteria have led some
managers and investors to prefer one agency over the other.
While such behavior smacks of ‘ratings shopping,’ in our view
these decisions are typically motivated by legitimate concerns
over the compatibility of certain agency criteria with a
manager’s investment style or credit strategy.
We have identified several areas where certain agency criteria
actually create an incentive to increase credit risks as managers
are compelled to make certain credit decisions merely to meet
the criteria standard. Sophisticated CLO investors are keenly
aware of these trade‐offs and the motivations behind the
selection of a rating agency in today’s market.
Ratings criteria attempt to reconcile the risk of the loan
portfolio (within stated limits) with a statistical likelihood of
tranche impairment for a given rating (see Figure 4). The
objective is to equilibrate the risk of all CLO tranches of a given
rating. The results of this reconciliation can be, and frequently
are, at odds with the way investors may evaluate the same
security.
Consequently, in our experience we perceive significant
differences in risk among tranches of the same rating. Likewise,
the market attempts to differentiate weak from strong,
aggressive from conservative, but using metrics and analytics
that are simply outside the scope of rating agency criteria. So
while the market is compelled to live with the structure that the
ratings process produces, sophisticated CLO investors tend to
look well beyond the rating to make judgments about the
integrity and value of the security.
Question 1: How does the structure compare to other CLOs in
its peer group?
It is something of a truism that, like snowflakes, no two CLO
structures are identical. Despite strong similarities among
essential characteristics, and a relatively limited range of
differences, CLO structures are ultimately a product of the
rating process, investor negotiations and market conditions.
Structures can also vary depending on the arranging bank and
by manager; each party can impose preferences or alternative
solutions to addressing investor demands.
When market conditions are healthy and demand is strong, we
see relatively little market price differentiation among CLOs
based on structure. CLO tranches with relatively weak
structures will still find acceptance and can trade at spreads
very similar to CLO tranches having a strong structure.
However, at times of market stress and when demand is
weaker, stronger structures still tend to enjoy liquidity and
experience less spread volatility compared to weaker
structures. Consequently, we think it’s important to identify
relative strength and weakness in structures as one means of
positioning for future trading opportunities.
Beyond market liquidity and volatility considerations, about
which some investors may have less sensitivity, structural
differences among 2.0 CLOs can have a meaningful impact on
performance, ratings, average life and optionality. Of course
these are the very factors that ultimately drive investor
preferences in times of stress.
All things equal, debt investors should be primarily interested
in structures that are protective of credit enhancement (e.g.
relatively tight triggers) and limit extension risks (e.g. relatively
strict governance of reinvestment, especially after the
reinvestment period date). In many scenarios, such ‘debt
friendly’ structures have the added feature of creating an
economic incentive for equity investors, and perhaps
managers, to redeem and restructure the CLO earlier than they
might otherwise. Compared to a CLO without such features, the
debt‐friendly structure may present a debt investor an element
of relative value.
By carefully evaluating and then comparing structural features,
one can begin to select structures that tend to support one’s

8 | Market Insights
investment view or strategy, and provide another means of
diversifying certain risks within a portfolio.
Question 2: Has the choice in rating agency introduced risks
in the portfolio or credit strategy that would otherwise not
be present?
The prevalence of single‐rated CLOs in today’s market,
combined with substantive differences in criteria among the
rating agencies, introduces the possibility that the chosen
agency’s criteria provided some value to one or more of the
CLO’s stakeholders. A thorough understanding of each agency’s
criteria, especially those factors that tend to be the most
constraining, is essential to identifying possible motivations.
A recent example involves a CLO manager who struggled to
assemble a loan portfolio that both produced a healthy
arbitrage while still meeting S&P’s minimum recovery rate
criteria given the structural leverage they were hoping to
achieve. By choosing instead to have the CLO rated by Moody’s,
the manager was able to avoid the S&P recovery rate test
altogether (in exchange for taking on Moody’s diversity score
and WARF tests). The result was a loan portfolio that had over
20bps more spread than would have been achievable had they
been constrained by the S&P tests. One might reasonably
conclude a few things from this example.
It’s not always clear ‘who is right’ in these situations, so
investors need to evaluate the implications of avoiding a rating
agency constraint that is ostensibly designed to protect
investors. However, such constraints can also incentivize a
manager to purchase loans it may otherwise not choose for
reasons of risk and value simply to pass an arbitrarily set limit.
In that sense, an element of credit selection and portfolio
construction has been ceded to the rating agency. Some
managers, rightly or wrongly, bristle at the notion of being
compelled to change their credit strategy to suit rating agency
criteria.
We believe investors should take an agnostic view of these
things and focus instead on evaluating a manager’s portfolios
and strategies on their own merits. One area of particular focus
is the comparison of loan portfolios, and risk allocations, should
the manager have CLOs rated by different rating agencies. This
tends to produce a greater number of non‐overlapping
positions which can reveal how the agency criteria has shaped
risk for better or worse. Such a comparative approach can also
highlight the sophistication with which a manager works under
CLO constraints – an important element in manager evaluation,
especially for newer CLO managers.
Question 3: What is the value of the credit enhancement?
CLO investors benefit from four different forms of credit
enhancement, each contributing a different type and value of
economic protection against unexpected stress.
1. Subordination
2. Excess Spread
3. Structure
4. Active Management
The economic value of the first three forms of credit
enhancement can be estimated using advanced quantitative
methods and cash flow models representing the CLO’s asset‐
liability structure. While a quantitative approach has certain
limitations inherent in modeling, it is nonetheless a useful tool
for comparing and differentiating one CLO from another.
Subordination: The value of subordination, or excess collateral,
has two components. Perhaps the most obvious is the
protection it provides against a potential principal loss. Should
all subordination be eroded through par losses in the
underlying loan portfolio, the tranche faces a strong likelihood
of actual impairment, or default.
However, a default of principal on a CLO tranche is an
exceptionally rare event. In our view, there is a more immediate
value to subordination than principal protection: market
perception. Investors and CLO trading desks spend a lot of time
and effort focused on relative subordination levels among CLO
tranches. Tranches with high subordination levels tend to be
considered of higher quality; tranches with low subordination
levels tend to be considered lower quality. Trading spreads tend
to reflect these judgments. Accordingly, a trend toward par
erosion or par creation can have a material impact on tranche
liquidity and relative value.
Excess Spread: Excess spread is significantly harder to value not
because it is less tangible, but because it relies on cash flow
models and is contingent (captured only if certain triggers are
breached). Despite these challenges, excess spread is, in our
opinion, one of the most significant and valuable forms of credit
enhancement available to CLO investors. It was the capture of
excess spread that absorbed losses and then replenished credit
enhancement that had been lost within CLO portfolios during
the past two credit cycles.
Structure: CLO structures include features, including
investment limits and triggers, that protect investors from

| Market Insights 9
certain portfolio concentrations and from degradation in
portfolio quality, subordination or excess spread.
The economic value of certain structural features can be
measured using sophisticated simulation analyses. This
approach allows the analyst to measure the economic impact
of a structural feature relative to a base line (standard)
structure, or under a variety of market scenarios. Such analyses
can provide meaningful insights into relative value and risk.
During the previous cycle, Ares employed a proprietary
simulation technology, within INsight, specifically to help us identify structural features we perceived to be mispriced in the
market.
Active Management: Because both subordinated management
fees and performance fees are only payable if the CLO structure
and arbitrage are healthy, managers face strong economic
incentives to manage the loan portfolio for positive outcomes.
In practice, we have found that these incentives are an
important form of credit enhancement that doesn’t exist in
other structures, such as static CLOs. In the hands of a talented
manager, active management of the underlying portfolio can
(and certainly did during the previous cycle) improve credit
enhancement levels beyond what the CLO structure alone
could have provided.
Question 4: Does the structure impede the manager from
“doing the right thing” or executing their strategy in certain
scenarios?
The variety of CLO structures that existed in June 2007 created
something of a laboratory for investors to evaluate the impact
of CLO structures on manager behavior and performance.
Several larger managers had, over the course of 2005‐2007,
issued a number of CLOs with significantly different structural
features.
Ares observed in most of these cases that the manager’s credit
strategies were largely consistent across each CLO in terms of
risk allocations, credit overlap, and key portfolio attributes. Yet
as the cycle progressed, the varying CLO structures began
imposing different constraints and created unique portfolio and
trading challenges for the managers. Some created unexpected
incentives that resulted in divergent trading and credit
decisions… and ultimately different performance.
CLO structures in today’s primary market are generally more
consistent with one another. However, in our view there is a
more marked vintage effect than we have observed before. The
evolution of cov‐lite limits, reinvestment language, optional
redemption rights, and many other features have experienced
large swings in both directions since 2011. Micro‐vintages now
exist defined by market conditions that either favored equity or
debt investors.
The differences are more than nuances, in our opinion. We
have always maintained that it is incumbent on investors to
very carefully read and analyze the legal documents governing
every CLO investment. We feel this duty is as relevant today as
ever; we fully expect that certain structures will have a material
impact on performance as they impose constraints on CLO
managers, or create unexpected incentives or outcomes.
Question 5: Does the structure create uncertainty about the
timing and length of the principal repayment window?
In today’s market, there is perhaps no structural feature more
frequently debated among sophisticated CLO investors than
the specific language governing principal reinvestment after
the end of the reinvestment period.
Relatively few CLOs are so tightly structured as to completely
eliminate the possibility of principal window extension as a
function of manager discretion or trading activity. Perhaps
ironically, the risk and economic implications of extension are
fraught with complexity as they combine both legal
interpretation, market conditions and opportunity, and
mitigating structural features that are, frankly, impossible to
forecast with any certainty.
Given that, investors tend to take a simplistic approach.
Documents and structures that are perceived to be ‘loose’
around the issue of reinvestment tend to be modeled assuming
a worst‐case scenario (that is, very extended). Stricter
documents receive a different, but not always significant,
treatment.
Evaluating the economic implications of these features is vexing
given currently low interest rates and a relatively steep term
structure. The ‘modeled’ value of extension today barely
registers. However, the specific legal language within a given
CLO’s indenture relative to extension risk could one day
become a very material component to price and yield
calculations. The details do matter.
Question 6: What structural features were the most
contested / negotiated among investors prior to finalization?
The typical new issue CLO begins life as a discussion among a
sponsoring equity investor, a manager and an arranging bank.
Certain key terms or features are agreed with the equity

10 | Market Insights
investor typically leading those conversations. The arranging
bank is then tasked with executing those agreed terms with
debt investors.
Generally the next conversation takes place between the
arranging bank and a lead AAA investor. The current cohort of
AAA investors are generally very sophisticated in their analysis
of CLO terms and structures. The ensuing negotiation often
results in the lead AAA investor proposing changes to the initial
terms. In some cases, this triggers an intense round of
negotiations between the lead equity investor and the lead AAA
investor, with the arranging bank mediating.
Once an agreement has been reached, the resulting structure
and terms reflect a series of compromises, some favoring debt
investors and others favoring equity investors.
In our experience, the points of greatest contention tend to be
very instructive. Perceiving shifts in negotiating leverage, and
thereby shifts in structure and terms, can indicate upcoming
shifts in relative value and risk. By participating broadly in the
primary CLO market, we often get an early read of these
developments and can then position for these shifts through
trading.
Questions about CLO Managers
Efficient markets theory suggests that managers are limited, at
best, in their ability to create value and are, at worst, an
unnecessary cost imposed on investors as they add no real
value. While empirical studies of certain markets (i.e. publicly
traded stocks) would seem to support such statements, the
same cannot be said of credit managers generally, and CLO
managers specifically. Prior to the recent financial crisis, it was
common to hear CLO investors say that the manager “doesn’t
matter.” Such sentiments were especially popular among
investors in the senior tranches who could argue that virtually
nothing the manager did would really impact their investment.
Statistically, that statement is probably true. Given that no
senior CLO tranche has ever defaulted, it may stand to reason
that the managers’ actions, whether competent or reckless,
had no ultimate effect.
But such a view ignores some stark realities. Despite the
remarkable success of CLOs as an asset class, there were indeed
winners and losers in the market where investors differentiated
based on quality and performance. Those judgments were
often swift and severe. As a function of both liquidity (demand)
and execution (spread), tiering by manager has been, and
continues to be, a favorite pastime of CLO investors.
With robust issuance and the entrance of new CLO managers,
it may be tempting to again ignore manager quality in the view
that they don’t matter. In our opinion, such indifference toward
managers ignores the very real implications of tiering in the
market on both structure and portfolio quality, and by
extension asset liquidity.
The pressures to create and maintain an arbitrage among even
top‐tier managers are significant today. A weaker manager is in
an even tougher position. Debt execution levels for a second‐
or third‐tier manager may be as much as 20‐30 basis points
wider than for a top tier manager. Equity investors (justifiably)
also demand a higher return from a weaker manager. To deliver
that return given higher debt costs, the weaker manager will
need to construct and maintain a higher spread collateral
portfolio. The weaker manager may also be compelled to
reduce their management fees (perhaps significantly) as a
means of compensating for weaker debt execution levels. Such
relationships suggest a classic case study in adverse selection.
Investors who ignore this new market reality may be in for an
unwelcome surprise in the next downturn as they find
themselves holding onto distressed positions for which there
may be few bidders. In our experience as investors, the few
extra basis points earned as compensation for investing in a
weaker manager will be swallowed by illiquidity and a much
higher risk premium.
Empirical CLO data show a strong relationship between CLO
performance and manager; in fact, the effect of a manager can
dwarf the effects of both vintage and structure. Our due
diligence experience with hundreds of managers has revealed a
wide range of CLO manager qualities. We find large differences
in talent, aptitude, credit competency, investment process,
operations, sophistication around CLO structures and
technology. We find some managers fully equipped to support
the complicated task of creating value within CLO structures
while others are still developing those resources and skills.
You will never hear a member of our team say that managers
don’t matter. Rather, you’ll hear instead strong opinions about
managers based on regular, probing interactions with them.

| Market Insights 11
Question 1: What evidence is there to suggest the manager is
sophisticated in the management of CLOs?
Managing a CLO is unlike managing almost any other kind of
loan fund. Most CLO managers will freely admit that there is a
relatively steep learning curve to managing loans within a CLO
structure with its myriad rules and constraints. Mistakes are
common among new managers.
However, competent managers having deep experience with
CLO structures often laud CLOs as one of the best vehicles for
creating value for investors, especially in times of stress. Such
managers are few in number, but not terribly hard to identify.
Most managers can articulate a clear and logical process for
managing credit and making credit decisions. Far fewer can
articulate a clear and logical process for managing the CLO
structure. In our view, the best CLO managers are those who
see their roles as managing both credit and structure with equal
rigor.
Sophistication is evidenced in a manager’s investment in the
kind of resources (professional staff and technology) necessary
to manage CLOs. It is evidenced in a manager’s fluency with CLO
structural features, especially those that are easy to overlook.
It is also evidenced in a manager’s trading and cash
management decisions. Sophisticated managers simply talk a
different game and view the CLO structure as a vehicle for
creating value.
Many investors confuse equity performance or some other
metric with sophistication. While equity outperformance is an
indication of something special, we have found strong equity
performance among some managers who are barely literate in
their own indentures. Evaluating managers based on data is
necessary, but wholly insufficient.
In our experience, nothing beats on‐site, in‐person manager
due diligence. Over the years, our team has invested hundreds
of hours meeting with managers in their offices. In every single
one of those meetings, we were able to learn something
important that we could not have gleaned from looking at the
data alone.
Question 2: What is the general market opinion of this
manager, and is it likely to change over time?
Every manager that is today considered ‘top tier’ by the market
was once a start‐up with no reputation and was greeted by CLO
investors with a measure of deserved skepticism. Managers
earn their reputations among CLO investors through
performance and by demonstrating a real commitment to their
CLO business.
Manager tiering is a common feature in the CLO market today.
While investors may have different views of managers, tiering
is evident in trading levels and liquidity (depth of bid). One
potential source of value, excess returns, can stem from
identifying managers whose reputations are likely to improve
over time.
The only process we have found to help establish such a view
on a manager is conducting a series of on‐site, in‐person due
diligence meetings over time. Especially for newer CLO
managers – whether or not they are established in other
businesses – a rigorous analysis of the platform (including a
thorough investigation of their investment process, operations,
financials and technology), can reveal strengths and
weaknesses that would otherwise be missed.
Question 3: How accessible is the portfolio manager and
analyst team? Are they willing to share information freely?
A remarkable feature of the recent financial crisis was the
manner in which CLO managers dealt with their investors.
Almost all CLO managers boast of offering transparency and
access when marketing a new CLO to investors; fewer continue
to extend that offer in practice after the CLO has been issued.
Some go to seemingly great lengths to avoid interaction with
investors.
It seems hard to imagine, but several managers simply refused
to interact with investors and other market participants during
the financial crisis. Prior to the cycle, some of these bad actors
were highly respected and had a strong following. As a
testament to the professional integrity of the CLO investor
base, all such managers today struggle to access the market.
Even despite the fact that in several cases these managers’ CLO
performance was ultimately decent, their CLO businesses are
effectively dead having suffered the self‐inflicted wound of
investor neglect. Two of these managers have been working
diligently to repair the damage to their reputations, but
continue to experience very poor reception by the market.
Transparency and a proactive approach to investor relations is
important even if – as many managers will admit – only a
handful of investors actually take advantage of this access.

12 | Market Insights
Question 4: How has the manager performed in terms of par
and spread? Has the manager been lucky or smart?
In times of peace and plenty, when default rates are low and
the loan market is active and healthy, the focus shifts
somewhat to value creation within the CLO of a different sort
than is available during types of stress. Managers can build par,
slowly but steadily, by participating in primary issue loans and
managing cash prudently while taking advantage of loan market
volatility. Managers can also spend time that might otherwise
be invested in a work‐out situation to find value away from the
bread and butter credits in their portfolios.
One of the easier analyses investors can conduct is to measure
the degree to which managers have performed in terms of par
(built or lost) and spread (built or lost).
As the table below shows, these two metrics reveal a
considerable difference among 2.0 managers where the
difference between top and bottom performers is, in most
cases, a function of trading and management strategy.
∆ Par ∆ Spread
Top 5% +1.20 +0.12
Median +0.06 ‐0.22
Bottom 5% ‐1.66 ‐0.70
As of 1Q 2017.
It is insufficient to note that a manager has created or lost par,
or bucked the repricing trend in the loan market; the important
question is how? What combination of circumstances and
strategy led to the performance?
One example is worth highlighting. We recently evaluated a US
manager who has been consistently outperforming other
managers in terms of par creation, across time and across their
2.0 CLOs. As we investigated how this was happening, we
discovered that they were buying almost every new issue loan
and flipping out on the breaks. Because the flips were generally
conducted on the same day as the purchase, the trustee report
recorded only the ‘net’ positions (if any); the initial (larger)
position and subsequent sale (whole or partial) were not
designated as “discretionary,” “credit risk,” or “credit
improved” trades as they are supposed to be. Effectively, the
manager was working outside the indenture’s definitions of
trading, although virtually all of the par creation was a function
of these flip trades.
This example is just another reminder that investors should not
become distracted by statistics, even those suggesting positive
performance. The age‐old question, ‘is the manager lucky or
smart,’ is as relevant today as ever.
Question 5: Is the manager appropriately resourced: analyst
team, operations, business management, technology?
It has been said that managing a CLO is not for the faint of heart.
With dozens of different investment limits and criteria, tests,
triggers and reporting metrics – all of which have to be reported
accurately each month, coupled with a diversified portfolio of
loans with their own operational burdens… it’s frankly
surprising that anyone willingly volunteers for the job of CLO
manager, let alone succeeds at it. And yet this market includes
managers who have undeniably mastered the art and science
of CLO management.
Yet no one, to our knowledge, has ever done so without having
made very significant and specific investments in their
platform. Furthermore, every CLO manager we have ever asked
admits to mistakes, some serious, as they moved up the CLO
management learning curve. CLOs, in our opinion, are best
managed by highly competent professionals who have a
sophisticated approach to managing CLO structures and the
operations that support them.
Since 2010, nearly fifty credit managers entered the CLO
market by issuing their very first CLO. Fifteen of these new CLO
managers have already issued three or more CLOs. The limited
timeframe in which some newer managers have entered and
established themselves is, we believe, a key consideration for
investors. We find, generally, only a small minority of these new
managers have invested sufficiently in their platforms such that
we can have confidence in their ability to perform as expected.
Even established managers can fall behind or become
complacent. Manager due diligence remains an essential
component to our ability to differentiate risk and relative value.
We find too many CLO investors – typically new to the market
themselves – complacent about manager competency and
sophistication.
Question 6: What is the manager’s edge as a loan investor?
Does that edge translate into real value creation?
It’s almost axiomatic in our market that every CLO manager’s
pitch book has a page showing how they outperformed the
broad loan market, either on a total return basis, or on a default
/ loss basis.
Turns out, beating the broad loan market index as a CLO
manager wasn’t terribly hard to do. In our view, the

| Market Insights 13
combination of investment guidelines, collateral limits and
diversification requirements probably did as much to
contribute to index outperformance as anything they did.
Creating value within the CLO structure consists of far more
than beating the loan index. The best performers through the
past cycle developed strategies suited for CLO structures and
used the structures as an offensive weapon. The weakest
performers almost always describe the CLO structure as the
‘thing that got in their way.’
While nearly all managers can boast of good CLO performance
(e.g. strong equity returns, healthy structures), the difference
between the top and bottom performers reveals substantial
differences in strategy, sophistication and competence.
There is no simple way to evaluate a manager’s edge. There is
no metric, statistic, or graph that reliably differentiates smart
from lucky. The analysis is more complicated, and requires
significant effort and experience to distill. However, in our
opinion, there are a handful of CLO managers who consistently
operate at a higher level than their peers.
Question 7: Is the manager financially stable, well capitalized
and profitable?
Most CLO managers are relatively small companies consisting
of founding partners – who often also act as portfolio managers
– and a small team of analysts, operations and other support
staff. They are typically thinly capitalized, and they rely heavily
on outsourced resources for accounting, legal and human
resources.
The typical CLO generates somewhere between $1.5 and $2.0
million of management fee revenues, split into senior (highly
certain) fees of approximately $500,000 and subordinated (less
certain) fees of approximately $1.0 million or more. Overhead
for a typical CLO business runs between $2.5 and $4.0 million
annually, excluding bonuses and distributions to the partners.
One reason CLOs are a popular fund vehicle for such smaller
companies is that they provide a source of long‐term capital
and a stable basis of revenues. Managers generally find that
senior fees alone on four to five CLOs are sufficient to cover all
SG&A expenses. Subordinated fees can then be used to support
business growth, bonuses and partner distributions.
Performance fees in CLOs can be very substantial but are
typically very back‐ended and highly uncertain.
That said, not all CLO fee structures are typical, and not all
managers have typical costs. We have seen several platforms
where breakeven revenues were substantially higher, where far
greater reliance on subordinated fees put pressure on the
manager to print as many CLOs as possible, quickly, whether or
not it was ‘sensible’ to do in every case.
Smaller managers (with loan AUM <$2.5 billion) also face what
the market sometimes refers to as the “S&P Tax.” Because of
the inherent business risks of such a manager, S&P’s CLO rating
criteria require that a back‐up manager be in place for the life
of the CLO. The back‐up manager, a larger, established CLO
manager (and typically also participating as a triple‐A investor
in the CLO), charges a back‐up manager fee of approximately
10bps. This back‐up management fee is essentially paid by the
CLO manager, reducing senior management fee revenues to
perhaps only 5bps to 10bps (hence the notion of a small
manager ‘tax’). The financial implications of this tax are obvious
– shifting overhead breakevens out to six CLOs or more, and
creating an even stronger economic incentive to get to $2.5
billion AUM as fast as possible.
Other sources of manager financial risk exist among much
larger managers. A CLO analyst should carefully evaluate the
overall nature of a manager’s business and fee revenues. For
example, larger managers whose business revenues are
sensitive to capital outflows, fund NAVs or carried interest tend
to see CLOs as a ‘cash cow’ business (e.g. a stable source of
revenue). They may not be as seriously committed to their CLO
business or performance. Many ‘hedge fund’ managers who
issued CLOs during the previous cycle underperformed the
market as attention and resources during the financial crisis
were pulled away from the management of CLOs and into
challenges and opportunities perceived in other parts of the
business.
The bottom line is that the financial incentives present in every
CLO manager are a significant source of risk that must be
carefully evaluated. CLOs have been called ‘shadow banks,’ not
only because they perform the basic functions of a commercial
or merchant bank, but because they face similar business and
financial risks. The CLO analyst must always ask: is this a healthy
bank? How likely is it that the functions of this bank will
continue to run smoothly in times of stress?
Factors Related to CLO Supply
While the creation of new CLOs in today’s market is
fundamentally a matter of economics, there are several other
factors that have contributed to the robust pace and variety of
CLOs issued recently.

14 | Market Insights
Warehouses: The growth in primary issue supply has been
fostered by not only a large cohort of investors, but also the re‐
emergence of capital for loan warehouses. By most estimates,
more than 90% of primary CLOs in the US and Europe benefit
from warehouse capital to begin ramping the initial portfolio
well before the CLO is officially launched.
The availability of warehousing today has alleviated at least
some of the spikes in demand for loans that created challenging
loan market technicals in recent years. Managers are able to
build portfolios at a more measured pace, including greater
initial participation in primary issue loans. However, the
availability of warehouses (currently estimated to represent
$10 billion of loan AUM) has kept the so‐called CLO bid for loans
steady and increasing, more than offsetting the volume of
mutual fund and retail outflows that made headlines during
2014.
A notable difference between warehouses today and those
from pre‐2008 is the fact that banks – with rare exception – are
not providing the ‘equity’ capital in warehouse facilities as they
once did. Rather, today’s warehouses are capitalized by either
managers, third‐party investors or some combination of the
two. While today’s warehouses are structured as mark‐to‐
market facilities, they generally also feature an initial ‘MTM
holiday’ and a one‐ to two‐year (occasionally longer)
amortization period should a CLO not be issued.
Warehouse leverage, typically set at 4:1, is also meaningfully
lower than pre‐cycle. This is both positive and negative.
Warehouses today should be more robust to loan market
dislocations, with far greater MTM cushion before the capital
calls or forced liquidations are triggered. However, they also
tend to be smaller compared to pre‐cycle warehouses. Today’s
warehouses are typically around 50% of the target CLO size
(approximately $250mm), providing a valuable head‐start on
ramping the target portfolio.
Naturally the very existence of $10+ billion in leveraged
warehouse facilities with MTM triggers suggests the potential
for a domino‐like liquidity event should the loan market
experience the kind of dislocation we saw in 2008 and 2009. In
our view, while the nature of the risk is similar, the magnitude
and financial market repercussions strike us as very different
given the participation of third‐party capital, significantly lower
leverage, and longer terms. These market structure differences
suggest a fundamentally different tipping point and workout
process.
Arrangers: The growth and pace of issuance has certainly been
a boon to CLO bankers. Each year we expect to see more than
200 primary CLOs issued by nineteen different banks /
arrangers, including several banking teams who entered the
market for the first time in 2014. While more than half
(according to league tables) of the primary market is still
dominated by five banks, the competitive landscape among
arrangers has certainly evolved in recent years. The smaller, or
less active, arrangers have tended to focus their business
(perhaps necessarily) on managers who are either new or may
otherwise struggle accessing the market. Typically unable to
provide warehousing, or even access to a loan trading desk,
these arrangers tend to emphasize lower banking fees and/or a
special relationship with a key investor (e.g. captive AAA).
CLO Management Fees: Management fee structures consisting
of a senior fee, subordinated fee and performance fee, are
virtually unchanged from pre‐cycle. What has changed is that
not every manager can command 50bps total fees on assets in
today’s market. In fact, most managers have been compelled to
reduce their fees either by prospectus or more commonly via
private side‐letter rebates to equity investors. As discussed
above, this is largely due to pressures on CLO arbitrage
especially among managers whose debt will be sold at wider
spreads.
It’s not clear to us that there is a general trend toward lower
CLO management fees overall, or that the market will settle into
a ‘new norm’ lower than 50bps. Rather, it appears to be a
circumstantial, and therefore temporary, accommodation that
most managers are willing to make to access the market when
arbitrage conditions are challenging.
Our expectation is that as the quality of arbitrage improves,
equity investors may have to split the upside with both
managers and arrangers who today tend to discount their fees
for the sake of doing business. We expect these parties will be
relatively aggressive in reclaiming some of their sacrifices.
Consequently, when we invest in CLO equity we have always
taken the approach of pre‐negotiating fees with both parties
well in advance, thus preserving any upside from improved
arbitrage for our investors.
Trustees: A notable, but generally ignored, change in the
market today has been the significant shift in market share
among CLO trustees.

| Market Insights 15
Trustee Name Total 1.0 CLOs 2.0 CLOs
BNY 35% 54% 21%
US Bank 29% 13% 41%
DB 10% 12% 8%
Citi 9% 3% 15%
State Street 6% 7% 6%
WF 5% 2% 8%
As of 1Q 2017.
Among investors, this shift has been a somewhat welcome
development. Anecdotally, prior to the cycle the perception
was that there wasn’t a greener pasture to be found among all
of the choices available to CLO managers. Frustration with the
accuracy, timeliness and content of trustee reports was a
common lament among both managers and investors alike. It is
far less common to hear complaints about trustee services in
our manager meetings today.
That is not to suggest that there aren’t problems, including
serious mistakes that occasionally arise. For example, we
recently identified a material misallocation of cash flows on the
payment date of a CLO managed by a very large, well‐respected
US manager. Neither the manager nor the trustee, nor any
other investor in the CLO, had noticed that a few million dollars
had been distributed incorrectly, revealing a significant
weakness in operational oversight by both the manager and
trustee. Correcting this error took two full quarters.
We sense another era of complacency, or false security, among
many investors and managers in their diligence and oversight
of trustee reporting. We continue to emphasize quality checks
of trustee report data in our surveillance processes.
Amortization and New Issue Dynamics
Strong primary issue volume in recent years has been received
with mixed reactions by market participants and observers.
While presenting strong evidence for both the acceptance and
confidence that investors have in this asset class, it continues
to defy the imagination just how much capital is ‘out there’ to
absorb the volume of primary issue.
Sell‐side CLO research analysts frequently direct attention to a
‘net’ supply statistic. That is, primary issue volumes have been
offset at least somewhat by the amortization of older CLOs.
Given the relatively high pace of prepayment and refinancing
activity in the loan market, 1.0 CLOs have experienced fairly
high prepayment rates themselves.
Figure 5 illustrates how, until mid‐2013, the amortization rate
of 1.0 US CLOs has kept the overall size of the US CLO market
relatively stable. In the past year or so, the volume of new issue
has exceeded the rate of amortization and the overall US CLO
market has grown for the first time since 2007, reaching $350
billion in 2014.
But this map of the overall market hides an interesting shift in
supply within the CLO market that we think is relevant to a
discussion of the market opportunity today and going forward.
Figures 6, 7, and 8 break down supply into constituents that
better reflect investor types. A feature of the CLO market is
that, with rare exception, the cohort of investors who
participate in AAA – AA (‘senior’) tranches are different from
the cohort who invest in A – BBB (‘mezzanine’), or even BB‐
equity (‘subordinate’). Each cohort sees the ‘net’ supply
equation a little differently, and we see supply technicals
affecting market spreads and volatility differently as a result.
CLO Models
At this point it is hopefully clear that choices in risk and value
are significantly more complicated than the decision to invest
in one rating class or another. However, another key element
of risk that must not be ignored is model risk.
It is both a blessing and curse that today investors can license
cash flow models that provide the means to evaluate CLO
tranche values and performance under various scenarios. The
most widely used models are licensed from Intex Solutions.
Intex models are practically ubiquitous in the market today.
Investors, traders and a myriad of service providers (e.g.
valuation agents, accountants, risk management, reporting)
who actively participate in the CLO market all license and use
Intex as their main, or exclusive, cash flow models for CLOs.
The models themselves are far more sophisticated today than
ever before. While this permits a greater range and depth of
analysis, and greater flexibility to create specific scenarios, it
also introduces greater reliance on modeled outputs. As we
have tried to emphasize here, some of the most significant
sources of risk and value lay in factors or features for which
models either tend to fall short, or cannot approach.
The heavy reliance by the market on Intex models establishes a
conventional wisdom about CLO tranche performance and
valuations that has been widely adopted by market
participants. These models have left many investors with the
impression that credit risk within leveraged funds can be
appropriately evaluated using statistical concepts like CDR and
CPR. The fact is, were it not so difficult to conduct bottoms‐up,
line‐item analysis, no one in their right mind would ever

16 | Market Insights
recommend evaluating the risk or value of a given CLO tranche
using statistical formulas.
Investors need to remain wary of models and understand both
their limitations and the many ways they can mislead… to say
nothing of actual errors that regularly appear in both the data
and the code behind these models.
Key Issues in European CLOs
While the key questions around portfolio, structure, and
manager are relevant to the analysis of both US and European
CLOs, we believe that there are several factors unique to
European CLOs that require an extra measure of focus and
consideration.
Investors in European CLOs had a very different experience
than investors in US CLOs through the cycle. Whereas virtually
all US CLOs recovered (and in many cases benefitted) from the
cycle, a large proportion of European CLOs will struggle to cross
the finish line. We still expect very few debt tranche defaults,
but European CLO equity investors will, on average, see very
poor returns and many will see negative returns. Only a few 1.0
European CLOs, concentrated among just a handful of
managers, will show strong equity performance.
While each CLO and manager’s performance will have a specific
story, there are four fundamental differences between
European CLOs and US CLOs that we believe were the primary
factors in the relative underperformance of European CLOs.
1. Smaller, less liquid syndicated loan market
The European credit market is markedly smaller than the
US credit market, especially the leveraged loan market.
Lagging the US market by several years, the rise of
institutional (non‐bank) credit investors was just
beginning to accelerate as the financial crisis struck.
Unlike in the US, where since 1994 banks have had less
than a 25% market share in syndicated loans, the
European loan market was still dominated by banks,
limiting both the spectrum and availability of credit to
non‐bank investors. Consequently, European CLO
portfolios were, on average, more concentrated than
their US counterparts. European CLO diversity scores
were roughly half of the US scores. It was common to find
2% ‐ 3% position sizes in European CLOs (in some cases
much larger). Larger exposures rendered European CLOs
more vulnerable to credit mistakes.
A contributing factor was the relative lack of liquidity in
European loan markets. While this proved to be a
significant hindrance especially for some of the larger
credit managers in Europe (given larger notional
exposures to given credits), CLO managers generally had a
more challenging time executing either defensive or
offensive strategies in their portfolios.
2. Loan market dominated by LBO credits
The predominance of private‐equity sponsored loans, via
LBO, changed both the actual process of recovery in
Europe as well as the incentives that managers faced
when working through a troubled credit. PE firms had
every reason (and apparently the patience) to delay
addressing capital structure problems which would have
increased their cost of capital and possibly their own
recoveries. Consequently, as LBO credits entered a work‐
out phase, the process was typically long and
cumbersome.
One contributing factor was a conflict of interest that
many managers faced during a restructuring process. As
managers continued to be reliant on PE firms for new
credit opportunities, they had overall business incentives
to ‘play nice.’ As a result, European CLOs did not
participate nearly to the same extent in amendment fees,
higher spreads, and other economic offsets as did US
CLOs, despite a higher default rate.
3. Jurisdictional uncertainties
Prior to the cycle, the great unanswered question for
European CLO investors was: How would the multiple
legal jurisdictions that were represented within every CLO
portfolio affect the recovery process? This risk was clear
and obvious, but there were very few actual data points.
Now we know. As many investors feared, jurisdictional
disputes became a common feature in European credit
work‐outs. Creditors sought to foreclose on their security
in creditor‐friendly countries and jurisdictions; companies
and PE sponsors sought to relocate the court process into
legal jurisdictions that had weak creditor protection laws.
Not only did jurisdictional risks contribute to lower overall
recovery rates, but also led to extended work‐out
processes as creditor groups struggled themselves to
coordinate and work together.
4. Low recovery rates on non‐senior collateral
Perhaps the biggest difference investors saw between
European and US CLOs prior to the cycle was the much

| Market Insights 17
higher exposure to non‐senior collateral in European
CLOs. In the US, first‐lien loans constituted 90% of more
of the collateral (and often 95% or more). Within
European CLOs, it was very typical for managers to
allocate 15% ‐ 25% of the CLO portfolio to second‐lien,
mezzanine, unsecured bonds and other subordinated
investments. Combined with generally higher
concentrations and the challenges articulated above with
work‐out processes, non‐senior collateral tended to
realize very low average recovery rates with many notable
(widely‐held) second lien and mezzanine loans recovering
close to zero.
These four factors together explain much of the difference in
performance between US and European CLOs. Notably, these
same fundamental factors are still present in European CLOs
today, although it is now more common to see 90% or more
first lien collateral in primary issue European CLOs.
Despite these factors remaining largely unchanged, there
seems to be strong investor demand for new issue European
CLOs, even for those managers who underperformed during
the cycle. That is, in contrast to US managers where tiering and
access are highly correlated to 1.0 performance, European
managers do not seem to be experiencing the same treatment.
One contributing factor to the strong demand for European
CLOs is the sunrise of new regulations aimed at governing
securitization in Europe. The most burdensome of these
regulations, called specifically Regulation 122a, or AIFMD
Articles 51 and 53, requires the sponsor of a securitization to
retain 5% of the ‘risk’ in the securitization. This has been further
specified to mean a vertical slice of the CLO capital structure
(AAA through equity), or an equivalent amount of the equity
tranche (approximately 35% of the equity notional). In value
terms, given the typical size of a 2.0 European CLO, this requires
an investment of approximately €15 million every time a CLO is
issued. This capital burden is to be borne by the CLO manager.
Consequently, few managers are both willing and able to
capitalize CLOs to this extent, let alone multiple CLOs each year.
On the demand side, these same regulations require (of most
institutions) that investors only participate in 122a, or AIFMD,
compliant CLOs. They are either strictly prohibited from
investing in non‐compliant CLOs, or face prohibitively high
capital charges.
The combination of capital‐constrained supply and a captive
audience of investors who cannot buy US 2.0 CLOs has not only
led to significant CLO tranche spread tightening in Europe (vs
the US) but apparently also market access to any European CLO
manager who shows up with a compliant CLO.
In our view, given the challenges specific to CLO investing in
Europe, the lack of differentiation among managers or loan
portfolio credit risks, and relatively tight spreads (and lower
yields on equity), investors need to be very deliberate and
disciplined in their investment decisions. While the market may
not be willing to differentiate much between a top tier manager
and others, we believe the rewards of prudence will be earned
as investors construct higher quality portfolios in advance of
the next cycle – much more so than strategy that relies simply
on diversification as a primary tool of risk management.

18 | Market Insights
Figure 1. Sample CLO Economics (Annualized)
Assets Par Amount Avg Loan Coupon Interest Income
CLO Loan Portfolio 500,000,000 5.00% 25,000,000
Expenses Expense
Deal Expenses (0.08%) (400,000)
Senior Loan Manager Fees (0.15%) (750,000)
CLO Debt Securities Interest Expense (2.43%) (11,180,000)
Contingent Loan Manager Fees (0.35%) (1,750,000)
Total Expenses (~2.83%) (13,820,000)
Net Income (Interest Income Minus Total Expenses) 11,180,000
CLO Equity Face Amount 50,000,000
CLO Equity Cash Yield (Net Income / CLO Equity Face) 22.4%
Note: There can be no assurance potential returns will be achieved. As with any investment there is risk, including the loss of principal. Based on Ares’ market observations and analysis. 1. The sample CLO economics shown are for illustrative purposes only and based on a CLO structure Ares believes is typical of recent primary CLOs.
2. The CLO Equity cash yield on par is the estimated cash yield on the entire notional of the CLO Equity Security. CLO Equity Securities receive net income distributions provided the CLO remains in compliance with certain tests, including minimum overcollateralization ratios.
Figure 2: Illustration of Typical CLO Structure
Figure 3: Timeline of Major Periods in a CLO’s Life Cycle
Diversified Portfolio of Senior Secured
Loans
Assets Liabilities
AAA‐rated notes: 63%
Principal + Interest
AA‐rated notes: 11%
BBB‐rated notes: 5%
BB‐rated notes: 5%
CLO Equity: 10%
A‐rated notes: 6%
Last Loss
5th Loss
3rd Loss
2nd Loss
1st Loss
4th Loss
CLO Investors
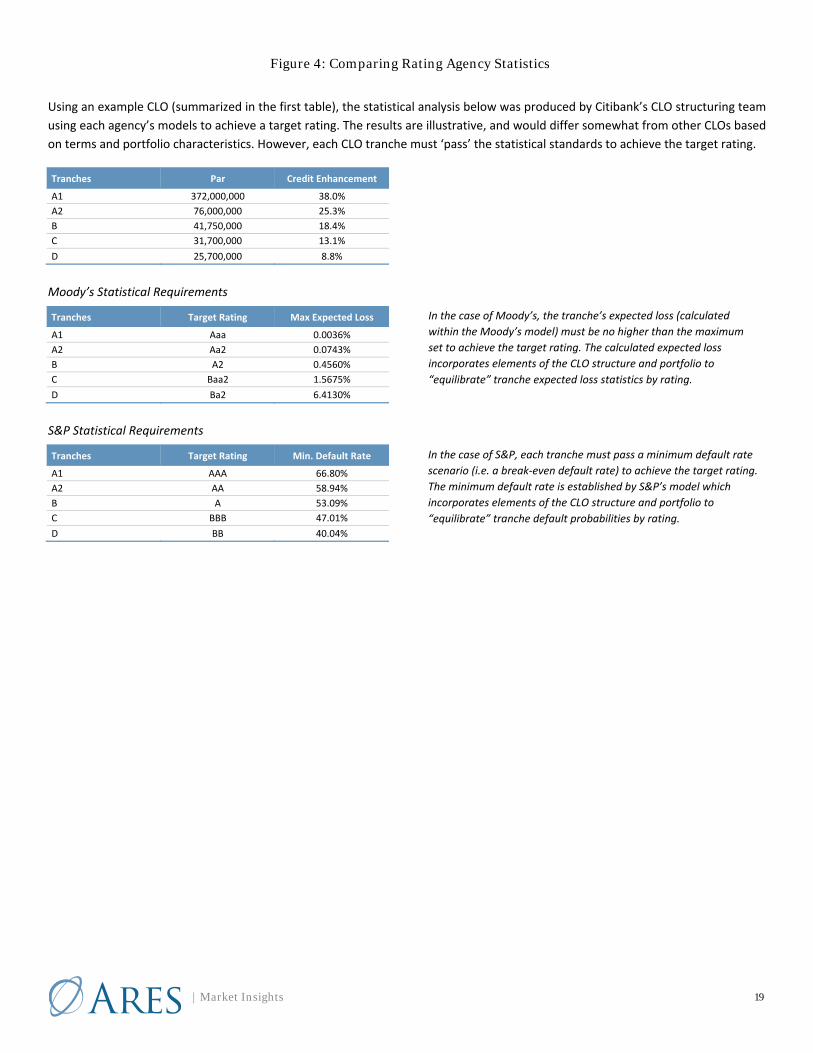
| Market Insights 19
Figure 4: Comparing Rating Agency Statistics
Using an example CLO (summarized in the first table), the statistical analysis below was produced by Citibank’s CLO structuring team
using each agency’s models to achieve a target rating. The results are illustrative, and would differ somewhat from other CLOs based
on terms and portfolio characteristics. However, each CLO tranche must ‘pass’ the statistical standards to achieve the target rating.
Tranches Par Credit Enhancement
A1 372,000,000 38.0%
A2 76,000,000 25.3%
B 41,750,000 18.4%
C 31,700,000 13.1%
D 25,700,000 8.8%
Moody’s Statistical Requirements
Tranches Target Rating Max Expected Loss
A1 Aaa 0.0036%
A2 Aa2 0.0743%
B A2 0.4560%
C Baa2 1.5675%
D Ba2 6.4130%
S&P Statistical Requirements
Tranches Target Rating Min. Default Rate
A1 AAA 66.80%
A2 AA 58.94%
B A 53.09%
C BBB 47.01%
D BB 40.04%
In the case of Moody’s, the tranche’s expected loss (calculated
within the Moody’s model) must be no higher than the maximum
set to achieve the target rating. The calculated expected loss
incorporates elements of the CLO structure and portfolio to
“equilibrate” tranche expected loss statistics by rating.
In the case of S&P, each tranche must pass a minimum default rate
scenario (i.e. a break‐even default rate) to achieve the target rating.
The minimum default rate is established by S&P’s model which
incorporates elements of the CLO structure and portfolio to
“equilibrate” tranche default probabilities by rating.
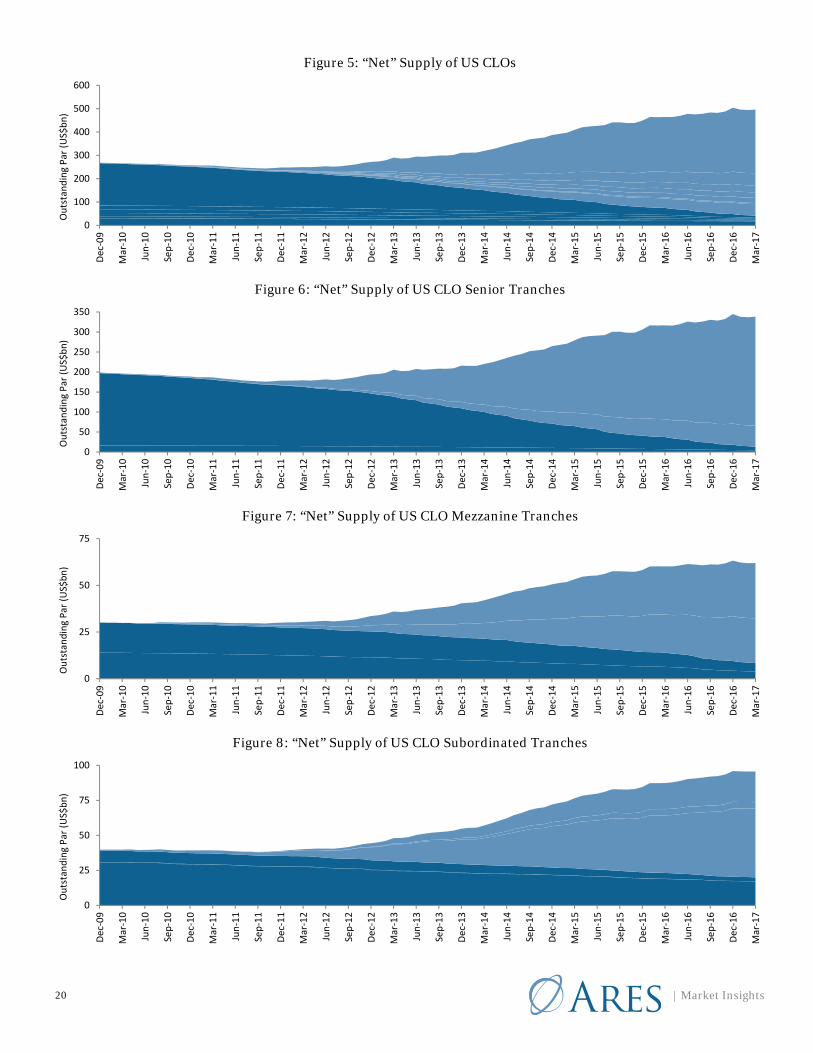
20 | Market Insights
Figure 5: “Net” Supply of US CLOs
Figure 6: “Net” Supply of US CLO Senior Tranches
Figure 7: “Net” Supply of US CLO Mezzanine Tranches
Figure 8: “Net” Supply of US CLO Subordinated Tranches
0
100
200
300
400
500
600
Dec‐09
Mar‐10
Jun‐10
Sep‐10
Dec‐10
Mar‐11
Jun‐11
Sep‐11
Dec‐11
Mar‐12
Jun‐12
Sep‐12
Dec‐12
Mar‐13
Jun‐13
Sep‐13
Dec‐13
Mar‐14
Jun‐14
Sep‐14
Dec‐14
Mar‐15
Jun‐15
Sep‐15
Dec‐15
Mar‐16
Jun‐16
Sep‐16
Dec‐16
Mar‐17
Outstanding Par (US$bn)
0
50
100
150
200
250
300
350
Dec‐09
Mar‐10
Jun‐10
Sep‐10
Dec‐10
Mar‐11
Jun‐11
Sep‐11
Dec‐11
Mar‐12
Jun‐12
Sep‐12
Dec‐12
Mar‐13
Jun‐13
Sep‐13
Dec‐13
Mar‐14
Jun‐14
Sep‐14
Dec‐14
Mar‐15
Jun‐15
Sep‐15
Dec‐15
Mar‐16
Jun‐16
Sep‐16
Dec‐16
Mar‐17
Outstanding Par (US$bn)
0
25
50
75
Dec‐09
Mar‐10
Jun‐10
Sep‐10
Dec‐10
Mar‐11
Jun‐11
Sep‐11
Dec‐11
Mar‐12
Jun‐12
Sep‐12
Dec‐12
Mar‐13
Jun‐13
Sep‐13
Dec‐13
Mar‐14
Jun‐14
Sep‐14
Dec‐14
Mar‐15
Jun‐15
Sep‐15
Dec‐15
Mar‐16
Jun‐16
Sep‐16
Dec‐16
Mar‐17
Outstanding Par (US$bn)
0
25
50
75
100
Dec‐09
Mar‐10
Jun‐10
Sep‐10
Dec‐10
Mar‐11
Jun‐11
Sep‐11
Dec‐11
Mar‐12
Jun‐12
Sep‐12
Dec‐12
Mar‐13
Jun‐13
Sep‐13
Dec‐13
Mar‐14
Jun‐14
Sep‐14
Dec‐14
Mar‐15
Jun‐15
Sep‐15
Dec‐15
Mar‐16
Jun‐16
Sep‐16
Dec‐16
Mar‐17
Outstanding Par (US$bn)

| Market Insights 21
DISCLAIMER
The views expressed in this article are those of the author(s) as of the date of the article. Ares has no obligation to provide updates on the subject
in the future. The views are provided for informational purposes only, are not meant as investment advice, and are subject to change. Ares and its
affiliates cannot guarantee the accuracy or completeness of any statements or data contained in this material.
These materials are not an offer to sell, or the solicitation of an offer to purchase, any security, the offer and/or sale of which can only be made by
definitive offering documentation. Any offer or solicitation with respect to any securities that may be issued by any investment vehicle (each, an
“Ares Fund”) managed by Ares Management LLC or any of its affiliated entities (collectively, “Ares”) will be made only by means of definitive offering
memoranda, which will be provided to prospective investors and will contain material information that is not set forth herein, including risk factors
relating to any such investment. Any such offering memoranda will supersede these materials and any other marketing materials (in whatever form)
provided by Ares to prospective investors. In addition, these materials are not an offer to sell, or the solicitation of an offer to purchase securities of
Ares Management, L.P. (“Ares LP”), the parent of Ares Management LLC. In the United States, Ares Fund securities may be offered through our
affiliate, Ares Investor Services LLC, a broker‐dealer registered with the SEC, and a member of FINRA and SIPC.
The securities/investment process mentioned in this research paper may not be suitable for all investors. This research paper does not provide
tailored investment advice and has been primarily for distribution to institutional investors and market professionals. In making a decision to invest
in any securities of an Ares Fund, prospective investors should rely only on the offering memorandum for such securities and not on these materials,
which contain preliminary information that is subject to change and that is not intended to be complete or to constitute all the information necessary
to adequately evaluate the consequences of investing in such securities. Ares makes no representation or warranty(express or implied) with respect
to the information contained herein (including, without limitation, information obtained from third parties) and expressly disclaims any and all liability
based on or relating to the information contained in, or errors or omissions from, these materials; or based on or relating to the recipient’s use (or
the use by any of its affiliates or representatives) of these materials; or any other written or oral communications transmitted to the recipient or any
of its affiliates or representatives in the course of its evaluation of Ares. Ares undertakes no duty or obligation to update or revise the information
contained in these materials.
The recipient should conduct its own investigations and analyses of Ares and the relevant Ares Fund and the information set forth in these materials.
Nothing in these materials should be construed as a recommendation to invest in any securities that may be issued by Ares LP or an Ares Fund or as
legal, accounting or tax advice. Before making a decision to invest in any Ares Fund, a prospective investor should carefully review information
respecting Ares and such Ares Fund and consult with its own legal, accounting, tax and other advisors in order to independently assess the merits of
such an investment.
These materials are not intended for distribution to, or use by, any person or entity in any jurisdiction or country where such distribution or use
would be contrary to law or regulation.
These materials contain confidential and proprietary information, and their distribution or the divulgence of any of their contents to any person,
other than the person to whom they were originally delivered and such person's advisors, without the prior consent of Ares is prohibited. The
recipient is advised that United States securities laws restrict any person who has material, nonpublic information about a company from purchasing
or selling securities of such company (and options, warrants and rights relating thereto) and from communicating such information to any other
person under circumstances in which it is reasonably foreseeable that such person is likely to purchase or sell such securities. The recipient agrees
not to purchase or sell such securities in violation of any such laws, including of Ares LP or a publicly traded Ares Fund.
In the United Kingdom, this document is intended only for distribution to professional clients and eligible counterparties, as defined by the Financial
Services and Markets Act 2000 (Financial Promotion) Order 2001, and such other persons to whom financial promotions can be issued within the
scope of available exemptions. Investments should only be made by persons with professional experience of participating in unregulated collective
investment schemes and any other person who receives this document should not rely upon it. In other EEA countries, these materials are available
for distribution only to persons regarded as professional clients (or the equivalent) in their home jurisdiction.
Notice to Australian Residents: The financial services are provided by Ares Management LLC or Ares Management Limited; Ares Management LLC
and Ares Management Limited are exempt from the requirement to hold an Australian financial services license under the Corporations Act (Cth)
2001; Ares Management LLC is regulated by the U.S. Securities and Exchange Commission under U.S. laws, which differ to Australian laws; and Ares
Management Limited is regulated by the UK Financial Services Authority under UK laws, which differ to Australian laws.
These materials may contain “forward‐looking” information that is not purely historical in nature, and such information may include, among other
things, projections, forecasts or estimates of cash flows, yields or returns, scenario analyses and proposed or expected portfolio composition. The
success or achievement of various results and objectives is dependent upon a multitude of factors, many of which are beyond the control of Ares.
No representations are made as to the accuracy of such estimates or projections or that such projections will be realized. Actual events or conditions
are unlikely to be consistent with, and may differ materially from, those assumed. Past performance is not indicative of future results. Ares does not
undertake any obligation to publicly update or review any forward‐looking information, whether as a result of new information, future developments
or otherwise, except as required by law.
This may contain information obtained from third parties, including ratings from credit ratings agencies such as Standard & Poor’s. Reproduction and
distribution of third party content in any form is prohibited except with the prior written permission of the related third party. Third party content
providers do not guarantee the accuracy, completeness, timeliness or availability of any information, including ratings, and are not responsible for

22 | Market Insights
any errors or omissions (negligent or otherwise), regardless of the cause, or for the results obtained from the use of such content. THIRD PARTY
CONTENT PROVIDERS GIVE NO EXPRESS OR IMPLIED WARRANTIES, INCLUDING, BUT NOT LIMITED TO, ANY WARRANTIES OF MERCHANTABILITY OR
FITNESS FOR A PARTICULAR PURPOSE OR USE. THIRD PARTY CONTENT PROVIDERS SHALL NOT BE LIABLE FOR ANY DIRECT, INDIRECT, INCIDENTAL,
EXEMPLARY, COMPENSATORY, PUNITIVE, SPECIAL OR CONSEQUENTIAL DAMAGES, COSTS, EXPENSES, LEGAL FEES, OR LOSSES (INCLUDING LOST
INCOME OR PROFITS AND OPPORTUNITY COSTS OR LOSSES CAUSED BY NEGLIGENCE) IN CONNECTION WITH ANY USE OF THEIR CONTENT, INCLUDING
RATINGS. Credit ratings are statements of opinions and are not statements of opinions and are not statements of fact or recommendations to
purchase, hold or sell securities. They do not address the suitability of securities or the suitability of securities for investment purposes, and should
not be relied on as investment advice.