Embed Size (px)
Citation preview
KOREANINSURANCE
INDUSTRY2016
KOREANINSURANCE
INDUSTRY2016
August 2016
Korea Insurance Research Institute
Korean Insurance Industry 2016 3
Foreword
Global economy is still struggling through the low interest and low growth trap that has lasted for
the past years. In 2015, global economy grew only 3.1%, less than 3.4% in 2014. Furthermore,
under the low inflation based on low oil prices, protectionism is glooming over the global trade
increasing uncertainty on the future economic situation. Central banks and fiscal authroties of
leading economies are trying their best to improve the current situation only to achieve modest
outcomes.
Korean economy also slowed down to grow only 2.6% in 2015, showing a steep decline from
3.3% in 2014. The outbreak of MERS in the first half in 2015 adversely affected the private
consumption and dragged the growth down, although the government stimulus helped pick up
the consumption level in the second half. Especially to be worried is the low growth in equipment
and intellectural property product investment that may reveal the low expectation for the future
economy.
In this harsh global and domestic economic environment, the Korean insurance market achieved to
grow 5.5% in 2015 exceeding 4.4% in 2014. In detail, the high growth was made possible as life
insurers increased sales on protection-type insurance products to cope with reverse interest margin
entailed from prolonged low interst situation and insurance rates, suppressed through the subtle
price regulation for a long time, were allowed to increase to reflect the loss ratio amid insurance
deregulation. That is, when insurers move fast and active to adjust to market and regulatory
environment and change, it is possible to grow more than overall economy even if overall
economic situation is not in favor of the growth and profits.
4
Korean Insurance Industry in 2016 is intended to discuss recent developments in the Korean
insurance, the global and domestic economies, as well as financial circumstances that surround the
industry. We hope that this book will be helpful for readers to understand the Korean insurance
industry better.
I would like to express my sincere gratitude to all the members of the Department of Insurance
Market Analysis for their hard work in making this publication.
Kijeong Han
PresidentKorea Insurance Research Institute
KOREANINSURANCE
INDUSTRY2016
CONTENTS
Economic trends
Insurance market environments
Life insurance industry
Non-life insurance industry
Regulation and supervision
Insurance industry issues
Appendix

KOREANINSURANCE
INDUSTRY2016
Economic trends
Global economy
Gross domestic products (GDP)
Employment
Inflation
Balance of current account
Interest rates
Exchange rate
Stock price

Korean Insurance Industry 2016 9
Global economy
The world economic growth rate declined from 3.4% in 2014 to 3.1% in 2015. The decrease
in global GDP growth rate is mainly caused by the low growth rates in emerging countries,
plunging commodity prices, and global trade slowdown. While the advanced countries
showed a moderate recovery trend, GDP growth rate declined in the emerging economies
dragged by the slowdown of Chinese economy.
The GDP growth rate for advanced economies was 1.8% due to the implementation of QE
(Quantitative Easing) policies by the ECB (European Central Bank) and recovery of labor
market conditions. It was 0.1%p lower than 2014 GDP growth rate, 1.9%. The GDP growth
rate of emerging economies was 4.0% in 2015, which fell from 4.5% in 2014, mainly due to
the economic slowdown of China, and worsened economic conditions in the MENA (Middle
East and North Africa) regions from low oil prices.
The GDP growth rate in the U.S. increased by 2.4% in 2015, the same growth rate as in
2014. Moderate GDP growth in the U.S. is primarily attributed to the increase in personal
consumption expenditures, and improved employment situations. In the first quarter of
2015, downturns in exports and private consumption expenditure led to a decline in GDP.
However, from the second quarter of 2015 the US economy showed fairly moderate growth
due to state and local government spending, increase in private inventory investment,
personal consumption expenditures, and favorable labor market conditions.
The GDP growth rate of the Eurozone 1) climbed from 0.9% in 2014 to 1.6% in 2015, due to
the ECB’s monetary policy and an increase in consumer spending. The Eurozone economy
1) The Eurozone is composed of 18 countries: Austria, Belgium, Cyprus, Estonia, Finland, France, Germany, Greece,
Ireland, Italy, Latvia, Luxembourg, Malta, Netherlands, Portugal, Slovak Republic, Slovenia, and Spain.
10
continued to recover due to accommodative monetary policy and low commodity prices.
The GDP growth rate in Japan inched up from 0.0% in 2014 to 0.5% in 2015. The GDP
growth was slowed down by sluggish export growth and contraction of consumption. In the
second half of the year, Japanese economic indicators point to weakening Japanese economy.
The Bank of Japan announced an additional monetary easing plan to boost the economy on
December.
The Chinese economic growth has continued to slowdown since 2010 as the Chinese
government implemented structural reforms of the Chinese economy. The Chinese GDP
growth rate decreased to 6.9% in 2015 from 7.3% in 2014 due to the decline in exports, and
sluggish investment by excessive capacities.
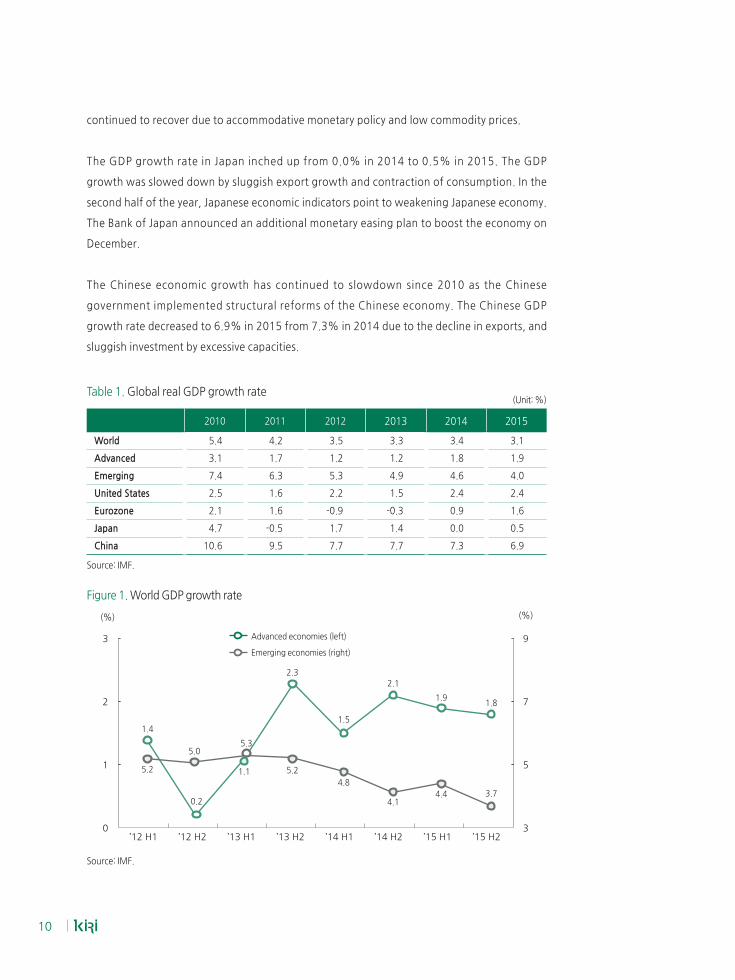
Table 1. Global real GDP growth rate (Unit: %)
2010 2011 2012 2013 2014 2015
World 5.4 4.2 3.5 3.3 3.4 3.1
Advanced 3.1 1.7 1.2 1.2 1.8 1.9
Emerging 7.4 6.3 5.3 4.9 4.6 4.0
United States 2.5 1.6 2.2 1.5 2.4 2.4
Eurozone 2.1 1.6 -0.9 -0.3 0.9 1.6
Japan 4.7 -0.5 1.7 1.4 0.0 0.5
China 10.6 9.5 7.7 7.7 7.3 6.9
Source: IMF.
Figure 1. World GDP growth rate
(%)(%)
Source: IMF.
’12 H1 ’12 H2 ’13 H1 ’13 H2 ’14 H1 ’14 H2 ’15 H1 ’15 H2
3
2
1
0
9
7
5
3
Advanced economies (left)
Emerging economies (right)
1.4
0.2
5.3
1.1
4.4
2.3
5.2
1.5
2.1
4.13.7
1.91.8
5.2
5.0
-
-
-
-
-
-
4.8
Korean Insurance Industry 2016 11
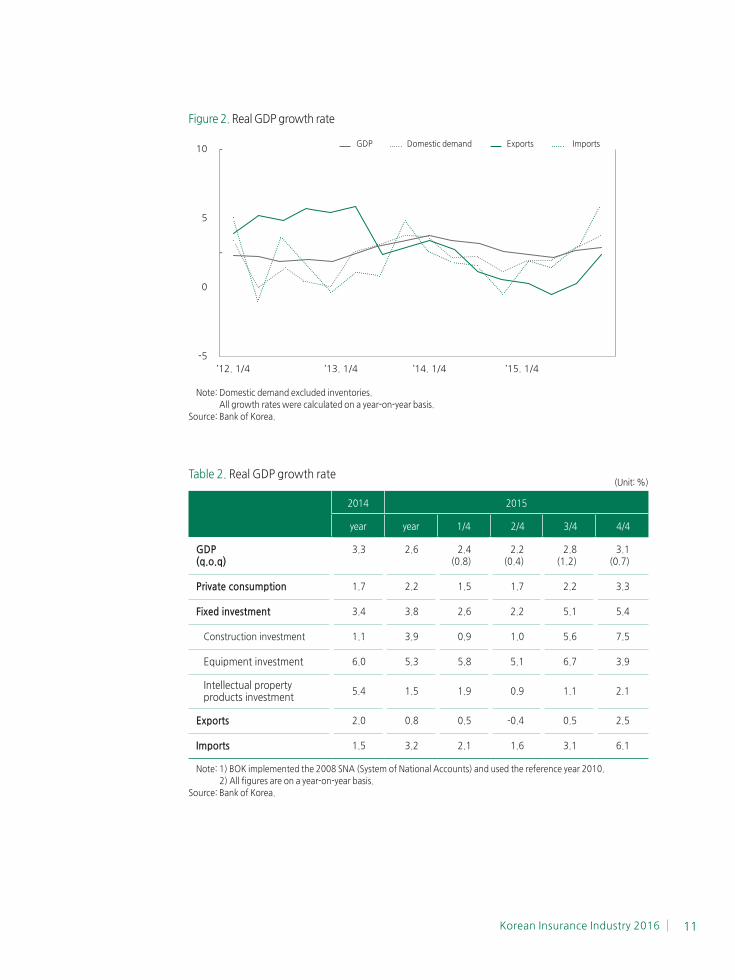
Figure 2. Real GDP growth rate
Note: Domestic demand excluded inventories.
All growth rates were calculated on a year-on-year basis.
Source: Bank of Korea.
Table 2. Real GDP growth rate (Unit: %)
2014 2015
year year 1/4 2/4 3/4 4/4
GDP (q.o.q)
3.3 2.6 2.4(0.8)
2.2(0.4)
2.8(1.2)
3.1(0.7)
Private consumption 1.7 2.2 1.5 1.7 2.2 3.3
Fixed investment 3.4 3.8 2.6 2.2 5.1 5.4
Construction investment 1.1 3.9 0.9 1.0 5.6 7.5
Equipment investment 6.0 5.3 5.8 5.1 6.7 3.9
Intellectual property products investment
5.4 1.5 1.9 0.9 1.1 2.1
Exports 2.0 0.8 0.5 -0.4 0.5 2.5
Imports 1.5 3.2 2.1 1.6 3.1 6.1
Note: 1) BOK implemented the 2008 SNA (System of National Accounts) and used the reference year 2010.
2) All figures are on a year-on-year basis.
Source: Bank of Korea.
GDP Domestic demand Exports Imports
’12. 1/4 ’13. 1/4 ’14. 1/4 ’15. 1/4
10
5
0
-5
-
-
12
Gross domestic products
The GDP 2) growth rate in Korea decreased to 2.6% in 2015 from 3.3% in 2014 due to the
downturn in intellectual property product investment, and a worsening export performance
(see below for the details). However, positive signs of the recovery in domestic demand were
witnessed during the second half of the year, and the growth rate of construction investment
increased.
Quarter by quarter 3), the GDP growth rate in the 1Q of 2015 was 2.4% due to an increase in
equipment investment. However, in the 2Q, the GDP growth rate slowed down to 2.2% due
to a decrease in private consumption by MERS (Middle East Respiratory Syndrome) outbreak.
The GDP growth rate in the 3Q was 2.8% due to the recovery of private consumption after
the MERS outbreak. In the last quarter of 2015 the GDP growth rate continued to increase to
3.1% as private consumption continued to recover from the MERS outbreak.
In 2015, the private consumption grew by 2.2% compared to 2014. In the first half of the
year, private consumption was mainly affected by the MERS outbreak. However, private
consumption recovered in the second half by governments’ consumption-stimulation.
Quarter by quarter, in the 1Q of 2015, the private consumption grew by 1.5% compared to
2014. In the 2Q, it only increased by 1.7% due to the MERS outbreak and entailed
contraction of consumption. In the 3Q of 2015, the private consumption increased by 2.2%
and continued to grow to 3.3% in the last quarter, mainly due to the governments’ economic
stimulation.
2) Chained volume measure of GDP
3) All quarter by quarter figures are on a year-on-year basis.
Korean Insurance Industry 2016 13
The growth rate of fixed investment 4) was 3.8% in 2015, which increased 0.4%p from 3.4%
in 2014 due to the growth of construction investment, offsetting a decrease in equipment
investment.
Construction investment grew by 3.9% in 2015 compared to 2014. Quarter by quarter, the
growth rates of construction investment were less than 1% each in the 1Q and 2Q of 2015.
However, it reached to 5.6% in the 3Q of 2015 due to the increase in the construction of
residential buildings from housing market boom and engineering investment by the
execution of government’s extra budget to boost the economy. In the 4Q of 2014,
construction investment increased to as high as 7.5%.
Equipment investment grew by 5.3% in 2015, driven by both machinery and transportation
equipment. Quarter by quarter, in the 1Q and 2Q of 2015 the equipment investment grew by
5.8% and 5.1%, respectively, due to the increase in transportation investment. In the 3Q, it
grew by 6.7% due to the increase in the machinery investment. However, equipment
investment increased only by 3.9% in the last quarter due to the decrease in transportation
investment.
Intellectual property product investment only grew by 1.5% in 2015. Quarter by quarter, the
intellectual property product investment increased by 1.9% in the 1Q, led by R&D
investment. In the 2Q, it only grew by 0.9% due to the sluggish R&D investment in the
private sector. In the 3Q, it increased by 1.1%. In the last quarter of 2015, it increased by
2.1% due to the increase in software investment.
Exports of goods and services grew by 0.8% and imports of goods and services increased by
3.2% in 2015 compared to 2014. Quarter by quarter, exports of goods and services
increased by 0.5% mainly on semi-conductor products in the 1Q of 2015. However, it
decreased by 0.4% in the 2Q due to sluggish exports of displays. In the 3Q, it only increased
by 0.5%. In the last quarter, the exports of goods and services grew by 2.5% due to the
increase in exports of mobile phones and chemical products. The trends of imports of goods
and services were similar to those of exports in the last quarter of 2015, the growth rate of
the import of goods and services increased by 6.1% due to the large amounts of crude oil
imports.
4) Fixed investment can be composed of construction investment, equipment investment, intellectual property
product investment and etc.
14
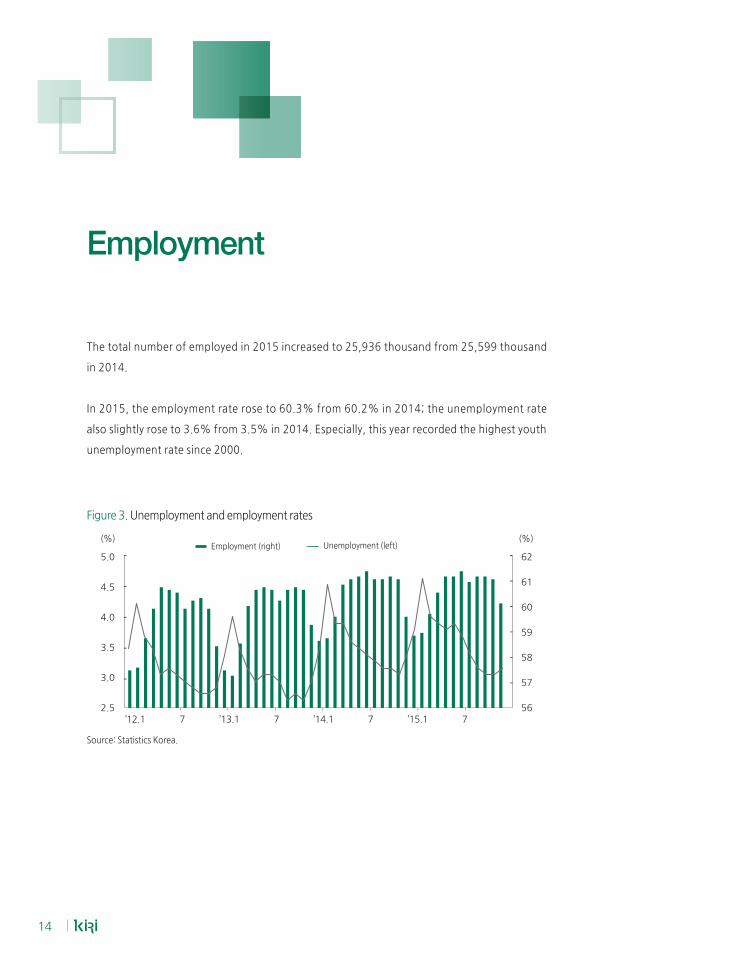
The total number of employed in 2015 increased to 25,936 thousand from 25,599 thousand
in 2014.
In 2015, the employment rate rose to 60.3% from 60.2% in 2014; the unemployment rate
also slightly rose to 3.6% from 3.5% in 2014. Especially, this year recorded the highest youth
unemployment rate since 2000.
Figure 3. Unemployment and employment rates
-
-
-
-
-
-
(%)Unemployment (left)Employment (right)
’12.1 7 ’13.1 7 ’14.1 7 ’15.1 7
5.0
4.5
4.0
3.5
3.0
2.5
62
61
60
59
58
57
56- - - - - - -
(%)
-
-
-
-
-
Source: Statistics Korea.
Employment
Korean Insurance Industry 2016 15
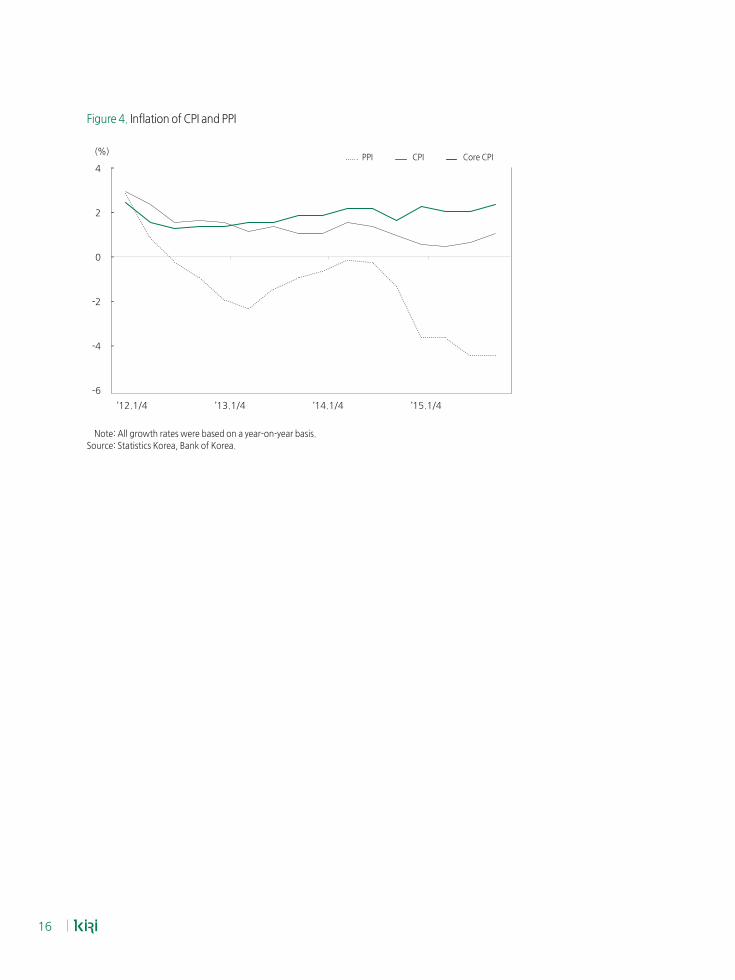
The inflation rate measured by CPI (consumer price index) was 0.7% in 2015, declined from
1.3% in 2014, mainly due to low oil prices and poor consumption demand. The inflation rate
(CPI) in the first quarter of 2015 fell to 0.6% due to cheap oil. In the 2Q, inflation rate (CPI)
dropped to 0.5% due to the reduction in the public utilities charges. However, it rose to
0.7% in the 3Q due to the increase in transportation prices. In the last quarter of 2015, it
rose to 1.1% due to the increase in housing rental fees.
The inflation rate of core CPI 5) was 2.2% in 2015. In the first quarter of 2015, the inflation
rate of core CPI increased from 1.7% to 2.3%. However, it dropped to 2.1% in 2Q and 3Q
and in the last quarter of 2015, it increased again to 2.4%.
In 2015, the inflation rate measured by PPI (producer price index) was -4.0% due to
plummeting international oil prices. The inflation rate (PPI) was -3.6% in the 1Q and 2Q, and
dropped further to -4.4% in the 3Q and 4Q of 2015.
5) CPI without agricultural and petroleum products
Inflation
16
Figure 4. Inflation of CPI and PPI
(%)
’12.1/4 ’13.1/4 ’14.1/4 ’15.1/4
4
2
0
-2
-4
-6
-
-
-
-
-CPI Core CPIPPI
Note: All growth rates were based on a year-on-year basis.
Source: Statistics Korea, Bank of Korea.
Korean Insurance Industry 2016 17
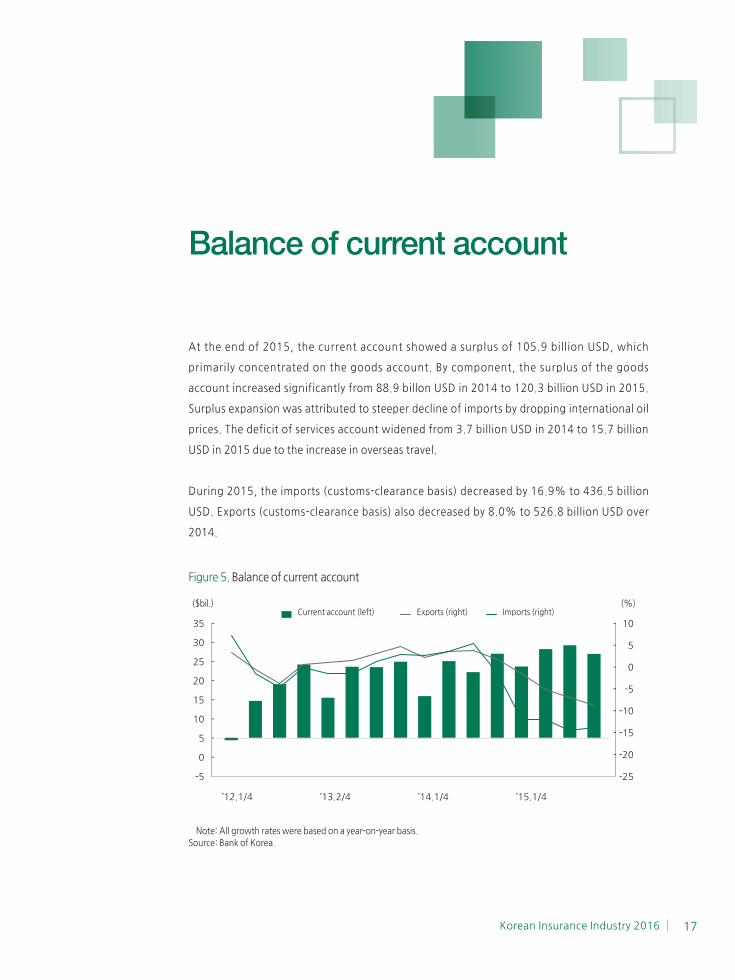
At the end of 2015, the current account showed a surplus of 105.9 billion USD, which
primarily concentrated on the goods account. By component, the surplus of the goods
account increased significantly from 88.9 billon USD in 2014 to 120.3 billion USD in 2015.
Surplus expansion was attributed to steeper decline of imports by dropping international oil
prices. The deficit of services account widened from 3.7 billion USD in 2014 to 15.7 billion
USD in 2015 due to the increase in overseas travel.
During 2015, the imports (customs-clearance basis) decreased by 16.9% to 436.5 billion
USD. Exports (customs-clearance basis) also decreased by 8.0% to 526.8 billion USD over
2014.
Figure 5. Balance of current account
Exports (right) Imports (right)Current account (left)
’12.1/4 ’13.2/4 ’14.1/4 ’15.1/4
35
30
25
20
15
10
5
0
-5
10
5
0
-5
-10
-15
-20
-25
-
-
-
-
-
-
-
-
-
-
-
-
-
-
-
($bil.) (%)
Note: All growth rates were based on a year-on-year basis.
Source: Bank of Korea.
Balance of current account
18
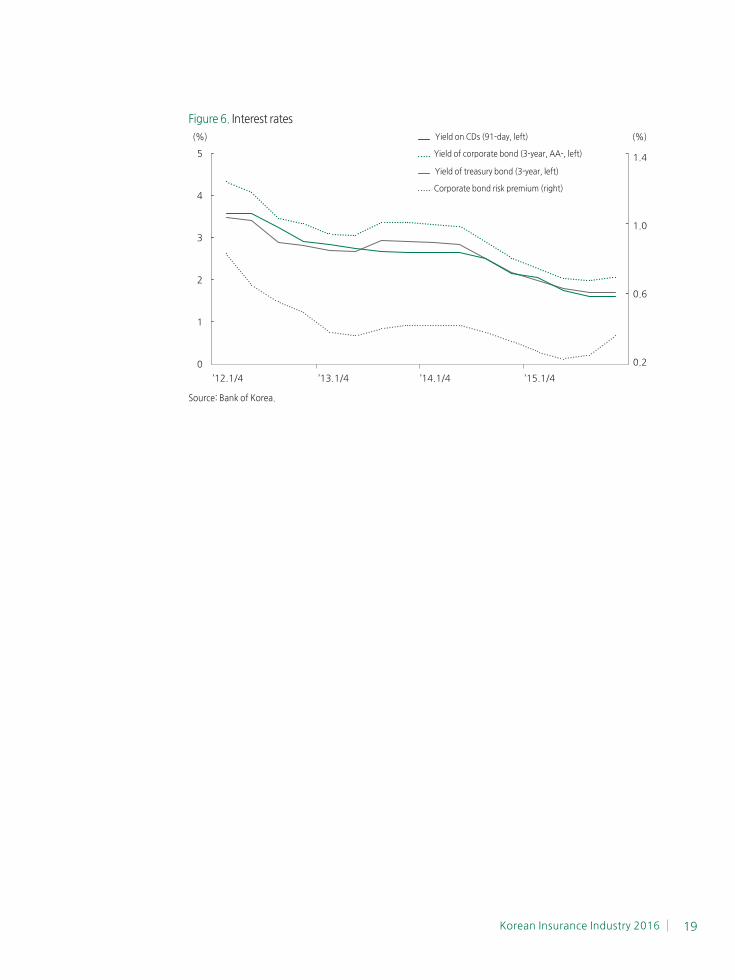
The Bank of Korea (BOK) cut the base rate by 25 basis points to 1.75% in March 2015, and
lowered it again to 1.50% in June 2015. Concerning the slow growth of emerging market
countries including China, and dwindling consumption after the outbreak of MERS (Middle
East Respiratory Syndrome), the Monetary Policy Board of the Bank of Korea decided to lower
the base rate. 6)
The average 3-year treasury bond yield in 2015 was 1.80%, lower by 0.79%p than 2014. It
was largely influenced by the cuts in base rates by the Bank of Korea, preference for safe
assets, and the U.S. Fed’s decision to hold the Federal funds rate.
The secondary market yields on corporate bonds followed similar movements to the treasury
bond yields. The average secondary market yields on corporate bonds was 2.09% in 2015
decreased by 0.90%p from 2.99% in 2014.
The average yields on 91-day CDs was 1.77% in 2015, fell by 72bp from 2014. A downward
trend of yield on 91-day CDs was primarily affected by the cuts in base rate of the Bank of
Korea in March and June in 2015.
Corporate bond risk premium 7) also showed the downward trend. The average corporate
bond risk premium was 0.29% in 2015, decreased by 0.11%p from 0.40% in 2014.
6) As of June 2016, the Bank of Korea held the base rate remained at 1.25%.
7) Corporate bond risk premium was calculated as the difference between secondary market yields on 3-year
AA-corporate bonds and those on 3-year Korea treasury bonds.
Interest rates
Korean Insurance Industry 2016 19
Figure 6. Interest rates
(%) (%)
Source: Bank of Korea.
Yield on CDs (91-day, left)
Yield of treasury bond (3-year, left)
Yield of corporate bond (3-year, AA-, left)
Corporate bond risk premium (right)
’12.1/4 ’13.1/4 ’14.1/4 ’15.1/4
5
4
3
2
1
0
1.4
1.0
0.6
0.2
-
-
-
-
-
-
-
-
20
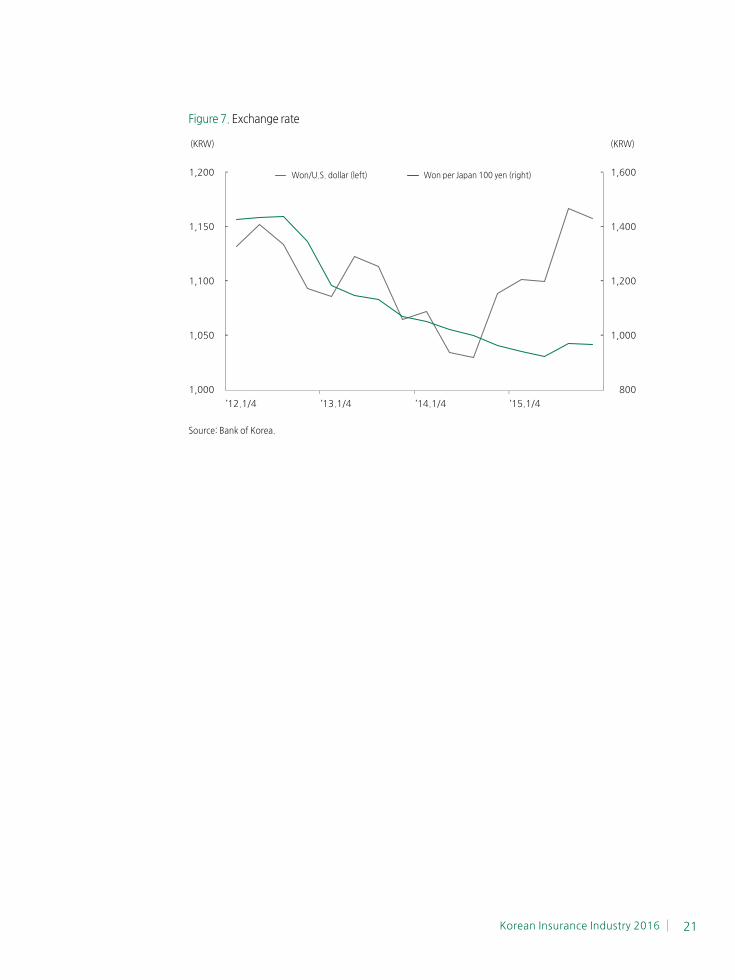
Exchange rates 8)
The average KRW/USD exchange rate in 2015 increased to 1,130.9 KRW from 1,053.0 KRW
in 2014. In the 1Q, the average KRW/USD exchange rate was 1,100.3 KRW, which rose by
1.2% due to a situation where the U.S. Fed is set to raise its interest rate, additional
quantitative easing by the ECB(European Central Bank). In the 2Q, it was 1,097.8 KRW,
which dropped by 0.2% due to the current account surplus, and foreigners’ net buying in the
stock market. In the 3Q, it was 1,167.8 KRW, which sharply increased by 6.4% due to the
expanded volatility of Chinese stock market, preference for safe assets, and country risks by
North Korea. In the 4Q of 2015, it was 1,157.7 KRW, which fell by 0.9% mainly due to the
weak USD caused by an announcement of poor U.S economic indicators.
The average KRW/JPY exchange rate showed a downward trend. In 2015, the average KRW/
JPY exchange rate was 934.2 KRW per 100 JPY, which dropped by 6.3% from 996.7 KRW
per 100 JPY in 2014, due to the quantitative easing by the Bank of Japan. In the first quarter
of 2015, it was 923.4 KRW per 100 JPY, which dropped by 2.8% from the previous quarter.
In the 2Q of 2015, it was 904.7 KRW per 100 JPY, which fell by 2.0% from the previous
quarter. In the 3Q of 2014, the average KRW/JPY exchange rate was 955.8 KRW per 100 JPY,
which sharply rose by 5.6% over the previous quarter. In the last quarter of 2015, the
average KRW/JPY exchange rate fell to 953.1 KRW per 100 JPY.
8) In this section, all growth rates were calculated on a quarter-on-quarter basis.
Korean Insurance Industry 2016 21
Figure 7. Exchange rate
Source: Bank of Korea.
Won/U.S. dollar (left) Won per Japan 100 yen (right)
’12.1/4 ’13.1/4 ’14.1/4 ’15.1/4
1,200
1,150
1,100
1,050
1,000
-
-
-
-
- - -
-
-
-
-
1,600
1,400
1,200
1,000
800
(KRW) (KRW)
22
Stock price 9)
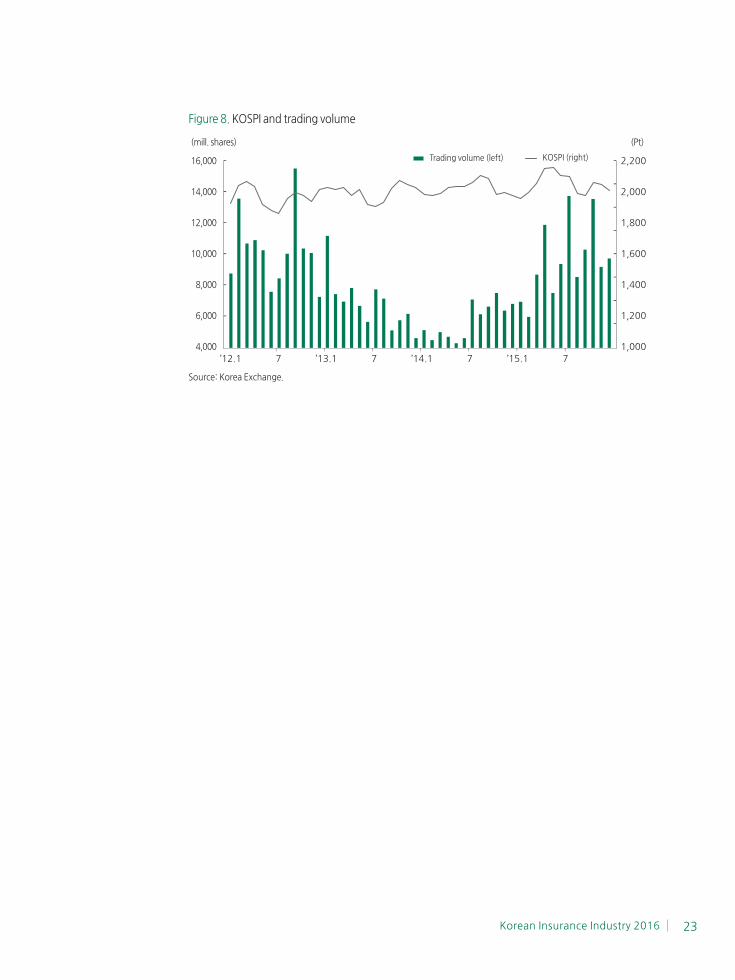
The average Korean Composite Stock Price Index (KOSPI), which is a benchmark stock price
of Korea, was 2,011 in 2015. Compared to 2014, KOSPI rose by 1.4%, mainly due to
government stimulation, and the Quantitative Easing by the ECB. In the first quarter of 2015,
the average KOSPI slightly rose by 0.9% to 1,965 from 1,948 in the previous quarter due to
the increase in global stock prices, announcement on base rate cut by the Bank of China. In
the 2Q of 2015, it jumped up 6.6% to 2,095. This record was primarily attributed to the
improvements in indicators for the euro area, government’s economic stimulus, and
skepticism of early rise in the U.S. interest rates. However, average KOSPI in the 3Q plunged
by 5.3% to 1,983 due to the economic recession in China, and geo-political risks caused by
North Korean nuclear threats. In the 4Q of 2015, it rose by 0.8% to 2,000 due to the net
purchase by foreign and institutional investors.
9) In this section, all growth rates were calculated on a quarter-on-quarter basis.
Korean Insurance Industry 2016 23
Figure 8. KOSPI and trading volume
’12.1 7 ’13.1 7 ’14.1 7 ’15.1 7
16,000
14,000
12,000
10,000
8,000
6,000
4,000
2,200
2,000
1,800
1,600
1,400
1,200
1,000
-
-
-
-
-
-
-
-
-
-
-
-
-
-
- - - - - - -
KOSPI (right)Trading volume (left)
(mill. shares) (Pt)
Source: Korea Exchange.

KOREANINSURANCE
INDUSTRY2016
Insurance market environment
Overview
Premium volumes and total assets
Industry landscape
Positioning of foreign companies
Market concentration
26
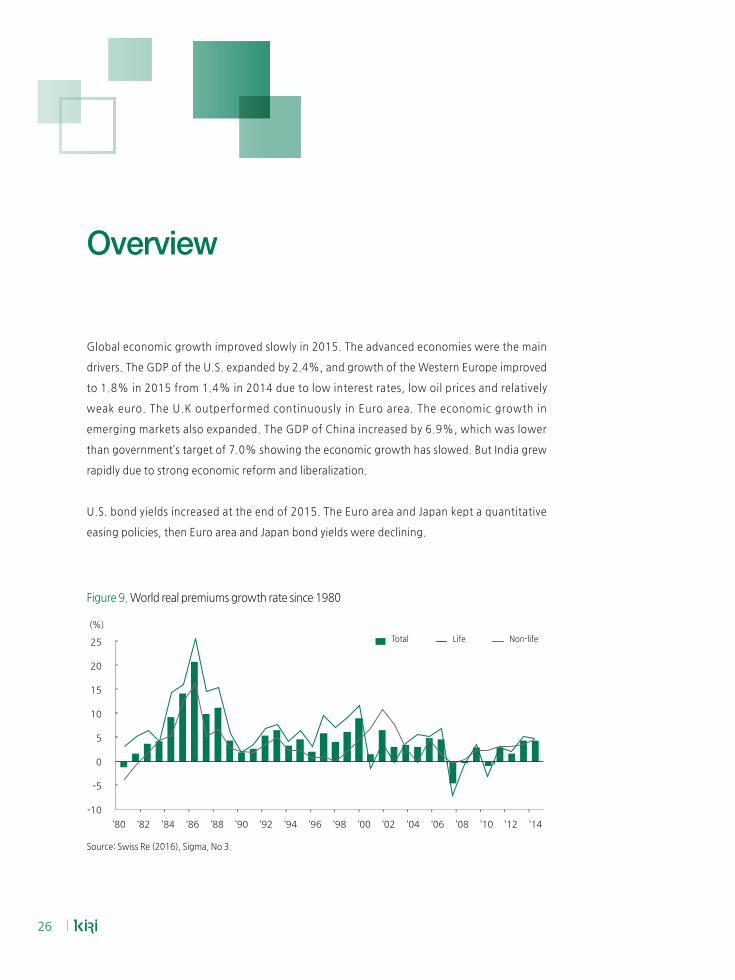
Global economic growth improved slowly in 2015. The advanced economies were the main
drivers. The GDP of the U.S. expanded by 2.4%, and growth of the Western Europe improved
to 1.8% in 2015 from 1.4% in 2014 due to low interest rates, low oil prices and relatively
weak euro. The U.K outperformed continuously in Euro area. The economic growth in
emerging markets also expanded. The GDP of China increased by 6.9%, which was lower
than government’s target of 7.0% showing the economic growth has slowed. But India grew
rapidly due to strong economic reform and liberalization.
U.S. bond yields increased at the end of 2015. The Euro area and Japan kept a quantitative
easing policies, then Euro area and Japan bond yields were declining.
Figure 9. World real premiums growth rate since 1980
Total Non-lifeLife
’80 ’82 ’84 ’86 ’88 ’90 ’92 ’94 ’96 ’98 ’00 ’02 ’04 ’06 ’08 ’10 ’12 ’14
25
20
15
10
5
0
-5
-10
-
-
-
-
-
-
- - - - - - - - - - - - - - - - -
(%)
Source: Swiss Re (2016), Sigma, No 3.
Overview
Korean Insurance Industry 2016 27
The global real premium growth rate increased to 3.8% in 2015 from 3.5% in 2014. There
was substantial growth in total premiums in the advanced markets especially in the life
insurance sector, and premium growth in the emerging markets also grew steadily.
The global life insurance industry gained a momentum in 2015, although the premium
growth rate of the global life insurance decreased to 4.0% in 2015 from 4.3% in 2014. The
premium growth rate of the emerging markets and advanced Asian markets sharply
increased in 2015. China, India, Indonesia, Philippines are the main drivers for the growth in
the emerging markets. While the North American markets and Western Europe markets had
been slowed, North American markets recovered uptrend of growth rate. The life premium
growth remained on a positive track in advanced Asian markets, the growth rate was 14.2%.
Table 3. Real premium growth rate of world(Unit: %)
Life Non-life Total
2014 2015 2014 2015 2014 2015
World 4.3 4.0 2.4 3.6 3.5 3.8
Advanced markets 3.8 2.5 1.1 2.6 2.6 2.5
Emerging markets 6.8 11.7 8.6 7.8 7.6 9.8
North America -1.0 3.8 0.9 3.2 0.1 3.5
Western Europe 5.8 1.3 0.4 1.5 3.4 1.2
Advanced Asian markets 3.3 14.2 3.4 4.1 3.3 4.2
Note: Advanced Asian markets: South Korea, Hong Kong, Singapore, and Taiwan
Source: Swiss Re (2016), Sigma, No 3.
The global non-life premiums increased by 3.6% in 2015. The improvement was driven by
the premium growth of the advanced markets. However, there was regional variation in the
growth of the advanced markets. The premium growth of the emerging markets was robust
7.8% in 2015. China was the main driver, with premiums increasing by 17.0%.
28
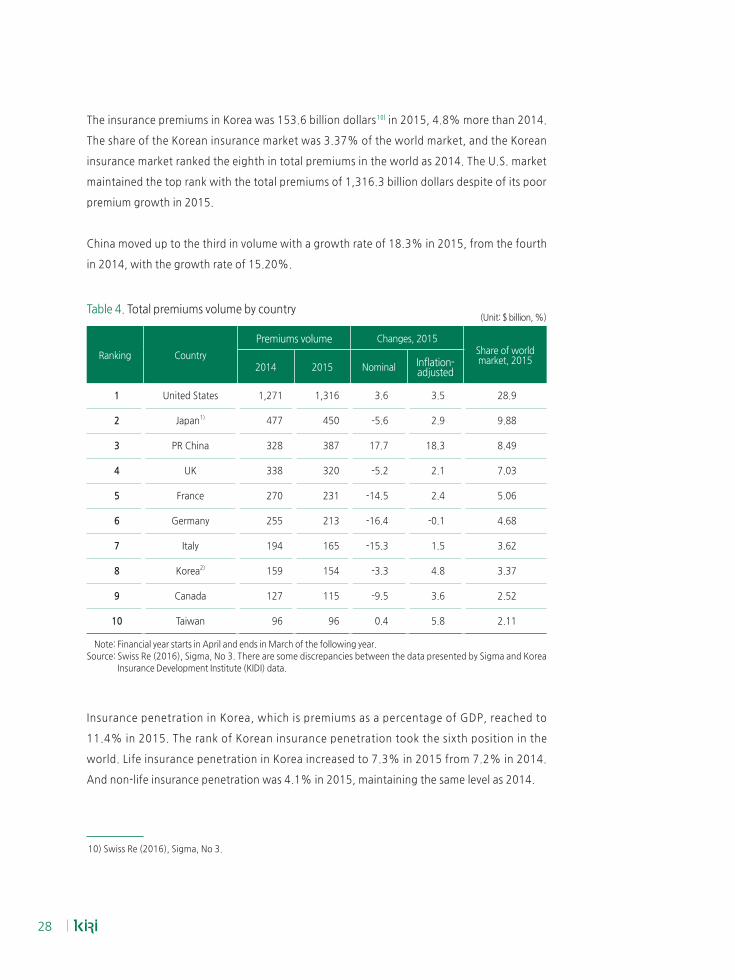
The insurance premiums in Korea was 153.6 billion dollars 10) in 2015, 4.8% more than 2014.
The share of the Korean insurance market was 3.37% of the world market, and the Korean
insurance market ranked the eighth in total premiums in the world as 2014. The U.S. market
maintained the top rank with the total premiums of 1,316.3 billion dollars despite of its poor
premium growth in 2015.
China moved up to the third in volume with a growth rate of 18.3% in 2015, from the fourth
in 2014, with the growth rate of 15.20%.
Table 4. Total premiums volume by country(Unit: $ billion, %)
Ranking Country
Premiums volume Changes, 2015Share of world market, 2015
2014 2015 Nominal Inflation-adjusted
1 United States 1,271 1,316 3.6 3.5 28.9
2 Japan1) 477 450 -5.6 2.9 9.88
3 PR China 328 387 17.7 18.3 8.49
4 UK 338 320 -5.2 2.1 7.03
5 France 270 231 -14.5 2.4 5.06
6 Germany 255 213 -16.4 -0.1 4.68
7 Italy 194 165 -15.3 1.5 3.62
8 Korea2) 159 154 -3.3 4.8 3.37
9 Canada 127 115 -9.5 3.6 2.52
10 Taiwan 96 96 0.4 5.8 2.11
Note: Financial year starts in April and ends in March of the following year.
Source: Swiss Re (2016), Sigma, No 3. There are some discrepancies between the data presented by Sigma and Korea
Insurance Development Institute (KIDI) data.
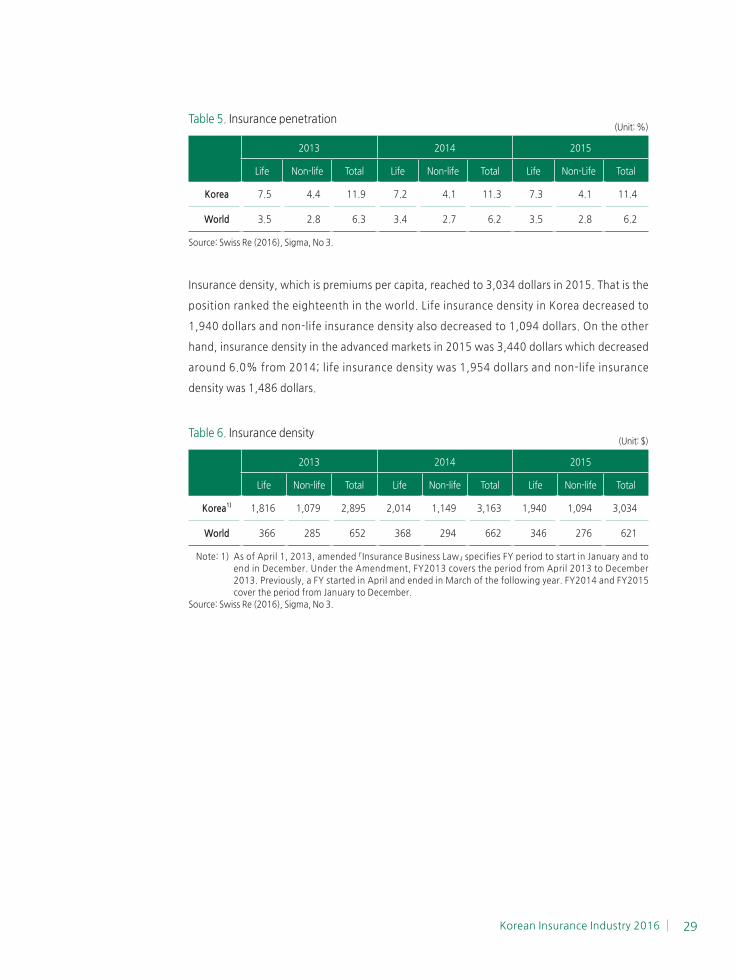
Insurance penetration in Korea, which is premiums as a percentage of GDP, reached to
11.4% in 2015. The rank of Korean insurance penetration took the sixth position in the
world. Life insurance penetration in Korea increased to 7.3% in 2015 from 7.2% in 2014.
And non-life insurance penetration was 4.1% in 2015, maintaining the same level as 2014.
10) Swiss Re (2016), Sigma, No 3.
Korean Insurance Industry 2016 29
Table 5. Insurance penetration(Unit: %)
2013 2014 2015
Life Non-life Total Life Non-life Total Life Non-Life Total
Korea 7.5 4.4 11.9 7.2 4.1 11.3 7.3 4.1 11.4
World 3.5 2.8 6.3 3.4 2.7 6.2 3.5 2.8 6.2
Source: Swiss Re (2016), Sigma, No 3.
Insurance density, which is premiums per capita, reached to 3,034 dollars in 2015. That is the
position ranked the eighteenth in the world. Life insurance density in Korea decreased to
1,940 dollars and non-life insurance density also decreased to 1,094 dollars. On the other
hand, insurance density in the advanced markets in 2015 was 3,440 dollars which decreased
around 6.0% from 2014; life insurance density was 1,954 dollars and non-life insurance
density was 1,486 dollars.
Table 6. Insurance density(Unit: $)
2013 2014 2015
Life Non-life Total Life Non-life Total Life Non-life Total
Korea1) 1,816 1,079 2,895 2,014 1,149 3,163 1,940 1,094 3,034
World 366 285 652 368 294 662 346 276 621
Note:1)AsofApril1,2013,amended『InsuranceBusinessLaw』specifiesFYperiodtostartinJanuaryandto
end in December. Under the Amendment, FY2013 covers the period from April 2013 to December
2013. Previously, a FY started in April and ended in March of the following year. FY2014 and FY2015
cover the period from January to December.
Source: Swiss Re (2016), Sigma, No 3.
30
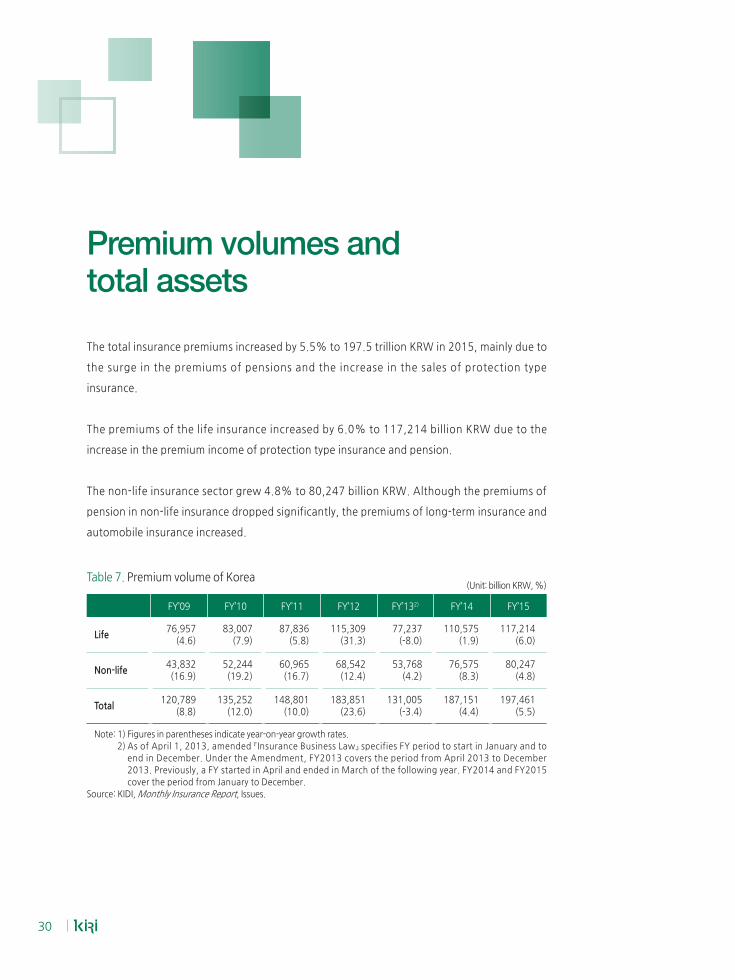
The total insurance premiums increased by 5.5% to 197.5 trillion KRW in 2015, mainly due to
the surge in the premiums of pensions and the increase in the sales of protection type
insurance.
The premiums of the life insurance increased by 6.0% to 117,214 billion KRW due to the
increase in the premium income of protection type insurance and pension.
The non-life insurance sector grew 4.8% to 80,247 billion KRW. Although the premiums of
pension in non-life insurance dropped significantly, the premiums of long-term insurance and
automobile insurance increased.
Table 7. Premium volume of Korea(Unit: billion KRW, %)
FY’09 FY’10 FY’11 FY’12 FY’132) FY’14 FY’15
Life76,957
(4.6)83,007
(7.9)87,836
(5.8)115,309
(31.3)77,237
(-8.0)110,575
(1.9)117,214
(6.0)
Non-life43,832(16.9)
52,244(19.2)
60,965(16.7)
68,542(12.4)
53,768(4.2)
76,575(8.3)
80,247(4.8)
Total120,789
(8.8)135,252
(12.0)148,801
(10.0)183,851
(23.6)131,005
(-3.4)187,151
(4.4)197,461
(5.5)
Note: 1) Figures in parentheses indicate year-on-year growth rates.
2)AsofApril1,2013,amended『InsuranceBusinessLaw』specifiesFYperiodtostartinJanuaryandto
end in December. Under the Amendment, FY2013 covers the period from April 2013 to December
2013. Previously, a FY started in April and ended in March of the following year. FY2014 and FY2015
cover the period from January to December.
Source: KIDI, Monthly Insurance Report, Issues.
Premium volumes and total assets
Korean Insurance Industry 2016 31
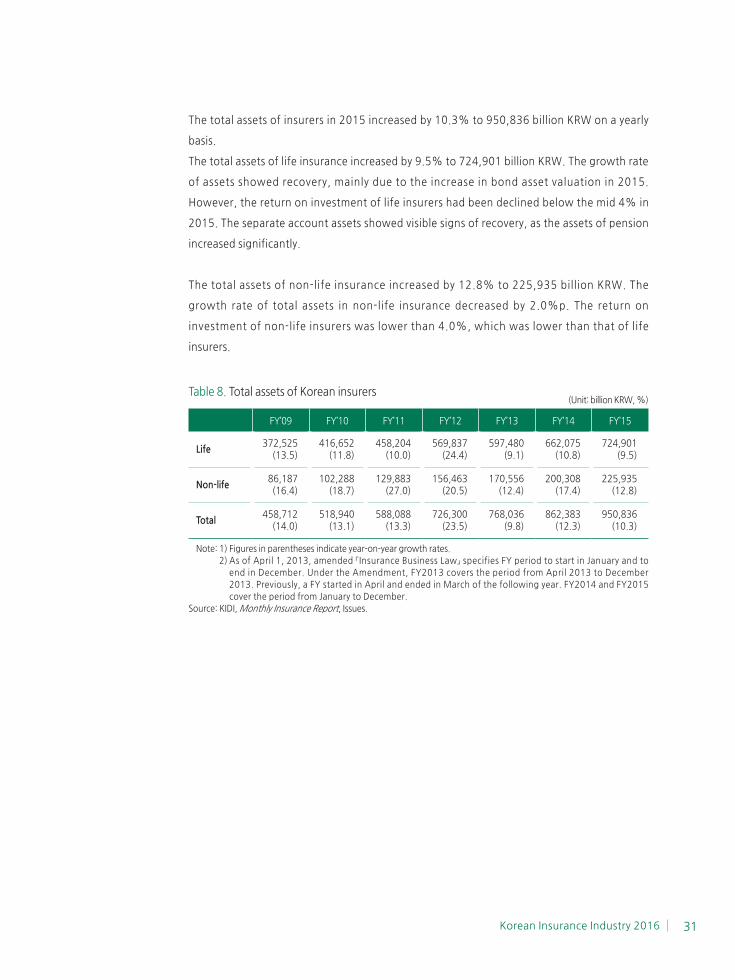
The total assets of insurers in 2015 increased by 10.3% to 950,836 billion KRW on a yearly
basis.
The total assets of life insurance increased by 9.5% to 724,901 billion KRW. The growth rate
of assets showed recovery, mainly due to the increase in bond asset valuation in 2015.
However, the return on investment of life insurers had been declined below the mid 4% in
2015. The separate account assets showed visible signs of recovery, as the assets of pension
increased significantly.
The total assets of non-life insurance increased by 12.8% to 225,935 billion KRW. The
growth rate of total assets in non-life insurance decreased by 2.0%p. The return on
investment of non-life insurers was lower than 4.0%, which was lower than that of life
insurers.
Table 8. Total assets of Korean insurers (Unit: billion KRW, %)
FY’09 FY’10 FY’11 FY’12 FY’13 FY’14 FY’15
Life372,525
(13.5)416,652
(11.8)458,204
(10.0)569,837
(24.4)597,480
(9.1)662,075
(10.8)724,901
(9.5)
Non-life86,187(16.4)
102,288(18.7)
129,883(27.0)
156,463(20.5)
170,556 (12.4)
200,308(17.4)
225,935(12.8)
Total458,712
(14.0)518,940
(13.1)588,088
(13.3)726,300
(23.5)768,036
(9.8)862,383
(12.3)950,836
(10.3)
Note: 1) Figures in parentheses indicate year-on-year growth rates.
2)AsofApril1,2013,amended『InsuranceBusinessLaw』specifiesFYperiodtostartinJanuaryandto
end in December. Under the Amendment, FY2013 covers the period from April 2013 to December
2013. Previously, a FY started in April and ended in March of the following year. FY2014 and FY2015
cover the period from January to December.
Source: KIDI, Monthly Insurance Report, Issues.
32
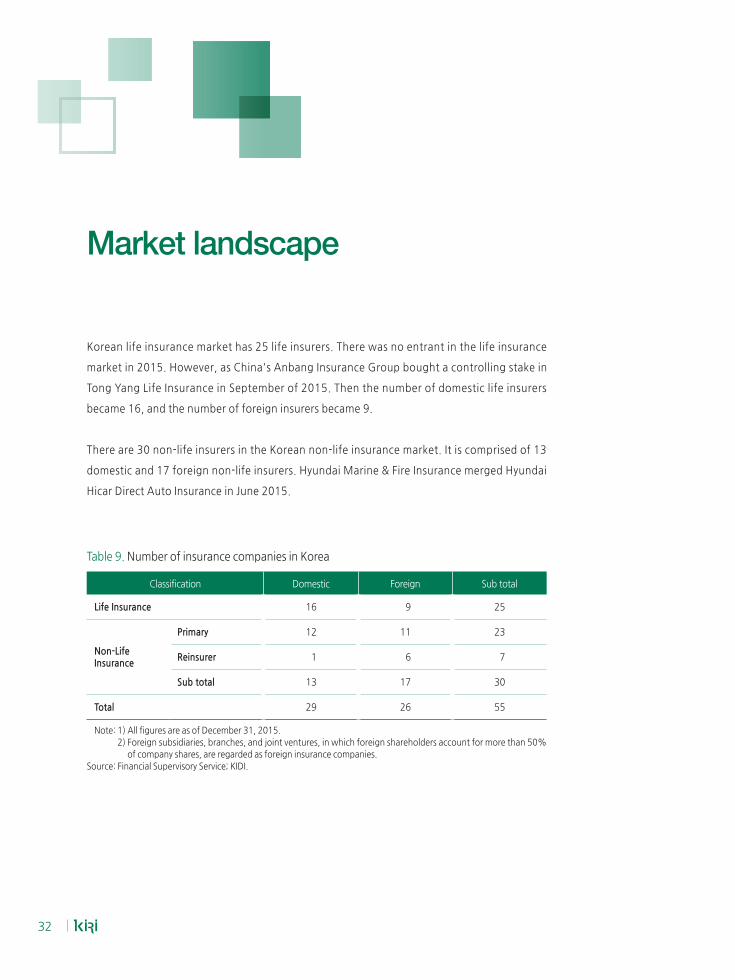
Korean life insurance market has 25 life insurers. There was no entrant in the life insurance
market in 2015. However, as China's Anbang Insurance Group bought a controlling stake in
Tong Yang Life Insurance in September of 2015. Then the number of domestic life insurers
became 16, and the number of foreign insurers became 9.
There are 30 non-life insurers in the Korean non-life insurance market. It is comprised of 13
domestic and 17 foreign non-life insurers. Hyundai Marine & Fire Insurance merged Hyundai
Hicar Direct Auto Insurance in June 2015.
Table 9. Number of insurance companies in Korea
Classification Domestic Foreign Sub total
Life Insurance 16 9 25
Non-LifeInsurance
Primary 12 11 23
Reinsurer 1 6 7
Sub total 13 17 30
Total 29 26 55
Note: 1) All figures are as of December 31, 2015.
2) Foreign subsidiaries, branches, and joint ventures, in which foreign shareholders account for more than 50%
of company shares, are regarded as foreign insurance companies.
Source: Financial Supervisory Service; KIDI.
Market landscape
Korean Insurance Industry 2016 33
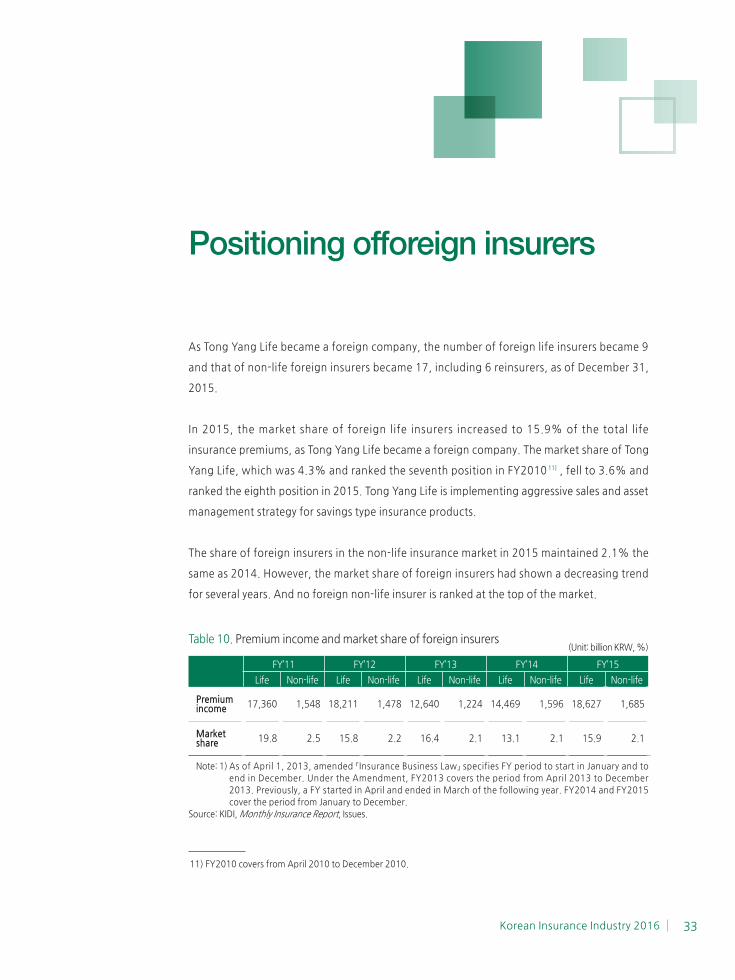
As Tong Yang Life became a foreign company, the number of foreign life insurers became 9
and that of non-life foreign insurers became 17, including 6 reinsurers, as of December 31,
2015.
In 2015, the market share of foreign life insurers increased to 15.9% of the total life
insurance premiums, as Tong Yang Life became a foreign company. The market share of Tong
Yang Life, which was 4.3% and ranked the seventh position in FY2010 11) , fell to 3.6% and
ranked the eighth position in 2015. Tong Yang Life is implementing aggressive sales and asset
management strategy for savings type insurance products.
The share of foreign insurers in the non-life insurance market in 2015 maintained 2.1% the
same as 2014. However, the market share of foreign insurers had shown a decreasing trend
for several years. And no foreign non-life insurer is ranked at the top of the market.
Table 10. Premium income and market share of foreign insurers (Unit: billion KRW, %)
FY’11 FY’12 FY’13 FY’14 FY’15
Life Non-life Life Non-life Life Non-life Life Non-life Life Non-life
Premium income 17,360 1,548 18,211 1,478 12,640 1,224 14,469 1,596 18,627 1,685
Market share 19.8 2.5 15.8 2.2 16.4 2.1 13.1 2.1 15.9 2.1
Note:1)AsofApril1,2013,amended『InsuranceBusinessLaw』specifiesFYperiodtostartinJanuaryandto
end in December. Under the Amendment, FY2013 covers the period from April 2013 to December
2013. Previously, a FY started in April and ended in March of the following year. FY2014 and FY2015
cover the period from January to December.
Source: KIDI, Monthly Insurance Report, Issues.
11) FY2010 covers from April 2010 to December 2010.
Positioning offoreign insurers
34
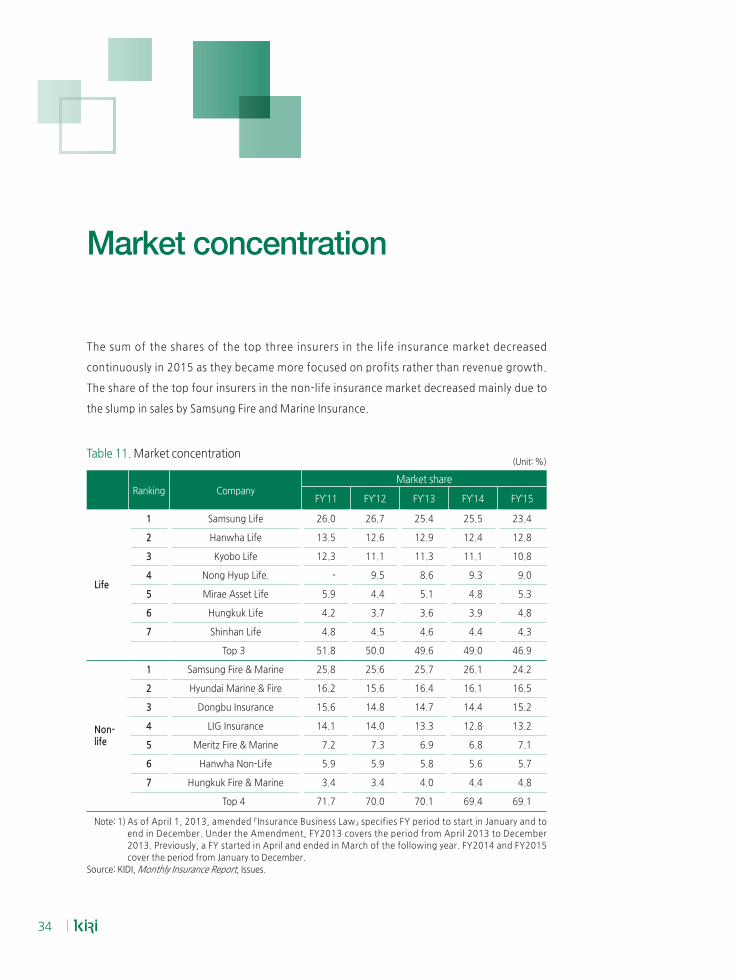
The sum of the shares of the top three insurers in the life insurance market decreased
continuously in 2015 as they became more focused on profits rather than revenue growth.
The share of the top four insurers in the non-life insurance market decreased mainly due to
the slump in sales by Samsung Fire and Marine Insurance.
Table 11. Market concentration (Unit: %)
Ranking CompanyMarket share
FY’11 FY’12 FY’13 FY’14 FY’15
Life
1 Samsung Life 26.0 26.7 25.4 25.5 23.4
2 Hanwha Life 13.5 12.6 12.9 12.4 12.8
3 Kyobo Life 12.3 11.1 11.3 11.1 10.8
4 Nong Hyup Life. - 9.5 8.6 9.3 9.0
5 Mirae Asset Life 5.9 4.4 5.1 4.8 5.3
6 Hungkuk Life 4.2 3.7 3.6 3.9 4.8
7 Shinhan Life 4.8 4.5 4.6 4.4 4.3
Top 3 51.8 50.0 49.6 49.0 46.9
Non-life
1 Samsung Fire & Marine 25.8 25.6 25.7 26.1 24.2
2 Hyundai Marine & Fire 16.2 15.6 16.4 16.1 16.5
3 Dongbu Insurance 15.6 14.8 14.7 14.4 15.2
4 LIG Insurance 14.1 14.0 13.3 12.8 13.2
5 Meritz Fire & Marine 7.2 7.3 6.9 6.8 7.1
6 Hanwha Non-Life 5.9 5.9 5.8 5.6 5.7
7 Hungkuk Fire & Marine 3.4 3.4 4.0 4.4 4.8
Top 4 71.7 70.0 70.1 69.4 69.1
Note:1)AsofApril1,2013,amended『InsuranceBusinessLaw』specifiesFYperiodtostartinJanuaryandto
end in December. Under the Amendment, FY2013 covers the period from April 2013 to December
2013. Previously, a FY started in April and ended in March of the following year. FY2014 and FY2015
cover the period from January to December.
Source: KIDI, Monthly Insurance Report, Issues.
Market concentration
KOREANINSURANCE
INDUSTRY2016
Life insurance industry
Statement of financial position
Income statement
Investment rate of return
Premium income
Expenditures
Management efficiency
Distribution
36
Statement of financial position 12)
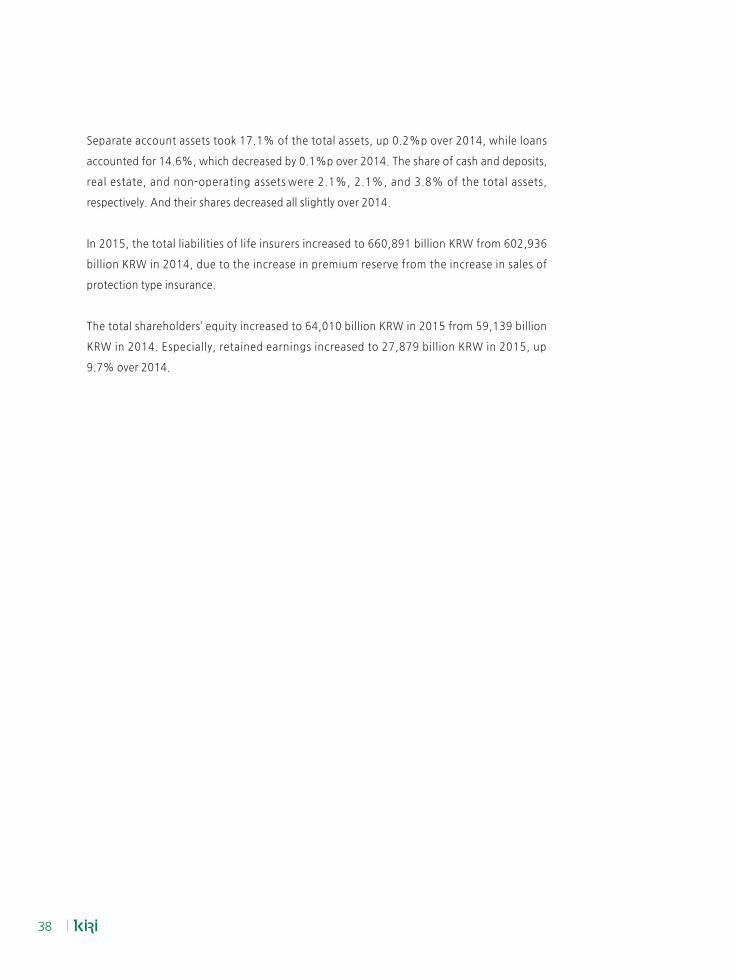
The total assets of life insurers in 2015 recorded 724,901 billion KRW, up by 9.5% over 2014.
General account assets 13) in 2015 increased by 10.8% over 2014, mainly due to the increase
in premium income and the decrease of claims paid. Separate account assets in 2015 also
increased by 10.8% over 2014, as premium income of pension plans increased.
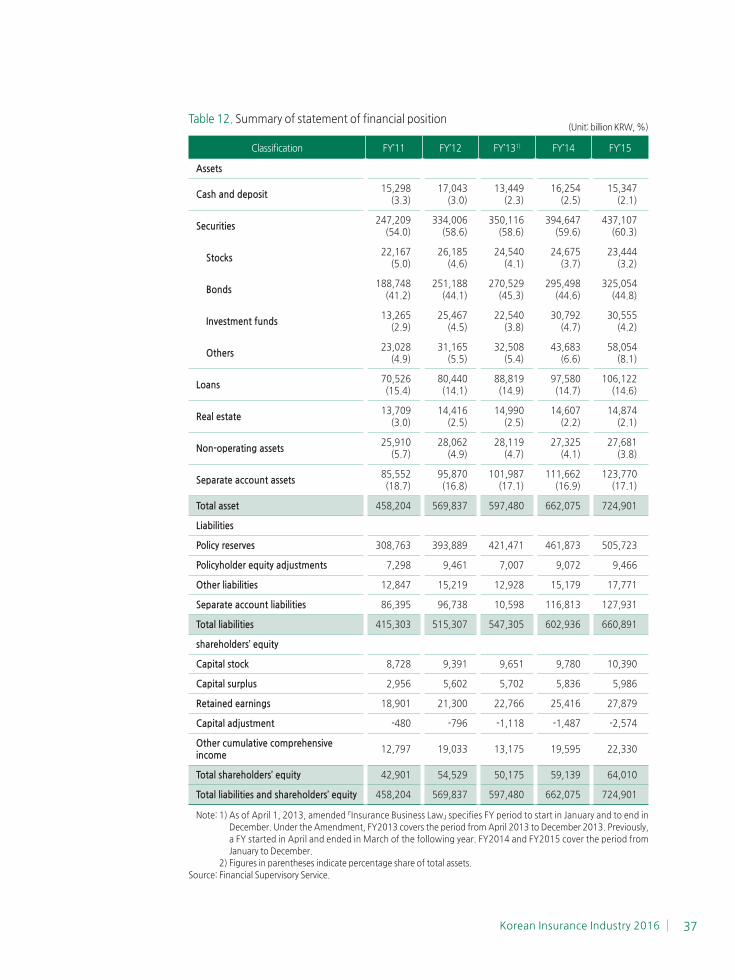
In 2015, the share of securities increased by 0.7%p over 2014 and took 60.3% of the total
assets, which represented the largest share in life insurance. Life insurers’ securities consists
of bonds, stocks, investment funds, and others. Bonds took 44.8% of the total assets, up by
0.2%p over 2014. The share of stocks and investment funds decreased each by 0.5%p over
2014, and recorded 3.2% and 4.2%, respectively. The share of others increased by 1.5%p
over 2014, as life insurers increased the amount of overseas investments.
Figure 10. Asset portfolio as of December 31, 2015(Unit: %)
Others 8.1
Stocks 3.2
Bonds44.8
Securities 60.3
Separate accountassets 17.1
Non-operatingassets 3.8
Real estate 2.1
Loans 14.6
Cash & deposit 2.1
Investment funds 4.2
Note: Others = overseas securities + others.
Source: Financial Supervisory Service.
12) As of December 31, 2015.
13) It means that the total assets exclude separate account assets.
Korean Insurance Industry 2016 37
Table 12. Summary of statement of financial position(Unit: billion KRW, %)
Classification FY’11 FY’12 FY’131) FY’14 FY’15
Assets
Cash and deposit15,298
(3.3)17,043
(3.0)13,449
(2.3)16,254
(2.5)15,347
(2.1)
Securities247,209
(54.0)334,006
(58.6)350,116
(58.6)394,647
(59.6)437,107
(60.3)
Stocks22,167
(5.0)26,185
(4.6)24,540
(4.1)24,675
(3.7)23,444
(3.2)
Bonds188,748
(41.2)251,188
(44.1)270,529
(45.3)295,498
(44.6)325,054
(44.8)
Investment funds13,265
(2.9)25,467
(4.5)22,540
(3.8)30,792
(4.7)30,555
(4.2)
Others23,028
(4.9)31,165
(5.5)32,508
(5.4)43,683
(6.6)58,054
(8.1)
Loans70,526(15.4)
80,440(14.1)
88,819(14.9)
97,580 (14.7)
106,122(14.6)
Real estate13,709
(3.0)14,416
(2.5)14,990
(2.5)14,607
(2.2)14,874
(2.1)
Non-operating assets25,910
(5.7)28,062
(4.9)28,119
(4.7)27,325
(4.1)27,681
(3.8)
Separate account assets 85,552
(18.7)95,870(16.8)
101,987(17.1)
111,662 (16.9)
123,770(17.1)
Total asset 458,204 569,837 597,480 662,075 724,901
Liabilities
Policy reserves 308,763 393,889 421,471 461,873 505,723
Policyholder equity adjustments 7,298 9,461 7,007 9,072 9,466
Other liabilities 12,847 15,219 12,928 15,179 17,771
Separate account liabilities 86,395 96,738 10,598 116,813 127,931
Total liabilities 415,303 515,307 547,305 602,936 660,891
shareholders’ equity
Capital stock 8,728 9,391 9,651 9,780 10,390
Capital surplus 2,956 5,602 5,702 5,836 5,986
Retained earnings 18,901 21,300 22,766 25,416 27,879
Capital adjustment -480 -796 -1,118 -1,487 -2,574
Other cumulative comprehensive income
12,797 19,033 13,175 19,595 22,330
Total shareholders’ equity 42,901 54,529 50,175 59,139 64,010
Total liabilities and shareholders’ equity 458,204 569,837 597,480 662,075 724,901
Note:1)AsofApril1,2013,amended『InsuranceBusinessLaw』specifiesFYperiodtostartinJanuaryandtoendin
December. Under the Amendment, FY2013 covers the period from April 2013 to December 2013. Previously,
a FY started in April and ended in March of the following year. FY2014 and FY2015 cover the period from
January to December.
2) Figures in parentheses indicate percentage share of total assets.
Source: Financial Supervisory Service.
38
Separate account assets took 17.1% of the total assets, up 0.2%p over 2014, while loans
accounted for 14.6%, which decreased by 0.1%p over 2014. The share of cash and deposits,
real estate, and non-operating assets were 2.1%, 2.1%, and 3.8% of the total assets,
respectively. And their shares decreased all slightly over 2014.
In 2015, the total liabilities of life insurers increased to 660,891 billion KRW from 602,936
billion KRW in 2014, due to the increase in premium reserve from the increase in sales of
protection type insurance.
The total shareholders’ equity increased to 64,010 billion KRW in 2015 from 59,139 billion
KRW in 2014. Especially, retained earnings increased to 27,879 billion KRW in 2015, up
9.7% over 2014.
Korean Insurance Industry 2016 39
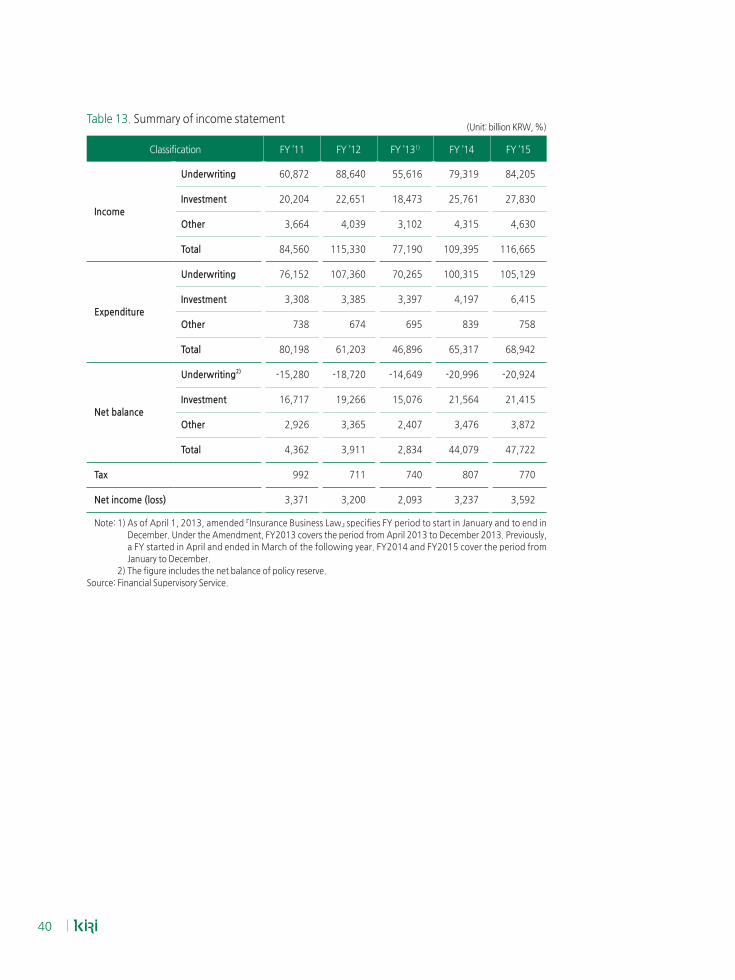
Income statement
The net income of life insurers in 2015 increased by 11.0% over 2014, and recorded 3,592
billion KRW. The main reason for the net profits of the life insurers in 2015 was the decrease
in deficits from underwriting and the increase in other gains.
The amount of deficits from underwriting decreased to 20,924 billion KRW from 20,996
billion KRW, due to the improvement in sales of protection type insurance products such as
whole life insurance with low-level surrender values.
Net investment income in 2015 decreased to 21,415 billion KRW from 21,564 billion KRW in
2014, due to lower rate of return on investment assets.
Other gains in 2015 increased to 3,872 billion KRW by 11.4% compared to 2014, as the
commissions from separate account increased.
40
Table 13. Summary of income statement (Unit: billion KRW, %)
Classification FY ’11 FY ’12 FY ’131) FY ’14 FY ’15
Income
Underwriting 60,872 88,640 55,616 79,319 84,205
Investment 20,204 22,651 18,473 25,761 27,830
Other 3,664 4,039 3,102 4,315 4,630
Total 84,560 115,330 77,190 109,395 116,665
Expenditure
Underwriting 76,152 107,360 70,265 100,315 105,129
Investment 3,308 3,385 3,397 4,197 6,415
Other 738 674 695 839 758
Total 80,198 61,203 46,896 65,317 68,942
Net balance
Underwriting2) -15,280 -18,720 -14,649 -20,996 -20,924
Investment 16,717 19,266 15,076 21,564 21,415
Other 2,926 3,365 2,407 3,476 3,872
Total 4,362 3,911 2,834 44,079 47,722
Tax 992 711 740 807 770
Net income (loss) 3,371 3,200 2,093 3,237 3,592
Note:1)AsofApril1,2013,amended『InsuranceBusinessLaw』specifiesFYperiodtostartinJanuaryandtoendin
December. Under the Amendment, FY2013 covers the period from April 2013 to December 2013. Previously,
a FY started in April and ended in March of the following year. FY2014 and FY2015 cover the period from
January to December.
2) The figure includes the net balance of policy reserve.
Source: Financial Supervisory Service.
Korean Insurance Industry 2016 41
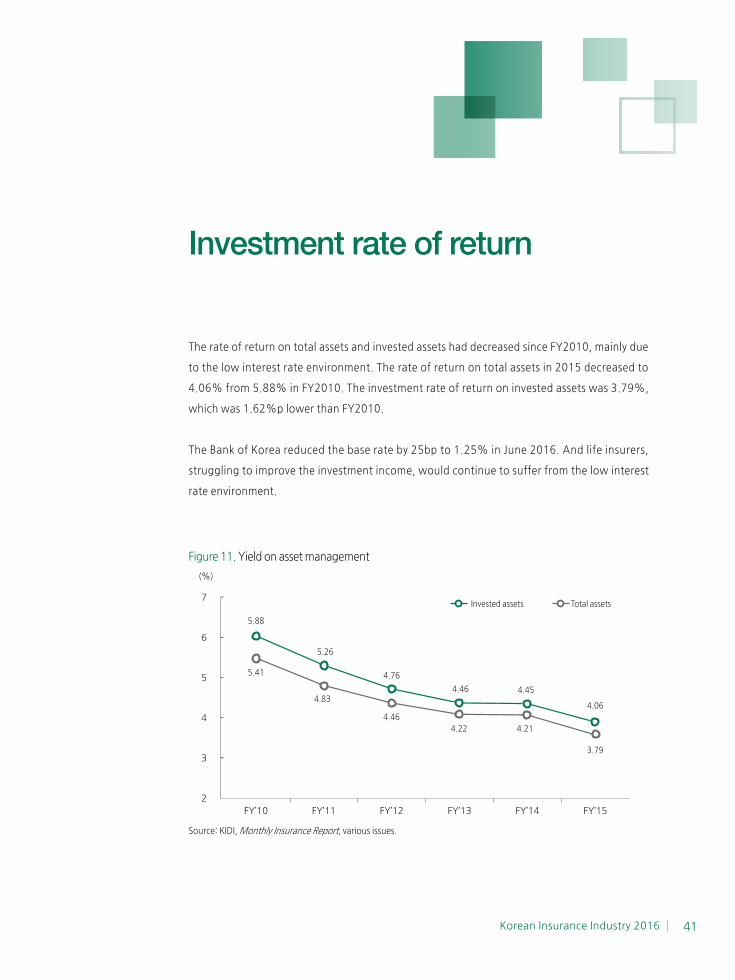
The rate of return on total assets and invested assets had decreased since FY2010, mainly due
to the low interest rate environment. The rate of return on total assets in 2015 decreased to
4.06% from 5.88% in FY2010. The investment rate of return on invested assets was 3.79%,
which was 1.62%p lower than FY2010.
The Bank of Korea reduced the base rate by 25bp to 1.25% in June 2016. And life insurers,
struggling to improve the investment income, would continue to suffer from the low interest
rate environment.
Figure 11. Yield on asset management
(%)
FY’10 FY’11 FY’12 FY’13 FY’14 FY’15
7
6
5
4
3
2
-
-
-
-
-
5.88
5.26
4.76
4.454.46
5.41
4.83
4.46
4.214.22
3.79
Invested assets Total assets
4.06
Source: KIDI, Monthly Insurance Report, various issues.
Investment rate of return
42
Premium income
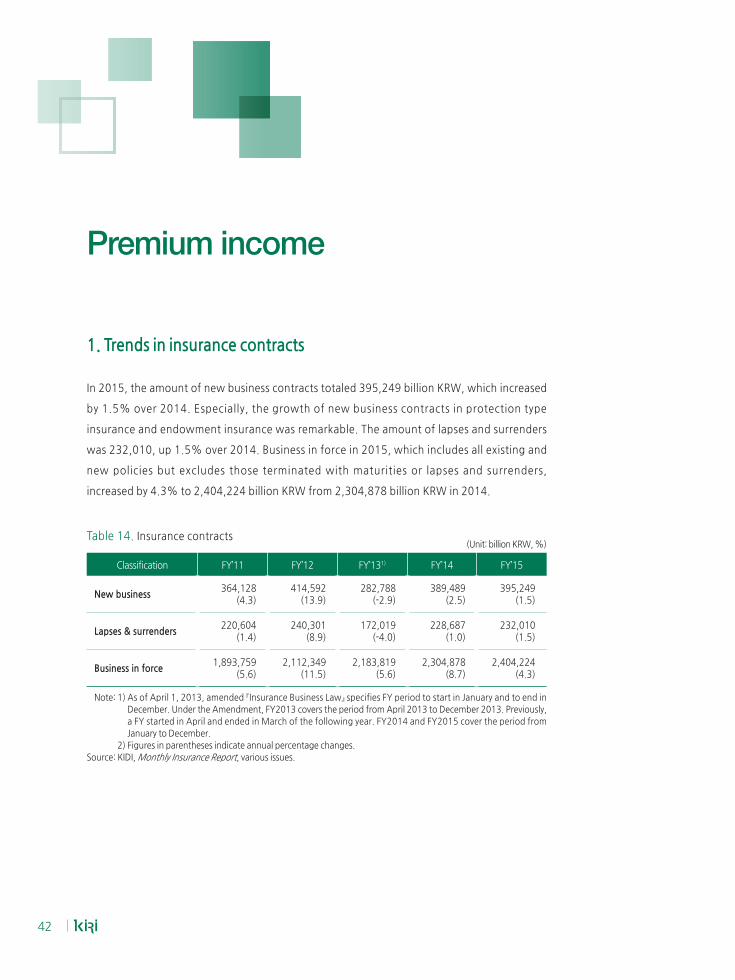
1. Trends in insurance contracts
In 2015, the amount of new business contracts totaled 395,249 billion KRW, which increased
by 1.5% over 2014. Especially, the growth of new business contracts in protection type
insurance and endowment insurance was remarkable. The amount of lapses and surrenders
was 232,010, up 1.5% over 2014. Business in force in 2015, which includes all existing and
new policies but excludes those terminated with maturities or lapses and surrenders,
increased by 4.3% to 2,404,224 billion KRW from 2,304,878 billion KRW in 2014.
Table 14. Insurance contracts (Unit: billion KRW, %)
Classification FY’11 FY’12 FY’131) FY’14 FY’15
New business364,128
(4.3)414,592
(13.9)282,788
(-2.9) 389,489
(2.5)395,249
(1.5)
Lapses & surrenders220,604
(1.4)240,301
(8.9)172,019
(-4.0)228,687
(1.0)232,010
(1.5)
Business in force1,893,759
(5.6)2,112,349
(11.5)2,183,819
(5.6)2,304,878
(8.7)2,404,224
(4.3)
Note:1)AsofApril1,2013,amended『InsuranceBusinessLaw』specifiesFYperiodtostartinJanuaryandtoendin
December. Under the Amendment, FY2013 covers the period from April 2013 to December 2013. Previously,
a FY started in April and ended in March of the following year. FY2014 and FY2015 cover the period from
January to December.
2) Figures in parentheses indicate annual percentage changes.
Source: KIDI, Monthly Insurance Report, various issues.
Korean Insurance Industry 2016 43
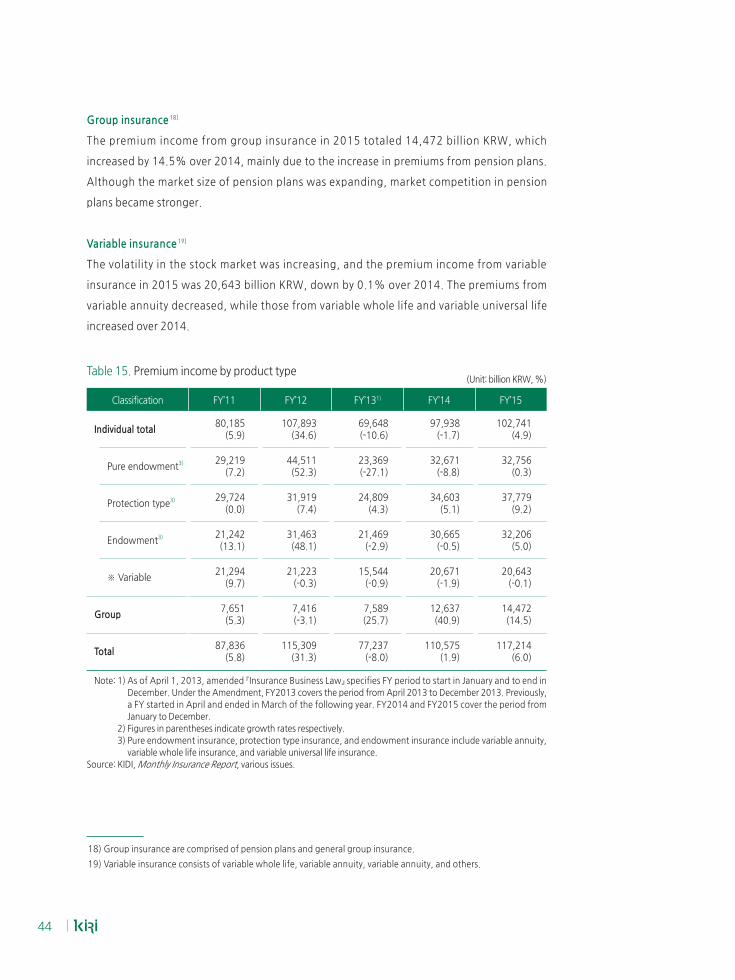
2. Premium income by product type 14)
The total premium income of life insurance in 2015 totaled 117,214 billion KRW, up by 6.0%
over 2014, due to the increase in premium income from protection type insurance,
endowment insurance, and pension plans. However, premium income from pure endowment
insurance in 2015 increased slightly, and the growth rate of variable insurance premiums in
2015 was negative.
Pure endowment insurance 15)
In 2015, premium income from pure endowment insurance increased only by 0.3% over
2014, and recorded 32,756 billion KRW. The growth rate of pure endowment insurance
premiums in 2015 was expected to recover because of the base effect from the low growth
rate in FY2013 and 2014. However, the recovery of pure endowment insurance premiums
was only modest due to the low interest rate environment.
Protection type insurance 16)
The premium income from protection type insurance in 2015 increased to 37,779 billion
KRW, up by 9.2% over 2014, due to various new products, such as whole life insurance with
low-level surrender values. As low interest rate environment persists, and consumers’
awareness on health risk increased recently, life insurers put more efforts in protection type
product sales.
Endowment insurance 17)
The premium income from endowment insurance in 2015 increased to 32,206 billion KRW,
up by 5.0% over 2014, as some life insurers pushed the sales of savings type insurance. They
provided better minimum guaranteed interest rate than other life insurers with more
aggressive asset management, despite of the low interest rate environment.
14) Life insurance by product type was classified into pure endowment, protection type, endowment, and group
insurance. The variable insurance such as variable whole life, variable annuity, and variable universal life
insurance came under each product type, according to the risk covered.
15) Pure endowment insurance consists of annuity and variable annuity.
16) Protection type insurance are comprised of whole life, critical illness, term life, health insurance, and variable
whole life insurance.
17) Endowment insurance consists of tax-favored savings type insurance and variable universal life insurance.
44
Group insurance 18)
The premium income from group insurance in 2015 totaled 14,472 billion KRW, which
increased by 14.5% over 2014, mainly due to the increase in premiums from pension plans.
Although the market size of pension plans was expanding, market competition in pension
plans became stronger.
Variable insurance 19)
The volatility in the stock market was increasing, and the premium income from variable
insurance in 2015 was 20,643 billion KRW, down by 0.1% over 2014. The premiums from
variable annuity decreased, while those from variable whole life and variable universal life
increased over 2014.
Table 15. Premium income by product type (Unit: billion KRW, %)
Classification FY’11 FY’12 FY’131) FY’14 FY’15
Individual total80,185
(5.9)107,893
(34.6)69,648(-10.6)
97,938(-1.7)
102,741(4.9)
Pure endowment3) 29,219(7.2)
44,511(52.3)
23,369(-27.1)
32,671(-8.8)
32,756(0.3)
Protection type3) 29,724(0.0)
31,919(7.4)
24,809(4.3)
34,603(5.1)
37,779(9.2)
Endowment3) 21,242(13.1)
31,463(48.1)
21,469(-2.9)
30,665(-0.5)
32,206(5.0)
※Variable21,294
(9.7)21,223
(-0.3)15,544
(-0.9)20,671
(-1.9)20,643
(-0.1)
Group7,651(5.3)
7,416(-3.1)
7,589(25.7)
12,637(40.9)
14,472(14.5)
Total87,836
(5.8)115,309
(31.3)77,237
(-8.0)110,575
(1.9)117,214
(6.0)
Note:1)AsofApril1,2013,amended『InsuranceBusinessLaw』specifiesFYperiodtostartinJanuaryandtoendin
December. Under the Amendment, FY2013 covers the period from April 2013 to December 2013. Previously,
a FY started in April and ended in March of the following year. FY2014 and FY2015 cover the period from
January to December.
2) Figures in parentheses indicate growth rates respectively.
3) Pure endowment insurance, protection type insurance, and endowment insurance include variable annuity,
variable whole life insurance, and variable universal life insurance.
Source: KIDI, Monthly Insurance Report, various issues.
18) Group insurance are comprised of pension plans and general group insurance.
19)Variableinsuranceconsistsofvariablewholelife,variableannuity,variableannuity,andothers.
Korean Insurance Industry 2016 45
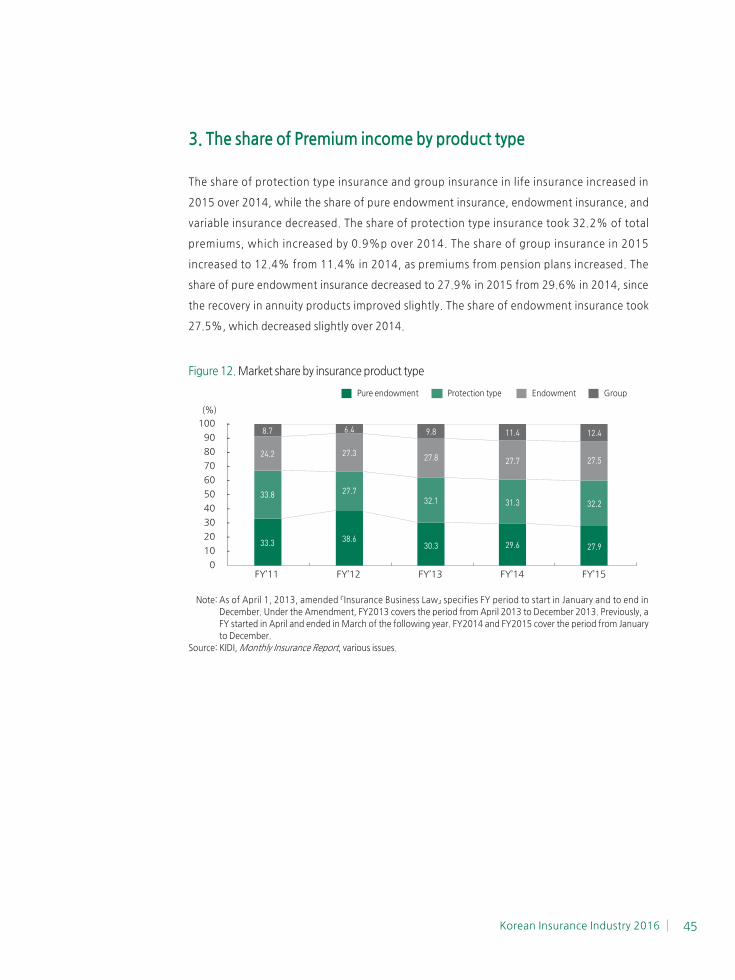
3. The share of Premium income by product type
The share of protection type insurance and group insurance in life insurance increased in
2015 over 2014, while the share of pure endowment insurance, endowment insurance, and
variable insurance decreased. The share of protection type insurance took 32.2% of total
premiums, which increased by 0.9%p over 2014. The share of group insurance in 2015
increased to 12.4% from 11.4% in 2014, as premiums from pension plans increased. The
share of pure endowment insurance decreased to 27.9% in 2015 from 29.6% in 2014, since
the recovery in annuity products improved slightly. The share of endowment insurance took
27.5%, which decreased slightly over 2014.
Figure 12. Market share by insurance product type
Pure endowment Protection type Endowment Group
FY’11 FY’12 FY’13 FY’14 FY’15
100
90
80
70
60
50
40
30
20
10
0
-
-
-
-
-
-
-
-
-
-
8.7 6.4 9.8 11.4 12.4
24.2 27.3 27.8 27.7 27.5
33.8 27.732.1 31.3 32.2
33.3 38.630.3 29.6 27.9
Note:AsofApril1,2013,amended『InsuranceBusinessLaw』specifiesFYperiodtostartinJanuaryandtoendin
December. Under the Amendment, FY2013 covers the period from April 2013 to December 2013. Previously, a
FY started in April and ended in March of the following year. FY2014 and FY2015 cover the period from January
to December.
Source: KIDI, Monthly Insurance Report, various issues.
(%)
46
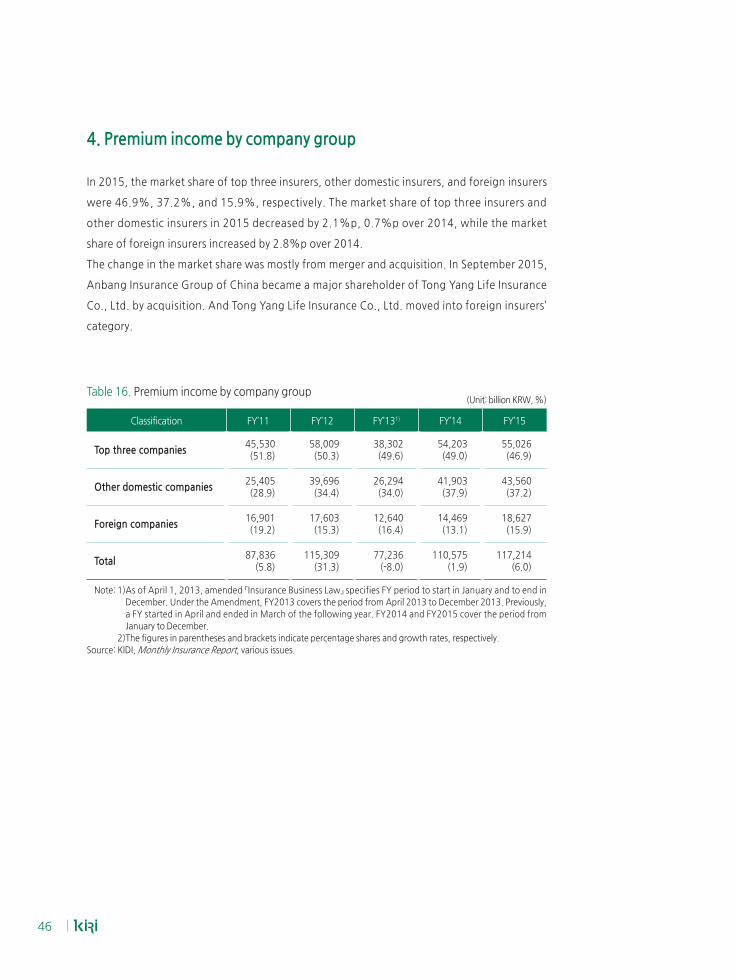
4. Premium income by company group
In 2015, the market share of top three insurers, other domestic insurers, and foreign insurers
were 46.9%, 37.2%, and 15.9%, respectively. The market share of top three insurers and
other domestic insurers in 2015 decreased by 2.1%p, 0.7%p over 2014, while the market
share of foreign insurers increased by 2.8%p over 2014.
The change in the market share was mostly from merger and acquisition. In September 2015,
Anbang Insurance Group of China became a major shareholder of Tong Yang Life Insurance
Co., Ltd. by acquisition. And Tong Yang Life Insurance Co., Ltd. moved into foreign insurers’
category.
Table 16. Premium income by company group(Unit: billion KRW, %)
Classification FY’11 FY’12 FY’131) FY’14 FY’15
Top three companies45,530(51.8)
58,009(50.3)
38,302(49.6)
54,203(49.0)
55,026(46.9)
Other domestic companies25,405(28.9)
39,696(34.4)
26,294(34.0)
41,903(37.9)
43,560(37.2)
Foreign companies16,901(19.2)
17,603(15.3)
12,640(16.4)
14,469(13.1)
18,627(15.9)
Total87,836
(5.8)115,309
(31.3)77,236
(-8.0)110,575
(1.9)117,214
(6.0)
Note:1)AsofApril1,2013,amended『InsuranceBusinessLaw』specifiesFYperiodtostartinJanuaryandtoendin
December. Under the Amendment, FY2013 covers the period from April 2013 to December 2013. Previously,
a FY started in April and ended in March of the following year. FY2014 and FY2015 cover the period from
January to December.
2)The figures in parentheses and brackets indicate percentage shares and growth rates, respectively.
Source: KIDI, Monthly Insurance Report, various issues.
Korean Insurance Industry 2016 47
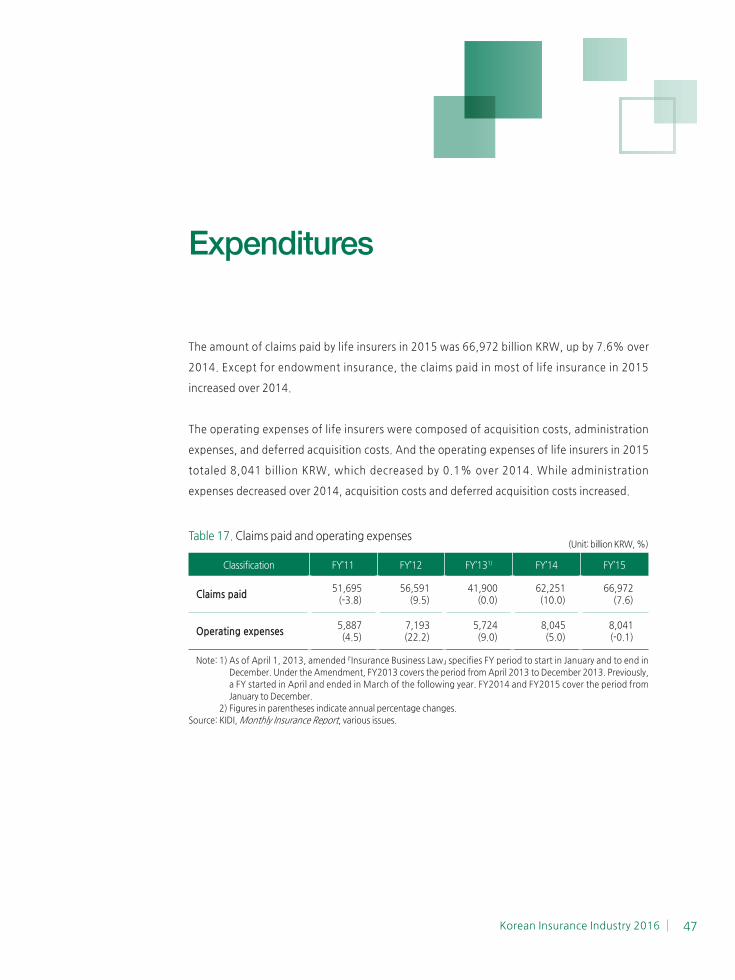
Expenditures
The amount of claims paid by life insurers in 2015 was 66,972 billion KRW, up by 7.6% over
2014. Except for endowment insurance, the claims paid in most of life insurance in 2015
increased over 2014.
The operating expenses of life insurers were composed of acquisition costs, administration
expenses, and deferred acquisition costs. And the operating expenses of life insurers in 2015
totaled 8,041 billion KRW, which decreased by 0.1% over 2014. While administration
expenses decreased over 2014, acquisition costs and deferred acquisition costs increased.
Table 17. Claims paid and operating expenses (Unit: billion KRW, %)
Classification FY’11 FY’12 FY’131) FY’14 FY’15
Claims paid51,695
(-3.8)56,591
(9.5)41,900
(0.0)62,251(10.0)
66,972(7.6)
Operating expenses5,887(4.5)
7,193(22.2)
5,724(9.0)
8,045(5.0)
8,041(-0.1)
Note:1)AsofApril1,2013,amended『InsuranceBusinessLaw』specifiesFYperiodtostartinJanuaryandtoendin
December. Under the Amendment, FY2013 covers the period from April 2013 to December 2013. Previously,
a FY started in April and ended in March of the following year. FY2014 and FY2015 cover the period from
January to December.
2) Figures in parentheses indicate annual percentage changes.
Source: KIDI, Monthly Insurance Report, various issues.
48
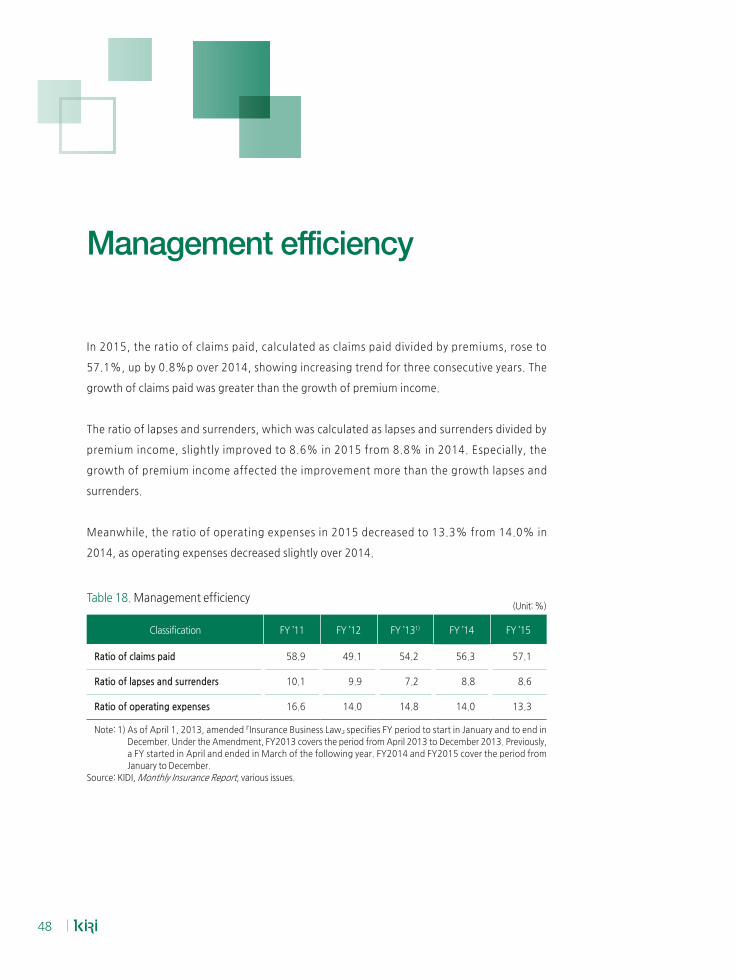
In 2015, the ratio of claims paid, calculated as claims paid divided by premiums, rose to
57.1%, up by 0.8%p over 2014, showing increasing trend for three consecutive years. The
growth of claims paid was greater than the growth of premium income.
The ratio of lapses and surrenders, which was calculated as lapses and surrenders divided by
premium income, slightly improved to 8.6% in 2015 from 8.8% in 2014. Especially, the
growth of premium income affected the improvement more than the growth lapses and
surrenders.
Meanwhile, the ratio of operating expenses in 2015 decreased to 13.3% from 14.0% in
2014, as operating expenses decreased slightly over 2014.
Table 18. Management efficiency (Unit: %)
Classification FY ’11 FY ’12 FY ’131) FY ’14 FY ’15
Ratio of claims paid 58.9 49.1 54.2 56.3 57.1
Ratio of lapses and surrenders 10.1 9.9 7.2 8.8 8.6
Ratio of operating expenses 16.6 14.0 14.8 14.0 13.3
Note:1)AsofApril1,2013,amended『InsuranceBusinessLaw』specifiesFYperiodtostartinJanuaryandtoendin
December. Under the Amendment, FY2013 covers the period from April 2013 to December 2013. Previously,
a FY started in April and ended in March of the following year. FY2014 and FY2015 cover the period from
January to December.
Source: KIDI, Monthly Insurance Report, various issues.
Management efficiency
Korean Insurance Industry 2016 49
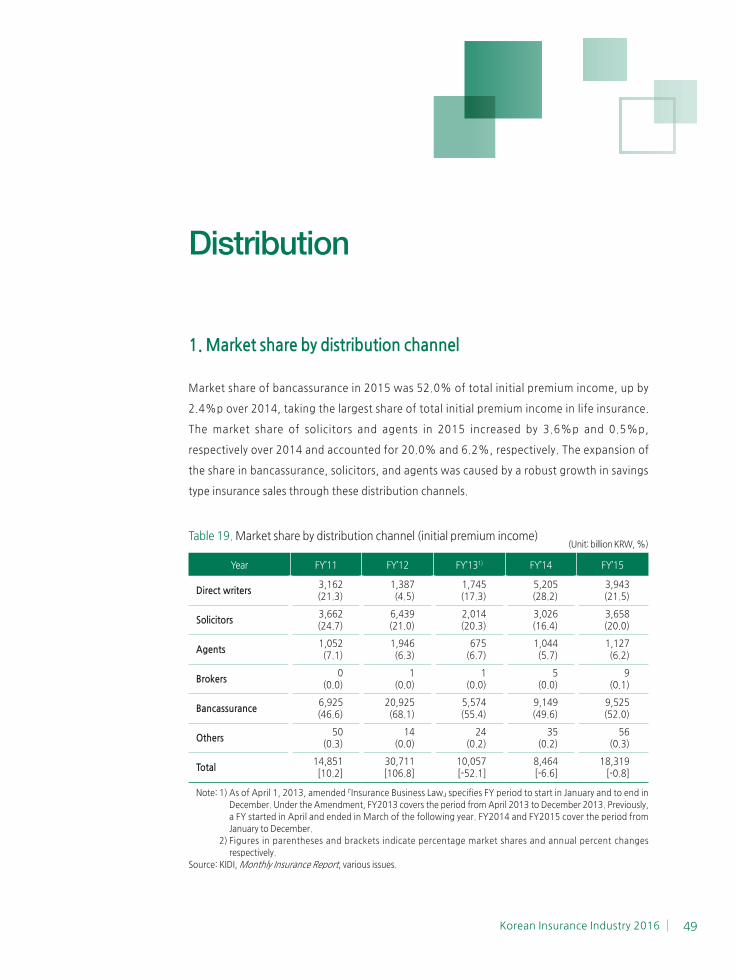
1. Market share by distribution channel
Market share of bancassurance in 2015 was 52.0% of total initial premium income, up by
2.4%p over 2014, taking the largest share of total initial premium income in life insurance.
The market share of solicitors and agents in 2015 increased by 3.6%p and 0.5%p,
respectively over 2014 and accounted for 20.0% and 6.2%, respectively. The expansion of
the share in bancassurance, solicitors, and agents was caused by a robust growth in savings
type insurance sales through these distribution channels.
Table 19. Market share by distribution channel (initial premium income)(Unit: billion KRW, %)
Year FY’11 FY’12 FY’131) FY’14 FY’15
Direct writers3,162(21.3)
1,387(4.5)
1,745(17.3)
5,205(28.2)
3,943(21.5)
Solicitors3,662(24.7)
6,439(21.0)
2,014(20.3)
3,026(16.4)
3,658(20.0)
Agents1,052 (7.1)
1,946(6.3)
675(6.7)
1,044(5.7)
1,127(6.2)
Brokers0
(0.0)1
(0.0)1
(0.0)5
(0.0)9
(0.1)
Bancassurance6,925(46.6)
20,925(68.1)
5,574(55.4)
9,149(49.6)
9,525(52.0)
Others50
(0.3)14
(0.0)24
(0.2)35
(0.2)56
(0.3)
Total14,851[10.2]
30,711[106.8]
10,057[-52.1]
8,464[-6.6]
18,319[-0.8]
Note:1)AsofApril1,2013,amended『InsuranceBusinessLaw』specifiesFYperiodtostartinJanuaryandtoendin
December. Under the Amendment, FY2013 covers the period from April 2013 to December 2013. Previously,
a FY started in April and ended in March of the following year. FY2014 and FY2015 cover the period from
January to December.
2) Figures in parentheses and brackets indicate percentage market shares and annual percent changes
respectively.
Source: KIDI, Monthly Insurance Report, various issues.
Distribution
50
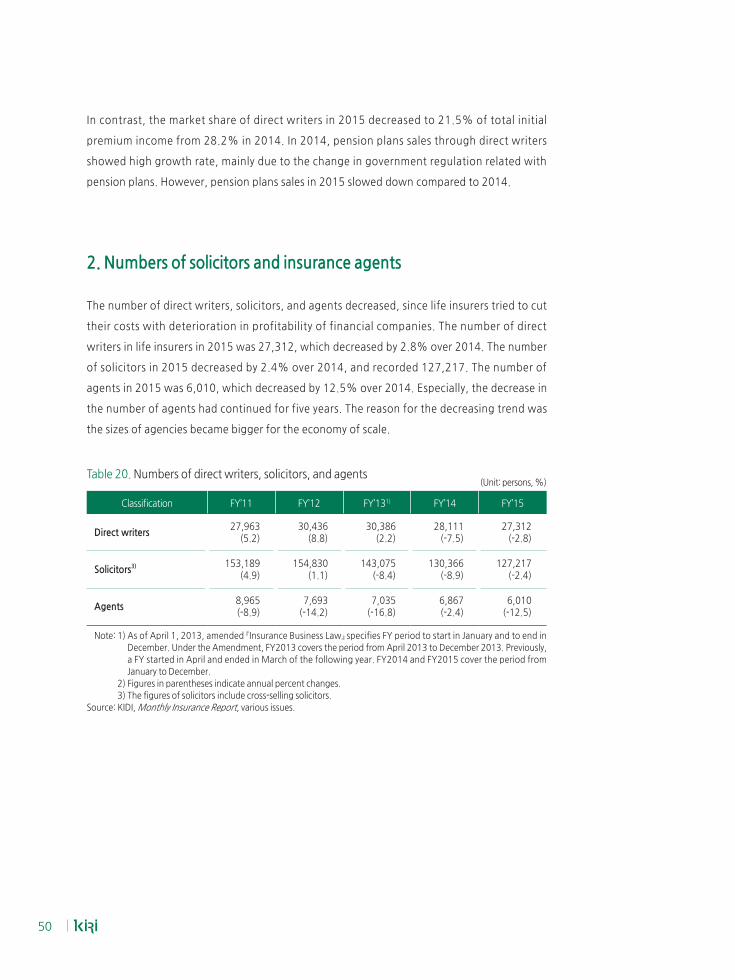
In contrast, the market share of direct writers in 2015 decreased to 21.5% of total initial
premium income from 28.2% in 2014. In 2014, pension plans sales through direct writers
showed high growth rate, mainly due to the change in government regulation related with
pension plans. However, pension plans sales in 2015 slowed down compared to 2014.
2. Numbers of solicitors and insurance agents
The number of direct writers, solicitors, and agents decreased, since life insurers tried to cut
their costs with deterioration in profitability of financial companies. The number of direct
writers in life insurers in 2015 was 27,312, which decreased by 2.8% over 2014. The number
of solicitors in 2015 decreased by 2.4% over 2014, and recorded 127,217. The number of
agents in 2015 was 6,010, which decreased by 12.5% over 2014. Especially, the decrease in
the number of agents had continued for five years. The reason for the decreasing trend was
the sizes of agencies became bigger for the economy of scale.
Table 20. Numbers of direct writers, solicitors, and agents(Unit: persons, %)
Classification FY’11 FY’12 FY’131) FY’14 FY’15
Direct writers27,963
(5.2)30,436
(8.8)30,386
(2.2)28,111
(-7.5)27,312
(-2.8)
Solicitors3) 153,189(4.9)
154,830(1.1)
143,075(-8.4)
130,366(-8.9)
127,217(-2.4)
Agents8,965(-8.9)
7,693(-14.2)
7,035(-16.8)
6,867(-2.4)
6,010(-12.5)
Note:1)AsofApril1,2013,amended『InsuranceBusinessLaw』specifiesFYperiodtostartinJanuaryandtoendin
December. Under the Amendment, FY2013 covers the period from April 2013 to December 2013. Previously,
a FY started in April and ended in March of the following year. FY2014 and FY2015 cover the period from
January to December.
2) Figures in parentheses indicate annual percent changes.
3) The figures of solicitors include cross-selling solicitors.
Source: KIDI, Monthly Insurance Report, various issues.

KOREANINSURANCE
INDUSTRY2016
Non-life insurance industry
Statement of financial position
Income statement
Investment rate of return
Direct premiums written
Expenditures
Management efficiency
Distribution
52
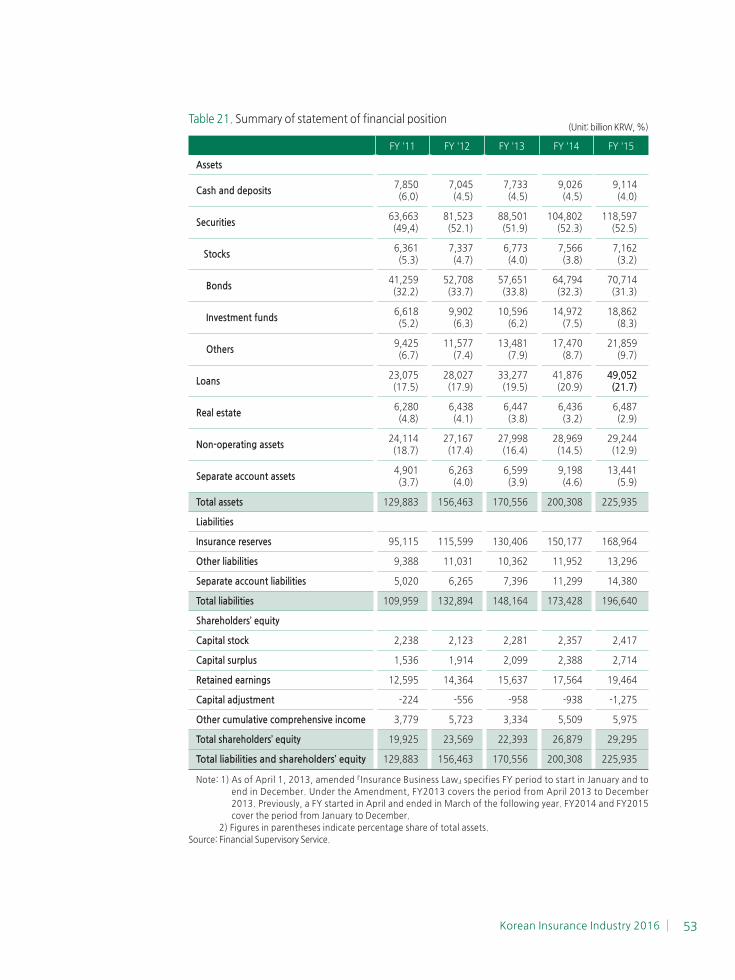
Statement of financial position 20)
In 2015, the total assets of non-life insurers increased by 12.8% over 2014, and recorded
225,935 billion KRW. The total assets of general account increased by 11.2% over 2014,
mainly due to the increase in available-for-sale assets and loans, which came from an increase
in the premium reserve. The total assets of separate account increased by 46.1% over 2014
because of the robust growth in retirement pension funds.
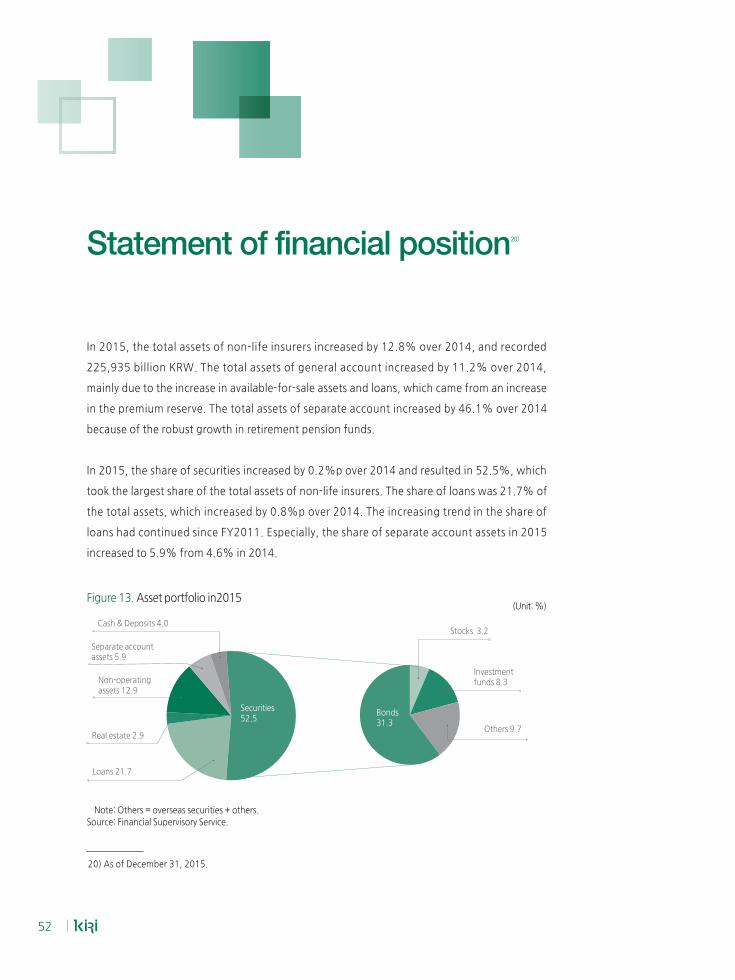
In 2015, the share of securities increased by 0.2%p over 2014 and resulted in 52.5%, which
took the largest share of the total assets of non-life insurers. The share of loans was 21.7% of
the total assets, which increased by 0.8%p over 2014. The increasing trend in the share of
loans had continued since FY2011. Especially, the share of separate account assets in 2015
increased to 5.9% from 4.6% in 2014.
Figure 13. Asset portfolio in2015(Unit: %)
Note: Others = overseas securities + others.
Source: Financial Supervisory Service.
20) As of December 31, 2015.
Others 9.7
Investmentfunds 8.3
Stocks 3.2
Bonds 31.3
Securities 52.5
Cash & Deposits 4.0
Separate account assets 5.9
Non-operating assets 12.9
Real estate 2.9
Loans 21.7
Korean Insurance Industry 2016 53
Table 21. Summary of statement of financial position(Unit: billion KRW, %)
FY '11 FY '12 FY '13 FY '14 FY '15
Assets
Cash and deposits7,850(6.0)
7,045 (4.5)
7,733 (4.5)
9,026 (4.5)
9,114 (4.0)
Securities63,663(49,4)
81,523 (52.1)
88,501 (51.9)
104,802 (52.3)
118,597 (52.5)
Stocks6,361(5.3)
7,337 (4.7)
6,773 (4.0)
7,566 (3.8)
7,162 (3.2)
Bonds41,259(32.2)
52,708 (33.7)
57,651 (33.8)
64,794 (32.3)
70,714 (31.3)
Investment funds6,618(5.2)
9,902 (6.3)
10,596 (6.2)
14,972 (7.5)
18,862 (8.3)
Others9,425(6.7)
11,577 (7.4)
13,481 (7.9)
17,470 (8.7)
21,859 (9.7)
Loans23,075(17.5)
28,027 (17.9)
33,277 (19.5)
41,876 (20.9)
49,052 (21.7)
Real estate6,280(4.8)
6,438 (4.1)
6,447 (3.8)
6,436 (3.2)
6,487 (2.9)
Non-operating assets24,114(18.7)
27,167 (17.4)
27,998 (16.4)
28,969 (14.5)
29,244 (12.9)
Separate account assets4,901(3.7)
6,263 (4.0)
6,599 (3.9)
9,198 (4.6)
13,441 (5.9)
Total assets 129,883 156,463 170,556 200,308 225,935
Liabilities
Insurance reserves 95,115 115,599 130,406 150,177 168,964
Other liabilities 9,388 11,031 10,362 11,952 13,296
Separate account liabilities 5,020 6,265 7,396 11,299 14,380
Total liabilities 109,959 132,894 148,164 173,428 196,640
Shareholders’ equity
Capital stock 2,238 2,123 2,281 2,357 2,417
Capital surplus 1,536 1,914 2,099 2,388 2,714
Retained earnings 12,595 14,364 15,637 17,564 19,464
Capital adjustment -224 -556 -958 -938 -1,275
Other cumulative comprehensive income 3,779 5,723 3,334 5,509 5,975
Total shareholders’ equity 19,925 23,569 22,393 26,879 29,295
Total liabilities and shareholders’ equity 129,883 156,463 170,556 200,308 225,935
Note:1)AsofApril1,2013,amended『InsuranceBusinessLaw』specifiesFYperiodtostartinJanuaryandto
end in December. Under the Amendment, FY2013 covers the period from April 2013 to December
2013. Previously, a FY started in April and ended in March of the following year. FY2014 and FY2015
cover the period from January to December.
2) Figures in parentheses indicate percentage share of total assets.
Source: Financial Supervisory Service.
49,052 (21.7)
54
Real estate and bonds took 2.9% and 31.3% of the total assets respectively, which
decreased slightly over 2014. The shares of cash & deposits, stocks and non-operating assets
decreased to 4.0%, 3.2% and 12.9% in 2015 from 4.5%, 3.8% and 14.5%, respectively in
2014. The shares of investment fund and others in securities increased to 8.3% and 9.7% in
2015 from 7.5% and 8.7%, respectively in 2014.
In 2015, the total liabilities increased to 196,640 billion KRW from 173,428 billion KRW in
2014. The main reason for the increase was the steady growth in long-term insurance
premium reserve. Also, the separate account liabilities in 2015 increased to 14,380 billion
KRW.
In 2015, the total equity of shareholders increased to 29,295 billion KRW from 26,879 billion
KRW in 2014, mainly due to the increase in capital surplus and retained earnings.
Korean Insurance Industry 2016 55
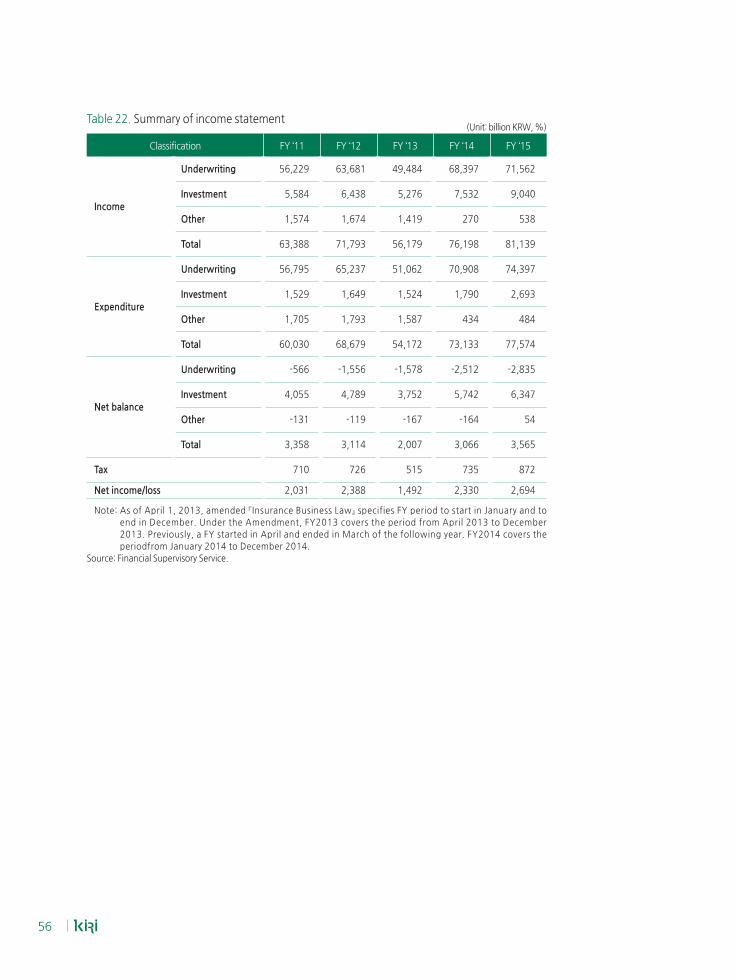
Income statement
Net income of non-life insurers in 2015 was 2,694 billion KRW, which increased by 15.6%
over 2,330 billion KRW in 2014. The amount of deficit from underwriting increased to 2,835
billion KRW in 2015 from 2,512 billion KRW in 2014, mainly due to the increase in the loss
ratio of automobile insurance and long-term insurance. The amount of surplus from
investment increased to 6,347 billion KRW in 2015 from 5,742 billion KRW in 2014, due to
the increase in invested assets.
56
Table 22. Summary of income statement (Unit: billion KRW, %)
Classification FY ‘11 FY ‘12 FY ‘13 FY ‘14 FY ‘15
Income
Underwriting 56,229 63,681 49,484 68,397 71,562
Investment 5,584 6,438 5,276 7,532 9,040
Other 1,574 1,674 1,419 270 538
Total 63,388 71,793 56,179 76,198 81,139
Expenditure
Underwriting 56,795 65,237 51,062 70,908 74,397
Investment 1,529 1,649 1,524 1,790 2,693
Other 1,705 1,793 1,587 434 484
Total 60,030 68,679 54,172 73,133 77,574
Net balance
Underwriting -566 -1,556 -1,578 -2,512 -2,835
Investment 4,055 4,789 3,752 5,742 6,347
Other -131 -119 -167 -164 54
Total 3,358 3,114 2,007 3,066 3,565
Tax 710 726 515 735 872
Net income/loss 2,031 2,388 1,492 2,330 2,694
Note:AsofApril1,2013,amended『InsuranceBusinessLaw』specifiesFYperiodtostartinJanuaryandto
end in December. Under the Amendment, FY2013 covers the period from April 2013 to December
2013. Previously, a FY started in April and ended in March of the following year. FY2014 covers the
periodfrom January 2014 to December 2014.
Source: Financial Supervisory Service.
Korean Insurance Industry 2016 57
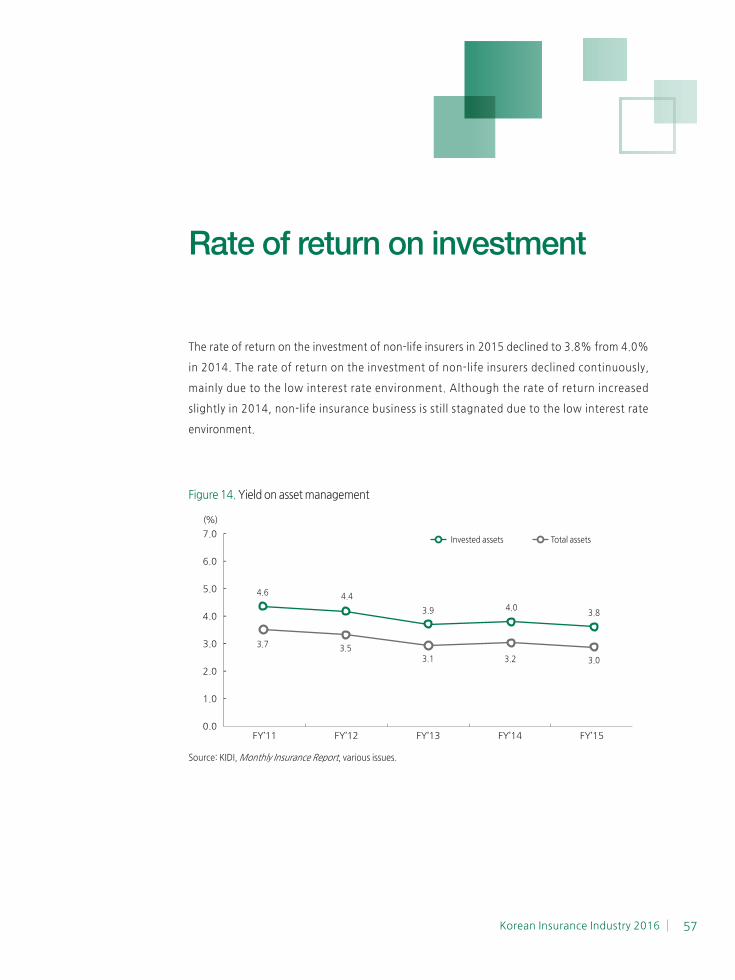
Rate of return on investment
The rate of return on the investment of non-life insurers in 2015 declined to 3.8% from 4.0%
in 2014. The rate of return on the investment of non-life insurers declined continuously,
mainly due to the low interest rate environment. Although the rate of return increased
slightly in 2014, non-life insurance business is still stagnated due to the low interest rate
environment.
Figure 14. Yield on asset management
FY’11 FY’12 FY’13 FY’14 FY’15
7.0
6.0
5.0
4.0
3.0
2.0
1.0
0.0
-
-
-
-
-
-
-
4.6 4.4
3.9 4.03.8
3.7 3.53.1 3.2 3.0
Invested assets Total assets
(%)
Source: KIDI, Monthly Insurance Report, various issues.
58
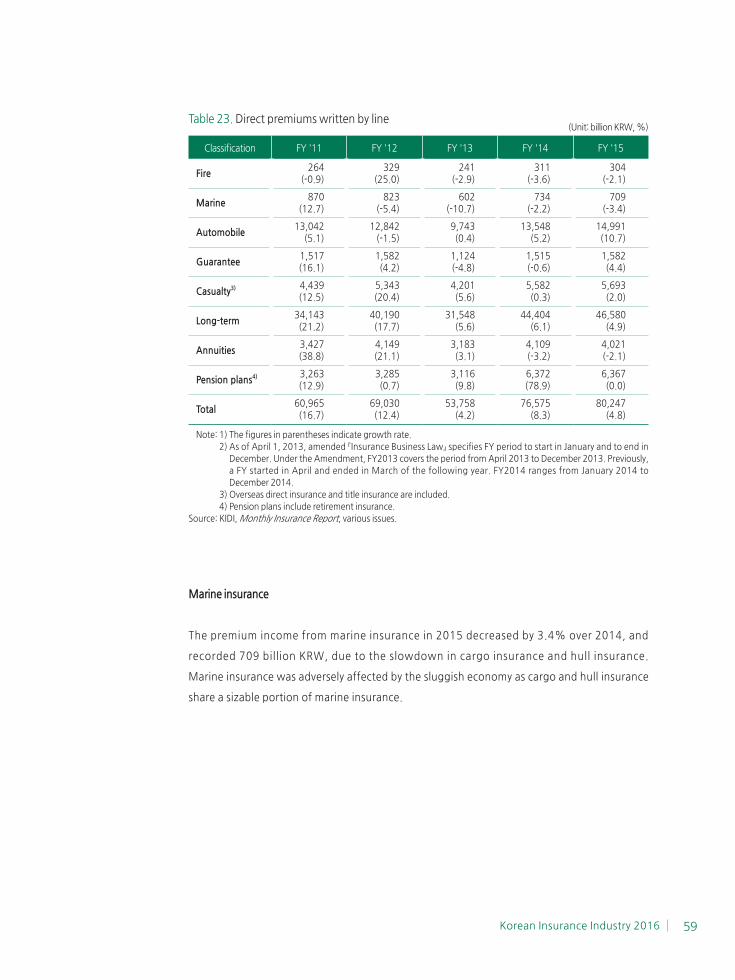
Direct premiums written
The total premium income 21) of non-life insurance 22) in 2015 recorded 80,247 billion KRW.
The growth rate decreased to 4.8% in 2015 from 8.3% in 2014, mainly due to the decline of
annuities 23) and pension plans. However, the premiums from general insurance 24) and long-
term insurance are increased in 2015. Especially, automobile insurance showed a sudden
increase in the premium income in 2015.
1. Lines of business
Fire insurance
The premium income from fire insurance in 2015 amounted to 304 billion KRW, which
decreased by 2.1% over 2014. The growth rate of fire insurance premiums had declined for
three years, due to the slow recovery in construction business and the sales of comprehensive
insurance, which covers fire.
21) Direct premiums written.
22) Non-life insurance consists of fire, marine, automobile, guarantee, casualty insurances, and non-traditional
business, such as long-term insurance, annuities, and pension plans.
23) Non-life insurers could sell annuities qualified for tax breaks.
24) General insurance includes fire, marine, guarantee and casualty insurances.
Korean Insurance Industry 2016 59
Table 23. Direct premiums written by line (Unit: billion KRW, %)
Classification FY '11 FY '12 FY '13 FY '14 FY '15
Fire264
(-0.9)329
(25.0) 241
(-2.9) 311
(-3.6)304
(-2.1)
Marine870
(12.7)823
(-5.4)602
(-10.7)734
(-2.2)709
(-3.4)
Automobile13,042
(5.1)12,842
(-1.5) 9,743(0.4)
13,548 (5.2)
14,991 (10.7)
Guarantee1,517 (16.1)
1,582(4.2)
1,124 (-4.8)
1,515 (-0.6)
1,582 (4.4)
Casualty3) 4,439(12.5)
5,343 (20.4)
4,201 (5.6)
5,582 (0.3)
5,693 (2.0)
Long-term34,143(21.2)
40,190 (17.7)
31,548 (5.6)
44,404 (6.1)
46,580 (4.9)
Annuities3,427 (38.8)
4,149 (21.1)
3,183 (3.1)
4,109 (-3.2)
4,021 (-2.1)
Pension plans4) 3,263 (12.9)
3,285 (0.7)
3,116 (9.8)
6,372 (78.9)
6,367 (0.0)
Total60,965 (16.7)
69,030 (12.4)
53,758 (4.2)
76,575 (8.3)
80,247 (4.8)
Note: 1) The figures in parentheses indicate growth rate.
2)AsofApril1,2013,amended『InsuranceBusinessLaw』specifiesFYperiodtostartinJanuaryandtoendin
December. Under the Amendment, FY2013 covers the period from April 2013 to December 2013. Previously,
a FY started in April and ended in March of the following year. FY2014 ranges from January 2014 to
December 2014.
3) Overseas direct insurance and title insurance are included.
4) Pension plans include retirement insurance.
Source: KIDI, Monthly Insurance Report, various issues.
Marine insurance
The premium income from marine insurance in 2015 decreased by 3.4% over 2014, and
recorded 709 billion KRW, due to the slowdown in cargo insurance and hull insurance.
Marine insurance was adversely affected by the sluggish economy as cargo and hull insurance
share a sizable portion of marine insurance.
60
Automobile insurance
The premium income from automobile insurance in 2015 recorded 14,991 billion KRW,
which increased by 10.7% over 2014, due to the increase in the premium rate of automobile
insurance in 2014. The rate change was to compensate operating losses in automobile
insurance. Also, the property damage liability in automobile insurance showed a modest
recovery, since the share of expensive cars such as imported cars and premiums thereof,
increased. However, there was still reduction factors of the premium income in automobile
insurance such as the increase in the products offering premium discount and an expansion
of on-line automobile insurance.
Guarantee insurance
The premium income from guarantee insurance in 2015 increased by 4.4% over 2014 to
1,582 billion KRW, due to the expansion of construction investment and increasing demand
of lease deposit credit insurance from the price increase in housing lease.
Casualty insurance
In 2015, the premium income from casualty insurance increased by 2.0% over 2014, and
recorded 5,693 billion KRW. The slow growth is due to the delay of economic recovery.
Casualty insurance consists of various insurances, which covers the risks such as liability,
accident, theft, damage of objects and so forth, and its premiums are usually associated with
economic situation.
Long-term insurance 25)
The premiums from long-term insurance in 2015 increased by 4.9% over 2014, and recorded
46,580 billion KRW. But the growth rate in long-term insurance in 2015 was lower by 1.2%p
over 2014. The premium growth of long-term insurance was due to good performance in
accident insurance and sickness insurance. The premiums of accident insurance and sickness
insurance increased by 12.0% and 16.6%, respectively over 2014. The initial premiums in
accident insurance and sickness insurance showed a modest recovery 26). However, the initial
premiums of savings type insurance in 2015 decreased by 20.3% over 2014. Savings type
25) Long-term insurance includes savings type products with the maturity of 5~15 years combined with health
insurance to cover medical expenses.
26) The initial premiums in accident insurance and sickness insurance increased by 1.8%, 6.5% over 2014.
Korean Insurance Industry 2016 61
insurance had shown a slowdown for three years. The main reason for the slowdown in the
premiums of savings type insurance was the tax reform, announced in August 2012, which
reduced tax benefits for savings type insurance. And the premiums of savings type insurance
in 2015 also decreased significantly by 11.0%, due to the decrease in disclosure interest rates
and investment pressure of insurers with a prolonged period of low interest rates.
Annuities 27)
The premium income from annuities in 2015 decreased by 2.1% over 2014 to 4,021 billion
KRW as the effect of increased tax exemption for annuity premiums from 3 to 4 million KRW
in 2011 became faded. Also, sales commission cuts in annuities contributed to the decrease.
Pension plans 28)
In 2015, the premiums from pension plans decreased by 0.001% over 2014 to 6,367 billion
KRW. The decline was due to the base effect of its dramatic increase in 2014, a passive sales
policy of some insurers expecting stronger prudential regulation under the low interest rate
environment.
27) Non-life insurers could sell annuities qualified for tax breaks. Also, the premium income of annuities is usually
associated with regulation changes for tax breaks.
28) Pension plans include retirement insurance.
62
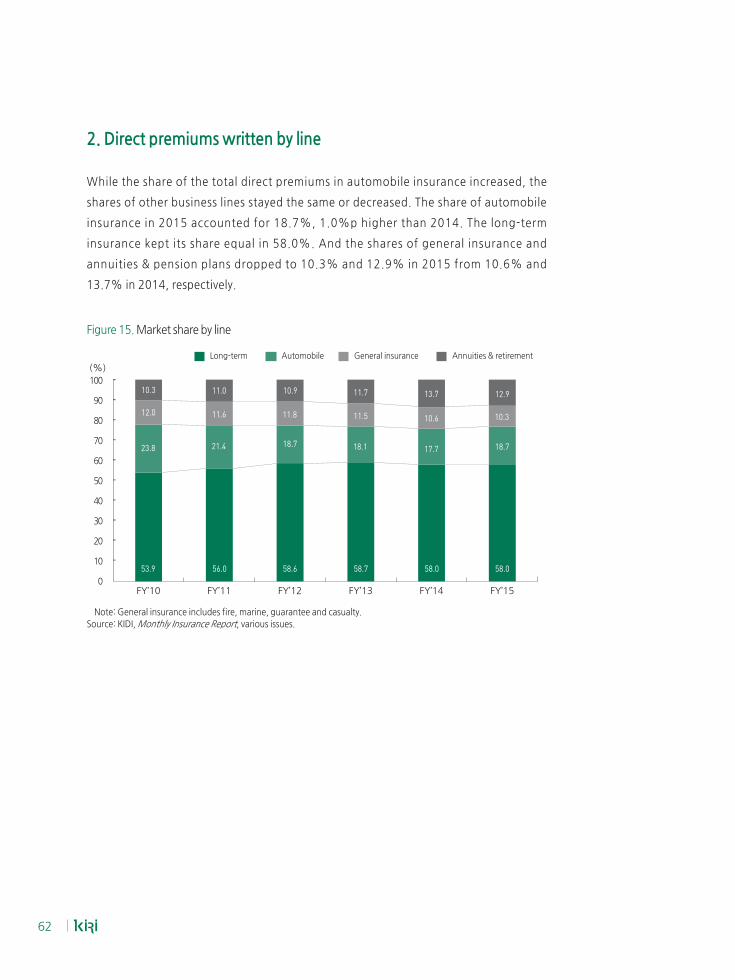
2. Direct premiums written by line
While the share of the total direct premiums in automobile insurance increased, the
shares of other business lines stayed the same or decreased. The share of automobile
insurance in 2015 accounted for 18.7%, 1.0%p higher than 2014. The long-term
insurance kept its share equal in 58.0%. And the shares of general insurance and
annuities & pension plans dropped to 10.3% and 12.9% in 2015 from 10.6% and
13.7% in 2014, respectively.
Figure 15. Market share by line
Long-term Automobile General insurance Annuities & retirement
FY’10 FY’11 FY’12 FY’13 FY’14 FY’15
100
90
80
70
60
50
40
30
20
10
0
-
-
-
-
-
-
-
-
-
-58.0
18.7
10.3
12.9
53.9
23.8
12.0
10.3
56.0
21.4
11.6
11.0
58.6
18.7
11.8
10.9
58.7
18.1
11.5
58.0
17.7
10.6
11.7 13.7
(%)
Note: General insurance includes fire, marine, guarantee and casualty.
Source: KIDI, Monthly Insurance Report, various issues.
Korean Insurance Industry 2016 63
Expenditures
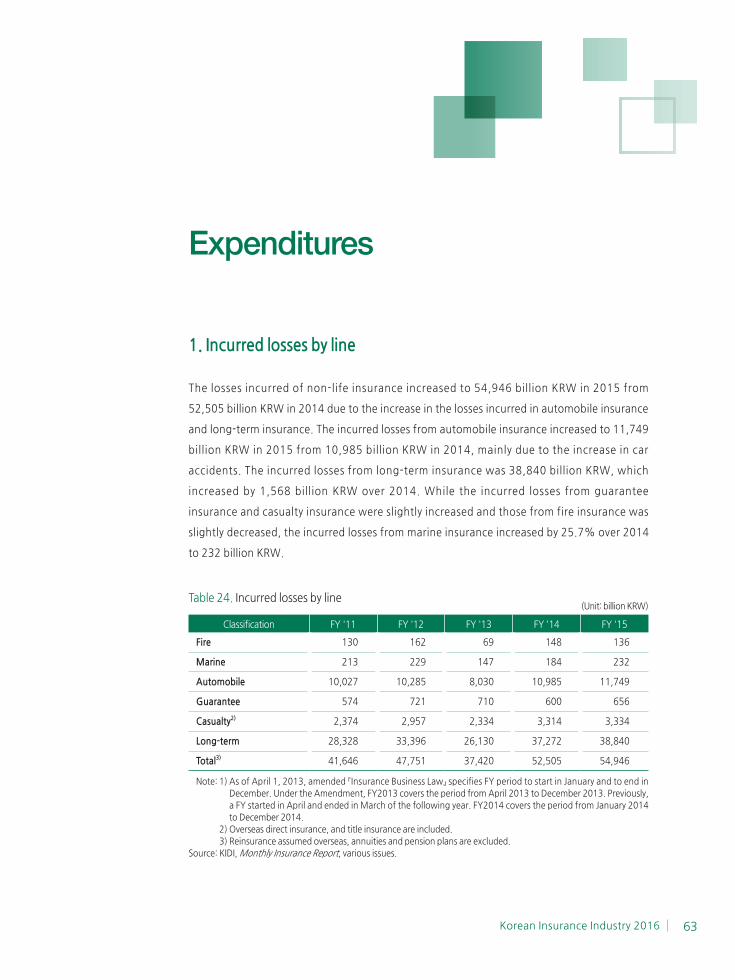
1. Incurred losses by line
The losses incurred of non-life insurance increased to 54,946 billion KRW in 2015 from
52,505 billion KRW in 2014 due to the increase in the losses incurred in automobile insurance
and long-term insurance. The incurred losses from automobile insurance increased to 11,749
billion KRW in 2015 from 10,985 billion KRW in 2014, mainly due to the increase in car
accidents. The incurred losses from long-term insurance was 38,840 billion KRW, which
increased by 1,568 billion KRW over 2014. While the incurred losses from guarantee
insurance and casualty insurance were slightly increased and those from fire insurance was
slightly decreased, the incurred losses from marine insurance increased by 25.7% over 2014
to 232 billion KRW.
Table 24. Incurred losses by line(Unit: billion KRW)
Classification FY '11 FY '12 FY '13 FY '14 FY '15
Fire 130 162 69 148 136
Marine 213 229 147 184 232
Automobile 10,027 10,285 8,030 10,985 11,749
Guarantee 574 721 710 600 656
Casualty2) 2,374 2,957 2,334 3,314 3,334
Long-term 28,328 33,396 26,130 37,272 38,840
Total3) 41,646 47,751 37,420 52,505 54,946
Note:1)AsofApril1,2013,amended『InsuranceBusinessLaw』specifiesFYperiodtostartinJanuaryandtoendin
December. Under the Amendment, FY2013 covers the period from April 2013 to December 2013. Previously,
a FY started in April and ended in March of the following year. FY2014 covers the period from January 2014
to December 2014.
2) Overseas direct insurance, and title insurance are included.
3) Reinsurance assumed overseas, annuities and pension plans are excluded.
Source: KIDI, Monthly Insurance Report, various issues.
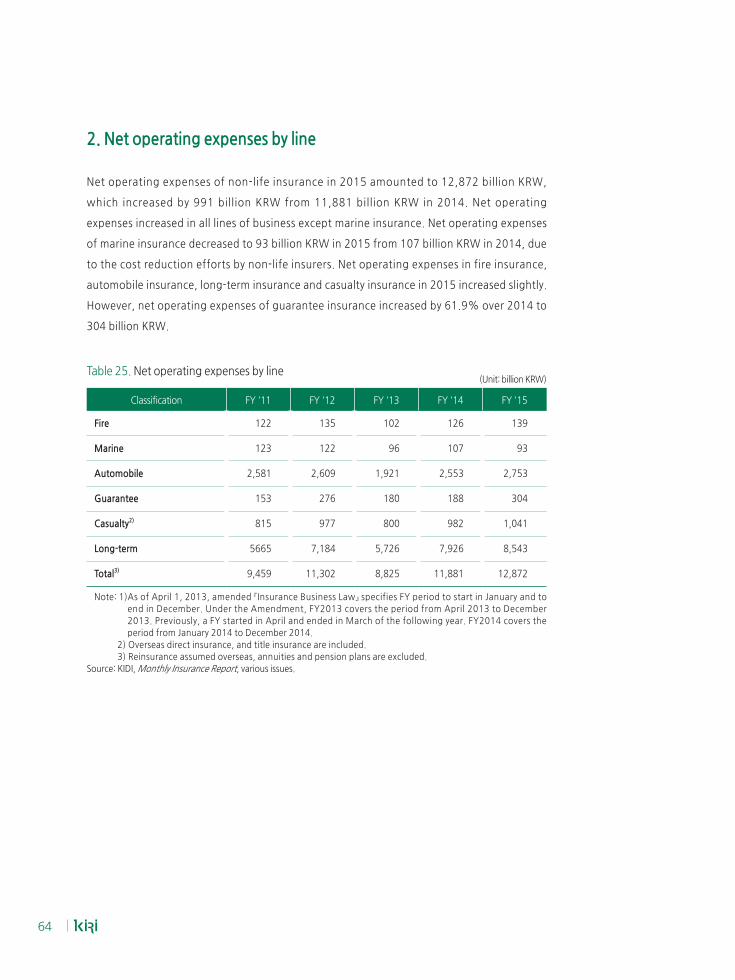
64
2. Net operating expenses by line
Net operating expenses of non-life insurance in 2015 amounted to 12,872 billion KRW,
which increased by 991 billion KRW from 11,881 billion KRW in 2014. Net operating
expenses increased in all lines of business except marine insurance. Net operating expenses
of marine insurance decreased to 93 billion KRW in 2015 from 107 billion KRW in 2014, due
to the cost reduction efforts by non-life insurers. Net operating expenses in fire insurance,
automobile insurance, long-term insurance and casualty insurance in 2015 increased slightly.
However, net operating expenses of guarantee insurance increased by 61.9% over 2014 to
304 billion KRW.
Table 25. Net operating expenses by line(Unit: billion KRW)
Classification FY '11 FY '12 FY '13 FY '14 FY '15
Fire 122 135 102 126 139
Marine 123 122 96 107 93
Automobile 2,581 2,609 1,921 2,553 2,753
Guarantee 153 276 180 188 304
Casualty2) 815 977 800 982 1,041
Long-term 5665 7,184 5,726 7,926 8,543
Total3) 9,459 11,302 8,825 11,881 12,872
Note:1)AsofApril1,2013,amended『InsuranceBusinessLaw』specifiesFYperiodtostartinJanuaryandto
end in December. Under the Amendment, FY2013 covers the period from April 2013 to December
2013. Previously, a FY started in April and ended in March of the following year. FY2014 covers the
period from January 2014 to December 2014.
2) Overseas direct insurance, and title insurance are included.
3) Reinsurance assumed overseas, annuities and pension plans are excluded.
Source: KIDI, Monthly Insurance Report, various issues.
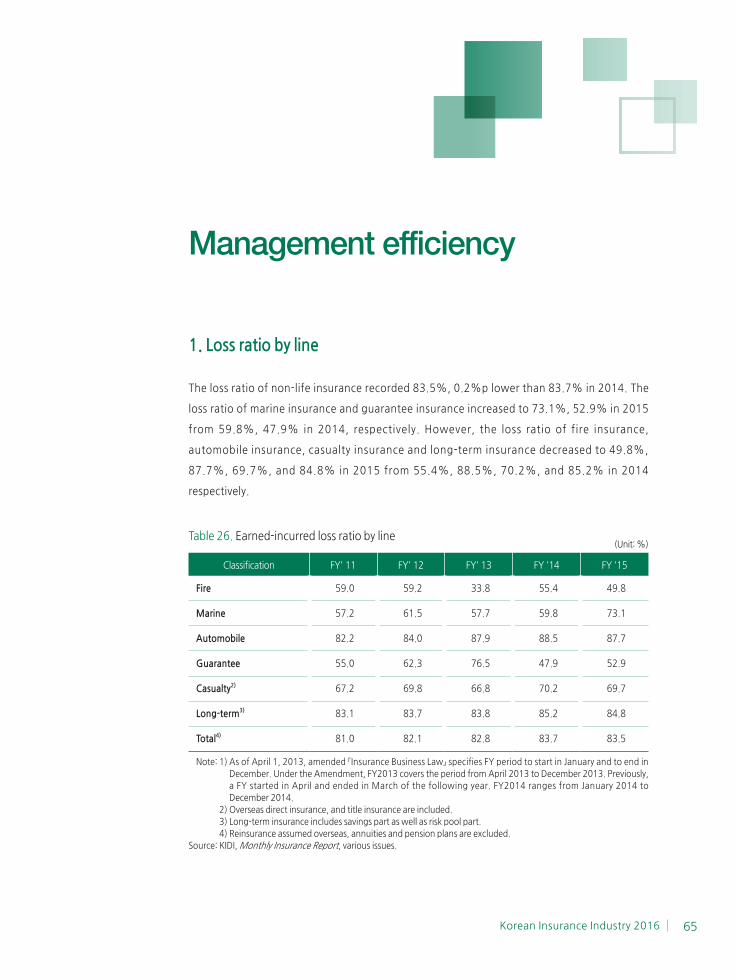
Korean Insurance Industry 2016 65
Management efficiency
1. Loss ratio by line
The loss ratio of non-life insurance recorded 83.5%, 0.2%p lower than 83.7% in 2014. The
loss ratio of marine insurance and guarantee insurance increased to 73.1%, 52.9% in 2015
from 59.8%, 47.9% in 2014, respectively. However, the loss ratio of fire insurance,
automobile insurance, casualty insurance and long-term insurance decreased to 49.8%,
87.7%, 69.7%, and 84.8% in 2015 from 55.4%, 88.5%, 70.2%, and 85.2% in 2014
respectively.
Table 26. Earned-incurred loss ratio by line(Unit: %)
Classification FY' 11 FY' 12 FY' 13 FY '14 FY '15
Fire 59.0 59.2 33.8 55.4 49.8
Marine 57.2 61.5 57.7 59.8 73.1
Automobile 82.2 84.0 87.9 88.5 87.7
Guarantee 55.0 62.3 76.5 47.9 52.9
Casualty2) 67.2 69.8 66.8 70.2 69.7
Long-term3) 83.1 83.7 83.8 85.2 84.8
Total4) 81.0 82.1 82.8 83.7 83.5
Note:1)AsofApril1,2013,amended『InsuranceBusinessLaw』specifiesFYperiodtostartinJanuaryandtoendin
December. Under the Amendment, FY2013 covers the period from April 2013 to December 2013. Previously,
a FY started in April and ended in March of the following year. FY2014 ranges from January 2014 to
December 2014.
2) Overseas direct insurance, and title insurance are included.
3) Long-term insurance includes savings part as well as risk pool part.
4) Reinsurance assumed overseas, annuities and pension plans are excluded.
Source: KIDI, Monthly Insurance Report, various issues.
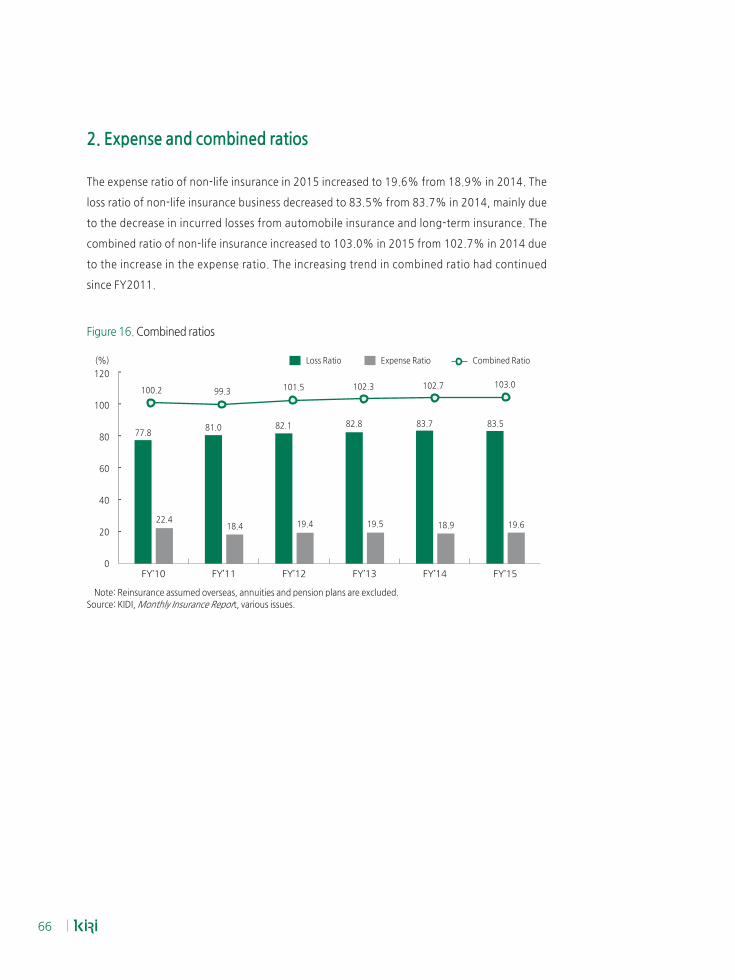
66
2. Expense and combined ratios
The expense ratio of non-life insurance in 2015 increased to 19.6% from 18.9% in 2014. The
loss ratio of non-life insurance business decreased to 83.5% from 83.7% in 2014, mainly due
to the decrease in incurred losses from automobile insurance and long-term insurance. The
combined ratio of non-life insurance increased to 103.0% in 2015 from 102.7% in 2014 due
to the increase in the expense ratio. The increasing trend in combined ratio had continued
since FY2011.
Figure 16. Combined ratios
120
100
80
60
40
20
0
-
-
-
-
-
-
FY’10 FY’11 FY’12 FY’13 FY’14 FY’15
Loss Ratio Expense Ratio Combined Ratio
100.2 99.3 101.5 102.3 102.7 103.0
(%)
77.8
22.4
81.0
18.4
82.1
19.4
82.8
19.5
83.7
18.9
83.5
19.6
Note: Reinsurance assumed overseas, annuities and pension plans are excluded.
Source: KIDI, Monthly Insurance Report, various issues.
Korean Insurance Industry 2016 67
Distribution
1. Market share by distribution channel
The market share of company employees in 2015 was 18.0% of total premium income,
which decreased by 0.3%p over 2014. The key driver of the decrease in the market share of
company employees was the base effect of its increase in 2014. The share of agents in 2015
increased by 1.3%p over 2014 and accounted for 42.5%, which still took the largest one.
The market share of solicitors in 2015 decreased by 0.8%p over 2014 to 27.1%, which had
shown a slowdown for eight years. The share of bancassurance in 2015 recorded 11.2%,
0.6%p lower than 2014. The market shares of brokers and insurance pool were 0.8% and
0.1% respectively, the same as those in 2014.
68
Table 27. Market share by distribution channel (total premium income)(Unit: billion KRW, %)
Year FY '11 FY '12 FY '13 FY '14 FY '15
Company employees9,712(15.9)
10,294(15.0)
8,389(15.6)
13,984(18.3)
14,461(18.0)
Solicitors18,964(31.1)
20,629(30.1)
15,989(29.7)
21,334(27.9)
21,762(27.1)
Agents25,920(42.5)
28,425(41.5)
22,688(42.2)
31,533(41.2)
34,138(42.5)
Brokers442
(0.7) 480
(0.7) 437
(0.8) 618
(0.8) 659
(0.8)
Bancassurance5,833(9.6)
8,629(12.6)
6,194(11.5)
9,003(11.8)
9,019(11.2)
Insurance pool95
(0.2) 85
(0.1) 60
(0.1) 104
(0.1) 56
(0.1)
Total60,965(100.0)
68,542(100.0)
53,758(100.0)
76,575(100.0)
80,249(100.0)
Note:1)AsofApril1,2013,amended『InsuranceBusinessLaw』specifiesFYperiodtostartinJanuaryandto
end in December. Under the Amendment, FY2013 covers the period from April 2013 to December
2013. Previously, a FY started in April and ended in March of the following year. FY2014 covers the
period from January 2014 to December 2014.
2) The premium income of pension plans is included.
3) Company employees include telemarketing (TM) and computer marketing (CM).
Source: KIDI, Monthly Insurance Report, various issues.
2. Numbers of solicitors and insurance agents
The number of solicitors of non-life insurance in 2015 was 156,596, which decreased by
0.04% over 2014. The number of cross-selling solicitors increased to 75,448 in 2015 from
74,363 in 2014. The increase in the number of cross-selling solicitors had continued for two
years. The number of agents decreased by 6.5% to 30,850 in 2015 from 32,995 in 2014. The
decreasing trend had shown since FY2009, as the size of general agencies became bigger.
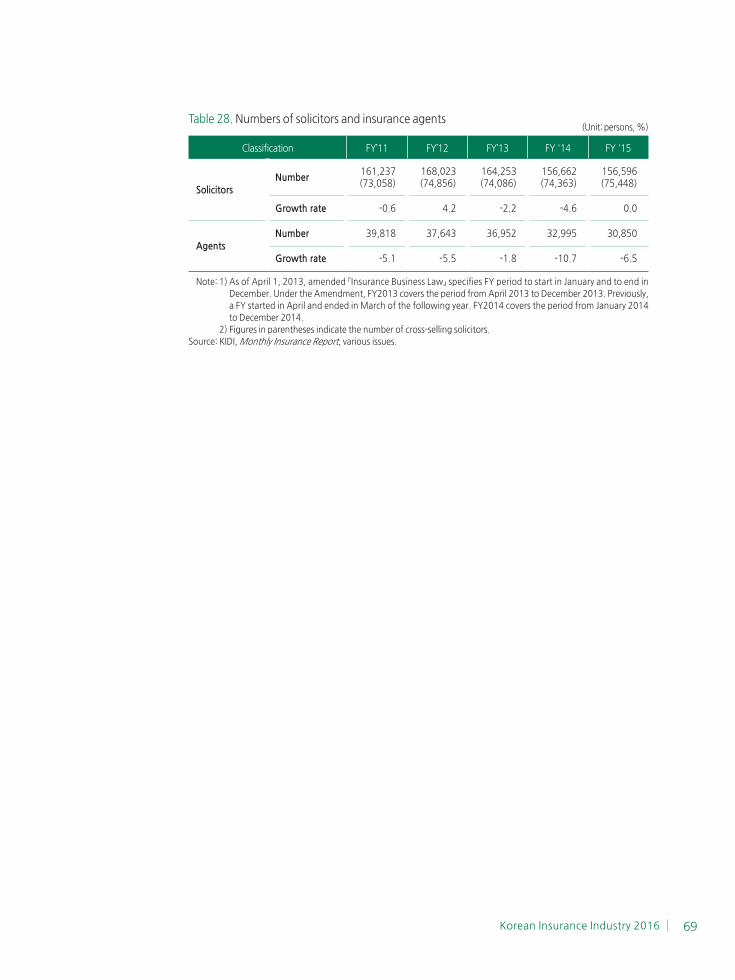
Korean Insurance Industry 2016 69
Table 28. Numbers of solicitors and insurance agents(Unit: persons, %)
Classification FY’11 FY’12 FY’13 FY '14 FY '15
SolicitorsNumber
161,237(73,058)
168,023(74,856)
164,253(74,086)
156,662(74,363)
156,596(75,448)
Growth rate -0.6 4.2 -2.2 -4.6 0.0
AgentsNumber 39,818 37,643 36,952 32,995 30,850
Growth rate -5.1 -5.5 -1.8 -10.7 -6.5
Note:1)AsofApril1,2013,amended『InsuranceBusinessLaw』specifiesFYperiodtostartinJanuaryandtoendin
December. Under the Amendment, FY2013 covers the period from April 2013 to December 2013. Previously,
a FY started in April and ended in March of the following year. FY2014 covers the period from January 2014
to December 2014.
2) Figures in parentheses indicate the number of cross-selling solicitors.
Source: KIDI, Monthly Insurance Report, various issues.

KOREANINSURANCE
INDUSTRY2016
Insurance regulations and
supervision
Insurance regulations
Supervision of insurance companies
Changes in supervisory regulations of
insurance business in 2015-2016
72
Insurance regulations 29)
1. Insurance business law and related laws
The『InsuranceBusinessLaw』anditsrelevantenforcementregulationsconstitutetheKorean
legalsystemforinsurance.SinceitspromulgationonJanuary15,1962,the『Insurance
BusinessLaw』wasrevisednumeroustimestoreflectthechangesinfinancialenvironment
and international regulatory trends.
In2010,the『InsuranceBusinessLaw』wasamendedtostrengthenconsumerprotection.The
explanation about the key provisions of insurance contracts and the consumers’
acknowledgement became mandatory. Also, the amended law helped insurers to be
informed of their consumers’ financial situation and to recommend appropriate products,
which suited consumers’ interests best. Besides, the product development process was
simplified, so that insurers were allowed not to have regulatory filing (use without file) for
certain products that meet certain regulatory requirements.
In August 2010, as a preparatory measure to introduce the risk based capital (RBC) for
insurers, the Financial Supervisory Service (FSS) 30) began to conduct a pre-assessment of
internal models of several insurance companies. As of April 2011, the RBC regime was fully
implemented.Andin2011,theenforcementdecreeofthe『InsuranceBusinessLaw』were
revised to enhance risk management abilities of insurers.
In2012,theenforcementdecreeofthe『InsuranceBusinessLaw』wasrevisedtoreflectthe
changein『AgriculturalCo-operativeLaw』.As『AgriculturalCo-operativeLaw』wasrevisedto
29) This section is extracted from the publications of Financial Supervisory Service (FSS).
30) The insurance subsidiaries are called NongHyup Life Insurance Co Ltd and NongHyup Property & Casualty
Insurance Co Ltd.
Korean Insurance Industry 2016 73
split the whole organization into farming business and financial service, a financial holding
company was formed with banking, investment, and life and non-life insurance subsidiaries 31).
Theinsurancesectionofthe『KoreanCommercialCode』,ortheinsurancecontractlawwas
amended on March 11, 2014, and the amendment was in effect on March 12, 2015. The
amendment added new provisions on guaranty and health insurance, as well as clarification
of the requirements for group insurance. Also, to protect the disabled and the family
members of a decedent, subrogation against family members was prohibited. The
amendment required for obligatory explanation on the terms of the insurance contract and
indicated the responsibility of insurance agents.
2. Financial Investment Services and Capital Market Act
The『FinancialInvestmentServicesandCapitalMarketAct』(FSCMA)wasinitiallyenactedby
the National Assembly in July 2007 and took into effect as of February 4, 2009. The act aimed
toreformulatethelegalframeworkoftheKoreancapitalmarket,onwhich『Securitiesand
ExchangeAct』of1962,hadbeenthemainlegislation.
The major changes for legislation:
•Shifting to functional regulation
•Introducing a comprehensive system
•Expanding business scope
•Upgrading investor protection mechanism
Shifting to functional regulation left financial products or services with the same function to
become subject to the same regulatory treatment regardless of financial sectors the products
are provided. Financial investment companies can engage in multiple areas of business such
as dealing, brokerage, and asset management provided some of information barrier
requirements are satisfied.
The act provided the measures to enhance investor protection by classifying investors into
two groups, ordinary and professional; and the measures were more inclined to protect the
31) The insurance subsidiaries are called NongHyup Life Insurance Co Ltd and NongHyup Property & Casualty
Insurance Co Ltd.
74
former. In addition, the rules; such as the prohibition of unsolicited calls, the prohibition of
misleading investors with uncertain matters, the adoption of cooling-off period and the duty
to manage conflicts of interest; were both applicable to ordinary and professional investors.
On November 5, 2012, the Financial Services Commission (FSC) announced that the
regulations on financial investment business would be amended as there had been ongoing
concerns regarding the practice of fund distribution.
The amendment included the provisions that prohibit insurance companies from outsourcing
more than 50% of their variable insurance assets to affiliated asset managers within the
same business group. The restriction on outsourcing to affiliated fund managers became
effective as of January 1, 2014.
3. Entry Regulation
Only stock corporations, mutual companies, and licensed foreign insurers are allowed to
enter into insurance business with appropriate regulatory permission granted by the FSC.
There are three different insurance licenses for life, non-life, and the so-called ‘third
insurance’. 32)
(a) Capital requirement
The minimum capital required for insurance business is 30 billion KRW. Given that, when any
insurer intends to engage in a single-line insurance business, the amount of the paid-in
capital or funds should be no less than 5 billion KRW.
•Life insurance: 20 billion KRW
•Annuity (including pension): 20 billion KRW
•Fire insurance: 10 billion KRW
•Marine insurance: 15 billion KRW
•Automobile insurance: 20 billion KRW
32) The term the ‘third insurance’ refers to the gray zone of insurance business with characteristics and features of
both life and non-life insurance policies.
Korean Insurance Industry 2016 75
•Guaranty insurance: 30 billion KRW
•Reinsurance: 30 billion KRW
•Liability insurance: 10 billion KRW
•Engineering insurance: 5 billion KRW
•Real-estate right insurance: 5 billion KRW
•Accident insurance: 10 billion KRW
•Sicknessinsurance: 10 billion KRW
•Long-term care insurance: 10 billion KRW
•Other insurance business: 5 billion KRW
However, if insurers subscribe more than 90% of total contracts or premiums using
telephone, mail, or electronic communications, they can enter into an insurance business
with two thirds of the paid-in capital or funds amount above.
(b) Business funds to be paid by foreign insurers
When foreign insurers aim to engage in the insurance business in Korea, the amount of the
paid-in funds should be no less than 3 billion KRW
(c) Other requirements for permission
• Insurers are required to have adequate professional manpower and physical facilities,
including computer equipment to carry on the intended insurance business
•Insurer’s business plan is required to be feasible and sound
• Significant owners are required to possess financial capability to carry on the business
and have financial soundness and social credit
(d) Maintenance of manpower and physical facilities
Insurers should maintain adequate professional manpower and physical facilities, which can
be waived only by the approval of the FSC with proper measures to protect policyholders and
maintain financial soundness of insurers.
76
4. Product Regulation
Insurers are required to make basis documents on the insurance products. When insurers are
making or changing basis documents, the insurers are required to file to the FSC in one of the
following cases.
• New products are introduced by making a new law or changing the law or the purchase
of the insurance product is mandatory.
• The products are sold through financial institutions or bancassurnace except in the case
where the change is only on the insurance rates.
•Products are covering new risks never covered or sold by by any insurers before.
• The products are subsidized by the central or local government by the law covering risk
related the agriculture, aquaculture, forestry, or floods.
• The FSC may request insurers to file the basis document of the products in order to
protect policyholders.
Korean Insurance Industry 2016 77
Supervision of insurance companies 33)
1. Prudential regulations
All insurers must possess a solvency ratio of 100% or higher to ensure that they have an
adequate capital to support the risks they undertake and to meet the insurers’ obligations to
policyholders. They must also classify their assets according to their soundness and set up
mandatory allowances for bad assets to provide for a capital buffer to prepare for adverse
losses such as the decline in the value of the assets.
(a) Risk based capital (RBC)
In April 2009, the risk based capital (RBC) 34) replaced the old solvency regime based on EU’s
SolvencyⅠ 35) model that had been used for the previous decade. To ensure a smooth
transition, supervisory authority allowed capital ratios calculated under both old solvency
regime and new RBC regime until March 2011. Accordingly, the RBC regime has been fully
implemented since April 2011.
In terms of components of the RBC, available capital is the capital amount that an insurer
maintains in excess of its liabilities as solvency surplus against unexpected future payment
obligations and other contingencies. It is computed as the difference between i) the sum of
contributed capital 36) retained earnings, capital adjustment accounts, and reserves in the
33)Source:FinancialSupervisoryService(FSS),『FSSHandbook2014』
34) The RBC regime is in line with the international trend and enables a proper measurement of insurance risk,
market risk, interest rate risk, credit risk, and operating risk.
35)TheEUsolvencyⅠregimehasseverallimitationssuchasaninaccuratemeasurementofassetriskand
insurance risk and no recognition of duration mismatch.
36) Legal capital (paid-in capital and additional paid-in capital).
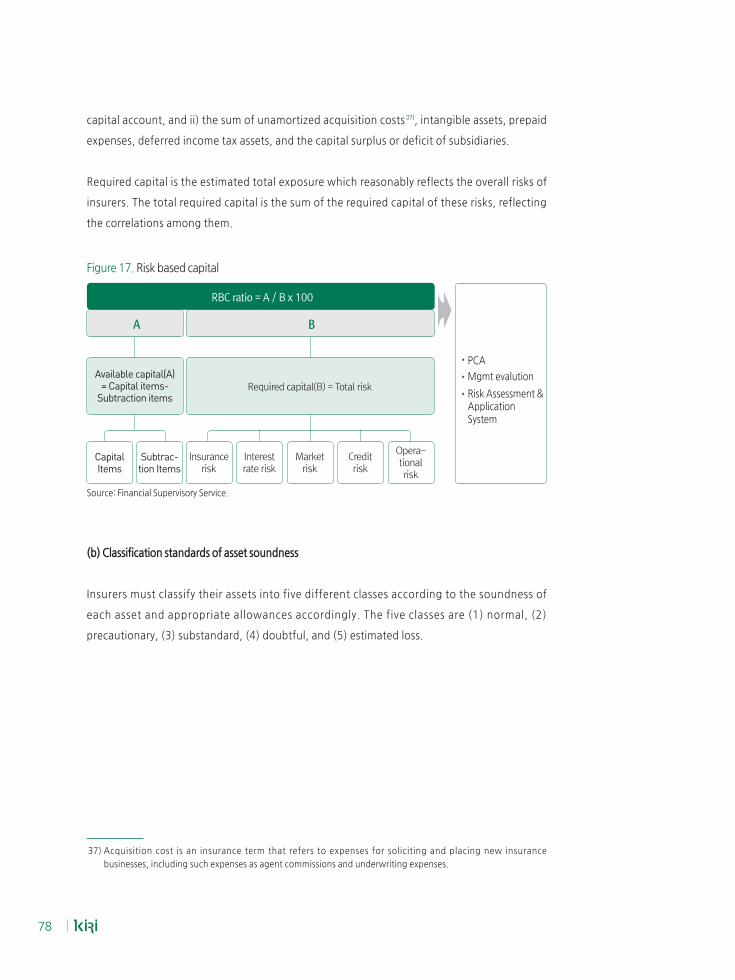
78
capital account, and ii) the sum of unamortized acquisition costs 37), intangible assets, prepaid
expenses, deferred income tax assets, and the capital surplus or deficit of subsidiaries.
Required capital is the estimated total exposure which reasonably reflects the overall risks of
insurers. The total required capital is the sum of the required capital of these risks, reflecting
the correlations among them.
Figure 17. Risk based capital
Available capital(A)= Capital items-
Subtraction items
Capital Items
Subtrac-tion Items
Risk Assessment & Application System
PCA
Mgmt evalution
Source: Financial Supervisory Service.
(b) Classification standards of asset soundness
Insurers must classify their assets into five different classes according to the soundness of
each asset and appropriate allowances accordingly. The five classes are (1) normal, (2)
precautionary, (3) substandard, (4) doubtful, and (5) estimated loss.
37) Acquisition cost is an insurance term that refers to expenses for soliciting and placing new insurance
businesses, including such expenses as agent commissions and underwriting expenses.
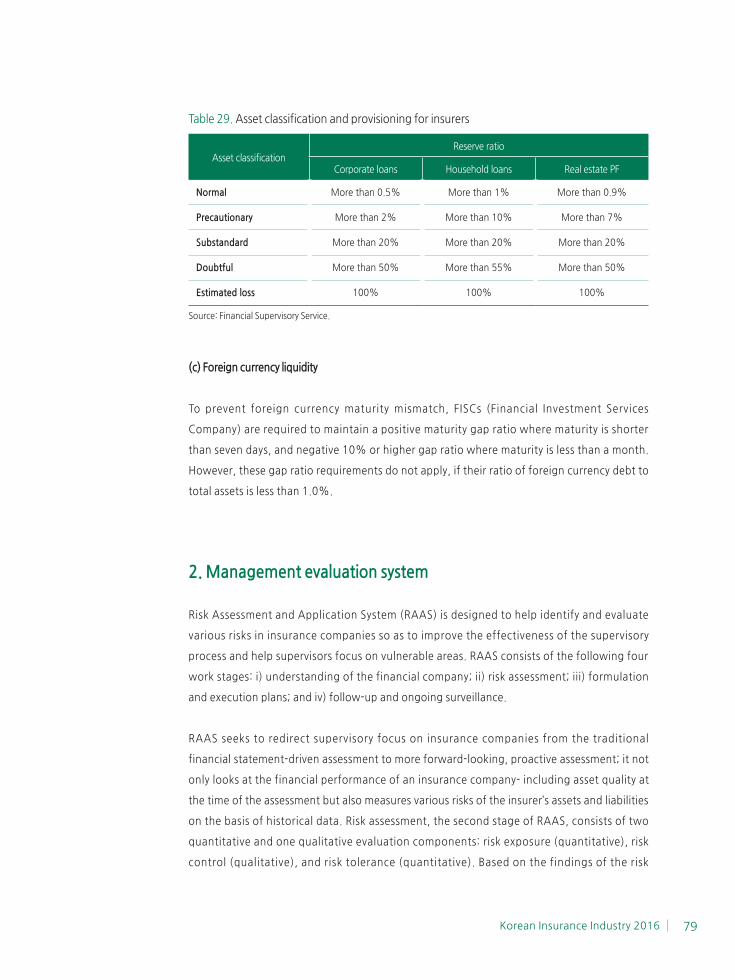
Korean Insurance Industry 2016 79
Table 29. Asset classification and provisioning for insurers
Asset classification Reserve ratio
Corporate loans Household loans Real estate PF
Normal More than 0.5% More than 1% More than 0.9%
Precautionary More than 2% More than 10% More than 7%
Substandard More than 20% More than 20% More than 20%
Doubtful More than 50% More than 55% More than 50%
Estimated loss 100% 100% 100%
Source: Financial Supervisory Service.
(c) Foreign currency liquidity
To prevent foreign currency maturity mismatch, FISCs (Financial Investment Services
Company) are required to maintain a positive maturity gap ratio where maturity is shorter
than seven days, and negative 10% or higher gap ratio where maturity is less than a month.
However, these gap ratio requirements do not apply, if their ratio of foreign currency debt to
total assets is less than 1.0%.
2. Management evaluation system
Risk Assessment and Application System (RAAS) is designed to help identify and evaluate
various risks in insurance companies so as to improve the effectiveness of the supervisory
process and help supervisors focus on vulnerable areas. RAAS consists of the following four
work stages: i) understanding of the financial company; ii) risk assessment; iii) formulation
and execution plans; and iv) follow-up and ongoing surveillance.
RAAS seeks to redirect supervisory focus on insurance companies from the traditional
financial statement-driven assessment to more forward-looking, proactive assessment; it not
only looks at the financial performance of an insurance company- including asset quality at
the time of the assessment but also measures various risks of the insurer’s assets and liabilities
on the basis of historical data. Risk assessment, the second stage of RAAS, consists of two
quantitative and one qualitative evaluation components: risk exposure (quantitative), risk
control (qualitative), and risk tolerance (quantitative). Based on the findings of the risk
80
assessment, a composite rating is assigned to each insurer using a scale of 1 to 5 to indicate
the overall status of an insurer’s risk.
The results of the risk assessment under RAAS are not publicly disclosed but used as internal
data for supervisory purposes, including prompt corrective actions (PCA) for management
improvement recommendations, requirements, or orders depending on the outcome of the
evaluation.
3. Restrictions on investments of insurers
Premiums paid by the policyholders make up the bulk of insurers' assets, which are mostly
appropriated as reserves to meet the insurers' future liabilities and benefit obligations.
Prudent and sound management of insurers' assets are essential to protect the policyholders.
Asset management is important to ensure safety, liquidity, profitability, and public interest of
the assets. According to the insurance-related laws and regulations, the regulations on the
asset management of insurance companies prohibit certain types of asset operation.
Insurance companies are restricted from the following activities:
• Acquisition of non-business-purpose real estate holdings
• Lending intended for speculation in securities
• Lending intended for acquisition of its own shares
• Lending intended to fund political activities
• Lending to the officers or employees
• Any activity that undermines the safety and soundness of the company assets
In order to prevent the extension of disproportionate support by an insurer to its own
business group and the spread of investment risks, investment limit and its investment
categories of insurance companies are restricted as follows:
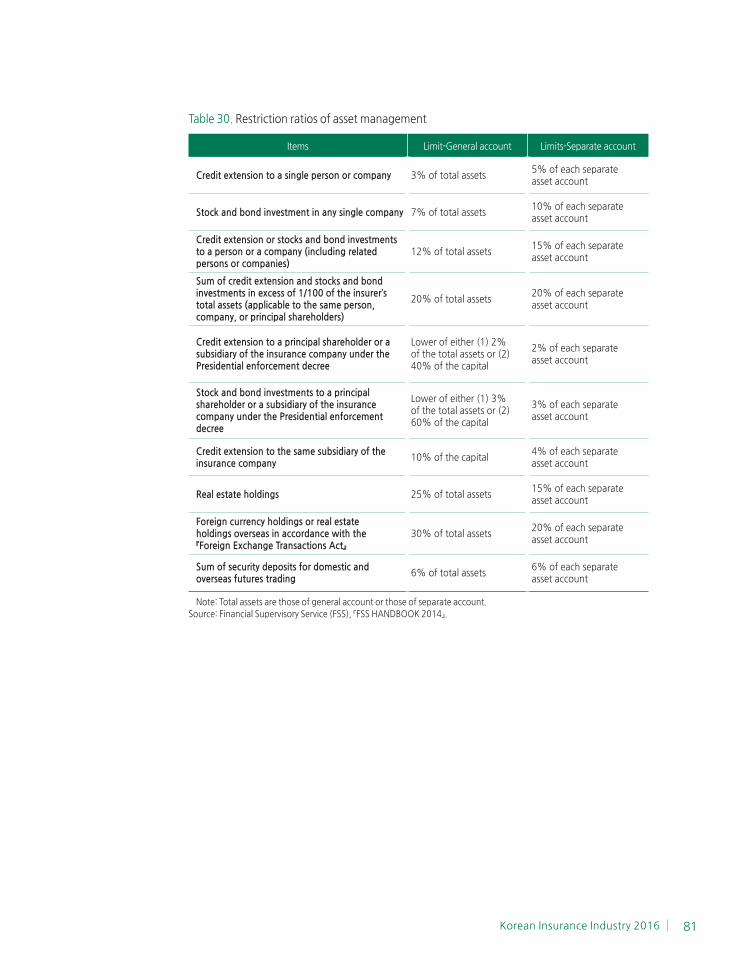
Korean Insurance Industry 2016 81
Table 30. Restriction ratios of asset management
Items Limit-General account Limits-Separate account
Credit extension to a single person or company 3% of total assets5% of each separate asset account
Stock and bond investment in any single company 7% of total assets10% of each separate asset account
Credit extension or stocks and bond investments to a person or a company (including related persons or companies)
12% of total assets15% of each separate asset account
Sum of credit extension and stocks and bondinvestments in excess of 1/100 of the insurer’s total assets (applicable to the same person, company, or principal shareholders)
20% of total assets20% of each separate asset account
Credit extension to a principal shareholder or a subsidiary of the insurance company under the Presidential enforcement decree
Lower of either (1) 2% of the total assets or (2) 40% of the capital
2% of each separate asset account
Stock and bond investments to a principal shareholder or a subsidiary of the insurance company under the Presidential enforcement decree
Lower of either (1) 3% of the total assets or (2) 60% of the capital
3% of each separate asset account
Credit extension to the same subsidiary of the insurance company
10% of the capital4% of each separate asset account
Real estate holdings 25% of total assets15% of each separate asset account
Foreign currency holdings or real estate holdings overseas in accordance with the『Foreign Exchange Transactions Act』
30% of total assets20% of each separate asset account
Sum of security deposits for domestic and overseas futures trading
6% of total assets6% of each separate asset account
Note: Total assets are those of general account or those of separate account.
Source:FinancialSupervisoryService(FSS),『FSSHANDBOOK2014』.
82
4. Corporate governance
•Outside directors
The board of directors of insurance companies whose assets exceed 5 trillion KRW must
appoint three or more outside directors, and more than a half the number of board members
must be outside directors. The board of directors of insurance companies whose assets do not
exceed 5 trillion KRW but exceed 3 trillion KRW must appoint at least one fourth of outside
directors. 38)
•Audit committee
Insurance companies whose assets exceed 5 trillion KRW must establish an audit committee.
The audit committee must comprise at least three directors, and at least two thirds of the
number of its members must be outside directors. And at least one of members should
possess expertise in accounting or finance.
•Compliance officer & risk manager
Insurance companies must appoint a compliance officer & a risk manager who possess
knowledge and expertise to fulfill their duties. The appointment and dismissal of the
compliance officer & risk manager must be approved by the board of directors, and dismissal
requires at least two third votes of board members in order to ensure the independence from
the management of the company.
38)Bythe『KoreanCommercialCode』,alistedcompanyshouldappointatleastonefourthofitsboardmembersas
outside directors and a listed company with assets exceeding 2 trillion KRW should appoint three or more
outside directors, and more than a half the number of board members must be outside directors.
Korean Insurance Industry 2016 83
1. Amendments to the 『Enforcement Decree of the Insurance Business Act』 39)
OnJuly15,2014,FSCannouncedtheimplementationofthe『MeasurestoReformand
ImproveInsuranceBusiness』.Asafollow-up,theKoreangovernmenthaspreparedlegislative
billstoamendthe『EnforcementDecreeoftheInsuranceBusinessAct』.
•Disclosures on conditions and adjustments related to the insurance proceeds payment
Written explanations related to conditions and adjustments to the insurance proceeds
payment are included as one of the required disclosures, such as product descriptions and
subscription plans, in insurance information materials provided to consumers.
This amendment will allow insurance policyholders to better understand the terms and
conditions related to the insurance proceeds payment under insurance products during the
policy subscription phase.
•Permitted image advertisements for insurance products
Insurers are permitted to launch image advertisements for their insurance products so long as
the advertisements do not specifically describe the detailed terms and conditions of an
insurance product, such as insurance premiums, proceeds, and so on.
39) Kim & Chang (2015.04), Newsletter.
Changes in supervisory regulations of insurance business in 2015-2016
84
AsofJanuary20,2015,the『EnforcementDecreeoftheInsuranceBusinessAct』regarding
image advertisements became effective and the specific requirements for image
advertisementsareseparatelyprovidedbytheamended『RegulationontheSupervisionof
InsuranceBusiness』.
2. Amendments to the 『Regulation on Supervision of Insurance Business』 40)
OnNovember 24, 2015, the FSC announced amendments to the 『Regulation on the
SupervisionofInsuranceBusiness』.TheamendmentsareeffectiveasofJanuary1,2016.
With the proposed amendments, the standard interest rate that insurance companies may
use in setting policy reserves are to be abolished, enabling insurance companies to set the
insurance premiums with more discretion.
Moreover, the range of the interest rates that insurance companies may apply in determining
the benefit amount for interest rate-linked insurance products are to be widen from the
current ±20% to ±30% in 2016 and to be phased out in 2017.
The safety margin, the caps on loss adjustment to premiums for insurance products designed
to underwrite new risks or cover not readily insurable consumers are to be raised from the
current ±30% to ±50% in 2016 and to be phased out in 2017.
The caps on risk adjustment that may be made when setting insurance premiums is to be
raised from the current ±25% to ±30% in 2016 and to ±35% in 2017 and to be conditionally
phased out in 2018.
40) Financial Supervisory Service (2015.11.24), Laws and Regulations Announcement.
KOREANINSURANCE
INDUSTRY2016
Insurance industry issues
Adjusting to low growth & strengthening risk
management
Systematic response to financial reform
Seeking growth strategy for small and
medium-sized insurers
Strategic reaction to IFRS4 Phase II
Dealing with financial convergence &
integration
86
The Korea Insurance Research Institute proposes five key issues that the Korean insurance
industry should consider in 2016: i) adjusting to low growth & strengthening risk
management, ii) systematic response to financial reform, iii) seeking growth strategy for
small and medium-sized insurers, iv) strategic reaction to IFRS4 Phase II, and v) dealing with
financial convergence & integration.
1. Adjusting to low growth & strengthening risk management
After financial crisis in 2008, Korean insurers’ profitability has deteriorated and the growth has
slowed down. Insurers’ return on equity has continuously decreased, and especially profitability
of life insurers has significantly declined. For 10 years from 2004, ROE of life insurers has
lowered from 19% to 6% and that of non-life insurers has lowered from 21% to 9%.
The Korean insurers’ profitability has been deteriorated due to prolonged low growth and
aging population, technology changes, and regulations. In order for insurers to cope with such
a harsh business environment, insurers should change management strategies.
The management strategies are divided by survival strategy and growth strategy. For the
survival strategy, which should be carried out immediately, more capital should be raised to
strengthen the financial soundness responding to the introduction of IFRS Phase II. On the
other hand, for the growth strategy as a medium to long-term point of view, the variable
annuities business, asset management services, and the overseas operation should be
enforced.
Insurance industry issues
Korean Insurance Industry 2016 87
The Korean insurers’ should reestablish product development and asset management strategy
under the ERM framework (enterprise risk management). For product development, the types
and quality of products should be strategically differentiated to meet the diverse consumer
demand. For asset management, Liability-Driven Investment (LDI) strategy should be
established to improve profitability amid prolonged low interest rate environment, while
financial stability still being maintained.
2. Systematic response to financial reform
(a) Improving rating skills in general insurance
The Korean general insurance market has been stagnant due to the low growth of the
economy. In 2014, the growth rate of Korean general insurance was -0.3%. Recently, the
size of technology and marine insurance has been decreased due to the downturn of
construction and marine industry
As general insurance usually use agreement rates quoted by reinsurers, it hinders
improvement of rating skills. When insurers use agreement rates, they are exempt from filing
and therefore need not to assess the risks.
Large insurers can take a lead during negotiations with the reinsurers based on the scale and
rate calculation ability. On the other hand, small and medium-sized insurers lack the ability to
evaluate the risks and have a difficulty in rate calculation.
To improve rating skills, insurers should strengthen the self-reliance and internal control
capabilities. Moreover, insurers should present the optimal price after assessing the risks and
reviewing various rates.
(b) Reputation through fair trade and promotion to understanding of insurance
Overall policy adjustment is needed to establish healthy distribution channels and ultimately
improve consumer confidence by strengthening the responsibility of large distribution
channels.
88
Consumer’s confidence on the Korean insurers has been relatively low. As price controls in
the Korean insurance market persisted, insurers focused on the expansion of size through the
sales force and consequently market order of fair trading has been deteriorated. Therefore,
improvement on this issue is urgent to restore consumer confidence.
Especially, some of the large corporative distribution channels are to be blamed to disrupt
market order. Taking advantage of the absence of regulations on agent responsibility, these
agencies engage in the unhealthy business practices keeping their own benefits ahead of
consumers’.
To strengthen the agent responsibility, in the short-term, obligation for general consultation
(consultations during contract negotiation and before signing the contracts) before
explanation of the contracts, should be imposed. Moreover, the proof of observing the
obligation for general consultation and explanation for the contracts should be required to
distribution channels.
In the medium to long-term, in order to minimize distribution channels’ moral hazard,
regulation should be restructured to directly impose direct sales responsibility to actual sellers
when insurers delegate sales of insurance products.
3. Seeking growth strategy for small and medium-sized insurers
The competition among insurers in a limited market are expected to intensify due to market
saturation amid prolonged low growth. Recent market conditions and financial reform will
make business environment harsher to small and medium-sized insurers.
Therefore, the small and medium-sized insurers should redefine their competitiveness based
on their own strength and should find ways to overcome size handicap through M&A.
The small and medium-sized insurers should highlight the unique competitiveness in the field
of product development, asset management, and distribution channels.
Moreover, appropriate business models with associate partners, such as external distribution
channels, other insurers, and other financial companies, are needed. Cooperation by building
capital alliance or joint business model should be strengthened.
Korean Insurance Industry 2016 89
4. Strategic reaction to IFRS4 Phase II
In IFRS 4 phase I, the current insurance accounting standard, insurance liabilities are assessed
at cost. However, new insurance accounting standard (IFRS 4 phase II), which assesses the
insurance liability in market price, is expected be in effect from 2020.
In IFRS 4 phase II, future profits, which are evaluated in market value, are marked as the
insurance liabilities while future deficits, such as deficits from reverse interest margin, are
recognized immediately as losses.
Prior to the IFRS 4 phase II enforcement, system and the manpower should be established
and overall business process from profit and loss management to asset management to risk
management should be enhanced to meet market value assessment of liabilities.
The insurers should establish a concrete capital expansion plan, as capital is expected to be
reduced with the adoption of market price valuation system.
To ensure soft landing of insurers to new accounting standard together with a stronger
prudential regulation, transparency should be improved from the planning stage. System
planning stage for IFRS 4 phase II should also accommodate the special case such as legacy
contract issues.
5. Dealing with financial convergence and integration
(a) Corresponding to the financial convergence and integration
The integration of technology and finance, such as Internet Only Bank, financial
convergence, such as Individual Savings Account (ISA), and complex branch have been
accelerated.
For example, complex branches enable customers to go one stop shopping for various
financial services from banking to insurance to securities. Mostly banking branches host
marketing section for insurance and securities companies inside. ISA combines savings and
investment products with the benefits of tax-exemption.
90
The convergence and integration of banking and insurance will intensify the competition
between on and off-line. In particular, the competition in the insurance market is expected to
be intensified with more channels available for consumers.
As the sales competition of insurance products and complex products seems to be
intensified, product development and marketing strategy need to be changed accordingly.
Insurers should increase product competitiveness through strengthening the capabilities of
risk evaluation.
Moreover, to compete with the Individual Saving Account, investment-linked insurance
products, reflecting various fee structure, need to be developed. Also, insurers should
expand bancassurance channel as well as online channel. Products sold through online
channel should be simple and affordable so that consumer can easily understand and
purchase.
(b) Take advantage of the fintech
Introduction of fintech to the insurance market creates new values by triggering the changes
in the business system from product development to insurance payments.
In the product development and rate calculation stage, fintech helps develop new products
and calculate appropriate premiums by obtaining basic data. Fintech also makes a new
analysis possible on the insurance needs of individuals and potential to meet them for
insurers. In the sales and marketing stage, fintech helps capture new and potential customers
and vitalize insurance sales through diverse platforms, including online and mobile channels.
In the underwriting stage, fintech helps develop a more advanced system to review insurance
application and determine whether to approve it. In the contract management stage, fintech
helps improve profitability and customer loyalty through the introduction of contract
continuation rate and loss ratio management program. In the insurance payment stage,
fintech also helps improve the process of settlement by enhancing the efficiency of claims
system and insurance fraud detection and prevention.
Supervisors should construct an environment to encourage fintech development through the
improvement of the regulation. Insurers should also make an effort to create consumer
needs, to take advantage of the ICT, and to improve the information security.

KOREANINSURANCE
INDUSTRY2016
Appendix
Standards for classification of types (contracts)
of insurances
Profiles of insurance companies
Websites
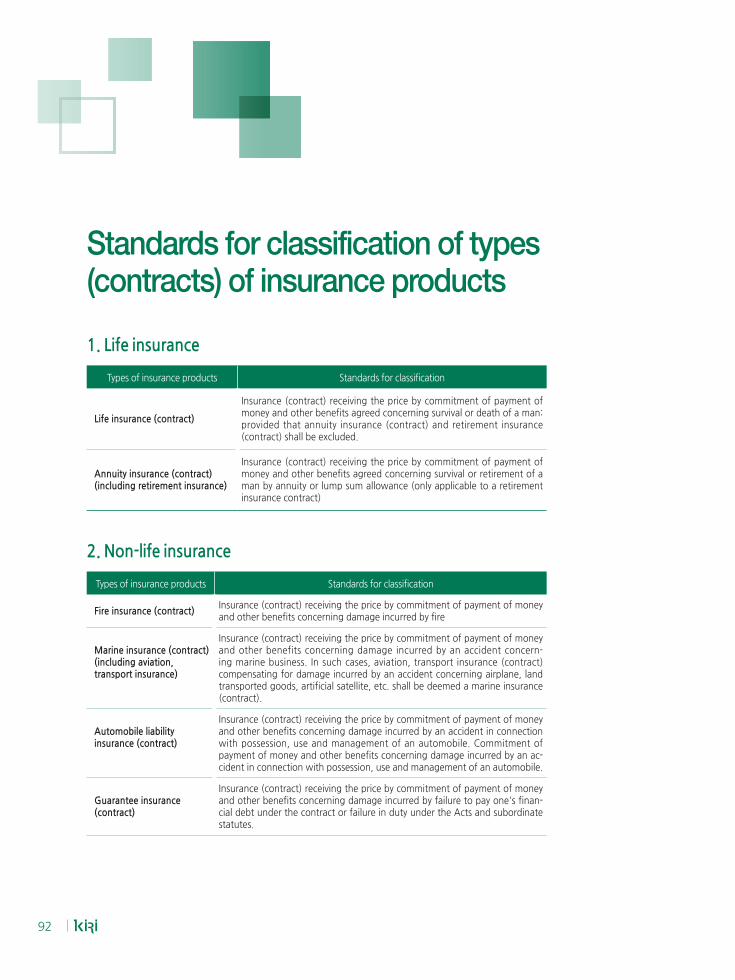
92
1. Life insurance
Types of insurance products Standards for classification
Life insurance (contract)
Insurance (contract) receiving the price by commitment of payment of money and other benefits agreed concerning survival or death of a man: provided that annuity insurance (contract) and retirement insurance (contract) shall be excluded.
Annuity insurance (contract)(including retirement insurance)
Insurance (contract) receiving the price by commitment of payment of money and other benefits agreed concerning survival or retirement of a man by annuity or lump sum allowance (only applicable to a retirement insurance contract)
2. Non-life insurance
Types of insurance products Standards for classification
Fire insurance (contract)Insurance (contract) receiving the price by commitment of payment of money and other benefits concerning damage incurred by fire
Marine insurance (contract)(including aviation, transport insurance)
Insurance (contract) receiving the price by commitment of payment of money and other benefits concerning damage incurred by an accident concern-ing marine business. In such cases, aviation, transport insurance (contract) compensating for damage incurred by an accident concerning airplane, land transported goods, artificial satellite, etc. shall be deemed a marine insurance (contract).
Automobile liability insurance (contract)
Insurance (contract) receiving the price by commitment of payment of money and other benefits concerning damage incurred by an accident in connection with possession, use and management of an automobile. Commitment of payment of money and other benefits concerning damage incurred by an ac-cident in connection with possession, use and management of an automobile.
Guarantee insurance (contract)
Insurance (contract) receiving the price by commitment of payment of money and other benefits concerning damage incurred by failure to pay one's finan-cial debt under the contract or failure in duty under the Acts and subordinate statutes.
Standards for classification of types (contracts) of insurance products
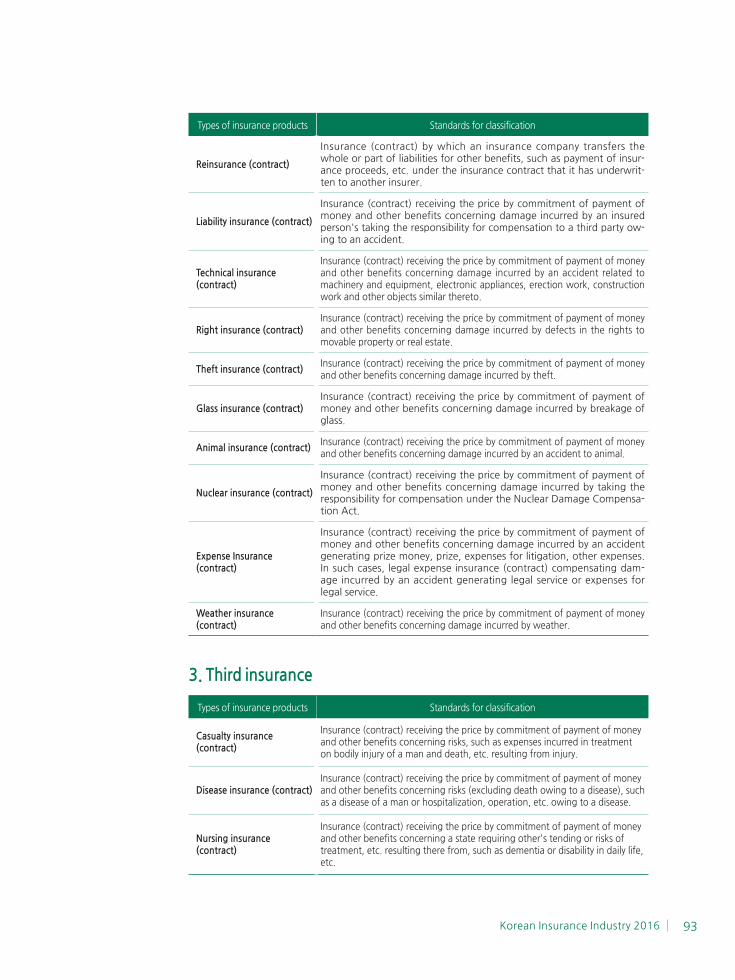
Korean Insurance Industry 2016 93
Types of insurance products Standards for classification
Reinsurance (contract)
Insurance (contract) by which an insurance company transfers the whole or part of liabilities for other benefits, such as payment of insur-ance proceeds, etc. under the insurance contract that it has underwrit-ten to another insurer.
Liability insurance (contract)
Insurance (contract) receiving the price by commitment of payment of money and other benefits concerning damage incurred by an insured person's taking the responsibility for compensation to a third party ow-ing to an accident.
Technical insurance (contract)
Insurance (contract) receiving the price by commitment of payment of money and other benefits concerning damage incurred by an accident related to machinery and equipment, electronic appliances, erection work, construction work and other objects similar thereto.
Right insurance (contract)Insurance (contract) receiving the price by commitment of payment of money and other benefits concerning damage incurred by defects in the rights to movable property or real estate.
Theft insurance (contract)Insurance (contract) receiving the price by commitment of payment of money and other benefits concerning damage incurred by theft.
Glass insurance (contract)Insurance (contract) receiving the price by commitment of payment of money and other benefits concerning damage incurred by breakage of glass.
Animal insurance (contract)Insurance (contract) receiving the price by commitment of payment of money and other benefits concerning damage incurred by an accident to animal.
Nuclear insurance (contract)
Insurance (contract) receiving the price by commitment of payment of money and other benefits concerning damage incurred by taking the responsibility for compensation under the Nuclear Damage Compensa-tion Act.
Expense Insurance (contract)
Insurance (contract) receiving the price by commitment of payment of money and other benefits concerning damage incurred by an accident generating prize money, prize, expenses for litigation, other expenses. In such cases, legal expense insurance (contract) compensating dam-age incurred by an accident generating legal service or expenses for legal service.
Weather insurance (contract)
Insurance (contract) receiving the price by commitment of payment of money and other benefits concerning damage incurred by weather.
3. Third insurance
Types of insurance products Standards for classification
Casualty insurance (contract)
Insurance (contract) receiving the price by commitment of payment of money and other benefits concerning risks, such as expenses incurred in treatment on bodily injury of a man and death, etc. resulting from injury.
Disease insurance (contract)Insurance (contract) receiving the price by commitment of payment of money and other benefits concerning risks (excluding death owing to a disease), such as a disease of a man or hospitalization, operation, etc. owing to a disease.
Nursing insurance (contract)
Insurance (contract) receiving the price by commitment of payment of money and other benefits concerning a state requiring other's tending or risks of treatment, etc. resulting there from, such as dementia or disability in daily life, etc.
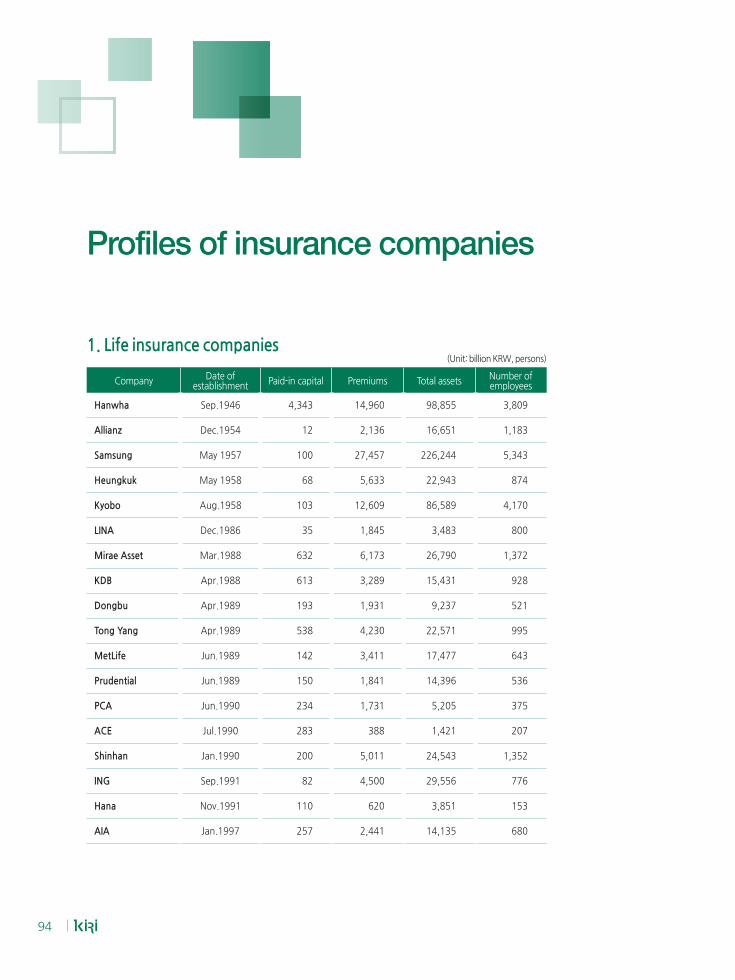
94
1. Life insurance companies(Unit: billion KRW, persons)
Company Date of establishment Paid-in capital Premiums Total assets Number of
employees
Hanwha Sep.1946 4,343 14,960 98,855 3,809
Allianz Dec.1954 12 2,136 16,651 1,183
Samsung May 1957 100 27,457 226,244 5,343
Heungkuk May 1958 68 5,633 22,943 874
Kyobo Aug.1958 103 12,609 86,589 4,170
LINA Dec.1986 35 1,845 3,483 800
Mirae Asset Mar.1988 632 6,173 26,790 1,372
KDB Apr.1988 613 3,289 15,431 928
Dongbu Apr.1989 193 1,931 9,237 521
Tong Yang Apr.1989 538 4,230 22,571 995
MetLife Jun.1989 142 3,411 17,477 643
Prudential Jun.1989 150 1,841 14,396 536
PCA Jun.1990 234 1,731 5,205 375
ACE Jul.1990 283 388 1,421 207
Shinhan Jan.1990 200 5,011 24,543 1,352
ING Sep.1991 82 4,500 29,556 776
Hana Nov.1991 110 620 3,851 153
AIA Jan.1997 257 2,441 14,135 680
Profiles of insurance companies
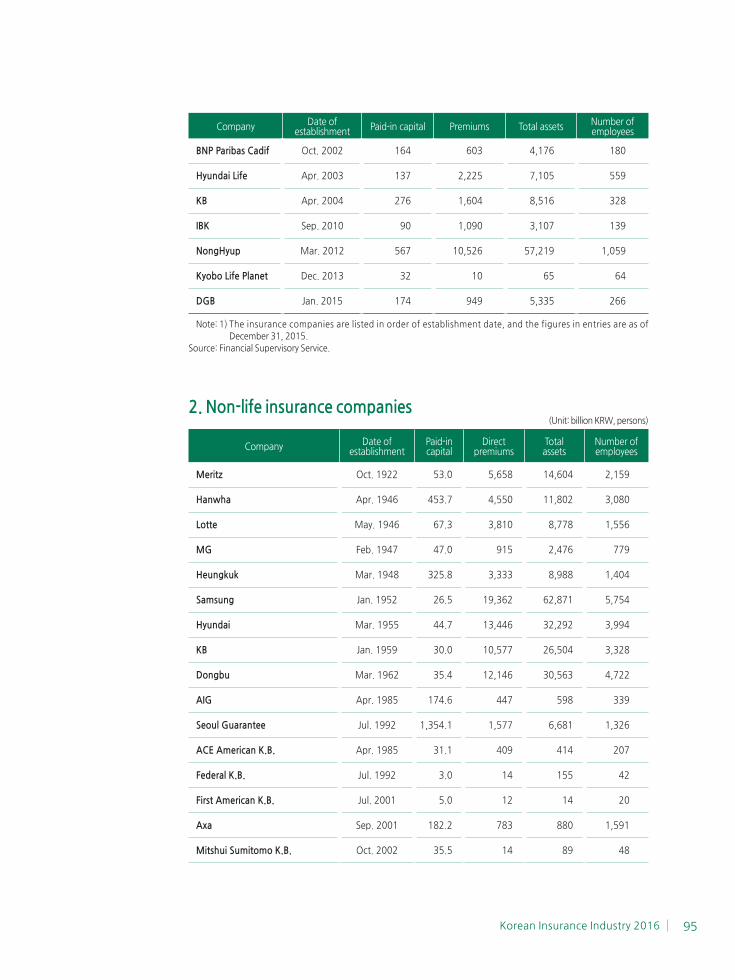
Korean Insurance Industry 2016 95
Company Date of establishment Paid-in capital Premiums Total assets Number of
employees
BNP Paribas Cadif Oct. 2002 164 603 4,176 180
Hyundai Life Apr. 2003 137 2,225 7,105 559
KB Apr. 2004 276 1,604 8,516 328
IBK Sep. 2010 90 1,090 3,107 139
NongHyup Mar. 2012 567 10,526 57,219 1,059
Kyobo Life Planet Dec. 2013 32 10 65 64
DGB Jan. 2015 174 949 5,335 266
Note: 1) The insurance companies are listed in order of establishment date, and the figures in entries are as of
December 31, 2015.
Source: Financial Supervisory Service.
2. Non-life insurance companies(Unit: billion KRW, persons)
Company Date of establishment
Paid-incapital
Direct premiums
Total assets
Number of employees
Meritz Oct. 1922 53.0 5,658 14,604 2,159
Hanwha Apr. 1946 453.7 4,550 11,802 3,080
Lotte May. 1946 67.3 3,810 8,778 1,556
MG Feb. 1947 47.0 915 2,476 779
Heungkuk Mar. 1948 325.8 3,333 8,988 1,404
Samsung Jan. 1952 26.5 19,362 62,871 5,754
Hyundai Mar. 1955 44.7 13,446 32,292 3,994
KB Jan. 1959 30.0 10,577 26,504 3,328
Dongbu Mar. 1962 35.4 12,146 30,563 4,722
AIG Apr. 1985 174.6 447 598 339
Seoul Guarantee Jul. 1992 1,354.1 1,577 6,681 1,326
ACE American K.B. Apr. 1985 31.1 409 414 207
Federal K.B. Jul. 1992 3.0 14 155 42
First American K.B. Jul. 2001 5.0 12 14 20
Axa Sep. 2001 182.2 783 880 1,591
Mitshui Sumitomo K.B. Oct. 2002 35.5 14 89 48
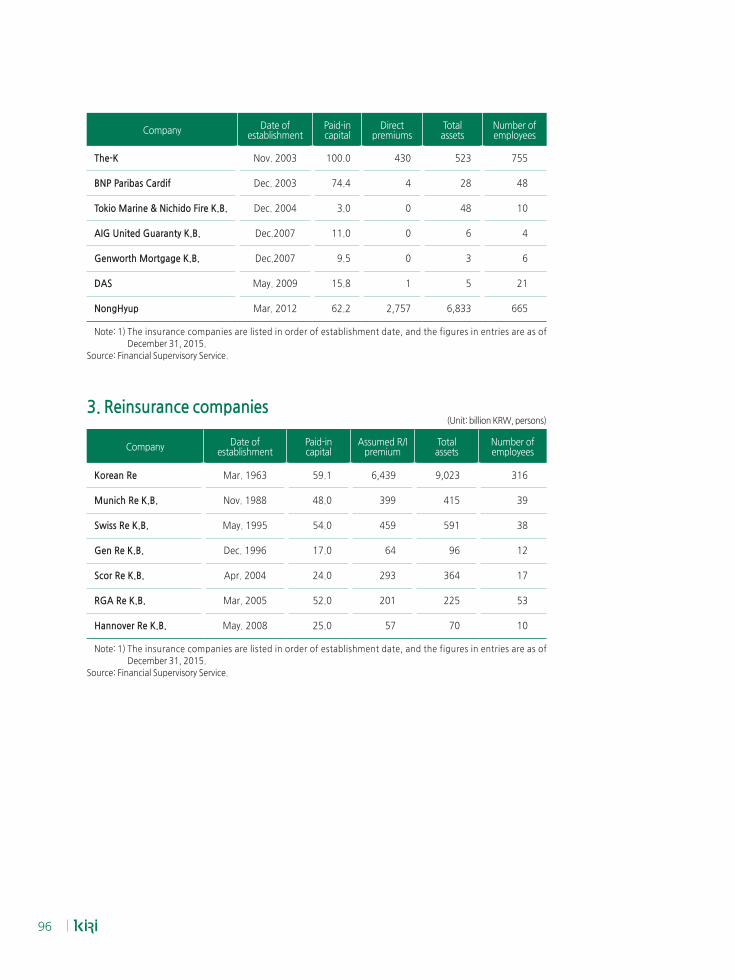
96
Company Date of establishment
Paid-incapital
Direct premiums
Total assets
Number of employees
The-K Nov. 2003 100.0 430 523 755
BNP Paribas Cardif Dec. 2003 74.4 4 28 48
Tokio Marine & Nichido Fire K.B. Dec. 2004 3.0 0 48 10
AIG United Guaranty K.B. Dec.2007 11.0 0 6 4
Genworth Mortgage K.B. Dec.2007 9.5 0 3 6
DAS May. 2009 15.8 1 5 21
NongHyup Mar. 2012 62.2 2,757 6,833 665
Note: 1) The insurance companies are listed in order of establishment date, and the figures in entries are as of
December 31, 2015.
Source: Financial Supervisory Service.
3. Reinsurance companies (Unit: billion KRW, persons)
Company Date of establishment
Paid-incapital
Assumed R/Ipremium
Total assets
Number of employees
Korean Re Mar. 1963 59.1 6,439 9,023 316
Munich Re K.B. Nov. 1988 48.0 399 415 39
Swiss Re K.B. May. 1995 54.0 459 591 38
Gen Re K.B. Dec. 1996 17.0 64 96 12
Scor Re K.B. Apr. 2004 24.0 293 364 17
RGA Re K.B. Mar. 2005 52.0 201 225 53
Hannover Re K.B. May. 2008 25.0 57 70 10
Note: 1) The insurance companies are listed in order of establishment date, and the figures in entries are as of
December 31, 2015.
Source: Financial Supervisory Service.
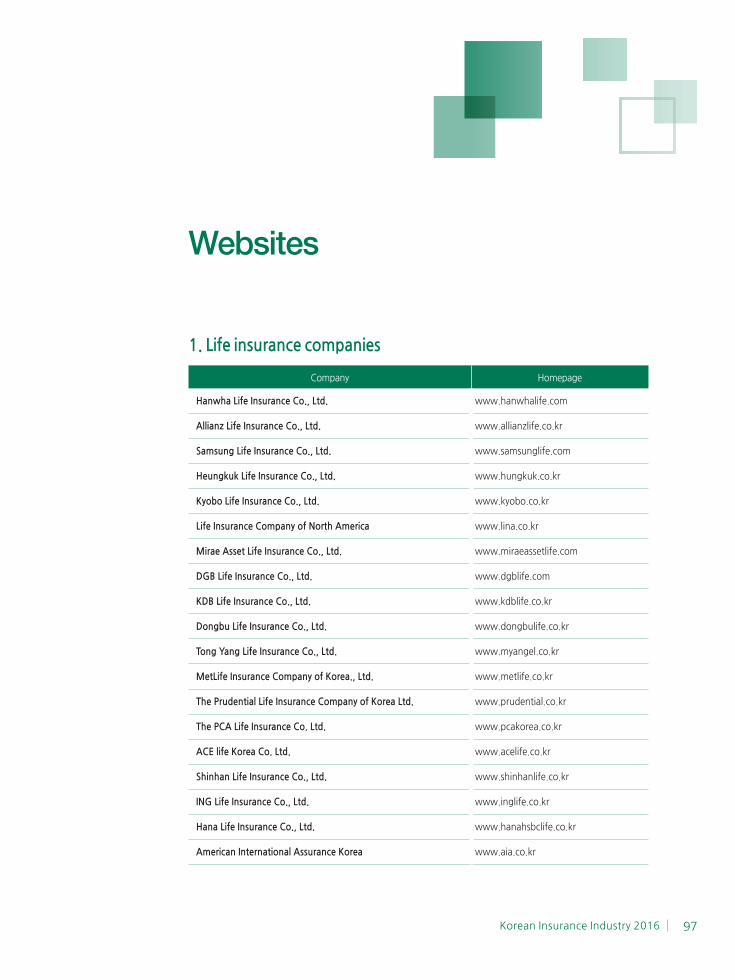
Korean Insurance Industry 2016 97
1. Life insurance companies
Company Homepage
Hanwha Life Insurance Co., Ltd. www.hanwhalife.com
Allianz Life Insurance Co., Ltd. www.allianzlife.co.kr
Samsung Life Insurance Co., Ltd. www.samsunglife.com
Heungkuk Life Insurance Co., Ltd. www.hungkuk.co.kr
Kyobo Life Insurance Co., Ltd. www.kyobo.co.kr
Life Insurance Company of North America www.lina.co.kr
Mirae Asset Life Insurance Co., Ltd. www.miraeassetlife.com
DGB Life Insurance Co., Ltd. www.dgblife.com
KDB Life Insurance Co., Ltd. www.kdblife.co.kr
Dongbu Life Insurance Co., Ltd. www.dongbulife.co.kr
Tong Yang Life Insurance Co., Ltd. www.myangel.co.kr
MetLife Insurance Company of Korea., Ltd. www.metlife.co.kr
The Prudential Life Insurance Company of Korea Ltd. www.prudential.co.kr
The PCA Life Insurance Co. Ltd. www.pcakorea.co.kr
ACE life Korea Co. Ltd. www.acelife.co.kr
Shinhan Life Insurance Co., Ltd. www.shinhanlife.co.kr
ING Life Insurance Co., Ltd. www.inglife.co.kr
Hana Life Insurance Co., Ltd. www.hanahsbclife.co.kr
American International Assurance Korea www.aia.co.kr
Websites
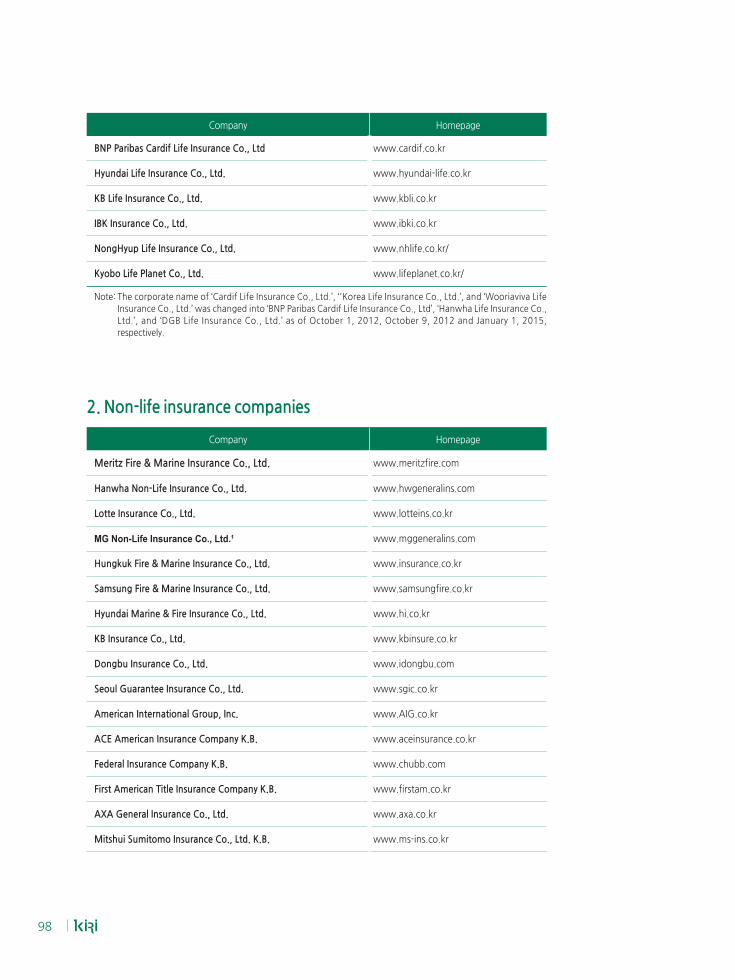
98
Company Homepage
BNP Paribas Cardif Life Insurance Co., Ltd www.cardif.co.kr
Hyundai Life Insurance Co., Ltd. www.hyundai-life.co.kr
KB Life Insurance Co., Ltd. www.kbli.co.kr
IBK Insurance Co., Ltd. www.ibki.co.kr
NongHyup Life Insurance Co., Ltd. www.nhlife.co.kr/
Kyobo Life Planet Co., Ltd. www.lifeplanet.co.kr/
Note: The corporate name of ‘Cardif Life Insurance Co., Ltd.’, ‘'Korea Life Insurance Co., Ltd.’, and ‘Wooriaviva Life
Insurance Co., Ltd.’ was changed into ‘BNP Paribas Cardif Life Insurance Co., Ltd’, ‘Hanwha Life Insurance Co.,
Ltd.’, and ‘DGB Life Insurance Co., Ltd.’ as of October 1, 2012, October 9, 2012 and January 1, 2015,
respectively.
2. Non-life insurance companies
Company Homepage
Meritz Fire & Marine Insurance Co., Ltd. www.meritzfire.com
Hanwha Non-Life Insurance Co., Ltd. www.hwgeneralins.com
Lotte Insurance Co., Ltd. www.lotteins.co.kr
MG Non-Life Insurance Co., Ltd.¹ www.mggeneralins.com
Hungkuk Fire & Marine Insurance Co., Ltd. www.insurance.co.kr
Samsung Fire & Marine Insurance Co., Ltd. www.samsungfire.co.kr
Hyundai Marine & Fire Insurance Co., Ltd. www.hi.co.kr
KB Insurance Co., Ltd. www.kbinsure.co.kr
Dongbu Insurance Co., Ltd. www.idongbu.com
Seoul Guarantee Insurance Co., Ltd. www.sgic.co.kr
American International Group, Inc. www.AIG.co.kr
ACE American Insurance Company K.B. www.aceinsurance.co.kr
Federal Insurance Company K.B. www.chubb.com
First American Title Insurance Company K.B. www.firstam.co.kr
AXA General Insurance Co., Ltd. www.axa.co.kr
Mitshui Sumitomo Insurance Co., Ltd. K.B. www.ms-ins.co.kr
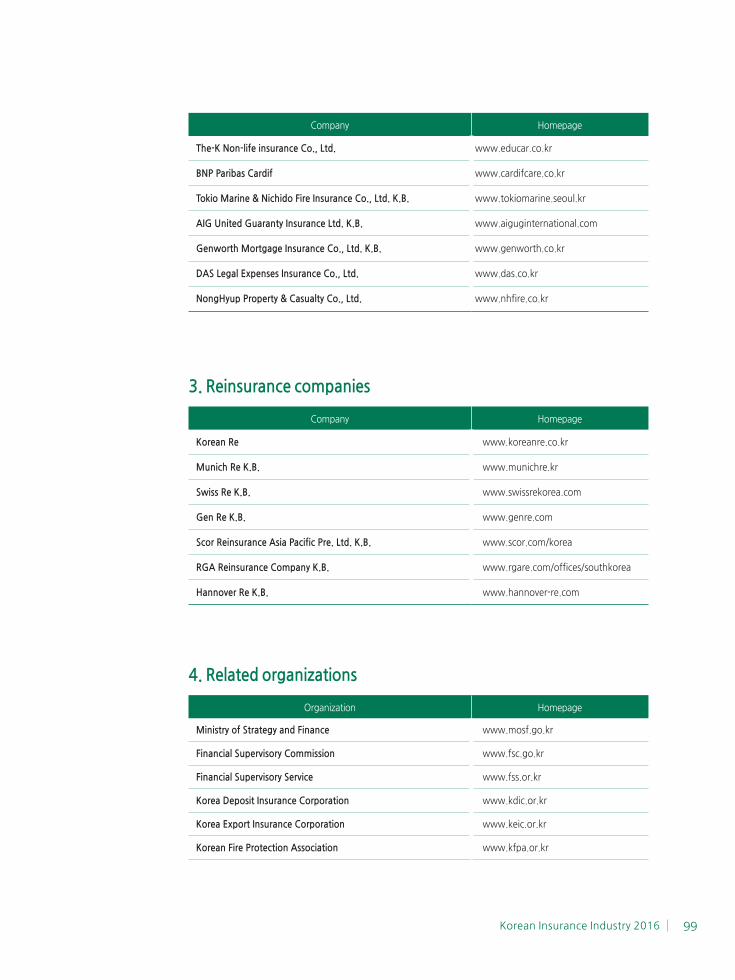
Korean Insurance Industry 2016 99
Company Homepage
The-K Non-life insurance Co., Ltd. www.educar.co.kr
BNP Paribas Cardif www.cardifcare.co.kr
Tokio Marine & Nichido Fire Insurance Co., Ltd. K.B. www.tokiomarine.seoul.kr
AIG United Guaranty Insurance Ltd. K.B. www.aiguginternational.com
Genworth Mortgage Insurance Co., Ltd. K.B. www.genworth.co.kr
DAS Legal Expenses Insurance Co., Ltd. www.das.co.kr
NongHyup Property & Casualty Co., Ltd. www.nhfire.co.kr
3. Reinsurance companies
Company Homepage
Korean Re www.koreanre.co.kr
Munich Re K.B. www.munichre.kr
Swiss Re K.B. www.swissrekorea.com
Gen Re K.B. www.genre.com
Scor Reinsurance Asia Pacific Pre. Ltd. K.B. www.scor.com/korea
RGA Reinsurance Company K.B. www.rgare.com/offices/southkorea
Hannover Re K.B. www.hannover-re.com
4. Related organizations
Organization Homepage
Ministry of Strategy and Finance www.mosf.go.kr
Financial Supervisory Commission www.fsc.go.kr
Financial Supervisory Service www.fss.or.kr
Korea Deposit Insurance Corporation www.kdic.or.kr
Korea Export Insurance Corporation www.keic.or.kr
Korean Fire Protection Association www.kfpa.or.kr
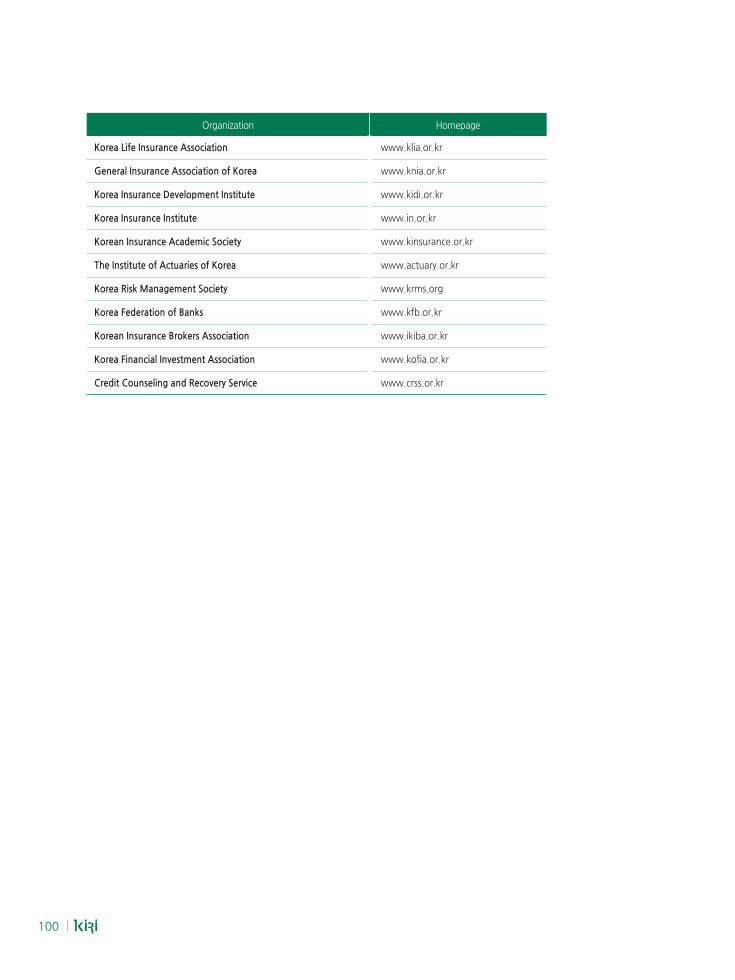
100
Organization Homepage
Korea Life Insurance Association www.klia.or.kr
General Insurance Association of Korea www.knia.or.kr
Korea Insurance Development Institute www.kidi.or.kr
Korea Insurance Institute www.in.or.kr
Korean Insurance Academic Society www.kinsurance.or.kr
The Institute of Actuaries of Korea www.actuary.or.kr
Korea Risk Management Society www.krms.org
Korea Federation of Banks www.kfb.or.kr
Korean Insurance Brokers Association www.ikiba.or.kr
Korea Financial Investment Association www.kofia.or.kr
Credit Counseling and Recovery Service www.crss.or.kr


![Is the Insurance Industry Systemically Risky? - Brookings · [Type text] write and retain large and concentrated amounts of nontraditional insurance or similar risk management products](https://img.pdfslide.tips/doc/110x75/5ae797007f8b9a6d4f8e51b7/is-the-insurance-industry-systemically-risky-brookings-type-text-write-and-retain.jpg)