Embed Size (px)
Citation preview

=
=
=k^s^i=
mlpqdo^ar^qb=p`elli=
jlkqbobvI=`^ifclokf^=
=
NPS-GSBPP-08-001
Approved for public release, distribution is unlimited.
Prepared for: Naval Postgraduate School, Monterey, California 93943
The Potential Impact of Collaborative and Three-dimensional Imaging Technology on SHIPMAIN Fleet Modernization Plan
15 January 2008
by
Nathan L. Seaman, LT, USN,
Thomas Housel, Professor, and
Jonathan Mun, Professor
Graduate School of Operational and Information Sciences
Naval Postgraduate School

THIS PAGE INTENTIONALLY LEFT BLANK

Naval Postgraduate School Monterey, California
Daniel T. Oliver Leonard A. Ferrari President Provost
The Acquisition Chair, Graduate School of Business & Public Policy, Naval
Postgraduate School supported the funding of the research presented herein.
Reproduction of all or part of this report is authorized.
The report was prepared by:
________________________________ Nathan L. Seaman, LT, USN Graduate School of Operational and Information Sciences
________________________________ Thomas Housel, Professor Graduate School of Operational and Information Sciences
________________________________ Jonathan Mun, Professor Graduate School of Operational and Information Sciences
Reviewed by:
________________________________ Robert N. Beck Dean, Graduate School of Business & Public Policy
Released by:
________________________________ Dan C. Boger, Ph.D. Acting Dean of Research

THIS PAGE INTENTIONALLY LEFT BLANK

- i -
REPORT DOCUMENTATION PAGE
Form approved
OMB No 0704-0188 Public reporting burden for this collection of information is estimated to average 1 hour per response, including the time for reviewing instructions, searching existing data sources, gathering and maintaining the data needed, and completing and reviewing the collection of information. Send comments regarding this burden estimate or any other aspect of this collection of information, including suggestions for reducing this burden, to Washington Headquarters Services, Directorate for information Operations and Reports, 1215 Jefferson Davis Highway, Suite 1204, Arlington, VA 22202-4302, and to the Office of Management and Budget, Paperwork Reduction Project (0704-0188), Washington, DC 20503.
1. AGENCY USE ONLY (Leave blank)
2. REPORT DATE 15 January 2008
3. REPORT TYPE AND DATES COVERED 1 October 2006 through 30 September 2007
4. TITLE AND SUBTITLE The Potential Impact of Collaborative and Three-dimensional Imaging Technology on SHIPMAIN Fleet Modernization Plan
5. FUNDING
6. AUTHOR (S) Nathan L. Seaman, Thomas Housel, and Jonathan Mun
7. PERFORMING ORGANIZATION NAME (S) AND ADDRESS (ES) NAVAL POSTGRADUATE SCHOOL GRADUATE SCHOOL OF BUSINESS AND PUBLIC POLICY 555 DYER ROAD MONTEREY, CA 93943-5103
8. PERFORMING ORGANIZATION REPORT NUMBER NPS-GSBPP-08-001
9. SPONSORING/MONITORING AGENCY NAME (S) AND ADDRESS (ES)
10. SPONSORING/MONITORING AGENCY REPORT NUMBER
11. SUPPLEMENTARY NOTES 12a. DISTRIBUTION/AVAILABILITY STATEMENT Approved for public release; distribution is unlimited
12b. DISTRIBUTION CODE
13. ABSTRACT (Maximum 200 words.) Maintenance and modernization of the US Navy fleet is big business. The Navy has invested substantial fiscal and human
resources to standardize the processes used to accomplish maintenance, modernization and repair for its fleet of ships. As technology continues to advance at exponential rates, reliable and quantitative measures capturing and measuring the full range of benefits are essential. The Knowledge Value Added (KVA) + Real Options (RO) framework was used in this case analysis to quantify process improvements and subsequent benefits of select technology on the ship maintenance and modernization (SHIPMAIN) program. 14. SUBJECT TERMS Knowledge Value Added (KVA) + Real Options (RO), ship maintenance and modernization (SHIPMAIN) program, US Navy fleet
15. NUMBER OF PAGES 109
16. PRICE CODE
17. SECURITY CLASSIFICATION OF REPORT: UNCLASSIFIED
18. SECURITY CLASSIFICATION OF THIS PAGE: UNCLASSIFIED
19. SECURITY CLASSIFICATION OF ABSTRACT: UNCLASSIFIED
20. LIMITATION OF ABSTRACT: UU
NSN 7540-01-280-5800 Standard Form 298 (Rev. 2-89) Prescribed by ANSI Std 239-18

- ii -
THIS PAGE INTENTIONALLY LEFT BLANK
- iii -
Abstract
Maintenance and modernization of the US Navy fleet is big business. The
Navy has invested substantial fiscal and human resources to standardize the
processes used to accomplish maintenance, modernization and repair for its fleet of
ships. As technology continues to advance at exponential rates, reliable and
quantitative measures capturing and measuring the full range of benefits are
essential. The Knowledge Value Added (KVA) + Real Options (RO) framework was
used in this case analysis to quantify process improvements and subsequent
benefits of select technology on the ship maintenance and modernization
(SHIPMAIN) program.

- iv -
THIS PAGE INTENTIONALLY LEFT BLANK

- v -
Acknowledgements
We would like to thank Jim Greene (RADM retired), Acquisitions Chair at
NPS, for his continued support and guidance on this study. We would also like to
thank all those who participated in this research for giving their time and guidance,
and especially, Bob Stout.

- vi -
THIS PAGE INTENTIONALLY LEFT BLANK

- vii -
About the Authors
Lieutenant Nathan L. Seaman, Medical Service Corps, United States Navy is a native of Florida. He enlisted in the Navy in 1994 as a Hospital Corpsman (HM). He graduated from Saint Leo University with a Bachelor of Arts Degree in Business Administration and was commissioned an Ensign in April of 2002 via the Inservice Procurement Program.
LT Seaman reported for duty as a staff hospital corpsman assigned to Naval Hospital Camp Lejeune in September of 1994. In March of 1996 he joined the USS McClusky (FFG-41) and deployed throughout the 7th Fleet Area of Responsibility and the Western Pacific. In June 1999 he reported to the Branch Medical Clinic, Key West, Florida for duty as an instructor/trainer and ran the Emergency Medical Technician training program and served as an Affiliate Faculty for the American Heart Association’s Basic Life Support Program. Through the Inservice Procurement Program, he was commissioned as an Ensign in the Medical Service Corps in April of 2002 and completed Officer Indoctrination School in Newport, Rhode Island. In June of 2002 he joined the medical staff of Naval Hospital, Yokosuka, Japan as the Business Manager for the Director of Branch Medical Clinics. He later became the Business Manager for the Director of Surgical Services. He reported to the Naval Postgraduate School in June of 2005 as a student in the Graduate School of Information Sciences and deployed in support of Hurricane Katrina recovery operations prior to earning a Masters of Science in Information Technology Management in June of 2007. LT Seaman is currently assigned to the Naval Hospital Camp Pendleton as the Department Head for the Information Management Department.
LT Seaman is Enlisted Surface Warfare designated and his personal awards include the Navy and Marine Corps Commendation Medal (two awards), the Joint Services Achievement Medal and the Navy and Marine Corps Achievement Medal (two awards).
He is married to the former Melodee Noel Benson of Alpine, California. They have three children: Annmarie Noel 4, Hollee Nicole 3, and Elise Elaine 1.
Thomas Housel, specializes in valuing intellectual capital and knowledge value measurement. He is currently a tenured Full Professor for the Information Sciences (Systems) Department. He won the prestigious Society for Information Management award for best paper in the field in 1986. His work on measuring the value of intellectual capital has been featured in a Fortune cover story (October 3, 1994) and Investor’s Business Daily, numerous books, professional periodicals, and academic journals (most recently in the Journal of Intellectual Capital vol. 2 2005).
Thomas Housel Professor Graduate School of Operational and Informational Sciences

- viii -
Naval Postgraduate School Monterey, CA 93943 Tel: (831) 656-7657 E-mail: [email protected] Johnathan Mun, is the founder and CEO of Real Options Valuation, Inc., a consulting, training and software development firm specializing in real options, employee stock options, financial valuation, simulation, forecasting, optimization and risk analysis located in northern California. He is the creator of the Super Lattice Solver software, Risk Simulator software and Employee Stock Options Valuation software at the firm. He has also authored numerous books including Real Options Analysis: Tools and Techniques, Real Options Analysis Course: Business Cases, Applied Risk Analysis: Moving Beyond Uncertainty, and others.
Johnathan Mun Professor Graduate School of Operational and Information Sciences Naval Postgraduate School Monterey, CA 93943 Tel: (925) 271-4438 E-mail: [email protected]

- ix -
=
=
=k^s^i=
mlpqdo^ar^qb=p`elli=
jlkqbobvI=`^ifclokf^=
=
NPS-GSBPP-08-001
Approved for public release, distribution is unlimited.
Prepared for: Naval Postgraduate School, Monterey, California 93943
The Potential Impact of Collaborative and Three-dimensional Imaging Technology on SHIPMAIN Fleet Modernization Plan
15 January 2008
by
Nathan L. Seaman, LT, USN,
Thomas Housel, Professor, and
Jonathan Mun, Professor
Graduate School of Operational and Information Sciences
Naval Postgraduate School

- x -
THIS PAGE INTENTIONALLY LEFT BLANK
- xi -
Table of Contents
1.0 Executive Summary ....................................................................xv
2.0 Business Transformation .............................................................1
3.0 Defense Maintenance....................................................................4
3.1 Fleet Modernization Plan ......................................................6
3.2 SHIPMAIN ............................................................................7
3.3 Lean Six Sigma (LSS) ........................................................11
4.0 Background .................................................................................16
4.1 Terrestrial Laser Scanning Technology ..............................17
4.2 Product Lifecycle Management Technology .......................19
4.3 Naval Shipyard Study .........................................................21
4.4 National Shipbuilding Research Program Studies ..............24
5.0 Methodology Proof of Case Study.............................................28
5.1 Map to SHIPMAIN ..............................................................29
5.2 The Defined SHIPMAIN Process for Phases IV and V .......32
5.3 KVA Analysis: As-Is Scenario ............................................34
5.4 KVA Results: To-Be Scenario.............................................34
5.5 Real Options: Value Risk Analysis......................................38
6.0 Summary ......................................................................................41
List of References ..................................................................................43
Appendix A. KVA+RO Methodology ..................................................47
Appendix B. Five Phases of SHIPMAIN .............................................55
Appendix C. 2005 NSRP Ship Check Cost/Time Savings ...............63
Appendix D. Business Rules for Phases IV and V............................65
- xii -
Appendix E. Case Study .....................................................................71
Appendix F. Block As-is KVA Data....................................................77
Appendix G: To-be Process Data Analysis........................................79
Appendix H : To-be Block Assumptions and Data Analysis ............83
Initial Distribution List ...........................................................................89

- xiii -
List of Abbreviations and Acronyms
3D THREE-DIMENSIONAL
3DIS 3D IMAGING SYSTEM
ALT ACTUAL LEARNING TIME
ASE ADVANCED SHIPBUILDING ENTERPRISE
C5I COMMAND, CONTROL, COMMUNICATIONS, COMPUTERS, COMBAT SYSTEMS AND INTELLIGENCE
CM CONFIGURATION MANAGEMENT
DoD DEPARTMENT OF DEFENSE
DoN DEPARTMENT OF THE NAVY
DP DECISION POINT
FMP FLEET MODERNIZATION PLAN
FY FISCAL YEAR
IEDP IMPROVED ENGINEERING DESIGN PROGRAM
ILS INTEGRATED LOGISTICS SUPPORT
IT INFORMATION TECHNOLOGY
KVA KNOWLEDGE-VALUE ADDED
KVA+RO KNOWLEDGE-VALUE ADDED PLUS REAL OPTIONS
L6S LEAN SIX SIGMA
NAVSEA NAVAL SEA SYSTEMS COMMAND
NDE NAVY DATA ENVIRONMENT
NSRP NATIONAL SHIPBUILDING RESEARCH PROGRAM
OPNAV OFFICE OF THE CHIEF OF NAVAL OPERATIONS
PLM PRODUCT LIFECYCLE MANAGEMENT

- xiv -
RLT RELATIVE LEARNING TIME
ROI RETURN IN INVESTMENT
ROK RETURN ON KNOWLEDGE
SC SHIP CHANGE
SCD SHIP CHANGE DOCUMENT
SES SENIOR EXECUTIVE SERVICE
SHIPMAIN SHIP MAINTENANCE
SHIPMAIN EP SHIP MAINTENANCE ENTITLED PROCESS
SIS SPATIAL INTEGRATED SYSTEMS
SME SUBJECT-MATTER EXPERT
SSCEPM SURFACE SHIP AND CARRIER ENTITLED PROCESS FOR MODERNIZATION
SPAWAR SPACE AND NAVAL WARFARE SYSTEMS COMMAND
TYCOM TYPE COMMANDER

- xv -
1.0 Executive Summary
This paper applies the Knowledge Value Added (KVA) + Real Options (RO)
framework in a proof-of-concept case that analyzes current maintenance and
modernization efforts for combatant ships of the Navy’s surface forces. The
KVA+RO framework is applied to a notional scenario to quantify the potential cost
savings and other benefits with implementing 3D terrestrial laser scanning and PLM
technologies to the SHIPMAIN process. The SHIPMAIN process is a large program
with many interrelated concepts, instructions, policies, and specializations for study.
The technologies evaluated in this research are likely to provide additional benefits
(e.g., more accurate cost-estimation, higher quality, less rework and more efficient
system dynamics) across all phases of SHIPMAIN. The quantitative scope of the
research, however, was constrained to Phases IV and V of the SHIPMAIN process.
3D terrestrial laser scanning and PLM tools have the potential to build a
coherent data structure and consolidate dispersed information sources of as-
designed, as-planned, as-built and as-maintained product data into a single record
for specific ships, classes of ships or shipboard systems. A single repository of
comprehensive lifecycle information enables decision-makers to conduct analysis
and make informed decisions based on the full spectrum of product definition data.
Beyond improved lifecycle planning and increased business process efficiencies,
these technologies have the potential to:
Derive significant annual cost savings. The US Navy currently spends nearly $184 million to install and implement 520 medium-complexity ship changes to all surface combat vessels.1 Costs could drop 43% resulting in annual operating savings of nearly $78 million.
Achieve higher return on investment. ROI increases 35 percent on IT investments.
1 Cost estimate is based solely on labor rates and doesn’t include expenses for travel or material.

- xvi -
Enhance the fleet cycle time. Cycle-time for SHIPMAIN Phases IV and V could be reduced from 80 days to 56 days, a 2.5-week reduction in cycle-time.
This paper presents the research in greater detail. In the first section,
transformational initiatives at the Navy, such as the Fleet Modernization Plan (FMP)
and SHIPMAIN, are introduced. Section two provides background information on
initial research assessing the impact of 3D and collaborative PLM technologies in
the legacy naval planning yard processes, along with results from two National
Shipbuilding Research Program (NSRP) projects. Section three applies the
KVA+RO framework to Phases IV and V of SHIPMAIN under two scenarios: current
As-is and potential To-be. Results of the KVA analysis and the RO options analysis
are also presented.

- 1 -
2.0 Business Transformation
Business is not as usual at the Department of Defense (DoD). The DoD is
currently engaged in a massive business transformation effort to become an
adaptive, agile and nimble organization by modernizing business processes,
systems and information flows to support 21st-century national security requirements
(DoD, 2007, p. 1). This is a tremendous task for the DoD—a large and complicated
organization with an annual budget two times that of the world’s largest corporation,
and employer of more people than the population of a third of the world’s countries
(p. 1). As seen in Figure 1, transformation for the world’s largest business entails
five crucial elements.
Figure 1. Core Business Transformation Elements for the DoD (DoD, 2007)
Business transformation is driven by a series of strategic objectives:
Support Joint Warfighting Capabilities of the DoD,
Enable Rapid Access to Information for Strategic Decisions,
Reduce Cost of Defense Budget Operations, and
Improve Financial Stewardship to American People.

- 2 -
The DoD unveiled its transformation plan in 2005, when for the first time, it
provided a comprehensive view of initiatives and systems required for transformation
to internal and external stakeholders. Considerable progress has been made since,
with each department of the military making significant transformational strides.
The Navy has been extremely adept at adapting, changing and transforming
itself to respond to changing requirements and meet emerging threats. However,
the Navy will continue to be challenged to make necessary investments in future
capabilities with reduced resources while sustaining current warfighting capabilities.
To become a more efficient and effective enterprise, it must implement innovative
business strategies. The Navy’s business transformation vision is to significantly
increase the readiness, effectiveness, and availability of warfighting forces at the
process level to reduce costs and create more effective operations by leveraging
process improvements, technology enhancements, and effective human capital
strategies (DoD, 2007). Naval Power 21 articulates that vision, and Sea Power 21
sets the strategy for achieving that vision.
Figure 2. Department of Navy (DoN) Business Transformation (DoD, 2007, p. 122)

- 3 -
Sea Power 21 defines a transformed Navy with three fundamental operational
concepts (Sea Strike, Sea Shield, Sea Basing) and enabled by FORCEnet, a robust
IT component. FORCEnet is an IT architecture that includes common data
packaging, standard joint protocols, strengthened security and seamless
interoperability. A triad of initiatives supports those operational concepts:
Sea Enterprise—promotes reengineering and incorporation of new
technologies to deploy more efficient ways of doing business. It
captures efficiencies by employing lessons from private business
transformation to assess organizational alignment, target areas for
improvement, and prioritize investments.
Sea Trial—continual process of concept and technological
development through focused wargames, experiments, and exercises.
It strengthens the Navy’s culture of innovation and accelerates the
delivery of enhanced capabilities to the Fleet.
Sea Warrior—identifies knowledge, skills, and abilities needed for
mission accomplishment; applies a career-long training and education
continuum; and employs an interactive career-management system.
This initiation more fully develops the 21st century soldier. (DoD, 2007,
p. 122)

- 4 -
THIS PAGE INTENTIONALLY LEFT BLANK

- 5 -
3.0 Defense Maintenance
As mentioned above, maintenance of DoD assets is big business. In Fiscal
Year (FY) 2005, more than $81 billion was spent to support approximately 280
ships, 14,000 aircraft, 900 strategic missiles and 330,000 ground combat and
tactical vehicles (Office of the Deputy Under Secretary of Defense (Logistics and
Material Readiness), 2006).
Figure 3. DoD Expense Maintenance
$59 $63
$81
FY2003 FY2004 FY2005
DOD Maintenance Spending in Billions
The Navy is transitioning into a new era of maintenance on its entire fleet of
surface ships, submarines and aircraft. The Navy spent approximately $39.1 billion
in FY 2006 (including all wartime supplemental funding) to operate, maintain and
modernize its 4,000-plus aircraft and 276 deployable battle force ships (Office of the
Deputy Under Secretary of Defense (Logistics and Material Readiness), 2006, p. 3).
To meet the United States’ national defense objectives within cost, schedule and
performance constraints, new business processes, coupled with innovative use of
technologies like 3D terrestrial laser scanning and PLM, are required to provide for
maintenance, modernization, and repair of the Navy’s battle force assets.
The current acquisition environment in the DoD and the Navy is moving
toward new and innovative ways of getting the most return possible for each dollar
spent. Initiatives like Open Architecture (OA), the Entitled Process for Surface Ship
and Carrier Modernization (SHIPMAIN EP) and rapid acquisition strategies are

- 6 -
challenging old business models to get higher levels of mission capability for less
cost in less time. Cost-estimation and comprehensive lifecycle management are two
specific areas in which the Navy needs to become more efficient to enable these
new initiatives. PLM management techniques and technologies have the potential to
provide DoD leaders the ability to:
Minimize lifecycle expenses and up-front cost overruns from poor cost-estimation.
Ensure a comprehensive lifecycle portfolio exists for each program of record and specific units of each program (i.e., specific hulls of each ship class).
Have a means to evaluate total cost of ownership and hold Program Managers (PM) accountable for their efforts to evaluate lifecycle costs, not just up-front cost, in meeting program cost objectives.
The Fleet Modernization Plan, SHIPMAIN and LSS are several key initiatives
for the Navy.
3.1 Fleet Modernization Plan Keeping a fleet of 276 deployable ships and more than 4,000 aircraft in an
acceptable operational condition while modernizing and acquiring new vessels is a
difficult task to accomplish given fiscal constraints. Responding to this challenge,
the Navy established the Fleet Modernization Plan (FMP).2 The FMP provides a
disciplined process, delivering operational and technical modifications to the Fleet in
the most operationally effective and cost-efficient way. It defines a standard
methodology to plan, budget, engineer, and install timely, effective, and affordable
shipboard improvements while maintaining configuration management and
supportability (Commander, Naval Sea Systems Command, 2002, p. 1-1).
2 “Chief of Naval Operations (OPNAV) N43 sponsors the FMP and Naval Sea Systems Command (NAVSEA) 04M3 serves as the FMP Policy Implementation Office and Program Manager for the Navy Data Environment-Navy Modernization (NDE-NM) database (formerly the Fleet Modernization Program Management Information System (FMPMIS) which is the official database in support of the FMP” (Commander, Naval Sea Systems Command, 2002, p. 1-1).

- 7 -
The FMP is the means by which the Navy leverages technology and
innovation to:
Keep the warfighting edge,
Fix systemic and safety problems,
Improve Battle Force Interoperability,
Improve platform reliability and maintainability, and
Reduce the burden on the sailor. (Commander, Naval Sea Systems Command, 2002, p. 1-1)
The FMP is designed to prevent unauthorized and non-supported alterations
from being installed on ships. Unauthorized alterations are a substantial cost to the
Navy due to loss of configuration control, inefficiencies from unexpected installation
interference, systems and equipment which are not logistically supported, and
resources expended to support items which are no longer required (Commander,
Naval Sea Systems Command, 2002, p. 1-1). Moreover, unauthorized and
unsupported alterations reduce combat effectiveness.
3.2 SHIPMAIN The Sea Power 21 vision outlines what capabilities naval forces will provide
the nation in the decades ahead. In that vision, Sea Enterprise is transforming the
way the Navy does business by harvesting efficient ways of getting jobs done,
saving resources, reinvesting them into future Navy assets and delivering increased
combat capability. SHIPMAIN is one of the newest initiatives aimed at harvesting
efficient ways to get the job done. It is a best business practice that fleet sailors and
shipyards are utilizing, changing the culture of getting ship work completed. The
Navy implemented the SHIPMAIN process in FY 2004 to:
Increase efficiency of maintenance and modernization process without compromising effectiveness,
Define common planning process for surface ship maintenance and alterations,

- 8 -
Install disciplined management process with objective measurements, and
Institutionalize that process and provide continuous improvement methodology for it. (Commander, Naval Sea Systems Command, 2006)
SHIPMAIN is about doing the right maintenance at the right time, in the right
place for the right cost. The initiative seeks to identify redundancies in maintenance
processes and eliminate them. It provides a single process, assisting the Navy in
realizing the maximum benefit per maintenance dollar by eliminating time lags,
prioritizing ship jobs and empowering Sailors in their maintenance decisions
(Commander, Naval Sea Systems Command, 2006).
In August 2006, the Surface Ship and Carrier Entitled Process for
Modernization (SSCEPM) Management and Operations Manual, also known as “The
One Book,” became the Navy’s official document for the modernization of all Surface
Ships and Aircraft Carriers (Commander, Naval Sea Systems Command, 2006).
SSCEPM provides the policy and processes associated with SHIPMAIN for
planning, budgeting, engineering and installing timely effective and affordable
shipboard improvements while maintaining configuration management and
supportability. The SHIPMAIN process represents a sweeping change in the
modernization of Surface Ships and Carriers. It significantly reduces the FMP by
reducing over 40 change types to just two. Additionally, the SHIPMAIN process
streamlines and consolidates a number of existing modernization practices,
processes, meetings and supporting documents to provide a single, hierarchical
decision-making process for modernizing Surface Ships and Carriers.
The SHIPMAIN process is comprised of five distinct phases3 and three
Decision Points (DP)4 to take a proposed change from concept to completion in one
3 Five Phases: I-Conceptual, II-Preliminary Design, III-Detailed Design, IV-Implementation, V-Installation (Commander, Naval Sea Systems Command, 2006). 4 DPs occur at the conclusion of Phases I-III. Each DP is an approval for funding of successive phases and has an associated Cost Benefit Analysis (CBA), Alteration Figure of Merit (AFOM) and Recommended Change Package (RCP) (Commander, Naval Sea Systems Command, 2006).

- 9 -
document: the Ship Change Document (SCD). The SCD is a single lifecycle-
management document depicting a modernization change from concept to
completion for ships (Commander, Naval Sea Systems Command, 2006, §3, p. 3-2).
Appendix B provides a detailed description of each of the five phases. Although
SHIPMAIN has a functional governance structure and supporting business rules, it
has yet to reach a fully implemented state, especially in Phases IV and V. Business
rules for Phases IV and V are in a maturing phase, and the process owners are
regularly gathering input from stakeholders to resolve issues and refine the business
rules in order to move forward with this initiative.
Improved Engineering Design Process The Navy has been working to establish a common, interoperable IT
framework for ship construction and lifecycle management enterprises. Initiatives
implemented to realize this vision are NDE and Integrated Shipbuilding Environment
(ISE). NDE is a centralized database that contains a wide range of data from many
sources related to ship repair, maintenance and modernization. ISE seeks to attain
data interoperability so business processes and IT systems are able to accept,
transfer, and disseminate data electronically.
Naval Sea Systems Command (NAVSEA) is currently developing the
Improved Engineering Design Process (IEDP) to reduce cost, improve productivity
and design processes, collect technical data quickly, and enable greater sharing of
information between all activities involved in lifecycle management, modernization
and maintenance programs using an easy, on-line collaboration process (Stout &
Tilton, 2007).
The IEDP is a technology transition project utilizing 3D terrestrial laser
scanning capability to acquire as-built images of shipboard spaces for repair,
maintenance and modernization activities. Figure 7 shows the architecture of the
IEDP.5 The IEDP also promotes cross-functional collaboration, integrated design
5SIS is the prime contractor executing the IEDP solution for NAVSEA under a $1.8 million FY 2007 appropriation.

- 10 -
environments and fills a void that has long existed in the shipbuilding industry by
addressing the needs of ship design and sustainment throughout the ship’s lifecycle
in a common data environment.6
Figure 4. IEDP Architecture (Stout & Tilton, 2007)
IEDP benefits include:
Enabling L6S implementation for Model/Drawing development and sustainment processes leveraging 3D scanning and collaborative environment,
Reducing site visits by ship check planning team,
Capturing data used to verify dimensional information anytime after site visit (reuse),
Using 3D models for many applications such as preplanning, general cost estimates, virtual reviewing tasks with contractors, and performing what-if scenarios for rip-outs and installation of new equipment, and
Allowing engineering collaboration for cross-functional effort on same-project and data exchange between remote sites. Improved Configuration Management and Validation processes: Automated Identification Technology (AIT) (e.g., Bar Codes, RFID); ILS Product Management and visibility. (Stout & Tilton, 2007)
6 Lifecycles vary from 20 to 50 years, depending on the Navy ship.

- 11 -
Tools provided by the IEDP will let managers and engineers view as-built
images and related project information in a virtual, collaborative environment. PLM
tools provided by the IEDP have the potential to provide Navy leadership with its first
ever cradle-to-grave view of an individual hull or class of ship. Having access to
complete lifecycle information will enable longitudinal analysis of cost, performance
and other items to provide a true picture of the total cost of ownership for our naval
battle force assets.
3.3 Lean Six Sigma (LSS) A broad range of businesses have adopted LSS principles to reengineer their
business processes since the early 1980s because the approach has proven
effective in private industry. In recent years, the DoD has widely embraced LSS as
its preferred business transformation tool. LSS is a set of tools and methods for
continuous improvement. “Lean” embodies methods to identify and remove non-
value-added activities from processes, reducing cycle-time and increasing
productivity, while “Six Sigma” methods improve quality, reduce variability, and
measure performance (George, Rowlands & Kastle, 2004).
LSS has become the tool of choice for modern business transformation
activities across the DoD. Indeed, LSS initiatives are being implemented from the
level of the Assistant Secretary of Defense down to individual commands. All
branches of the DoD have implemented guidance for how and when to apply LSS
principles, and some have established LSS training sites for their personnel.7 The
Secretary of the Navy uses monthly meetings with his principal leaders to discuss
how LSS is being applied to their respective “top issues,” with High Impact Core
Value Streams relating to those “top issues” identified, mapped and used for project
selection (DoD, 2007, p. 134). For example, Comprehensive Casualty Care is a
High Impact Core Value Stream in which LSS was used to develop a framework
clearly documenting and identifying relationships to implement measurable
7 The Norfolk Naval Shipyard established a L6S College in 1999 and has trained more than 2,350 students from the Navy, Marine Corps, Army, Coast Guard, Air Force and many other agencies (Brayshaw, 2007)

- 12 -
improvements. Figure 5 depicts the very complex process of end-to-end casualty
care:
Figure 5. Navy Comprehensive Casualty Care (DoD, 2007)
By applying LSS to “top issues,” DoD leadership has improved its processes,
including reducing the contract cycle time at the Naval Sea Systems Command by
30% and improving base check-in and check-out procedures, with value of labor
reallocated resulting from improved procedures exceeding $4.5 million.8
Through continuous process improvement (CPI) and LSS efforts, the military
services have realized significant benefits. Discrete active and completed LSS
projects in the Navy exceed 4,500, resulting in improved performance and savings
returned to the warfighter and taxpayers across a broad spectrum of activities. For
example, Naval Air Systems Command used CPI/LSS to analyze, consolidate, and
8 FAQ: The ETP

- 13 -
improve processes—resulting in monetary savings and reduction in unnecessary
paperwork during the closeout process for large Naval Warfare Center contracts. It
is projected that the new closeout process will save the Navy more than $1 million in
2007; greater savings could be achieved if the new process is adopted by other
organizations (DoD, 2007, p. 12).
Maintenance is another area in which significant time and money savings
have resulted through CPI/LSS. Under the existing inspection process, the Army
Material Command at the Fort Knox Unit Maintenance could not meet its required
service of ten M1 Main Battle Tanks per week. The team could only service an
average of six tanks per week. Using LSS tools, the team was able to reduce the
tank servicing backlog from 85 tanks to zero over a six-month period.
The Air Force also decreased costs and improved cycle-times in maintenance
activities with CPI/LSS. The 58th Maintenance Squadron reduced the inspection
time for MH-53J Pave Low helicopter by 53%.
LSS Enabled By PLM Common benefits of LSS initiatives include cost reduction, decreased cycle-
time, less material waste, and more reliable products. PLM tools deliver similar
benefits. LSS provides a statistical measure of factors to help organizations meet
desired goals, and PLM tools capture, store and distribute the longitudinal data
necessary for accurate and reliable statistical measures. The DoD has struggled to
keep accurate, longitudinal lifecycle information on its major programs, specifically in
ship construction, maintenance, modernization and repair.
Without an accurate picture of the past, effective planning and cost-estimation
for future projects is difficult. PLM tools provide historical and current information to
any authorized entity in the enterprise in a web-based, collaborative environment.
PLM technology provides a shared-data environment for the Navy and shipyards in
order to reduce product development/installation cycle-time, reduce the cost of
change and allow collaboration with suppliers to dramatically reduce the cost in the
value chain. Theses outcomes will enable the Navy and shipyards to meet desired

- 14 -
L6S targets. PLM technology utilized in the IEDP is helping NAVSEA attain its goal
of a common, interoperable IT framework for ship construction and lifecycle
management by providing data management and product change management to all
stakeholders in a collaborative environment.
As an example, Figure 6 shows the UGS’ Teamcenter modules and
supportive role in lifecycle management.
Figure 6. PLM Longitudinal Lifecycle (State of Industry Brief, 2005)
LSS Supported by KVA LSS has two key methodologies: DMAIC (Define, Measure, Analyze, Improve
and Control) and DMADV (Define, Measure, Analyze, Design and Verify) (Affuso,
2004). Regardless of which methodology is used, measurement is a primary means
of determining if the initiative is achieving the desired results. When enterprise
implementations are initiated without metrics, there is no way to measure the value
achieved—often resulting in a failed implementation.
Performance metrics for productive DoD assets may use many different units
of measurement for benefits. Cost is one common measure, yet it is not always
applicable for defining value in a non-profit organization. KVA methodology provides
a way to measure value as common units of output (dollars for instance), and it

- 15 -
provides a more accurate comparison for developing key metrics supporting LSS
initiatives in the DoD. Another common metric is ROI. It is difficult to estimate ROI
on organizational assets such as IT systems, but KVA provides a framework to
allocate revenue to productive assets by describing all outputs in common units.

- 16 -
THIS PAGE INTENTIONALLY LEFT BLANK

- 17 -
4.0 Background
This case study builds upon previous analysis by Lieutenant (LT) Christine
Komoroski, USN, evaluating the effects of 3D terrestrial laser scanning technology
and PLM technologies in the four public-sector naval planning yards. LT
Komoroski’s research demonstrated that by adding 3D terrestrial laser scanning
tools and PLM technologies to the planning yards’ core processes, the total process
cost decreased by 89% (2006). In addition, studies conducted by the Naval
Shipbuilding Research Program (NSRP) found similar results. In one study, NSRP
found that adding 3D terrestrial laser scanning tools to just the ship check process9
decreased cost by as much as 44 percent and cycle-time by 49 percent (National
Shipbuilding Research Program Advanced Shipbuilding Enterprise (NSRP), 2006).
A follow-on NSRP study found that the technology is beyond the early adoption
phase and is mature enough to be used reliably (2007b).
Our research expands the scope of LT. Komoroski’s research by mapping the
proof-of-concept case study using 3D terrestrial laser scanning and applying PLM
technologies to specific phases of the ship maintenance and modernization
(SHIPMAIN) process.10 The researchers applied findings from LT Komoroski’s
research to the SHIPMAIN process, with appropriate conditional modifications and
evaluated potential cost-savings and reduction in cycle-time. LT Komoroski’s
research and the NSRP studies are discussed in greater detail below, following a
brief discussion of terrestrial scanning technology and PLM tools.
4.1 Terrestrial Laser Scanning Technology Terrestrial laser scanning technology is used in a variety of industries.
According to industry analysts, laser scanner manufacturers and related software
and service providers report strong activity across many markets, including:
9 Ship check is one of seven core processes of the planning yard (Komoroski, 2005, p. 32). 10 SHIPMAIN refers to maintenance and modernization efforts. SHIPMAIN EP refers to modernization efforts only (Anonymous, personal communication, May 2007).
- 18 -
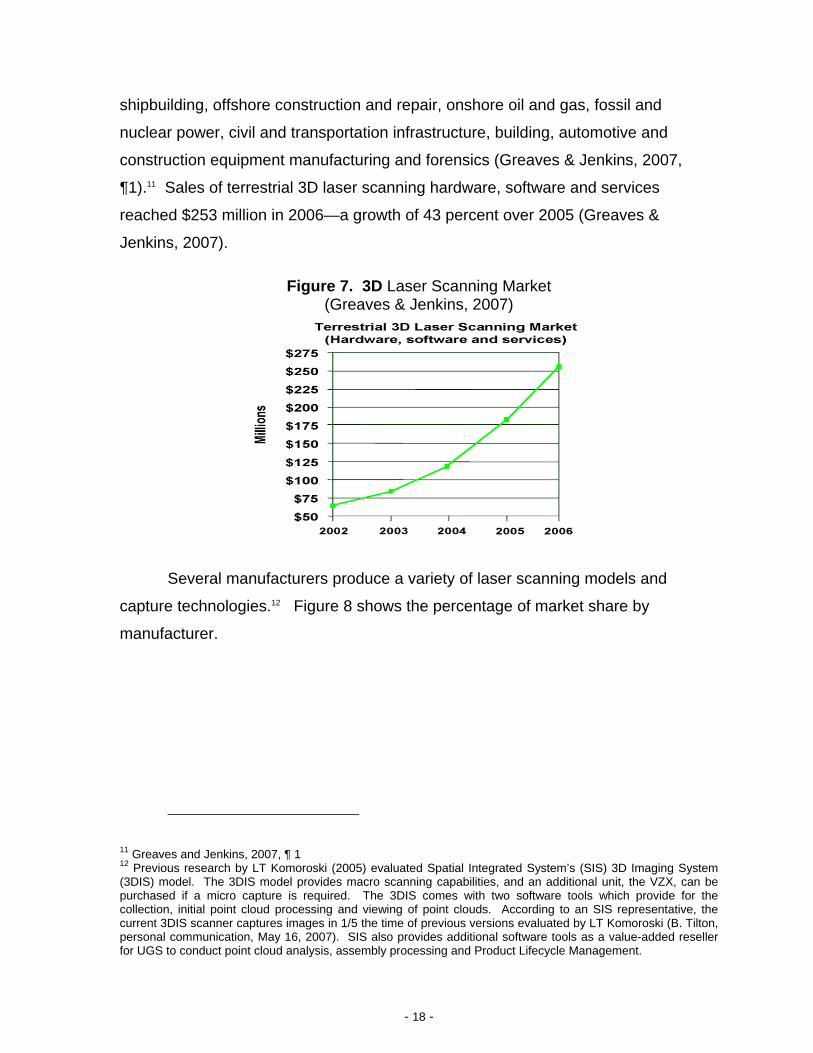
shipbuilding, offshore construction and repair, onshore oil and gas, fossil and
nuclear power, civil and transportation infrastructure, building, automotive and
construction equipment manufacturing and forensics (Greaves & Jenkins, 2007,
¶1).11 Sales of terrestrial 3D laser scanning hardware, software and services
reached $253 million in 2006—a growth of 43 percent over 2005 (Greaves &
Jenkins, 2007).
Figure 7. 3D Laser Scanning Market (Greaves & Jenkins, 2007)
Several manufacturers produce a variety of laser scanning models and
capture technologies.12 Figure 8 shows the percentage of market share by
manufacturer.
11 Greaves and Jenkins, 2007, ¶ 1 12 Previous research by LT Komoroski (2005) evaluated Spatial Integrated System’s (SIS) 3D Imaging System (3DIS) model. The 3DIS model provides macro scanning capabilities, and an additional unit, the VZX, can be purchased if a micro capture is required. The 3DIS comes with two software tools which provide for the collection, initial point cloud processing and viewing of point clouds. According to an SIS representative, the current 3DIS scanner captures images in 1/5 the time of previous versions evaluated by LT Komoroski (B. Tilton, personal communication, May 16, 2007). SIS also provides additional software tools as a value-added reseller for UGS to conduct point cloud analysis, assembly processing and Product Lifecycle Management.

- 19 -
Figure 8. 2004 Market Share Estimate (Jenkins, 2005, November)
Most manufacturers’ scanners work by scanning a target space with a laser
light mounted on a highly articulating mount, enabling data capture in virtually any
orientation with minimal operator input. Some also incorporate a digital camera that
simultaneously captures a 360° field-of-view color photo image of the target. Once
the capture phase is complete, the system automatically executes proprietary point-
processing algorithms to process the captured image. The system can generate an
accurate13 digital 3D model of the target space, automatically fuse image texture
onto 3D model geometry, export file formats ready for commercial, high-end design
and import them into 2D/3D Computer-aided Design (CAD) packages.
4.2 Product Lifecycle Management Technology PLM is defined by CIMdata as a strategic business approach applying a
consistent set of business solutions in support of the collaborative creation,
management, dissemination, and use of product definition information across the
extended enterprise, from concept to end of life. 14 It integrates people, processes,
and information. Figure 9 shows the impressive growth of the PLM market.
13 NSRP’s study (2006 & 2007b) requirement was within 3/16 of an inch to actual measurements. 14 CIMdata is a consulting firm with over 20 years of experience in strategic IT applications and is an acknowledged leader in the application of PLM and related technologies (CIMdata, 2007a)

- 20 -
CIMdata research indicates that the overall PLM market grew 10.4% to reach $20.1
billion in 2006. The research attributes the strong growth rate to continued
recognition of the value of PLM in improving companies’ business performance.
PLM investments are forecast to continue their climb over the next five years,
increasing at a compound annual growth rate of approximately 8.5%, to exceed an
estimated $30 billion by 2011.
Figure 9. PLM Market Growth History and Forecast (CIMdata, 2007b, p. 21)
Each year, PLM-related technologies and services are provided by more
companies representing all sectors of the PLM industry. In 2006, six companies
reported revenues of more than $1 billion, as demonstrated in Figure 10. Some
companies are focused on specific technologies and functions that are part of an
overall PLM environment, while others are distinguishing themselves as “PLM
Mindshare Leaders15” (CIMdata, 2007b, ¶ 17). PLM Mindshare leaders’ revenues
are shown in Figure 11.
Figure 10. 2006 PLM Revenue Leaders (CIMdata, 2007b, p.3)
15 These companies are typically considered to be at the forefront of the market in terms of either revenue generation or thought leadership (CIMdata, 2007b).

- 21 -
Figure 11. 2006 PLM Mindshare Leaders’ Revenue (CIMdata, 2007b, p. 5)
4.3 Naval Shipyard Study In 2005, LT Komoroski conducted research to identify the potential benefits
resulting from the integration of new IT assets16 into existing Navy shipyard design
16 Specific IT assets evaluated were SIS’s 3DIS laser scanner and UGS’s Teamcenter PLM software suite.

- 22 -
processes. LT Komoroski identified seven sequential core processes utilized by
planning yards to accomplish ship alterations on US Navy surface ships, as shown
in Figure 12. A baseline As-is environment was modeled and compared to potential
To-be and Radical-to-be scenarios.17
Figure 12. Planning Yard Core Processes (Komoroski, 2005, p 36)
The first hypothetical To-be scenario evaluated the effects of adding 3D laser
scanning to the As-is baseline. In the As-is environment, it cost $45 million per year
to execute the shipyard planning process cycle 40 times across the four public
shipyards. Adding 3D laser scanning to the planning process cycle lowered
expenses a projected 84 percent (to less than $8 million), as seen in Table 1.
Introduction of 3D laser scanning in the To-be environment could result in projected
17 Baseline data for As-is environment was compiled by conducting extensive interviews with SMEs of the Puget Sound Planning Yard.

- 23 -
cost savings of nearly $37 million—because Sub-processes 3, 4 and 7 were re-
engineered (Komoroski, Housel, Hom, & Mun, 2006).
The second notional environment, Radical-to-be, evaluated the effects of
adding 3D laser scanning and the collaborative PLM suite of software to the As-is
baseline. Projections for this scenario (from increased savings in process Steps 3, 4
and 7 and additional savings realized in Steps 2 and 5) included a cost savings of
90%—to nearly $40 million.
Table 1. KVA Results—Analysis of Costs (Komoroski et al., 2006, p 36)
Process Title AS-IS TO-BE RADICAL-TO-BE
AS-IS &
TO-BE
Cost Savings
AS-IS & RADICAL
Cost Savings
1 ISSUE TASKING $173,500 $173,500 $173,500 $0 $0
2 INTERPRET ORDERS $520,000 $520,000 $328,000 $0 $192,000
3 PLAN FOR SHIP CHECK $1,655,000 $714,000 $374,500 $941,000 $1,280,500
4 CONDUCT SHIP CHECK $2,604,500 $1,364,000 $1,041,000 $1,240,500 $1,563,500
5 REPORT ASSEMBLY $235,000 $235,000 $122,000 $0 $113,000
6 REVISE SCHEDULE $131,000 $131,000 $131,000 $0 $0
7 GENERATE DRAWINGS $39,386,000 $4,716,000 $2,319,000 $34,670,000 $37,067,000
TOTALS $44,705,000 $7,853,500 $4,489,000 $36,851,5000 $40,216,000
LT Komoroski’s research was conducted within the scope of the core
processes of the planning yard, a small piece of the overall process leading to the
actual installation, modernization or repair of surface ships. By expanding the
investigation beyond that initial micro-view, researchers could derive a more
comprehensive analysis of the potential impact of 3D laser scanning and PLM
technologies

- 24 -
4.4 National Shipbuilding Research Program Studies Komoroski’s limited research was predictive in nature (2005, p. 2) because it
relied on validated estimates from SMEs in the shipbuilding industry. While these
estimates attained a desirable level of correlation, none of the data points were from
physical experiments using the technologies evaluated. However, a two-part field
experiment utilizing 3D laser scanning technologies from several vendors on actual
shipyard projects was conducted by the National Shipbuilding Research Program
(NSRP). This NSRP study yielded similar benefits of significant cost and labor
savings.18
NSRP 2005 Ship-Check Data Capture Project In the spring of 2005, the NSRP’s Strategic Investment Plan added a new
initiative to focus on as-built data capture for performing ship repairs and
maintenance (National Shipbuilding Research Program Advanced Shipbuilding
Enterprise, 2006). Objectives of the NSRP ASE Ship-Check Data Capture Project in
2006 were to:
Develop a process capturing as-built measurement data in digital/electronic format during a ship check,
Process as-built measurement data into 3D CAD models using available COTS modeling technologies (software and hardware), and
Ultimately provide a building block process for the anticipated development of the capabilities to generate 3D CAD models of the as-built space envelope from the geometric measurement data captured during the ship check.
The ship check data capture process investigated and developed through this
research was focused on providing acquisition and lifecycle cost relief to the
18 “NSRP was created by US shipyards at NAVSEA request to reduce the cost of building and maintaining U.S. Navy warships. NSRP is structured as a collaboration of 11 major U.S. shipyards focused on industry-wide implementation of solutions to common cost drivers. NSRP's flagship R&D program, Advanced Shipbuilding Enterprise (ASE), targets solutions to priority issues that exhibit a compelling business case to improve the efficiency of the U.S. Shipbuilding and Ship Repair Industry. Solutions include leveraging of best commercial practices and creation of industry-specific initiatives. Aggressive technology transfer to, and buy-in by, multiple U.S. shipyards is a requirement of all funded efforts” (National Shipbuilding Research Program Advanced Shipbuilding Enterprise, 2007b).
- 25 -
government through the generation and management of accurate 3D CAD models of
as-built space and geometric measurement data.
During the project, multiple vendors conducted data capture onboard a
Torpedo Weapons Receiver (TWR 841) and the USS Georgia (SSGN 729) using
either 3D laser scanning or Digital Photogrammetry. Software solutions for post-
collection processing of ship check data were also evaluated. Once data capture
and post-processing were completed, each vendor’s product was evaluated for
accuracy of measurement and its individual data process flow. Then, each overall
process was evaluated for cost savings and cycle-time reduction.
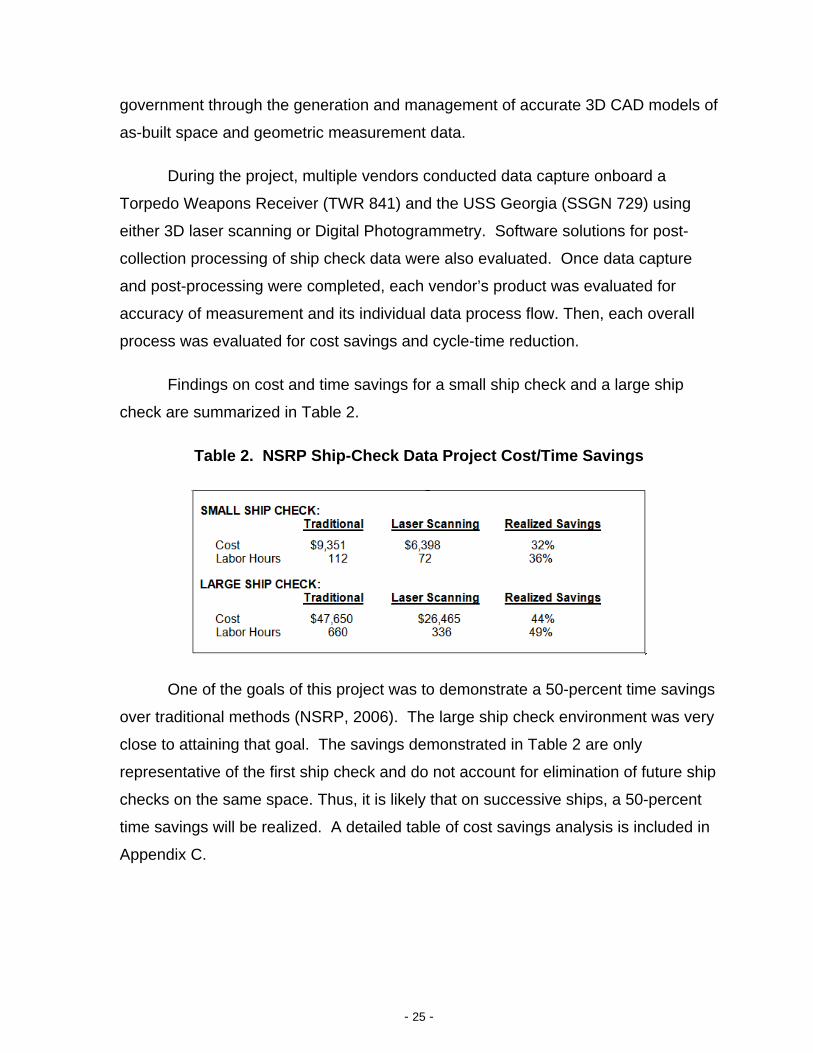
Findings on cost and time savings for a small ship check and a large ship
check are summarized in Table 2.
Table 2. NSRP Ship-Check Data Project Cost/Time Savings
One of the goals of this project was to demonstrate a 50-percent time savings
over traditional methods (NSRP, 2006). The large ship check environment was very
close to attaining that goal. The savings demonstrated in Table 2 are only
representative of the first ship check and do not account for elimination of future ship
checks on the same space. Thus, it is likely that on successive ships, a 50-percent
time savings will be realized. A detailed table of cost savings analysis is included in
Appendix C.
- 26 -
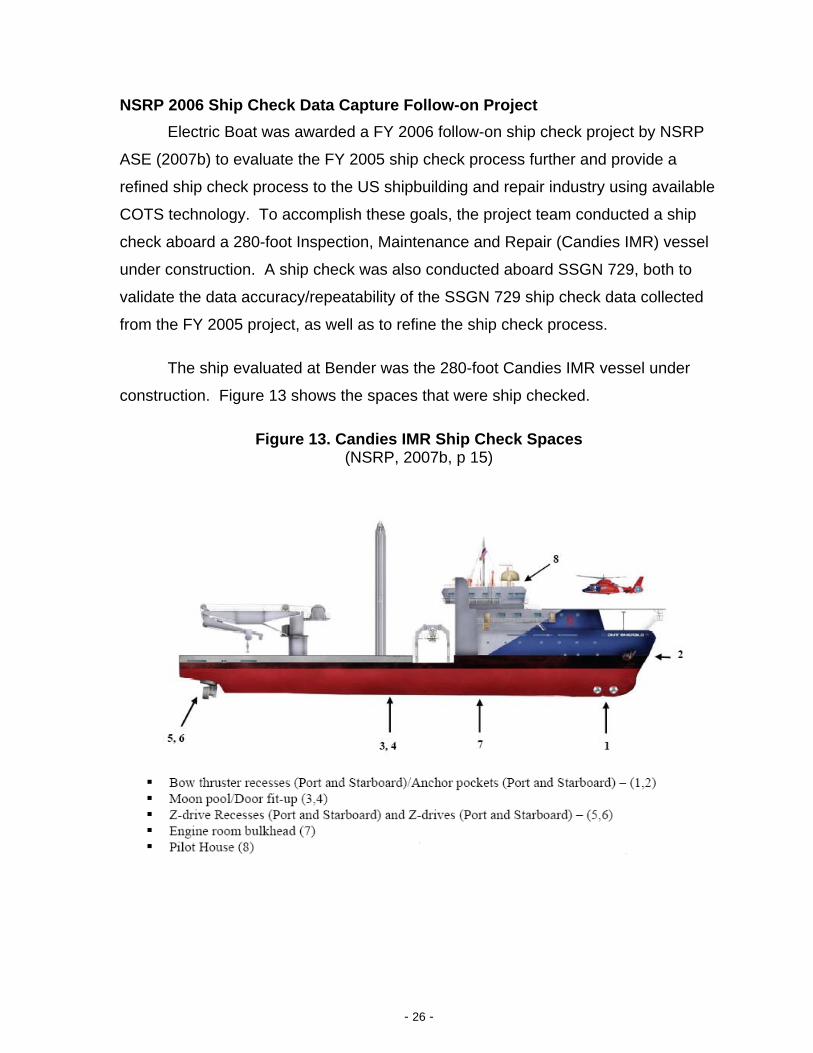
NSRP 2006 Ship Check Data Capture Follow-on Project Electric Boat was awarded a FY 2006 follow-on ship check project by NSRP
ASE (2007b) to evaluate the FY 2005 ship check process further and provide a
refined ship check process to the US shipbuilding and repair industry using available
COTS technology. To accomplish these goals, the project team conducted a ship
check aboard a 280-foot Inspection, Maintenance and Repair (Candies IMR) vessel
under construction. A ship check was also conducted aboard SSGN 729, both to
validate the data accuracy/repeatability of the SSGN 729 ship check data collected
from the FY 2005 project, as well as to refine the ship check process.
The ship evaluated at Bender was the 280-foot Candies IMR vessel under
construction. Figure 13 shows the spaces that were ship checked.
Figure 13. Candies IMR Ship Check Spaces (NSRP, 2007b, p 15)
- 27 -
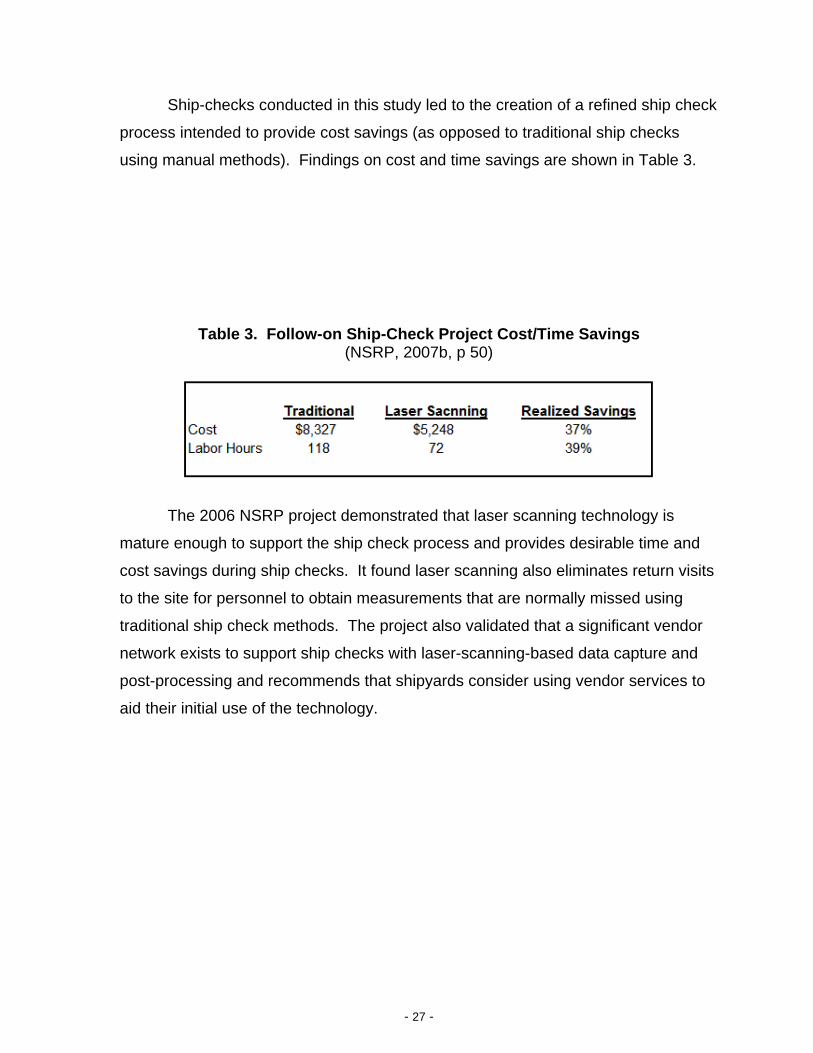
Ship-checks conducted in this study led to the creation of a refined ship check
process intended to provide cost savings (as opposed to traditional ship checks
using manual methods). Findings on cost and time savings are shown in Table 3.
Table 3. Follow-on Ship-Check Project Cost/Time Savings (NSRP, 2007b, p 50)
The 2006 NSRP project demonstrated that laser scanning technology is
mature enough to support the ship check process and provides desirable time and
cost savings during ship checks. It found laser scanning also eliminates return visits
to the site for personnel to obtain measurements that are normally missed using
traditional ship check methods. The project also validated that a significant vendor
network exists to support ship checks with laser-scanning-based data capture and
post-processing and recommends that shipyards consider using vendor services to
aid their initial use of the technology.

- 28 -
THIS PAGE INTENTIONALLY LEFT BLANK

- 29 -
5.0 Methodology Proof of Case Study
The KVA+RO framework was applied in a case analysis studying the potential
effects of 3D terrestrial laser scanning and PLM technologies into Phases IV and V
of the SHIPMAIN process. During a multi-phase project, Komoroski’s proof-of-
concept case was directly mapped to applicable areas of SHIPMAIN. All major
inputs, processes, and respective outputs were first identified by a comprehensive
review of current SHIPMAIN directives and then validated by SHIPMAIN subject-
matter experts (SME). After KVA was applied, a real-options analysis was
conducted under two scenarios: As-is and To-be.
5.1 Map to SHIPMAIN Komoroski’s seven core processes describe the Navy planning yard process
in a legacy FMP context and are still relevant in the current SHIPMAIN EP, as
validated by a SME with 38 years of experience in the shipyard industry
(Anonymous, personal communication, March 2007). Figure 14 shows a detailed
view of Komoroski’s evaluation of the core processes in the Navy planning yard.

- 30 -
Figure 14. Planning Yard Core Processes (Komoroski et al., 2006, p 36)
1. Issue Tasking
• Planning yard leadership receives formal tasking from customer (government source) for work on a specific platform.
• Tasking order provides funding and direction for what planning yard must accomplish on a given ship; Navy ships operate with availability periods planned well in advance.
• Project Manager (PM) consolidates and organizes all tasks into the Design Tasking Memorandum (DTM) an internal planning yard document.
• DTM issued to all applicable parties, the Lead and Follow Codes.
• Lead and Follow codes perform portion of work based on DTM and according to area of specialization.
• Lead Code is subspecialty with most significant role; Follow Code is subspecialty performs work in a given assignment.
• Subtasks include budget and schedule planning, and the Production Line Manager’s (PLM) management of overall process.
3. Plan for Shipcheck
• All Lead and Follow Codes receive official guidance (DTM and its respective JIS documents).
• All Codes begin more formal preparations for actual shipcheck.
• Tasks primarily entails data collection and collaboration between Lead and Follow Codes, although there are also subprocesses critical to the success of shipcheck.
• Shipcheck team formed with consideration to volume and complexity of SHIPALTs.
• Program Manager contacts the Commanding Officer (CO) of shipcheckplatform to verify location and schedule.
• Physical tools required for work assembled.
2. Interpret Orders
• DTM reviewed by all Lead and Follow Codes.
• Lead Codes use guidance contained in DTM to begin preparations for assigned ship alterations.
• One lead code assigned for each SHIPALT; there may be many SHIPALTs so many Lead Codes may exist in planning for one shipcheck. Many follow codes may also be assigned to one SHIPALT.
• To prepare for shipcheck, Lead Codes collect and review official guidance and previously generated SHIPALT records to produce Job Information Sheets (JIS).
• All JIS documents distributed to applicable Follow Codes for a given SHIPALT.
• Subtasks include communication between Lead and Follow Codes, beginning SHIPALT data collection process, and creation of JIS.
4. Conduct Shipcheck
• Planning yard customers sometimes fall outside of the waterfront shipyard organization.
• Planning yard products (i.e. 2-dimensional CAD drawings, material lists, and equipment access route) often used by actual shipyard facility to accomplish mission of maintaining and modernizing the U.S. Naval Fleet.
• Shipcheck team assembled and a Group Leader assigned for entire shipcheck. Shipcheck team travels to ship’s location.
• Length of shipcheck dependant on number of SHIPALTs, experience level of team members, and complexity of assigned tasks.
• Many activities occur, including space walk-thrus, meetings, compartment sketching, and coordination with ship’s crew.
• Activities designed to validate “as is” ship configuration, to assess the compartments, equipment, or system intended for alteration to ensure systems will not conflict, and to plan equipment removal and entry routes.
• Rough sketches drawn to-scale are produced and entered into CAD software to develop 2D drawings.
5. Report Assembly
• Lead Designer assembles SHIPALT Report Following actual SHIPCHECK.
• Lead Designer must coordinate with all follow codes to accurately document all system conflicts that may result from implementation of modernization and maintenance tasks.
• SHIPALT Report distributed to project stakeholders.
6. Revise Schedule
• Data collected during process is taken and entered in to large database, DIS, once SHIPCHECK complete.
• After all data entered into DIS, a “Drawing Schedule” report is automatically produced.
• Drawing Schedule generates revised schedule, and appropriate cost and manhour estimates.
• Program Manager informs customer of expected cost, schedule, and revisions required.
7. Generate Drawings
• Referencing drawing list, Lead Designer ensures completed sketches from shipcheck are verified, developed and completed in the standard CAD 2D format, as required by the FMP.
• With each drawing, applicable material list will be included.
• Planning Yards generally expect to complete at least five ship installation drawings (SID) for every SHIPALT assigned, although the number of drawings varies.
• Completed drawings delivered to customer, and used to facilitate maintenance and modernization work in industrial activities.
4. Conduct Shipcheck
• Planning yard customers sometimes fall outside of the waterfront shipyard organization.
• Planning yard products (i.e. 2-dimensional CAD drawings, material lists, and equipment access route) often used by actual shipyard facility to accomplish mission of maintaining and modernizing the U.S. Naval Fleet.
• Shipcheck team assembled and a Group Leader assigned for entire shipcheck. Shipcheck team travels to ship’s location.
• Length of shipcheck dependant on number of SHIPALTs, experience level of team members, and complexity of assigned tasks.
• Many activities occur, including space walk-thrus, meetings, compartment sketching, and coordination with ship’s crew.
• Activities designed to validate “as is” ship configuration, to assess the compartments, equipment, or system intended for alteration to ensure systems will not conflict, and to plan equipment removal and entry routes.
• Rough sketches drawn to-scale are produced and entered into CAD software to develop 2D drawings.
5. Report Assembly
• Lead Designer assembles SHIPALT Report Following actual SHIPCHECK.
• Lead Designer must coordinate with all follow codes to accurately document all system conflicts that may result from implementation of modernization and maintenance tasks.
• SHIPALT Report distributed to project stakeholders.
6. Revise Schedule
• Data collected during process is taken and entered in to large database, DIS, once SHIPCHECK complete.
• After all data entered into DIS, a “Drawing Schedule” report is automatically produced.
• Drawing Schedule generates revised schedule, and appropriate cost and manhour estimates.
• Program Manager informs customer of expected cost, schedule, and revisions required.
7. Generate Drawings
• Referencing drawing list, Lead Designer ensures completed sketches from shipcheck are verified, developed and completed in the standard CAD 2D format, as required by the FMP.
• With each drawing, applicable material list will be included.
• Planning Yards generally expect to complete at least five ship installation drawings (SID) for every SHIPALT assigned, although the number of drawings varies.
• Completed drawings delivered to customer, and used to facilitate maintenance and modernization work in industrial activities.
Phases IV and V of the SHIPMAIN process consist of eight core processes
referred to as blocks (Commander, Naval Sea Systems Command, 2006). Blocks
250 and 265 of the core can be further decomposed to 11 sub-processes.
Komoroski’s planning yard process maps directly to Block 265, specifically sub-
Block 265.1 of the SHIPMAIN process, as shown in Figure 15. Komoroski’s detailed
sub-processes, as described in Figure 12, can be applied to Sub-block 265.1. The
detailed process flow chart for Sub-block 256.1 is shown in Figure 16.

- 31 -
Figure 15. Mapping of Komoroski’s Core Processes to SHIPMAIN
Figure 16. Detailed View of Block 265.1 (Commander, Naval Sea Systems Command, 2006, p 56)
Figure 15 may seem to suggest that Komoroski’s research was very small
when placed into the context of SHIPMAIN. However, when blocks are placed
based on complexity, number of personnel involved and number of times executed,

- 32 -
it is evident that that is not the case. Block 265 is where LT Komoroski’s research
was mapped, and in addition to being the most complex, this block requires 5 times
more personnel to accomplish than six of the seven other blocks19 and is utilized in
every instance of SHIPMAIN. Three SMEs, each with more than 30 years of
experience in the shipyard industry, rated Block 265 as the most complex and
difficult to learn.
5.2 The Defined SHIPMAIN Process for Phases IV and V Figure 17 below illustrates the current As-is process. For Phases IV and V of
SHIPMAIN, there are eight core processes referred to as blocks, which encompass
implementation and installation of approved SC. Each block has an official title
corresponding to the core process it accomplishes, as shown in Figure 17.
19 Block 300 is equivalent to Block 265 in complexity, training time and personnel involved (Anonymous, personal communication, May 2007).

- 33 -
Figure 17. SHIPMAIN Core Processes (Commander, Naval Sea Systems Command, 2006, p 58)
This chain of core processes is executed for every naval vessel as it
approaches and completes a shipyard availability period. The schedule timeline and
location for ship availabilities are established by Navy leadership far in advance, but
calendar dates and work assigned may be constrained by budget allowances and
other prioritization factors. Availability schedules may be affected if world events
trigger an unanticipated demand for operational naval assets.
Core processes for SHIPMAIN Phase IV (Block 250-280) and Phase V (Block
300-330) are described in detail in Appendix D. As mentioned previously, Phases IV
and V are still in an early adoption period and are not widely used across shipyards
at this point. A key assumption for the purpose of this study is that Phases IV and V

- 34 -
are being conducted as described in the business rules listed in Appendix D of the
SSCEPM dated December 11, 2006.
5.3 KVA Analysis: As-is Scenario A summary of the high-level, As-is KVA analysis is depicted in Table 4.
These estimates were compiled from interviews of SMEs at NAVSEA and from
historical data contained in the NDE. This sample is representative of availability
periods for ships of the Pacific and Atlantic Fleet, including Aircraft Carriers,
averaged from FY 2002 to FY 2007. All estimates contained in this analysis are as
conservative and accurate as possible.
Table 4. SHIPMAIN Phases IV and V As-is Core Process Model
As Is SHIPMAIN Process Overview
Core Process Process TitleNumber of Employees
Total Benefits Total Cost ROK ROI
Block 250Authorize and Issue Letter of Authorization
(LOA)/Hull Maintenance Plan (HMP); Generate 2Ks 9 $22,619,472 $5,311,299 426% 326%
Block 265 Hull Installation and Risk Assessment 44 $94,928,918 $130,071,059 73% -27%
Block 270 Authorize Installation 4 $24,710,347 $3,161,555 782% 682%
Block 280 Resolve "Not Authorized/Deferred SC 1 $3,706,552 $619,523 598% 498%
Block 300 Install SC 46 $94,722,998 $40,617,720 233% 133%
Block 310Feedback: Cost, CM, Performance,
Schedule, ILS 2 $1,853,276 $619,523 299% 199%
Block 320 Continue Installs 5 $4,633,190 $3,068,367 151% 51%Block 330 Final Install, Closeout SC 1 $926,638 $309,762 299% 199%
$248,101,392 $183,778,809 135% 35%
5.4 KVA Results: To-be Scenario The SHIPMAIN process was reengineered by adding 3D laser scanning tools
and a comprehensive suite of PLM products to the as-is state. Implementation of 3D
laser scanning tools will primarily affect Block 265.1 by enabling the planning yard to
acquire images and output its drawings in a highly accurate and electronically
transferable 3D format—as opposed to static installation drawings delivered on
paper. The 3D scanning tools can produce a 2D output also, as currently required
under the FMP. With the addition of a robust PLM product suite, the 3D images
generated can be shared across the enterprise in an Integrated Data Environment,
- 35 -
allowing all stakeholders real-time access to highly accurate as-built imagery
through a single interface.
Implementation of an enterprise-wide PLM product suite demonstrated a
remarkable effect on each core process. Providing stakeholders access to real-time
information related to all iterations of the product lifecycle in a collaborative
environment enabled nearly all sub-processes to benefit. Processes that didn’t
demonstrate a quantitative improvement in this model will likely show qualitative
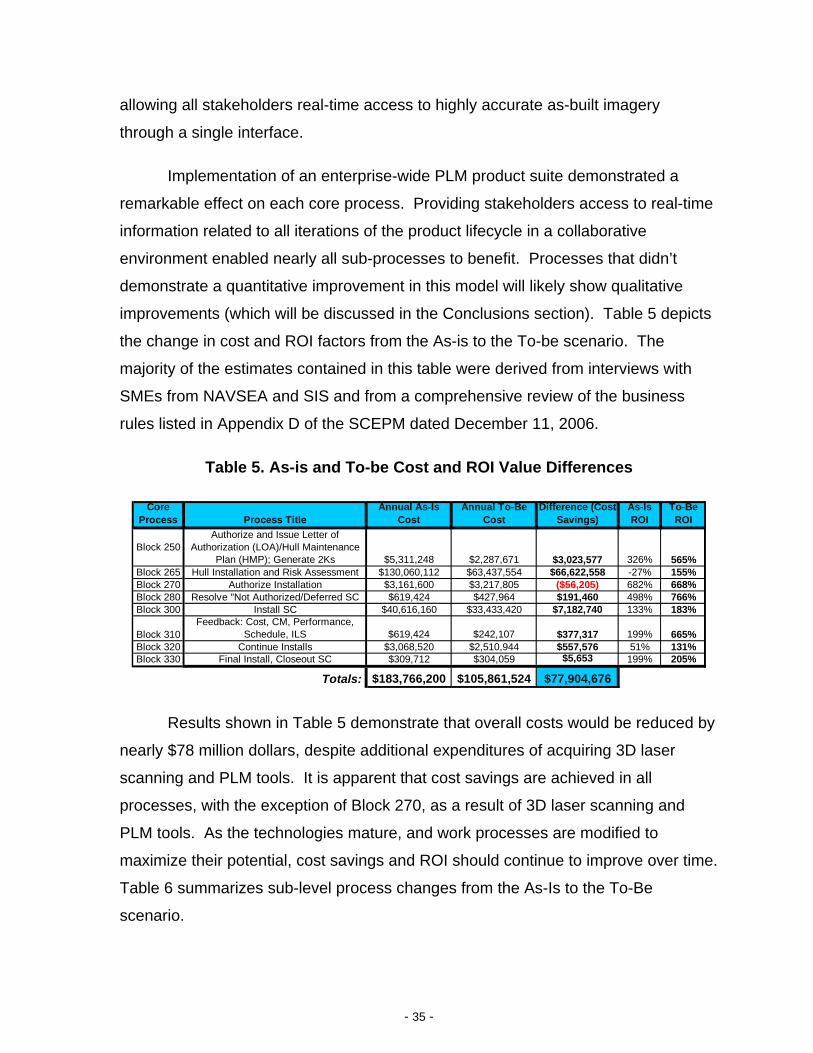
improvements (which will be discussed in the Conclusions section). Table 5 depicts
the change in cost and ROI factors from the As-is to the To-be scenario. The
majority of the estimates contained in this table were derived from interviews with
SMEs from NAVSEA and SIS and from a comprehensive review of the business
rules listed in Appendix D of the SCEPM dated December 11, 2006.
Table 5. As-is and To-be Cost and ROI Value Differences
Core Process Process Title
Annual As-Is Cost
Annual To-Be Cost
Difference (Cost Savings)
As-Is ROI
To-Be ROI
Block 250Authorize and Issue Letter of
Authorization (LOA)/Hull Maintenance Plan (HMP); Generate 2Ks $5,311,248 $2,287,671 $3,023,577 326% 565%
Block 265 Hull Installation and Risk Assessment $130,060,112 $63,437,554 $66,622,558 -27% 155%Block 270 Authorize Installation $3,161,600 $3,217,805 ($56,205) 682% 668%Block 280 Resolve "Not Authorized/Deferred SC $619,424 $427,964 $191,460 498% 766%Block 300 Install SC $40,616,160 $33,433,420 $7,182,740 133% 183%
Block 310Feedback: Cost, CM, Performance,
Schedule, ILS $619,424 $242,107 $377,317 199% 665%Block 320 Continue Installs $3,068,520 $2,510,944 $557,576 51% 131%Block 330 Final Install, Closeout SC $309,712 $304,059 $5,653 199% 205%
Totals: $183,766,200 $105,861,524 $77,904,676
Results shown in Table 5 demonstrate that overall costs would be reduced by
nearly $78 million dollars, despite additional expenditures of acquiring 3D laser
scanning and PLM tools. It is apparent that cost savings are achieved in all
processes, with the exception of Block 270, as a result of 3D laser scanning and
PLM tools. As the technologies mature, and work processes are modified to
maximize their potential, cost savings and ROI should continue to improve over time.
Table 6 summarizes sub-level process changes from the As-Is to the To-Be
scenario.

- 36 -
Table 6. Block Changes
Core Process
As-Is To-Be
Block 250 • Primarily a management-based activity. • Low annual cost is because few employees are involved in management activities of this process. • Process contains a large percentage of automation, which enables a small number of people to execute the process many times—leading to high ratios for ROK and ROI.
• No quantitative changes with 3D laser scanning or PLM. • Accuracy of outputs block potentially much higher with the PLM suite. • PLM tools provide some benefit to Block 250.x though centralization of required inputs necessary to accomplish the task, reducing the number of personnel involved and the time to complete the process.
Block 265 • Most complex block throughout Phases IV and V of SHIPMAIN with 17 individual tasks. • Involves management of operational tasks requiring significant knowledge assets, a large budget and significant manpower. • Goal is to complete all required design, procurement of material, pre-installation testing, and obtain all required certifications/risk assessment(s). • Blocks 265.2 through 265.5 primarily processes involving decision makers evaluating available information on readiness, risk, maturity and systems integration to determine if a proposed installation should be approved for actual installation.
• Block 265.1 (Installation Procurement, Design and Advance Planning) directly affected. • Komoroski’s research related to planning yard process to accomplish a ship check; personnel involved for ship check would be reduced by at least 50 percent and cycle-time would improve by at least 20 percent. Ship check is one of many tasks involved in 265.1. • For C5I installations, a quarterly meeting is held discussing issues for pending installations; all stakeholders must travel to a central location. Introducing a PLM suite would enable virtual meetings, thereby eliminating travel expenses and lost productivity. With a conservative estimate that each decision-maker brings a support staff of at least five to each meeting ($1,800 cost per traveler), annual savings are at least $352,000.
Block 270 • Involves management decisions at the highest levels of the organization, typically the GS-15 or Senior Executive Service level. • Few employees are involved with high labor costs. • There is a high level of automation with small number of people executing it often, so cost is very low compared to benefits—leading to high ROK and ROI ratios.
Block 280 • Primarily a managerial task involving few employees at low labor rates. • Process updates key planning and authorization documents after installation review in Block 265 and Fleet Commander or platform-specific TYCOM authorization in Block 270.
• More efficient process with PLM tools because personnel involved will have access to all documents and process owners in a collaborative environment.
Block 300 • Second most complex block where actual installation of SCs occur. • Process is where alterations to the ship are actually installed and tested; this block requires significant knowledge assets, a large budget and significant manpower, similar to Block 265. • Few management review sub-processes, primarily focused on completing installations and testing them. • Due to high number of times process is performed per year, cost is relatively low when compared to benefits.
• Although the majority of the tasks involved are physically installing modifications, several oversight tasks will benefit from the introduction of PLM tools. Improved communication and coordination between material suppliers and shipyards increases efficiency with minimal project delays. • 3D imagery from Block 265 shared with suppliers in real-time enables higher quality and better performing “plant engineered” parts minimizing rework and reducing “field engineering” to accomplish the install.

- 37 -
tBlock 310 • Six tasks required for this block, with no automation. • Process involves taking raw feedback data and manually entering it into required forms and databases. • This manual process could become much more efficient with some form of automation tool leading to lower process cost and increased benefits.
• Allows users to access all product information (cost, schedule, performance, CM and ILS) related to an installation, a specific hull, or a class of hulls through a single interface and to auto-generate pre-defined feedback reports. • Feedback reports generated are more reliable, and the output is faster. • Another key benefit is that each ship, system or class of ships has complete lifecycle information documented in one place, allowing leadership to truly understand the total cost of ownership for a hull, class or system.
Block 320 • Management-based process using feedback provided in previous block to determine potential impact on follow-on installs. • Completely manual process reliant upon the feedback provided in Block 310. • Decision-based process in which risks from previous installations evaluated and decisions are made to adjust the follow-on installation plan and, if required, to refine the Cost Benefit Analysis estimates.
• Process has the potential to become more efficient and reliable as an automation and analysis tool. • Process remains mainly a human thought process in the to-be scenario but is supported by accurate and timely information.
Block 330 • Review of all planned installations to determine if completed. • Done by manually comparing planned installations against reported completions and verification of all ILS completion/delivery for all installs. If all planned installs are complete, and ILS is delivered, the SC can be closed out. This process is also completely manual and could potentially become more efficient if an automation and analysis tool was introduced to the process. • Verification that all ILS is completed and delivered.
• Verification items placed into a virtual environment ,accessible through a single interface leading to a 20-percent reduction in time to complete the task.
Based on KVA analysis, 3D data capture and PLM tools have the potential to:
Derive Substantial Cost Savings. The US Navy currently spends
nearly $184 million to implement and install 520 medium-complexity
ship changes to all surface combat vessels.20 In the reengineered To-
be scenario, costs drop 43 percent—to less than $106 million. In
addition, ROI can increase by 35 percent, with total benefits derived
increasing from $248 million to nearly $319 million.
20 Cost estimate based solely on labor rates and doesn’t include expenses for travel or material.

- 38 -
Table 7. As-is and To-be ROI Comparison
Core Process Process Title
Annual As-Is Cost
Annual As-Is Benefits
Annual To-Be Cost
Annual To-Be Benefits
As-Is ROI
To-Be ROI
Block 250Authorize and Issue Letter of
Authorization (LOA)/Hull Maintenance Plan (HMP); Generate 2Ks $5,311,248 $22,619,472 $2,287,671 $15,215,872 326% 565%
Block 265 Hull Installation and Risk Assessment $130,060,112 $94,928,918 $63,437,554 $161,749,816 -27% 155%Block 270 Authorize Installation $3,161,600 $24,710,347 $3,217,805 $24,710,347 682% 668%Block 280 Resolve "Not Authorized/Deferred SC $619,424 $3,706,552 $427,964 $3,706,552 498% 766%Block 300 Install SC $40,616,160 $94,722,998 $33,433,420 $94,722,998 133% 183%
Block 310Feedback: Cost, CM, Performance,
Schedule, ILS $619,424 $1,853,276 $242,107 $1,853,276 199% 665%Block 320 Continue Installs $3,068,520 $4,633,190 $2,510,944 $5,791,488 51% 131%Block 330 Final Install, Closeout SC $309,712 $926,638 $304,059 $926,638 199% 205%
Totals: $183,766,200 $248,101,392 $105,861,524 $318,820,901 35% 201%
Reduce Fleet Cycle-time. An improved fleet cycle-time will increase
the availability of operational assets for Operational Commanders.
This study demonstrated that the cycle-time for Phases IV and V of
SHIPMAIN would be reduced from 80 days to 56 days, a 2.5-week
reduction.
Improve Lifecycle Planning and Business Process Efficiency. The
Navy doesn’t have a single portfolio that contains all product lifecycle
information from cradle-to-grave for individual ships, classes of ships
or shipboard systems, according to a SME from NAVSEA
(Anonymous, personal communication, May 2007). PLM tools have
the potential to build a coherent data structure and consolidate
dispersed information sources of as-designed, as-planned, as-built and
as-maintained product data into a single record for specific ships,
classes of ships or shipboard systems. Common access to a single
repository of comprehensive lifecycle information will enable decision-
makers to conduct analysis and make informed decisions based on the
full spectrum of product-definition data.
5.5 Real Options: Value Risk Analysis There are many options to consider when implementing the technologies
presented in this paper, including phased-in acquisitions, several up-front

- 39 -
purchases, and ways to extend use of the technology to other areas. Table 8
summarizes range of options to consider.
Table 8. Potential Options
• Do nothing and allow the As-is process to continue.
• Immediately acquire the 3D laser scanning capability for the public planning yards without PLM tools.
• If successful, expand implementation to all planning yards.
• Immediately acquire 3D laser scanners and PLM technologies for the public planning yards.
• If successful, expand implementation across all planning yards.
• Immediately acquire comprehensive PLM software for all government agencies involved in Surface Fleet Modernization and Maintenance (SYSCOM, TYCOM, Fleet Commander, OPNAV, RMC, public shipyards, etc.)
• Once business rules are established and mature, extend PLM to all maintenance and modernization efforts (Submarine, Aircraft, Missiles, etc.)
• Immediately acquire a minimal set of the PLM product suite for enterprise maintenance and modernization efforts.
• If successful, acquire additional functionality to support additional areas.
We focused on four potential strategies: A (As-Is), B (Immediately
Implementation), B (Partial Implementation), C (Limited Layering) and D (Phased
Implementation) for this case analysis.
Table 9. Real Options Valuation Results: Strategies A-D
Strategy A Strategy B Strategy C Strategy D
STRATEGIC OPTION AS IS
TO-BE (Implement All
Changes Immediately)
TO-BE (Implement at 3
Public Shipyards, then at 3 Private
Shipyards 2 Years Later)
TO-BE
(Implement 3D Laser Scanning, then PLM
2 Years Later)
Total Strategic Value -$533M $320M $651M $745M Volatility 10% 50% 30% 50% Total Cost $1.4B $800M $948M $883M
With Strategy A, there are really no strategic options available; it requires
simply keeping the system as is and letting it retire over time. Therefore, the total

- 40 -
strategic value is the net present value at -$533M. With Strategy B, the option is to
execute immediately, which means that the option to wait and defer is not valued,
and the total strategic value is also its net present value, valued at $320M.
Strategy C is the option to wait and defer with a proof of concept on
implementing the technology in 3 public yards for the first two years. After this initial
test case, there is an option for a follow-up opportunity to expand into the next
phase, generating a total net strategic value of $652M. This significantly higher value
comes in the form of being able to wait and defer a decision until risks and
uncertainty become resolved over the passage of time, events, and actions, and in
this case, the proof-of-concept results. There is an option to abandon
implementation should the results from the proof-of-concept prove to be under-
performing expectations.
Finally, in comparison, Strategy D, with its higher uncertainty and volatility
(the average time-weighted volatility is higher than in Strategy C), with a lower cost
and higher net revenues from the first-phase proof-of-concept, the total strategic
value is valued at $745M, higher than Strategy C.
- 41 -
6.0 Summary
This study reveals the significant potential value that 3D laser scanning and
PLM technologies have to offer maintenance and modernization efforts for US Navy
warships. High-quality, reliable, accurate and reusable digital 3D data capture,
paired with the information storage, distribution and collaboration capabilities of PLM
can provide a single digital thread connecting as-desired, as-planned, as-built and
as-maintained product data throughout the lifecycle of any ship or program. This
single digital environment has the potential to provide decision-makers the
longitudinal views of a product from cradle-to-grave that are nonexistent today.

- 42 -
THIS PAGE INTENTIONALLY LEFT BLANK

- 43 -
List of References
Affuso, T. (2004, June). PLM and six sigma, complementary strategies for success [Electronic version]. PLM Perspective. Retrieved April 27, 2007, from http://www.ugs.com/about_us/newsletter/perspective/2004_june/affuso_article_six_sigma.doc
Bozin, S. R. (2006). Department Of The Navy FY 2007 President’s Budget. http://www.finance.hq.navy.mil/fmb/07pres/highbook/FY07_PB_Rollout_Brief_6_Feb_06.pdf.
Brayshaw, M. (2007). Lean six sigma college reaches throughout DoD. Retrieved April 06, 2007, from http://www.marinelink.com/Story/NNSY%E2%80%99sLeanSixSigmaCollegeReachesThroughoutDOD-206722.html
Chief of Naval Operations. (1995). Fleet modernization program (FMP) policy (OPNAV Instruction 4720.2G ed.). Retrieved April 27, 2007, from http://doni.daps.dla.mil/Directives/04000%20Logistical%20Support%20and%20Services/04-700%20General%20Maintenance%20and%20Construction%20Support/4720.2G.pdf
Chief of Naval Operations. (2003). Maintenance policy for U.S. navy ships (OPNAV Instruction 4700.7K ed.). Retrieved March 01, 2007, from http://doni.daps.dla.mil/Directives/04000%20Logistical%20Support%20and%20Services/04-700%20General%20Maintenance%20and%20Construction%20Support/4700.7K.pdf
CIMData. (2007a). All about PLM. Retrieved April 14, 2007, from http://www.cimdata.com/PLM/plm.html
CIMData. (2007b). CIMdata reports 10.4% PLM market growth for 2006. Retrieved April 20, 2007, from http://www.cimdata.com/press/PR07-0403.htm
Commander, Naval Sea Systems Command. (2002). Fleet modernization program (FMP) management and operations manual (NAVSEA SL720-AA-MAN-010 Revision 2 ed.). Retrieved March 03, 2007, from http://www.fmp.navy.mil/FMPACTIVE/BusinessPolicy/FMPDocuments/FMP_Manual/FMPManpageinit.htm
Commander, Naval Sea Systems Command. (2006). Surface ship and carrier entitled process for modernization management and operations manual (SL720-AA-MAN-030 ed.). Retrieved April 27, 2007, from

- 44 -
http://www.fmp.navy.mil/FMPACTIVE/BusinessPolicy/FMPDocuments/draft_onebook_1a.htm
Defense Business Transformation Website, “Enterprise Transformation Plan FAQ” http://www.defenselink.mil/dbt/products/FAQs/faqs_etp.pdf
George, M. L., Rowlands, D., & Kastle, B. (2004). What is lean six sigma? New York: McGraw-Hill.
Greaves, T., & Jenkins, B. (2007). 3D laser scanning market red hot: 2006 industry revenues $253 million, 43% growth [Electronic version]. SparView, 5(7) Retrieved May 01, 2007, from http://www.sparllc.com/archiveviewer.php?vol=05&num=07&file=vol05no07-01
Housel, T. J., & Bell, A. H. (2001). Measuring and managing knowledge. Boston, MA: McGraw-Hill/Irwin.
Jenkins, B. (2005, November). 3D laser scanner sales top $44.8 million in 2004 – 65% growth [Electronic version]. SparView™ Vol. 3, No. 34, November 22, 2005 ISSN 1553-8834Retrieved April 16, 2007, from http://www.sparllc.com/archiveviewer.php?vol=03&num=34&file=vol03no34-01
Jenkins, B. (2007, March 14). Ship check data capture 37% cheaper, 39% faster with 3D laser scanning, NSRP and electric boat report [Electronic version]. SparView™ Vol. 3, No. 34, November 22, 2005 ISSN 1553-8834). Retrieved May 1, 2007, from http://www.sparllc.com/archiveviewer.php?vol=05&num=06&file=vol05no06-01
Jensen, M. D. (2004). SHIPMAIN and the sea power 21 vision [Electronic version]. Navy News Stand. Retrieved March 12, 2007, from http://www.navy.mil/search/display.asp?story_id=12343
Komoroski, C. L. (2005). Reducing cycle time and increasing value through the application of knowledge value added methodology to the U.S. navy shipyard planning process. Monterey, CA: Naval Postgraduate School.
Komoroski, C. L., Housel, T., Hom, S., & Mun, J. (2006). A methodology for improving the shipyard planning process: Using KVA analysis, risk simulation and strategic real options. Monterey, CA: Naval Postgraduate School.
Lean six sigma. (2007). Wikipedia. Retrieved April 26, 2007, from http://en.wikipedia.org/w/index.php?title=Lean_Six_Sigma&oldid=136347307
- 45 -
Miller, E. (2005). Miller’s 2005 State of PLM Address. Available at http://www.cimdata.com/publications/PLM_State_of_Industry_October_2005.pdf.
National Shipbuilding Research Program Advanced Shipbuilding Enterprise. (2007a). NSRP home page. Retrieved June 09, 2007, from http://www.nsrp.org/
National Shipbuilding Research Program Advanced Shipbuilding Enterprise. (2007b). Ship check data capture follow-on project (Technical No. NSRP ASE 05-01). http://www.nsrp.org/projects/deliverables/ase_505001.pdf.
National Shipbuilding Research Program Advanced Shipbuilding Enterprise. (2006). NSRP ASE Ship Check Project (Technical No. NSRP 04-01-08). http://www.nsrp.org/panels/bpt/downloads/ShipCheck1205.pdf.
NAVSEA Shipbuilding Support Office. (2007). Planning yard (hull) assignments. Retrieved June 04, 2007, from http://www.nvr.navy.mil/nvrships/S_PY.HTM
Office of the Deputy Under Secretary of Defense (Logistics and Material Readiness). (2006). DoD maintenance, policy, programs and resources fact book. Retrieved March 17, 2007, from http://www.acq.osd.mil/log/mrmp/factbooks/FACT_BOOK_2006_09_06_06.pdf
Service Cost Estimating Organizations. (2007). Improving cost estimation in the DoD. Retrieved June 04, 2007, from https://acc.dau.mil/CommunityBrowser.aspx?id=149301
State of Industry Brief, 2005
Stout, R., & Tilton, B. (2007). U.S. navy leverages 3D scanning with design and technical data management. Paper presented at the Spar View Conference, Houston, Texas. March 26-27, 2007.
UGS Corporation. (2007). UGS teamcenter. Retrieved June 4, 2007, from http://www.ugs.com/products/teamcenter/

- 46 -
THIS PAGE INTENTIONALLY LEFT BLANK

- 47 -
Appendix A. KVA+RO Methodology
A. KVA+RO21
The Naval Postgraduate School (NPS) developed the Knowledge Value
Added/Real Options (KVA+RO) valuation framework which quantifies elements of
uncertainty and risks and includes ways to mitigate these risks through strategic
options. KVA+RO analysis is designed to support IT portfolio acquisitions and to
empower decision-makers by providing performance-based data and scenario
analysis (Komoroski et al., 2006). Analyses like Return on Investment (ROI) on
individual projects, programs and processes within a portfolio of IT acquisitions can
be derived through KVA methodology. With historical data provided by KVA,
potential strategic investments can then be evaluated with Real Options analysis.
The analysis applied is a robust and analytical process incorporating the risk
identification (applying various sensitivity techniques), risk quantification (applying
Monte Carlo simulation), risk valuation (Real Options analysis), risk mitigation (Real
Options framing), and risk diversification (analytical portfolio optimization).
B. The Value Problem22
Before investigating the potential returns or benefits knowledge assets, either
human or IT, can provide, one must understand the concept of “value.” When new
and promising IT resources are introduced into an organization, the value derived
may take a variety of intangible forms, such as improved market competitiveness,
expanded markets, new capabilities, or increased efficiency. What value an
organization receives from that IT asset depends on many factors beyond the entire
capability of the asset, such as organizational culture, the management climate, and
the organization’s commitment to training and maintenance. Also important to note
is the percentage of the IT resource’s full potential that is actually in use. If the asset
21 This entire section is taken directly from (Komoroski et al., 2006) 22 Sections B-D are taken directly from (Komoroski, 2005)

- 48 -
is rarely used or used at baseline functionality, then the perceived and actual value
derived from the IT asset is likely low. Leveraging people, technologies, and
information effectively within an organization can promote team cohesion and
provide value.
In other definitions of value, financial metrics tend to prevail. In fact, most
value assessments focus on return and cost of ownership for IT investments.
Monetary benefits are determined in commercial applications by assigning a price
per unit to each process output. However, these financial-based methods seldom
capture the benefit streams produced by processes and resources in common,
comparable units of measurement. At the same time, financial metrics and benefits
are difficult to apply in private-sector and government organizations. The DoD, for
example, will not be able to establish the monetary benefits, or the value added from
combat effectiveness, operational readiness, and national defense. Therefore, an
alternate common unit must be used to determine the value added in public-sector
process analysis.
C. The KVA Solution The Knowledge-value Added (KVA) methodology provides a framework for
the analytical analysis of organizational knowledge assets. Developed by Drs.
Thomas Housel (Naval Postgraduate School) and Valerny Kanevsky (Agilent Lab),
the theory of KVA has been published internationally, and has been applied in
academic research and 20 various business consultations for over 15 years.
Executed properly, KVA will measure the value of knowledge embedded in an
organization’s core processes, employees, and IT investments. This measure is
quantified in a return-on-knowledge (ROK) ratio, which can be used to identify how
much value knowledge assets provide within each core business process. In
instances in which revenue comparisons or other market-comparable values are
available, a return on investment (ROI) figure can be ascertained.

- 49 -
1. The Theory of KVA With its roots in the Information Age, the theory behind KVA follows the basic
principles of thermodynamics by purporting that organizational outputs can be
described in units of complexity. More specifically, KVA theory is based on the
concept of entropy, which connotes changes in the environment. It follows that as
all organizations collect input from various sources and add value in some way, the
inputs are transformed to outputs, and the value added during that transition is
proportionate to the amount of transformation necessary to change the inputs to the
desired output. A unit of change, therefore, is considered simply as a unit of
complexity. Belief in this assertion provides a method by which all organizational
outputs can be measured in common units. The value added to each process
comes from organizational knowledge assets: people, processes, capabilities, or
information technology. Through estimation of this value, an analytical method for
estimating the return on knowledge, using the knowledge inherent in organizational
assets to describe process outputs with a common unit of measurement, is
achieved.
The knowledge used every day in the core processes of an organization can
be translated to a numerical format, because knowledge is a surrogate for the
process outputs measured in common units. By capturing corporate knowledge into
value, with clear figures to measure the value contained in each process, decision
and policy makers can reengineer processes to maximize value. Then, by seeing
the returns each process generates, better decisions can be made for an
organization. Whether the knowledge is contained in IT systems or in the minds of
an organization’s employees is irrelevant, because common units of knowledge can
be observed in the organization’s core processes, and measured in terms of cost.
Similarly, this approach provides management a verifiable way to assign benefit
streams and costs to sub-organizational outputs produced by its knowledge assets,
and can effectively redirect management’s investment focus from cost containment
to value creation.

- 50 -
Figure 4 [in original text], below, shows a visual depiction of the KVA
methodology’s underlying model and primary assumptions.
Figure 4. Fundamental Assumptions of KVA
The assumptions presented in Figure 4 are the foundation of the KVA
process. Accepting these assumptions allows the methodology to work in a way that
breaks all input down into a common unit of output, allowing all processes to be
evaluated from a common baseline reference. Because of this, in determining how
data is collected, analyzed, and how easily it can be monetized, the methodology
functions much like accounting. As such, KVA results can be utilized in corporate
finance and valuation problems.
2. Core Process Identification In order to translate the knowledge utilized in an organization’s core
processes to numerical form, it is important to accurately define what those core
processes are, and to define the amount of change each process produces.
Typically, corporate executives or other Subject-matter Experts are able to identify
the main processes executed by their organization. In some instances, work flow
models exist and may be referenced. In most instances, five to seven core
processes sufficiently cover the entire process chain for an organization. For each

- 51 -
of those processes, boundaries must be established by identifying the end output of
the process, including all sub-process outputs that eventually create the end
product. Any contribution IT provides to the process must be isolated.
3. Approaches to KVA The knowledge within a process can be represented as learning time,
process instructions, or information bits. In theory, any approach that satisfies the
basic KVA assumptions will create the same results; however, it must capture the
“know how” in the production of process outputs, given particular inputs. Table 21
[in original text] illustrates the steps used in three primary methods used to apply
KVA. The Binary Query Method will not be addressed in this research.
Table 21. Three Approaches to KVA
a. Learning-time Approach In the learning-time approach, the amount of knowledge embedded in a core
process is represented by an estimate of the amount of time it would take an
individual of average ability to learn that process’s execution well enough to

- 52 -
successfully create the same process output. In capturing this estimate, learning
time is proportional to the amount of knowledge learned, and thus indicates how
much knowledge is embedded in that process. In the context of this methodology,
this figure is called “Actual Learning Time,” or ALT. Learning Time must be
measured in common units of time, and these units represent common units of
output, which are described by the variable K. Following this line of thought, a single
execution of any process is equal to a single unit of output, represented by a given
number of common units, K.
The obvious question, then, is how one correctly estimates how long it would
take for an average person to learn a certain process. In practice, most Subject-
matter Experts can provide quality estimates based on formal training times, on-the-
job training, training manuals, and other programs, given a minimum explanation of
what ALT is in terms of the KVA methodology. It is important that SMEs understand
that for each estimate, knowledge must only be counted when it is in use; otherwise,
there is a tendency to overestimate the amount of knowledge contained in a given
process. Further, knowledge must only be counted if it is truly necessary to execute
the process. The shortest, most succinct approach to the process output must be
considered, again, to avoid overestimation.
b. Establishing Reliability Critics would argue that the Learning Time Approach is subjective and
anecdotal. However, several methods exist to ensure reliability and accuracy of
estimates. The most common way of ensuring reliable estimates is by calculating
the correlation between the ALT, ordinal ranking, and relative learn time (RLT) for
each process. A correlation value greater than or equal to 80% is sufficient for
establishing reliability, and is the preferred method of proving the estimates credible.
The three terms are described in detail below:
Actual Learn Time (ALT) is an estimate for the period of time it would take to teach an average individual to execute a given process. There is no limit to the amount of time required.

- 53 -
Ordinal Rank is a measure of process complexity described as its difficulty to learn. Subject-matter Experts, or Executives within an organization, are asked to rank the processes in order from that which is easiest to learn, to that which is the most difficult to learn.
Relative Learn Time (RLT) is a measure of the time it would take to teach an average individual the core processes of an organization given only 100 hours, days, months, or other unit of time.
Subject-matter Experts or Executives must allocate the time appropriately to
each process, with regard to that process’s complexity. Estimates may also be
verified using actual knowledge measures such as on-the-job training time, or the
number of process instructions within each core process. However, attaining a high
degree of correlation and reliability between ALT, RLT, and Ordinal Rankings is the
preferred method (Housel & Bell, 2001).
c. Total Learning Time The amount of knowledge embedded into the existing IT used in each core
process must be captured. This estimate is best achieved by considering what
percentage of a process is automated. This percentage estimate for IT is used to
calculate the total learning time (TLT), and revenue is allocated proportionally.
Interestingly, the revenue attributed to IT-based knowledge, plus the cost to use that
IT, often reveals that the value added to processes by IT applications, shown in the
resulting ROK ratio, is not always equal to the percentage of IT and automation used
in a process (Housel & Bell, 2001).
d. Process Instructions Approach In some cases, the Process Instruction Approach must be used to gain
reliability of estimates. This approach requires Subject-matter Experts to truly break
apart each core process into the various subtasks that comprise it, in order to
describe the products in terms of the “instructions required to reproduce them.” By
capturing the actual learning time of the sub-processes, one is better able to assign
reliable estimates of the knowledge contained therein. Just as the case in the
Learning Time Approach, it is important that the estimates cited in Process
Instructions only contain the knowledge required, or “in use” during execution of

- 54 -
each individual process, without overlap. By adding the ALT results for each sub-
process within a core process, one has a more reliable estimate of the core
process’s ALT.
4. Measuring Utility and Knowledge Executions A count must be taken to determine the number of times the knowledge is
executed (value) and the time it takes to execute (cost) in a given sample period.
These values are needed to determine the ROK value. The actual time is takes to
execute the process, multiplied by cost, is a flow-based estimate of its cost. It is
important to note that process costs alone, without reference to value, present a
different picture of the core process’s value.
5. The Relevance of Return on Knowledge (ROK) The return ratio known as ROK is expressed with a numerator representing
the percentage of revenue allocated to amount of knowledge required to complete a
given process successfully, in proportion to the total amount of knowledge required
to generate the total outputs. The denominator of the equation represents the cost
to execute the process knowledge. With knowledge as a surrogate for the process
outputs measured in common units, a higher ROK signifies better utilization of
knowledge assets. In this way, KVA makes it possible to measure how well a
specific process is doing in converting existing knowledge into value. Similarly, it
gives decision-makers an idea of how an investment in knowledge and learning is
paying off, and not simply how much it costs. The ROK value provides decision-
makers an analytical way to determine how knowledge can be more effectively used
to produce better return on performance. If increased automation does not improve
the ROK value of a given process, steps must be taken to improve that process’s
function and performance.

- 55 -
Appendix B. Five Phases of SHIPMAIN
There are five phases leading to the completion of an alteration/modification.
These five phases are: conceptual, preliminary design, detailed design,
implementation and installation.
A. Phase I—Conceptual The purpose of this phase is to identify a need for change, propose a
resolution, and gain approval to proceed with development of that resolution into an
engineered Ship Change (SC). Products developed during this phase include:
Requirement and proposed conceptual solution, Proposed fielding plan, Estimate for Phase II and III design development, and “Best Guess” estimate for Phase IV and V implementation and
execution. Figure 1. Phase I Top Level Flow Chart (Commander, Naval Sea Systems Command, 2006)

- 56 -
B. Phase II—Preliminary Design The purpose of this phase is to initiate design work for the SC, perform
preliminary design development of the SC, and gain approval to continue to detailed
design. Preliminary design development can include selection of technologies,
establishment of design parameters, and prototype development. Products
developed during this phase can include:
Design parameters, Updated fielding plan, Refined estimates for Phases III, IV, and V, Initiation of Installation Control Drawings (ICDs) and performance
specifications, Identification of interfaces and distributive system impacts, Design Budget Execution Plans, and Prototype Design.
Figure 2. Phase II Top Level Flow Chart (Commander, Naval Sea Systems Command, 2006)
- 57 -
C. Phase IIa Upon approval at Decision Point (DP) 1, the approving authority may
determine a SC is eligible to move through Phase IIa. Phase IIa is utilized when a
proposed SC design is mature to the point that DP 2 is not required. Phase IIa is a
combination of the Phase II and III development and review processes and ends at
DP 3. In order to qualify for Phase IIa, the following criteria must be met:
If the scope of the SC is an Internal Equipment Modification, all of the
following criteria must be met:
The SC can be accomplished without changing an interface external to the equipment or system.
The change is made within the equipment or system. The change does not negatively impact Strike Force Interoperability
(SFI) The change does not impact shipboard distributive systems, Ship
Selected Records (SSRs) or interfacing equipment or systems, compartmental arrangement records, or Damage Control records.
If the scope of the SC is a Ship Modification, all of the following requirements
must be met:
The change does not negatively impact SFI. The change does not impact ship stability records (weight & moment). The change does not impact or alter the 3-dimensional footprint of the
equipment being replaced. The change does not impact shipboard distributive systems, SSRs or
interfacing equipment or systems, compartmental arrangement records, or Damage Control records.
The change does not impact manning levels. Installation may not begin until authorized in Phase IV.
D. Phase III—Detailed Design The purpose of this phase is to complete detailed design development of the
SC. Once approved at DP 3, SCs are added to the Authorized or Planned but Not
Authorized section of the Ship Program Manager (SPM) Letter of Authorization

- 58 -
(LOA). Installations may not begin in Phase IV until they have been added to the
Authorized Section of the SPM LOA in accordance with the milestones identified.
The Technical Data Package (TDP) for a Ship Change Document (SCD) at DP 3
must include the level of detail equivalent to preliminary class-level Ship Installation
Drawings (SIDs) or preliminary ICDs. Products developed during this phase can
include:
A Technical Data Package, Installation Control Drawings, Performance Specifications, Quantification of interfaces and distributive system impacts (i.e.,
parametric data), Refined estimates for Phases IV and V, Refined fielding plan, List of required certifications and Plan of Action and Milestones
(POA&M) for completion, and Alteration Bill of Material (ABOM) including Long-lead-time Material
(LLTM), Government-furnished Equipment (GFE), and logistically significant material 3-4.

- 59 -
Figure 3. Phase III Top Level Flow Chart (Commander, Naval Sea Systems Command, 2006)
E. Phase IV—Implementation The purpose of Phase IV is to accomplish site-specific advanced planning of
the SC. The attention is redirected from overall SC applicability to design for
installation on a specific hull or at a specific location. This phase includes finalized
design (including Ship Check/site survey, drawings, technical installation
instructions, etc.), initiation of procurement, pre-installation certification and testing,
installation readiness assessments, and risk assessments. Products developed
during Phase IV can include:
Ships Installation Drawings, ILS Certification, Government-furnished Equipment (GFE) and Industrial Activity
Furnished (IAF) material procurement, Pre-installation certifications, Pre-installation testing,

- 60 -
Risk assessments, Installation documents, and Alteration Installation Team (AIT) Plan of Action and Milestones
(POA&M). Funding for Phase IV is budgeted as part of the Modernization Plan (MP)
after Phase IIa or III approval.
1. SCD Revision There are currently two reasons to have a SCD revised, post DP 3. The first
is the capability difference between what was planned for procurement and what
was actually procured. This capability difference includes changes inherent through
design, provided by the manufacturer, for a multi-year procurement requirement.
The second is if SCD actual costs are projected to increase by a factor greater than
+/- 10% more than estimated costs, a revised SCD must be resubmitted to DP 3.
Figure 4. Phase IV Top Level Flow Chart (Commander, Naval Sea Systems Command, 2006)

- 61 -
F. Phase V—Installation The purpose of Phase V is to execute the SC and provide feedback for future
installation decisions. It is possible for a SC to be in Phase IV and V in parallel for
different individual installations. Feedback from each individual installation is
provided to update and refine technical information and installation cost estimates.
Once all planned installations have been completed, this phase and the SC are
closed-out by providing feedback data reflecting final installation and closeout.
Products developed and services performed during Phase V can include:
Return Cost Reports, Liaison Action Requests (LARs), Post-installation certification and testing, ILS Product delivery, and Alteration Completion Reports.
Figure 5. Phase V Top Level Flow Chart (Commander, Naval Sea Systems Command, 2006)

- 62 -
THIS PAGE INTENTIONALLY LEFT BLANK

- 63 -
Appendix C. 2005 NSRP Ship Check Cost/Time Savings
Table 1. Traditional vs. Laser Scanning Small Ship Check
(National Shipbuilding Research Program Advanced Shipbuilding Enterprise, 2006)
Table 2. Traditional vs. Laser Scanning Large Ship Check
(National Shipbuilding Research Program Advanced Shipbuilding Enterprise, 2006)

- 64 -
THIS PAGE INTENTIONALLY LEFT BLANK

- 65 -
Appendix D. Business Rules for Phases IV and V
A. Block 250 Goal/Description: Develop Hull Modernization Plan (HMP), associated time-
phased Advanced Planning HMP (AHMP) and Execution Planning HMP (EHMP), issue Letter of Authorization (LOA), and generate/update 2Ks to reflect decisions made by the appropriate Voting Boards and depicted in the MP.
Sub-tasks:
• 250.1 Develop AHMP/EHMP. • 250.2 Develop HMP. • 250.3 Generate/Update 2K. Input:
• SCD and specific NDE-NM data elements (covered in BR 250.2), scheduled to an applicable hull as reflected in the MP.
• C5I Baseline Status as discussed in BR 250.2 for Strike Force Interoperability (SFI) CAT 1 and 2.
• Legacy Alteration (D, K, Engineering Changes) JCF and SAR approval status.
Output:
Time-phased, Critical Milestone-based NDE-NM reports:
• AHMP/EHMP and associated Advance Planning Letter (APL). • HMP/LOA. • 2Ks.
B. Block 265 Goal/Description: Complete all required design, procurement of material, pre-
installation testing, and obtain all required certifications/risk assessment(s) prior to final installation. Evaluate maturity of an installation and determine if the SC is ready for installation. Perform a risk assessment for SCs that have not achieved maturity IAW the milestone charts to determine whether or not to proceed with installation planning.
Sub-tasks:
• 265.1 Installation Procurement, Design & Advanced Planning, • 265.2 Hull Installation Readiness Review, • 265.3 Installation Maturity Determination, • 265.4 Hull Installation Risk Assessment, • 265.5 Operational Risk/Readiness Determination, and

- 66 -
• 265.xx (Future Enhancement) Generate Readiness Assessment Form. Input:
• SCs approved at DP 2 for Non-permanent Change (NPC) installations or DP 3 (Phase IIa/III) for permanent installations,
• AHMP/HMP/LOA, • Completed readiness assessment form (Future Enhancement), • Documentation of completed milestones entered in appropriate
authoritative data sources, and • Installation risk(s), if any. Output: Installation recommendation based on maturity and installation risk.
C. Block 270 Goal/Description: Authorize the installation of a SC on a specific hull based
upon the installation readiness assessment, installation risk assessment (as applicable), and operational risk. After authorization, installation can be moved to the authorized portion of the HMP/LOA. If an installation is not approved, that item shall be removed from the HMP/LOA. If the disapproval will cause a change in the SCD funding profile, the PARM must update the SCD and resubmit it to the boards for approval.
Sub-tasks:
• Installation decision. Input:
• Installation recommendation, • Endorsements from ESG/CSG staff, • Endorsements from Numbered Fleet staff, and • For C5I SFI Cat 1 and 2, endorsement from Platform TYCOM. Output:
• Approval for installation, • Update of HMP/LOA,
• Disapproval of installation and removal, and • Updated LOA/Quarterly Scheduling Message IAW Block 250.
D. Block 280 Goal/Description: Update HMP, Letter of Authorization and Fielding Plan (if
required) and reschedule in NDE-NM.
Sub-tasks:
• Updated Mod Plan (if required), • SC rescheduling in NDE-NM, and
- 67 -
• Updated HMP/LOA/Quarterly Installation Scheduling Message (QISM). Input:
• Disapproval and/or deferral of Installation.
Output:
• Updated HMP/LOA. • Updated SCD for submission to the O-6 Board at DP 3 (if required IAW
the Fielding Plan change process in section 3 of the SSCEPM).
E. Block 300 Goal/Description: Complete installation and testing IAW drawings and other
technical guidance, and deliver all Integrated Logistic Support (ILS) products.
Sub-tasks:
• SC Check-in (for AIT installs), • Installation of SC,
• Government oversight of AIT (as required), • RMC/NSA Installation,
• Progress Reports, • Testing of SC, • Delivery of ILS, • Validation of installation and ILS delivery,
• Final SSRs and SRDs typically delivered 3 months post-install, and
• Release of completion message. Input:
• Authorized SC and supporting documentation to support installation and checkout of specific installations,
• Installation Readiness Assessment, • Installation POA&M and MOA (for AIT jobs), • Installation QA Plan, • CDMD-OA COP Data submission, • ILS Certification Sheets, and • PY Approved Drawings and ship-specific Bill of Material (BOM). Output:
• Installed SC, • Completion Reports (IAW NAVSEAINST 4790.14 series, JFMM,
Appendix H, and SSCEPM Section 6), • CDM Planned/Emergent Installation Reports, • Ship availability ILSMT Action Items, • Completion message, and

- 68 -
• Closed-out 4790/2Ks and 4790/CKs (IAW NAVSEAINST 4790.8 series).
F. Block 310 Goal/Description: Provide feedback data to support future installation
decisions and (if necessary) revise portions of the Ship Change (SC).
Sub-tasks:
• Feedback on: • Cost, • Configuration Management (CM), • Schedule, • Testing/Integrated Logistics support (ILS), • Technical Feedback, • Schedule (Completion Date), • System Performance/QA, and • HSI Fleet Certification.
Input:
• Completed Installation, • Completion Report (IAW NAVSEAINST 4790,14 series, JFMM,
Appendix H, and SSCEPM Section 6), • Closed out 4790/2Ks and 4790/CKs (IAW NAVSEAINST 4790,8
series), and • Closed out RMMCO check-out form for AITs. Output:
• Completed SC with actual Return Cost, CM and Testing/ILS, • NSA EOA/EOI Reports, • Ship ILSMT Minutes/Action Items, and • HSI Fleet Certification Message.
G. Block 320 Goal/Description: Using feedback information from completed installs,
determine impact on follow-on installs.
Sub-tasks:
• Assessment of risk based on information from initial/follow-on installation,
• Decision as to whether to adjust follow-on installation plan, and • If required, refinement of CBA estimates. Input:

- 69 -
• Updated Cost, Configuration Management (CM), Integrated Logistics Support (ILS), Technical, Material, and Schedule data from initial and/or follow-on installation,
• LARs or other design configuration changes/updates, • Ships Superintendent Reports, • Completion Reports, and • Ships Situation Reports. Output:
• Participating Acquisition Resource Manager (PARM)/Resource Sponsor dialog on whether to continue follow-on installs (if required), and
• If necessary, revised Ship Change (SC) to reflect changes to cost, material, fielding plan, etc.
H. Block 330 Goal/Description: Verify all planned installations of the Ship Change (SC)
have been completed.
Sub-Tasks:
• Determination that all planned installations have been completed.
Input:
• Mature SC and supporting installation completion documentation.
Output:
• Determination that all planned installations are complete, and Closeout of SC in the MP.

- 70 -
THIS PAGE INTENTIONALLY LEFT BLANK

- 71 -
Appendix E. Case Study
Data Collection Aggregate data was gathered during an initial KVA knowledge audit
conducted via survey and a group interview setting at NAVSEA, Washington Navy
Yard, DC. Three SHIPMAIN SMEs were present at the group interview, and each
had expertise related to the SHIPMAIN process. The three SMEs each have over
30 years experience in the shipyard industry, with a high degree of expertise in their
affiliated disciplines. Their input will be statistically analyzed for reliability, and all
estimates will be aggregated to reflect the cost and number of process executions
averaged over five years. Business rules for Phases IV and V of the SHIPMAIN
process guided the interview.
Phases IV and V of the SHIPMAIN process were created from input and
discussion by various stakeholders at NAVSEA, Type Commanders (TYCOM),
public and private shipyards, Space and Naval Warfare Systems Command
(SPAWAR), Office of the Chief of Naval Operations (OPNAV) and other entities with
a vested interest in maintenance and modernization efforts (Commander, Naval Sea
Systems Command, 2006). Business rules for these phases are regularly reviewed
and updated to be properly aligned with business goals and the needs of Fleet
Commanders. Currently, Phases IV and V of SHIPMAIN are not in a functionally
implemented state but are rather in an early adoption period while business
rules/processes mature and long-standing legacy practices give way to the
SHIPMAIN process. A key assumption of this proof-of-concept case is that the
SHIPMAIN process functions as described in the business rules listed in Appendix D
of the SSCEPM dated December 11, 2006.

- 72 -
Methodology The method of analysis for this proof of concept is the Learning Time
method.23 A thorough discussion and review of current SHIPMAIN business rules
with the SMEs established what processes constitute the core of SHIPMAIN Phases
IV and V, identified the inputs and outputs of those processes, and determined the
frequency of core process iterations. The discussion further established boundaries
between the defined processes in order to effectively apply the KVA methodology
and to properly identify and valuate the knowledge required for each. Eight core
processes were identified, and detailed descriptions of each were provided by the
SMEs and the SHIPMAIN business rules. Each core process requires a certain
level of knowledge in one or more of the following areas: administration,
management, scheduling, budgeting, basic computer skills, engineering, shipboard
systems, logistics or project management.
The SMEs spent considerable time contemplating the amount of knowledge
embedded in each core process, and provided ALT estimates for each. The
established baseline level of knowledge for consideration was a GS-13 employee
with 1 year of experience and a college degree (no field specified). Finally, the team
of SMEs provided individual and uninfluenced RLT and rank-order estimates, which
lead to a correlation of greater than 80 percent—thereby establishing a high level of
reliability on the ALT figures obtained. Additional discussion occurred
spontaneously among the SMEs, which lead to a group conclusion that Blocks 265
and 300 were equivalent in complexity. Adjusting the RLT and rank order to reflect
that conclusion leads to greater than a 90-percent correlation across the data fields.
Key Assumptions As previously mentioned, this analysis is based on information collected from
previous research by LT Christine Komoroski (2005), SMEs from NAVSEA, data
contained in the NDE and current directives. For the purposes of this study, all
23 See Appendix A for a detailed discussion of Learning Time.
- 73 -
maintenance and modernization efforts are assumed to occur as described in the
current business rules listed in Appendix D of the SSCEPM dated December 11,
2006. It is also important to keep in mind that maintenance and modernization
efforts vary substantially in number, manpower requirements, duration and
complexity. After conducting extensive interviews with SMEs and conducting a
thorough review of current directives, related research and existing data in the NDE,
the researchers made the following assumptions:
Of 1,200 annual modernization and maintenance availability periods, 25 percent involve low complexity installations, 25 percent high complexity installations, and 50 percent involve medium complexity installations. Assume all efforts in this study involve efforts of medium complexity.
On average, 20 SCDs are generated per week.
The market comparable labor rate is 35 percent greater than the government labor rate.
Price per common unit of output is $75.45.
Discussion of As-is Scenario Number of Employees. The number of employees value used to build this
model represents the number of employees assigned to complete the given process
for each cycle or iteration. Numbers assigned are based on interviews with SMEs.
By accounting for the number of personnel involved in each process, the
researchers can determine how often knowledge is used. This method also
provides an approximate way to weight the cost of using knowledge in each process.
Times Performed in a Year. Estimations for the number of times each
process is executed per year are based on the aggregated number of occurrences
for each process. The NDE was queried with the following filters to gather the raw
data:
The search was limited to title “K” and “P” alterations.
FY 2002 through 2007.

- 74 -
Ships of the following TYCOMs:
o Commander, Naval Air Force Atlantic
o Commander, Naval Air Force Pacific
o Commander, Naval Surface Force Atlantic
o Commander, Naval Surface Force Pacific
These filters were put in place to establish a five-year average of
maintenance or modernization availability periods for all surface combatant ships to
include Aircraft Carriers. The result of the query was that an average of 1,200
availability periods occur each year. This number was conditionally modified to take
the complexity of installs during availability periods into consideration. To provide a
reasonable scope, 25 percent of availability periods were considered to be simple,
25 percent complex and 50 percent moderate. 600 moderately complex installations
frame the scope of this model.
The number of times the process is performed for the remaining blocks is
based on the number of installations that occur. For each installation that occurs, a
SCD is generated, and the number of SCDs provides a reliable proxy for the number
of installations. SMEs provided data and analysis which estimates an average of 20
SCDs are initiated per week, leading to 1,040 SCDs generated annually. Applying
the same conditional modifier to account for complexity, 520 SCDs or installs, would
occur each year.
Actual Learning Time. In order to determine the ALT from a common point
of reference, the SMEs were instructed to imagine a baseline individual of a college
graduate at the GS-13 civilian rank level with a year of experience in some sector of
the shipyard industry. All experts understood that each process learning time
estimate must adhere to the basic assumptions that knowledge is only counted if in
use, and the most succinct path to achieve a unit of output must be considered.
Each core process was broken down into its component sub-processes, and
respective ALT values were assigned for each sub-process. The final ALT value for

- 75 -
each core process is a summation of the sub-process ALT estimates. Finally, all
ALT values are based on the following time assumptions:
One year = 230 work days
One month = 20 work days
One week = 5 work days
One day = 8 hours
Determining Value. Each process contains a certain amount of process
automation—ranging from zero to 100 percent. The amount of automation is a
proxy for how much knowledge is embedded in the IT supporting the automation. It
is important to estimate how much of each process is automated, and to be
consistent in those estimates, so that the knowledge embedded in the technology
resources is accounted for. Upon determination of the percentage estimate, the
Total Learning Time (TLT) is calculated by dividing ALT by the percentage of
process automation for that process.
The TLT value is then multiplied by the number of employees and the number
of times the process is performed per year to establish a Total Knowledge factor.
The Total Knowledge factor is then multiplied by a price per common unit, based on
market comparables, to derive the “benefits” or “value” of each process. The
resulting product is then used as the numerator for determining ROK and ROI.
Cost-estimation. To estimate the cost of government employees involved in
the processes, the 2007 civilian pay chart was referenced. Each civilian pay grade
has associated “steps” to account for various unique factors of each job. All pay
estimates are based on Step Six of the associated pay grade. Since the processes
take place across the globe, no locality pay differentials were taken into
consideration to minimize variation. Also, because basic computing hardware and
software is utilized in every scenario, IT cost is not included in the As-is analysis. It
is assumed that each employee in this process has an email account, laptop or
desktop computer with identical software and has access to a printer. Material,
- 76 -
travel, and other miscellaneous costs are not included in this analysis so labor cost
may be isolated.
Establishing a market comparable for government labor was accomplished by
comparing the pay of contractors who conduct the same type and scope of work as
the government employee. The contracted base pay was on average 35 percent
higher than the government employees. Benefits, locality pay differential and other
variables were not compared to establish this rate; only base pay was considered.
All government employee rates were increased by 35 percent to achieve the values
for the market price used to establish a price per common unit of output.

- 77 -
Appendix F. Block As-is KVA Data
Block 265Hull Installation and Risk Assessment
Sub process
Hourly Personnel
CostHead count
Times Perf. Per Year
Time to Complete
(Hrs)Annual
Personnel Cost %IT ALT (Hrs)Total
Knowledge Total Benefits Annual Cost ROK ROI
265.1Installation Procurement, Design & Advance Planning $43.10 35 520 160 $125,507,200 25% 40 970667 $72,071,847 $125,507,200 57% -43%
265.2 Hull Installation Readiness Review $29.78 2 520 40 $1,238,848 80% 40 208000 $15,443,967 $1,238,848 1247% 1147%265.3 Evaluate Maturity Status $50.16 1 520 20 $521,664 0% 40 20800 $1,544,397 $521,664 296% 196%265.4 Provide Risk Assessment $50.16 1 520 40 $1,043,328 0% 56 29120 $2,162,155 $1,043,328 207% 107%
265.4.1Formally Propose Install for Readniess Assessment and Auth. $50.16 1 520 20 $521,664 0% 40 20800 $1,544,397 $521,664 296% 196%
265.5 Risk/Readiness Determination $59.01 4 130 40 $1,227,408 0% 56 29120 $2,162,155 $1,227,408 176% 76%Process Totals: $94,928,918 $130,060,112 73% -27%
Block 270Authorize Installation
Sub process
Hourly Personnel
CostHead count
Times Perf. Per Year
Time to Complete
(Hrs)Annual
Personnel Cost %IT ALT (Hrs)Total
Knowledge Total Benefits Annual Cost ROK ROI
270 Installation decision $76.00 4 520 20 $3,161,600 85% 24 332800 $24,710,347 $3,161,600 782% 682%
Block 280Resolve "Not Authorized/Deferred SC"
Sub process
Hourly Personnel
CostHead count
Times Perf. Per Year
Time to Complete
(Hrs)Annual
Personnel Cost %IT ALT (Hrs)Total
Knowledge Total Benefits Annual Cost ROK ROI
280 Update HMP,LOA and Fielding Plan $29.78 1 520 40 $619,424 75% 24 49920 $3,706,552 $619,424 598% 498%
Block 300Install SC
Sub process
Hourly Personnel
CostHead count
Times Perf. Per Year
Time to Complete
(Hrs)Annual
Personnel Cost %IT ALT (Hrs)Total
Knowledge Total Benefits Annual Cost ROK ROI
300 Complete installation and testing $42.45 46 520 40 $40,616,160 25% 40 1275733 $94,722,998 $40,616,160 233% 133%
Block 310Feedback: Cost, CM, Performance, Schedule, ILS
Sub process
Hourly Personnel
CostHead count
Times Perf. Per Year
Time to Complete
(Hrs)Annual
Personnel Cost %IT ALT (Hrs)Total
Knowledge Total Benefits Annual Cost ROK ROI
310 Provide Feedback Data $29.78 2 520 20 $619,424 0% 24 24960 $1,853,276 $619,424 299% 199%
Block 320Continue Installs
Sub process
Hourly Personnel
CostHead count
Times Perf. Per Year
Time to Complete
(Hrs)Annual
Personnel Cost %IT ALT (Hrs)Total
Knowledge Total Benefits Annual Cost ROK ROI
320Determine impact on future installs
from Feedback in 310 $59.01 5 520 20 $3,068,520 0% 24 62400 $4,633,190 $3,068,520 151% 51%

- 78 -
Block 330Final Install, Closeout SC
Sub process
Hourly Personnel
CostHead count
Times Perf. Per Year
Time to Complete
(Hrs)Annual
Personnel Cost %IT ALT (Hrs)Total
Knowledge Total Benefits Annual Cost ROK ROI
330 Verify all SCs have been completed $29.78 1 520 20 $309,712 0% 24 12480 $926,638 $309,712 299% 199%

- 79 -
Appendix G. To-be Process Data Analysis
This scenario represents a combination of notional and verified data to
portray current activities contained in the SHIPMAIN process reengineered to
maximize utilization of 3D laser scanning and PLM assets. Not every sub-process
will be affected in this scenario; instead, only affected processes will be used for
comparison. All others may be assumed static as described in their as-is state.
1. Cost of 3D Terrestrial Laser Scanning Technology The cost for laser scanning equipment and required software was provided by
the IEDP Project Manager for SIS. The SISs IEDP Project Manager stated that the
current cost has not changed from the estimates LT Komoroski used in her 2005
research (B. Tiltion, personal communication, May 16, 2007). For this study, the
cost for IT used in LT Komoroski’s 2005 study will be increased by 3% to account for
inflation and will be amortized over a 10-year period. Cost and assumptions for the
3DIS are:
Current inflation adjusted initial cost is $90,640 for one 3DIS scanner and its applicable software suite.
Maintenance/upkeep annual cost-estimate is 20 percent.
Use estimate is 200 days per year.
Lifespan estimate is 10 years.
The resulting cost per unit per day is: $135.96.
For analysis of the to-be KVA model, this cost is absorbed by the actual scanning process contained in Block 265.1.
The six planning yards that support naval surface force assets are: Bath Iron
Works, Bath, ME; Norfolk Naval Shipyard, Norfolk, VA; Northrop Grumman Ship
Systems, Avondale OP, New Orleans, LA; Northrop Grumman Ship Systems, Ingalls
OP, Pascagoula, MS; Puget Sound (DET) Boston, Boston, MA and; Puget Sound
Naval Shipyard, Bremerton, WA (NAVSEA Shipbuilding Support Office, 2007).

- 80 -
To properly account for the enterprise-wide cost of the 3DIS product, the daily
cost was increased by a factor of 6 under the assumption that each planning yard
received one scanner with the required software. Accordingly, the daily cost to
introduce 3DIS across the enterprise would be $815.76.
2. Cost of PLM Technology SIS is a Value-added Reseller of UGSs PLM suite of software called
Teamcenter. Under the IEDP, Teamcenter products will be introduced to establish
an Integrated Data Environment using team collaboration and configuration data-
management platforms. The Teamcenter suite contains the following specific
product solutions: Community Collaboration; Compliance Management; Engineering
Process Management; Enterprise Knowledge Management; Lifecycle Visualization;
Maintenance, Repair and Overhaul; Manufacturing Process Management; Portfolio
and Program Management; Reporting and Analytics; Simulation Process
Management; Supplier Relationship Management, and Systems Engineering (UGS
Corporation, 2007).
For the scope of this study, Community Collaboration, Engineering Process
Management, Lifecycle Visualization, Portfolio and Program Management, Reporting
and Analytics and the Supplier Relationship Management solutions will be
considered. These solutions will be part of the complete PLM solution evaluated in
the to-be model. Cost estimation for these tools has proven to be difficult.
According to a leading PLM provider, “Identifying an accurate, average or
generalized pricing schema for respective toolsets within the PLM space is almost
unachievable. It is safe to say, however, that vendor’s price-models have been
decreasing over the years” (Anonymous, personal communication, June 2007).
To establish a reasonable cost for the Teamcenter solution, the following cost
estimation will be used:
An assumption that PLM and Enterprise Resource Planning (ERP) initiatives are similar in cost and scope.
- 81 -
DoD spent an average of $250 million per ERP initiative in FY 06 (Service Cost Estimating Organizations, 2007).
The Department of the Navy (DoN) budget for FY 06 was $122.9 billion, including supplemental transfers (Bozin, 2006)
DoN budget for Ship Depot Maintenance was $3.72 billion, or 3 percent of the entire DoN budget (Bozin, 2006).
3 percent of a $250 million (the cost for an ERP) is $7.5 million.
The $7.5 million PLM solution will be deployed at the six planning yards listed
earlier in this section and at all SYSCOMs/TYCOMs supporting surface force
combatant assets. The cost for the PLM suite will be amortized over 10 years with a
2 percent annual increase for the cost of version upgrades—bringing the total cost to
$9 million. It is assumed that the PLM software will be used 230 days per year,
making the daily cost of PLM software $3,913. This cost will be distributed equally
across all processes of Phases IV and V of SHIPMAIN.

- 82 -
THIS PAGE INTENTIONALLY LEFT BLANK

- 83 -
Appendix H. To-be Block Assumptions and Data Analysis
Reengineering the to-be scenario proved to be quite challenging. While the
formal guidance for SHIPMAIN is relatively mature for Phases I-III, that is not so for
Phases IV and V. Remarkable effort has been put into developing and refining the
business rules associated with Phases IV and V, and they continue to be in a
maturing phase at the time of this study. According to one SME, until all areas
become aligned with the business rules and until the required technology to support
them is acquired, the processes currently in use to accomplish the tasks in Phases
IV and V are the legacy procedures. As the business rules, governance structure
and core technologies mature, the processes as defined in current SHIPMAIN
business rules should become the standard practice. In order to model the notional
to-be scenario, strict observation of currently defined business rules were coupled
with SME assessments of their practical implementation for each core process. For
additional clarity, all core processes will be described in terms of their sub-processes
and the assumptions affecting key parameter changes from the as-is to the to-be
scenario.
Block 250Authorize and Issue Letter of Authorization (LOA)/Hull Maintenance Plan (HMP); Generate 2Ks
Sub process
Hourly Personnel
CostHead count
Times Perf. Per Year
Time to Complete
(Hrs)Annual
Personnel Cost IT Cost %IT ALT (Hrs)Total
Knowledge Total Benefits Annual Cost ROK ROI
250.1 Create AHMP/EHMP $42.45 0 720 1 $0 $56,250 100% 40 28800 $2,138,395 $56,250 3802% 3702%250.2 Create Annual HMP/LOA $42.45 1 1200 40 $2,037,678 $56,250 75% 32 153600 $11,404,776 $2,093,928 545% 445%250.3 Initiate 2Ks into ICMP $35.70 1 624 1 $22,276 $56,250 99% 32 19968 $1,482,621 $78,526 1888% 1788%250.x Generate/issue QISM $42.45 2 4 8 $2,717 $56,250 90% 32 2560 $190,080 $58,967 322% 222%
Process Totals: $15,215,872 $2,287,671 665% 565%
Assumptions for Block 250 are:
PLM product suite would provide the means for processes identified in the business rules as “future enhancements” to become a reality.
A conservative estimate of 20 percent greater efficiency was applied to the times fired per year for Blocks 250.1 and 205.3 due to automation.

- 84 -
Block 265Hull Installation and Risk Assessment
Sub process
Hourly Personnel
CostHead count
Times Perf. Per Year
Time to Complete
(Hrs)Annual
Personnel Cost IT Cost %IT ALT (Hrs)Total
Knowledge Total Benefits Annual Cost ROK ROI
265.1Installation Procurement, Design & Advance Planning $43.10 17 624 128 $58,527,196 $219,402 75% 40 1697280 $126,022,772 $58,746,598 215% 115%
265.2 Hull Installation Readiness Review $29.78 2 520 32 $991,238 $56,250 85% 40 277333 $20,591,956 $1,047,488 1966% 1866%265.3 Evaluate Maturity Status $50.16 1 520 20 $521,696 $56,250 0% 40 20800 $1,544,397 $577,946 267% 167%265.4 Provide Risk Assessment $50.16 1 520 40 $1,043,391 $56,250 0% 56 29120 $2,162,155 $1,099,641 197% 97%
265.4.1Formally Propose Install for Readniess Assessment and Auth. $50.16 1 520 20 $626,035 $56,250 0% 40 124800 $9,266,380 $682,285 1358% 1258%
265.5 Risk/Readiness Determination $59.01 4 130 40 $1,227,347 $56,250 0% 56 29120 $2,162,155 $1,283,597 168% 68%Process Totals: $161,749,816 $63,437,554 255% 155%
Assumptions for Block 265 are:
There are 17 unique tasks involved in Block 265.1.
The 15 employees required for the ship-check task of Block 265.1 don’t use the entire time allotted to complete the process. The 15 ship check employees are notionally reallocated to remaining tasks of a similar pay grade.
Two additional employees are required to accomplish the 17 tasks.
Cycle-time will improve by a conservative estimate of 20 percent with the addition of PLM and 3D laser scanning. PLM will allow suppliers and purchasers to share requirements and plan for delivery in a real-time, Integrated Data Environment. 3D laser scanning will provide more accurate design parameters to suppliers than hand-drawn images—reducing the amount of “field engineering” required.
Block 280Resolve "Not Authorized/Deferred SC"
Sub process
Hourly Personnel
CostHead count
Times Perf. Per Year
Time to Complete
(Hrs)Annual
Personnel Cost IT Cost %IT ALT (Hrs)Total
Knowledge Total Benefits Annual Cost ROK ROI
280 Update HMP,LOA and Fielding Plan $29.78 1 520 24 $371,714 $56,250 80% 24 49920 $3,706,552 $427,964 866% 766%
Block 300Install SC
Sub process
Hourly Personnel
CostHead count
Times Perf. Per Year
Time to Complete
(Hrs)Annual
Personnel Cost IT Cost %IT ALT (Hrs)Total
Knowledge Total Benefits Annual Cost ROK ROI
300 Complete installation and testing $42.45 36 624 35 $33,377,170 $56,250 35% 40 1275733 $94,722,998 $33,433,420 283% 183%
Assumptions for Block 300 are:
The majority of management and verification tasks will be accomplished by 30 percent fewer staff due to collaboration and access to the common data environment provided by PLM.
Cycle-time will improve by 20 percent due to:

- 85 -
Improved coordination between suppliers and the shipyards
Less rework due to installation items being built more accurately from the 3D imagery provided of as-built configuration.
Block 310Feedback: Cost, CM, Performance, Schedule, ILS
Sub process
Hourly Personnel
CostHead count
Times Perf. Per Year
Time to Complete
(Hrs)Annual
Personnel Cost IT Cost %IT ALT (Hrs)Total
Knowledge Total Benefits Annual Cost ROK ROI
310 Provide Feedback Data $29.78 1 624 10 $185,857 $56,250 50% 24 24960 $1,853,276 $242,107 765% 665%
Assumptions for Block 310 are:
PLM will enable a 50 percent reduction in staff by having all related information available through a single interface.
Time to complete the tasks will be reduced by 75 percent by eliminating lengthy manual data collection and aggregation.
The process will be executed 20 percent more often annually.
Block 320Continue Installs
Sub process
Hourly Personnel
CostHead count
Times Perf. Per Year
Time to Complete
(Hrs)Annual
Personnel Cost IT Cost %IT ALT (Hrs)Total
Knowledge Total Benefits Annual Cost ROK ROI
320 Continue Installs $59.01 5 520 16 $2,454,694 $56,250 20% 24 78000 $5,791,488 $2,510,944 231% 131%Block 330
Final Install, Closeout SC
Sub process
Hourly Personnel
CostHead count
Times Perf. Per Year
Time to Complete
(Hrs)Annual
Personnel Cost IT Cost %IT ALT (Hrs)Total
Knowledge Total Benefits Annual Cost ROK ROI
330 Verify all SCs have been completed $29.78 1 520 16 $247,809 $56,250 50% 24 12480 $926,638 $304,059 305% 205%

- 86 -
THIS PAGE INTENTIONALLY LEFT BLANK

- 87 -
2003 - 2007 Sponsored Acquisition Research Topics
Acquisition Management
Software Requirements for OA Managing Services Supply Chain Acquiring Combat Capability via Public-Private Partnerships (PPPs) Knowledge Value Added (KVA) + Real Options (RO) Applied to
Shipyard Planning Processes Portfolio Optimization via KVA + RO MOSA Contracting Implications Strategy for Defense Acquisition Research Spiral Development BCA: Contractor vs. Organic Growth
Contract Management
USAF IT Commodity Council Contractors in 21st Century Combat Zone Joint Contingency Contracting Navy Contract Writing Guide Commodity Sourcing Strategies Past Performance in Source Selection USMC Contingency Contracting Transforming DoD Contract Closeout Model for Optimizing Contingency Contracting Planning and Execution
Financial Management
PPPs and Government Financing Energy Saving Contracts/DoD Mobile Assets Capital Budgeting for DoD Financing DoD Budget via PPPs ROI of Information Warfare Systems Acquisitions via leasing: MPS case
- 88 -
Special Termination Liability in MDAPs
Logistics Management
R-TOC Aegis Microwave Power Tubes Privatization-NOSL/NAWCI Army LOG MOD PBL (4) Contractors Supporting Military Operations RFID (4) Strategic Sourcing ASDS Product Support Analysis Analysis of LAV Depot Maintenance Diffusion/Variability on Vendor Performance Evaluation Optimizing CIWS Life Cycle Support (LCS)
Program Management
Building Collaborative Capacity Knowledge, Responsibilities and Decision Rights in MDAPs KVA Applied to Aegis and SSDS Business Process Reengineering (BPR) for LCS Mission Module
Acquisition Terminating Your Own Program Collaborative IT Tools Leveraging Competence
A complete listing and electronic copies of published research within the Acquisition Research Program are available on our website: www.acquisitionresearch.org

- 89 -
Initial Distribution List
1. Defense Technical Information Center 2 8725 John J. Kingman Rd., STE 0944; Ft. Belvoir, VA 22060-6218
2. Dudley Knox Library, Code 013 2 Naval Postgraduate School, Monterey, CA 93943-5100
3. Research Office, Code 09 1 Naval Postgraduate School, Monterey, CA 93943-5138
4. Robert N. Beck 1 Dean, GSBPP 555 Dyer Road, Naval Postgraduate School, Monterey, CA 93943-5000
5. Keith F. Snider 1 Associate Professor, GB 555 Dyer Road, Naval Postgraduate School, Monterey, CA 93943-5000
6. James B. Greene 1 Acquisition Chair, GB 555 Dyer Road, Naval Postgraduate School, Monterey, CA 93943-5000
7. Bill Gates 1 Associate Dean for Research, GB 555 Dyer Road, Naval Postgraduate School, Monterey, CA 93943-5000
8. Thomas Housel 1 Professor 555 Dyer Road, Naval Postgraduate School, Monterey, CA 93943-5000
9. Jonathan Mun 1 Professor 555 Dyer Road, Naval Postgraduate School, Monterey, CA 93943-5000
10. Karey L. Shaffer 1 Program Manager, Acquisition Research Program, GB 555 Dyer Road, Naval Postgraduate School, Monterey, CA 93943-5000
Copies of the Acquisition Sponsored Research Reports may be printed from our website www.acquisitionresearch.org