Embed Size (px)
Citation preview

Disaster Mitigation of Debris Flows, Slope Failures and Landslides 605
Landslides and Landscape Change Induced by Heavy Rainfall and IntensiveEarthquake in Mid-Niigata, Japan: GIS Analyses and Interpretation ofAerial Photographs
Hiromitsu Yamagishi,1) Toko Takayama2) and Junko Iwahashi3)
1) Niigata University, Japan, 8050 Ikarashi-2-no-cho, Niigata 950-2181, Japan ([email protected])2) Asia Air Survey, Co. Ltd., Japan, Manpukuji 1-2-2, Asao-ku, Kawasaki 215-0004 Japan([email protected])3) Geographical Survey Institute, Japan, Kitasato-1-ban, Tsukuba 305-0811 Japan e-mail ([email protected])
Abstract
In 2004, two big triggering mechanisms (heavy rainfall on July 13 and intensive earthquake on October23) brought about numberless landslides and remarkable geomorphic changes in hilly terrains composed ofconsiderably folded and faulted Neogene sedimentary rocks. Using GIS, we have analyzed the distributioncharacteristic of the two landslides and compared between the two landslides. As the results, we have revealedthe relationship and the comparison between the two landslides distribution and the topography and geology.
Most of the gentle slopes of the Mid-Niigata terrains have been mostly used for paddy fields and ponds.In order to reveal the relationship between the two events and such landuse, we are analyzing the change inlandscape, the damage on paddy fields, the pattern of destruction of ponds and occurrence of landslides inGIS using various techniques and inputs. The use of high resolution aerial photographs and LiDAR data areespecially useful to classify paddy fields and ponds.
Keywords: Landslides, landscape change, heavy rainfalls, intensive earthquakes, DMC image, GIS
Introduction
In 2004, ten typhoons attacked throughout Japan and extensive damages were incurred because ofsubsequent rainfalls. At the same time, Mid-Niigata region (Fig. 1a) was affected by heavy precipitation andearthquakes (Fig. 1b) on July 13 and October 23, 2004, respectively.
The heavy rainfalls and the subsequent floods in Kariyatagawa and Ikarashigawa rivers claimed thelives of 13 people. Kariyatagawa and Ikarashigawa are major tributaries of Shinanogawa. The latter is thelongest river in Japan. More than 3600 landslides triggered by the rainfalls killed 2 people. Three months later,high magnitude intensive earthquakes occurred in the southern part of Mid-Niigata and around 60 persons werekilled directly or indirectly until now. The area affected by the earthquakes is typically characterized by ahilly terrain where there are beautiful landscapes consisting of paddy fields and ponds for feeding carps andirrigation. The destruction includes roads and houses too. Landslides triggered by the heavy rainfalls and theintensive earthquakes occurred in areas with similar geologic and geomorphologic conditions. In this study, weare analyzing the two landslides and landscape change using GIS, associating with aerial photographs.
1. The July 13, 2004 heavy rainfalls
According to Ushiyama (2004), the rainfall began in the evening of July 12, 2004. High amount ofrainfall, however, was documented in the early morning of July 13 in the lowlands and mountainous areas. Fig.1b presents the rainfall distribution on July 13, 2004 in the areas where flooding and landsliding occurred. Inthe roughly 1250 km2 area considered, the Tochio and Kariyatagawa localities got the maximum rainfalls ofone day. The 24 hour rainfall data of AMEDAS station in Tochio City for example showed a daily precipitationof 421mm.
2. Landslides triggered by the July 13, 2004 heavy rainfalls
Many landslides were inventoried through aerial photographs. We have been done field researchingusing research cards (Yamagishi and Ayalew, 2005). In Izumozaki and Tochio areas about 3600 landslides arerecorded. Particularly the Yoita area is characterized by more than 500 landslides. Some of the landslides areassociated with mudflows.
pp. 605–615 c©2006 by Universal Academy Press, Inc. / Tokyo, Japan

606
Fig. 1. a: Location map of the Mid Niigata, Japan. b: Circle area is affected by the 2004 July 13heavy rainfalls, and the elliptical area is affected by the 2004 Oct 23 intensive earthquakes.
Fig. 2. Geologic map of Nagaoka area (Geological Survey of Japan, 2004a)
3. GIS analyses of the rainfall-induced landslides
Vector data models were prepared from the inventory maps of landslides and mudflows. As the basemap, we used a 10m grid DEM prepared by GISMAP (Hokkaido Chizu Co. Ltd.). Geologic maps of Izumozakiand Sanjo areas at a scale of 1: 50,000, and Niigata and Nagaoka (1: 200,000 in scale) were provided byGeological Survey of Japan (Fig. 2, 20004a) and digitized. Moreover, as an additional data, we used thelandslide distribution maps (1:50,000) of Nagaoka and Takada prepared by the National Research Institute forEarth Science and Disaster Prevention (NIED, 2006).
In Mid-Niigata, there are high relief hills with elevations in the range of 200 to 600 m.Many straight ridges (for instances, Nishiyama hills in the west, Shimoda hills in the north and

607
Fig. 3. Map showing the distribution of the 7.13 landslides and old deep-seated slides (NIED, 2006)in the Nishiyma Hill.
Fig. 4. Map showing the distribution of landslides triggered by the October 23, 2004 earthquakesand the aftershocks. Notice that yellow colored areas indicate the sandstone-rich zone and bluecolor areas the mudstone-rich zone.
Higashiyama hills in the east) are trending in the directions of NNE-SSW (Fig. 2). Folding structures withaxes in directions of NNE-SSW are common most likely following the trend of the ridges. The geology ofthese ridges is dominated by mudstones and sandstones both of which make up the relatively hard TeradomariFormation. Landslide deposits formed by old deep-seated slope failures are abundantly distributed in the gentledipping stratum (Fig. 3). Relationship between the recent landslides and the topography has revealed thatin Izumozaki area, the former are concentrated in steep slopes which show rectangular and parallel drainagesystems along anticlinal axis of the Nishiyama hills (Fig. 3). In Higashiyama to Tochio, most of the landslidesand mudflows are mapped in the mudstone-rich zone rather than sandstone-rich localities.

608
Fig. 5. Map showing landslide distribution underlain by topographic contours, strata striking anddipping maps.
Fig. 6. Comparison between the densities of the shallow landslides by the two events. Note thatthe slopes with more than 40 degrees show variable plotting, because that such steep slopes havesmall number of grid cells compared with the gentle slopes with less than 40 degrees. The dataof the landslides by the earthquakes were derived from Geological Survey Institite.
4. The October 23 intensive earthquakes
At 17:56 on October 23th, 2004, an intensive earthquake occurred in the Yamakoshi area with ahypocenter at a latitude of 37◦ 17.4” N and longitude of 138◦ 52.2” E. The earthquake started at a depth of 13
609
Fig. 7. Paddy field in the hilly area of Ojiya, Niigata (taken by Yamamoto, H)
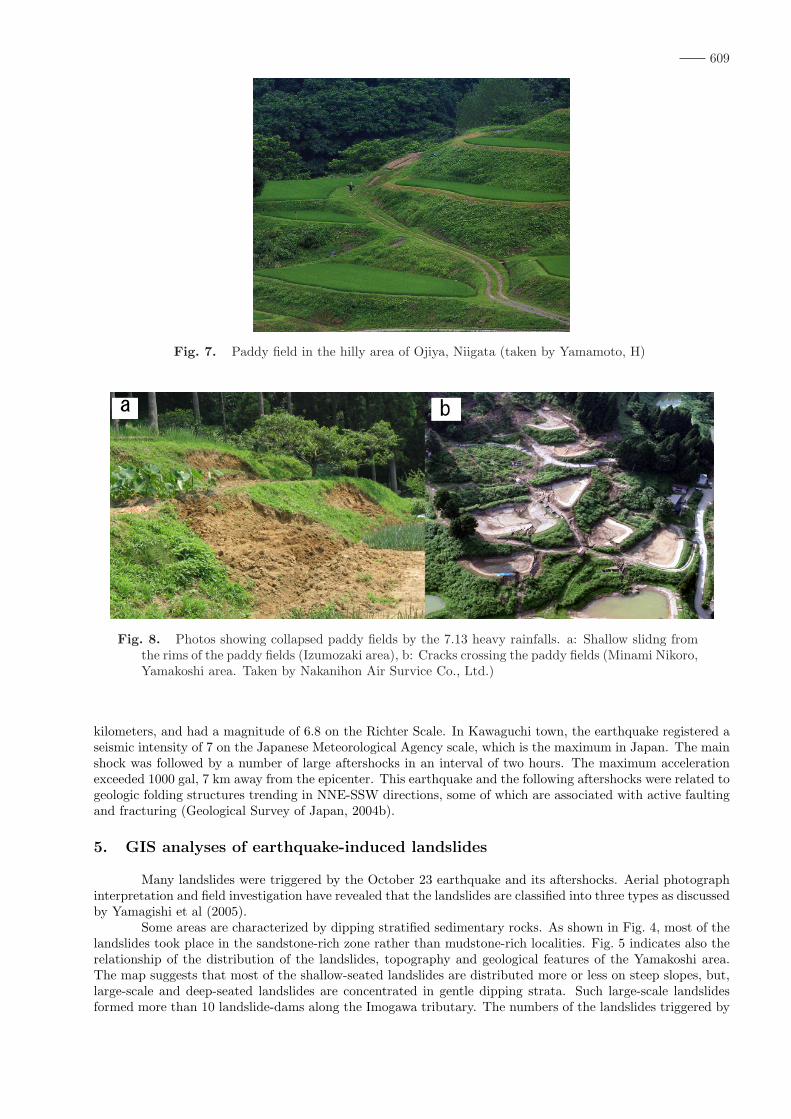
Fig. 8. Photos showing collapsed paddy fields by the 7.13 heavy rainfalls. a: Shallow slidng fromthe rims of the paddy fields (Izumozaki area), b: Cracks crossing the paddy fields (Minami Nikoro,Yamakoshi area. Taken by Nakanihon Air Survice Co., Ltd.)
kilometers, and had a magnitude of 6.8 on the Richter Scale. In Kawaguchi town, the earthquake registered aseismic intensity of 7 on the Japanese Meteorological Agency scale, which is the maximum in Japan. The mainshock was followed by a number of large aftershocks in an interval of two hours. The maximum accelerationexceeded 1000 gal, 7 km away from the epicenter. This earthquake and the following aftershocks were related togeologic folding structures trending in NNE-SSW directions, some of which are associated with active faultingand fracturing (Geological Survey of Japan, 2004b).
5. GIS analyses of earthquake-induced landslides
Many landslides were triggered by the October 23 earthquake and its aftershocks. Aerial photographinterpretation and field investigation have revealed that the landslides are classified into three types as discussedby Yamagishi et al (2005).
Some areas are characterized by dipping stratified sedimentary rocks. As shown in Fig. 4, most of thelandslides took place in the sandstone-rich zone rather than mudstone-rich localities. Fig. 5 indicates also therelationship of the distribution of the landslides, topography and geological features of the Yamakoshi area.The map suggests that most of the shallow-seated landslides are distributed more or less on steep slopes, but,large-scale and deep-seated landslides are concentrated in gentle dipping strata. Such large-scale landslidesformed more than 10 landslide-dams along the Imogawa tributary. The numbers of the landslides triggered by

610
Fig. 9. Stereo-paired photographs of paddy fields showing cracking patterns due to the earthquakes.Notice that cracks (a) are crossing the ponds and the others; (b) are arranged along the pondsdeveloping to a landslide.
Fig. 10. Long-run landslide from the pond with water (Broken pond) probably due to mixing withmuch water and debris.

611
Fig. 11. DMC orthophotograph (taken on October 24, 2004) along the Imogawa River, based on1m DEM made from LiDAR data (taken on October 28). Note that red-colored spots indicate thepaddy fields (tanata) selected by a remote sensing and that the indicated quadrangle is selectedarea (Figs. 12 and 13) for analysis (10481034)
Fig. 12. DMC Orthophoto (Mushigame; 10481034) for the analysis of paddy fields and ponds withcracking and landsliding.

612
Fig. 13. DMC orthophoto (Mushigame ; 10481034) showing cracks, landslides and classification ofpaddy fields (left) and ponds (right).
Fig. 14. Flow chart showing the process of the remote sensing analysis for paddy fields.
the October 23 earthquake and its aftershocks are counted to be more than several thousands.
6. Comparison between the two landslides using GIS
GIS-based analyses of the landslides triggered by the July 13, 2004 heavy rainfall and the October 23,2004 intensive earthquakes and the aftershocks, has revealed the differences as discussed by Yamagishi et al(2005). Firstly, the landslides triggered by the heavy rainfall do not necessarily coincide with old deep-seatedlandslides from the Web Site of NIED (2006). Most of landslides are small in scale and shallow-seated. Theyare distributed in steep slopes and in areas where there are steeply dipping sediment strata (Yamagishi et al.,2005). In addition, they occurred lithologically in mudstone-rich zones rather than sandstone-rich localities.On the otherhand, the landslides triggered by the intensive earthquake and its aftershocks coincided with theold deep-seated landslides shown by NIED.
Most of the deep-seated landslides are distributed in gentle slopes, and gently dipping strata areas(Fig.5). Most shallow-seated landslides by the earthquakes, on the other hand, are present on steep slopes.Besides, they are mostly distributed in sandstone-rich zone rather than mudstone-rich regions (Fig. 6). Sec-

613
Fig. 15. Result of the classification of paddy fields and ponds.
ondly, using such shallow-seated landslide densities, a comparison of density (numbers of landslides per km2)was done between the two triggering mechanisms (Fig.6). The graph shown in Fig. 6 shows that the densitiesof the landslides by heavy rainfall on July 13, remained almost constant over 25 degrees. However, thoseby intensive earthquakes on October 23 show drastically upward curve toward 40 degree in slope inclination.Namely, with inclination of slopes, the densities of the landslides by the earthquakes are increasing more andmore than those by the heavy rainfalls.
7. Landscape changes
Mid-Niigata areas is known for its fertile rice fields. Gentle slope areas between hills, which are mostlysites of old deep-seated landslides, are used as paddy fields (Tanata) for producing delicious rice such asKoshihikari. These rice fields also display beautiful landscape changes in colors from spring to winter (Fig. 7).However, because of the July 13 heavy rainfalls and October 23 intensive earthquakes, the paddy fields and thelandscape, are highly affected and destroyed (Figs. 7 and 8). Air-photos taken just after the destruction wereimportant to describe the damage patterns of the paddy fields. Particularly, images of high resolution airbornedigital mapping camera (DMC) were very useful to analyze landscape failure in a GIS and to provide fastermapping techniques. We have analyzed the damage patterns using the DMC images combined with GIS.
8. Patterns of the rainfall-induced paddy field landslides
Most of the July13 landslides took place on natural steep slopes, and the displaced materials coveredthe paddy fields. However, in some places, failures originated from the edges of the paddy fields themselves(Fig.8a). In some other places, landslide cracks crossed the rim of the paddy fields (Fig. 8b).

614
9. Patterns of intensive-earthquake induced paddy field destruction
The Yamakoshi area which was devastated by the earthquakes on October 23, has been also sites ofmany rice fields. Since the 1970th most of the paddy fields have been changed into ponds for irrigation andfeeding ornamental carps. Therefore, many ponds are distributed in the areas. However, when the earthquakesoccurred in 2004 many ponds as well as the paddy fields were broken as shown in Figs. 9 and 10. The crackingof ponds accelerated the process of landsliding because of water flowing out the ponds (Fig. 10). In orderto investigate how the failure of ponds promoted the landsliding processes, the paddy fields and ponds wererecognized and classified using DMC images taken by Asia Air Survey Co. Ltd. The criteria for the recognizingthese features are color and tonal difference due to reflection patterns and vegetation.
The pattern of cracking in the paddy fields was highly variable. Some cracks crossed the paddy fieldsvertically or obliquely as shown in Fig. 9a, and others are arranged along the shape (Fig. 10). Most of thecracks are considered as tensional because they are thought to be the result of gravitational slipping, althoughsome of the cracks are as compressional on the marginal toe of the landslide. Some of the landslide did notmove far due to scarcity of water (Fig.9b). However, long run-out distance due the induction of water fromthe ponds (Fig. 10).
10. Classification of paddy fields using DMC images
Paddy fields were analyzed in a GIS using DMC orthophoto images (25cm resolution , taken on October24, 2004) provided by Asia Air Survey Co. Ltd. combined with GIS technology. The DMC orthophoto imagesassociated with Digital Elevation Model (DEM) prepared from airborne laser sensor (LiDAR) are very usefulfor analyzing the micro-topography (Takayama et al., 2005). On the basis of these images, paddy fields wereclassified using Erdas IMAGINE and ARCGIS and the result is shown in Figs. 13 and 15.
Use of DMC orthophoto (Fig. 11) and LiDAR data allowed us to identify not only cracks and landslides,but also 1) abandoned old rice fields and 2) recent rice fields (Left of Fig. 13). Using these information, pondswere classified into four categories; 1) broken ponds with water, 2) broken ponds without water, 3)unbrokenponds with water and 4)broken ponds without water (Right of Fig.13). Comparison between the left and rightimage, revealed that the broken ponds with and without water are more ore less related to cracking ratherthan the rice fields.
Finally, the DMC orthophoto (10481034) was analyzed using remote sensing techniques to classify ricefields and ponds. The flow chart for analyzing the orthophoto using remote sensing is given in Fig.14. Asshown in Fig.15, the analysis also involved LiDAR data (DSM-Digital Surface Model- and DEM) and DMCimage. The result is such 4 categories were obtained (Fig. 15); abandoned rice fields (AbRF), recent rice fields(RcRF), pond with water (PDwW), and pond without water (PDnW).
Summary and Conclusion
By the heavy rainfalls on July 13th and intensive earthquakes on October 13th in the Mid-Niigatahills, many landslides occurred and landscapes such as paddy fields changed drastically. We have analyzed thedistribution characteristics and comparison of the two landslides using GIS. As the results, we have clearedthat the relationship of the two landslides to topography and geology, and the comparisons, such as landslidedensity. As the result, the landslides by the earthquakes are distributed in the sandstone-rich zone ratherthan mudstone-rich ones. The density by the earthquakes increases exponentially with the slope inclinations,although that by the rainfalls keeps constant over 25 degrees.
Finally, in order to reveal the relationship between the two events and landuse of the hills, such as ricefields and ponds, we are analyzing the landslides and the landscape change, the damage on paddy fields, thepattern of destruction of ponds in a GIS using various techniques and imputs. In conclusion, we have classifiedthe paddy fields and ponds into four categories.
We thank Mr. Ryuji Nakada and Mr. Takahiro Hiramatsu of Asia Air Survey Co., Ltd. for datapreparation and helpful suggestions. We are also grateful to Dr. Ayalew Lulseged for improving our draft, andfinally expressing appreciation to anonymous referees for correcting our draft and useful comments.
References
Geological Survey of Japan, AIST (2004a): Digital geologic maps of Japan 1:200,000, Tohoku.Geological Survey of Japan, AIST (2004b): http://www.gsj.jp/jishin/chuetsu 1023/index.htmlNational Research Institute for Earth Science and Disaster Prevention (NIED) (2006) http://www.bosai.go.jp/e/dosya.htm

615
Takayama, T., Suzuki, Y., Muraki, H. and Satoshi, O. (2005) Geomorphic analysis of landslide caused byChuetsu earthquake. Abstract volume of Poster session in Japan Landslide Society, Sasebo, Japan. August30-31, 2005.
Takeuchi, K., Yanagisawa, Y., Miyazaki, J. and Ozaki, M. (2004):1:50,000 digital geologic map of the Uonumaregion, Niigata Prefecture (Ver.1). http://www.gsj.jp/jishin/chuetsu 1023/geomap.html
Ushiyama M. (2004): Characteristics of heavy rainfall disasters in the Niigata Prefecture from July 12 to 13,2004. Journal of Japan Society for Natural Disaster Science, v. 23, 293-302. 2004.
Yamagishi, H. and Ayalew, L. (2005) Comparison between the landslides by heavy rainfalls on July 13, 2004, andIntensive Earthquakes on October 23, 2004, in Mid Niigata, Japan. Proceeding of International SymposiumLandslide Hazard in Orogenic Zone from the Himalaya to Island Arcs in Asia. September 25-26, 2005,Kathmandu, Nepal. Proceeding pp.83-91.
Yamagishi, H., Ayalew, L. and Kato, K. (2005) Charactersitics of the recent landslides in the Mid NiigataRegion-Comparison between the landslides by the heavy rainfall on 13 July 2004, and by the intensiveearthquakes on October 2004. Landslides-Risk Analyses and Sustainable Disaster Management. Proceedingof the First General Assembly of the International Consortium on Landslides. Springer-Verlag, 181-185.